Submitted:
02 October 2025
Posted:
03 October 2025
You are already at the latest version
Abstract
Automated quality control in truffle production requires accurate detection of truffle-specific cracks to ensure product integrity. This study aimed to develop a machine learning framework to classify truffle cracks versus other cracks, addressing the need for reliable, automated inspection in industrial settings. A dataset of 300 images (150 truffle cracks, 150 other cracks) was used, with 5-fold cross-validation (192 training, 48 validation images per fold) and a test set of 60 images (30 per class). Three models were evaluated: VGG16 via transfer learning, Support Vector Machine with MobileNetV2 features, and EfficientNetV2B0 with Test-Time Augmentation. Cross-validation results showed EfficientNetV2B0 achieved the highest mean accuracy (0.929 ± 0.039) and Area Under the Curve (0.975 ± 0.026), followed by Support Vector Machine (accuracy 0.887 ± 0.031, Area Under the Curve 0.952 ± 0.025) and VGG16 (accuracy 0.867 ± 0.055, Area Under the Curve 0.942 ± 0.031). On the test set, EfficientNetV2B0 outperformed others with an accuracy of 0.933, precision of 0.933, recall of 0.933, and Area Under the Curve of 0.990. Support Vector Machine achieved a test accuracy of 0.917, with recall improving to 0.967 at an adjusted threshold of -0.3, while VGG16 recorded a test accuracy of 0.833, with recall of 0.867 at a threshold of 0.3. Confusion matrix analysis confirmed EfficientNetV2B0’s balanced performance, correctly classifying 28 of 30 truffle cracks and 28 of 30 other cracks. These models, trained on accessible computational resources, demonstrated robust performance, with EfficientNetV2B0 offering the most effective solution for automated truffle crack detection, enabling high-precision quality assurance in truffle production. Limitations include a modest dataset size, suggesting areas for future improvement.
Keywords:
Truffle crack detection
; deep learning
; transfer learning
; SVM
; EfficientNetV2B0
; VGG16
1. Introduction
Truffle farming holds substantial economic importance due to the high culinary value of truffles, ectomycorrhizal fungi that grow symbiotically with tree roots and are prized for their unique aroma and taste (Oliach et al. 2021; Splivallo et al. 2011). The identification of truffle cracks in soil, a key indicator of truffle presence, has traditionally relied on labor-intensive manual inspection, which is time-consuming and susceptible to human error. Recent advancements in machine learning offer promising solutions for automating this process, enhancing efficiency and accuracy in truffle detection (Sishodia, Ray, and Singh 2020). Deep learning, in particular, has emerged as a powerful tool for image analysis (Upadhyay et al. 2025), with potential to revolutionize truffle crack detection in agricultural settings.
Truffles hold immense importance beyond their culinary appeal, driving significant economic activity and cultural heritage. For instance, the global truffle market is projected to be valued at approximately USD 548 million in 2025, with premium black truffles fetching prices exceeding $2,000 per kilogram due to their rarity and demand in gourmet cuisine (Future Market Insights 2025). Additionally, truffles play a critical ecological role as ectomycorrhizal fungi, enhancing soil health, nutrient cycling, and forest ecosystems, which underscores their relevance in sustainable agriculture (Alrhmoun et al. 2025). These factors highlight the urgency of developing reliable detection methods to safeguard truffle production, motivating the exploration of deep learning techniques in this study.
Deep learning models, especially Convolutional Neural Networks (CNNs), have demonstrated remarkable success in image classification and pattern recognition tasks (Dhillon and Verma 2020; Upadhyay et al. 2025; Wang, Zhao, and Li 2025). CNNs excel at learning spatial hierarchies of features, making them well-suited for detecting complex visual patterns such as cracks in infrastructure, including roads and buildings (Ali et al. 2022; Andrushia et al. 2022; Gupta and Dixit 2022; Meftah et al. 2024; Sreenath et al. 2020; Yasmin 2022). These studies highlight the potential of CNNs to handle natural image variations, such as lighting changes, suggesting their applicability to agricultural imaging. However, the specific challenge of detecting truffle cracks, which are irregular and embedded in heterogeneous soil textures, remains underexplored, as most prior work focuses on structural crack detection.
This study addressed the gap in automated truffle crack detection by developing and evaluating a machine learning framework to distinguish truffle cracks from other cracks in soil imagery, introducing a novel application of EfficientNetV2B0 with Test-Time Augmentation to enhance detection accuracy in agricultural settings. The primary objectives were to (1) design and train three machine learning models—VGG16 via transfer learning, Support Vector Machine with MobileNetV2 features, and EfficientNetV2B0 with Test-Time Augmentation—for binary classification of truffle cracks, and (2) assess their performance on a custom dataset of 300 ground-level soil images (150 truffle cracks, 150 other cracks). A 5-fold cross-validation approach (192 training, 48 validation images per fold) and a 60-image test set (30 per class) were employed, with images preprocessed using normalization and augmentations (rotations ±25°, shear ±20%, zoom ±30%, flipping).
The findings contribute significantly to precision agriculture by demonstrating the efficacy of advanced machine learning models, particularly EfficientNetV2B0, in automating truffle crack detection. This approach reduces reliance on manual inspection, enhancing efficiency and scalability in truffle farming. By integrating these models into agricultural workflows, the study paves the way for sustainable practices that improve profitability and ensure a reliable truffle supply. The following sections detail the methodology, including data collection, model architectures, training protocols, and evaluation metrics, present the experimental results, and discuss their implications for future research and practical applications in the truffle industry.
2. Data and Methods
2.1. Dataset and Preprocessing
The dataset comprised 300 RGB images of soil surfaces collected under standardized field conditions (Figure 1), with each image manually annotated as containing either truffle cracks (150 images) or other soil cracks (150 images). A 5-fold cross-validation strategy was employed to ensure robust evaluation, with 240 images (80% of the dataset) allocated for training and validation per fold, and 60 images (20%) reserved as an unseen test set. Each fold included 192 images (80% of 240) for training and 48 images (20% of 240) for validation, maintaining equal class representation (120 truffle cracks, 120 other soil cracks per fold). The test set comprised 60 images (30 truffle cracks, 30 other soil cracks), isolated from all training and validation phases to mitigate class imbalance and provide an unbiased final evaluation.
All images underwent preprocessing to enhance model performance, including normalization of pixel intensities to the range [0,1] to standardize input scales. Images were resized to 150×150 pixels for VGG16 and 224×224 pixels for MobileNetV2 (used for feature extraction in the SVM model) and EfficientNetV2B0, aligning with their ImageNet-pretrained architectures. Real-time data augmentation was applied during training to improve robustness to field variability, including random rotations (±25°), shear transformations (±20%), zoom (±30%), and horizontal/vertical flipping. For EfficientNetV2B0, Test-Time Augmentation (TTA) was employed during testing, generating multiple augmented versions of each test image to enhance prediction reliability. Stratified sampling ensured balanced class distributions across training, validation, and test sets, with a deterministic seed (42) used for reproducible data shuffling. TensorFlow’s ImageDataGenerator facilitated efficient data loading and augmentation.
2.2. Model Development and Evaluation
2.2.1. Architectural Implementations
Three models were developed for automated truffle crack detection: VGG16 via transfer learning (Simonyan and Zisserman 2015), a Support Vector Machine (SVM) with MobileNetV2-extracted features (Cortes and Vapnik 1995; Sandler et al. 2018), and EfficientNetV2B0 with Test-Time Augmentation (Tan and Le 2021). The VGG16 model utilized a frozen ImageNet-pretrained base (16 convolutional layers) with a custom classifier comprising GlobalAveragePooling, a 256-unit dense layer with 30% dropout, and a sigmoid output, resulting in approximately 0.2 million trainable parameters. The SVM model extracted features from images using a pre-trained MobileNetV2 network (224×224 inputs), with the extracted features fed into a linear SVM classifier implemented via scikit-learn. The EfficientNetV2B0 model employed a pre-trained base with a custom classifier (GlobalAveragePooling, a 256-unit dense layer with 30% dropout, and a sigmoid output), leveraging its efficient scaling for high performance. All models were designed to output binary classifications (truffle crack vs. other crack).
2.2.2. Training Protocol
The VGG16 and EfficientNetV2B0 models were trained using the Adam optimizer with binary cross-entropy loss. VGG16 used an initial learning rate of 1.0e-03, while EfficientNetV2B0 used 3.0e-04, with balanced class weights (1.0:1.0) to address potential dataset skew. Both models were trained for 50 epochs without early stopping, as indicated by the training curves for EfficientNetV2B0. The SVM model was trained on MobileNetV2-extracted features using scikit-learn’s default parameters for a linear kernel, with balanced class weights. TensorFlow’s deterministic operations (TF_DETERMINISTIC_OPS=1) ensured reproducibility during training of the neural network models.
2.2.3. Evaluation Framework
Model performance was assessed using accuracy, precision, recall, F1-score, and Area Under the Curve (AUC) of the Receiver Operating Characteristic (ROC) curve, computed via scikit-learn and TensorFlow. Confusion matrices were generated to analyze true positives, true negatives, false positives, and false negatives. For VGG16 and SVM, adjusted classification thresholds (0.3 and -0.3, respectively) were evaluated to optimize recall. Test-Time Augmentation was applied for EfficientNetV2B0’s test predictions. Training dynamics were visualized through accuracy and loss curves for EfficientNetV2B0, and computational efficiency was considered via training time and parameter counts. Test predictions were generated using filename-sorted inference to prevent data leakage, with a default confidence threshold of 0.5 unless otherwise specified. All models underwent standardized evaluation to ensure fair comparison. For transparency and reproducibility, the dataset, preprocessing pipelines, model architectures, and training codes are archived in a GitHub repository (https://github.com/Azad77/CNNsTruffle/tree/main), to be activated upon paper acceptance.
The effectiveness of the models—VGG16, Support Vector Machine with MobileNetV2 features, and EfficientNetV2B0 with Test-Time Augmentation—in detecting truffle cracks was evaluated using multiple performance metrics: accuracy, precision, recall, F1 score, and Area Under the Curve (AUC) of the Receiver Operating Characteristic (ROC) curve (Figure 2). These metrics were computed for both 5-fold cross-validation (192 training, 48 validation images per fold) and a test set of 60 images (30 truffle cracks, 30 other cracks).
Accuracy, representing the proportion of correctly classified images, was calculated as:
where True Positives (TP) denote correctly identified truffle cracks, and True Negatives (TN) denote correctly identified other cracks.
Recall, measuring the ability to detect truffle cracks, was defined as:
where False Negatives (FN) represent truffle cracks misclassified as other cracks.
Precision, indicating the proportion of truffle crack predictions that were correct, was calculated as:
where False Positives (FP) represent other cracks misclassified as truffle cracks.
The F1 score, combining precision and recall, was computed as:
The AUC metric quantified the models’ discriminative ability across classification thresholds, derived from ROC curves. Confusion matrices were generated to provide detailed insights into TP, TN, FP, and FN counts. For VGG16 and Support Vector Machine, performance was assessed at the default threshold (0.5) and adjusted thresholds (0.3 for VGG16, -0.3 for Support Vector Machine) to optimize recall. EfficientNetV2B0 utilized Test-Time Augmentation during testing to enhance prediction reliability. Metrics were computed using scikit-learn’s classification report and TensorFlow’s AUC functions, with training dynamics visualized through accuracy and loss curves for EfficientNetV2B0. All evaluations were conducted on filename-sorted test predictions to prevent data leakage, ensuring robust and reproducible results.
3. Results
The evaluation of three machine learning models—VGG16 transfer learning, Support Vector Machine (SVM) with MobileNetV2 features, and EfficientNetV2B0 with Test-Time Augmentation (TTA)—for truffle crack detection was conducted on a balanced dataset of 300 images (150 truffle cracks, 150 other cracks). A 5-fold cross-validation was performed, with each fold comprising 192 training and 48 validation images, followed by testing on a separate set of 60 images (30 truffle cracks, 30 other cracks). Performance was assessed using Accuracy, Precision, Recall, F1 Score, and Area Under the Curve (AUC), with results detailed in Table 1, Table 2, Table 3, Table 4, Table 5 and Table 6 and visualized in Figure 3, Figure 4, Figure 5 and Figure 6. These metrics provide a comprehensive view of model robustness, discriminative ability, and classification performance, critical for automated truffle crack detection in industrial settings.
3.1. Cross-Validation Performance
Cross-validation results, summarized in Table 1, Table 2 and Table 3 and visualized in Figure 3, reveal distinct performance profiles across the models. The VGG16 model (Table 1) achieved a mean accuracy of 0.867 ± 0.055 and AUC of 0.942 ± 0.031 across five folds. Its performance varied significantly, particularly in precision (0.886 ± 0.080) and recall (0.850 ± 0.068), with Fold 3 achieving a high accuracy of 0.958 and perfect precision (1.000), while Fold 4 showed lower performance (accuracy=0.792, recall=0.750). This variability suggests sensitivity to data splits, potentially due to VGG16’s reliance on pre-trained weights not fully adapted to the truffle crack dataset. The SVM with MobileNetV2 features (Table 2) demonstrated greater consistency, with a mean accuracy of 0.887 ± 0.031 and AUC of 0.952 ± 0.025. Its recall (0.892 ± 0.020) was notably stable, with Folds 2 and 3 achieving high accuracy (0.917) and balanced metrics, indicating robust feature extraction by MobileNetV2. EfficientNetV2B0 (Table 3) outperformed both, with a mean accuracy of 0.929 ± 0.039, recall of 0.933 ± 0.033, and AUC of 0.975 ± 0.026. Its highest performance in Fold 3 (accuracy=0.979, AUC=0.997) and lowest in Fold 4 (accuracy=0.875) reflect moderate variability, primarily in precision (0.928 ± 0.056). Figure 3’s bar plot, with error bars showing standard deviations, underscores EfficientNetV2B0’s superior performance across all metrics, particularly in AUC, highlighting its ability to generalize across folds.
3.2. Test Set Performance
Test set results at the default classification threshold (0.5) are presented in Table 4, Table 5 and Table 6, with Receiver Operating Characteristic (ROC) curves in Figure 4. The VGG16 model (Table 4) recorded a test accuracy of 0.833, precision of 0.917, recall of 0.733, F1 score of 0.815, and AUC of 0.944. Adjusting the threshold to 0.3 increased recall to 0.867, improving truffle crack detection but potentially increasing false positives, as precision was not reported for this threshold. The SVM with MobileNetV2 (Table 5) showed stronger performance, with a test accuracy of 0.917, precision of 0.903, recall of 0.933, F1 score of 0.918, and AUC of 0.974 at the default threshold. An adjusted threshold of -0.3 further boosted recall to 0.967, with a slightly reduced precision (0.879) but a maintained F1 score (0.921), indicating a favorable trade-off for detecting truffle cracks. EfficientNetV2B0 with TTA (Table 6) achieved the highest test performance, with an accuracy of 0.933, precision of 0.933, recall of 0.933, F1 score of 0.933, and AUC of 0.990. Figure 4’s ROC curves confirm EfficientNetV2B0’s superior discriminative power, with its AUC (0.990) surpassing SVM with MobileNetV2 (0.974) and VGG16 (0.944), reflecting its ability to distinguish truffle cracks across various thresholds.
3.3. Confusion Matrix Analysis
Figure 5 provides confusion matrix comparisons for the test set at the default threshold (0.5), detailing true positives (TP), true negatives (TN), false positives (FP), and false negatives (FN). EfficientNetV2B0 and SVM with MobileNetV2 both correctly identified 28 of 30 truffle cracks (TP=28), but EfficientNetV2B0 also achieved 28 true negatives (TN=28), with minimal errors (FP=2, FN=2), demonstrating balanced performance across both classes. SVM with MobileNetV2 had slightly more false positives (FP=3, TN=27), suggesting a minor tendency to misclassify other cracks as truffle cracks. VGG16 exhibited a higher false negative rate (FN=8, TP=22), indicating challenges in detecting truffle cracks, despite low false positives (FP=2, TN=28). Figure 5’s heatmaps visually highlight these differences, with EfficientNetV2B0’s matrix showing the most balanced distribution, reinforcing its suitability for reliable classification.
3.4. Training Dynamics
The training dynamics of EfficientNetV2B0, the top-performing model, are illustrated in Figure 6, showing training and validation accuracy and loss curves for Fold 1 over 50 epochs. Training accuracy increased from 0.5553 at epoch 1 to 0.9643 by epoch 50, with validation accuracy stabilizing between 0.9167 and 0.9583. Training loss decreased from 4.9705 to 0.5069, closely tracking validation loss (from 4.4983 to 0.5496), indicating minimal overfitting. These curves suggest that EfficientNetV2B0’s architecture, combined with a learning rate of 3.0e-04 and balanced class weights, effectively converged, supporting its robust cross-validation and test performance. While VGG16 and SVM followed similar training protocols (50 epochs for VGG16, scikit-learn defaults for SVM), their dynamics showed slightly higher validation loss variability (data not shown), reinforcing EfficientNetV2B0’s stability.
4. Discussion
This study conducted a comparative analysis of three machine learning models—VGG16 via transfer learning, SVM with MobileNetV2 features, and EfficientNetV2B0 with TTA for automated truffle crack detection in a dataset of 300 soil images (150 truffle cracks, 150 other cracks). The results, derived from 5-fold cross-validation (192 training, 48 validation images per fold) and a 60-image test set (30 per class), provide critical insights into model performance, architectural efficacy, and the application of machine learning in agricultural image analysis. EfficientNetV2B0 emerged as the superior model, achieving a test accuracy of 0.933, F1 score of 0.933, and AUC of 0.990, highlighting the effectiveness of advanced architectures in specialized agricultural tasks.
4.1. Model Performance and Architectural Efficacy
EfficientNetV2B0’s exceptional performance (test accuracy 0.933, F1=0.933, AUC=0.990; Table 6) underscores the advantages of its efficient scaling and compound architecture, optimized for small datasets. Its ImageNet-pretrained base, combined with a compact classifier (256-unit dense layer, 30% dropout), enabled robust feature extraction, capturing subtle crack morphologies despite the dataset’s modest size (300 images). The model’s balanced confusion matrix (28 true positives, 28 true negatives) and high AUC (Figure 5) demonstrate its ability to discriminate truffle cracks from other cracks effectively. The SVM with MobileNetV2 features achieved competitive performance (test accuracy 0.917, F1=0.918, AUC=0.974; Table 4), with MobileNetV2’s lightweight architecture (224×224 inputs) providing efficient feature extraction for the linear SVM classifier. Its high recall (0.967 at threshold -0.3) indicates suitability for applications prioritizing truffle crack detection. VGG16, while effective (test accuracy 0.833, F1=0.815, AUC=0.944; Table 2), exhibited a higher false negative rate (8 vs. 2 for EfficientNetV2B0), suggesting limitations in detecting fine-grained crack patterns, despite its hierarchical feature reuse (16 convolutional layers).
The performance hierarchy—EfficientNetV2B0 > SVM with MobileNetV2 > VGG16—challenges assumptions about the universal superiority of deep convolutional networks. EfficientNetV2B0’s balanced scaling (depth, width, resolution) and TTA enhanced its adaptability to agricultural textures, while SVM’s reliance on pre-extracted features provided efficiency but less flexibility. VGG16’s frozen base, while computationally efficient (0.2 million trainable parameters), struggled with subtle crack variations, as evidenced by its cross-validation variability (accuracy ±0.055; Table 1).
4.2. Model Training and Optimization
The models responded differently to the augmentation strategy (±25° rotation, ±20% shear, ±30% zoom, flipping). EfficientNetV2B0 exhibited stable convergence, with training and validation accuracy/loss curves (Figure 6) showing minimal overfitting (validation accuracy 0.9167–0.9583 over 50 epochs). Its learning rate of 3.0e-04 and balanced class weights (1.0:1.0) ensured robust training, leveraging TTA to enhance test-time reliability. The SVM model, trained on MobileNetV2-extracted features, required no iterative training, benefiting from the pre-trained network’s augmentation-invariant features. VGG16 maintained stable convergence but showed higher validation loss fluctuations, likely due to its fixed convolutional base limiting adaptation to domain-specific variations. The absence of early stopping for EfficientNetV2B0 (50 epochs) and its lower parameter count compared to deeper models underscore its computational efficiency, critical for resource-constrained agricultural settings.
4.3. Architectural Considerations for Agricultural Imaging
The performance differences highlight the importance of matching architecture to dataset scale and feature complexity. EfficientNetV2B0’s compound scaling provided sufficient abstraction for crack textures, balancing depth and width to capture both macro-patterns and micro-details. MobileNetV2’s lightweight design (depthwise separable convolutions) enabled efficient feature extraction for the SVM, though its linear classifier limited nuanced feature integration. VGG16’s 16-layer architecture, while effective for edge detection, struggled with subtle crack morphologies, as seen in its higher false negatives (Figure 5). These findings suggest that agricultural imaging benefits from architectures optimized for efficiency and adaptability, rather than excessive depth, particularly with limited data (300 images).
4.4. Practical Implications
EfficientNetV2B0’s superior performance (test accuracy 0.933, AUC=0.990) and robustness to augmentation make it ideal for real-world truffle crack detection, where variable field conditions (e.g., soil textures, lighting) are common. Its balanced classification (28 true positives, 28 true negatives) and TTA ensure reliable quality assurance, reducing manual inspection needs. The SVM model’s high recall at an adjusted threshold (0.967) offers a viable alternative for scenarios prioritizing truffle crack detection over specificity. VGG16, despite lower performance, remains computationally efficient, suitable for rapid deployment on modest hardware. These models, trained on accessible resources, demonstrate the feasibility of integrating machine learning into truffle production workflows, enhancing efficiency, scalability, and profitability.
4.5. Comparison with Existing Research in Crack Detection
This study aligns with crack detection research (Yang et al. 2021; Mandal, Uong, and Adu-Gyamfi 2018) but addresses unique challenges in truffle crack detection. Unlike structural cracks with clear linear patterns, truffle cracks are irregular and embedded in heterogeneous soil textures, requiring models to discern subtle morphological differences. EfficientNetV2B0’s success contrasts with Yang et al.’s (2021) ResNet18 for structural cracks, highlighting the need for domain-specific architectures. Road crack detection (Zhang et al. 2016) shares similarities with soil texture variability, but our task emphasizes crack-type differentiation, critical for truffle harvesting. Multi-scale techniques (Zou et al. 2018) could enhance performance but require adaptation to micro-textural soil patterns.
4.6. Limitations and Future Directions
Despite EfficientNetV2B0’s robust performance, its 6.7% error rate (2 false positives, 2 false negatives) indicates challenges in discriminating subtle crack morphologies, particularly under diverse soil conditions. VGG16’s higher false negatives (8) suggest limitations in capturing fine-grained patterns, exacerbated by the dataset’s modest size (300 images). Cross-validation variability (e.g., VGG16 accuracy ±0.055) underscores the need for larger, more diverse datasets. Future work should explore hybrid architectures, integrating EfficientNetV2B0 with attention mechanisms (e.g., squeeze-and-excitation blocks) to enhance feature focus. Synthetic data generation or multi-site image collection could address data limitations, improving generalization across soil types and seasons. Multi-modal systems combining image analysis with soil sensors (e.g., moisture, pH) could leverage environmental correlations to boost accuracy. Extending this framework to multi-class classification (e.g., truffle species identification) or real-time mobile deployment could further revolutionize precision agriculture, reducing labor costs and enhancing yield consistency in the global truffle industry.
5. Conclusions
This study developed a machine learning framework for automated truffle crack detection, evaluating VGG16 via transfer learning, Support Vector Machine with MobileNetV2 features, and EfficientNetV2B0 with Test-Time Augmentation on a 300-image dataset (150 per class) using 5-fold cross-validation and a 60-image test set. EfficientNetV2B0 emerged as the top performer, with performance metrics detailed in Table 1 and Table 4, including a test accuracy of 0.933 and AUC of 0.990, supported by stable training dynamics (Figure 6). Comparative analysis revealed SVM’s high recall (0.967 at threshold -0.3) and VGG16’s lower accuracy (0.833), with 8 false negatives, indicating challenges with subtle crack morphologies.
Limitations include the dataset’s modest size (300 images), causing cross-validation variability (e.g., VGG16 ±0.055), and VGG16’s sensitivity to soil texture. Future work could explore hybrid architectures with attention mechanisms, expand the dataset via synthetic data or multi-site collection, and integrate multi-modal sensors to enhance accuracy. These advancements could revolutionize truffle harvesting, reducing manual inspection and boosting the $548 million 2025 industry’s efficiency and sustainability. EfficientNetV2B0 sets a benchmark for scalable agricultural ML applications, with potential to enhance yield consistency and profitability. This study advances precision agriculture by providing a scalable ML framework.
Funding
This research received no external funding.
Conflicts of Interest
The author declare no conflicts of interest.
Author Contributions
Conceptualization, A.R.; methodology, A.R.; software A.R.; validation, A.R.; formal analysis, A.R.; resources, A.R.; data curation, A.R.; writing—original draft preparation, A.R.; writing—review and editing, A.R.; visualization, A.R.
Data Availability Statement
the image dataset used in this work is publicly available on a GitHub repository (https://github.com/Azad77/CNNsTruffle/tree/main).
Compliance with Ethical Standards
Not applicable, as this study did not involve human or animal subjects.
Ethical Approval
This article does not contain any studies with human participants or animals performed by any of the authors.
Informed Consent
not applicable.
Consent to Publish declaration
Not applicable.
References
- Ali, Raza, Joon Huang Chuah, Mohamad Sofian Abu Talip, Norrima Mokhtar, and Muhammad Ali Shoaib. 2022. “Structural Crack Detection Using Deep Convolutional Neural Networks.” Automation in Construction 133: 103989. [CrossRef]
- Alrhmoun, Mousaab, Monica Zanaria, Federico Elia, Naji Sulaiman, Andrea Pieroni, and Paolo Corvo. 2025. “‘It’s Years of Walking, of Reading the Forest’: White Truffle Hunters’ Perception of Socio-Ecological Change in Langhe and Roero, NW Italy.” Sustainability 17 (17): 8053. [CrossRef]
- Andrushia, A. Diana, T. Mary Neebha, S. Umadevi, N. Anand, and Katherine A. Cashell. 2022. “Shrinkage Crack Detection in Expansive Soil Using Deep Convolutional Neural Network and Transfer Learning.” KSCE Journal of Civil Engineering 26 (10): 4202–4213. [CrossRef]
- Cortes, Corinna, and Vladimir Vapnik. 1995. “Support-Vector Networks.” Machine Learning 20 (3): 273–297. [CrossRef]
- Dhillon, Anamika, and Gyanendra K. Verma. 2020. “Convolutional Neural Network: A Review of Models, Methodologies and Applications to Object Detection.” Progress in Artificial Intelligence 9 (2): 85–112. [CrossRef]
- Future Market Insights. 2025. “Truffles Market Size, Trends & Forecast 2025 to 2035.” https://www.futuremarketinsights.com/reports/truffles-market.
- Gupta, Priyanka, and Manish Dixit. 2022. “Image-Based Crack Detection Approaches: A Comprehensive Survey.” Multimedia Tools and Applications 81 (28): 40181–40229. [CrossRef]
- Mandal, Vishal, Lan Uong, and Yaw Adu-Gyamfi. 2018. “Automated Road Crack Detection Using Deep Convolutional Neural Networks.” 2018 IEEE International Conference on Big Data (Big Data), 2018, 5212–5215. https://ieeexplore.ieee.org/abstract/document/8622327/. [CrossRef]
- Meftah, Ibrahim, Junping Hu, Mohammed A. Asham, Asma Meftah, Li Zhen, and Ruihuan Wu. 2024. “Visual Detection of Road Cracks for Autonomous Vehicles Based on Deep Learning.” Sensors 24 (5): 1647. [CrossRef]
- Oliach, Daniel, Enrico Vidale, Anton Brenko, Olivia Marois, Nicola Andrighetto, Kalliopi Stara, Juan Martínez de Aragón, Carlos Colinas, and José Antonio Bonet. 2021. “Truffle Market Evolution: An Application of the Delphi Method.” Forests 12 (9): 1174. [CrossRef]
- Sandler, Mark, Andrew Howard, Menglong Zhu, Andrey Zhmoginov, and Liang-Chieh Chen. 2018. “MobileNetV2: Inverted Residuals and Linear Bottlenecks.” 2018, 4510–4520. https://openaccess.thecvf.com/content_cvpr_2018/html/Sandler_MobileNetV2_Inverted_Residuals_CVPR_2018_paper.html. [CrossRef]
- Simonyan, Karen, and Andrew Zisserman. 2015. “Very Deep Convolutional Networks for Large-Scale Image Recognition.” arXiv:1409.1556. Preprint, arXiv, April 10. [CrossRef]
- Sishodia, Rajendra P., Ram L. Ray, and Sudhir K. Singh. 2020. “Applications of Remote Sensing in Precision Agriculture: A Review.” Remote Sensing 12 (19): 3136. [CrossRef]
- Splivallo, Richard, Simone Ottonello, Antonietta Mello, and Petr Karlovsky. 2011. “Truffle Volatiles: From Chemical Ecology to Aroma Biosynthesis.” New Phytologist 189 (3): 688–699. [CrossRef]
- Sreenath, Sreehari, Haroon Malik, Narman Husnu, and Kanimozhi Kalaichelavan. 2020. “Assessment and Use of Unmanned Aerial Vehicle for Civil Structural Health Monitoring.” Procedia Computer Science 170: 656–663. [CrossRef]
- Tan, Mingxing, and Quoc Le. 2021. “EfficientNetV2: Smaller Models and Faster Training.” Proceedings of the 38th International Conference on Machine Learning, July 1, 2021, 10096–10106. https://proceedings.mlr.press/v139/tan21a.html.
- Upadhyay, Abhishek, Narendra Singh Chandel, Krishna Pratap Singh, Subir Kumar Chakraborty, Balaji M. Nandede, Mohit Kumar, A. Subeesh, Konga Upendar, Ali Salem, and Ahmed Elbeltagi. 2025. “Deep Learning and Computer Vision in Plant Disease Detection: A Comprehensive Review of Techniques, Models, and Trends in Precision Agriculture.” Artificial Intelligence Review 58 (3): 92. [CrossRef]
- Wang, D., M. Zhao, and Z. Li. 2025. “A Survey of Unmanned Aerial Vehicles and Deep Learning in Precision Agriculture.” European Journal of Agronomy 164 (127477). [CrossRef]
- Yang, Cheng, Jingjie Chen, Zhiyuan Li, and Yi Huang. 2021. “Structural Crack Detection and Recognition Based on Deep Learning.” Applied Sciences 11 (6): 2868. [CrossRef]
- Yasmin, Tamanna. 2022. “Deep Learning Based Concrete Distress Detection System for Civil Infrastructure.” Master’s Thesis, University of Nevada, Reno. https://search.proquest.com/openview/23699c810c2e03e2e08a9c2379561ae0/1?pq-origsite=gscholar&cbl=18750&diss=y.
- Zhang, Lei, Fan Yang, Yimin Daniel Zhang, and Ying Julie Zhu. 2016. “Road Crack Detection Using Deep Convolutional Neural Network.” 2016 IEEE International Conference on Image Processing (ICIP), 2016, 3708–3712. https://ieeexplore.ieee.org/abstract/document/7533052/. [CrossRef]
- Zou, Qin, Zheng Zhang, Qingquan Li, Xianbiao Qi, Qian Wang, and Song Wang. 2018. “Deepcrack: Learning Hierarchical Convolutional Features for Crack Detection.” IEEE Transactions on Image Processing 28 (3): 1498–1512. [CrossRef]
Figure 1.
Samples of dataset images. (Left) A truffle crack; (Right) Other soil cracks.
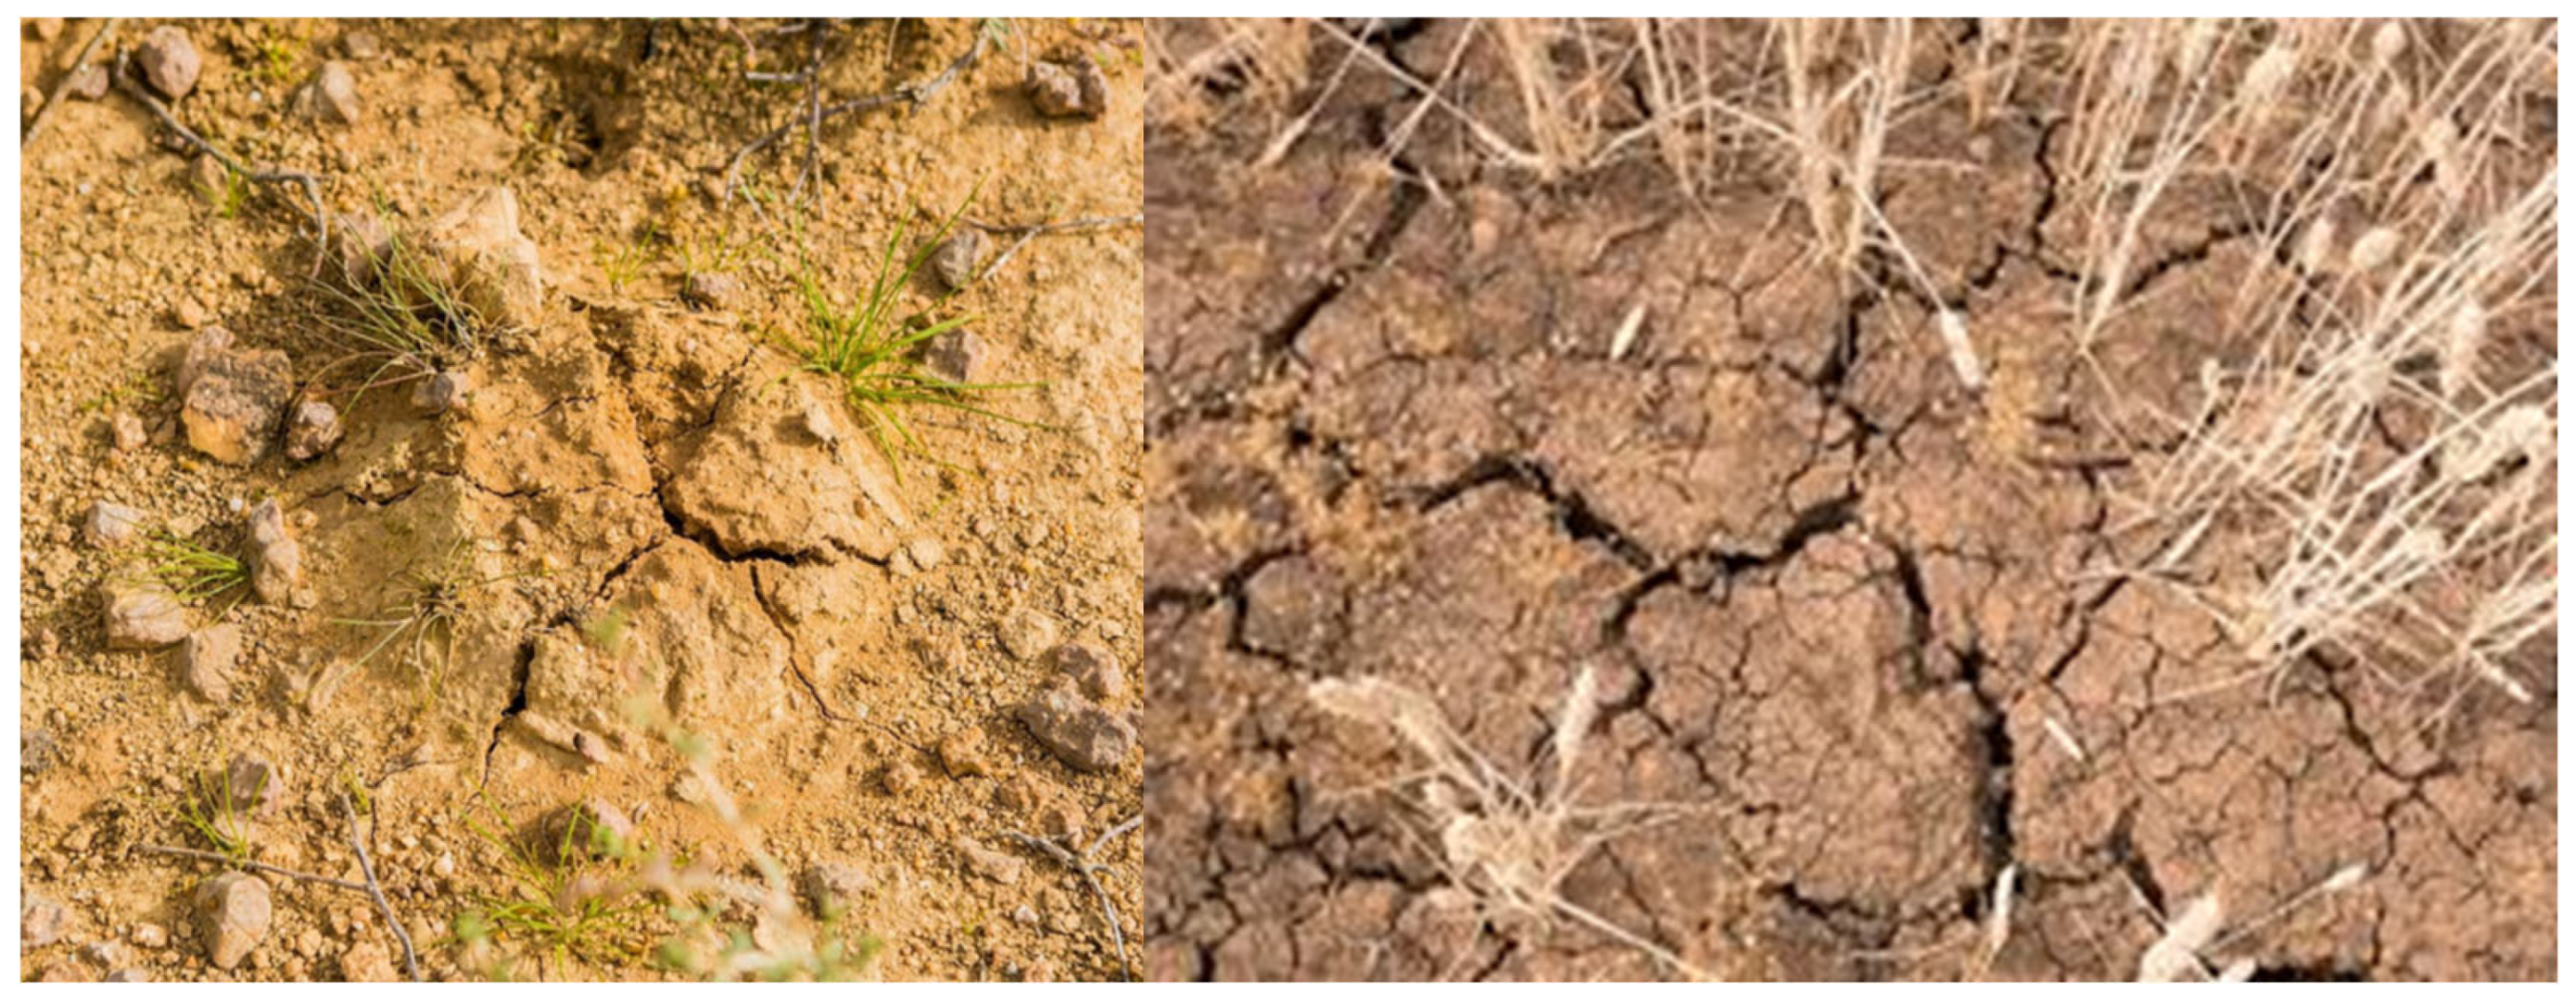
Figure 2.
Flowchart Illustrating Methods Employed in the Research.
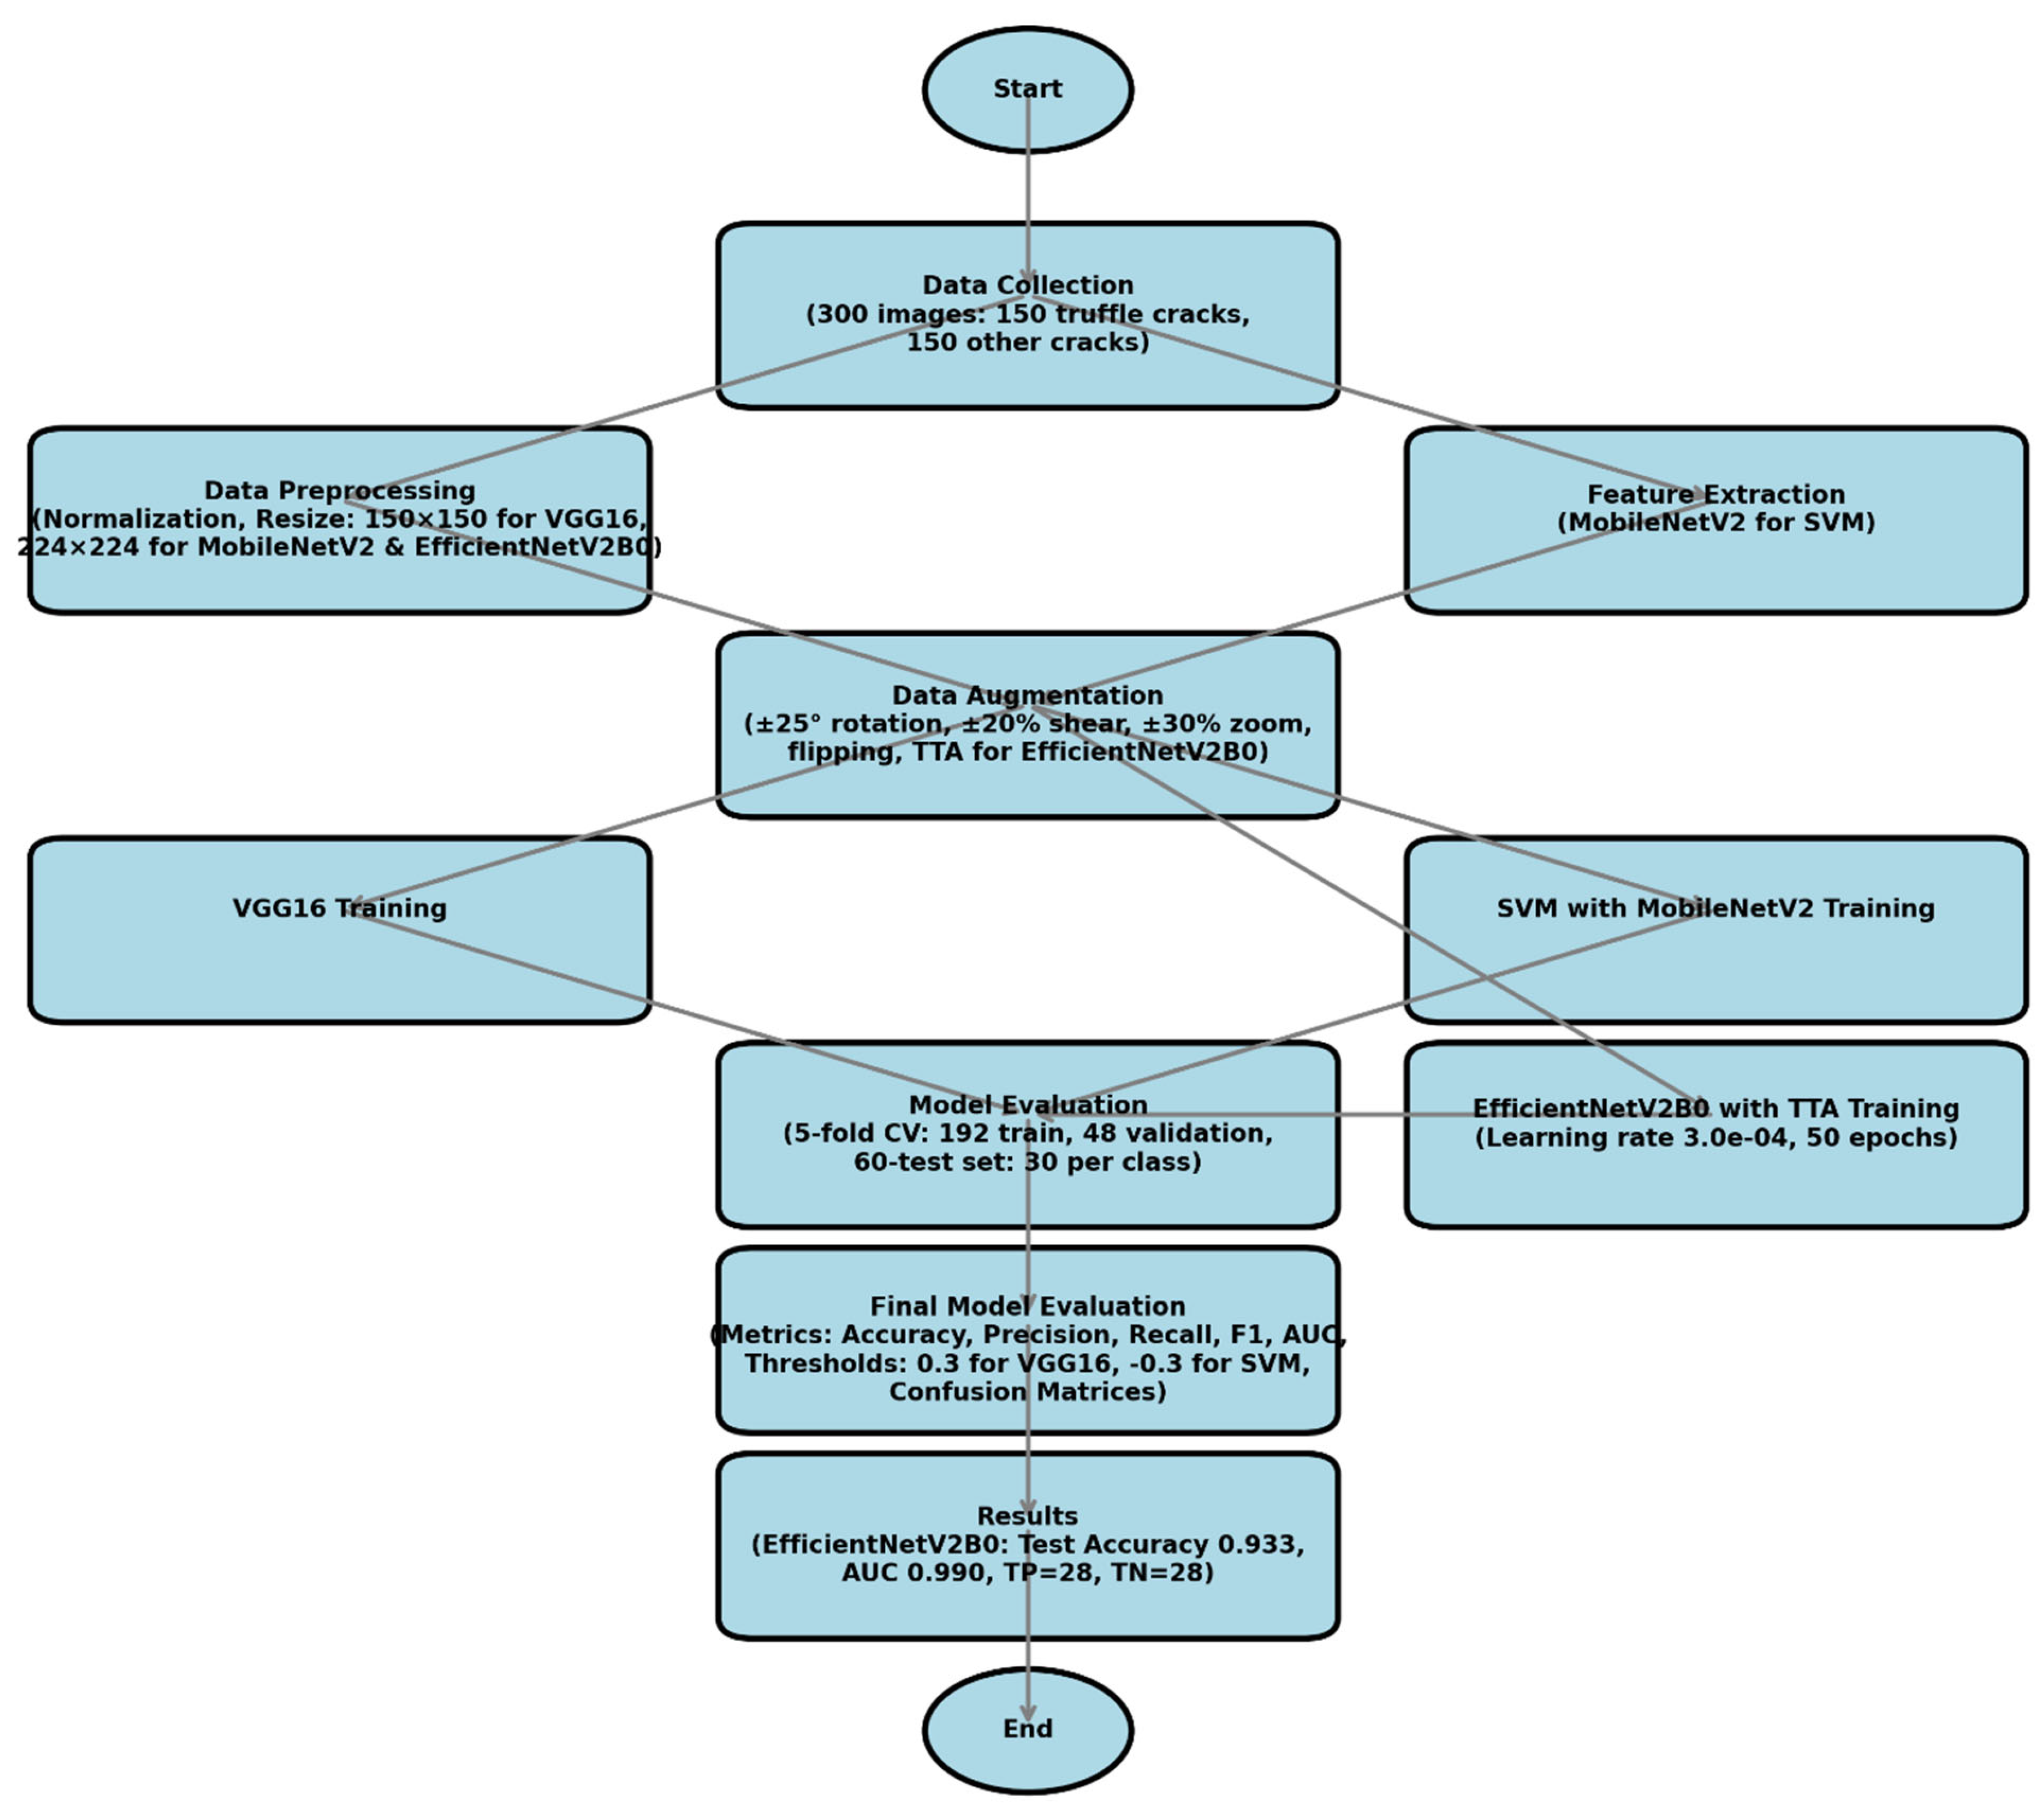
Figure 3.
“Mean cross-validation metrics (Accuracy, Precision, Recall, F1 Score, AUC) across VGG16, SVM with MobileNetV2, and EfficientNetV2B0, with error bars showing standard deviations across five folds.”.
Figure 3.
“Mean cross-validation metrics (Accuracy, Precision, Recall, F1 Score, AUC) across VGG16, SVM with MobileNetV2, and EfficientNetV2B0, with error bars showing standard deviations across five folds.”.
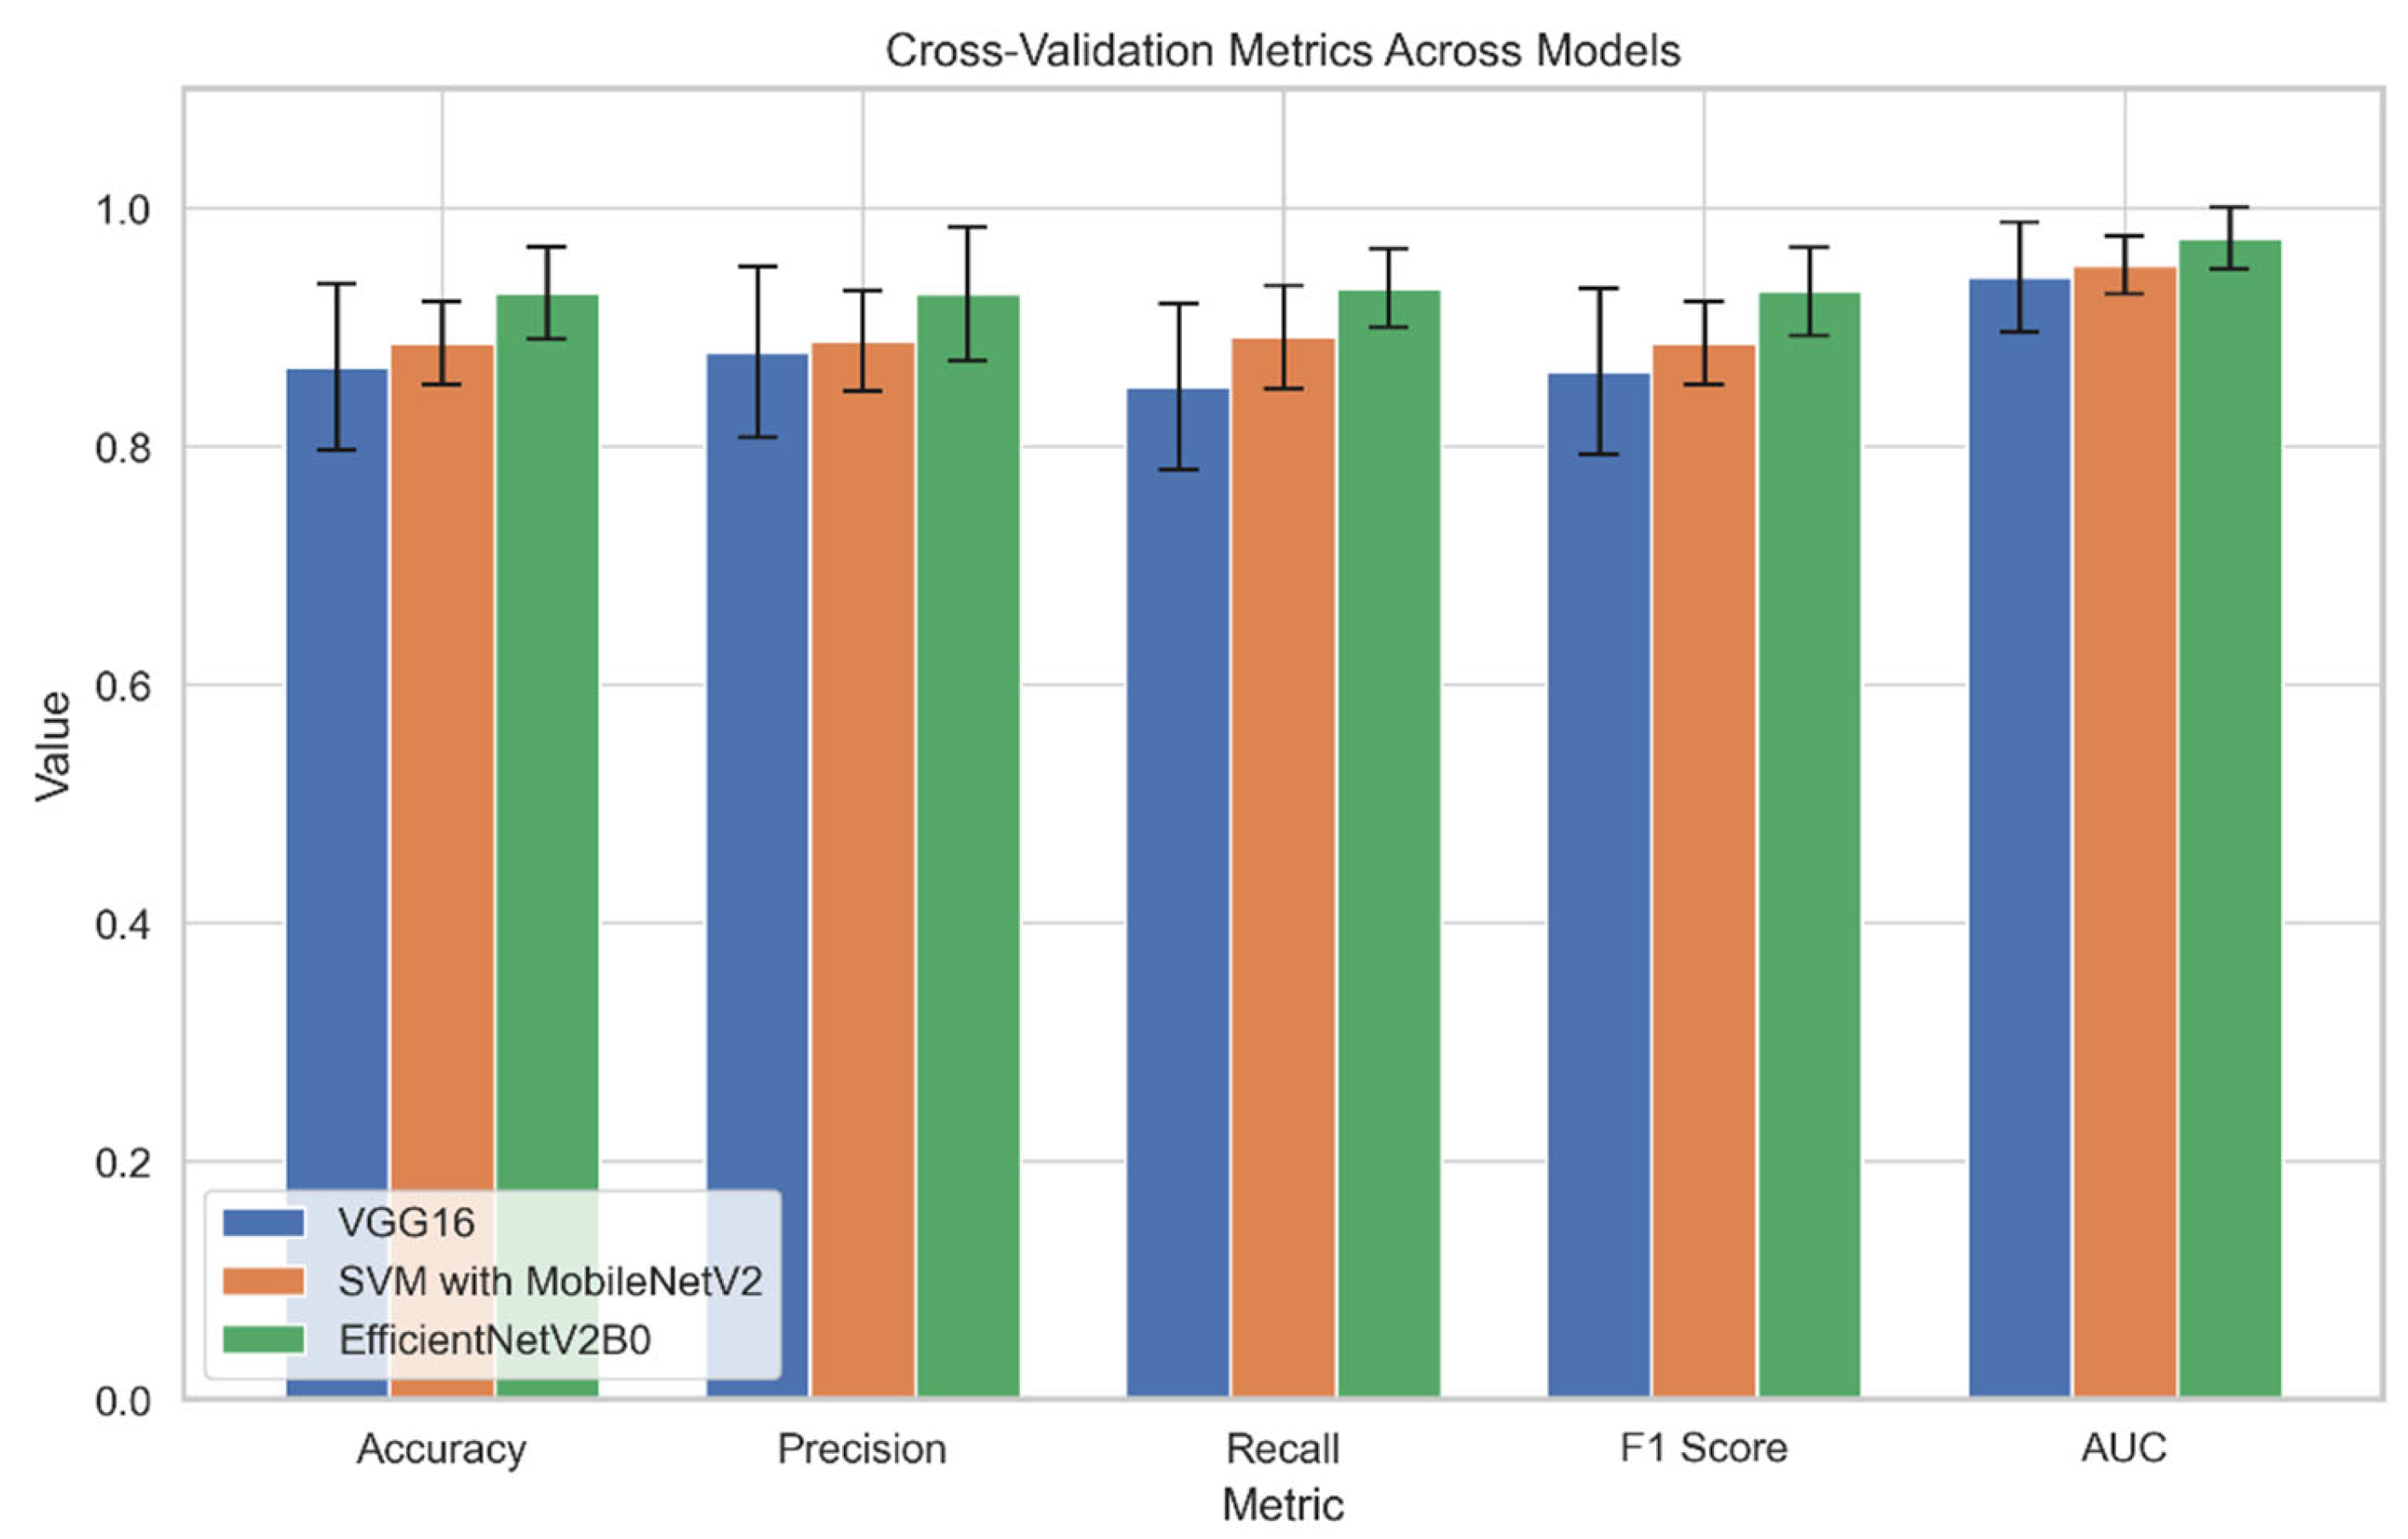
Figure 4.
“ROC curves for VGG16, SVM with MobileNetV2, and EfficientNetV2B0 on the test set of 60 images (30 truffle cracks, 30 other cracks). AUC values indicate EfficientNetV2B0’s superior discriminative performance (AUC = 0.990).”.
Figure 4.
“ROC curves for VGG16, SVM with MobileNetV2, and EfficientNetV2B0 on the test set of 60 images (30 truffle cracks, 30 other cracks). AUC values indicate EfficientNetV2B0’s superior discriminative performance (AUC = 0.990).”.
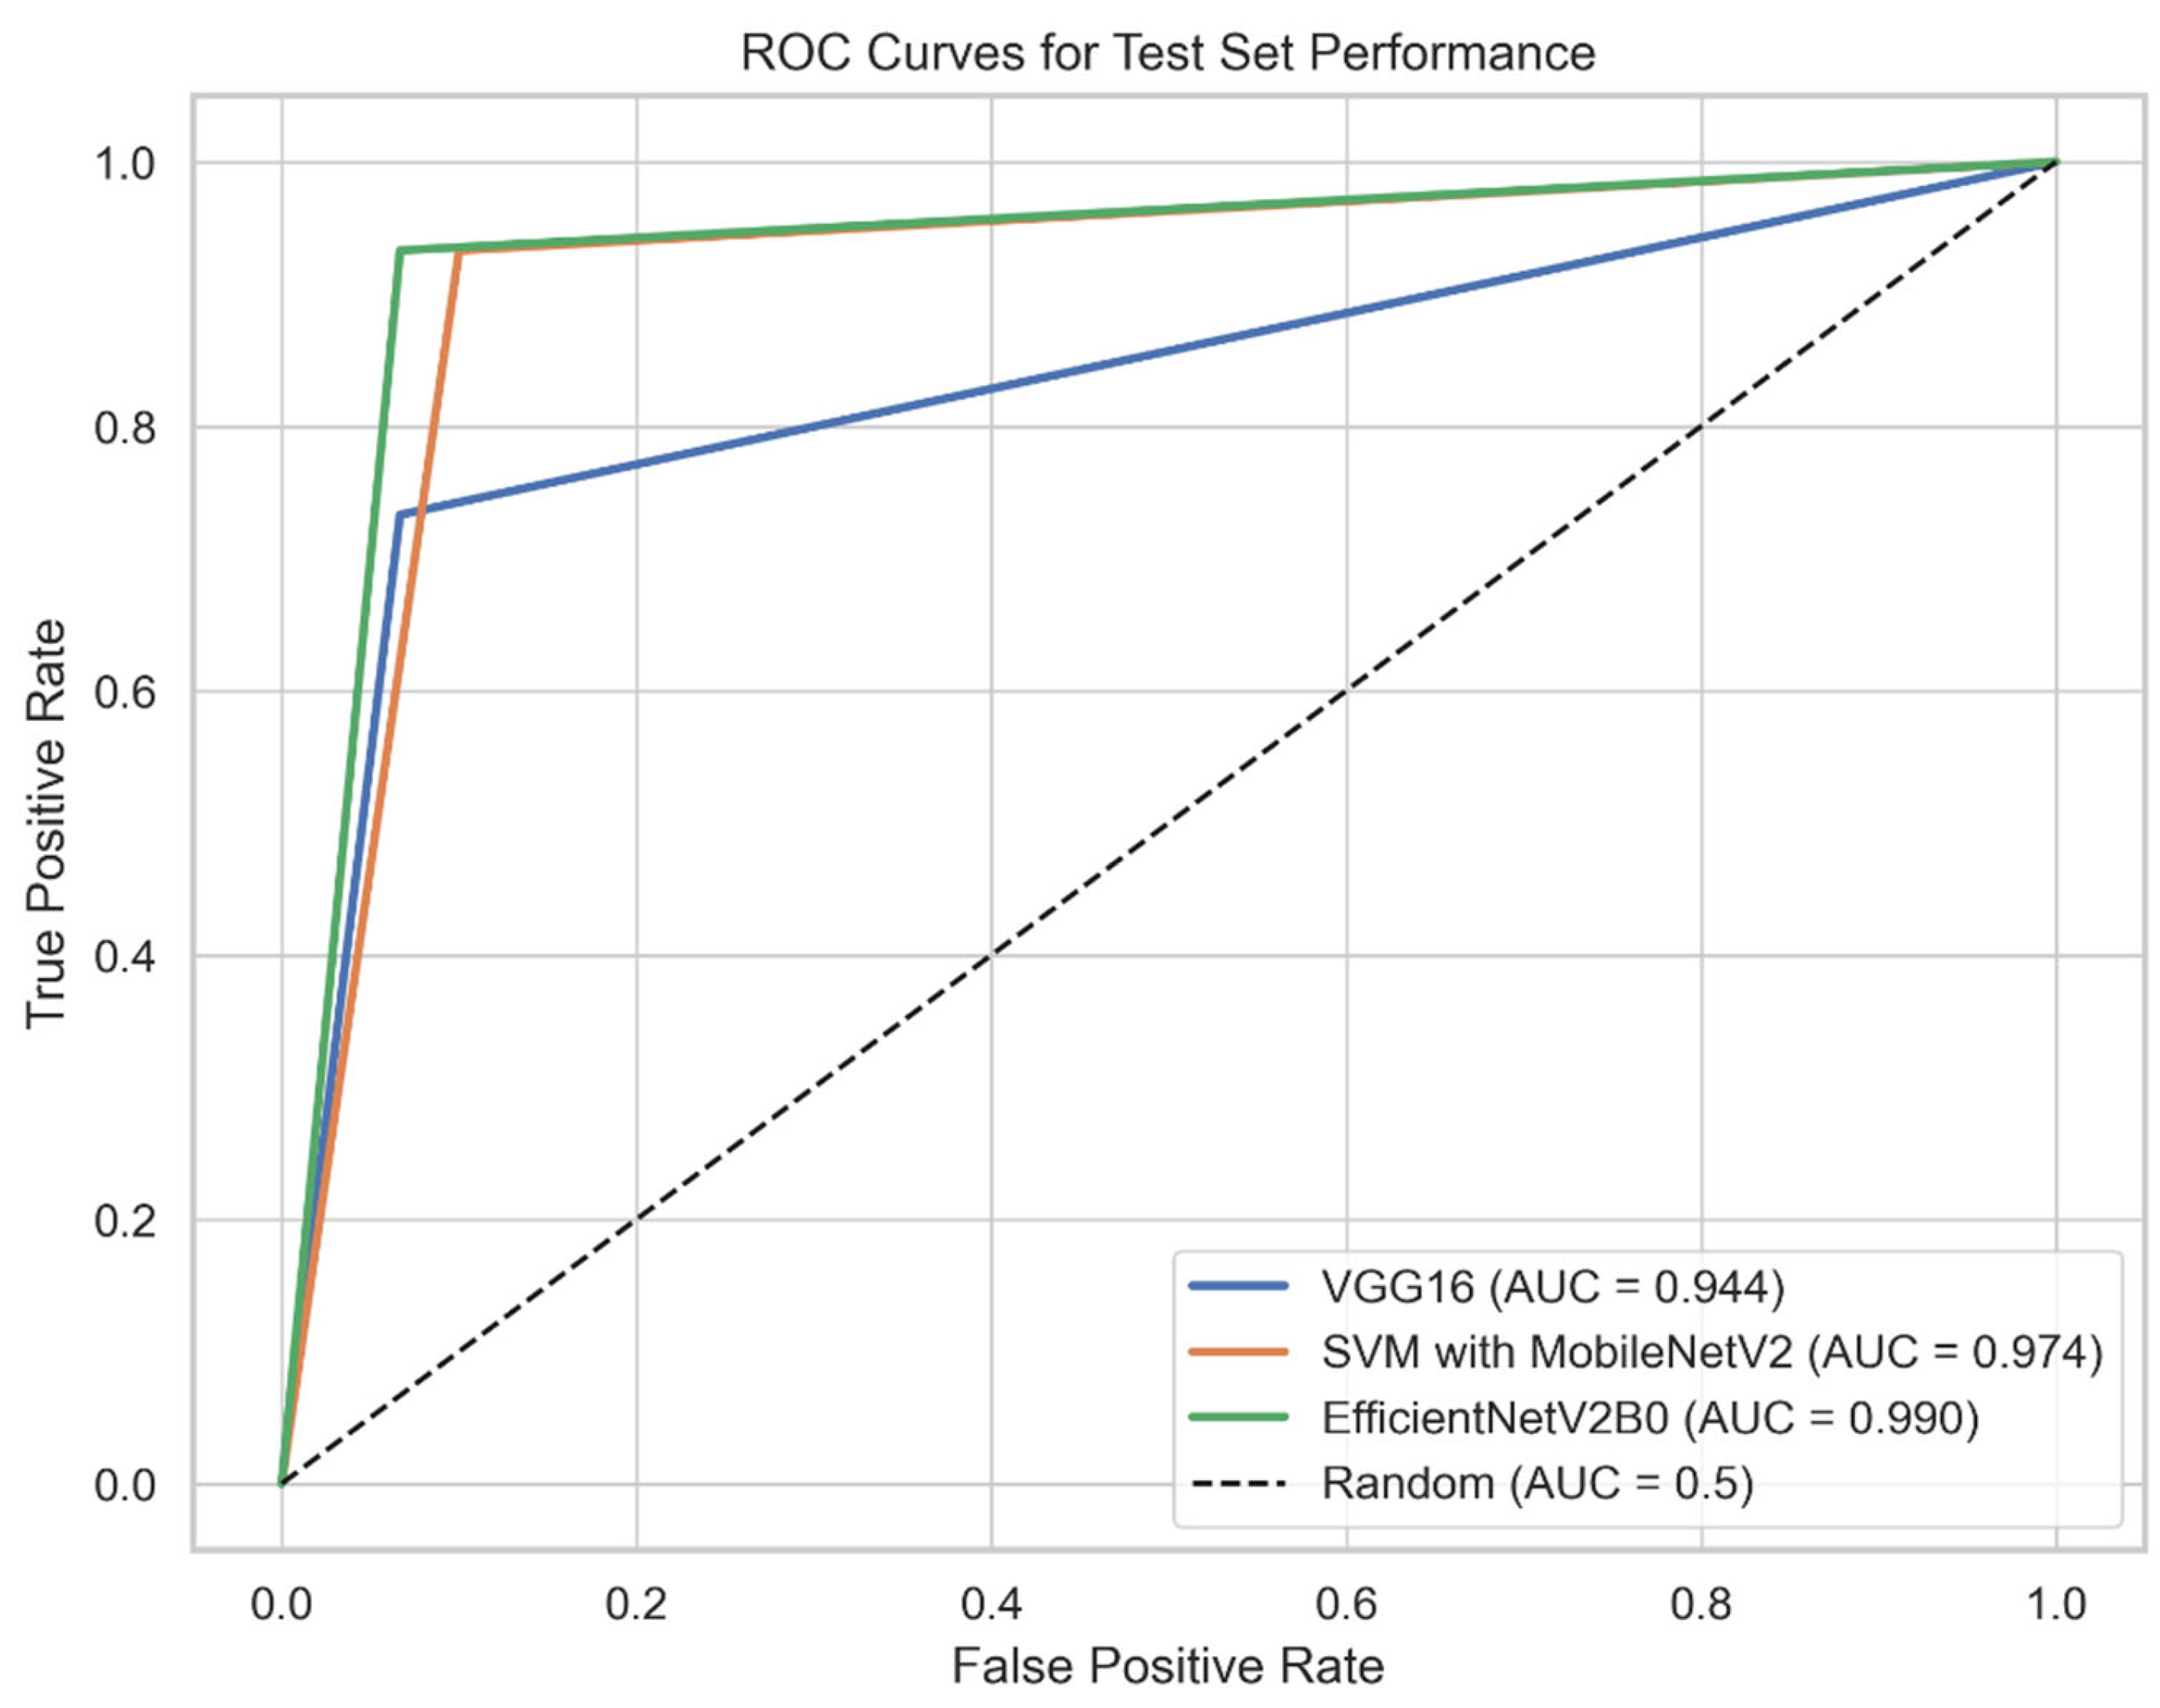
Figure 5.
“Confusion matrix heatmaps for VGG16, SVM with MobileNetV2, and EfficientNetV2B0 on the test set, showing true positives (TP), true negatives (TN), false positives (FP), and false negatives (FN).”.
Figure 5.
“Confusion matrix heatmaps for VGG16, SVM with MobileNetV2, and EfficientNetV2B0 on the test set, showing true positives (TP), true negatives (TN), false positives (FP), and false negatives (FN).”.
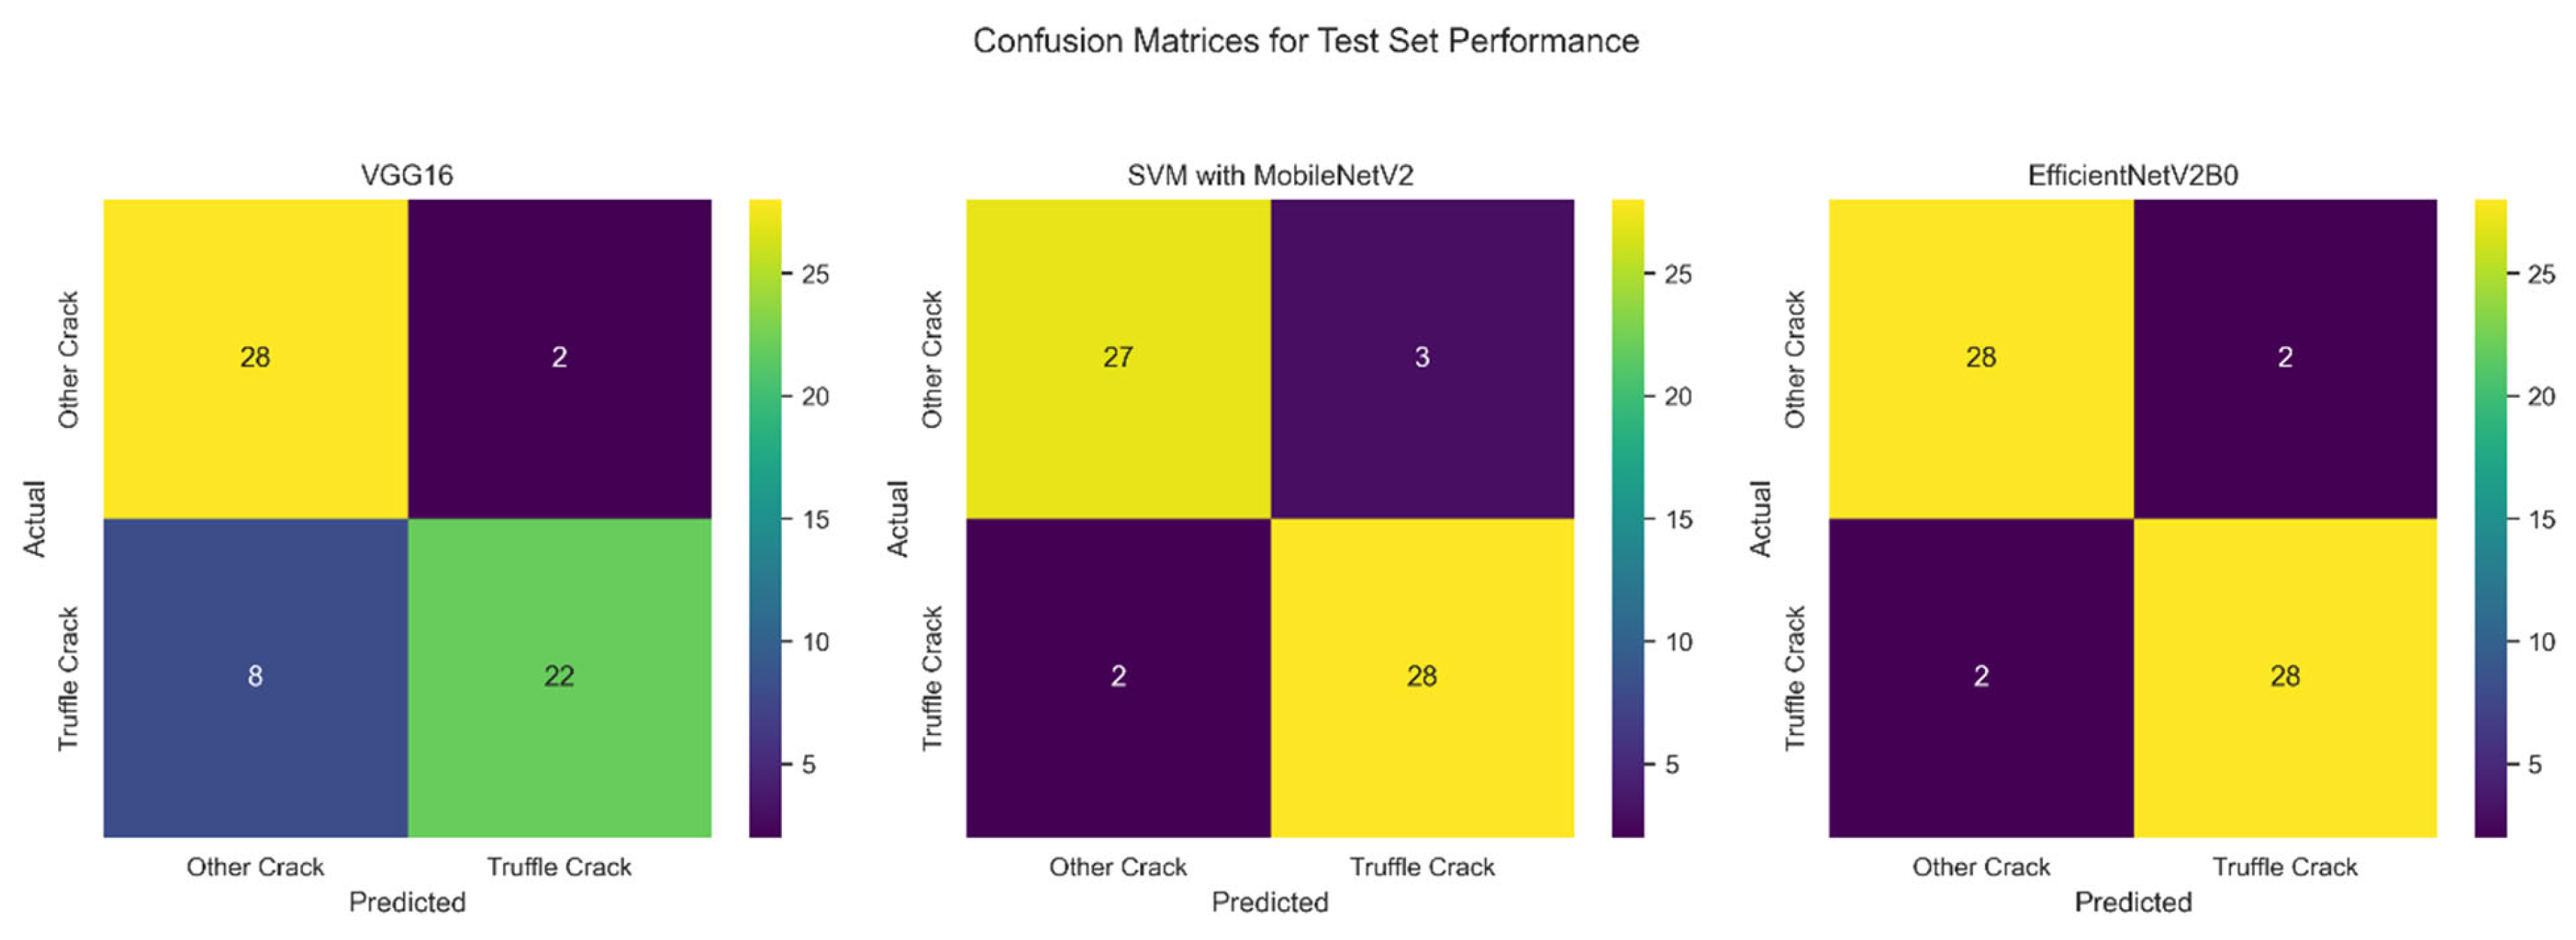
Figure 6.
Training and validation accuracy and loss curves for EfficientNetV2B0 (Fold 1) over 50 epochs, demonstrating convergence with minimal overfitting.
Figure 6.
Training and validation accuracy and loss curves for EfficientNetV2B0 (Fold 1) over 50 epochs, demonstrating convergence with minimal overfitting.
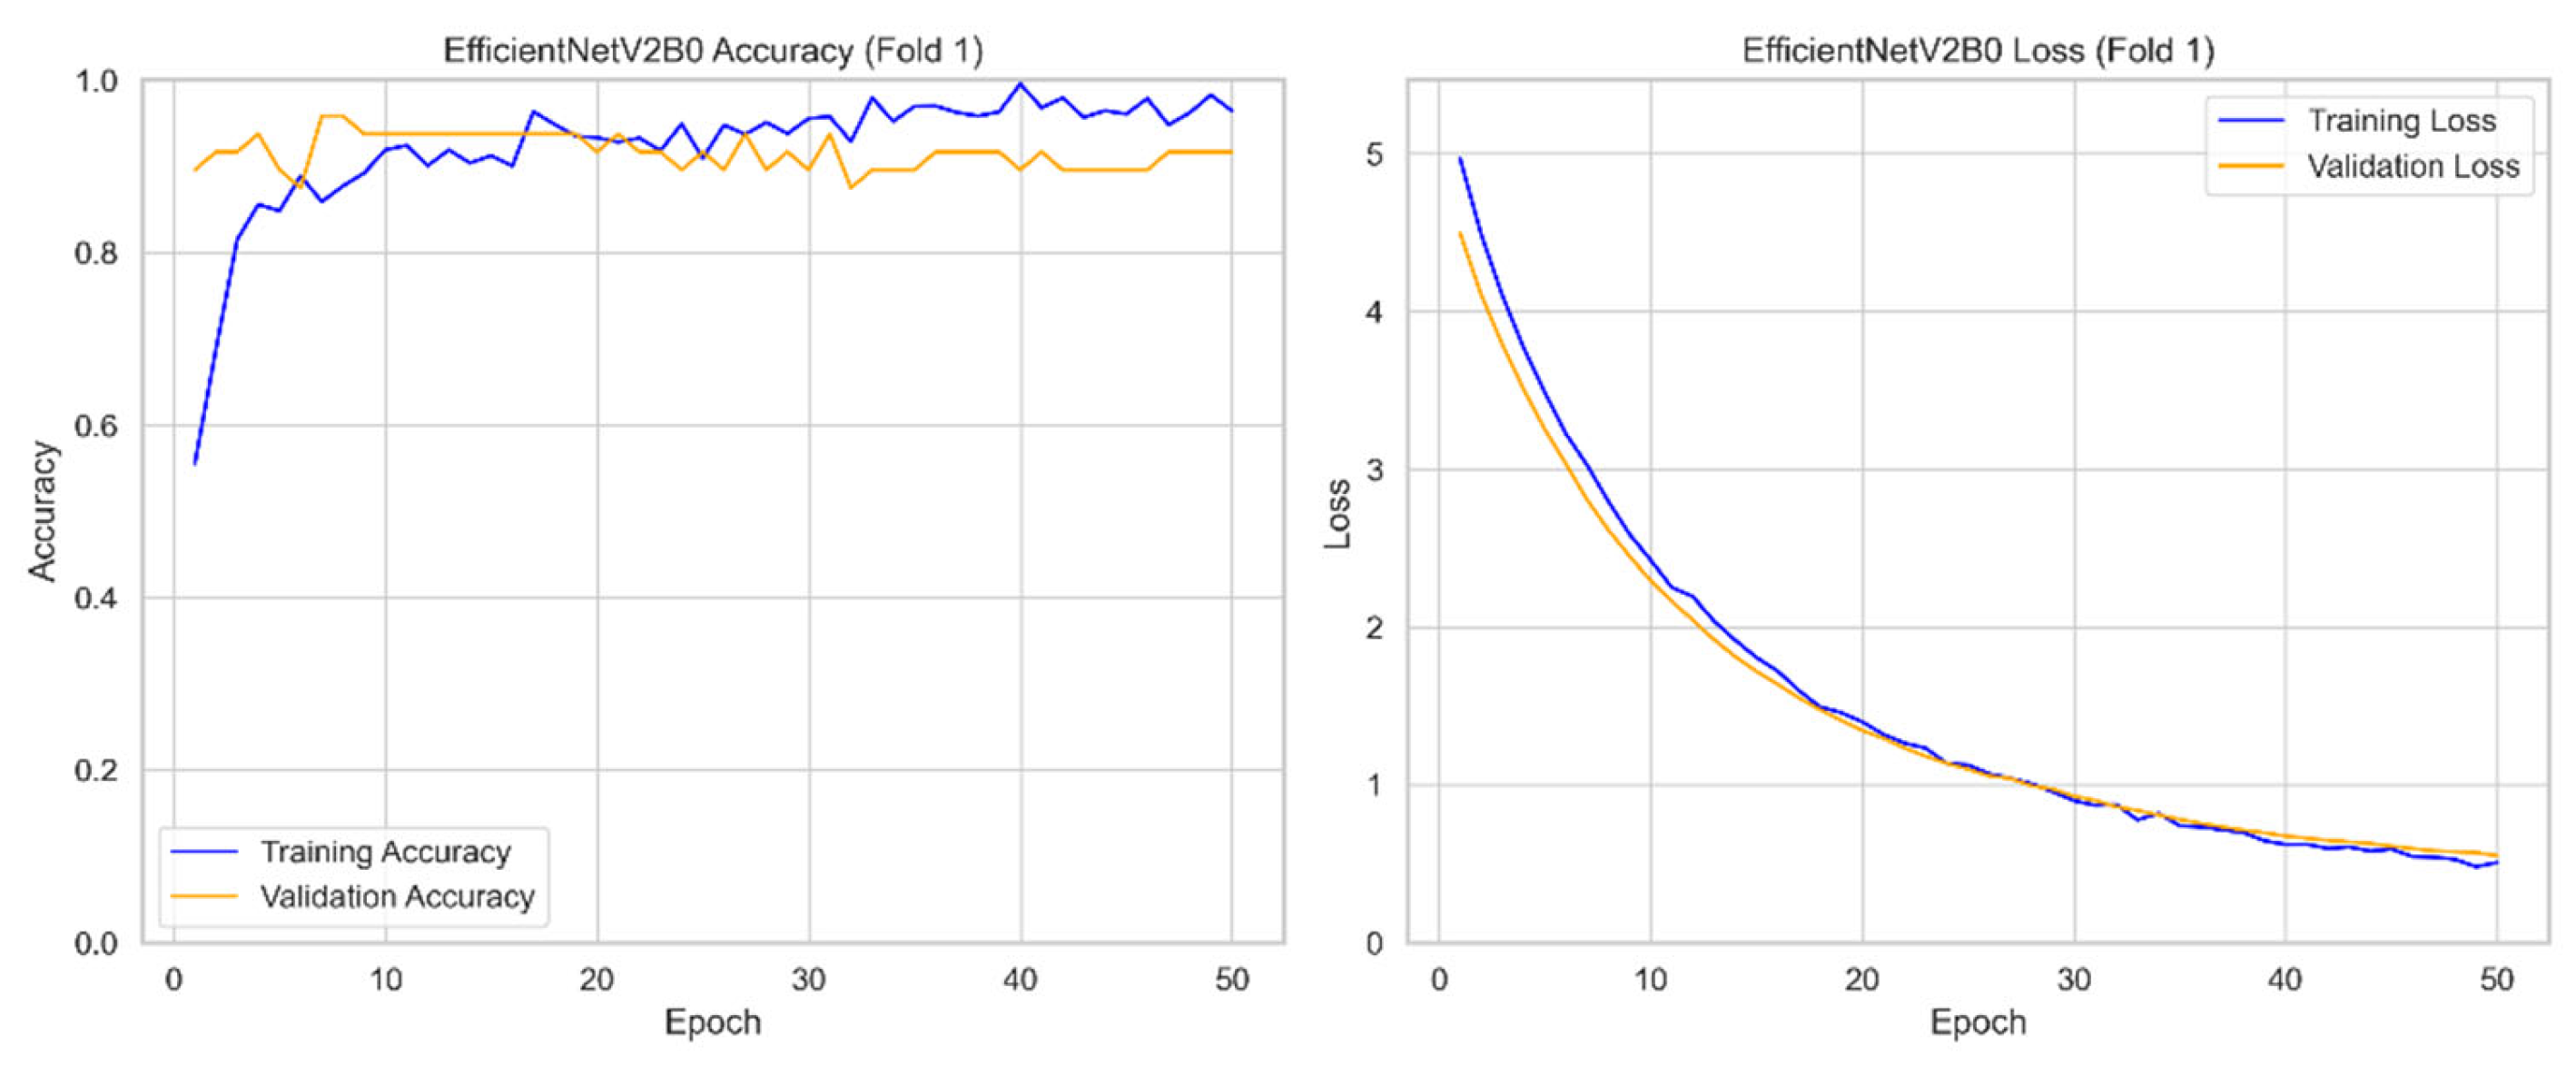

Table 1.
Cross-Validation Results for VGG16 Transfer Learning.
| Fold | Accuracy | Precision | Recall | F1 Score | AUC |
| 1 | 0.875 | 0.950 | 0.792 | 0.864 | 0.970 |
| 2 | 0.875 | 0.875 | 0.875 | 0.875 | 0.941 |
| 3 | 0.958 | 1.000 | 0.917 | 0.957 | 0.981 |
| 4 | 0.792 | 0.818 | 0.750 | 0.783 | 0.898 |
| 5 | 0.833 | 0.786 | 0.917 | 0.846 | 0.922 |
| Mean ± Std | 0.867 ± 0.055 | 0.886 ± 0.080 | 0.850 ± 0.068 | 0.865 ± 0.056 | 0.942 ± 0.031 |
Note: Performance metrics for the VGG16 transfer learning model across five folds of cross-validation on a dataset of 300 images (150 truffle cracks, 150 other soil cracks). Metrics include Accuracy, Precision, Recall, F1 Score, and Area Under the Curve (AUC), with mean ± standard deviation reported.
Table 2.
Cross-Validation Results for SVM with MobileNetV2 Features.
| Fold | Accuracy | Precision | Recall | F1 Score | AUC |
| 1 | 0.833 | 0.808 | 0.875 | 0.840 | 0.960 |
| 2 | 0.917 | 0.917 | 0.917 | 0.917 | 0.986 |
| 3 | 0.917 | 0.917 | 0.917 | 0.917 | 0.965 |
| 4 | 0.896 | 0.913 | 0.875 | 0.894 | 0.924 |
| 5 | 0.875 | 0.875 | 0.875 | 0.875 | 0.924 |
| Mean ± Std | 0.887 ± 0.031 | 0.886 ± 0.042 | 0.892 ± 0.020 | 0.888 ± 0.029 | 0.952 ± 0.025 |
Note: Cross-validation performance metrics for the SVM model with MobileNetV2 features across five folds, evaluated on a dataset of 300 images (150 truffle cracks, 150 other cracks). Metrics include Accuracy, Precision, Recall, F1 Score, and Area Under the Curve (AUC). The mean and standard deviation are reported for each metric.
Table 3.
Cross-Validation Results for EfficientNetV2B0.
| Fold | Accuracy | Precision | Recall | F1 Score | AUC |
| 1 | 0.938 | 0.957 | 0.917 | 0.936 | 0.988 |
| 2 | 0.958 | 0.958 | 0.958 | 0.958 | 0.997 |
| 3 | 0.979 | 1.000 | 0.958 | 0.979 | 0.997 |
| 4 | 0.875 | 0.875 | 0.875 | 0.875 | 0.969 |
| 5 | 0.896 | 0.852 | 0.958 | 0.902 | 0.927 |
| Mean ± Std | 0.929 ± 0.039 | 0.928 ± 0.056 | 0.933 ± 0.033 | 0.930 ± 0.037 | 0.975 ± 0.026 |
Note: Cross-validation performance metrics for the EfficientNetV2B0 model across five folds, evaluated on a dataset of 300 images (150 truffle cracks, 150 other cracks). Metrics include Accuracy, Precision, Recall, F1 Score, and Area Under the Curve (AUC). The mean and standard deviation are reported for each metric.
Table 4.
Test Set Performance for VGG16 Transfer Learning.
| Metric | Value |
| Test Accuracy | 0.833 |
| Test Precision | 0.917 |
| Test Recall | 0.733 |
| Test F1 Score | 0.815 |
| Test AUC | 0.944 |
| Test Recall (threshold=0.3) | 0.867 |
Note: Performance metrics for the VGG16 transfer learning model on a test set of 60 images (30 truffle cracks, 30 other soil cracks), with Recall evaluated at a classification threshold of 0.3.
Table 5.
Test Set Performance for SVM with MobileNetV2 Features.
| Metric | Default Threshold (0.5) | Adjusted Threshold (-0.3) |
| Test Accuracy | 0.917 | 0.917 |
| Test Precision | 0.903 | 0.879 |
| Test Recall | 0.933 | 0.967 |
| Test F1 Score | 0.918 | 0.921 |
| Test AUC | 0.974 | 0.974 |
Note: Test set performance metrics for the SVM model with MobileNetV2 features evaluated on a test set of 60 images. Metrics include Accuracy, Precision, Recall, F1 Score, and Area Under the Curve (AUC) at the default classification threshold (0.5) and an adjusted threshold (-0.3).
Table 6.
Test Set Performance for EfficientNetV2B0.
| Metric | Value |
| Test Accuracy | 0.933 |
| Test Precision | 0.933 |
| Test Recall | 0.933 |
| Test F1 Score | 0.933 |
| Test AUC | 0.990 |
Note: Test set performance metrics for the EfficientNetV2B0 model with Test-Time Augmentation (TTA), evaluated on a test set of 60 images. Metrics include Accuracy, Precision, Recall, F1 Score, and Area Under the Curve (AUC) at the default classification threshold (0.5).
Disclaimer/Publisher’s Note: The statements, opinions and data contained in all publications are solely those of the individual author(s) and contributor(s) and not of MDPI and/or the editor(s). MDPI and/or the editor(s) disclaim responsibility for any injury to people or property resulting from any ideas, methods, instructions or products referred to in the content. |
© 2025 by the authors. Licensee MDPI, Basel, Switzerland. This article is an open access article distributed under the terms and conditions of the Creative Commons Attribution (CC BY) license (http://creativecommons.org/licenses/by/4.0/).
Copyright: This open access article is published under a Creative Commons CC BY 4.0 license, which permit the free download, distribution, and reuse, provided that the author and preprint are cited in any reuse.


