Submitted:
12 August 2025
Posted:
13 August 2025
You are already at the latest version
Abstract
Space weather exerts a significant influence on the Earth’s atmosphere, driving a variety of physical processes, including the production of cosmogenic radionuclides. Among these, 7Be is a naturally occurring radionuclide formed through spallation reactions induced by cosmic-ray showers interacting with atmospheric constituents, primarily oxygen and nitrogen. Over long timescales, the atmospheric concentration of 7Be exhibits a direct correlation with the cosmic-ray flux reaching the Earth and an inverse correlation with solar activity, which modulates this flux via variations of the heliosphere. The large availability of 7Be concentration data, resulting from its use as a natural tracer employed in atmospheric transport studies and in monitoring the fallout from radiological incidents such as the Chernobyl disaster, can also be exploited to investigate the impact of space weather conditions on the terrestrial atmosphere and related geophysical processes. The present study analyzes a long-term dataset of monthly 7Be activity concentrations in air samples collected at ground level since 1987 at the ENEA Casaccia Research Center in Rome, Italy. In particular, the statistical dependency and correlation of this time series with the galactic cosmic ray flux on Earth and solar activity have been investigated. Data from a ground-based neutron monitor and sunspot numbers have been used as proxies for galactic cosmic rays and solar activity, respectively. De-trending techniques were applied to the 7Be monthly time series to extract its low-frequency component associated with cosmic drivers, which is partially hide by high-frequency modulations induced by atmospheric dynamics. For Solar Cycles 22, 23, 24, and partially 25, clear statistical associations were identified, indicating that a substantial portion of the relationship between stratospheric 7Be concentrations and cosmic drivers is captured by linear correlations, while dependence analyses suggest the possible presence of additional non-linear components. These findings support the potential use of 7Be as a quantitative indicator of cosmic ray modulation and, indirectly, of solar activity.
Keywords:
atmospheric 7Be concentration
; cosmic ray flux
; solar activity
; correlation
; anti-correlation
; cosmic drivers
; solar drivers
1. Introduction
Since the pioneering work of Libby [1], who hypothesized the production of radioactive isotopes in the development of atmospheric nuclear showers initiated by galactic cosmic rays, cosmogenic radionuclides have attracted growing scientific interest. Among them, 7Be has been extensively investigated since its first detection in rainwater samples [2], due to its characteristic half-life, emission properties, and distinctive distribution across atmospheric layers. As a natural radioactive tracer, it is a key radionuclide for investigating physical phenomena ranging from atmospheric dynamics [3,4,5,6] to climate change [7,8], but also for monitoring the fallout of potential anthropogenic releases into the atmosphere, as in the case of the Chernobyl disaster in 1986. As a result, since 1987, environmental laboratories worldwide have started the systematic measurement of 7Be concentrations in air (dry deposition) and rain (wet deposition) as part of their routine environmental monitoring programs [9,10]. Consequently, a vast amount of 7Be concentration data has been accumulated over the years, providing valuable resources also for other areas of physics, such as planetary science and space weather research.
Cosmogenic 7Be is present throughout the Earth’s atmosphere with varying concentrations, with maxima occurring in both production and accumulation layers. Although stratospheric production (12–50 km) represents the predominant source of 7Be detected at ground level due to its 53-day half-life, the isotope is also present at higher altitudes. Spectrometric measurements on the outer surfaces of spacecraft returning from low Earth orbit [11], as well as data from balloon-borne experiments [12,13,14], have indicated unexpectedly high 7Be concentrations in the mesosphere (above 50 km) and lower thermosphere (above 85 km), suggesting the existence of additional production mechanisms in these regions. In particular, SEPs (Solar Energetic Particles), whose lower energies compared to Galactic Cosmic Rays (GCRs) cause them to interact predominantly in the upper atmosphere, have been proposed as a possible source of additional 7Be production. By generating particle showers at high altitudes, they may lead to localized modulation of 7Be concentrations, as hypothesized for high-latitude regions [15].
Regarding the lower atmospheric layers, the dominant source of 7Be remains associated to the interaction of higher-energy GCRs, which are able to penetrate into the stratosphere and trigger the spallation reactions responsible for its formation. This well-established mechanism explains the statistical dependence and correlation observed between GCR flux and stratospheric 7Be concentrations. The GCR flux is modulated by the Sun, decreasing during periods of high solar activity because of the expansion of the heliosphere, which results from enhanced solar wind production and a stronger, more irregular interplanetary magnetic field. Scattering and diffusion processes of incoming GCRs within the expanded heliosphere lead to a reduction of their flux in the Solar System and on Earth[16,17]. As a consequence of this mechanism, there is a well-established anti-correlation between GCR flux and solar activity, which in turn translates into a direct anti-correlation between atmospheric 7Be concentrations and solar activity.
In the environmental and atmospheric physics fields the correlation between the stratospheric 7Be and solar activity at different time scale has been investigated by some authors [18,19,20] but only a few have also examined its correlation with the galactic cosmic ray flux on Earth at the same time [21].
This study focuses on the correlation and statistical dependence between the monthly stratospheric 7Be concentration, measured at the Casaccia Research Centre since 1987, and proxy variables of cosmic ray flux and solar activity, retrieved from open science databases. The use of long-term monthly time series provides an appropriate temporal framework for detecting relationships with cosmic drivers and characterizing multi-annual trends. Dedicated de-trending techniques have been applied to filter out signals induced by atmospheric processes, which are typically characterized by shorter-term modulations, allowing for a clearer assessment of the cosmic component. Phenomena such as the seasonal intrusion of stratospheric air into the troposphere (annual modulation) [22,23], the quasi-biennial oscillation (QBO) in stratospheric wind direction with a period of approximately 2.2 years [24], teleconnections with the El Niño–Southern Oscillation occurring on timescales of about 7 years [25], and semi-decadal oscillations [26] are all recognized contributors to 7Be variability, and they can hide the low-frequency cosmic modulation signal. By applying specific analytical techniques to disentangle these Earth-induced effects, this study aims to investigate the underlying correlations and dependencies evaluating whether the stratospheric 7Be concentration can be considered as a proxy, or anti-proxy, for cosmic ray flux and solar activity.
2. Materials and Methods
2.1. Stratospheric 7Be Production, Deposition and Measurement in Casaccia Research Center
The 7Be isotope is produced in the Earth’s atmosphere through interactions of galactic cosmic rays (GCR) predominantly with nitrogen and oxygen nuclei [27]. The production reactions are driven by spallation processes, mainly induced by protons and neutrons generated within the atmospheric shower initiated by a GCR. Examples of such reactions are given below:
where X and Y denote the residual products of the respective spallation reactions. Considering the timescales of atmospheric diffusion processes (typically on the order of several weeks), the production of 7Be can be assumed to occur quasi-simultaneously along the entire extent of the hadronic shower.
According to theoretical models (e.g. [28]), the 7Be maximum production is reached in the stratosphere (), where showers exhibit their maximum development [29]. Formed in ionized states as Be+ or Be2+, beryllium rapidly attaches to sub-micron aerosol particles, whose high specific surface area enhances electrostatic interaction efficiency [30,31]. Once attached, 7Be gradually drifts toward the ground due to gravitational settling and atmospheric dynamics, reaching deposition velocities of few [32]. The separation layer between the stratosphere and the troposphere, the tropopause (approximately at of altitude), acts as an accumulation layer for 7Be during its drifting. The strong reduction in vertical mixing, caused by the sharp gradient in temperature and density in this layer, effectively inhibits the downward transfer of air masses containing beryllium [33]. Approximately 71% of 7Be is removed from the atmosphere by deposition processes, with about 68% of this fraction due to wet deposition (precipitation) and around 3% due to dry deposition (aerosol settling). The remaining 29% is lost through radioactive decay in the atmosphere [34,35]. Due to its characteristic single gamma emission at , 7Be is readily detectable on ground via gamma-ray spectrometry both in rainwater sample (wet deposition) and in aerosol samples collected on filters (dry deposition).
In this study, only dry deposition data are available because the monitoring network in place at the Casaccia Research Center is designed for nuclear emergency preparedness, aiming to detect potential releases from the on-site nuclear facilities and the following plume passage. Air sampling is performed using three high-volume air samplers dislocate in the center, each processing approximately 800 m3 of air per day. Dry deposition of 7Be is measured monthly by performing gamma spectrometry on 90 filters, corresponding to daily samples collected over a month from the 3 sampling points. This method allows the determination of atmospheric 7Be concentrations with sufficient sensitivity.
2.2. Datasets and Data Analysis
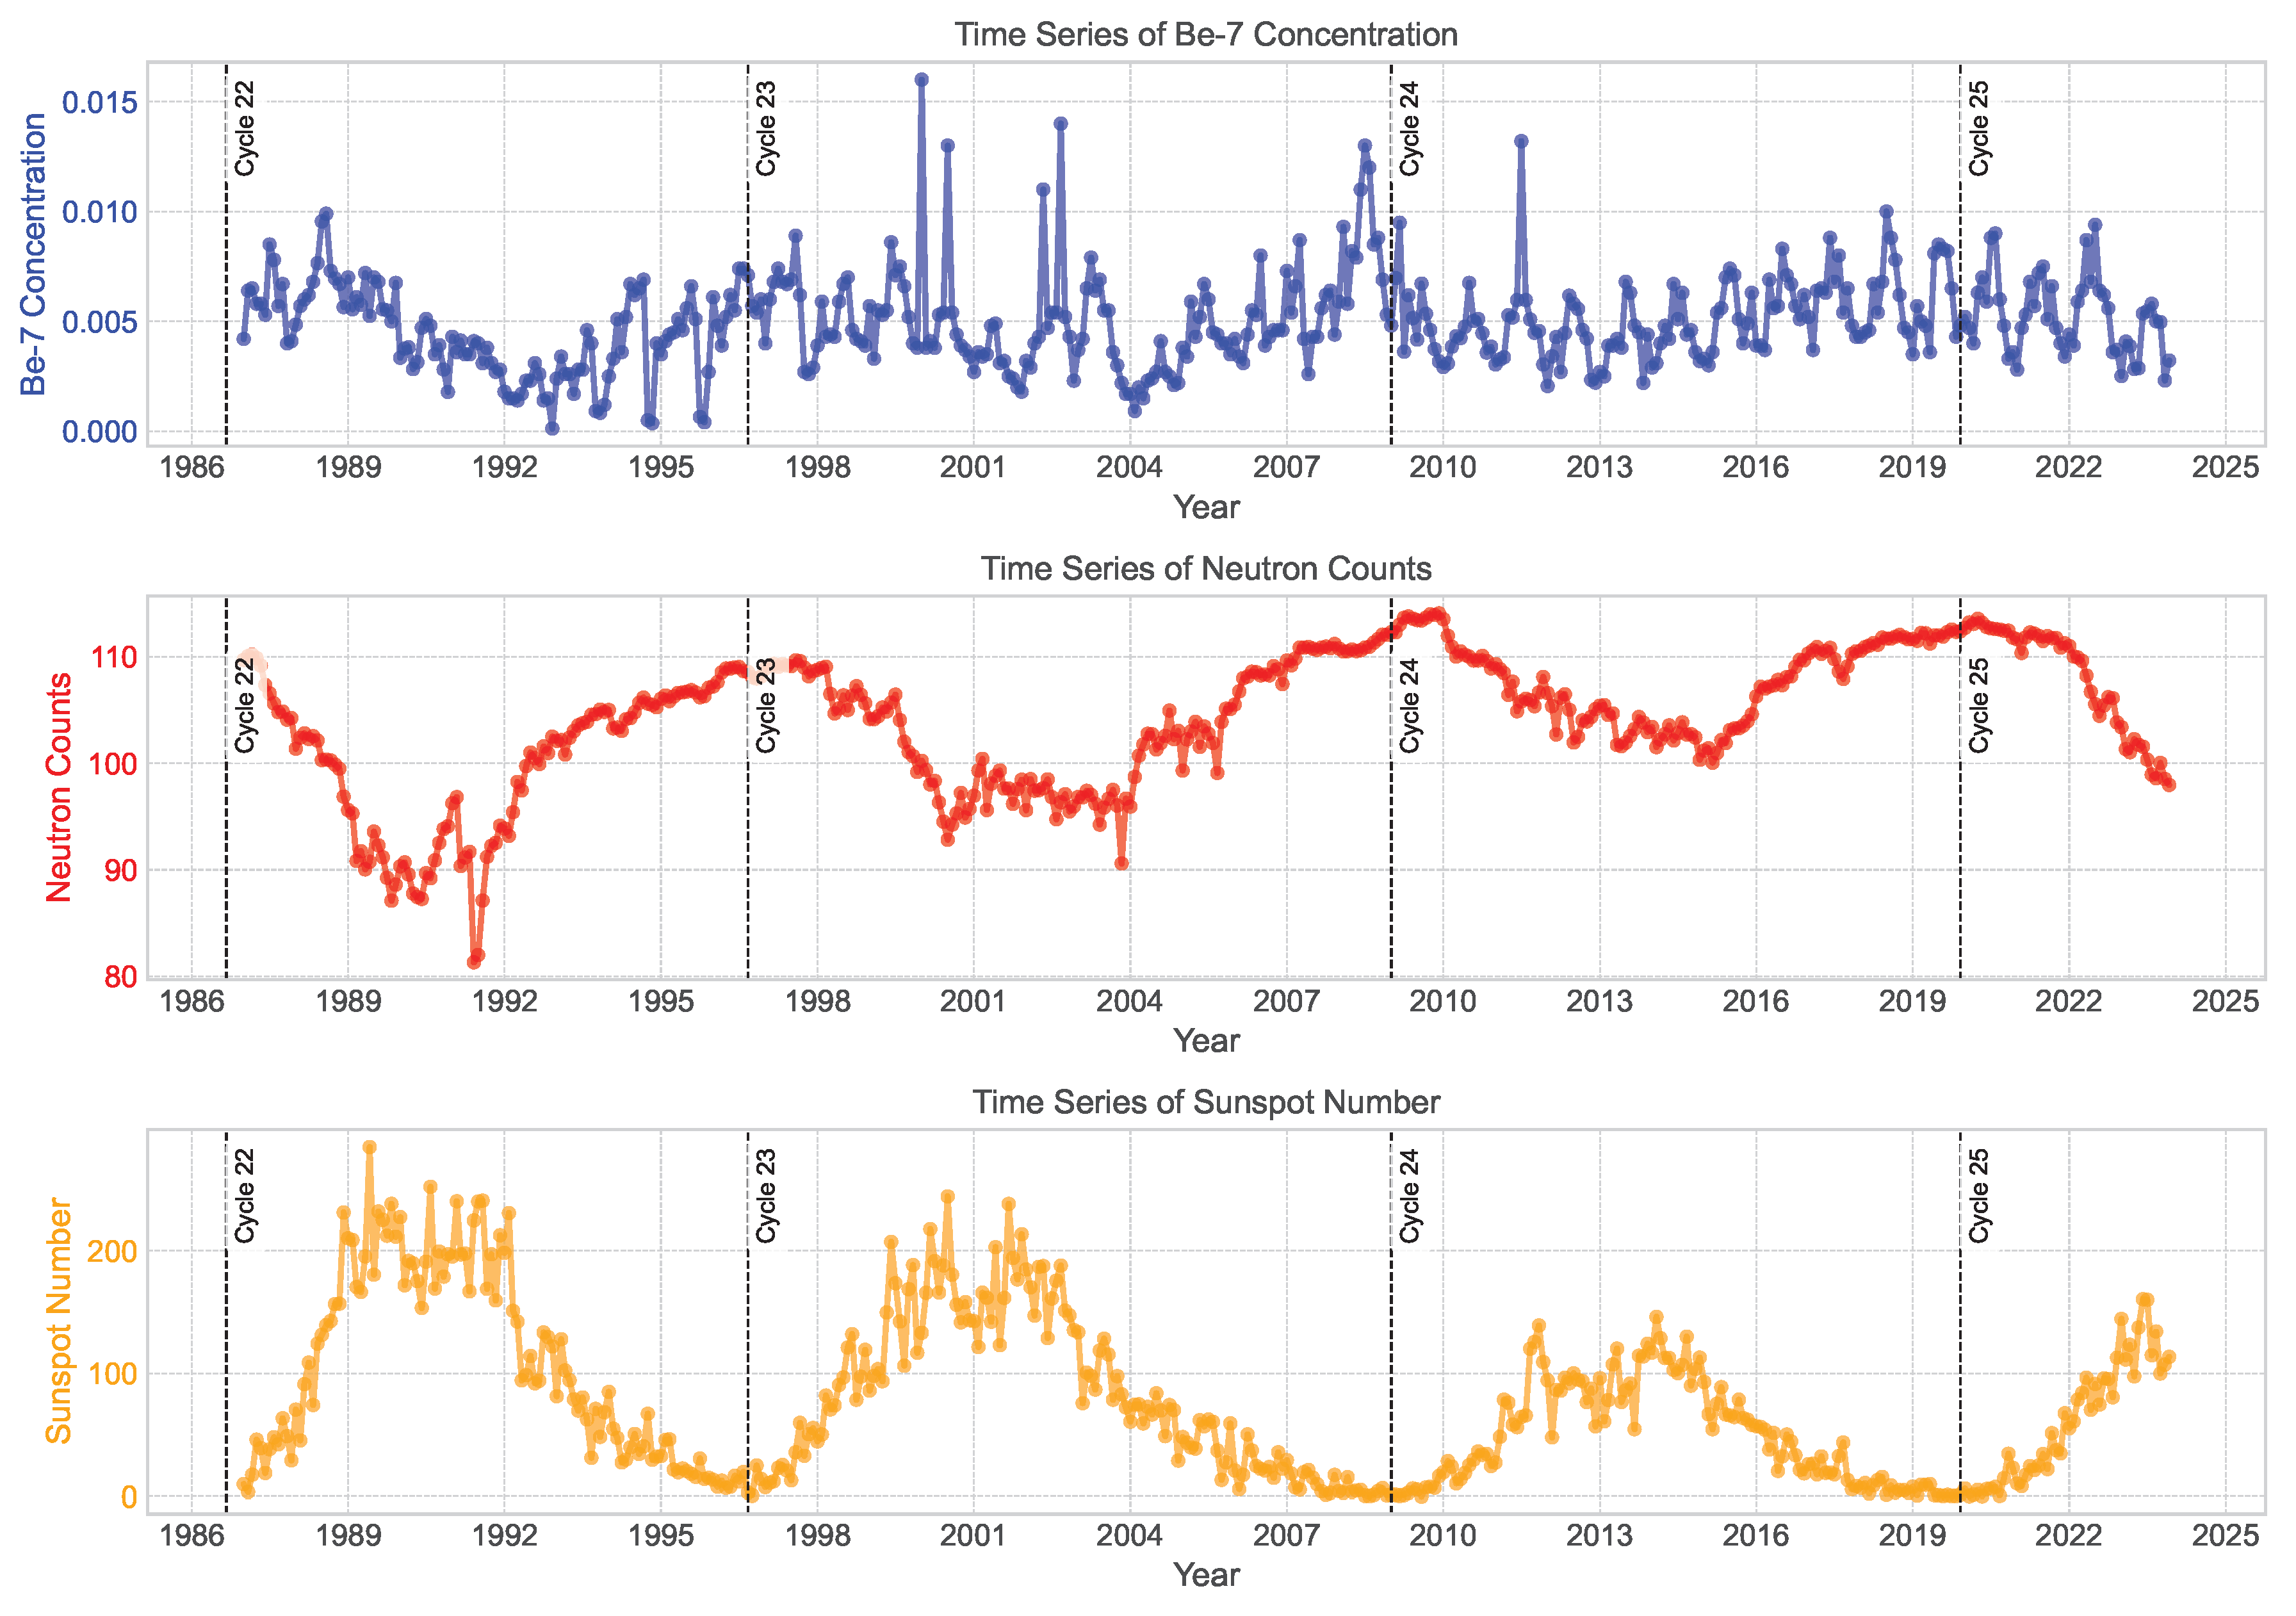
The upper panel of Figure 1 shows the monthly time series of atmospheric 7Be dry deposition, as measured at the Casaccia Research Center.
The variables linked to the space weather conditions around our planet are available through two Open Science databases. In this work, neutron flux data from the Oulu station in Finland, part of the global neutron monitor network [36], are used as a proxy for GCR flux at Earth’s surface. This detector was chosen as the closest to the beryllium-7 sampling site among the stations of the global network, with data available starting from 1987. Neutrons, together with muons, are among the most penetrating particles produced in hadronic showers in the atmosphere and are capable of reaching the ground. Their flux is directly proportional to the incoming GCR flux impacting the Earth.
The sunspot number was used in this study as a proxy for solar activity and the corresponding data were retrieved from the Open Science database provided by [37]. These datasets are shown in the middle and bottom panel of Figure 1.
Figure 1.
Time series of monthly 7Be concentrations measured at Casaccia (top), neutron monitor counts (middle), and sunspot numbers (bottom). The 7Be time-series exhibits a clear higher-frequency modulation driven by stratosphere-troposphere exchange processes and meteorological dynamics. Neutron monitor counts and sunspot numbers are shown as proxies for cosmic ray intensity and solar activity respectively. Vertical dashed lines indicate the boundaries of solar cycles.
2.3. De-Trending Methods
The presence of temporal modulations in the 7Be time series, induced by atmospheric exchange processes with no counterparts in cosmic drivers, necessitates the application of de-trending procedures to reliably quantify the correlation and the dependency between these variables. Their presence can indeed introduce artificial negative contributions in the covariance structure, potentially obscuring the true physical relationships under investigation.
Short-term variability in atmospheric 7Be concentrations primarily reflects dynamic processes occurring in the troposphere and lower stratosphere, including seasonal cycles, quasi-biennial oscillations (QBO), stratosphere-troposphere exchange events, large-scale circulation patterns, and phenomena such as ENSO (El Niño–Southern Oscillation). These terrestrial drivers impart oscillations on timescales ranging from several months to a few years, superimposed upon longer-term variations controlled by solar activity and cosmic ray modulation. To achieve this separation of timescales, three distinct de-trending techniques were implemented and systematically compared in this study, aiming to isolate the long-term variability of atmospheric 7Be concentrations from shorter-term meteorological and seasonal perturbations.
The selection of de-trending parameters for each applied method is therefore constrained by the need to suppress these high-frequency, non-cosmogenic fluctuations while preserving the low-frequency signal components associated with solar and heliospheric processes. Accordingly, parameter choices were guided by the typical temporal scales of the known atmospheric oscillations, with the objective of ensuring that the extracted trends accurately reflect variability on timescales consistent with cosmic-ray-related influences.
The first method consists of applying a running average with a fixed time window. This classical approach, widely adopted in geophysical and climate sciences, is used to suppress high-frequency fluctuations and emphasize low-frequency trends [38,39]. In this work, the running average was computed using a centered window, so that each value represents the mean of observations symmetrically distributed around the point in time. This ensures that the smoothed series remains aligned in phase with the original signal, avoiding the temporal shifts that occur when the averaging is performed only over past values. Additionally, near the boundaries of the time series, where a full window cannot be accommodated, the filter adapts by computing the average over the available data points, even if fewer than the nominal window size. This prevents gaps at the start and end of the series and maintains the continuity of the smoothed trend. Overall, this approach preserves the low-frequency component of the series while effectively reducing short-term variability, making it suitable for highlighting temporal patterns associated with atmospheric or solar influences on 7Be concentrations.
Secondly, a Seasonal-Trend decomposition based on Loess (STL) was applied [40]. STL is a decomposition technique that separates a time series into trend, seasonal, and remainder components. The method employs locally weighted regression (Loess) to iteratively estimate the trend and seasonal components. Although the seasonal period must be specified in advance, the use of local regression allows the method to accommodate gradual variations in both the amplitude and phase of the seasonal cycle, as well as long-term modulations in the trend component. Finally, a low-frequency Fourier reconstruction was implemented by summing the first n terms of the Fourier series expansion of the 7Be time series [41]. The Fourier series expansion preserves the full temporal resolution of the data, avoiding the loss of detail associated with smoothing techniques. In the present work, these de-trending methods were applied exclusively to the 7Be time series: the neutron counts and sunspot number series were analyzed in their original form, as they are considered physical drivers of 7Be concentration and already represent temporally smoothed indices of cosmic ray flux and solar activity, respectively. This approach avoids the introduction of mathematical artifacts and preserves the physical meaning of the time-series.
2.4. Advanced Measures of Statistical Dependence
The investigation of correlations among variables characterized by (quasi-)sinusoidal periodicity, phase shifts, and inherent temporal lags, such as the detrended time series of atmospheric 7Be concentrations, sunspot numbers, and ground-level neutron fluxes, requires careful methodological consideration. These properties suggest that analyses confined to linear and monotonic associations, as measured by the Pearson coefficient (r), may be insufficient to capture the complexity of interactions. Therefore, employing additional statistical metrics capable of detecting complex and nonlinear dependencies is essential for a robust and comprehensive assessment of the relationships among these variables.
To address these challenges, a suite of advanced dependence measures has been employed, including Spearman’s () and Kendall’s () rank correlation coefficients for capturing monotonic yet potentially nonlinear associations; Distance Correlation (), which can detect any type of dependence irrespective of functional form; Mutual Information (I), quantifying shared information content between variables and the Maximal Information Coefficient (MIC), designed to identify a wide range of linear and nonlinear relationships with sensitivity to various dependency structures. Collectively, these methods enable a more comprehensive and robust assessment of statistical associations, offering critical insights into the complex dynamics underlying environmental and cosmic phenomena. For the following analyses, we assume that the two time series, whose correlation and dependency is to be investigated, can be expressed as vectors of observations:
where n denotes the number of observations, and and represent the values of the variables X and Y at time indices i and j, respectively. These generic representations will be used consistently throughout the discussion of the different statistical dependence measures.
2.4.1. Correlation Metrics
Several correlation metrics can be employed to assess the relationship between two variables. The simplest and most widely used is Pearson’s correlation coefficient, which measures the strength and direction of a linear association. However, it is limited to detecting linear relationships and may fail to capture more complex or nonlinear dependencies. To detect monotonic relationships that may not be strictly linear, rank-based correlation coefficients are often used. Unlike Pearson’s r, these metrics are sensitive to ordinal associations and do not assume a specific functional form for the relationship between variables. Two widely used estimators, Spearman’s [42] and Kendall’s [43,44], are employed to quantify the degree of monotonic dependence. Details regarding these correlation coefficient are given in the following:
- Pearson’s correlation coefficient r - the metric measures the strength and direction of a linear relationship between two variables. It is defined as:where denotes the covariance between X and Y, and and are the standard deviations of X and Y, respectively. The covariance is given by:where and are the sample means of X and Y respectively. The coefficient r ranges from (perfect negative linear relationship) to (perfect positive linear relationship), with indicating no linear association.
- Spearman’s rank correlation coefficient - the metric measures the strength and direction of a monotonic relationship by computing the Pearson correlation between the ranked values of the variables:where denotes the covariance and the standard deviation of the ranked variables. In this context, ranking transforms the original vector of values into a vector of ranks, where each rank indicates the position of a value in the ordered dataset. The coefficient ranges from (perfect decreasing monotonic relationship) to (perfect increasing monotonic relationship), with indicating no monotonic association. Spearman’s is particularly effective in detecting relationships that are nonlinear but still consistently increasing or decreasing.
- Kendall’s rank correlation coefficient - the metric is based on counting the number of concordant and discordant pairs among all possible pairs of observations:where is the number of concordant pairs and is the number of discordant pairs, with n representing the sample size. Two observations and are considered concordant if the ranks of both variables increase or decrease together (i.e., and , or and ). They are discordant if one variable increases while the other decreases (e.g., but ). The coefficient also ranges from (complete inversion of ranks) to (perfect agreement in rank order), with corresponding to no association.
While all three measures capture associations between variables, they differ in their sensitivity and interpretation. Pearson’s r assesses the strength and direction of a linear relationship and assumes normally distributed data. In contrast, Spearman’s and Kendall’s are rank-based measures that capture monotonic relationships without requiring linearity. Kendall’s tends to be more robust for small sample sizes and provides a probabilistic interpretation, representing the difference between the probability that pairs of observations are in the same order versus different orders. Spearman’s can be slightly more sensitive to variations in the strength of monotonic associations but may be more influenced by extreme values in the ranks. Together, these correlation coefficients offer complementary insights into both linear and non-linear associations in the data. For all three correlation coefficients, significance was assessed through classical statistical tests: the t-distribution for Pearson’s r [39], and asymptotic normal approximations for Spearman’s and Kendall’s [44,45].
2.4.2. Dependence Metrics
To quantify statistical dependence beyond monotonic or linear structures, three complementary approaches were employed: distance correlation [46,47], mutual information [48], and the maximal information coefficient [49] . These metrics are capable of detecting complex nonlinear or non-functional associations between variables and are suitable for identifying dependencies that traditional correlation measures may overlook. Details of these approaches are provided in the following:
-
Distance correlation - this metric measures the statistical dependence between two variables or vectors, capturing both linear and nonlinear relationships. Unlike Pearson’s correlation, distance correlation is equal to zero if and only if the variables are statistically independent, making it a true test of independence. Mathematically, distance correlation is defined as:where denotes the distance covariance between X and Y. The distance covariance quantifies how much the pairwise distances between observations in X are associated with the pairwise distances in Y. To compute it, the first step is to calculate the pairwise Euclidean distance matrices:These matrices are then transformed through a centering process, where the row means () and column means () are subtracted to the initial value and the grand mean () is added back, yielding the doubly centered matrices:and similarly for . The squared distance covariance is computed as:By normalizing the distance covariance with the distance variances of X and Y, the distance correlation coefficient , defined in eq. 8, is obtained. The coefficient ranges from 0 (independence) to 1 (perfect dependence) and can detect complex relationships that are not necessarily linear or monotonic. This makes distance correlation a valuable tool for exploring dependencies in environmental and geophysical data.
- Mutual information I - the metric quantifies the amount of information shared between two variables and is rooted in information theory. It is defined as:where is the joint probability distribution and , are the marginal distributions of X and Y, respectively. The index is always non-negative and equals zero if and only if X and Y are independent. Unlike correlation coefficients, mutual information has no fixed upper bound, and its magnitude depends on the entropy of the individual variables.
- Maximal Information Coefficient MIC - the metric allows to capture complex and potentially nonlinear relationships between time series. This method belongs to the family of maximal information-based nonparametric exploration (MINE) statistics and is designed to detect a wide range of association types, regardless of their functional form or strength. Conceptually, MIC measures how well one variable can be used to predict another by exploring how data points distribute over different grid partitions of the scatter plot. The algorithm divides the plane defined by variables X and Y into multiple grids of varying resolutions (up to a maximum resolution determined by the sample size). For each grid, it computes the mutual information—a measure quantifying how much knowing one variable reduces uncertainty about the other. The MIC is then defined as the highest normalized mutual information observed across all tested grids, formally expressed as:where denotes the maximum mutual information achievable with a grid of cells, and limits the maximum grid resolution based on the sample size n. This normalization ensures that MIC scores remain comparable across different grid sizes. A key advantage of MIC is its capacity to identify not only linear and monotonic relationships but also more complex patterns—such as periodic, exponential, or piecewise associations that traditional measures like Pearson or Spearman correlations might fail to detect. MIC values range between 0 and 1, where values close to 1 indicate strong dependence (irrespective of shape), and values near 0 suggest little or no association.
These measures of statistical dependence expand the analytical framework beyond linear or monotonic relationships, allowing the detection of complex, non-linear, and non-functional associations between variables. By identifying dependencies that traditional correlation coefficients might overlook, they offer a more comprehensive characterization of the data structure and are crucial for investigating subtle interactions in environmental and space-weather studies.
3. Results
3.1. Correlation on the Raw Data
The correlation and statistical dependence between 7Be, neutron flux, and sunspot number were initially evaluated using raw, non-detrended data. This preliminary analysis was conducted to establish a baseline reference for comparison with the results obtained after applying various de-trending techniques. The left and middle panels of Figure 2 show that the association between 7Be concentration and both neutron flux and sunspot number is modest across all metrics. In contrast, the right panel reveals a strong negative correlation between neutron flux and sunspot number, indicating that these series are closely anti-correlated and reflect the same solar modulation signal. This strong interdependence supports the use of both neutron counts and sunspot number as external drivers of 7Be variability, even without de-trending.
Metrics index and related p-values are summarized in Table 1.
The analysis of raw data indicates that the relationship between atmospheric 7Be concentration and both solar and cosmic proxies is relatively weak and method-dependent, in contrast to the strong and consistent anticorrelation observed between neutron counts and sunspot number. This suggests that 7Be does not respond to solar and cosmic drivers as directly as neutron monitors, but rather integrates additional atmospheric processes that may obscure or modulate the primary signal. These findings highlight the necessity of applying appropriate de-trending techniques in order to isolate the intrinsic, large-scale modulation of 7Be by solar and cosmic factors, which may otherwise be masked by dominant seasonal patterns and atmospheric variability.
3.2. De-Trending Methods Results
The main parameters of each de-trending method were selected based on their effectiveness in isolating low-frequency components while minimizing shorter-term atmospheric variability. The specific configurations adopted are summarized below:
- Running Average: A window length of 70 months was chosen to effectively suppress high-frequency atmospheric oscillations, including the annual cycle ( 12 months), the quasi-biennial oscillation ( 2.2 years), and other meteorological variations such as ENSO ( 7 years), while preserving lower-frequency components linked to solar activity, particularly the 11-year solar cycle. This window was identified as an optimal compromise, ensuring that the extracted trend predominantly reflects variability of cosmic origin with minimal contamination from terrestrial atmospheric dynamics.
- Fourier Series: The trend component of the 7Be time series was reconstructed using the first five Fourier harmonics, aiming to isolate variability on multi-annual to decadal timescales. This spectral resolution was selected to capture the dominant long-term modulation associated with the 11-year solar cycle, while effectively filtering out higher-frequency fluctuations driven by meteorological and seasonal processes. The resulting low-frequency component defines the primary large-scale variability inherent in the 7Be record.
- STL Decomposition: The STL method was applied with a seasonal period of 36 months to suppress intra-annual and inter-annual fluctuations driven by meteorological processes and stratosphere-troposphere dynamics. This configuration isolates the low-frequency trend component of the 7Be time series, preserving variability potentially linked to solar-cycle modulation, while reducing the influence of shorter-term atmospheric oscillations.
The results obtained are shown in Figure 3.
The consistency of the results obtained from the three de-trending methods was assessed by calculating the periods of the resulting carrier waves. To estimate systematic uncertainties, the key parameters of each method were varied within a plausible range: ±12 months for the running average window, ±2 harmonics for the Fourier reconstruction, and ±12 months for the STL seasonal period. Results are shown in Table 2.
Considering the associated uncertainties, the periods obtained with the three de-trending methods are consistent with each other and compatible with the typical duration of the solar cycle, which drives the main modulation on long timescales.
3.3. Correlation and Dependence Metrics Results
The correlation and dependence among the investigated time series were assessed using the metrics described in sub-section 2.4. The results of all dependence measures and the associated p-values computed for the different variable pairs and de-trending methods are summarized in Table 3. The pairwise analysis includes also the “Neutron vs Sunspot” relationship as a benchmark, given its well-known anti-correlation, allowing all metrics to be compared against an established physical connection.
Figure 4 reports the numerical results obtained after applying the three de-trending approaches to the 7Be concentration data, namely running average, Fourier series reconstruction, and STL decomposition. The plots allow comparison of the statistical relationships between 7Be and both neutron counts and sunspot number under different assumptions of trend extraction.
4. Discussion
The analysis of the raw time-series data (see Table 1), performed to establish reference values in the present study, reveals only weak statistical dependencies and low correlation coefficients between the atmospheric 7Be concentration and both neutron counts, a proxy variable for the cosmic ray flux reaching Earth, and the sunspot number, a proxy for solar activity. Almost all the dependency and correlation indices show modest values, although with a high level of statistical significance. Conversely, the same analysis performed on the neutron counts and sunspot number time series consistently shows the well-known anti-correlation between these two variables, with high absolute values across all correlation and dependency metrics. These findings support the conservative hypothesis adopted in this work to avoid de-trending the neutron count and sunspot number time series, as they already capture almost all the information regarding the two cosmic phenomena of interest. In the 7Be monthly concentration time-series, the presence of high-frequency modulations (see Figure 1) due to atmospheric dynamics, substantially hides the low-frequency modulations which carry the information related to the cosmic drivers phenomena. For this reason, three de-trending techniques have been applied to the 7Be signal to extract only the low frequency part. An assessment on the obtained low-frequency carrier signal has been performed evaluating the period of the sinusoidal patterns, finding values consistent with the 11 years period of the Solar cycle (see Table 2). The impact of de-trending on the considered metrics is shown in Figure 5.
The analysis of the de-trended 7Be series highlights a significant strengthening of the statistical dependence and correlation with both neutron counts and sunspot number, compared to the raw data results. Although all three de-trending techniques adopted (Fourier carrier, running average, and STL decomposition) lead to similar outcomes, we focus the discussion on the results obtained through the running average method, as this approach systematically yields the highest correlation and dependence coefficients. Focusing first on the relationship between 7Be and neutron counts (GCR proxy), dependence metrics after de-trending reach 0.69 for Distance Correlation (+48%), 0.93 for Mutual Information (+202%), and 0.60 for MIC (+140%), highlighting a strong shared low-frequency variability linked to cosmic ray modulation. Correlation indices likewise increase, attaining 0.65 for Pearson (+75%), 0.75 for Spearman (+51%), and 0.55 for Kendall (+61%), indicating a pronounced linear and monotonic association once high-frequency atmospheric fluctuations are removed. Overall, the results indicate that the low-frequency component of the 7Be time series exhibits substantial statistical association with neutron counts, consistent with shared variability driven by cosmic ray modulation. The increase observed in dependence metrics suggests the presence of shared information potentially extending beyond linear associations, while higher Spearman’s and Kendall’s coefficients point to strengthened monotonic relationships. Furthermore, the rise in Pearson’s correlation implies that a significant part of this dependency may be described through linear models, although statistical evidence leaves open the possibility of additional non-linear contributions, underscoring the mixed nature, linear and possibly non-linear, of the connection between 7Be and cosmic ray flux.
For the relationship between 7Be and sunspot number (solar activity proxy), dependence metrics after de-trending reach 0.51 for Distance Correlation (+56%), 0.68 for Mutual Information (+224%), and 0.39 for MIC (+137%), indicating moderate shared variability mediated by cosmic ray modulation. Correlation indices show also an absolute value increase, attaining -0.48 for Pearson (+54%), -0.58 for Spearman (+49%), and -0.40 for Kendall (+51%), consistent with a strengthened inverse monotonic relationship, though less pronounced than for neutron counts. These results suggest that, while the connection between 7Be and solar activity remains weaker than for neutron counts, the low-frequency component of 7Be still reflects a measurable imprint of solar modulation. This is consistent with the physical mechanism whereby solar activity does not directly regulate the stratospheric 7Be production, but rather modulates the intensity of galactic cosmic rays, which constitute the primary source of 7Be through spallation processes in stratosphere. The increased dependence metrics indicate potential non-linear associations, while enhanced correlation indices point to a clearer monotonic and partially linear relationship.
5. Conclusions
In this study, we investigated the correlation between 7Be concentrations, measured at the ENEA Casaccia site from 1987 to 2024, and proxies of cosmic ray flux and solar activity. The application of de-trending techniques to the atmospheric 7Be time series significantly improves the detection of its statistical associations with cosmic drivers such as GCR flux and solar activity. By removing high-frequency atmospheric variability, the analysis reveals a low-frequency signal in 7Be concentrations that shows stronger dependence and correlation metrics, particularly with neutron counts (GCR proxy), reflecting the shared influence of galactic cosmic ray flux. Although the associations with solar activity are comparatively weaker, they remain significant and align with the indirect role of the Sun in modulating cosmic ray intensities, which are the direct drivers for the 7Be production through spallation processes in the stratosphere.
The study employed a comprehensive statistical framework, combining classical correlation coefficients (Pearson, Spearman, Kendall) with dependence metrics such as Distance Correlation, Mutual Information, and the Maximal Information Coefficient (MIC), enabling the detection of both linear and non-linear associations as well as shared information content.
These results highlight the mixed linear and potentially non-linear nature of the connections between 7Be and cosmic phenomena, underscoring the importance of employing advanced signal processing techniques on the 7Be time series. From a practical standpoint, this work supports the potential use of atmospheric 7Be as a valuable proxy for monitoring long-term variations in galactic cosmic ray flux and, to a lesser extent, for inferring aspects of solar activity. However, careful consideration must be given to the choice of de-trending method, because the 7Be concentration is subjected to complex atmospheric transport and deposition processes.
Finally, given the extensive global network of atmospheric 7Be monitoring stations and the large datasets accumulated over decades, 7Be records represent a promising resource for reconstructing past trends in galactic cosmic ray flux on Earth and may potentially contain valuable information related to solar activity variations.
Author Contributions
For research articles with several authors, a short paragraph specifying their individual contributions must be provided. The following statements should be used “Conceptualization, A.R. and P.R.; methodology, A.R.; software, A.R.; validation, I.V., E.B., L.S.; formal analysis, A.R. and P.R.; resources, I.V.; data acquisition G.A., M.A., N.d.M., F.Z. G.l.N.; writing—original draft preparation, A.R. and L.C.; writing—review and editing, A.R. and L.C.; All authors have read and agreed to the published version of the manuscript.”.
Funding
This research received no external funding.
Data Availability Statement
The 7Be concentration data used in this study are available from the corresponding author upon reasonable request. The datasets related to cosmic ray flux (neutron counts) and solar activity (sunspot numbers) are publicly accessible through the open science repositories cited in the references.
Acknowledgments
The authors would like to thank all the ENEA colleagues who, over the years, have contributed to the collection of the 7Be data used in this study. Their long-standing efforts provided the foundation for this work.
Conflicts of Interest
The authors declare no conflicts of interest.
Abbreviations
The following abbreviations are used in this manuscript:
| GCR | Galactic Cosmic Rays |
| SEP | Solar Energetic Particles |
| ENSO | El Niño–Southern Oscillation |
| QBO | Quasi-Biennial Oscillation |
| STL | Seasonal-Trend decomposition using Loess |
| MIC | Maximal Information Coefficient |
| MI | Mutual Information |
References
- Libby, W. F. Atmospheric Helium Three and Radiocarbon from Cosmic Radiation. Phys. Rev. 1946, 69, 671. [CrossRef]
- Arnold, J. R.; Al-Salih, H. A. Beryllium-7 produced by cosmic rays. Science 1955, 121, 451. [CrossRef]
- Young, J. A.; Silker, W. B. Aerosol deposition velocities on the Pacific and Atlantic Oceans calculated from 7Be measurements. Earth Planet. Sci. Lett. 1980, 50, 92–104. [CrossRef]
- Sanak, J.; Lambert, G.; Ardouin, B. Measurement of stratosphere-to-troposphere exchange in Antarctica by using short-lived cosmonuclides. Tellus B 1985, 37, 109–115. Available online. [CrossRef]
- Mohan, M. P.; D’Souza, R. S.; Nayak, S. R.; Kamath, S. S.; Shetty, T.; Kumara, K. S.; Mayya, Y. S.; Karunakara, N. Influence of rainfall on atmospheric deposition fluxes of 7Be and 210Pb in Mangaluru (Mangalore) at the Southwest Coast of India. Atmos. Environ. 2019, 202, 281–295. Available online: https://www.elsevier.com/locate/atmosenv.
- Liu, H.; Considine, D.B.; Horowitz, L.W.; Crawford, J.H.; Rodriguez, J.M.; Strahan, S.E.; Damon, M.R.; Steenrod, S.D.; Xu, X.; Kouatchou, J.; Carouge, C.; Yantosca, R.M. Using beryllium-7 to assess cross-tropopause transport in global models. Atmos. Chem. Phys. 2016, 16, 4641–4659. Available online. [CrossRef]
- Liu, J.; Starovoitova, V. N.; Wells, D. P. Long-term variations in the surface air 7Be concentration and climatic changes. J. Environ. Radioact. 2013, 116, 42–47. Available online: https://www.elsevier.com/locate/jenvrad. [CrossRef]
- Batrakov, G. F.; Kremenchutsky, D. A.; Kholoptsev, A. V. El Nino / Southern Oscillation and beryllium-7 concentration in the atmospheric boundary layer. Eur. Res. 2013, 45, [pages unknown].
- Papastefanou, C.; Ioannidou, A.; Stoulos, S.; Manolopoulou, M. Atmospheric deposition of cosmogenic 7Be and 137Cs from fallout of the Chernobyl accident. Sci. Total Environ. 1995, 170, 151–156. [CrossRef]
- Todorovic, D.; Popovic, D.; Djuric, G. Concentration measurements of 7Be and 137Cs in ground level air in the Belgrade city area. Environ. Int. 1999, 25, 59–66. https://doi.org/10.1016/S0160-4120(98)00099-3.
- Phillips, G. W.; King, S. E.; August, R. A.; Ritter, J. C.; Cutchin, J. H.; Haskins, P. S.; McKisson, J. E.; Ely, D. W.; Weisenberger, A. G.; Piercey, R. B.; Dyble, T. Discovery of Be-7 Accretion in Low Earth Orbit. In Proceedings of the 14th Annual AAS Guidance and Control Conference, Keystone, Colorado, USA, February 1991; DTIC Report AD-A236 614. Available online: https://apps.dtic.mil/sti/pdfs/ADA236614.pdf.
- Wilson, J. K.; Rees, M. H.; Allen, L. V. Beryllium-7 concentrations in the mesosphere-lower thermosphere measured by high-altitude balloon flights. J. Geophys. Res. Atmos. 1993, 98, 20479–20484. Available online: https://doi.org/10.1029/93JD02253.
- Mewaldt, R. A.; Stone, E. C.; Tylka, A. J. Enhanced beryllium-7 concentrations in the upper atmosphere following solar proton events. Geophys. Res. Lett. 2001, 28, 2585–2588. Available online. [CrossRef]
- Chen, D. L.; Zell, S. E.; Paulikas, G. A. Observations of cosmogenic beryllium-7 in the mesosphere and lower thermosphere. J. Atmos. Solar-Terr. Phys. 1993, 55, 707–714. Available online: https://doi.org/10.1016/0021-9169(93)90003-8.
- Golubenko, K.; Rozanov, E.; Kovaltsov, G.; Leppänen, A.-P.; Sukhodolov, T.; Usoskin, I. Chemistry-climate model SOCOL-AERv2-BEv1 with the cosmogenic Beryllium-7 isotope cycle. Geosci. Model Dev. Discuss. 2021. Available online. [CrossRef]
- Nelson, G. A. Space Radiation and Human Exposures, A Primer. Radiat. Res. 2016, 185, 349–358. Available online. [CrossRef]
- Rizzo, A.; Borra, E. M.; Ciciani, L.; Di Fino, L.; Romoli, G.; Santi Amantini, G.; Sperandio, L.; Vilardi, I.; Narici, L. Foundations of radiological protection in space: the integrated multidisciplinary approach for next manned missions in deep space. Eur. Phys. J. Plus 2023, 138, Article 1001. Available online. [CrossRef]
- Papastefanou, C.; Ioannidou, A. Beryllium-7 and solar activity. Appl. Radiat. Isot. 2004, 61, 1493–1495. Available online. [CrossRef]
- Rajacic, M. M.; Todorovic, D. J.; Krneta Nikolic, J. D.; Puzovic, J. M. The impact of the Solar magnetic field on 7Be activity concentration in aerosols. Appl. Radiat. Isot. 2017, 125, 27–29. Available online. [CrossRef]
- Aldahan, A.; Hedfors, J.; Possnert, G.; Kulan, A.; Berggren, A.-M.; Söderström, C. Atmospheric impact on beryllium isotopes as solar activity proxy. Geophys. Res. Lett. 2008, 35, L21812. Available online. [CrossRef]
- Kremenchutskii, D. A.; Konovalov, S. K. Beryllium-7 and its variability in the near-surface atmosphere of Crimea, the Black Sea region. Atmos. Pollut. Res. 2022, 13, 101406. Available online. [CrossRef]
- Brattich, E.; Liu, H.; Tositti, L.; Considine, D. B.; Crawford, J. H. Processes controlling the seasonal variations in 210Pb and 7Be at the Mt. Cimone WMO-GAW global station, Italy: a model analysis. Atmos. Chem. Phys. 2017, 17, 1061–1080. Available online. [CrossRef]
- Kulan, A.; Aldahan, A.; Possnert, G.; Vintersved, I. Distribution of 7Be in surface air of Europe. Atmos. Environ. 2006, 40, 3855–3868. Available online. [CrossRef]
- Baldwin, M. P.; Gray, L. J.; Dunkerton, T. J.; Hamilton, K.; Haynes, P. H.; Randel, W. J.; Holton, J. R.; Alexander, M. J.; Hirota, I.; Horinouchi, T.; Jones, D. B. A.; Kinnersley, J. S.; Marquardt, C.; Sato, K.; Takahashi, M. The quasi-biennial oscillation. Rev. Geophys. 2001, 39, 179–229. Available online. [CrossRef]
- Casselman, J. W.; Lübbecke, J. F.; Bayr, T.; Huo, W.; Wahl, S.; Domeisen, D. I. V. The teleconnection of extreme El Niño–Southern Oscillation (ENSO) events to the tropical North Atlantic in coupled climate models. Weather Clim. Dyn. 2023, 4, 471–487. Available online. [CrossRef]
- Yu, N.; Chen, G.; Ray, J.; Chen, W.; Chao, N. Semi-decadal and decadal signals in atmospheric excitation of length-of-day. Earth Space Sci. 2019, 6, 1205–1216. Available online. [CrossRef]
- Lal, D.; Peters, B. Cosmic Ray Produced Radioactivity on the Earth. In Kosmische Strahlung II / Cosmic Rays II; Sitte, K., Ed.; Springer: Berlin, Heidelberg, 1967; Vol. 9, pp. 1–50.
- Talpos, S.; Cuculeanu, V. A Study of the Vertical Diffusion of 7Be in the Atmosphere. J. Environ. Radioact. 1997, 36, 93–106. [CrossRef]
- Sitte, K.; Stierwalt, D. L.; Kofsky, I. L. Development of Air Showers in the Atmosphere. Phys. Rev. 1954, 94, 988–993. Available online: https://link.aps.org/doi/10.1103/PhysRev.94.988. [CrossRef]
- Papastefanou, C.; Ioannidou, A. Beryllium-7 Aerosols in Ambient Air. Environ. Int. 1996, 22, S125–S130.
- Zheng, M.; Liu, H.; Adolphi, F.; Muscheler, R.; Lu, Z.; Wu, M.; Prisle, N. L. Simulations of 7Be and 10Be with the GEOS-Chem global model v14.0.2 using state-of-the-art production rates. Geosci. Model Dev. 2023, 16, 7037–7057. Available online. [CrossRef]
- Zhang, F.; Wang, J.; Baskaran, M.; Zhong, Q.; Wang, Y.; Paatero, J.; Du, J. A global dataset of atmospheric 7Be and 210Pb measurements: annual air concentration and depositional flux. Earth Syst. Sci. Data 2021, 13, 2963–2994. Available online. [CrossRef]
- Yoshimori, M. Beryllium 7 radionuclide as a tracer of vertical air mass transport in the troposphere. Adv. Space Res. 2005, 36, 828–832. Available online: https://www.sciencedirect.com/science/article/abs/pii/S0273117705004356.
- Koch, D. M.; Jacob, D. J.; Graustein, W. C. Vertical transport of tropospheric aerosols as indicated by 7Be and 210Pb in a chemical tracer model. J. Geophys. Res. Atmos. 1996, 101, 18651–18666. Available online. [CrossRef]
- Długosz-Lisiecka, M.; Bem, H. Seasonal fluctuation of activity size distribution of 7Be, 210Pb, and 210Po radionuclides in urban aerosols. J. Aerosol Sci. 2020, 144, 105544. Available online. [CrossRef]
- NMDB Event Search Tool (NEST). Available online: https://www.nmdb.eu/nest/ (accessed on 25 October 2024).
- WDC-SILSO. Royal Observatory of Belgium, Brussels. Available online: https://www.sidc.be/SILSO/datafiles (accessed on 25 October 2024).
- von Storch, H.; Zwiers, F. W. Statistical Analysis in Climate Research; Cambridge University Press: Cambridge, UK, 1999.
- Wilks, D. S. Statistical Methods in the Atmospheric Sciences, 3rd ed.; Academic Press: San Diego, USA, 2011.
- Cleveland, R. B.; Cleveland, W. S.; McRae, J. E.; Terpenning, I. STL: A Seasonal-Trend Decomposition Procedure Based on Loess. J. Off. Stat. 1990, 6, 3–73.
- Bloomfield, P. Fourier Analysis of Time Series: An Introduction; John Wiley & Sons: Hoboken, NJ, USA, 2004.
- Spearman, C. The Proof and Measurement of Association Between Two Things. Am. J. Psychol. 1904, 15, 72–101.
- Kendall, M. G. A New Measure of Rank Correlation. Biometrika 1938, 30, 81–93. [CrossRef]
- Conover, W. J. Practical Nonparametric Statistics, 3rd ed.; John Wiley & Sons: New York, USA, 1999.
- Kendall, M.; Gibbons, J. D. Rank Correlation Methods, 5th ed.; Edward Arnold: London, UK, 1990.
- Székely, G.J.; Rizzo, M.L.; Bakirov, N.K. Measuring and testing dependence by correlation of distances. Ann. Stat. 2007, 35, 2769–2794. Available online. [CrossRef]
- Szekely, G. J.; Rizzo, M. L. Brownian distance covariance. Ann. Appl. Statist. 2009, 3, 1236–1265. Available online. [CrossRef]
- Kraskov, A.; Stögbauer, H.; Grassberger, P. Estimating mutual information. Phys. Rev. E 2004, 69, 066138. Available online. [CrossRef]
- Reshef, D.N.; Reshef, Y.A.; Finucane, H.K.; Grossman, S.R.; McVean, G.; Turnbaugh, P.J.; Lander, E.S.; Mitzenmacher, M.; Sabeti, P.C. Detecting novel associations in large data sets. Science 2011, 334, 1518–1524. Available online. [CrossRef]
Figure 2.
Scatter plots showing the relationships among the investigated variables using raw monthly data. Pearson, Spearman, Kendall, Distance Correlation, Mutual Information, and MIC values are reported in each panel.
Figure 2.
Scatter plots showing the relationships among the investigated variables using raw monthly data. Pearson, Spearman, Kendall, Distance Correlation, Mutual Information, and MIC values are reported in each panel.
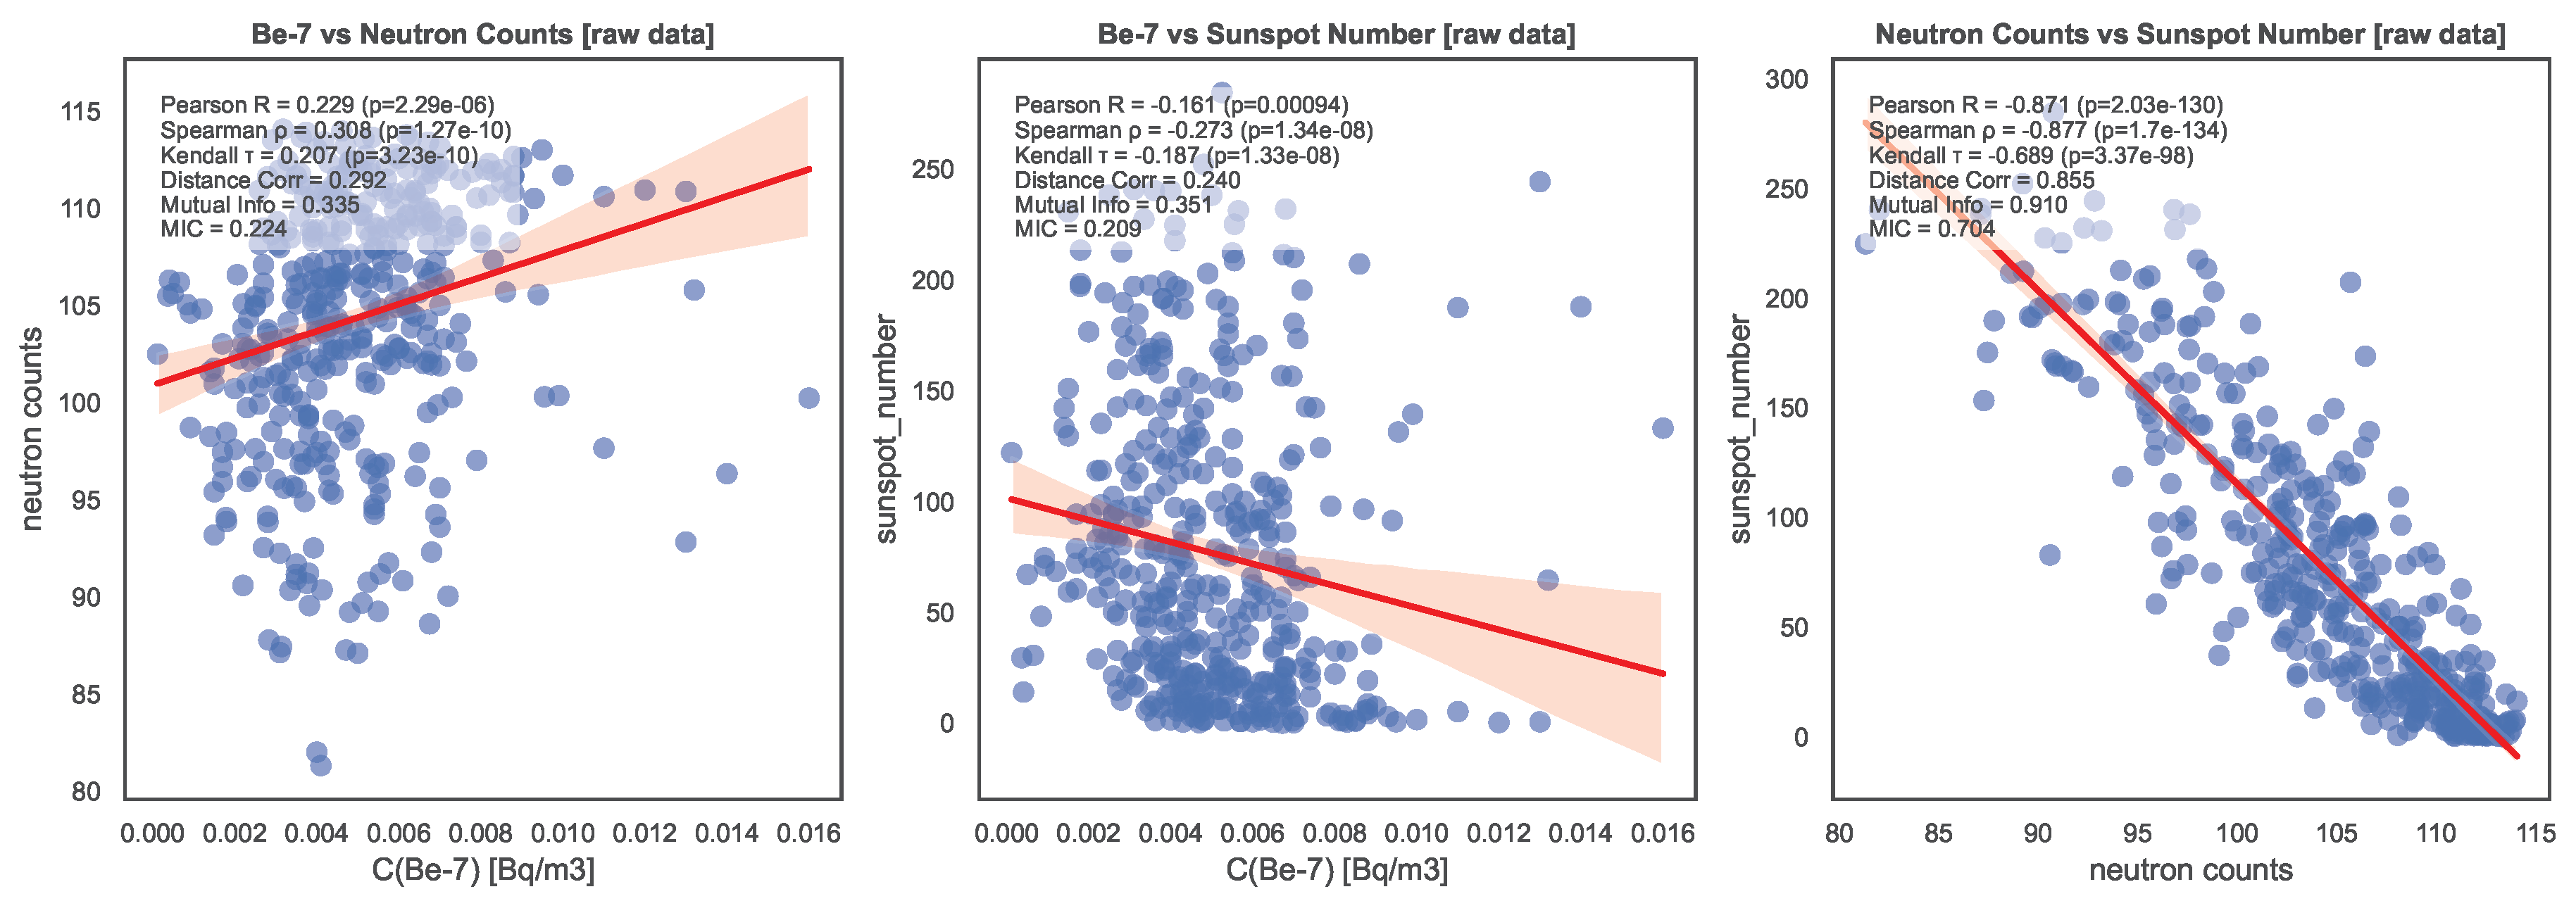
Figure 3.
Monthly concentrations of 7Be measured at Casaccia site. The grey lines represent the original monthly time series. Colored lines (on-line) in each panel show the low-frequency trends extracted using three different de-trending methods, plotted in separate rows: (left) running average with a 70-month window, (middle) Fourier reconstruction using the first 5 harmonics, and (right) STL decomposition with a seasonal period of 36 months. Vertical dashed lines indicate the start dates of Solar Cycles 22 to 25, allowing comparison of the extracted trends with solar activity phases.
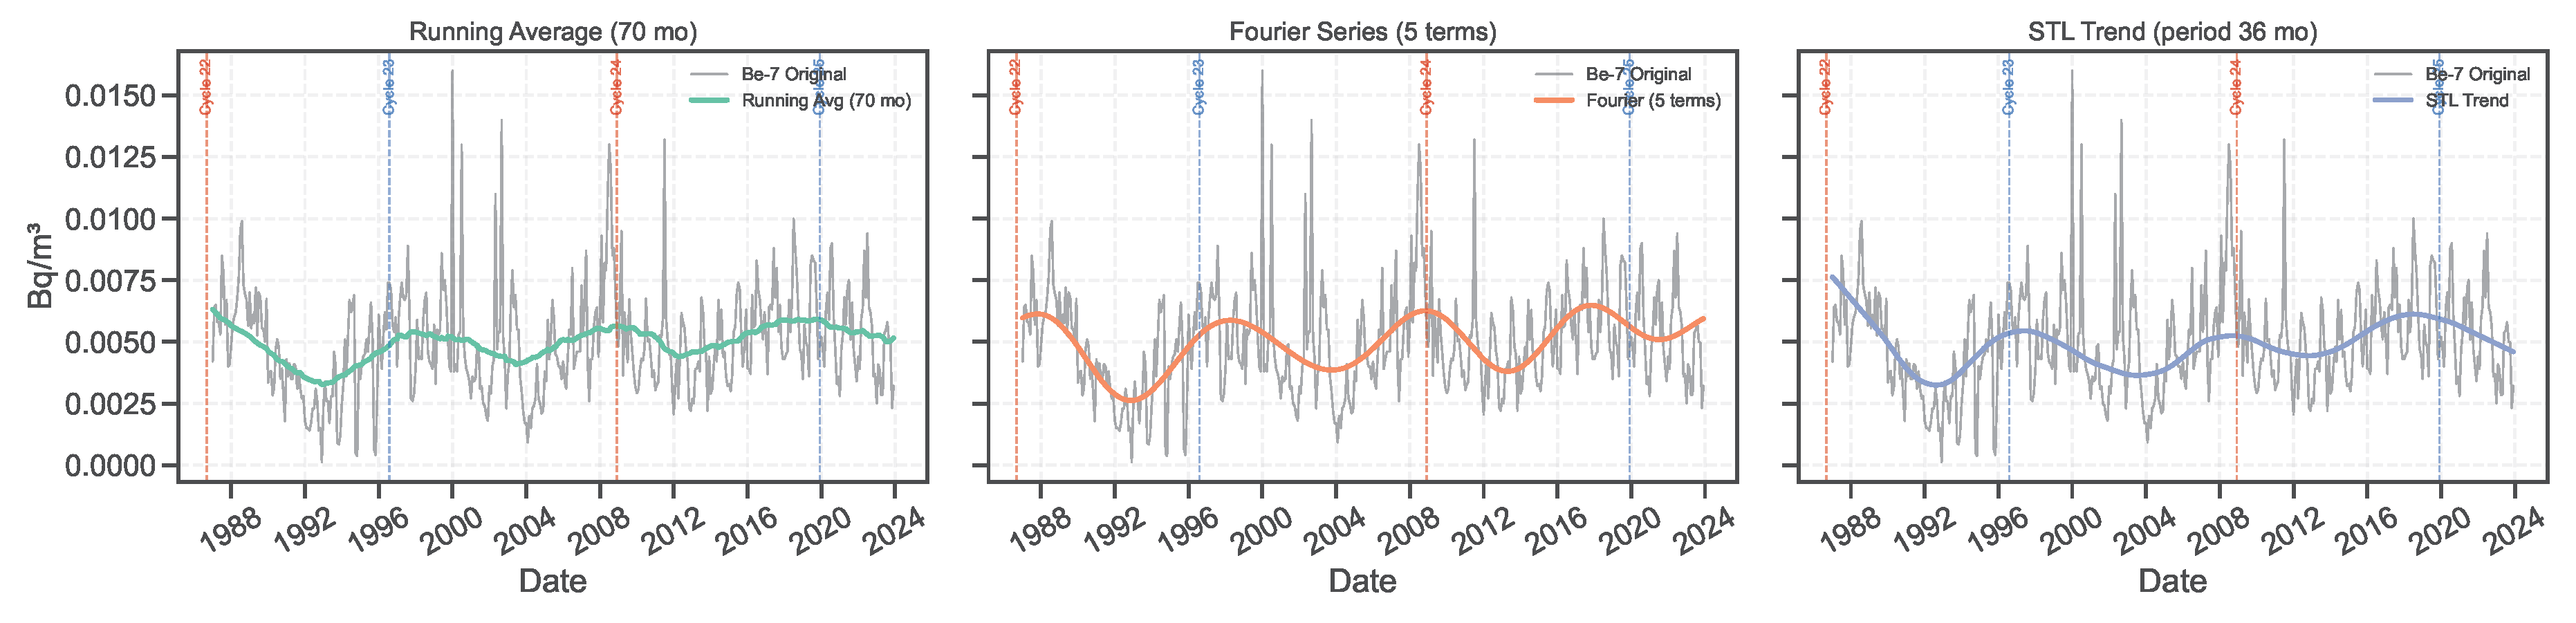
Figure 4.
Dependence metrics computed for the investigated time series after applying three different de-trending methods to the 7Be concentration data: Fourier series reconstruction (top), running average (middle), and STL decomposition (bottom). Each row shows two heatmaps for the same method. The left panels report signed correlation coefficients (Kendall, Pearson, Spearman) quantifying linear or monotonic relationships and retaining information about the direction of dependence. The right panels show positive-only dependence metrics (Distance Correlation, MIC, Mutual Information) capturing non-linear relationships. The pairs analyzed are 7Be vs neutron counts, 7Be vs sunspot number, and neutron counts vs sunspot number. All metrics were computed on the trend components (carrier waves of 7Be) extracted by the respective de-trending method.
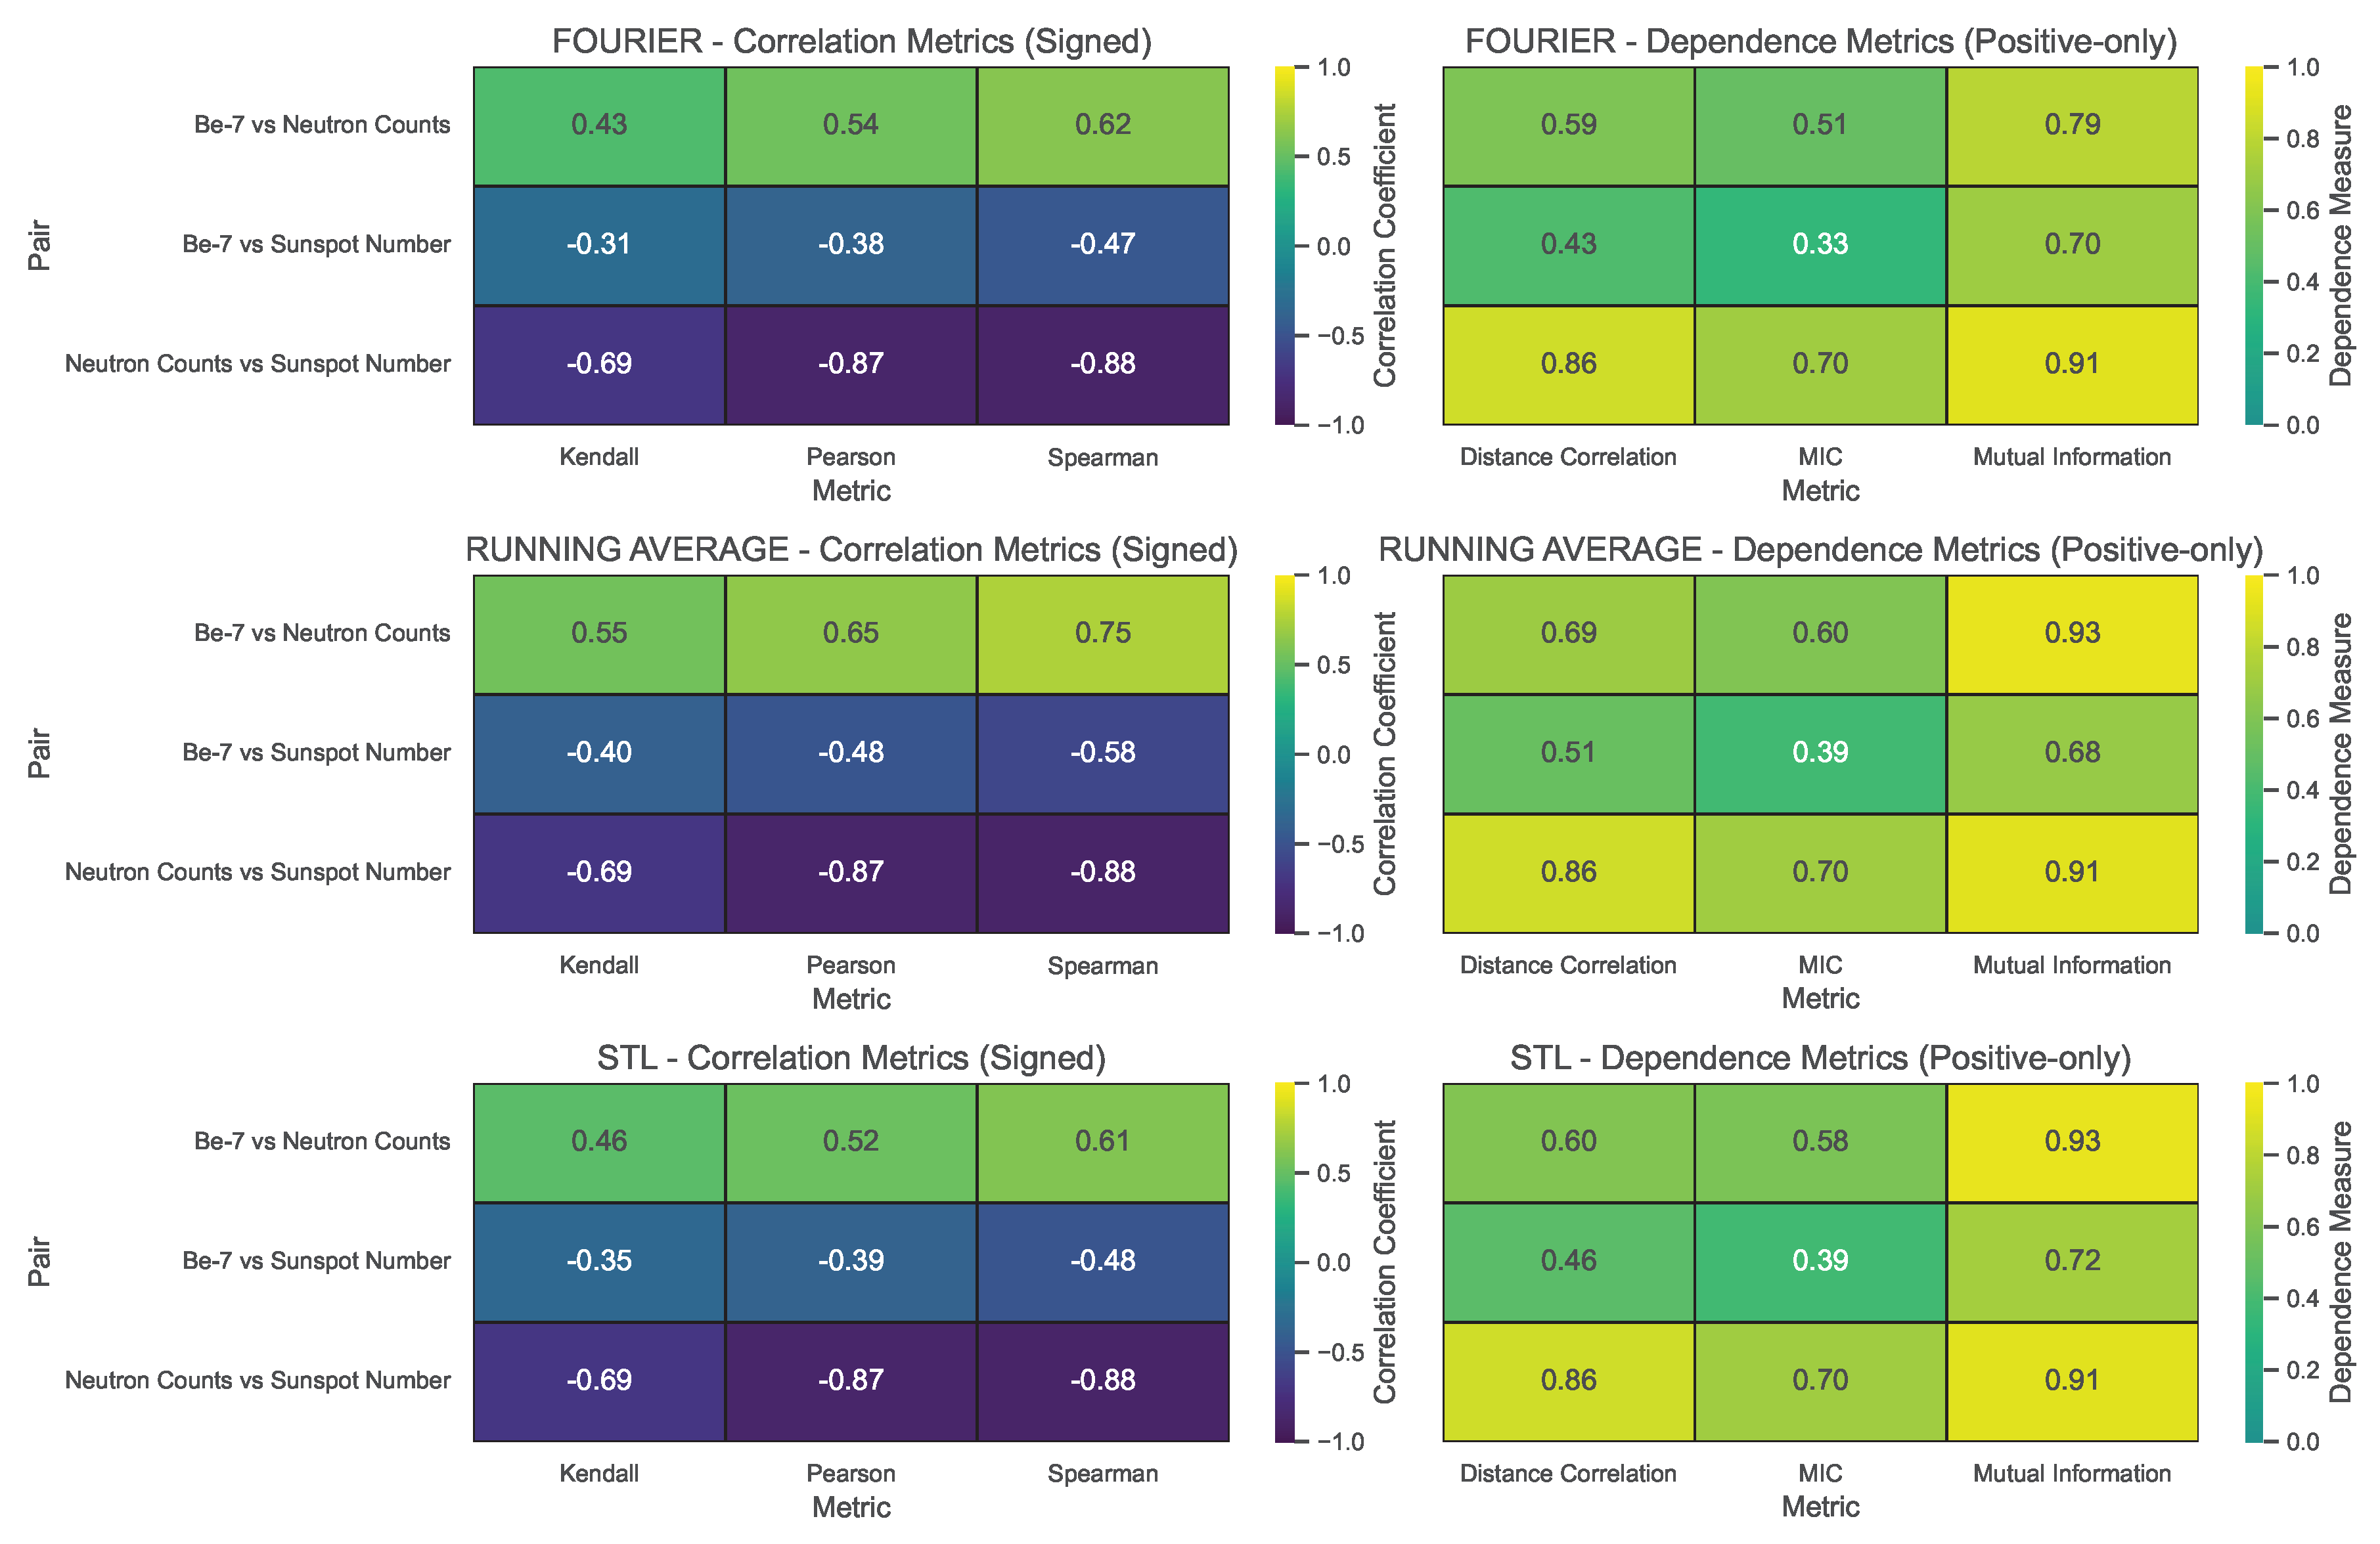
Figure 5.
Radar plots illustrating the correlation and dependence metrics for the investigated variable pairs. The left two panels refer to the relationship between 7Be concentration and neutron counts, while the right two panels show the relationship between 7Be concentration and sunspot number (absolute values). For each pair, correlation metrics (Pearson, Spearman, and Kendall) and dependence metrics (Distance Correlation, Mutual Information, and MIC) are presented separately. Different colors (on-line) represent the raw data and the results obtained after applying various de-trending methods (Fourier, STL, and Running Average). This visualization allows for a comparative assessment of the strength and consistency of associations under different de-trending techniques.
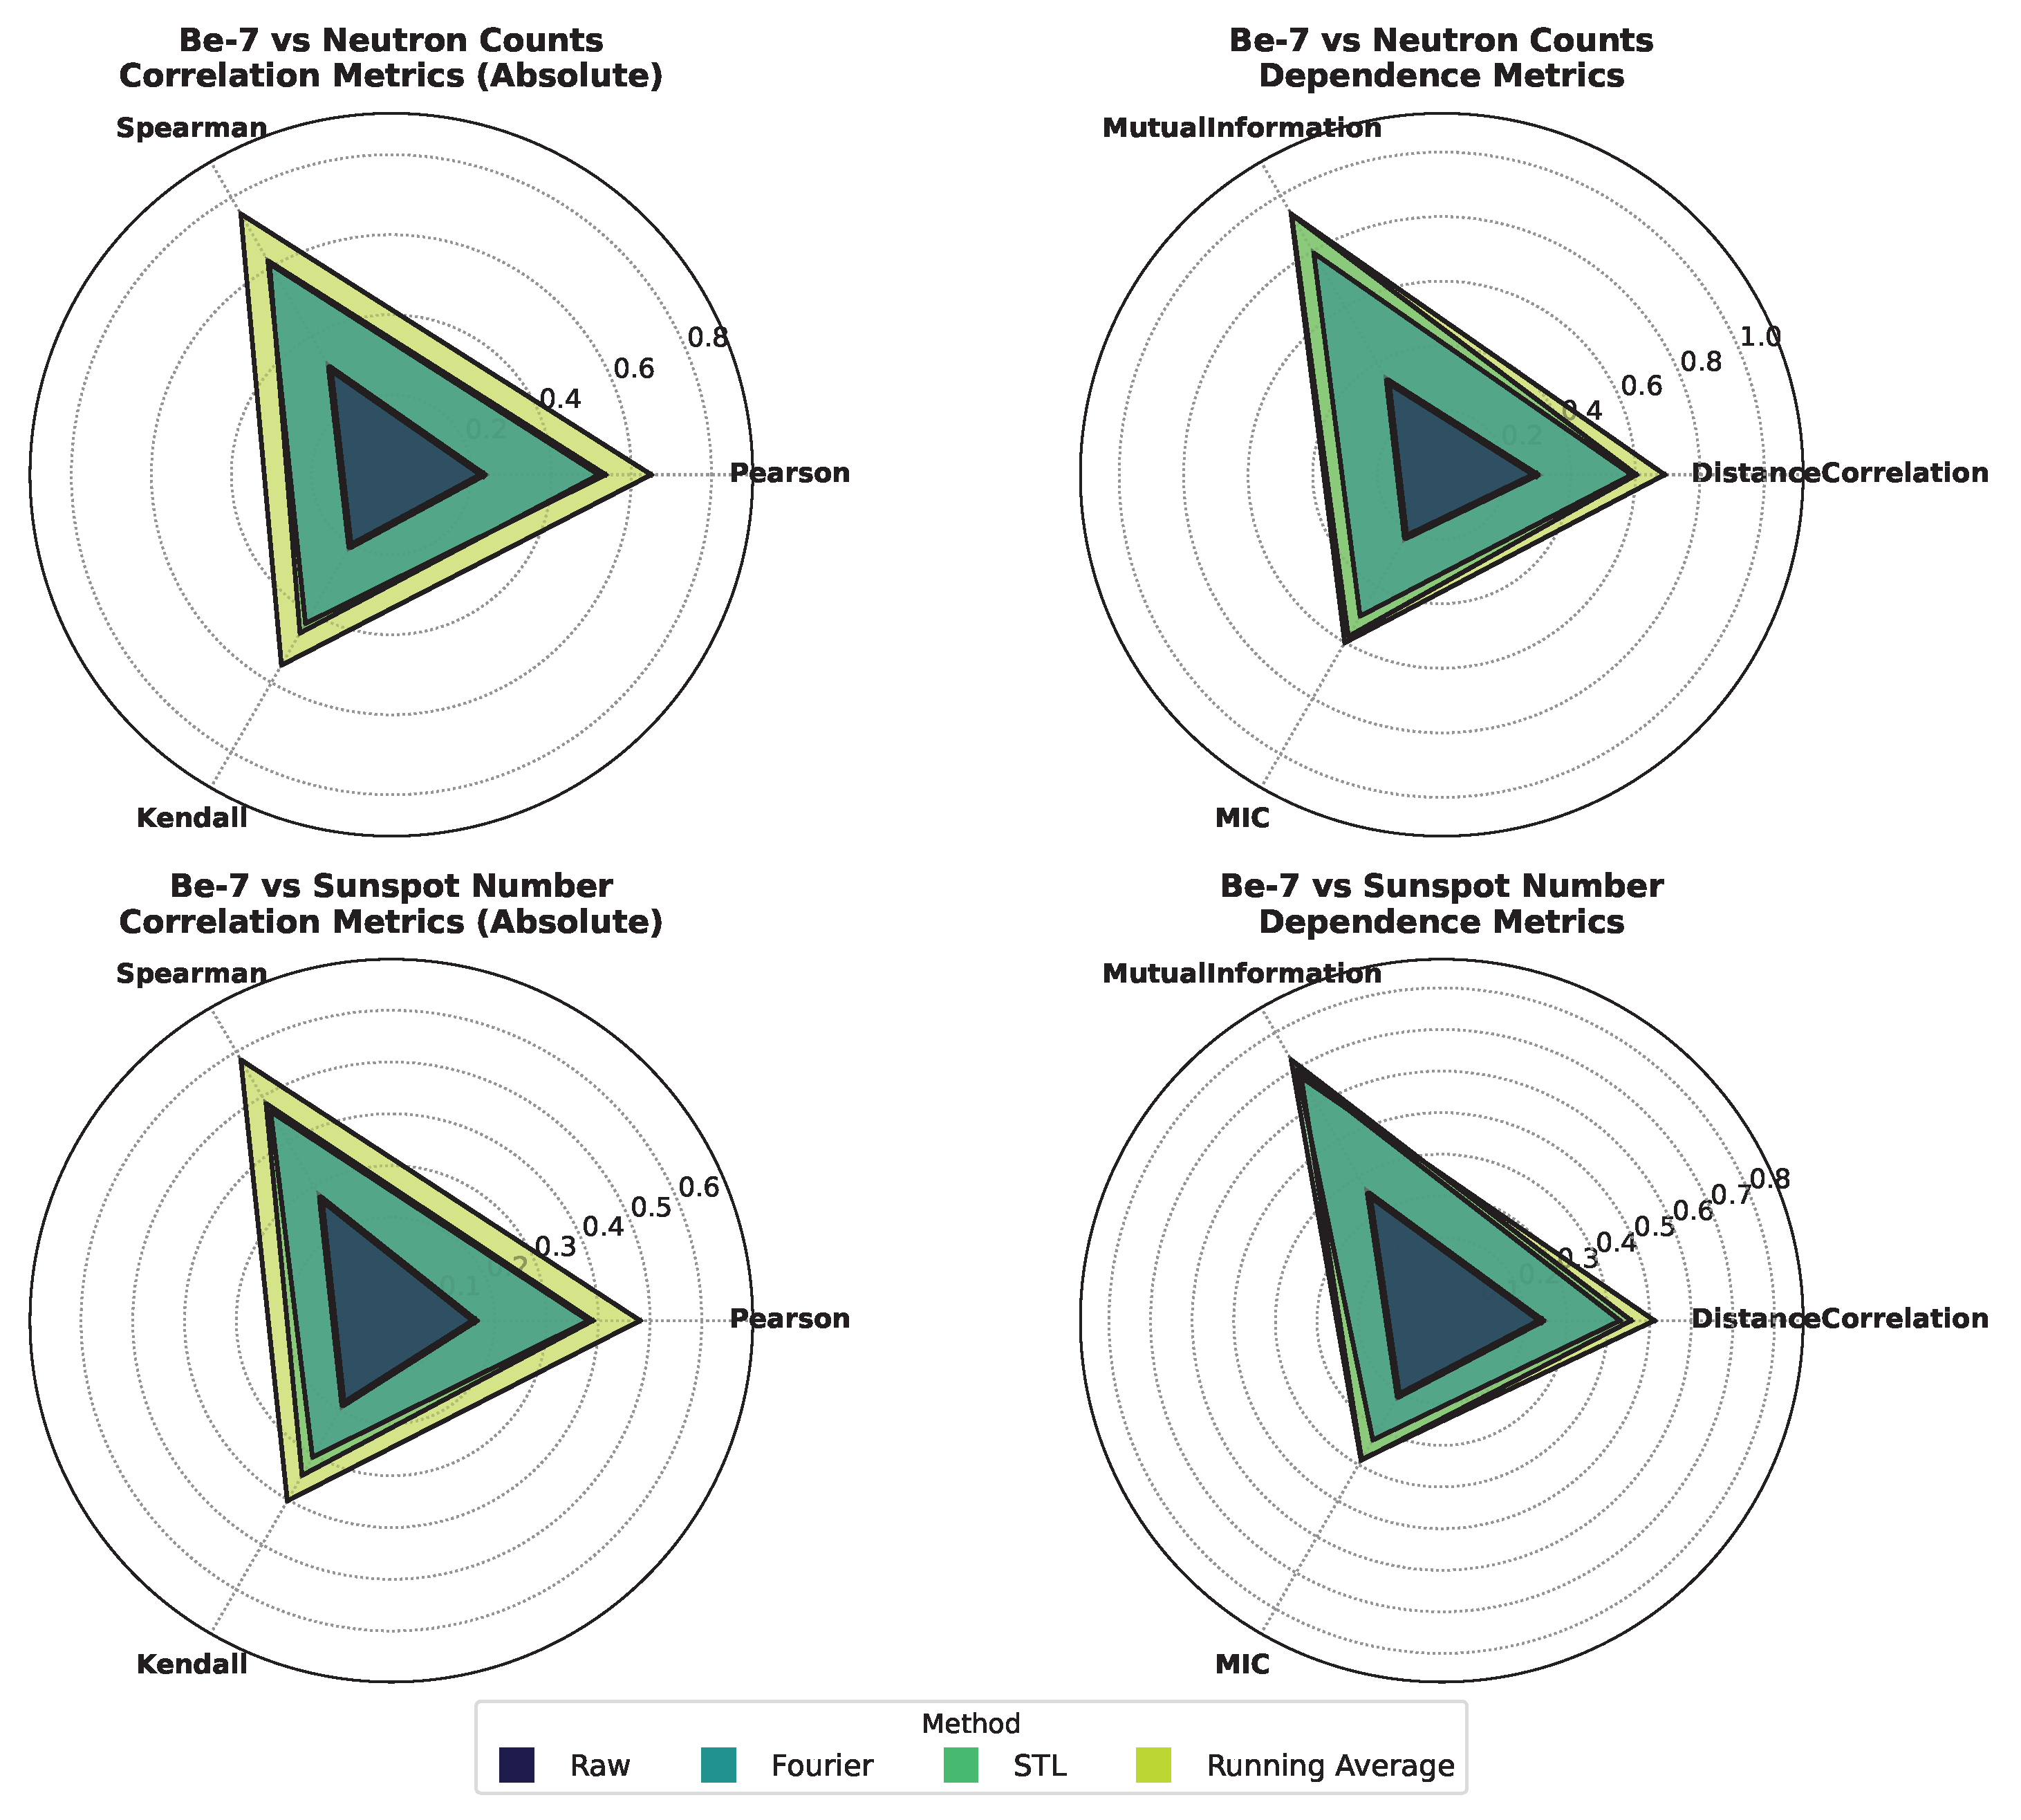

Table 1.
Dependence measures computed for the analyzed variable pairs on raw variables.
| Pair | r | p-value (r) | p-value () | p-value () | MI | MIC | |||
| Be-7 vs Neutron Counts | 0.23 | 0.31 | 0.21 | 0.29 | 0.34 | 0.22 | |||
| Be-7 vs Sunspot Number | -0.16 | -0.27 | -0.19 | 0.24 | 0.35 | 0.21 | |||
| Neutron Counts vs Sunspot | -0.87 | -0.88 | -0.69 | 0.86 | 0.91 | 0.70 |
Table 2.
Estimated periods of 7Be time-series using different de-trending methods.
| Method | Period [years] |
Lower Bound [years] |
Upper Bound [years] |
Systematic Range [years] |
|---|---|---|---|---|
| Running Avg | 10.92 | 9.96 | 10.92 | 0.96 |
| Fourier | 9.79 | 9.80 | 11.42 | 1.62 |
| STL | 10.54 | 10.46 | 10.79 | 0.33 |
Table 3.
Dependence measures computed for the analyzed variable pairs after de-trending, grouped by pair. The table reports Pearson’s r, Spearman’s , and Kendall’s correlation coefficients with their associated p-values, together with Distance Correlation (), Mutual Information (MI), and the Maximal Information Coefficient (MIC).
| Pair | Method | r | p-value(r) | p-value() | p-value() | MI | MIC | |||
| Be-7 vs Neutron | fourier | 0.54 | 0.62 | 0.43 | 0.59 | 0.79 | 0.51 | |||
| running | 0.65 | 0.75 | 0.55 | 0.69 | 0.93 | 0.60 | ||||
| stl | 0.52 | 0.61 | 0.46 | 0.60 | 0.93 | 0.58 | ||||
| Be-7 vs Sunspot | fourier | -0.38 | -0.47 | -0.31 | 0.43 | 0.70 | 0.33 | |||
| running | -0.48 | -0.58 | -0.40 | 0.51 | 0.68 | 0.39 | ||||
| stl | -0.39 | -0.48 | -0.35 | 0.46 | 0.72 | 0.39 | ||||
| Neutron vs Sunspot | raw | -0.87 | -0.88 | -0.69 | 0.86 | 0.91 | 0.70 |
Disclaimer/Publisher’s Note: The statements, opinions and data contained in all publications are solely those of the individual author(s) and contributor(s) and not of MDPI and/or the editor(s). MDPI and/or the editor(s) disclaim responsibility for any injury to people or property resulting from any ideas, methods, instructions or products referred to in the content. |
© 2025 by the authors. Licensee MDPI, Basel, Switzerland. This article is an open access article distributed under the terms and conditions of the Creative Commons Attribution (CC BY) license (http://creativecommons.org/licenses/by/4.0/).
Copyright: This open access article is published under a Creative Commons CC BY 4.0 license, which permit the free download, distribution, and reuse, provided that the author and preprint are cited in any reuse.


