
Submitted:
12 August 2025
Posted:
13 August 2025
You are already at the latest version
Abstract
Wind energy development is a key component for transition to sustainable clean energy. Collision probability depends on turbine dimensions. The avoidance rate in most of the species indicates a low collision probability. How this probability varies according to the dimensions of wind turbine and production capacity respectively are important questions when EIA must be performed in future and existing wind farm territories. We applied a simulation approach based on flight height distributions of middle size diurnal raptor species. To obtain accurate flight height data in different life cycle periods, we used long term GPS tracking data from an area with over 200 operating wind turbines. Our model species had unimodal flight height distribution in the period of breed-ing, wintering and a higher mode of flight altitudes in migration periods. As the poten-tial collision probability varied between seasons, wind energy planning should consid-er the composition of the local bird community to optimize mitigation measures. Our carcass searches data supported low collision probability for common buzzards. This optimistic result may indicate fast habituation process of middle size diurnal rapport species such as common buzzards to the changes in environment related to wind power projects.
Keywords:
GPS tracking
; energy transition
; environmental impact assessment
; cumulative effect
; flight behavior
; wind turbine
1. Introduction
The dynamic changes in climate systems on the planet is obvious. One of the most efficient tools to stop the process is the transition of energy production to renewable sources such as wind power. According to official information from the European Union, the installed wind power capacity by 2030 must be 510 GW [2]. This is more than twofold compared to 2022 [3]. For the moment there is no evidence for detrimental effects of the wind power development on the populations of any bird species [4], but the future expansion needs careful planning and effective Environmental Impact Assessment tools.
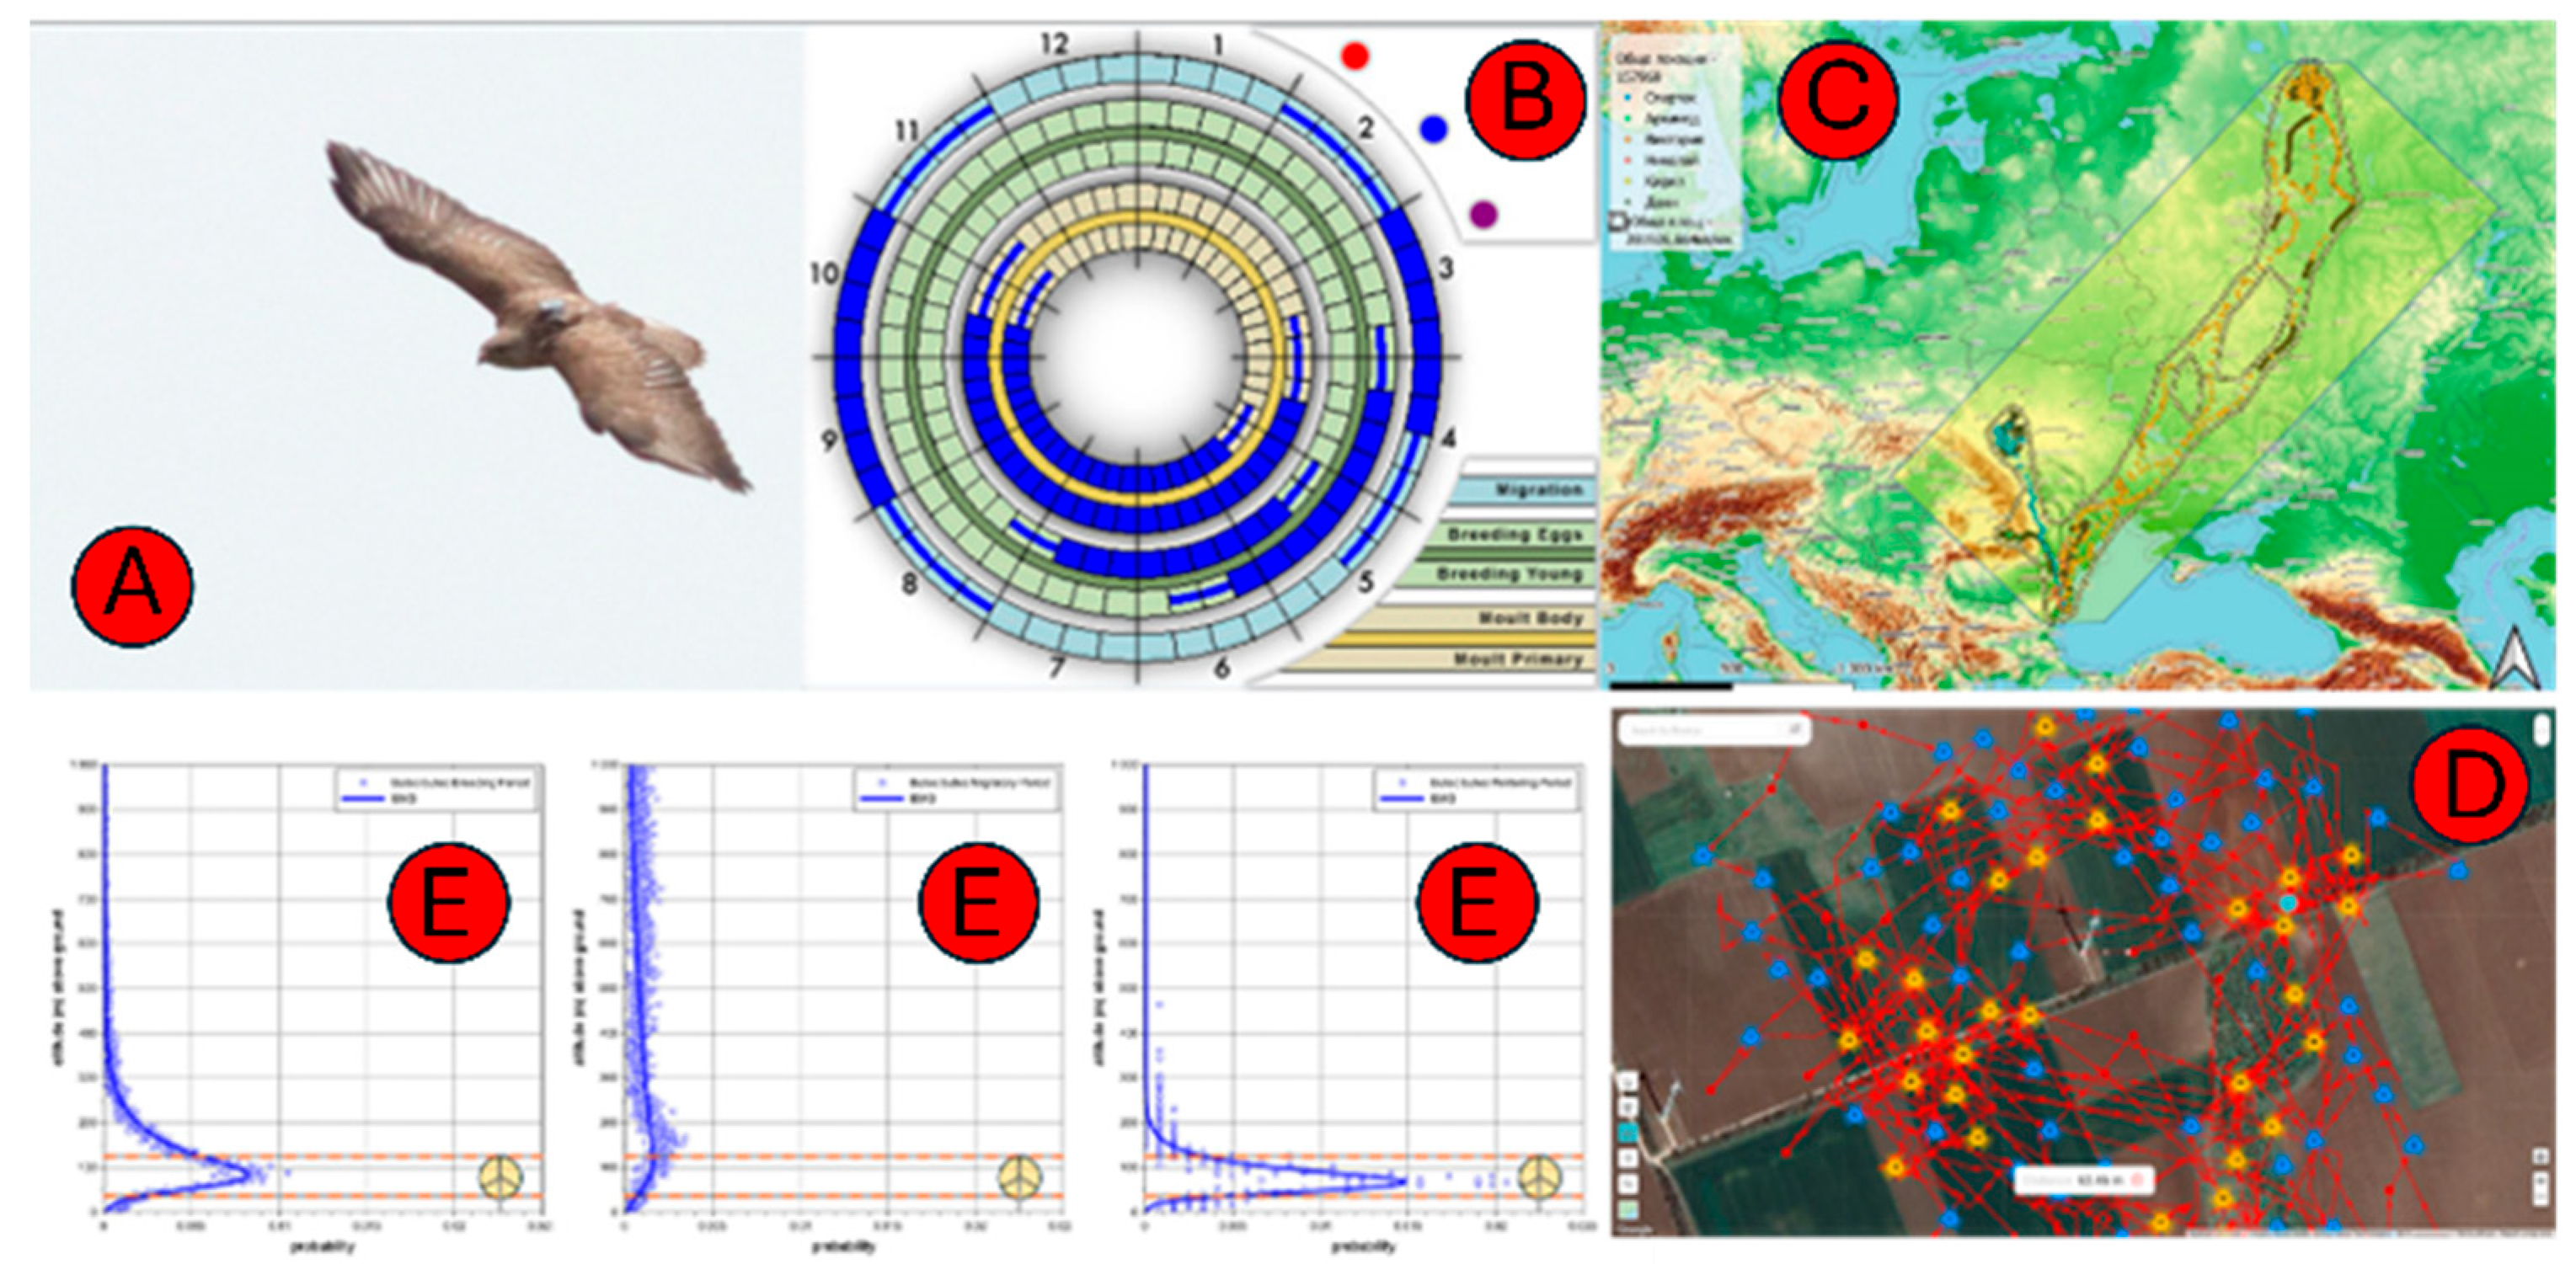
Figure 1.
Study overview. (A) Common Buzzard (Buteo buteo). (B) Annual cycle indicating migration, breeding and moult. (C) Eurasian range and study area in NE Bulgaria. (D) GPS tracks and turbine locations within the site. (E) Monte Carlo collision-probability outputs by season.
Figure 1.
Study overview. (A) Common Buzzard (Buteo buteo). (B) Annual cycle indicating migration, breeding and moult. (C) Eurasian range and study area in NE Bulgaria. (D) GPS tracks and turbine locations within the site. (E) Monte Carlo collision-probability outputs by season.
The main impact is collision of birds in some sensitive to wind turbines bird species and in badly sited wind farms. Several raptors and Old-World vultures appear to be especially vulnerable to collision with wind turbines [4,5,6,7,8,9,10,11,12]. While this may be because wind farms may be placed in locations which these species use for feeding [13], it is also probably equally if not more relevant for ‘soaring’ raptors and Old World vultures, that both the birds and wind farm developers select locations which are rich in wind energy [5,13,14,15,16,17]. This selection for the same wind energy resource often creates a potential conflict [14,16,17]. At least some other ‘soaring bird’ species do not appear to be similarly vulnerable, however. For example, while Old World vultures and their taxonomic relatives may have some difficulty in avoiding collision [6,7,10,11,18,19,20] this difficulty does not seem to apply to New World vultures as they are disproportionately unlikely to be killed at wind farms despite their frequent occurrence [4,21,22,23,24]. Another unrelated but predominantly scavenging species, the raven Corvus corax, is frequently recorded at wind farms but is rarely found as a victim of turbine collision [13,21,22]. This additional increase of selective pressure of the changed environment may have impact on local bird populations [25,35].
Mitigation measures are used to reduce the collision risk of birds with wind turbines in many regions of the world including NE Bulgaria. Most efficient are careful EIA based selection or wind turbine location and shutdown on demand during periods with increased collision risk [26].
According to the most often cited publications rotor height of wind turbines has a large effect on collision risk, as birds use the vertical airspace in a non-uniform way [27,28]. Some studies report the rate of bird collisions at a wind turbine determined by different turbine size parameters, such as rotor diameter [29], rated power [30], hub height [22], ground clearance [29] and maximum tip height [31]. The results were not consistent, because the studies did not distinguish between bird species [30].
There are two methods to evaluate collision probability. First is direct carcass searches. The second is simulation of collision probability by mathematical models. Carcass searches are limited by local land coverage and accessibility to the turbines. The models are often based on many assumptions and cannot be confirmed by direct evidence from the real mortality found in the field because long term monitoring data are often missing. The rapid need to develop more wind energy projects requires information on the effects of turbine dimensions on collision risk for a range of bird species, especially species important for ecosystems and human life.
The best approach is to apply carcass searches results as a test for collision risk estimated by a model of flight behavior, mainly with respect to the flight height distributions [32,33]. The study of flight height is limited by accuracy in the height measurements and long-term data in order to account on variations related to changes in ecology of species in its annual life cycle. In this study we used tracking data for several years to investigate the flight height distributions of 8 common buzzards across migratory, breeding and wintering periods in areas with operational wind turbines. Common buzzard is a model species of a middle size diurnal raptor species (Accipitriformes). This ecological group of species is particularly exposed to potential probability to wind turbine collisions [34]. The low mortality rate found in our carcass monitoring for 18 years in the study area exclude significant impact in the current moment (https://www.aesgeoenergy.com/ and https://kaliakrabirdmonitoring.eu/). Despite this as raptors are long-lived, their populations are particularly sensitive to an increased mortality [34,35].
Our study approach was based on a stochastic Monte – Carlo adaptation of the Band collision risk model [1,36]. We considered the overlap of the wind turbines' rotor height ranges with the birds' flight height distributions as well as wind speed, period when the turbines were operational alongside technical parameters varying with rotor diameter, such as rotor rotation speed. Furthermore, we considered the increase of rated power of wind turbines with larger rotor diameters, to determine whether the survival chance for common buzzard deepens on the power capacity using many small turbines or a small number of large turbines. Finally, we assessed the consistency of the results between study performed by theoretical Monte-Carlo simulation and real mortality of common buzzards discovered in the same territory after 18 years of systematic carcass monitoring.
Our main objective was to assess how the theoretical collision probability varied according to seasons and different height distribution of flights in an area with operational 114 wind turbines. We have compared our prediction with real mortality discovered after systematic carcass searches in the same territory.
2. Materials and Methods
2.1. Study Design and Concepts
We investigated the theoretical survival probability of Common Buzzards (Buteo buteo) passing through a wind farm area in Northeast Bulgaria. The study combined long-term GPS tracking data with systematic visual monitoring of raptor flights and carcass searches under operational turbines. We used seasonal flight-height distributions as inputs to a stochastic Monte Carlo implementation of the Band model [1] to estimate collision probability across turbine configurations. The study design is summarized in Figure 2.
2.2. Study Area
The research was conducted in the Kaliakra region, Dobrich Province, Northeastern Bulgaria, part of the Dobruja Plateau and located within the Continental biogeographic region [37]. The area lies along the Via Pontica migration flyway, one of Europe’s most important routes for migratory birds, and includes breeding and wintering grounds for several raptor species of conservation concern.
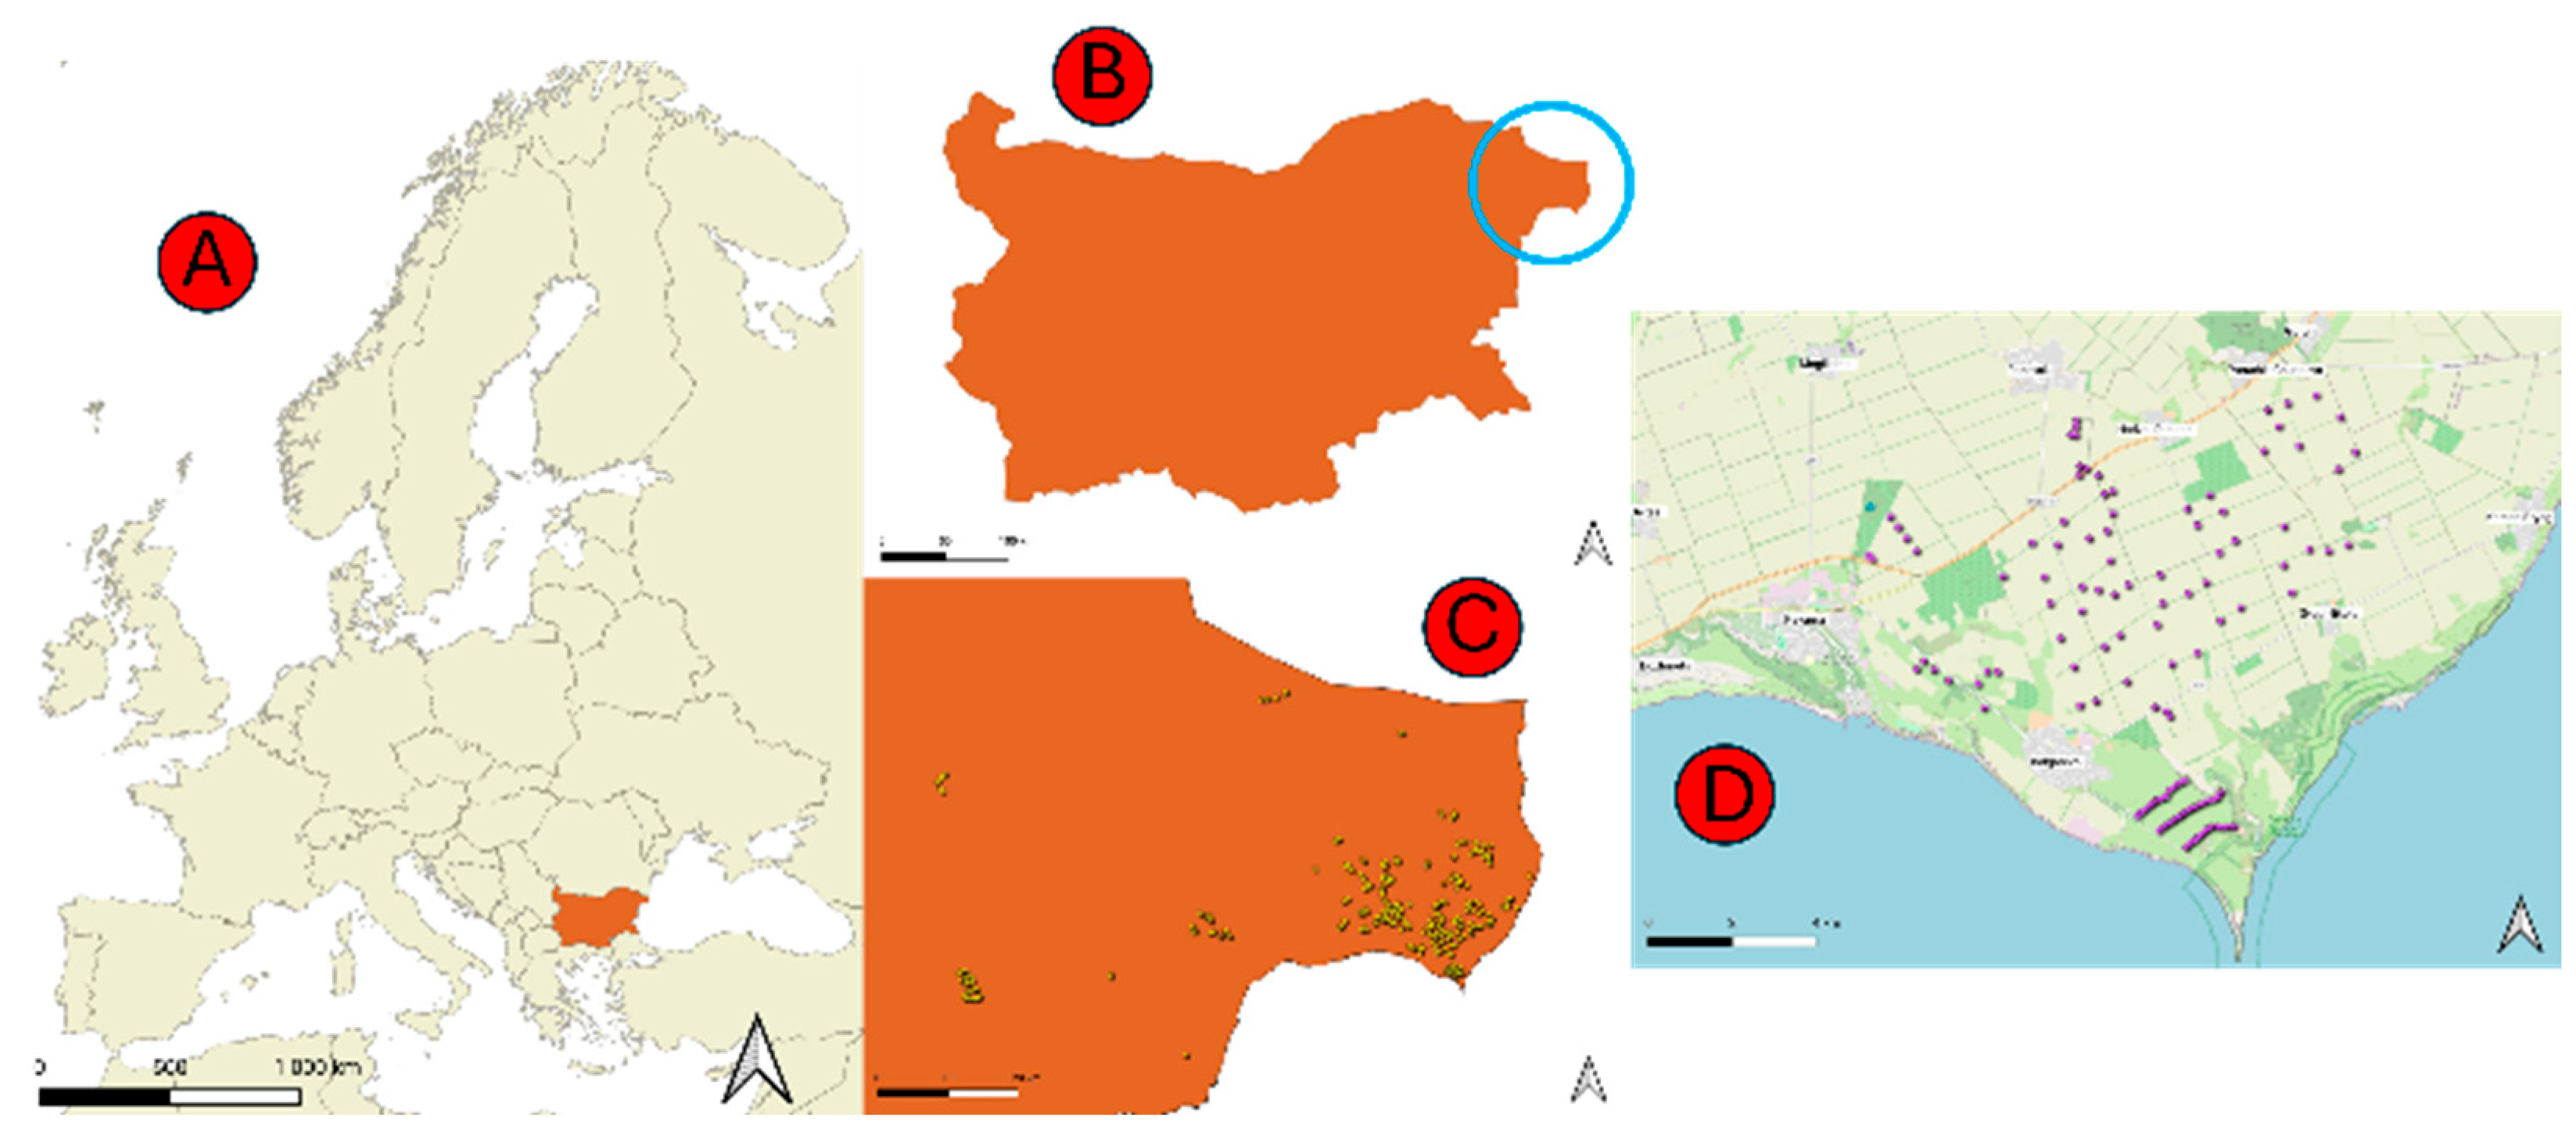
Figure 3.
Location and spatial context of the study area in Northeastern Bulgaria. (A) Map of Europe showing the location of Bulgaria. (B) Map of Bulgaria with the study area in the Northeast highlighted. (C) Distribution of wind farms in the northeastern region of Bulgaria. (D) Detailed map of the study area with the locations of individual wind turbines.
The climate is temperate-continental with maritime influence from the Black Sea; summers are hot, winters mild, and mean annual precipitation is ~450–500 mm. Vegetation is dominated by steppe grasslands and arable farmland (wheat, maize, sunflower), with scattered shrublands and small woodland patches.[37]
The study area and its surroundings contain 114 operational wind turbines, distributed across ~249 km² (43.384943°N to 43.481358°N, 28.356819°E to 28.499993°E). Within the study area and surroundings, 114 operational turbines are distributed across ~249 km² (43.384943–43.481358°N, 28.356819–28.499993°E). Inter-turbine distances vary from ~115 m to ~11.8 km, reflecting multiple projects and layouts. Turbine models vary in hub height and rotor diameter, influencing the vertical extent of the rotor-swept zone. Most turbines are sited in open agricultural landscapes and on elevated plateaus to maximise wind exposure. The main technical specifications of the wind turbines in the study area are summarised in Table 1. These parameters were used to define the vertical extent of the rotor-swept zone in the collision-risk modelling.
Habitats in the area provide suitable foraging grounds for Common buzzard (B. buteo) due to abundant prey (small mammals, birds, reptiles) and availability of perching and nesting sites.
2.3. Study Species
The Common Buzzard (Buteo buteo) is a widespread medium-sized diurnal raptor across Europe and parts of Asia. It is listed as Least Concern [41]. Global abundance is estimated at 3.6–6.0 million mature individuals, with ~2.0–3.7 million breeding pairs in Europe and ~12,000–18,000 breeding pairs in Bulgaria. The species breeds in forests, woodland edges and agricultural mosaics, typically nesting in trees but occasionally on cliffs or artificial structures. Buzzards are partial migrants—largely resident in Central and Western Europe, with northern/eastern populations moving south. Diet is opportunistic (small mammals, birds, reptiles, carrion). Key threats include habitat loss, illegal persecution, collisions with turbines and vehicles, and secondary poisoning from rodenticides.
2.4. Data Collection
2.4.1. GPS Tracking
We used solar-powered GPS/GSM tags (Druid LEGO 2G, weight 18.7 g) deployed on nine B. buteo individuals. Each device recorded location, orthometric and ellipsoid altitude, ground speed, and other telemetry parameters with spatial accuracy of ~5 m. Devices were powered by integrated solar panels, enabling up to 2,000 fixes per day. Altitude values from ellipsoid measurements were converted to orthometric heights using the UNAVCO Geoid Height Calculator [38,39,40]. Only GPS fixes with ground speed > 0 were retained for flight-height analysis.

Table 2.
Characteristic data of Common Buzzard GPS tracking in Bulgaria.
| Bird flight type | Number of GPS | Observation period | File | EMG* Gaussian mean and standard deviation | EMG* Exponential decay |
||
| tracking positions | from | to | name | μ (m) | +-σ (m) | τ (m) | |
| Breeding | 13,047 | 06.11.2021 | 29.06.2022 | BreedingPeriod-positivespeed.csv | 68.2 | +-20.4 | 86.2 |
| Migratory | 10,696 | 24.03.2023 | 20.11.2023 | MigratoryPeriod.csv | 557.4 | +-372.3 | 184.3 |
| Wintering | 247 | 18.01.2022 | 24.01.2022 | WinteringPeriod-positivespeed.csv | 68.0 | +-30.3 | 33.7 |
| * The EMG (Exponentially Modified Gaussian) distribution is the convolution integral of a Gaussian with μ, σ with an Exponential distribution with decay constant τ. | |||||||
2.4.2. Visual Observations
Standardized daytime vantage-point surveys covered turbine clusters and main flight corridors between August–September (autumn migration), December–February (wintering) and March–May (spring migration). Each point was equipped with 10× binoculars, 20–60× spotting scopes, GPS and compass. Experienced observers recorded, for each bird or flock, species (with age/sex where possible), number, estimated flight height (using calibrated landmarks), horizontal distance, flight direction and behavior, together with prevailing weather. Flight heights were assigned to predefined bands (0–10 m, …, >500 m) for consistency and integration with the collision-risk model [26].
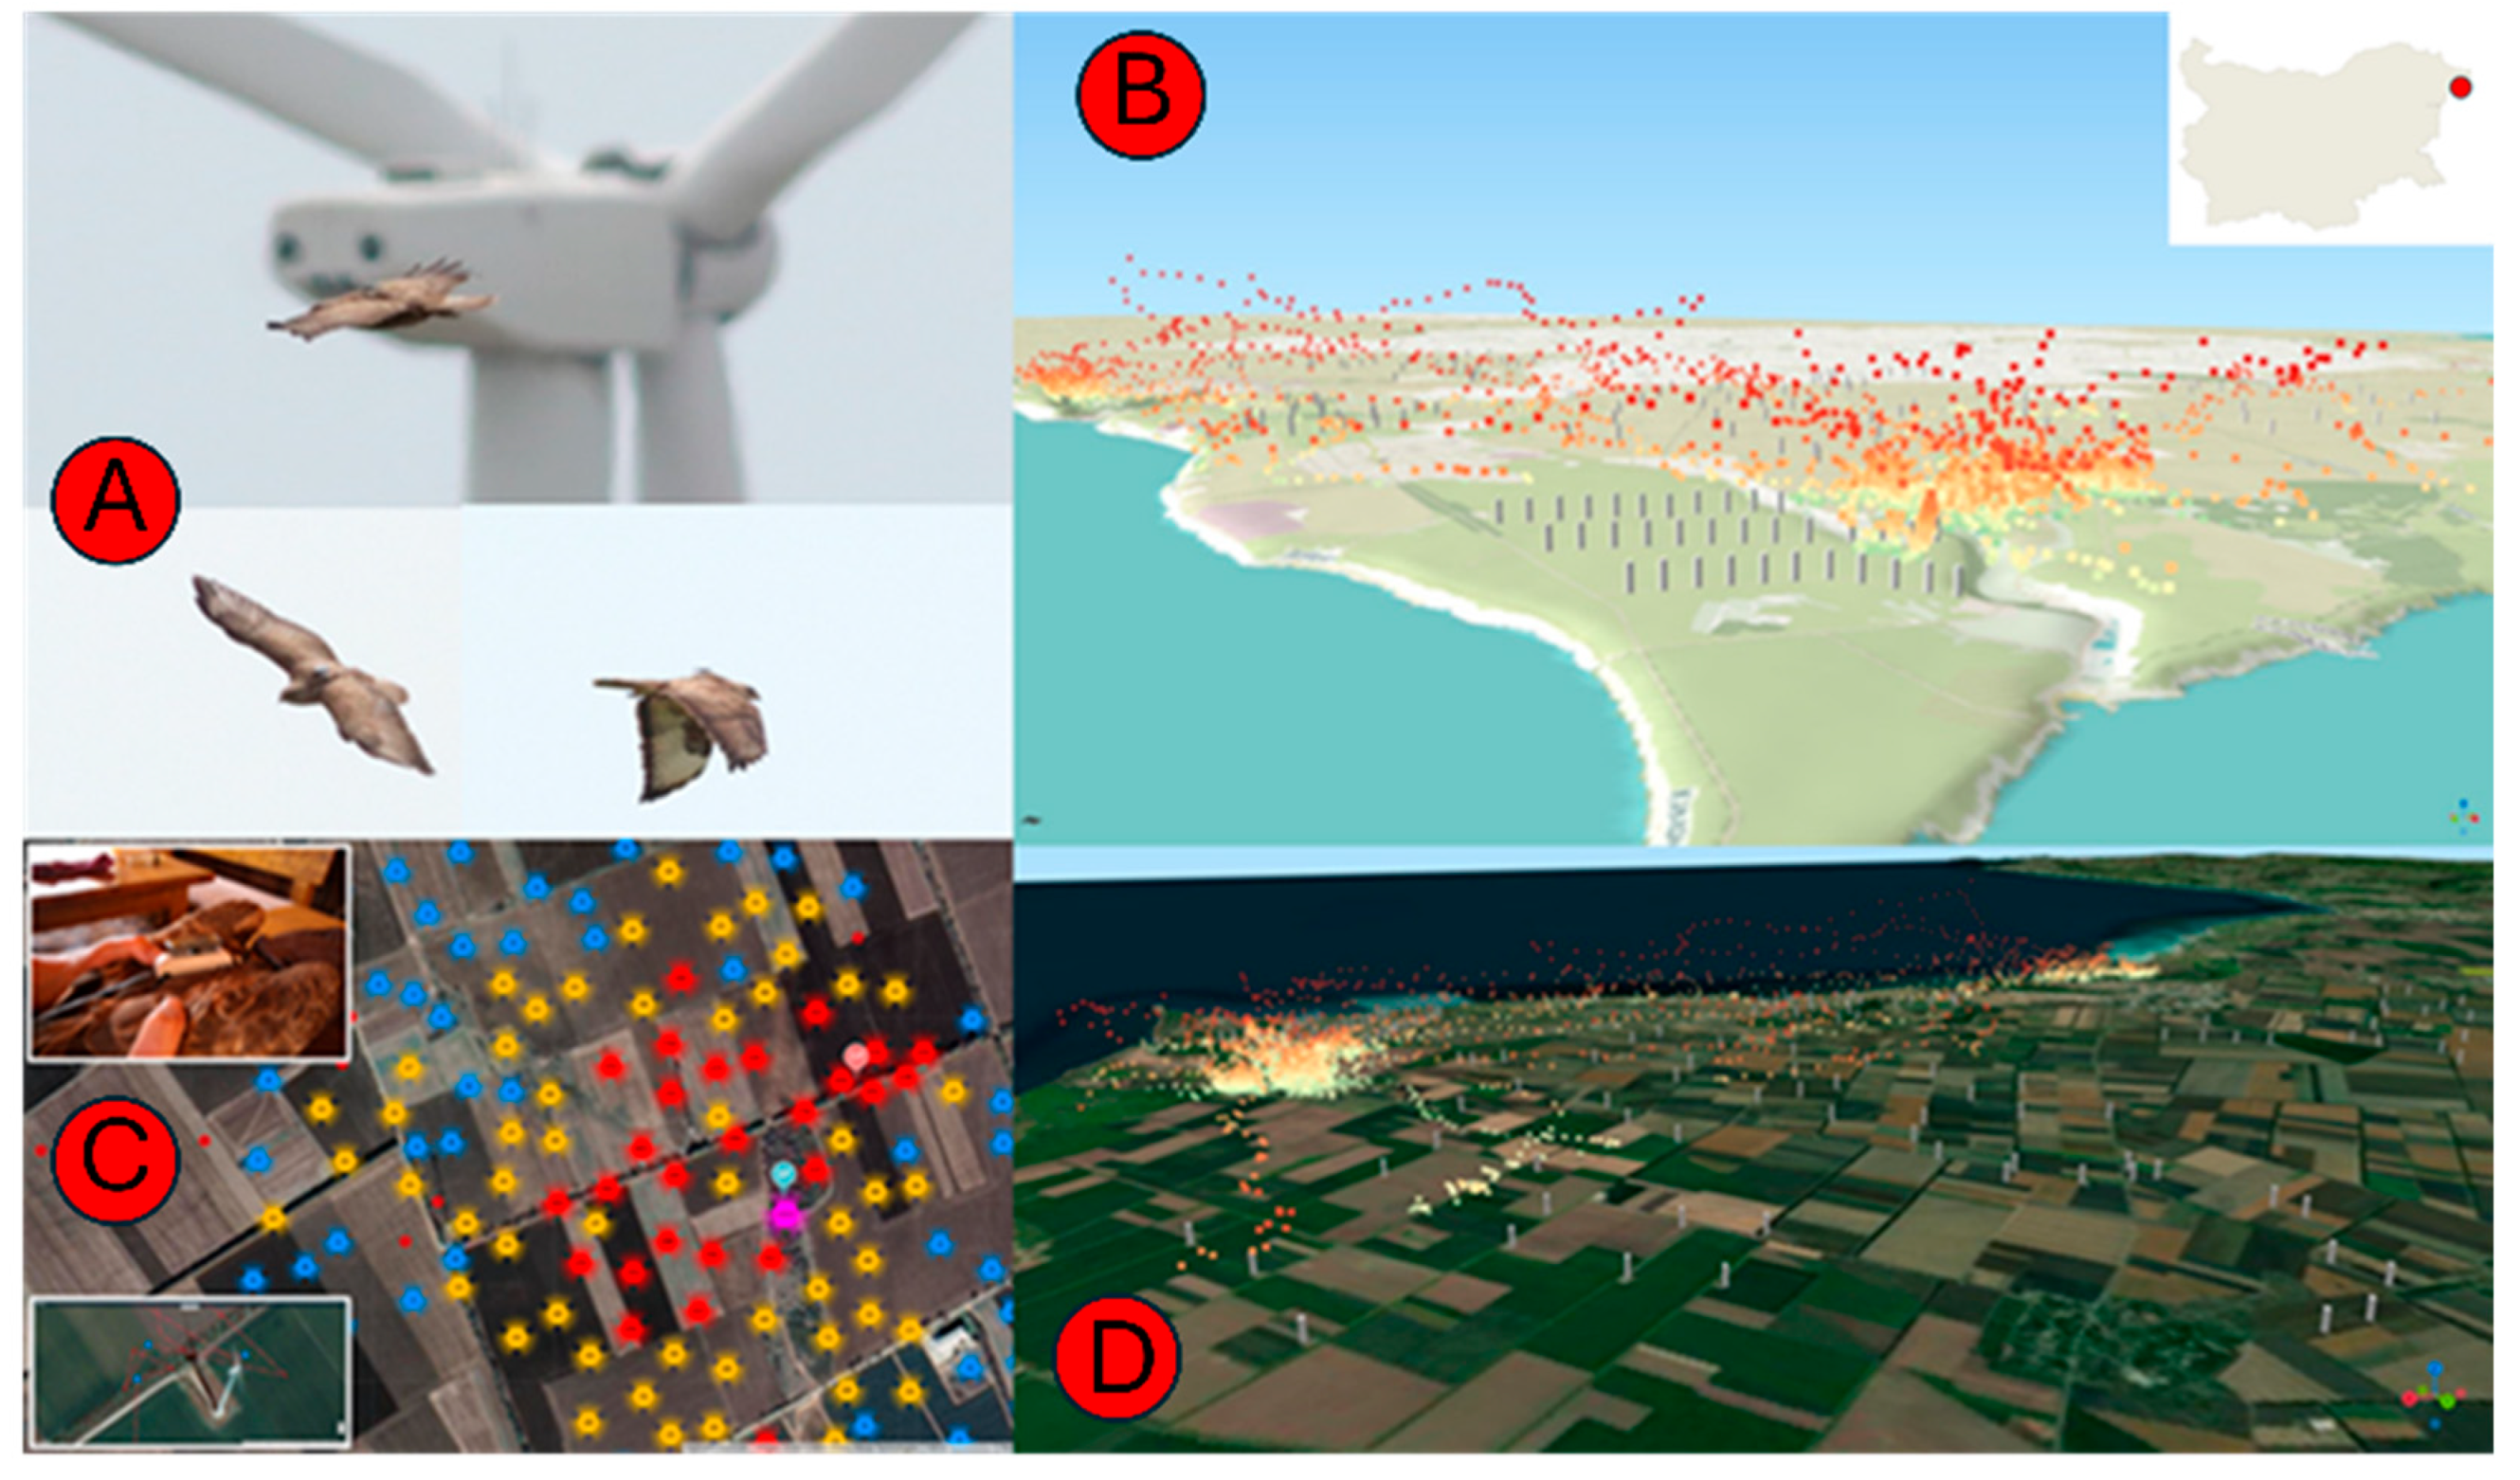
Figure 4.
Study area, field methods, and spatial distribution of bird tracking data. (A) Common Buzzards flying near a wind turbine within the study area in NE Bulgaria. (B) 3D visualization of GPS tracking data showing bird flight altitude and density across the coastal wind farm landscape. (C) Clustered GPS locations of a tagged Common Buzzard in the core wind farm area, with inset photo taken during the tagging procedure. (D) 3D spatial overview of buzzard movements and wind turbine positions across the agricultural landscape.
2.5. Carcass Searches
Systematic carcass searches followed protocols adapted from Morrison and Johnson and colleagues [42], using 200 × 200 m plots centered on each turbine and parallel transects spaced 20 m apart; where vegetation reduced detectability (e.g., unharvested sunflower), transects were narrowed. Searches were conducted once every seven days during autumn migration and every three to four days in winter, restricted to turbine sectors regularly used by geese or raptors.
For each find, observers recorded species (with age/sex where determinable), date and time, distance and bearing to the nearest turbine, carcass condition (intact, scavenged, or feather spot) and, where possible, likely cause of death (collision, predation, unknown). Searcher-efficiency and carcass-persistence trials were conducted at least once per migration season in the first two years; placed carcasses (e.g., chickens, pigeons, large ducks) were used to estimate detection and removal, and these metrics were applied to correct raw counts.
2.6. Data Processing and Modelling
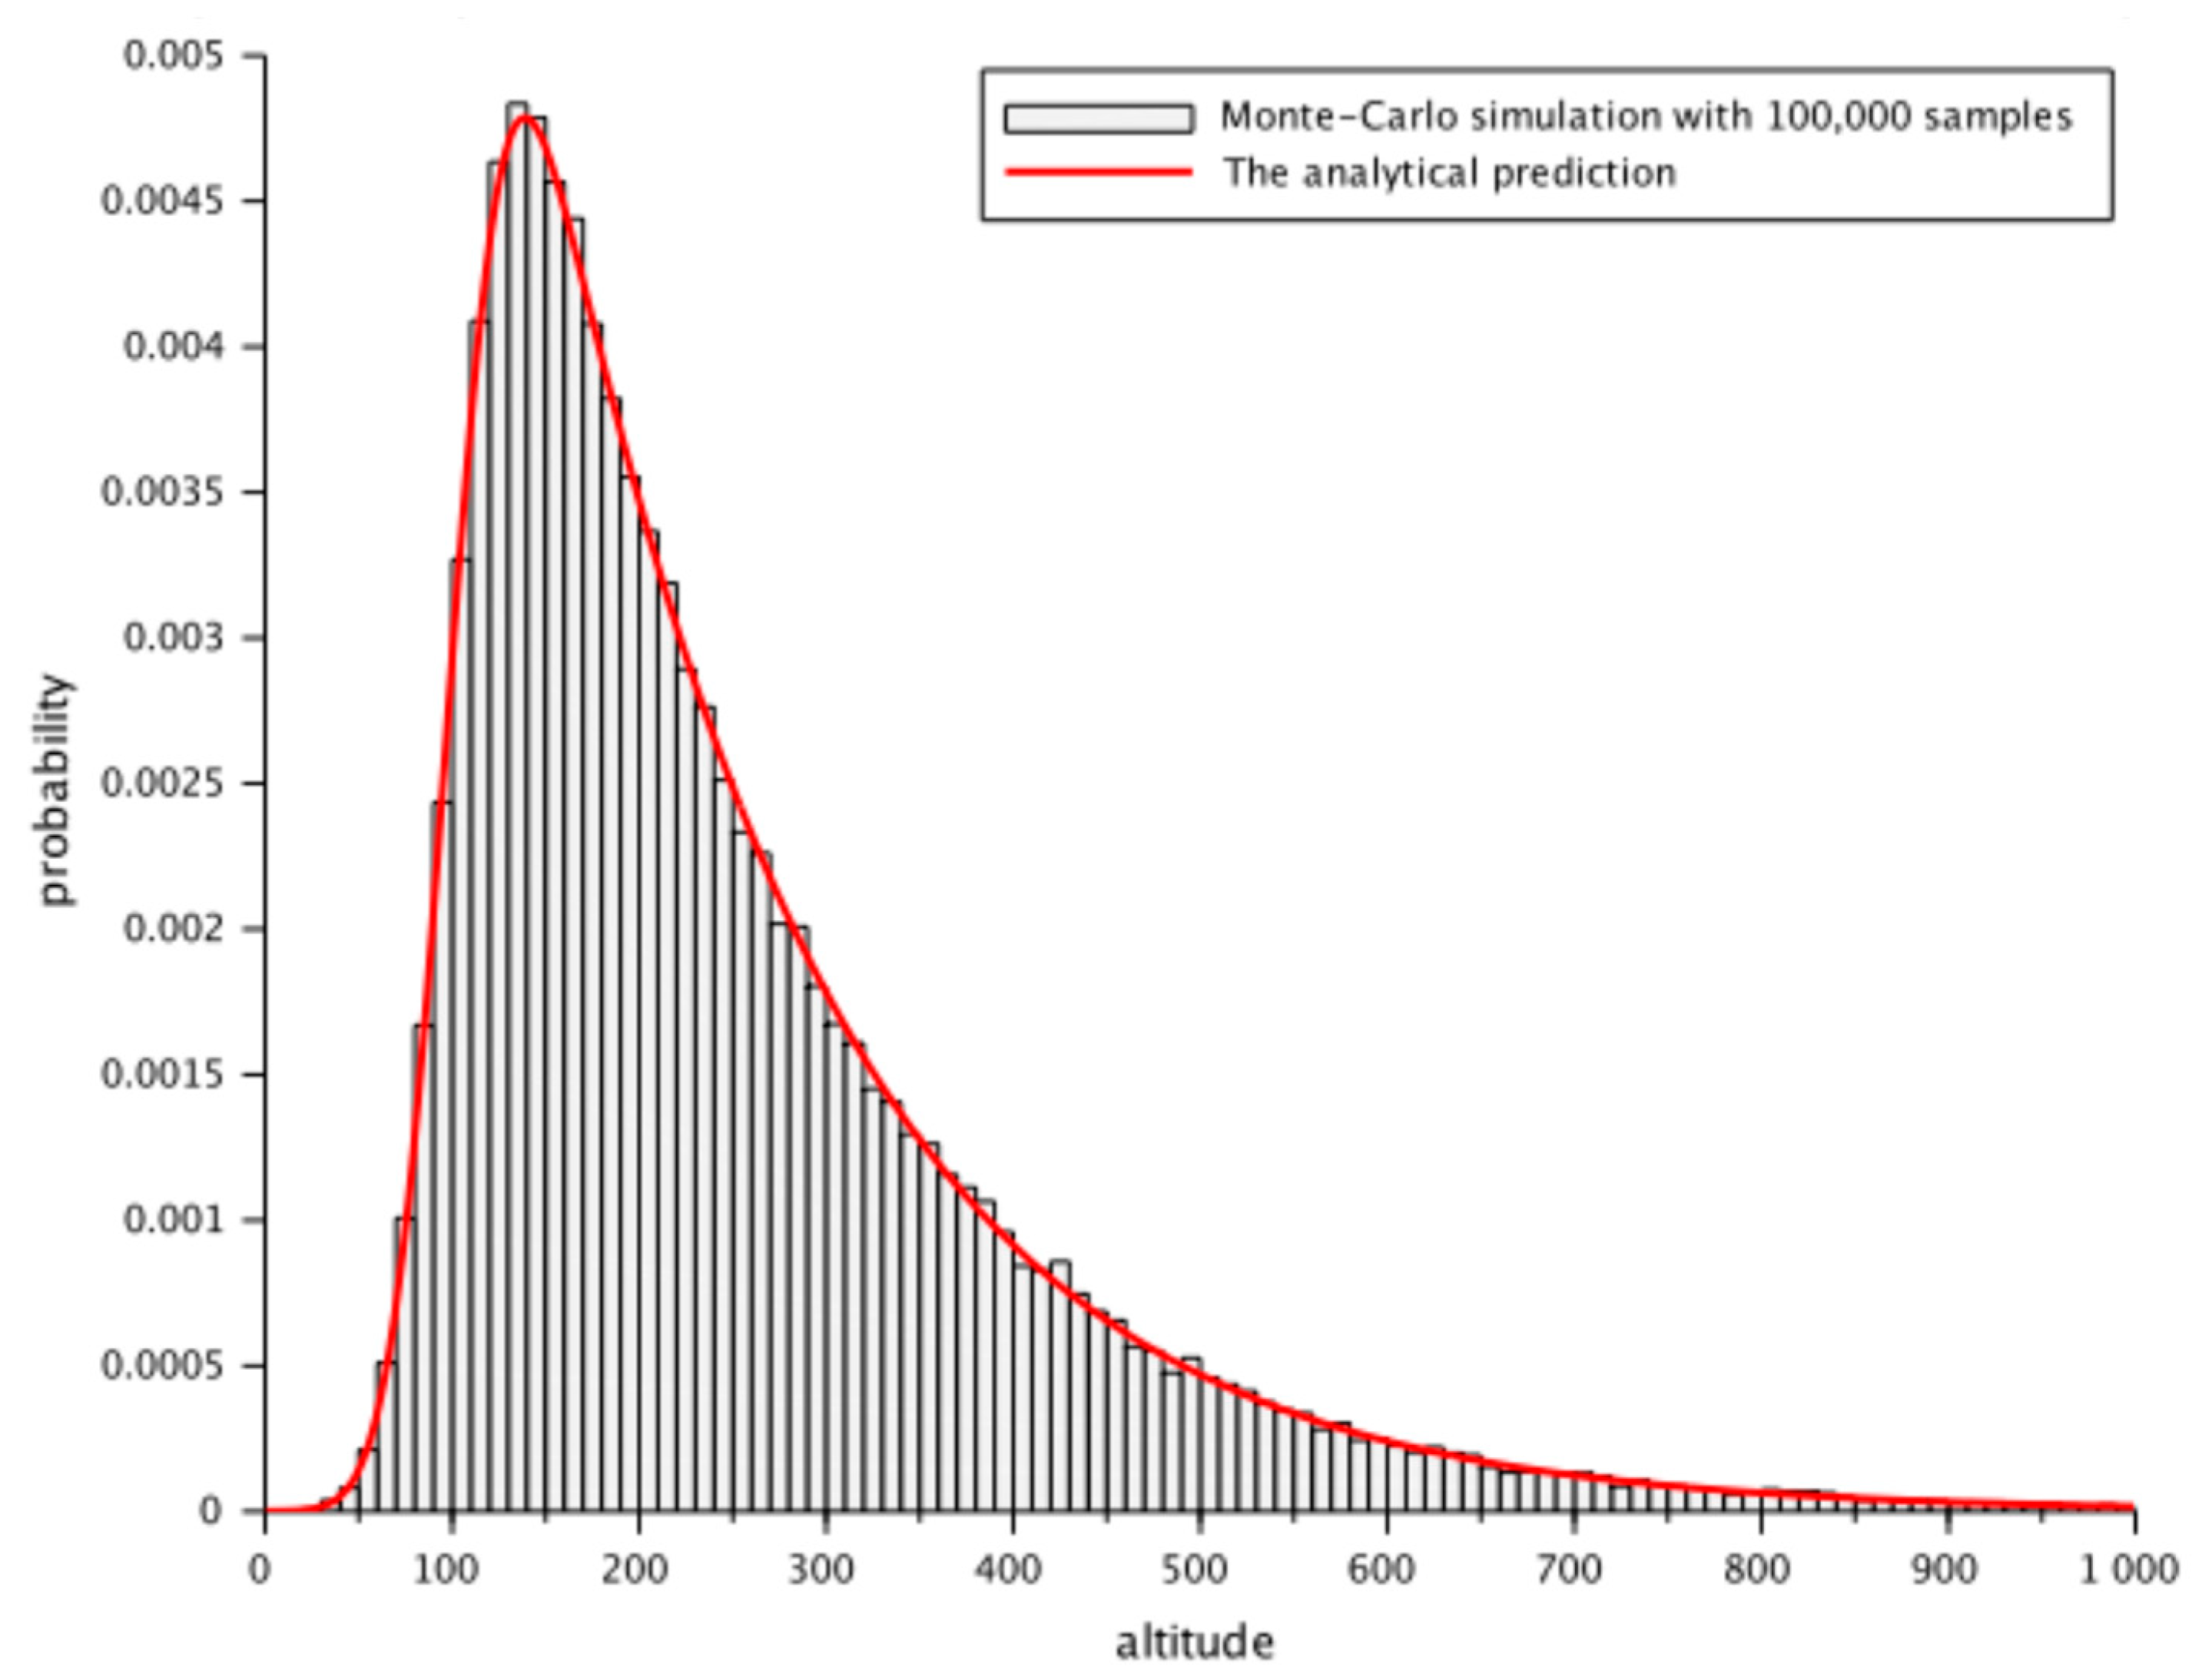
Flight-height distributions were modelled using the Exponentially Modified Gaussian (EMG) distribution. Seasonal distributions derived from GPS and visual data were bootstrapped to account for inter-individual variation. These distributions were integrated into a stochastic Monte-Carlo implementation of the Band collision risk model [1] to estimate collision probability for different turbine configurations. Mathematical details of the EMG formulation and simulation procedure are provided in the Supplementary Materials (Equations S1–S3).
Figure 5.
Example of the Exponentially Modified Gaussian EMG in Monte-Carlo simulation and analytical prediction.
Figure 5.
Example of the Exponentially Modified Gaussian EMG in Monte-Carlo simulation and analytical prediction.
3. Results
3.1. Flight Height Distributions
In periods of breeding and wintering the flight height distributions were clearly unimodal (Figure 6).
The mode was lowest in the wintering period when buzzards are often static and fly at low altitudes between two stationary points. In the breeding season the altitude of the fight slightly increases together with the need for more food for grooving offspring and increased energetic needs of breeding birds.
The most significant difference in altitudes of flight and collision probability respectively were in the period of seasonal migration when common buzzards fly long distances by transit flights.
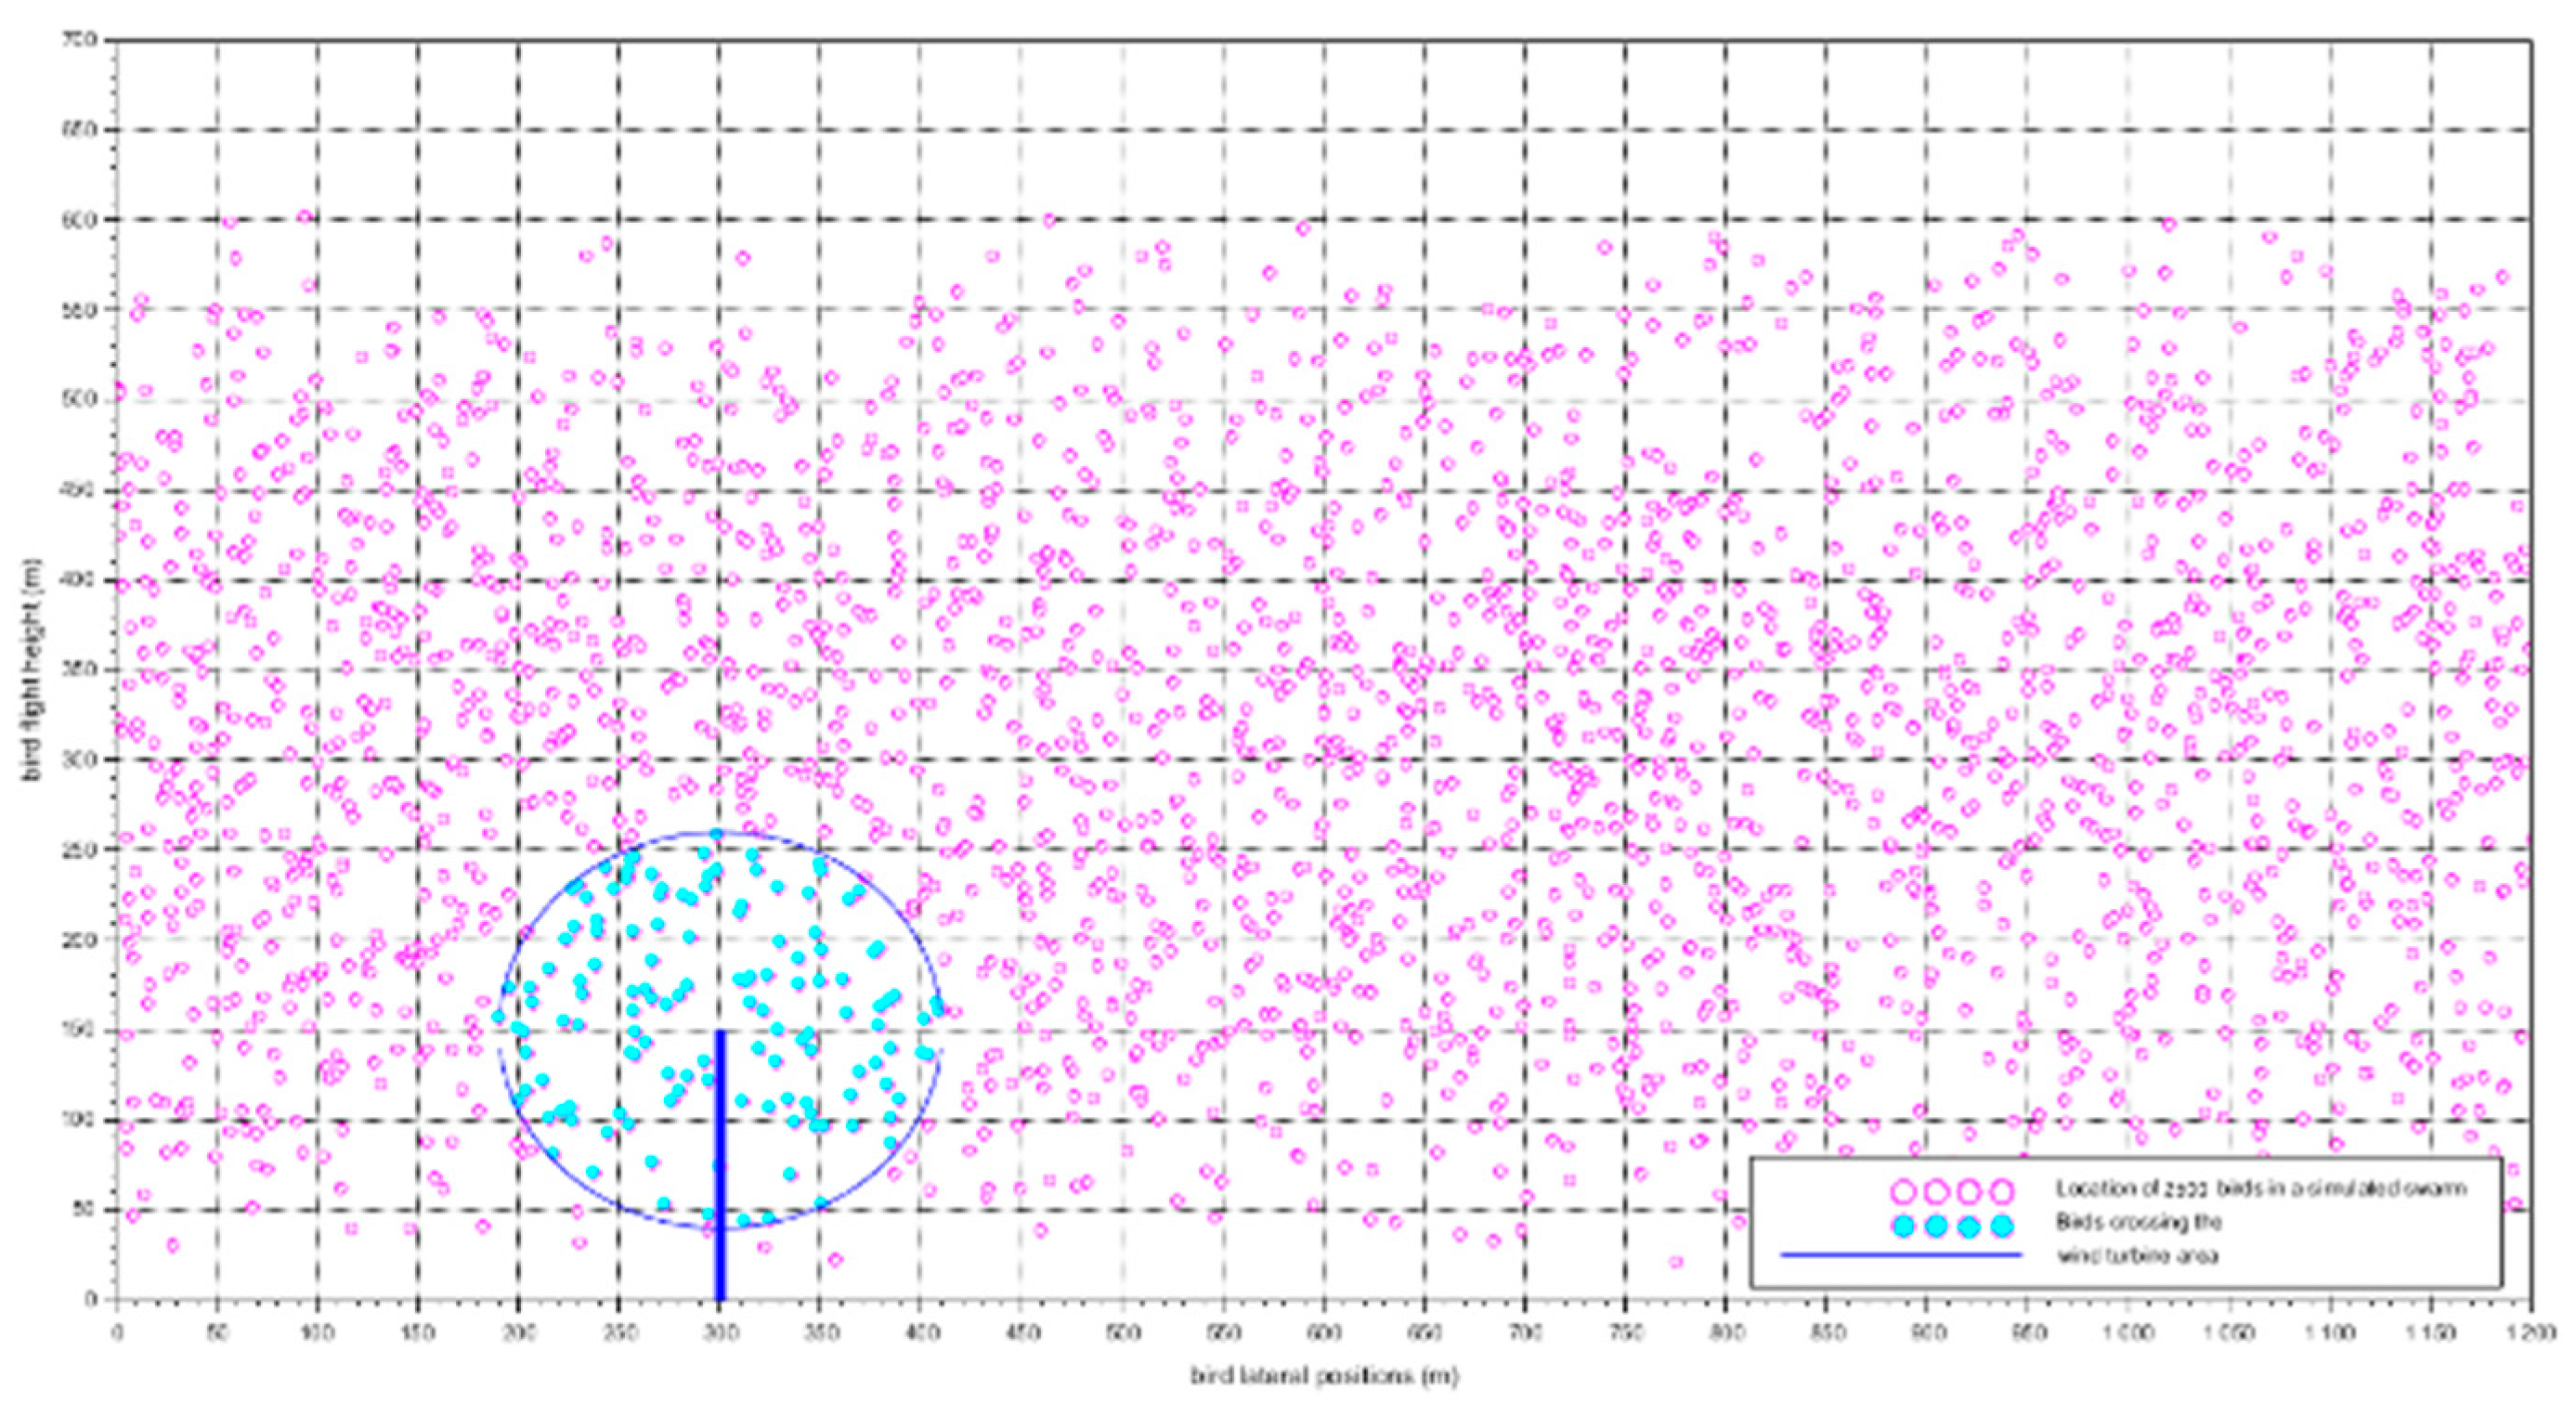
The collision probability (CP) varied between turbine models (Figure 9, Figure 10 and Figure 11). For the distribution of the birds in air volume of the space around the wind turbines we obtained a Monte-Carlo simulation for every model of wind turbines and their dimensions respectively.
Figure 7.
Stochastic model by Monte-Carlo simulations of 2500 birds’ distribution in air volume around a wind turbine used in our model.
Figure 7.
Stochastic model by Monte-Carlo simulations of 2500 birds’ distribution in air volume around a wind turbine used in our model.
3.2. Seasonal Variations in Number of Birds at the Risk Zone
For seasonal variation in the collision probability, we have applied data from a permanent Vantage Point (VP) used for monitoring of the birds in the study are in the middle of the area where 114 wind turbines operate in the moment. The data included in the evaluation of number of birds passing through the territory in different seasons as well as timing, scope and all details of the methodology of visual observations is published in a dedicated to this project web site: https://kaliakrabirdmonitoring.eu/ . According to this data the number of common buzzards passing the area of one single wind turbine with a range around the VP 4 km diameter varies between 1169 and 4129 buzzards. in the period 2019 – 2023. For our model we have applied an average number of 2355 common buzzards passing per year the space of one turbine within an area with diameter 4 km.
Figure 8.
Predicted number of Common Buzzards (Buteo buteo) entering the rotor-swept zone of wind turbines with different rated capacities during (A) breeding, (B) migration, and (C) wintering periods, based on Monte Carlo simulations using seasonal flight-height distributions. Horizontal lines show mean ± SD annual crossings; open squares indicate non-avoidance fatality rates; dashed line represents the approximate prediction curve.
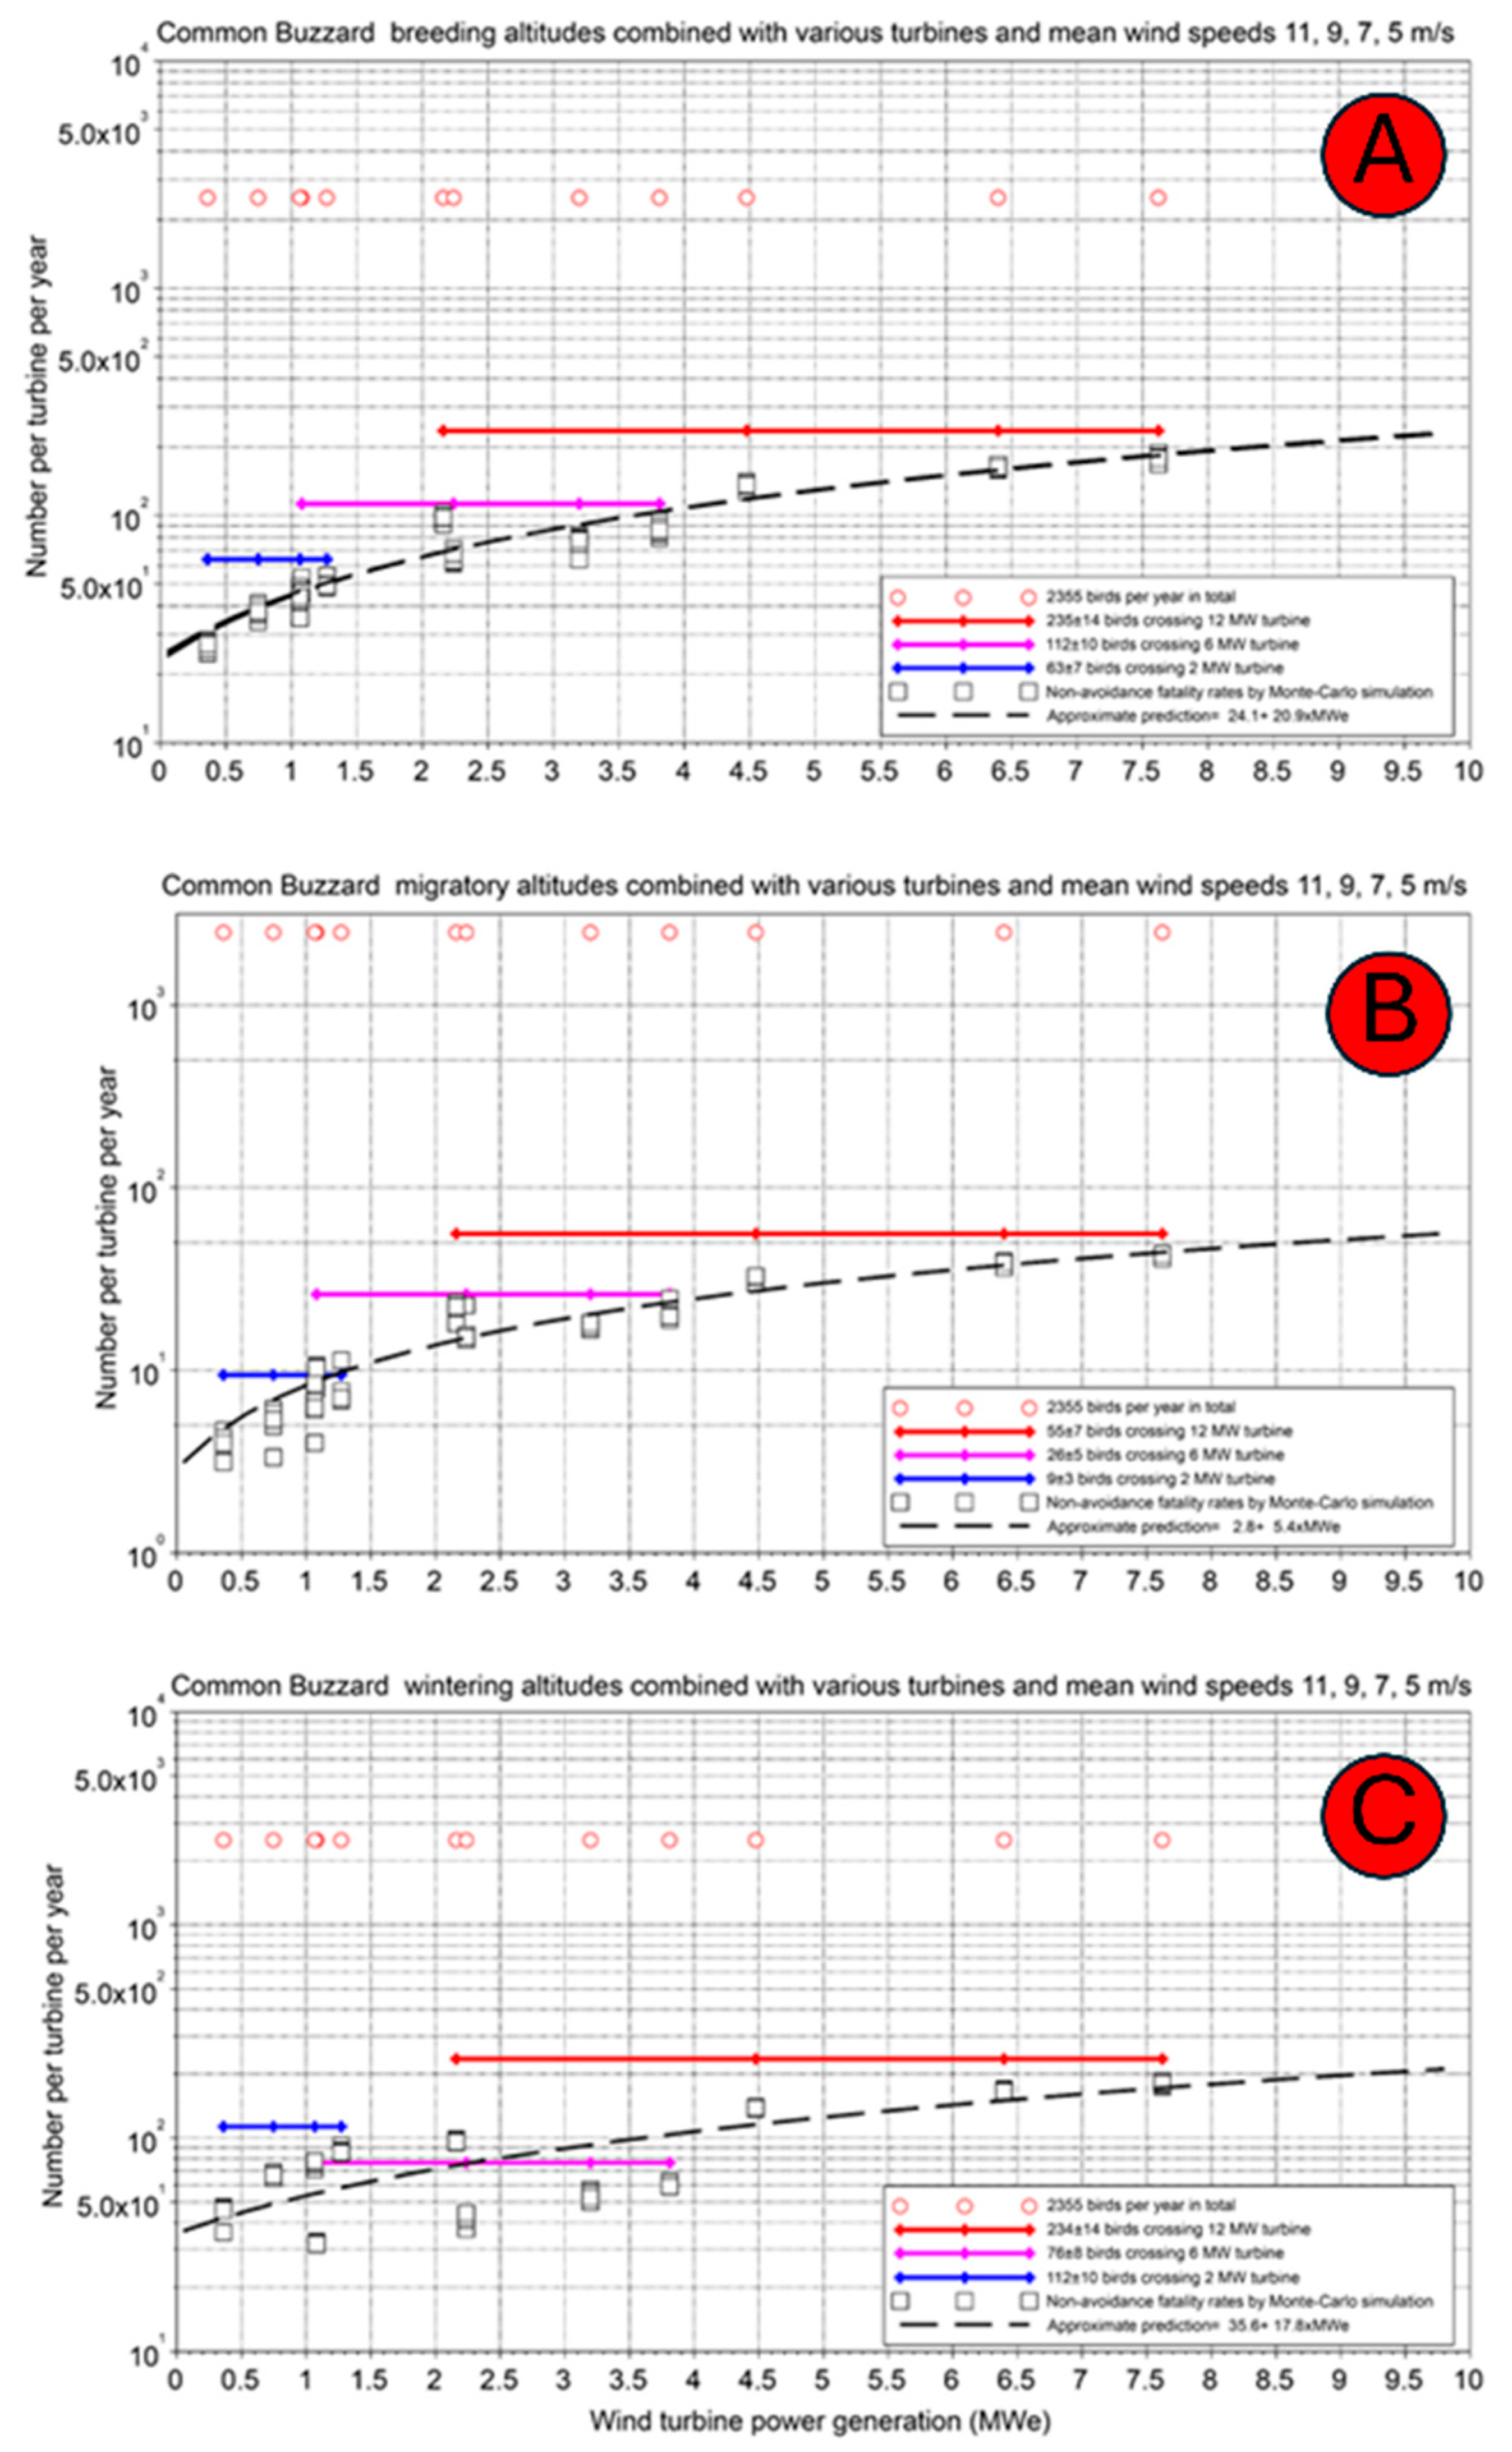
Based on the data from permanent VP observations and data from GPS tracking of eight common buzzards in the last 3 years we have obtained numbers of buzzards crossing the risky zone per every period of the life cycle of the species.
The model estimated the highest number of passing within the risky zone for wintering period when the number of buzzards in risk are between 76 and 234 for turbines of 2, 6 and 12 MW respectively. Similar values were estimated for common buzzards in the breeding season with variations between 64 and 236
The lowest number of birds in risky zones in the migratory season when 6 to 12 common buzzards were in the risky zone of a 2 MW turbine. For bigger turbines with bigger capacity this number increases and reaches 25 and 55 buzzards per season respectively for 6MW and 12 MW turbines (Figure 9, Figure 10 and Figure 11).
Figure 9.
Number of potential added by collision with wind turbines mortality calculated for common buzzards in breeding season.
Figure 9.
Number of potential added by collision with wind turbines mortality calculated for common buzzards in breeding season.
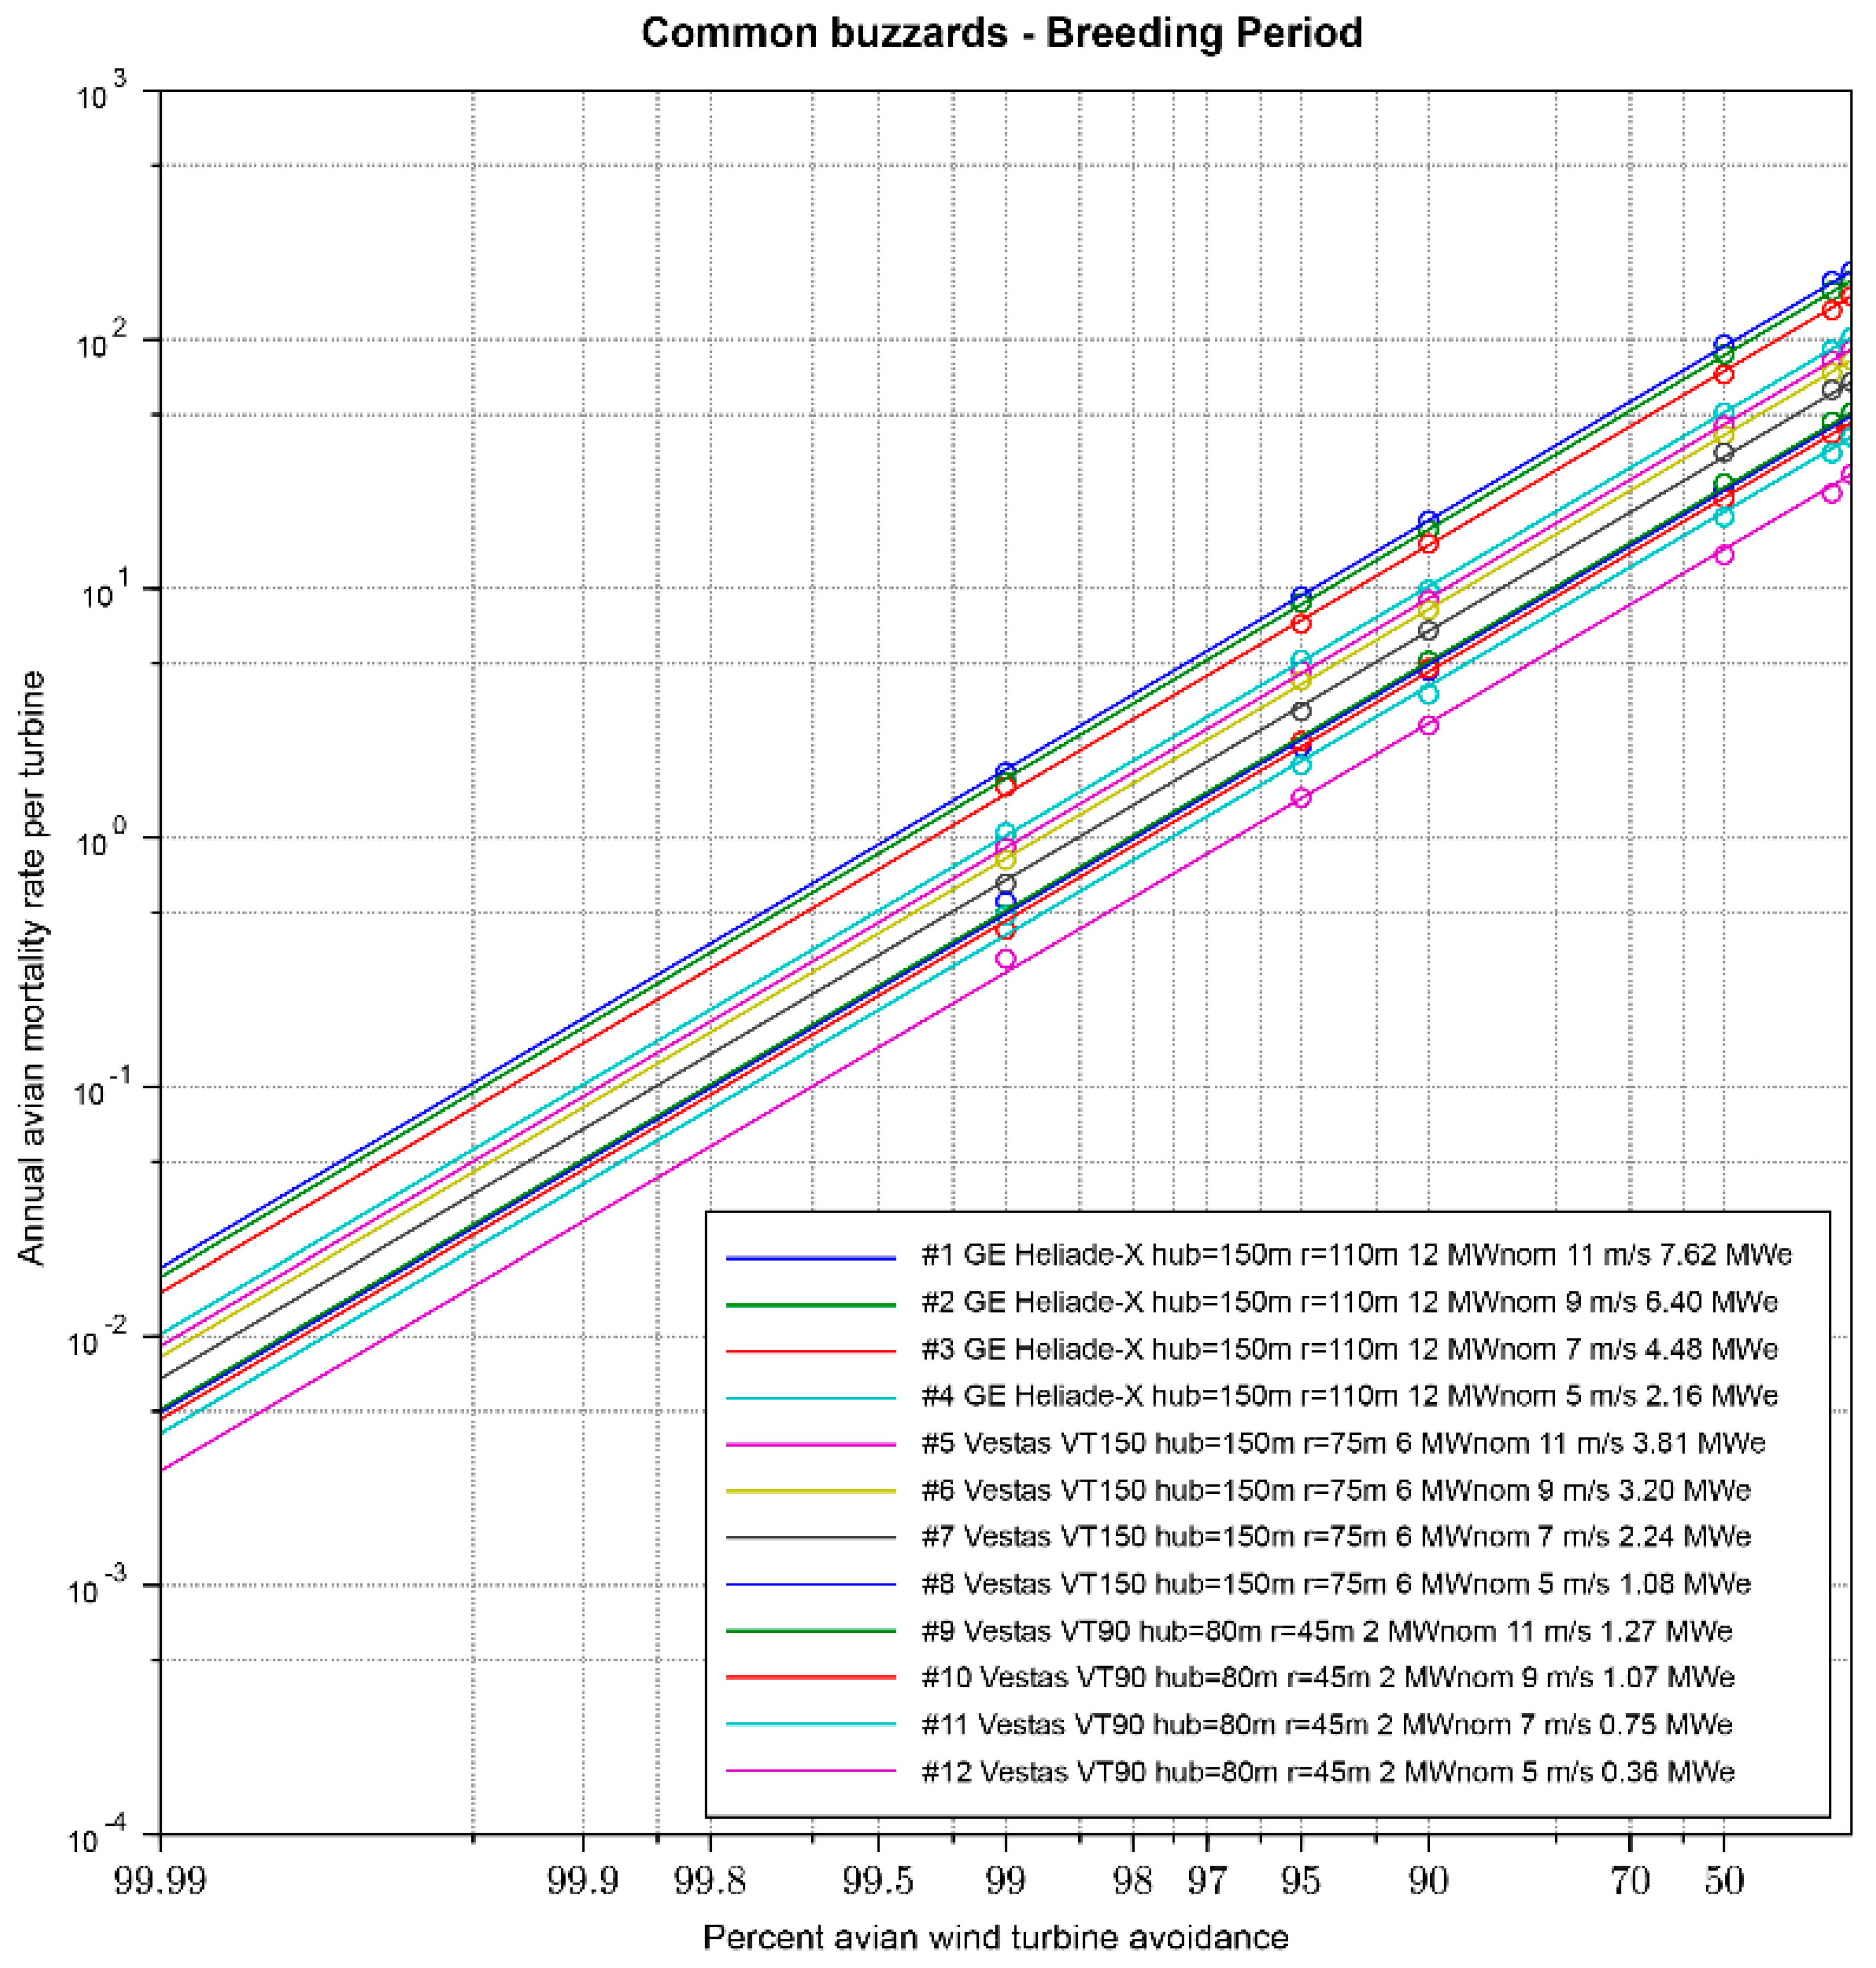
Figure 10.
Number of potential added by collision with wind turbines mortality calculated for common buzzards in migratory season.
Figure 10.
Number of potential added by collision with wind turbines mortality calculated for common buzzards in migratory season.
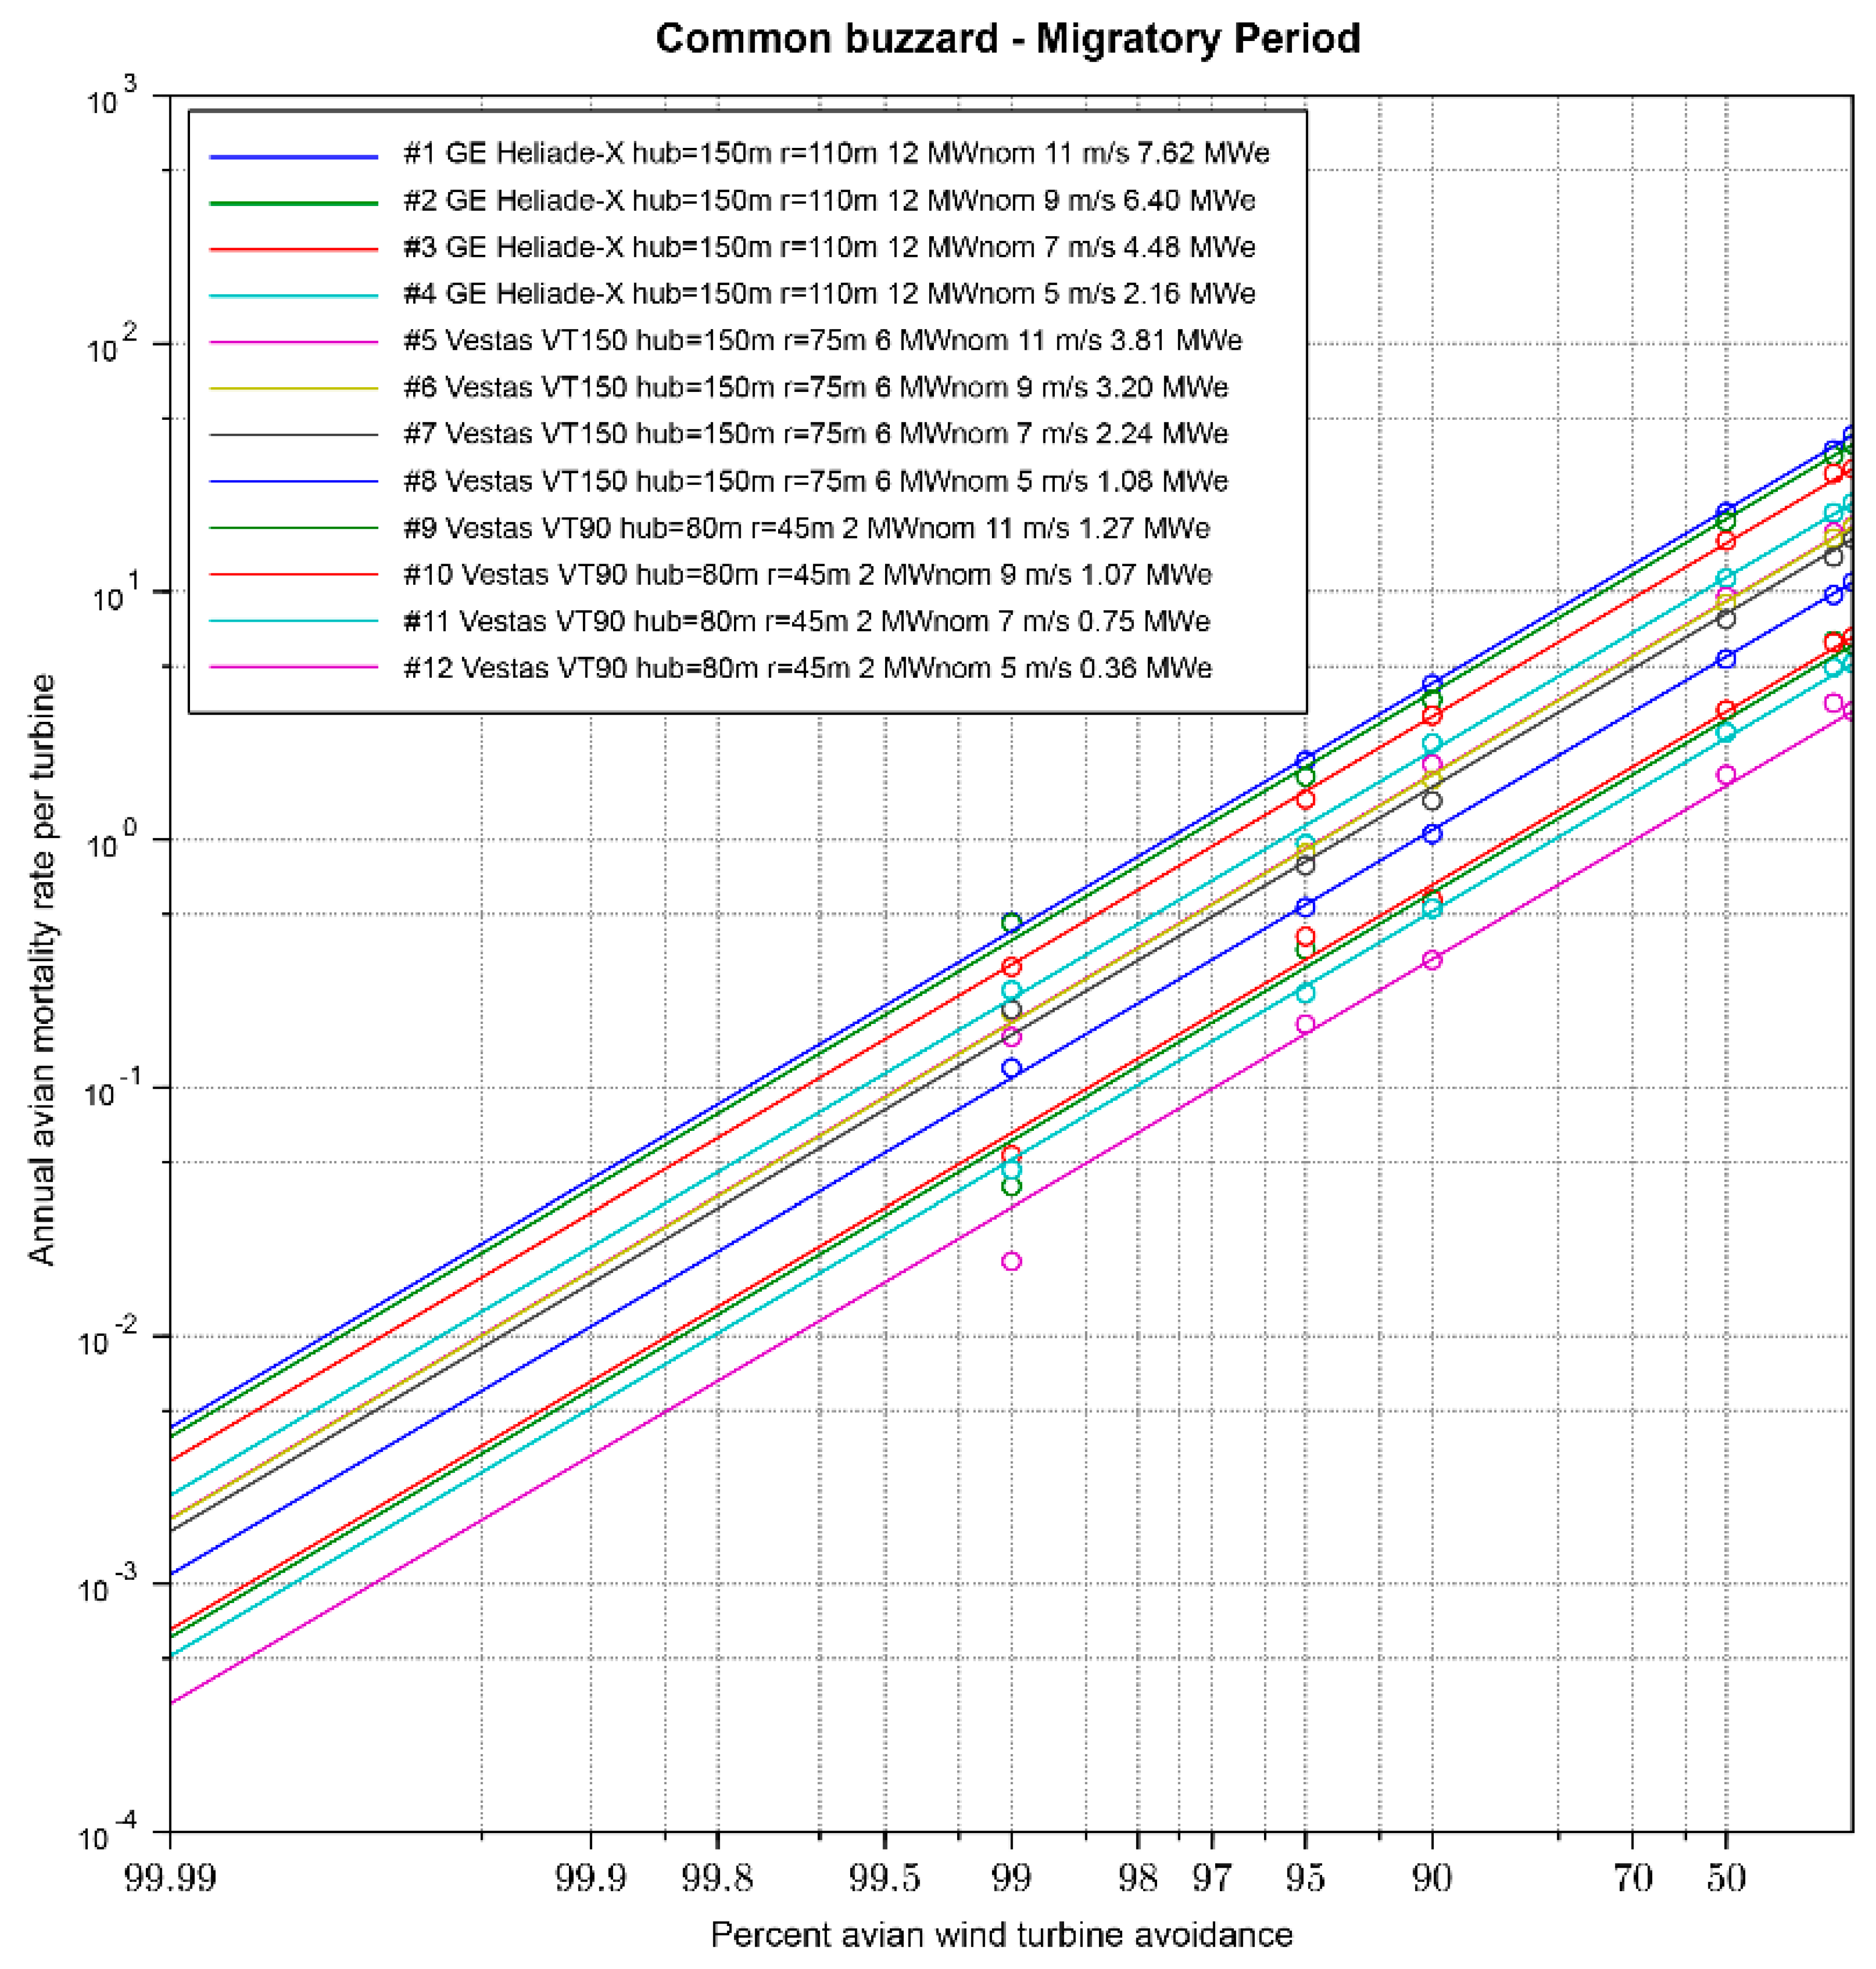
Figure 11.
Number of potential added by collision with wind turbines mortality calculated for common buzzards in migratory season.
Figure 11.
Number of potential added by collision with wind turbines mortality calculated for common buzzards in migratory season.

Systematic collision victims monitoring organized and performed by the Integrated System for Bird Protection in Kaliakra SPA territory (Table 3) allows comparison of the predicted by our model collisions with the established in site real mortality after 6 years of systematic searches. The data from the real collision victims support the results of our simulation. The low mortality discovered by carcass searches results indicate high avoidance rate of this species – common buzzard. In the figures above it appears in the top of best avoiding collision species!
4. Discussion
We found that collision probability for Common Buzzards (Buteo buteo) in the studied wind farm area was low, with clear seasonal variation: the highest estimated risk occurred during wintering and breeding periods, when flights were more frequently within the rotor-swept zone, and the lowest during migration, when birds flew at higher altitudes. These modelled probabilities closely matched carcass search results from 114 turbines over multiple years, indicating a high avoidance rate in this species.
Our findings are consistent with the general pattern reported for Common Buzzards in Brandenburg, Germany, where collision risk was shown to be influenced by proximity to open habitats and specific landscape features [38]. In both cases, buzzards were more exposed when flying low over open farmland, particularly outside migration periods. However, the absolute mortality rates in our study area were lower than those extrapolated in the PROGRESS study [39]. One reason for this difference may be the more dispersed turbine placement in our site, with average inter-turbine distances exceeding 5 km, reducing cumulative risk.
Comparisons with Finnish studies on Golden Eagles (Aquila chrysaetos) [36,37] reveal differences in species-specific responses. While Golden Eagles generally avoid turbines and maintain high survival in turbine-free areas, they may experience population-level impacts when mortality increases even slightly, due to their low reproductive rate. Common Buzzards, with higher reproductive potential and greater habitat flexibility, may adapt their flight behaviour seasonally to minimise collision risk, as indicated by our observed migration altitudes.
Evidence from modelling studies in the UK and Scotland [40,41] shows that spatial planning can significantly reduce collision risk for large raptors by identifying high-use flight corridors and avoiding turbine placement in these areas. Our results support such an approach and underline the importance of incorporating detailed species-specific flight height data into Environmental Impact Assessments. For species like the Common Buzzard, mitigation could focus on seasonal adjustments—such as targeted shutdowns in winter and breeding seasons—rather than year-round restrictions.
In summary, the close match between predicted and observed mortality suggests that combining high-resolution GPS tracking with systematic carcass monitoring provides a robust framework for assessing collision risk. Differences between our findings and those from other regions highlight the need to account for species-specific ecology, seasonal behaviour, and local turbine configuration in wind farm impact assessments.
5. Conclusions
Our study demonstrates that collision risk for Common Buzzards in the investigated wind farm area is low, with marked seasonal variation driven by flight-height behaviour. The highest potential risk occurs during wintering and breeding seasons, when birds more often enter the rotor-swept zone, while migration periods pose the lowest risk due to higher flight altitudes.
The strong agreement between modelled probabilities and observed carcass data confirms that integrating high-resolution GPS tracking with systematic mortality monitoring can produce reliable collision risk estimates. This approach enables more precise, species-specific Environmental Impact Assessments and can inform targeted mitigation, such as seasonal turbine shutdowns, that balance renewable energy development with raptor conservation.
Our findings underline the importance of tailoring wind farm planning and mitigation measures to the ecology and seasonal behaviour of focal species, and of validating predictive models with long-term field data.
Supplementary Materials
The following supporting information can be downloaded at the website of this paper posted on Preprints.org. Equations S1–S3 present the EMG formulation and simulation procedure. Figure S1 shows an example of the Exponentially Modified Gaussian (EMG) in Monte Carlo simulation and analytical prediction. Code S1 contains the SciLab script used for the Monte Carlo simulation.
Author Contributions
Conceptualization, P.Z. H.N.; methodology, N.Y. , H.N..; software, N.Y.; validation, H.N., P.Z., N.Y.; field work and data collection N.Y., K.B.; writing—original draft preparation, N.Y., H.N. , writing—review and editing, N.Y..; visualization, N.Y..; supervision, P.Z..; project administration, P.Z..; funding acquisition, P.Z. All authors have read and agreed to the published version of the manuscript.
Funding
This research received no external funding.
Institutional Review Board Statement
The study was performed in accordance with the legal requirements of Bulgarian Ministry of |Environment and Waters for catching and marking birds.
Data Availability Statement
The data presented in this study are available on request from the corresponding author. The data are stored in a shared Movebank project and are not publicly available due to restrictions related to sensitive species location information.
Acknowledgments
We are grateful to Integrated System for Protection of Birds in Kaliakra SPA (https://kaliakrabirdmonitoring.eu/ ) for the support and long term monitoring data provided for our analysis.
Conflicts of Interest
The authors declare no conflicts of interest. The funders had no role in the design of the study; in the collection, analyses, or interpretation of data; in the writing of the manuscript; or in the decision to publish the results.
References
- Band, W. Windfarms and birds: calculating a theoretical collision risk assuming no avoiding action. Scottish Natural Heritage, 2000.
- European Commission. Commission Staff Working Document. Implementing the REPower EU Action Plan: Investment Needs, Hydrogen Accelerator and Achieving the Bio-methane Targets. 2022.
- WindEurope. Wind Energy in Europe. 2022 Statistics and the Outlook for 2023–2027. 2023.
- Erickson, W.P.; Johnson, G.D.; Strickland, M.D.; Young, D.P.; Sernka, K.J.; Good, R.E. Avian Collisions with Wind Turbines: A Summary of Existing Studies and Comparisons to Other Sources of Avian Collision Mortality in the United States. National Wind Coordinating Committee, 2001.
- Madders, M.; Whitfield, D.P. Upland raptors and the assessment of wind farm impacts. Ibis 2006, 148, 43–56. [Google Scholar] [CrossRef]
- Whitfield, D.P.; Madders, M. A review of the impacts of wind farms on hen harriers Circus cyaneus and an estimation of collision avoidance rates. Natural Research Information Note 1, 2006, 1–33.
- de Lucas, M.; Janss, G.F.E.; Ferrer, M. Birds and Wind Farms: Risk Assessment and Mitigation. Quercus: Madrid, Spain, 2008; pp. 1–199.
- de Lucas, M.; Ferrer, M.; Bechard, M.J.; Muñoz, A.R. Griffon vulture mortality at wind farms in southern Spain: Distribution of fatalities and active mitigation measures. Biol. Conserv. 2012, 147, 184–189. [Google Scholar] [CrossRef]
- de Lucas, M.; Ferrer, M.; Janss, G.F.E. Using wind tunnels to predict bird mortality in wind farms: The case of griffon vultures. PLoS ONE 2012, 7, e48092. [Google Scholar] [CrossRef]
- Whitfield, D.P. Collision Avoidance of Golden Eagles at Wind Farms under the ‘Band’ Collision Risk Model. Natural Research Information Note 3; Natural Research Ltd: Banchory, UK, 2010; pp. 1–32. [Google Scholar]
- Ferrer, M.; de Lucas, M.; Janss, G.F.E.; Casado, E.; Muñoz, A.R.; Bechard, M.J.; Calabuig, C.P. Weak relationship between risk assessment studies and recorded mortality in wind farms. J. Appl. Ecol. 2012, 49, 38–46. [Google Scholar] [CrossRef]
- Dahl, E.L.; May, R.; Hoel, P.L.; Bevanger, K.; Pedersen, H.C.; Røskaft, E.; Stokke, B.G. White-tailed eagles (Haliaeetus albicilla) at the Smøla wind-power plant, Norway: Avoidance of turbines and active flight behaviour. Wildl. Biol. 2013, 18, 389–403. [Google Scholar]
- Hunt, G.; Watson, J.W. Addressing challenges to golden eagle monitoring in the western United States. J. Raptor Res. 2016, 50, 399–412. [Google Scholar]
- Thaxter, C.B.; Buchanan, G.M.; Carr, J.; Butchart, S.H.M.; Newbold, T.; Green, R.E.; Tobias, J.A.; Foden, W.B.; O’Brien, S.; Pearce-Higgins, J.W. Bird and bat species’ global vulnerability to collision mortality at wind farms revealed through a trait-based assessment. Proc. R. Soc. B 2017, 284, 20170829. [Google Scholar] [CrossRef]
- Katzner, T.E.; Brandes, D.; Miller, T.; Lanzone, M.; Maisonneuve, C.; Tremblay, J.A.; Mulvihill, R.; Merovich, G.T. Status, biology and conservation priorities for North America’s eastern golden eagle (Aquila chrysaetos) population. Auk 2012, 129, 168–176. [Google Scholar]
- Watson, J.W.; Duff, A.A.; Davies, R.W. Home range and resource selection by adult golden eagles during the breeding season in the Southern Great Basin. J. Raptor Res. 2014, 48, 93–109. [Google Scholar]
- Reid, T.; Krüger, S.; Whitfield, D.P.; Amar, A. Using spatial analyses of bearded vulture movements in southern Africa to inform wind turbine placement. J. Appl. Ecol. 2015, 52, 881–892. [Google Scholar] [CrossRef]
- Vasilakis, D.P.; Whitfield, D.P.; Kati, V.; Kret, E.; Kafetzis, A.; Thanou, E.; Poirazidis, K. Reconciling endangered species conservation with wind farm development: Cinereous vultures (Aegypius monachus) in south-eastern Europe. Biol. Conserv. 2016, 196, 10–17. [Google Scholar] [CrossRef]
- Vasilakis, D.P.; Whitfield, D.P.; Schindler, S.; Poirazidis, K.; Kati, V. Range use, habitat selection, and roosting of an insular population of cinereous vultures (Aegypius monachus) in south-eastern Europe. J. Ornithol. 2017, 158, 173–187. [Google Scholar]
- Barrios, L.; Rodríguez, A. Behavioural and environmental correlates of soaring-bird mortality at on-shore wind turbines. J. Appl. Ecol. 2004, 41, 72–81. [Google Scholar] [CrossRef]
- Dürr, T. Vogelverluste an Windenergieanlagen in Deutschland – Daten aus der zentralen Fundkartei der Staatlichen Vogelschutzwarte im Landesumweltamt Brandenburg. Ber. Vogelschutz 2017, 54, 111–123. [Google Scholar]
- Smallwood, K.S.; Thelander, C.G. Bird mortality in the Altamont Pass Wind Resource Area, California. J. Wildl. Manag. 2008, 72, 215–223. [Google Scholar] [CrossRef]
- Loss, S.R.; Will, T.; Marra, P.P. Estimates of bird collision mortality at wind facilities in the contiguous United States. Biol. Conserv. 2013, 168, 201–209. [Google Scholar] [CrossRef]
- Whitfield, D.P.; Urquhart, B. Deriving collision avoidance rates for red kites Milvus milvus. Scottish Nat. Herit. Comm. Rep. 2015, 1–30. [Google Scholar]
- Whitfield, D.P. Turbine shutdown systems—review and application at SNWF. Scottish Nat. Herit. Comm. Rep. 2018, 1–62. [Google Scholar]
- Ross-Smith, V.H.; Thaxter, C.B.; Masden, E.A.; Shamoun-Baranes, J.; Burton, N.H.K.; Wright, L.J.; Maclean, I.M.D. The influence of different flight strategies on collision risk for seabirds at offshore wind farms. J. Appl. Ecol. 2016, 53, 1676–1685. [Google Scholar]
- Pfeiffer, T.; Meyburg, B.U. Mortality of birds at wind turbines in central Europe: results from systematic carcass searches. J. Ornithol. 2022, 163, 867–879. [Google Scholar] [CrossRef]
- Garvin, J.C.; Cooper, J.L.; Erickson, W.P.; Huso, M.M.P.; Good, R.E. A framework for assessing the population-level impacts of wind energy development on birds and bats. Biol. Conserv. 2024, 291, 110474. [Google Scholar]
- Huso, M.M.P.; Dalthorp, D.; Miller, T.A.; Bruns, D.; Madsen, L.; Korner-Nievergelt, F.; Rabie, P.A. Estimating bird and bat fatality at wind facilities: a practical guide to performing estimators. J. Appl. Ecol. 2021, 58, 1284–1290. [Google Scholar] [CrossRef]
- Anderson, R.; Morrison, M.L.; Sinclair, K.; Strickland, M.D. Avian collision risk models for wind energy impact assessments. Environ. Impact Assess. Rev. 2022, 93, 106715. [Google Scholar]
- Johnston, A.; Cook, A.S.C.P.; Wright, L.J.; Humphreys, E.M.; Burton, N.H.K. Modelling flight heights of marine birds to more accurately assess collision risk with offshore wind turbines. J. Appl. Ecol. 2014, 51, 31–41. [Google Scholar] [CrossRef]
- Schaub, T.; Liechti, F.; Jenni, L.; Steuri, T.; Weber, D.; Kestenholz, M. Estimating collision risk of birds with wind turbines using a multilayered approach. Ibis 2020, 162, 520–534. [Google Scholar] [CrossRef]
- Beston, J.A.; Diffendorfer, J.E.; Loss, S.R.; Johnson, D.H. Prioritizing avian species for their risk of population-level consequences from wind energy development. Biol. Conserv. 2016, 206, 349–356. [Google Scholar] [CrossRef]
- Bellebaum, J.; Korner-Nievergelt, F.; Dürr, T.; Mammen, U. Wind turbine fatalities approach a level of concern in a raptor population. J. Nat. Conserv. 2013, 21, 394–400. [Google Scholar] [CrossRef]
- McGregor, R.M.; Furness, R.W.; Aumonier, A.; Hueppop, O.; Hüppop, K.; Garthe, S.; Leaper, G.; Searle, K.; Maclean, I.M.D. A stochastic collision risk model for seabirds in flight. Scott. Mar. Freshw. Sci. 2018, 9, 1–120. [Google Scholar]
- Koskimies, P.; Rönkä, N.; Valkama, J.; Saurola, P.; Asanti, T.; Ollila, T.; Lehikoinen, A. Survival estimates of GPS-tagged adult Golden Eagles (Aquila chrysaetos) breeding in Finland. Available online: https://www.researchgate.net/publication/386164922_Survival_estimates_of_GPS-tagged_adult_Golden_Eagles_Aquila_chrysaetos_breeding_in_Finland (accessed on 31 July 2025).
- European Environment Agency (EEA). Biogeographical regions in Europe. Available online: https://www.eea.europa.eu/data-and-maps/data/biogeographical-regions-europe-3 (accessed on 8 August 2025).
- Karney, C. F. F.; (2019). GeographicLib, Version 1.51. Available online: https://geographiclib.sourceforge.io/1.51 (accessed on 8 August 2025).
- Rapp, R.H. Use of potential coefficient models for geoid undulation determinations using a spherical harmonic representation of the height anomaly/geoid undulation difference. Journal of Geodesy 1997, 71, 282–289. [Google Scholar] [CrossRef]
- Smith, D.A. There is no such thing as "The" EGM96 geoid: Subtle points on the use of a global geopotential model. IGeS Bulletin 1998, 8, 17–27. [Google Scholar]
- BirdLife International. 2022. Buteo buteo. The IUCN Red List of Threatened Species 2022: e.T22695695A199849020.
- Morrison, M.L.; Johnson, G.D.; Shaffer, J.A.; Nichols, J.D. Wildlife Study Design. Springer, New York, NY, USA, 2008. [CrossRef]
Figure 2.
Schematic of study design and data flow.
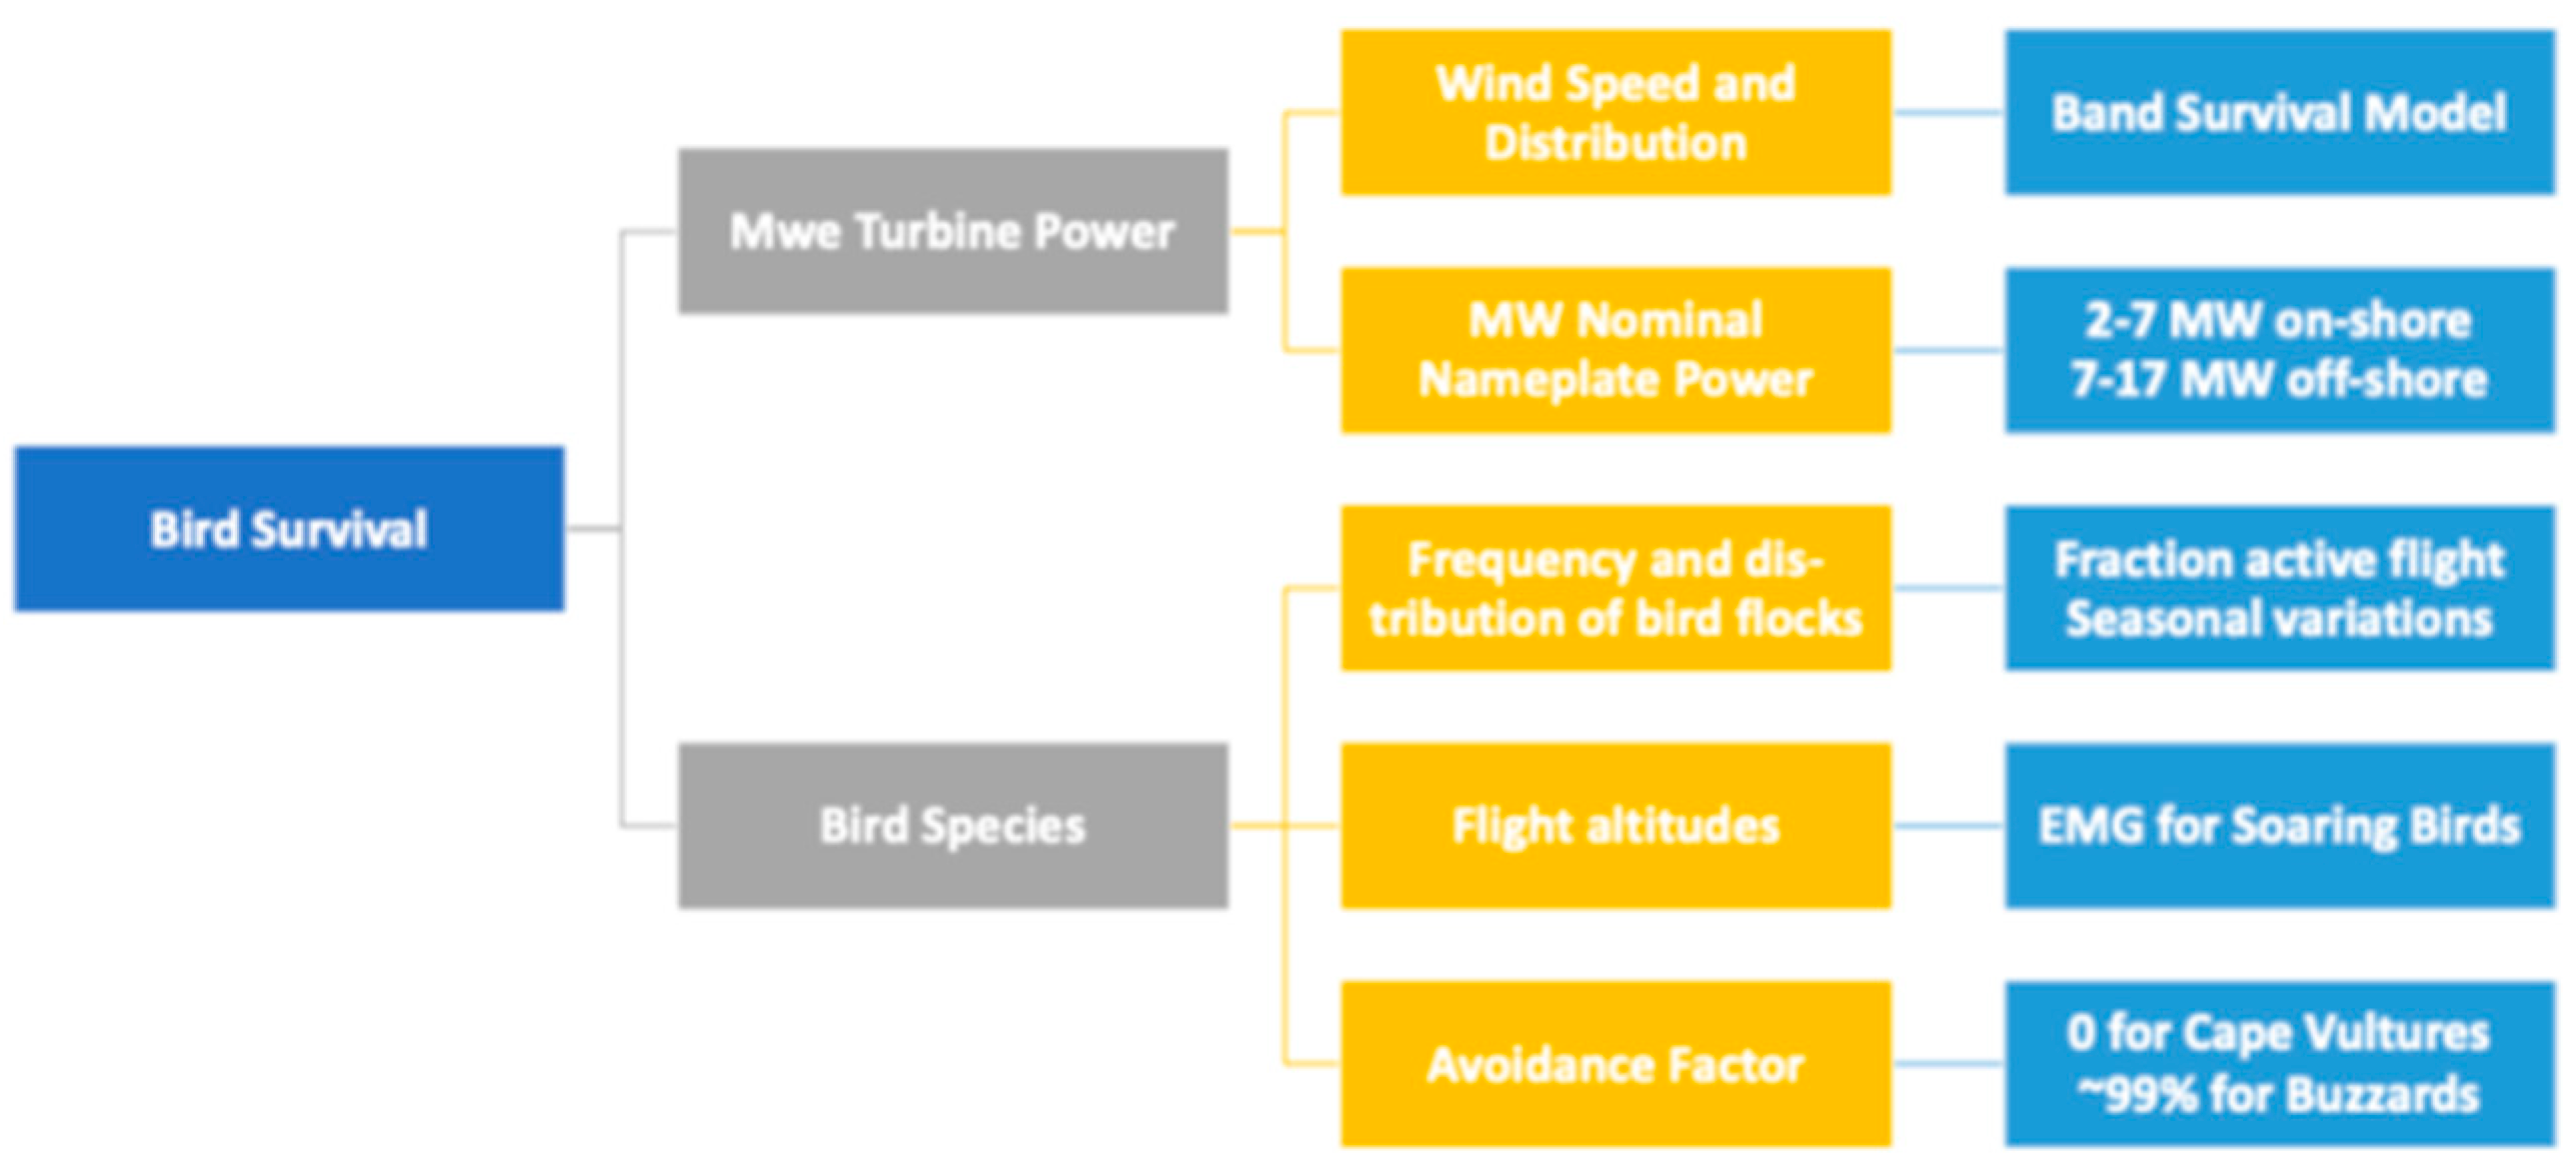
Figure 6.
Seasonal variation in flight height distributions of Common Buzzards in relation to wind turbine rotor-swept zones.(A) Breeding period: probability distribution of flight altitude above ground with observed data and fitted Exponentially Modified Gaussian (EMG) model. (B) Migration period: most flights occur at higher altitudes, reducing overlap with turbine rotor zone.(C) Wintering period: lower flight altitudes increase overlap with the rotor-swept zone. The orange dashed lines represent the lower and upper limits of rotor height for typical turbines in the study area. The rotor icon in the bottom-right corner of each panel visualizes this range.
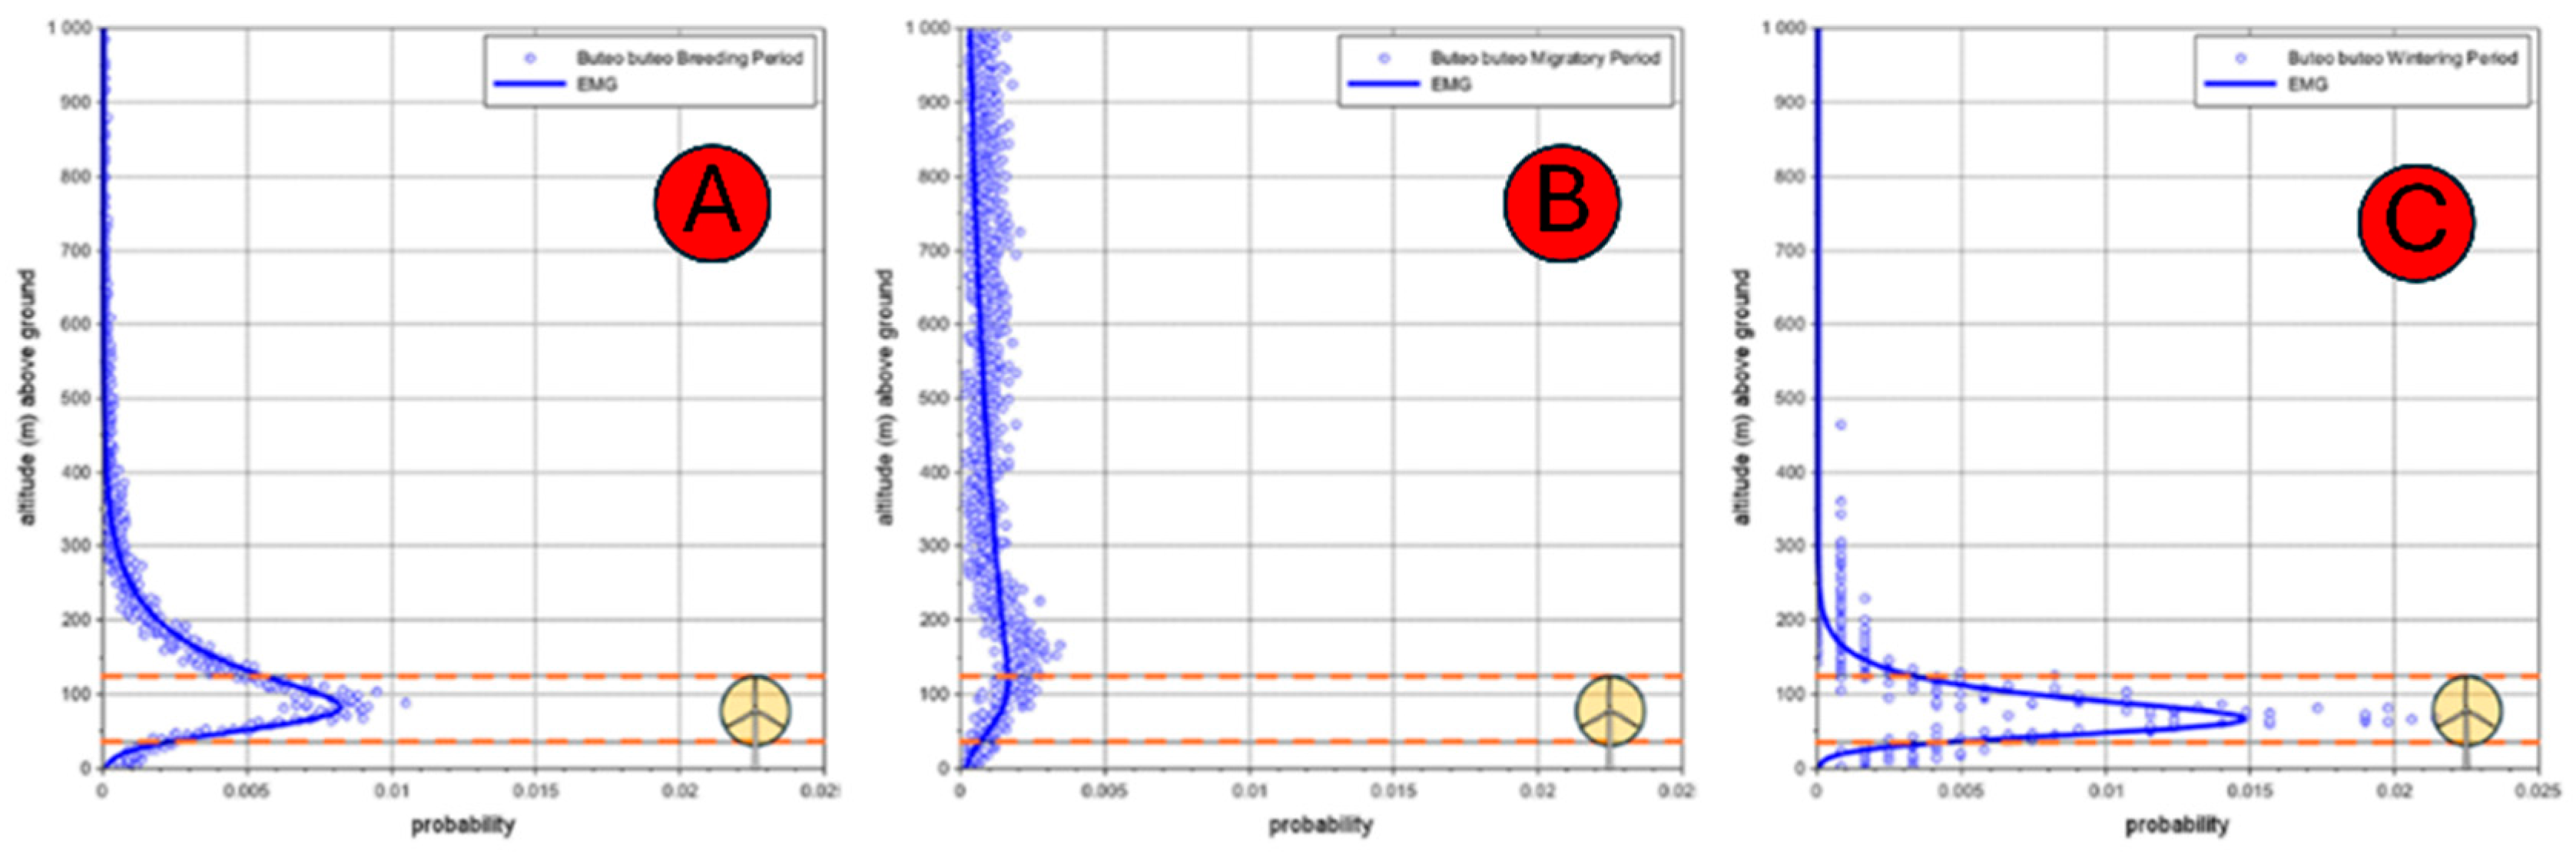
Table 1.
Basic technical specifications of the wind turbines operating in the study area.
| Model | Number of turbines | Rotor diameter (m) | Hub height (m) |
| Mitsubishi MWT-1000A | 35 | 61.4 | 69 |
| Vestas V90 | 73 | 90.0 | 105 |
| HSW 250 T | 6 | 28.5 | 50 |
Table 3.
Data from systematic collision monitoring in 114 wind turbines in the study territory in the period 2018 – 2023 https://kaliakrabirdmonitoring.eu/.
Table 3.
Data from systematic collision monitoring in 114 wind turbines in the study territory in the period 2018 – 2023 https://kaliakrabirdmonitoring.eu/.
| Period of annual cycle | Number of collision victims | Number per year in 114 turbines | Number per year per turbine |
| Breeding period | 3 | 0.5 | 0.004386 |
| Migratory period | 2 | 0.3 | 0.002632 |
| Wintering period | 5 | 0.8 | 0.007018 |
| Total 2018 - 2023 | 10 | 1.6 | 0.014035 |
Disclaimer/Publisher’s Note: The statements, opinions and data contained in all publications are solely those of the individual author(s) and contributor(s) and not of MDPI and/or the editor(s). MDPI and/or the editor(s) disclaim responsibility for any injury to people or property resulting from any ideas, methods, instructions or products referred to in the content. |
© 2025 by the authors. Licensee MDPI, Basel, Switzerland. This article is an open access article distributed under the terms and conditions of the Creative Commons Attribution (CC BY) license (http://creativecommons.org/licenses/by/4.0/).
Copyright: This open access article is published under a Creative Commons CC BY 4.0 license, which permit the free download, distribution, and reuse, provided that the author and preprint are cited in any reuse.


