Submitted:
11 August 2025
Posted:
13 August 2025
You are already at the latest version
Abstract
Gamba grass, a leading alternative for forage development in Brazil Cerrado’s areas, has received a more extensive researchers' attention in the recent years. Although three cultivars were already released, for gamba grass to be an alternative to most planted forage species in Brazil (Genera Urochloa and Megathyrsus), significant technological improvements need to be achieved, mainly in genetic development of DM yield and forage quality. Understanding genetic variability of populations and the nature of the gene action governing the inheritance of traits are important contexts to obtain genetic gains from selection in breeding programs. The objective was to estimate DM yield and quality traits narrow-sense heritability and expected gains from HS family tests of two populations originated from the cultivars BRS Sarandi and cv. Planaltina. The trials were established in spring 2017 in Planaltina, DF and evaluated in February and March, 2018 and January, February, and March, 2019. Cultivar BRS Sarandi presented better forage quality than did cv. Planaltina due to higher CP and lower NDF, ADF, CEL, and HEMIC contents, and they did not differ for DM yield. Heritability estimates were low to moderate in magnitude for both populations, ranging from 0.31 to 0.68 for individual harvests and from 0.07 to 0.27 for models across harvests and years. Similar low h2 magnitudes across harvests and years were also observed for all quality traits estimated for both populations. The theoretical expected gains per year for all traits reflected modest gains, but all aligned with those from literature. The nature of the genetic variation is quantitative for all studied traits, since they were highly influenced by the environment. Results suggest more elaborated breeding methods, more cycles of selection, and more accurate measurement techniques to improve chances of success when breeding gamba grass for yield and quality. Alternatively, the use of genomic selection may promote a faster improvement of DM yield and forage quality traits, to overcome the constraints of low heritability, number of selection cycles, high costs, and multi-trait selection.
Keywords:
tropical grass
; breeding
; genetic variability
; gains from selection
Introduction
Gamba grass (Andropogon gayanus Kunth) is a cross-pollinated forage species originally from Africa and well adapted to tropical savannas with different altitudes, climate and soils (Grof & Thomas, 1990). Gamba grass is used as forage for livestock production systems in Cerrado’s ecoregion of Brazil since early 1980’s, due to its natural resistance to spittlebug, good growth on acid and low fertility soils and fast regrow at the end of the dry season, after the first rainfalls. The species is a mandatory allogamous, anemophilous, and self-incompatible (Foster, 1962). The basic number of chromosomes is n = 10 and the total number of chromosomes 2n = 4x = 40, a tetraploid species belonging to the bisquamulatus botanic group (Okoli and Olorode, 1983; Nagahama & Norrmann, 2012), as supported by recent molecular studies (Pessoa Filho et al., 2021).
Genera Urochloa syn. Brachiaria and Megathyrsus syn. Panicum account for most of the cultivated pastures in Brazil, with basically few apomictic species. The low genetic variability from those clone propagated seeds takes large and continuous areas of Brazil, introducing risks to the livestock production systems (Jank et al., 2014). The introduction of new cultivars of different grass species is strategic to face the challenge of diversification and sustainable intensification of livestock production systems. Gamba grass is an alternative to increase pasture diversification in the Brazilian Savannas, since it is a well-adapted species with reported variability elsewhere for a number of traits, suggesting potential gains from selection programs (Miles & Grof, 1990). However, no breeding effort has been made to select gamba grass for yield and forage quality. An increase for both characteristics of gamba grass may be a worthwhile effort to develop high quality forage, which may lead to significant impacts on livestock production systems of the region.
Simultaneous selection for yield and quality has been the objective of several forage species breeding programs, e.g. alfalfa (Béguier & Julier, 2018; Santos et al., 2018), bermuda grass (Souza et al., 2020), forage peanuts (Simeão, et al., 2017), and switchgrass (Edmé & Mitchel, 2021). Both, genetic variability in the population and knowledge of the nature of the gene action governing the inheritance of the traits are important conditions to obtain genetic gains from selection as well as to be successful in breeding programs. Little is known about the genetic variability, gene action and potential genetic gains in gamba grass populations grown in the Brazilian savannas areas. The objective was to estimate DM yield and quality traits heritability and expected gains from HS family tests of two gamba grass populations. Those studies are needed to access the genetic variability of DM yield and quality traits and further design strategies for selection of superior material and release of improved gamba grass cultivars.
Material and Methods
Two genetically broad-based gamba grass populations, cv. Planaltina and cv. BRS Sarandi, from the Embrapa Cerrados forage breeding program were used. Planaltina was the first gamba grass cultivar released in 1981 in Brazil and was a direct introduction of CIAT 621 collected in Africa (Thomas et al., 1981). Cultivar BRS Sarandi was derived from Planaltina and developed primarily through phenotypic recurrent selection for higher leaf to stem ratio and more homogenous population. BRS Sarandi was registered and protected in 2019 and has higher frequency of plants with a semi-erect growth habit, higher number of tillers, and increased leaf to stem ratio, when compared to Planaltina and Baeti (Carvalho et al., 2021).
A random sample consisting of 120 HS families from each population was used to set up two independent HS family tests. In September 22nd, 2017, HS families were sown in plastic trays and, in November 22nd, 2-month-old seedlings were manually transplanted from the greenhouse to the field. Each experiment was laid out in a four replicate randomized complete block design with 10 seedlings planted in single family-row plot in each replicate, spaced 0.3 m apart within and 1.0 m across rows. The experiments were conducted in Planaltina, Federal District, Brazil (15°35’S, 47°42’W; 993 m a.s.l.), from September 2017 to April 2019. The climate at the experimental site is tropical savannah according to the Köppen-Geiger classification (Peel et al., 2007), with a seasonal rain distribution and a very well defined dry season between May and September.
The experiments were planted in a clay soil (Rhodic Haplustox Oxisol) in average with pH(H2O) 5.3, OM concentration of 27 g.kg-1, K concentration of 48 mg.kg-1, Al concentration of 24 mg.kg-1 and P concentration of 2.0 mg.kg-1 (Mehlich-I) at 0-0.2 m soil depth. The experimental area was uniformly fertilized with a commercial granular fertilizer surface applied at rates of 100 kg N ha−1, 40 kg P2O5 ha−1, and 60 kg K2O ha−1.
Half-sibs were sampled only during the wet season, two times in 2018 in February and March (January harvest was discarded as usual for the first one), and three times in 2019, January, February, and March, at 5 wk. intervals. Each sample weighed about 400 g fresh and was composed of randomly selected above ground material harvested with a hedge trimmer with a 66-cm long shaft, at a stubble height of 20 cm, from all plants in each HS row. All plant material from each plot was weighed with a field scale and the weights were further converted to DM yield per hectare, based on the dry weights of the samples collected during the harvest. All samples were dried for 72 h in a forced-air oven at 55 oC, ground through a 1-mm screen in a Wiley mill (A.H. Thomas Co., Philadelphia, PA), and stored in 200 ml plastic containers for laboratory analyses.
Near infrared reflectance spectroscopy (NIRS) calibrations were used to predict the conventional quality traits. The models were specifically developed for gamba grass and 10% of the samples from all harvests of the above experiments were used in the calibration process as described by Fonseca et al. (2020). Spectral data were collected for 4,640 samples of the above described experiments using a NIRS FOSS 5000 System II type 461006 (FOSS Analytical SA, DK 3400 Hilleroed, Denmark) with the ISIScan software v.2.85.3 (ISI Software, FOSS Analytical AB, Höganãs, Sweden). About 2-g homogenized samples were placed in 3.8 cm inner diameter ring cup cells, with a quartz window and closed with foam card board rings for the spectral readings. Scans were collected over a wavelength range of 1100 to 2498 nm with 2 nm resolution and 32 scans averaged for each sample. The spectral absorbance were recorded as the logarithm of the inverse of the reflectance (A = 1/R) and was used to predict CP, NDF, ADF, ADL, IVDMD, CEL, and HEMIC concentrations of all ground samples from both field experiments.
Linear mixed models were fitted to the data using the restricted maximum likelihood method - REML to estimate the variance components. All statistical analyses were carried out using RStudio v.2022.07.1 Build 554 and R version 4.2.1 (2022-06-23 ucrt) with lme4 package v.1.1-34. The analyses for each trait was performed with data from (i) each individual harvest, (ii) averaged across harvests within each year, (iii) across years model, and (iv) averaged across populations. Narrow sense heritability estimates and associated standard errors on HS progeny means basis were computed for all traits. Harvest was considered fixed effect while years, replicated blocks, and HS families were random. To compare both trials, population and harvests were considered fixed effects and block nested within trial was random:
- (i)
- ƴbf = μ + Bb + Ff + εbf, model for individual data harvest, all effects random;
- (ii)
- ƴbhf = μ + Bb + Hh + BHbh+ Ff + FBfb + FHfh + εbhf, model across harvests, all effects random but harvest;
- (iii)
- ƴyhbf = μ + Yy + Hh + YHyh + Bb + BYby + BHbh+ Ff + FYfy + FBfb + FHfh + FYHfyh + εyhbf, model across years and harvests, all effects random but harvest; and
- (iv)
- ƴph = μ + Pp + Hh + B(P)bp, model across populations, all effects fixed but blocks nested within population.
Where, ƴ is the observations on the traits of interest; μ is the overall mean; Bb is the random effect of the ‘bh’ replicated block; Ff is the random additive genetic effect of the ‘fth’ HS family; Hh is the fixed effect of the ‘hth’ harvest; Yy is the random effect of the ‘yth’ year; Pp is the fixed effect of the pth population; BHbh is the random effect interaction between block ‘b’ and harvest ‘h’; FBfb is the random effect interaction between HS family ‘f’ and block ‘b’; FHfh is the random effect interaction between HS family ‘f’ and harvest ‘h’; YHyh is the random effect interaction between year ‘y’ and harvest ‘h’; BYby is the random effect interaction between block ‘b’ and year ‘y’; FYfy is the random effect interaction between HS family ‘f’ and year ‘y’; B(P)bp is the random effect block ‘b’ nested within population ‘p’; FYHfyh is the random effect interaction among HS family ‘f’, year ‘y’, and harvest ‘h’; and εyhbf is the residual random error.
Narrow sense heritability on HS progeny means basis (h2), associated standard errors (SE), and expected gains (∆G) were computed for all traits for each population, within, across, and over harvests and years according to Nguyen and Sleper (1983) and Hallauer, Carena and Miranda (1988). The following equations were used to estimate heritability for each above model:
- (i)
-
and
- (ii)
-
and
- (iii)
-
and
Expected gains per cycle of direct selection were computed for each trait using the formula ∆G = kch2, where k is the standardized selection differential which equals to 1.75 for 10% selection pressure; c is the parental control factor which equals to 2 for crossing among only selected parentals, h2 is the narrow sense heritability estimate, and is the phenotypic standard deviation (Nguyen and Sleper,1983; Hallauer, Carena and Miranda,1988).
Results
In Table 1 a summary of trait measurements and associated statistics for two populations of gamba grass, Planaltina and BRS Sarandi are presented. These traits are related to forage yield and nutritional composition, and reflect the built-in variations between the two populations. Planaltina DM yield averaged 4.57 t.ha-1.harvest-1, ranging from 0.37 to 12.01 t.ha-1, and BRS Sarandi averaged 4.71 t.ha-1.harvest-1, varying across a wider range, from 0.29 to 21.18 t.ha-1. No significant difference was found for DM yield between the two populations.
Planaltina had a CP content of 104.94 g.kg-1, varying between 72.0 and 135.4 g.kg-1, and BRS Sarandi had a statistically significant higher mean of 110.67 g.kg-1, varying across a broader range, from 56.8 to 148 g.kg-1. Planaltina showed IVDMD mean of 537.11 g.kg-1, close to the BRS Sarandi mean of 543.65 g.kg-1, and no significant difference. Planaltina showed a higher mean NDF content of 689.34 g.kg-1, with a range of 631.9 to 796.9 g.kg-1, while BRS Sarandi presented a relatively lower mean of 668.67 g.kg-1, statistically significant, and a broader range extending from 499.6 to 753.1 g.kg-1. Similar to NDF, Planaltina had a higher mean ADF content (399.63 g.kg-1) while BRS Sarandi a lower mean of 389.9 g. g.kg-1, statistically different. Similarly to NDF and ADF, Planaltina had significant higher CEL and HEMIC contents compared to BRS Sarandi. ADL content was 36.44 g.kg-1 in average with means not statistically different between the two populations.
BRS Sarandi data revealed wider ranges of variation, with magnitudes of 20.89 t.ha-1.harvest-1 for DM yield, 9.12 g.kg-1 for CP, and 23.35 g.kg-1 for NDF, when compared to those from Planaltina with magnitudes of 11.64 t.ha-1.harvest-1 for DM yield, 6.34 g.kg-1 for CP and 16.5 g.kg-1 for NDF. Also, the lower and upper bounds of the ranges for DM yield and PB from BRS Sarandi outgrew those from Planaltina (Table 1).
In Table 2 and Table 3 information on the mean ± SE, range, and HS components of variance for dry matter (DM) yield and all forage quality traits from 115 HS Planaltina families, and from 117 HS BRS Sarandi families, with data collected from two harvests in Feb and Mar, 2018 and three harvests in Jan, Feb, and Mar 2019 is presented.
The mean DM Yield and the HS component of variance for both populations, Planaltina and BRS Sarandi, were consistently higher within and across harvests in 2018 than in 2019. The overall mean for DM yield across harvests and years, as well as across harvests 1 to 5 independent of year, had similar magnitudes for both populations (Table 2 and Table 3). Most of the quality traits estimates were similar in magnitude across harvests within each year for both populations. Fiber components NDF, ADF, ADL, and CEL estimates were lower in 2019 than in 2018. Yet, CP and IVDMD were higher in 2019. Variations for all other traits were similar in magnitude across harvests and years, as well as across harvests 1 to 5 independent of year, for both populations (Table 2 and Table 3).
Narrow-sense heritability estimates on half sib family mean basis (h2) were very low to moderate in magnitude for DM Yield and all quality traits. Their associated standard errors ranged from low to high. All h2 estimates for DM yield were significantly greater than zero but for 2018 1st harvest and across harvests for Planaltina, and 2019 3rd harvest for BRS Sarandi. DM yield ranged from 0.07 to 0.68 for population Planaltina (Table 4) and from 0.07 to 0.53 for population BRS Sarandi (Table 6).
For CP, only three of the eight h2 estimates were greater than zero for Planaltina and six for BRS Sarandi (2018 harvest 3 and across harvests, and 2019 harvest 3). CP h2 ranged from 0.16 to 0.36 and from 0.11 to 0.55 for Planaltina and BRS Sarandi, respectively.
IVDMD had three out of eight h2 estimates greater than zero (2018 harvest 2, 2019 harvest 3, and across years) for Planaltina, and five (2018 harvest 2, 2019 harvests 1, 2, 3, across harvests, and across years) for BRS Sarandi. IVDMD h2 ranged from 0.05 to 0.46 and from 0.08 to 0.56 for Planaltina and BRS Sarandi, respectively (Table 4 and Table 6). The fiber components NDF, ADF, and CEL were more consistent for Planaltina with five of eight h2 estimates significantly greater than zero. BRS Sarandi had only two significant h2 estimates for NDF and one significant h2 estimate for each ADF, CEL and HEMIC.
In general, significant heritability estimates across harvests and across years were lower when compared to those from individual harvests. For DM yield, they ranged from 0.07 to 0.15 and 0.07 to 0.13, while for individual harvests they ranged from 0.25 to 0.53 for Planaltina and from 0.29 to 0.60 for BRS Sarandi (Table 4 and Table 6). Similar performances related to heritability estimates across harvests and across years versus individual harvests were observed for all quality traits as well.
The expected gains estimated across harvests and across years were also lower when compared to those from individual harvests. For DM yield, expected gains per cycle ranged from 0.17 to 0.22 t.ha-1 and 0.24 to 0.58 t.ha-1 across harvests and across years, while for individual harvests they ranged from 0.37 to 2.19 and from 0.58 to 1.58 t.ha-1 for Planaltina and BRS Sarandi populations, respectively (Table 5 and Table 7). As the h2 estimates were low in magnitude, similar lower expected gains estimates per cycle of selection were observed for all quality traits as well.
All expected gains estimates from now on are reported only for traits with h2 estimates significantly different from zero. Also, all sequentially reported data below are for Planaltina and BRS Sarandi, respectively: the CP expected gains per cycle of selection ranged from 22.41 to 57.90 g.kg-1 and 29.40 to 105.57 g.kg-1; IVDMD ranged from 51.19 to 284.48 g.kg-1 and 64.13 to 317.02 g.kg-1; NDF ranged from 30.16 to 156.46 g.kg-1 and 43.12 to 106.69 g.kg-1; ADF ranged from 23.28 to 159.39 and 50.87 to 98.84 g.kg-1; ADL ranged from 4.18 to 33.94 g.kg-1 and 9.11 to 35.77 g.kg-1; CEL ranged from 25.21 to 135.34 g.kg-1 and 56.67 to 94.03 g.kg-1; and HEMIC from 16.51 to 55.26 g.kg-1 and 14.75 ,l. to 70.25 g.kg-1 (Table 5 and Table 7).
Discussion
The results highlighted significant variations between the Planaltina and BRS Sarandi populations for the forage quality traits CP, NDF, ADF, CEL, and HEMIC contents. Cultivar BRS Sarandi had better forage quality characteristics than did cv. Planaltina due to higher CP and lower NDF, ADF, CEL, and HEMIC contents. This may be explained by the breeding strategy during BRS Sarandi development. Five phenotypic recurrent selection generations were carried out from cv. Planaltina germplasm to select semi-erect growth habit genotypes, with higher number of tillers, and higher leaf to stem ratio (Carvalho et al., 2021). The BRS Sarandi had higher frequency of individuals with higher leaf to stem ratio which, indirectly, resulted in higher CP content and lower non-digestible fibers content of the resulted population. It is widely known that CP content is higher in leafs than in stems of forage species. The significant differences found between both gamba grass populations for most quality traits confirms that the newly developed population, BRS Sarandi, had significantly better forage quality properties when compared to its parental population, Planaltina. Similar trends were observed in new developed populations of alfalfa and red clover, which are reported to have significantly better forage quality properties in relation to parent cultivars (Tucak et al., 2021).
The fact that the two populations did not differ for DM yield may be explained by: (i) there was no direct selection for DM yield in the development of BRS Sarandi; and (ii) simultaneous selection for semi-erect growth habit, higher number of tillers, and higher leaf to stem ratio, in the development of BRS Sarandi, may not be genetically correlated to DM yield.
Wider ranges of DM yield, CP and NDF contents within a population may lead to a better effectiveness of forage breeding selection programs. Wider ranges indicate a potential higher genetic diversity within the population, which is essential for providing a broader pool of genetic material to select from. Also, as different environments can affect yield and nutritional composition of the plants, higher diversity within a population may facilitate the finding of adapted materials to different growing environments. Still, broader ranges of desired traits contents may provide breeders with other options for crossing superior and contrasting parents to develop hybrids and synthetic populations that exhibit those desired characteristics. In this study, the diversity found for DM yield, CP and NDF contents in both, Planaltina and BRS Sarandi populations may be used to develop new cultivars of gamba grass with improved yield and better nutritional quality.
The DM yield estimates within and across harvests decreased from 2018 to 2019 in both populations (Table 2 and Table 3). These changes in forage DM yield between the two harvest years may be due to unfavorable environmental conditions, such as weather patterns. Figure 1 illustrates the daily rainfall from Nov 2017 to Mar 2019, the period in which the experiments were carried out. The red rectangle indicates a period of 2 months that runs from January 1st to February 28th, 2019, in which the rainfall was much lower than that recorded in the same period in 2018. In 2019 period, it rained 134.5 mm, 34. 2% of the total rainfall from the same period in 2018, that was 393.6 mm, and 39.5% of the average rainfall from the last 20 years prior to 2017 (Embrapa Cerrados, 2023). Lower rainfall in 2019 resulted in higher forage quality, for both populations.
Lower DM yield may be due to the slower plant growth and, consequently, lower production of structural and reproductive tissues in gamba grass. This may explain, in part, the decrease in fiber components contents and the increase in CP contents and improved IVDMD in 2019, for both populations. Water stress has been reported to reduce seed and forage yield of smooth bromegrass genotypes by 38 and 14%, respectively, and a higher impact on reproductive growth than in vegetative growth (Saeidnia et al. 2017). Drought also has been reported to affect forage quality by affecting growth and physiological processes. Even though drought increased leaf senescence in smooth bromegrass, it improved digestibility by lowering acid detergent fiber and acid detergent lignin (Bittman et al., 1988). When drought occurred during the growth period, forage quality of smooth bromegrass was positively affected with increased CP concentration in leaf, stem, and total forage, and decreased NDF and ADF concentrations (Sheaffer et al., 1992).
Narrow sense heritability (h2) is the ratio of the additive genetic variation to the total phenotypic variation among families or plants. In other words, it is the proportion of trait variation within a population that can be attributed to genetic causes. In practice, h2 is routinely used by breeders to estimate gain from selection in breeding programs. In this study, although most of the h2 estimates were significantly greater than zero, they were predominantly low to moderate in magnitude.
DM yield is one of the most important traits of many forage crops breeding programs. For individual harvests, which model did not include harvests and years as factor affecting the yield, the h2 estimates were moderate in magnitude, ranging from 0.31±0.15 to 0.68±0.14 for Planaltina and from 0.42±0.14 to 0.53±0.14 for BRS Sarandi. Those estimates might be understood at most as an upper limit for DM yield h2, in both populations. However, they are overestimated because they are not free of genotype x environment interactions.
More realistic and less biased are the h2 estimates from models that accounted for harvests and years as factors affecting HS family’s DM yield performance. The h2 estimates were lower, ranging from 0.11 to 0.27 across harvests and 0.07 across years, considering both populations (Table 4 and Table 6). That means, only 11 to 27 % of the total phenotypic variation was due to genetic differences among HS families and 73 to 89% were due to environmental effects, suggesting that the observed DM yield expression was highly influenced by environmental factors, such as differences in blocks, harvests, or years. This is an indication that phenotypic selection for DM yield may not be efficient to select superior genotypes.
Similar low h2 magnitudes across harvests and across harvests and years were also found for all quality traits estimated for both gamba grass populations: CP ranged from 0.11 to 0.24; IVDMD from 0.05 to 0.24; NDF from 0.06 to 0.15; ADF from 0.05 to 0.17; ADL 0.11; CEL from 0.06 to 0.18; and HEMIC 0.07 (Table 4 and Table 6). In analogous way to DM yield, the environmental factors were more important than genetic factors in determining the variation for quality traits in both studied populations.
The cycle of selection on half-sib family mean basis took two years for gamba grass evaluation in this study. This is because it was evaluated five harvests, with four of them in February and March 2018 and 2019, to be able to analyze the experiments across harvest and years. Thus, the maximum expected gain per year from direct selection is as lower as half than the reported gain per cycle (Table 5 and Table 7).
Annual expected gains for DM yield from direct selection across harvests and harvests and years ranged from 0.09 to 0.11 t.ha-1 yr-1 for cv. Planaltina, and 0.12 to 0.29 t.ha-1 yr-1 for BRS Sarandi. The potential genetic gains are from 0.39% to 0.48 % yr-1 for Planaltina, and about the same magnitude from 0.50 % to 1.20 % yr-1 for BRS Sarandi. Those estimates are consistent with the expected gains for forage crops elsewhere in literature. Gains in forage yield from breeding forage crops have been reported low or nonexistent (Casler and Brummer, 2008). The genetic gain in annual DM yield of perennial ryegrass has been estimated to be about 4 to 5% decade-1 in Europe and New Zealand and less than 1% in the USA (Stewart and Hayes, 2011). Some studies reported that DM yield can be increased by selection at rates above 4.0 to 5.0 % decade-1, such as orchard grass with an average gain in DM yield of 1.3% yr–1 (Casler et al., 2002), and perennial ryegrass with DM yield gains of 1.1% yr–1 (Wilkins and Humphreys, 2003). Selection for DM yield in upland switchgrass resulted in gains of 0.71 t.ha-1 cycle-1 or 4% yr-1, while selection in lowland switchgrass resulted in gains of 0.89 t.ha-1 cycle-1 or 1% yr-1 (Casler and Vogel, 2014).
One of the main goals in forage breeding for quality is increasing protein content and fiber digestibility (Tucak et al., 2021). Expected gains for CP across harvests and harvests and years ranged from 11.2 to 18.6 g.kg-1 yr-1 for Planaltina and were lower than those for BRS Sarandi that ranged from 14.7 to 29.9 g.kg-1 yr-1. Gains from selection for CP may be effective for both populations and may be more effective for the latter. Expected gains for IVDMD across harvests/years was 25.5 g.kg-1 yr-1 for Planaltina and were lower than those for BRS Sarandi that ranged from 32,1 to 77,5 g.kg-1 yr-1. As for CP, gains from selection for IVDMD may be effective for both populations. Again, gains from cv. BRS Sarandi may be more effective. CP and IVDMD contents are the most important traits in forage quality and genetic improvement in IVDMD has been reported to improve animal daily gains at a rate of 3.2% increase for each 1% increase in IVDMD (Casler and Vogel, 1999). Also, concomitant selection for increased forage DM yield and IVDMD was reported successful in the development of improved cultivars of switchgrass (Vogel et al., 2013). Improved rates of ruminant live weight gain due to increased IVDMD have been responsible for rapid adoption rates of new cultivars for grazing and hay production (Casler and Vogel., 1999).
All below data are related to fiber components that are mostly made up of non-digestible carbohydrates. Some breeding programs base their selection on lower fiber contents to improve quality characteristics. Expected gains for the fiber components NDF ranged from 15.8 to 21.1 g.kg-1 yr-1 for cv. Planaltina and 21.6 g.kg-1 yr-1 for BRS Sarandi; ADF ranged from 11.6 to 28.78 g.kg-1 yr-1 for cv. Planaltina and no gain for BRS Sarandi; ADL was 2.1 g.kg-1 yr-1 for cv. Planaltina and 4.6 g.kg-1 yr-1 for BRS Sarandi; CEL ranged from 12.5 to 29.48 g.kg-1 yr-1 for cv. Planaltina and no gain for BRS Sarandi; and HEMIC was 8.26 g.kg-1 yr-1 for cv. Planaltina and no gain for BRS Sarandi.
There was no expected gains estimates for the fiber components ADF, CEL, e HEMIC for BRS Sarandi due to the non-significance of h2. Lower NDF and ADF fiber contents, which are structural components rich in non-digestible cellulose and lignin, have the potential to increase the feeding value of the forage by improving voluntary intake and fiber digestibility, respectively. NDF has been reported to be positively correlated with forage yield of smooth bromegrass (Casler, 2005) and with plant vigor of alfalfa populations (Fonseca, et al., 1999). NDF has been negatively correlated with a high digestible carbohydrate, pectin, the predominant component of neutral detergent-soluble fiber (NDSF) in alfalfa (Fonseca, et al., 1999, Tecle et al., 2006) and CP. Improvements in timothy (Phleum pretense L.) digestibility can only be achieved by reducing the proportion of the structural components and increments in forage yield reduced its nutritive value (Bélanger, 2001). Cultivar Planaltina show a better potential to be select for low fiber contents.
Conclusions
There is a sufficient amount of DM yield and quality traits genetic variation for gamba grass in both populations to make progress from selection. The nature of the genetic variation are quantitative for all studied traits, suggesting that more elaborated breeding methods, such as selection on HS family basis or combined selection among and within HS families, as well as more accurate measurement methods, to improve chances of success when breeding gamba grass for yield and quality. One breeding strategy may be to identify superior families based on genotypic selection (using selection index including yield, CP or/and IVDMD) and superior individuals within each superior family based on phenotypic selection of traits associated with yield and forage quality (as leaf/stem ratio and higher number of tillers) or even direct within family selection using independent selecting levels. However, since most of the studied traits were highly influenced by the environment, multiple cycles of selection may be necessary to make significant progress on DM yield and forage quality from both gamba grass populations. Even small increases in these traits may lead to a significant impact on the overall yield and quality of gamba grass new varieties. Next step, alternative may be the use of genomic selection aiming at a faster improvement of DM yield and forage quality traits, to overcome the constraints of low heritability, long selection cycles, high costs, and multi-trait selection.
Author Contributions
All authors contributed to the study conception, design, evaluation, data and lab analysis, and writing. Carlos Eduardo Lazarini da Fonseca, Marcelo Ayres Carvalho, Marco Pessoa-Filho, and Cláudio Takao Karia were effective in the experimental planning, seedlings production, experiments set up and conduction, data collection, writing-review and manuscript editing. Marcelo Ayres Carvalho and Cláudio Takao Karia were responsible for funding acquisition. Allan Kardec Braga Ramos for all genetic material preparation, field and glass house logistics, as well as the manuscript review. Carlos Eduardo Lazarini da Fonseca and Marco Pessoa-Filho did all statistics and quantitative analysis. Gustavo José Braga was responsible for countless scientific discussions, editing and for several manuscript reviews. Natália Bortoleto Athayde Maciel and Suelen Nogueira Dessaune Tameirão did all wet lab and NIRS analysis with respective interpretation and discussion.
Acknowledgements
This work was jointly funded by Embrapa - Brazilian Agricultural Research Corporation and UNIPASTO - Association for the Promotion of Forage Breeding Research.
Conflict of Interest
All authors are Embrapa’s employees with no involvement with UNIPASO or any other organization or entity with any financial interest or non-financial interest in the subject matter or materials discussed in this manuscript.
Abbreviations
ADF, acid detergent fiber; ADL, acid detergent lignin; CP, crude protein; CE, cellulose; DM, dry matter; HEMIC, Hemicelulose; h2, narrow sense heritability; HS, half-sib; IVDMD, in vitro dry matter digestibility; N, nitrogen; NDF, neutral detergent fiber; NIRS, near-infrared reflectance spectroscopy; OM, organic matter; REML, restricted maximum likelihood; SE standard error of the mean.
References
- Béguier V. Guillemot E., Julier B. 2018. Alfalfa forage quality breeding in France: 30 years of common efforts from seed industry, dehydratation industry and public research.25 IN Proceedings. Second World Alfalfa Congress, Cordoba, Argentina. 11-14 November, 2018. Instituto Nacional de Tecnología Agropecuaria (INTA). http://www.worldalfalfacongress.org/.
- Bélanger, G., Michaud, R., Jefferson, P. G., Tremblay, G. F. and Brégard, A. 2001. Improving the nutritive value of timothy through management and breeding. Can. J. Plant Sci. 81: 577–585. [CrossRef]
- Bittman, S., Simpson, G.M., andMir, Z. (1988). Leaf senescence and seasonal decline in nutritional quality of three temperate forage grasses as influenced by drought. Crop Sci. 28, 546–552. [CrossRef]
- Carvalho, Marcelo A., Fonseca, C. E. L., Ramos, A. K. B.; Braga, G. J.; Fernandes, F. D.; Pessoa Filho, M. A. de C. P. (2021). BRS Sarandi: a new Andropogon gayanus cultivar for tropical pastures. Crop Breeding and Applied Biotechnology. 21. 2021.
- Casler, M.D. (2005), Agricultural Fitness of Smooth Bromegrass Populations Selected for Divergent Fiber Concentration. Crop Science, 45: 36-43 cropsci2005.0036. [CrossRef]
- Casler, M. D. and Brummer, E. C. (2008). Theoretical Expected Genetic Gains for Among-and-Within-Family Selection Methods in Perennial Forage Crops. Crop Science, 48: 890-902. [CrossRef]
- Casler, M.D. and Vogel, K.P. (1999), Accomplishments and Impact from Breeding for Increased Forage Nutritional Value. Crop Science, 39: 12-20 cropsci1999.0011183X003900010003x. [CrossRef]
- Casler, M.D., Fales, S.L., McElroy, A.R., Hall, M.H., Hoffman, L.D., Undersander, D.J. and Leath, K.T. (2002), Half-sib family selection for forage yield in orchardgrass. Plant Breeding, 121: 43-48. [CrossRef]
- Casler, M.D. and Vogel, K.P. (2014), Selection for Biomass Yield in Upland, Lowland, and Hybrid Switchgrass. Crop Sci. 54:626–636 (2014). [CrossRef]
- Edmé, S.; Mitchell, R. Genetic Analysis of Yield and Quality Traits in Switchgrass Based on Population Crosses. Agronomy 2021, 11,2220. [CrossRef]
- Embrapa Cerrados. 2023. Serviços climáticos. Laboratório de Biofísica Ambiental. Access in Sep 26, 2023. http://clima.cpac.embrapa.br/clima/dados-climaticos.
- FONSECA, C. E. L.; HANSEN, J. ; THOMAS, E. M. ; PELL, A. ; VIANDS, D. R. . Near infrared reflectance spectroscopy prediction and heritability of neutral detergente-soluble fiber in alfalfa. Crop Science, Estados Unidos, v. 39, p. 1265-1270, 1999.
- FONSECA, C. E. L.; VIANDS, D. R. ; HANSEN, J. ; PELL, A. . Associations among forage quality traits, vigor, and disease resistance in alfalfa. Crop Science, Estados Unidos, v. 39, p. 1271-1276, 1999.
- Fonseca, C. E. L. da, Pessoa Filho, M., Braga, G. J., Ramos, A. K. B., Carvalho, M. A., Fernandes, F. D., Karia, C. T., Maciel, G. A., Athayde, N. B., Dessaune, S. N., Thomé, S. P., Garcia, A. C. C., 2020. “Near-infrared reflectance spectroscopy as a tool for breeding Andropogon gayanus Kunth for forage quality.” IOSR Journal of Agriculture and Veterinary Science (IOSR-JAVS), 13(6), pp. 57-66. [CrossRef]
- FOSTER, W. H. Investigations preliminary to the production of cultivars of Andropogon gayanus. Euphytica, v. 11, p. 47-52, 1962.
- Grof, B., Thomas, D., 1990. The agronomy of Andropogon gayanus, in: Toledo, J.M., Vera, R., Lascano, C., Lenné, J.M., 1990. Andropogon gayanus Kunth – A grass for tropical acid soilsc. CIAT Centro Internacional de Agricultura Tropical, Cali, pp. 157-177. Google Scholar.
- Hallauer, A. R., Carena,M. J, Miranda, J. B. (1988). Quantitative Genetics in Maize Breeding (2nd ed.). Iowa, Ames. USA: Iowa State University Press. https://link.springer.com/book/10.1007/978-1-4419-0766-0. [CrossRef]
- Jank Liana, Barrios Sanzio C., do Valle Cacilda B., Simeão Rosangela M., Alves Geovani F. (2014) The value of improved pastures to Brazilian beef production. Crop and Pasture Science 65, 1132-1137. [CrossRef]
- Miles J. W. and Grof B. (1990) Genetics and plant breeding of Andropogon gayanus. In Toledo JM, Vera R, Lascano C and Lenné JM (eds) Andropogon gayanus Kunth: A grass for tropical acid soils. CIAT Centro Internacional de Agricultura Tropical, Cali, pp.19-35. Google Scholar.
- Nagahama, Nicolás & Norrmann, Guillermo. (2012). Review of the Genus Andropogon (Poaceae: Andropogoneae) in America Based on Cytogenetic Studies. Journal of Botany. 2012. [CrossRef]
- Nguyen, H.T., Sleper, D.A. (1983). Theory and application of half-sib matings in forage grass breeding. Theoret. Appl. Genetics 64, 187–196. [CrossRef]
- Okoli, B. E.and Olorode, O. (1983) Cytogenetic studies in the Andropogon gayanus-a. Tectorum complex (Gramineae). Botanical Journal of the Linnean Society, v. 87, 3, pp. 263-271. [CrossRef]
- Pessoa Filho, M. A. C. De P.; Azevedo, A. L. S.; Ramos, A. K. B.; Carvalho, M. A.; Fonseca, C. E. L. da., 2021. Estimativa do Tamanho do Genoma em Cultivares de Capim-Andropogon (Andropogon gayanus Kunth). Planaltina, DF: Embrapa Cerrados, 2021. 13 p. (Embrapa Cerrados. Boletim de Pesquisa e Desenvolvimento, 372). https://ainfo.cnptia.embrapa.br/digital/bitstream/item/224864/1/Estimativa-do-tamanho-do-genoma-Boletim-372.pdf.
- Peel MC; Finlayson BL; McMahon TA. 2007. Updated world map of the Köppen-Geiger climate classification. Hydrology and Earth System Sciences 11:1633‒1644. [CrossRef]
- Saeidnia, F., Majidi, M. M., Mirlohi, A., and Soltan, S. (2017b). Physiological and tolerance indices useful for drought tolerance selection in smooth bromegrass. Crop Sci. 57, 282–289. [CrossRef]
- Santos, I. G. D., Cruz, C. D., Nascimento, M., Rosado, R. D. S., & Ferreira, R. D. P. (2018). Direct, indirect and simultaneous selection as strategies for alfalfa breeding on forage yield and nutritive value. Pesquisa Agropecuária Tropical, 48, 178-189. http://www.alice.cnptia.embrapa.br/alice/handle/doc/1096305.
- Sheaffer, C. C., Peterson, P. R., Hall, M. H., and Stordahl, J. B. (1992). Drought effects on yield and quality of perennial grasses in the North Central United States. J. Prod. Agric. 5, 556–561. [CrossRef]
- Simeão, R. M., Assis, G. M. L., Montagner, D. B., & Ferreira, R. C. U. (2017). Forage peanut (Arachis spp.) genetic evaluation and selection. Grass and Forage Science, 72(2), 322-332. [CrossRef]
- Souza, C. D., Lopez, Y., Munoz, P., Anderson, W., Dall’Agnol, M., Wallau, M., & Rios, E. (2020). Natural genetic diversity of nutritive value traits in the genus Cynodon. Agronomy, 10(11), 1729. [CrossRef]
- Stewart, A., & Hayes, R. (2011). Ryegrass breeding - balancing trait priorities. Irish Journal of Agricultural and Food Research, 50(1), 31–46. http://www.jstor.org/stable/41348154.
- Tecle, I.Y., Viands, D.R., Hansen, J.L. and Pell, A.N. (2006), Response from Selection for Pectin Concentration and Indirect Response in Digestibility of Alfalfa. Crop Sci., 46: 1081-1087. [CrossRef]
- Thomas, D., Andrade. R. P., Couto, W., Rocha, C.M.C., Moore P., 1981. Andropogon gayanus Var. bisquamulatus cv. Planaltina: Principais características forrageiras. Pesquisa Agropecuária brasileira, 16, 347-355. https://seer.sct.embrapa.br/index.php/pab/article/view/16890.
- Tucak, M.; Ravlić, M.; Horvat, D.; Čupić, T. Improvement of Forage Nutritive Quality of Alfalfa and Red Clover through Plant Breeding. Agronomy 2021, 11, 2176. [CrossRef]
- Vogel, K. P. (2013). Comparison of two perennial grass breeding systems in switchgrass. Crop Science, 53, 863–870. [CrossRef]
- Wilkins, P.W.; Humphreys, M.O. Progress in breeding perennial forage grasses for temperate agriculture. The Journal of Agricultural Science, Wageningem, v.140, n.2, p.129-150, 2003. [CrossRef]
Figure 1.
Daily rainfall (mm) from the main Embrapa Cerrados’ weather station from Nov 2017 to Mar 2019.
Figure 1.
Daily rainfall (mm) from the main Embrapa Cerrados’ weather station from Nov 2017 to Mar 2019.
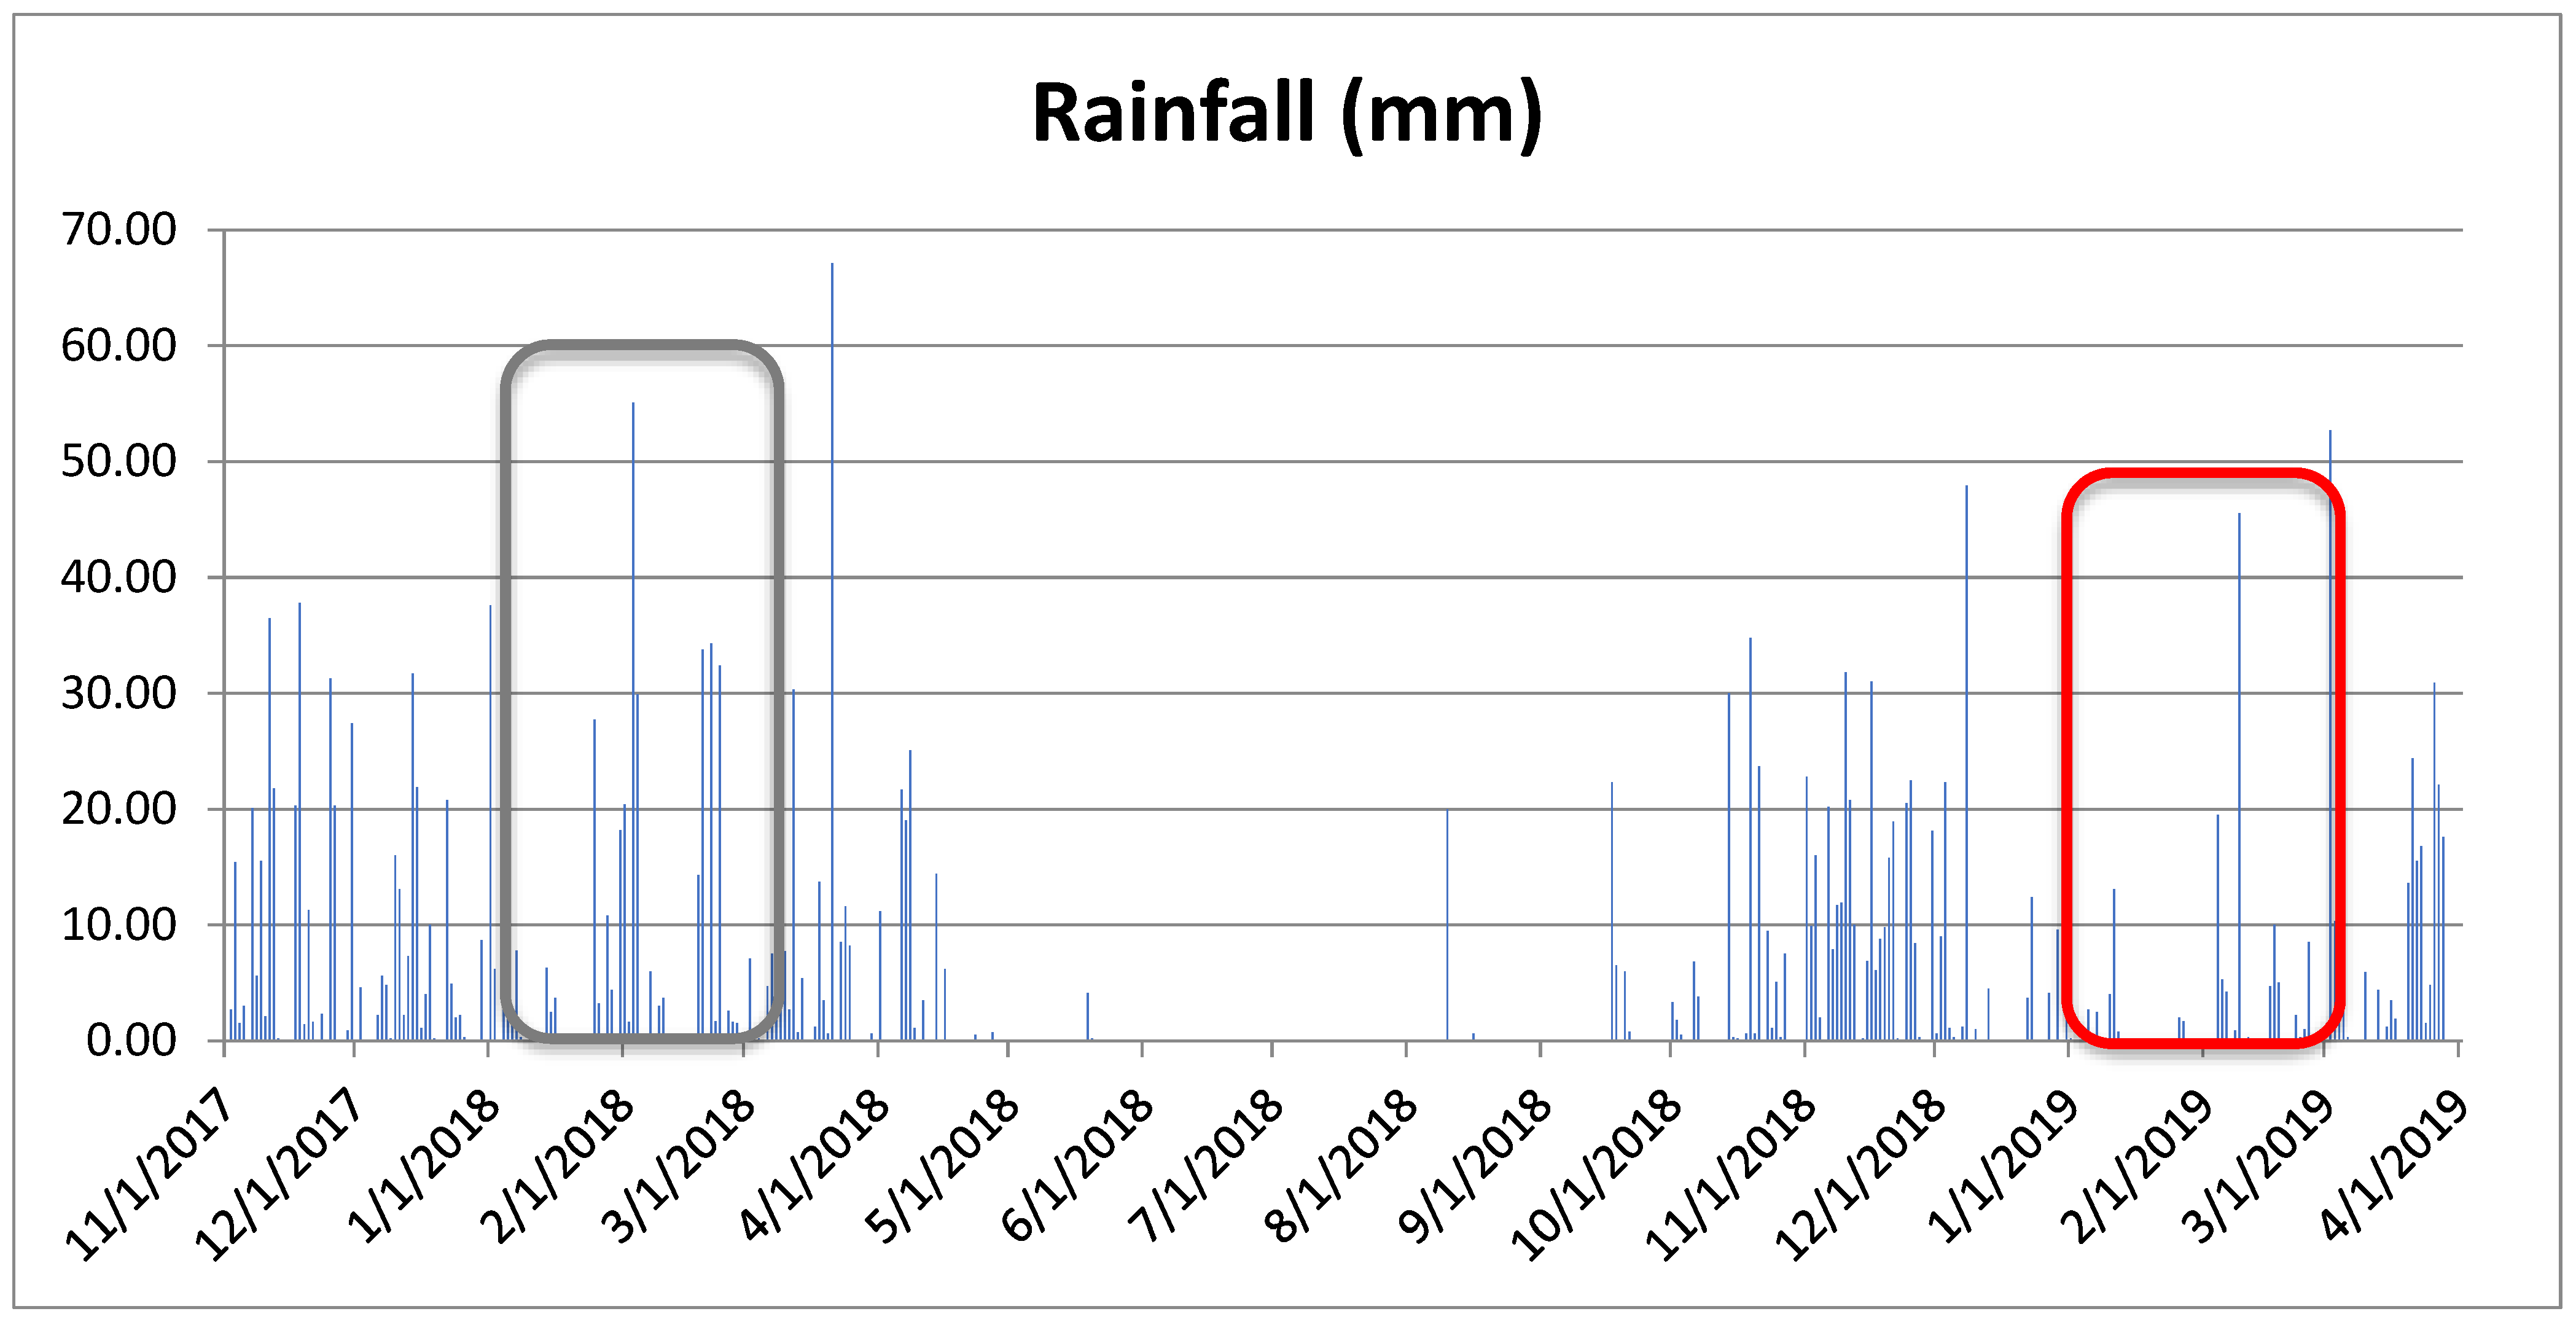

Table 1.
Mean, associated standard error (SE) and range for DM yield in t.ha-1.harvest-1 and forage quality traits in g.kg-1 of DM, of two gamba grass populations, cv. Planaltina and cv.Sarandi, and the overall populations statistics with mean, range, mean square (MS), and significance level from ANOVA.
| Planaltina | Sarandi | Overall Statistics | |||||
| Trait | Mean ± SE | Range | Mean ± SE | Range | Mean ± SE | Range | Pop. MS |
| DM Yield (t.ha-1.harvest-1) | 4.57 ± 0.06 | 0.37 - 12.01 | 4.83 ± 0.06 | 0.29 - 21.18 | 4.71 ± 0.05 | 0.29 - 21.18 | 6.800 ns |
| CP (g.kg-1) | 104.94 ± 0.23 | 72.0 - 135.4 | 110.67 ± 0.31 | 56.8 – 148.0 | 107.92 ± 0.20 | 56.8 – 148.0 | 9.834 ** |
| IVDMD (g.kg-1) | 537.11 ± 0.98 | 359.0 - 648.6 | 543.65 ± 1.17 | 379.2 - 653.8 | 540.50 ± 0.77 | 359 - 653.8 | 47.100 ns |
| NDF (g.kg-1) | 689.34 ± 0.70 | 631.9 - 796.9 | 668.67 ± 0.56 | 499.6 - 753.1 | 678.60 ± 0.48 | 499.6 - 796.9 | 106.88 ** |
| ADF (g.kg-1) | 399.63 ± 0.66 | 347.5 - 516.5 | 389.9 ± 0.44 | 325.4 - 461.7 | 394.57 ± 0.40 | 325.4 - 516.5 | 52.960 ** |
| ADL (g.kg-1) | 35.61 ± 0.12 | 25.2 - 52.0 | 37.2 ± 0.14 | 22.4 - 69.9 | 36.44 ± 0.10 | 22.4 - 69.9 | 0.606 ns |
| CEL (g.kg-1) | 364.03 ± 0.59 | 310.4 - 471.5 | 352.7 ± 0.43 | 270.1 - 424.4 | 358.14 ± 0.37 | 270.1 - 471.5 | 133.23 ** |
| HEMIC (g.kg-1) | 289.71 ± 0.22 | 258.1 - 323.2 | 278.78 ± 0.56 | 160.4 - 319.5 | 284.03 ± 0.32 | 160.4 - 323.2 | 77.70 ** |
ns – non significant differences between populations; *, ** - significant differences between populations at alfa level 0.05 and 0.01, respectively.
Table 2.
Mean and associated SE range and HS components of variance (σHS2) for DM yield and forage quality traits from 115 half-sib Planaltina families estimated from two harvests in 2018 and three harvests in 2019.
Table 2.
Mean and associated SE range and HS components of variance (σHS2) for DM yield and forage quality traits from 115 half-sib Planaltina families estimated from two harvests in 2018 and three harvests in 2019.
| 2018 | 2019 | 2018-19 | 2018-19 | |||||||
| Trait | Statistics | 2 | 3 | 2, 3ɫ | 1 | 2 | 3 | 1, 2, 3ɫ | 2,3 & 2,3ǂ | 1, 2, 3, 4, 5ɫ |
| DM Yield (t/ha) | Mean ± SE | 6.07±0.06 | 7.09±0.08 | 6.58±0.05 | 3.86±0.05 | 2.30±0.03 | 2.80±0.04 | 2.99±0.03 | 4.56±0.06 | 4.42±0.05 |
| Range | 2.80-10.61 | 0.37-12.01 | 0.37-12.01 | 0.41-9.59 | 1.18-5.40 | 1.20-7.74 | 0.41-9.59 | 0.37-12.01 | 0.37-12.01 | |
| σHS2 | 0.581 | 0.594 | 0.125 | 0.059 | 0.032 | 0.056 | 0.023 | 0.057 | 0.069 | |
| CP (g.kg-1) | Mean ± SE | 102.50±0.51 | 107.67±0.39 | 105.10±0.33 | 89.51±0.47 | 103.81±0.45 | 105.76±0.41 | 99.69±0.32 | 104.93±0.23 | 101.85±0.24 |
| Range | 72.0-135.4 | 79.5-133.2 | 72.0-135.4 | 60.7-130.3 | 81.7-128.4 | 75.2-133.4 | 60.7-133.4 | 72.0-135.4 | 60.7-135.4 | |
| σHS2 | 0.077 | 0.080 | 0.071 | 0.085 | 0.042 | 0.074 | 0.045 | 0.025 | 0.036 | |
| IVDMD (g.kg-1) | Mean ± SE | 494.50±1.80 | 536.69±1.58 | 515.59±1.39 | 487.1±1.44 | 551.48±1.40 | 565.73±1.1 | 534.77±1.20 | 537.10±0.97 | 527.10±0.93 |
| Range | 359.0-587.5 | 428.5-648.6 | 359.0-648.6 | 389.2-581.9 | 629.0-436.6 | 423.1-618.6 | 389.2-629.0 | 359.0-648.6 | 359.0-648.6 | |
| σHS2 | 1.451 | 0.650 | 0.383 | 0.517 | 0.070 | 0.759 | 0.222 | 0.440 | 0.315 | |
| NDF (g.kg-1) | Mean ± SE | 727.29±1.04 | 695.84±0.79 | 711.57±0.83 | 674.66±0.61 | 669.19±0.63 | 665.01±0.55 | 669.62±0.36 | 689.33±0.70 | 686.40±0.58 |
| Range | 668.1-796.9 | 648.4-731.6 | 648.4-796.9 | 639.1-742.5 | 713.5-634.9 | 631.9-709.8 | 631.9-742.5 | 631.9-796.9 | 631.9-796.9 | |
| σHS2 | 0.534 | 0.153 | 0.048 | 0.186 | 0.135 | 0.169 | 0.152 | 0.128 | 0.114 | |
| ADF (g.kg-1) | Mean ± SE | 436.60±1.11 | 401.20±0.65 | 418.90±0.87 | 413.23±0.62 | 380.03±0.58 | 380.66±0.47 | 391.31±0.53 | 399.62±0.65 | 402.35±0.55 |
| Range | 372.1-516.5 | 360.7-442.5 | 360.7-516.5 | 378.4-469.9 | 422.6-347.5 | 353.6-429.8 | 347.5-469.9 | 347.5-516.5 | 347.5-516.5 | |
| σHS2 | 0.574 | 0.137 | 0.029 | 0.254 | 0.167 | 0.198 | 0.163 | 0.099 | 0.110 | |
| ADL (g.kg-1) | Mean ± SE | 39.03±0.18 | 38.22±0.25 | 38.63±0.15 | 32.58±0.17 | 33.75±0.16 | 31.41±0.11 | 32.58±0.09 | 35.60±0.12 | 35.00±0.10 |
| Range | 28.8-51.6 | 25.2-52.0 | 25.2-52.0 | 22.6-43.4 | 49.8-26.8 | 26.0-46.2 | 22.6-49.8 | 25.2-52.0 | 22.6-52.0 | |
| σHS2 | 0.019 | 0.010 | 0.006 | 0.000 | 0.001 | 0.002 | 0.000 | 0.004 | 0.002 | |
| CEL (g.kg-1) | Mean ± SE | 397.57±1.01 | 362.97±0.58 | 380.27±0.82 | 380.65±0.61 | 346.28±0.54 | 349.26±0.46 | 358.73±0.52 | 364.02±0.58 | 367.35±0.5 |
| Range | 330.6-471.5 | 329.4-397.2 | 329.4-471.5 | 345.9-429.5 | 387.6-310.4 | 324.4-383.6 | 310.4-429.5 | 310.4-471.5 | 310.4-471.5 | |
| σHS2 | 0.448 | 0.131 | 0.048 | 0.227 | 0.163 | 0.210 | 0.163 | 0.099 | 0.110 | |
| HEMIC (g.kg-1) | Mean ± SE | 290.69±0.33 | 294.63±0.48 | 292.66±0.30 | 261.42±0.47 | 289.16±0.40 | 284.35±0.35 | 278.31±0.40 | 289.71±0.21 | 284.05±0.31 |
| Range | 271.2-309.9 | 258.1-323.2 | 258.1-323.2 | 230.2-290.6 | 313.2-263.5 | 263.6-308.5 | 230.2-313.2 | 258.1-323.2 | 230.2-323.2 | |
| σHS2 | 0.039 | 0.022 | 0.026 | 0.057 | 0.019 | 0.066 | 0.041 | 0.036 | 0.040 | |
*, ** Mean square associated with variance component was significant at the 0.05 and 0.01 probability levels, respectively.
Table 3.
Mean DM yield and associated SE range and HS components of variance (σHS2) for DM yield and forage quality traits from 117 half-sib BRS Sarandi families estimated from two harvests in 2018 and three harvests in 2019.
Table 3.
Mean DM yield and associated SE range and HS components of variance (σHS2) for DM yield and forage quality traits from 117 half-sib BRS Sarandi families estimated from two harvests in 2018 and three harvests in 2019.
| 2018 | 2019 | 2018-19 | 2018-19 | |||||||
| Trait | Statistics | 2 | 3 | 2. 3ɫ | 1 | 2 | 3 | 1. 2. 3ɫ | 2.3 & 2.3ǂ | 1. 2. 3. 4. 5ɫ |
| DM Yield (t/ha) | Mean ± SE | 5.43±0.07 | 8.38±0.10 | 6.9±0.08 | 3.43±0.04 | 2.58±0.03 | 2.78±0.03 | 2.93±0.02 | 4.79±0.06 | 4.52±0.05 |
| Range | 1.6-13.3 | 3.3-21.2 | 1.6-21.2 | 0.3-9.8 | 1.1-6.6 | 0.3-6.2 | 0.3-9.8 | 0.3-21.2 | 0.3-21.2 | |
| σHS2 | 0.393 | 0.430 | 0.186 | 0.133 | 0.067 | 0.040 | 0.068 | 0.077 | 0.069 | |
| CP (g.kg-1) | Mean ± SE | 118.43±0.43 | 93.42±0.49 | 105.92±0.52 | 117.28±0.45 | 111.09±0.39 | 121.13±0.4 | 116.5±0.26 | 111.01±0.33 | 112.27±0.28 |
| Range | 93.2-145.3 | 56.8-128.6 | 56.8-145.3 | 82-148 | 143.3-84.6 | 95.8-144.9 | 82.0-148.0 | 56.8-145.3 | 56.8-148 | |
| σHS2 | 0.115 | 0.051 | 0.047 | 0.164 | 0.166 | 0.099 | 0.125 | 0.069 | 0.036 | |
| IVDMD (g.kg-1) | Mean ± SE | 569.36±1.34 | 466.13±1.32 | 517.74±1.93 | 563.37±1.33 | 560.64±1.13 | 605.05±0.96 | 576.35±0.86 | 550.29±1.33 | 552.91±1.1 |
| Range | 488.5-644.1 | 379.2-559 | 379.2-644.1 | 497.2-645.9 | 616.5-478.3 | 501.4-685.3 | 478.3-685.3 | 379.2-685.3 | 379.2-685.3 | |
| σHS2 | 0.647 | 0.268 | 0.318 | 1.466 | 0.643 | 0.833 | 0.840 | 0.430 | 0.315 | |
| NDF (g.kg-1) | Mean ± SE | 686.86±1.00 | 650.37±1.47 | 668.62±1.07 | 673.51±0.57 | 667.97±0.72 | 654.26±0.72 | 665.25±0.45 | 664.87±0.61 | 666.6±0.51 |
| Range | 561.8-753.1 | 499.6-705.1 | 499.6-753.1 | 634.9-706.6 | 721.9-625.2 | 606.4-699.4 | 606.4-721.9 | 499.6-753.1 | 499.6-753.1 | |
| σHS2 | 0.105 | 0.336 | 0.071 | 0.205 | 0.183 | 0.121 | 0.130 | 0.055 | 0.114 | |
| ADF (g.kg-1) | Mean ± SE | 398.63±0.7 | 406.44±0.8 | 402.54±0.55 | 384.47±0.58 | 374.85±0.63 | 367.87±0.48 | 375.73±0.37 | 386.95±0.5 | 386.45±0.41 |
| Range | 343.4-446 | 325.4-461.7 | 325.4-461.7 | 347.3-424 | 420.2-333.9 | 331.9-403.8 | 331.9-424 | 325.4-461.7 | 325.4-461.7 | |
| σHS2 | 0.105 | 0.135 | 0.123 | 0.200 | 0.129 | 0.043 | 0.063 | 0.060 | 0.110 | |
| ADL (g.kg-1) | Mean ± SE | 41.15±0.32 | 37.16±0.33 | 39.15±0.24 | 37.52±0.17 | 34.96±0.14 | 32.91±0.25 | 35.13±0.12 | 36.54±0.15 | 36.74±0.13 |
| Range | 26.3-69.9 | 22.4-69.3 | 22.4-69.9 | 27.8-51.7 | 43.6-28.1 | 22.7-43.9 | 22.7-51.7 | 22.4-69.9 | 22.4-69.9 | |
| σHS2 | 0.030 | 0.015 | 0.006 | 0.005 | 0.008 | 0.006 | 0.006 | 0.003 | 0.002 | |
| CEL (g.kg-1) | Mean ± SE | 357.48±0.64 | 369.29±0.98 | 363.39±0.61 | 346.95±0.56 | 339.89±0.62 | 334.96±0.52 | 340.60±0.35 | 350.41±0.48 | 349.72±0.4 |
| Range | 293.7-393.9 | 270.1-424.4 | 270.1-424.4 | 308.7-386.8 | 386.2-298.1 | 295.6-370 | 295.6-386.8 | 270.1-424.4 | 270.1-424.4 | |
| σHS2 | 0.136 | 0.239 | 0.096 | 0.189 | 0.115 | 0.040 | 0.071 | 0.064 | 0.110 | |
| HEMIC (g.kg-1) | Mean ± SE | 288.23±0.77 | 243.92±1.02 | 266.08±0.97 | 289.04±0.45 | 293.12±0.4 | 286.40±0.56 | 289.52±0.28 | 277.92±0.58 | 280.14±0.48 |
| Range | 212-315.7 | 160.4-279.9 | 160.4-315.7 | 259.7-313.9 | 319.5-266.3 | 249.8-311.7 | 249.8-319.5 | 160.4-319.5 | 160.4-319.5 | |
| σHS2 | 0.155 | 0.082 | 0.024 | 0.020 | 0.102 | 0.049 | 0.052 | 0.037 | 0.040 | |
Table 4.
Half-sib family narrow-sense heritability estimates and associated standard errors (SE) for dry matter yield (DM yield) and forage quality traits in gamba grass cultivar Planaltina.
Table 4.
Half-sib family narrow-sense heritability estimates and associated standard errors (SE) for dry matter yield (DM yield) and forage quality traits in gamba grass cultivar Planaltina.
| Year | Harvest | DM Yield | CP | IVDMD | NDF | ADF | ADL | CEL | HEMIC |
| 2018 | 2 | 0.68 ± 0.14 | 0.25 ± 0.15 | 0.46 ± 0.14 | 0.37 ± 0.14 | 0.37 ± 0.15 | 0.50 ± 0.14 | 0.34 ± 0.15 | 0.29 ± 0.15 |
| 3 | 0.54 ± 0.14 | 0.35 ± 0.15 | 0.20 ± 0.15 | 0.23 ± 0.15 | 0.24 ± 0.15 | 0.21 ± 0.15 | 0.30 ± 0.15 | 0.15 ± 0.15 | |
| 2, 3ɫ | 0.13 ± 0.07 | 0.16 ± 0.07 | 0.07 ± 0.07 | 0.02 ± 0.07 | 0.01 ± 0.07 | 0.08 ± 0.07 | 0.03 ± 0.07 | 0.10 ± 0.08 | |
| 2019 | 1 | 0.29 ± 0.15 | 0.27 ± 0.15 | 0.23 ± 0.15 | 0.35 ± 0.15 | 0.43 ± 0.14 | 0.00 ± 0.16 | 0.42 ± 0.14 | 0.22 ± 0.15 |
| 2 | 0.35 ± 0.15 | 0.23 ± 0.15 | 0.04 ± 0.16 | 0.28 ± 0.15 | 0.35 ± 0.15 | 0.04 ± 0.16 | 0.37 ± 0.14 | 0.12 ± 0.15 | |
| 3 | 0.31 ± 0.15 | 0.36 ± 0.15 | 0.43 ± 0.14 | 0.40 ± 0.14 | 0.50 ± 0.14 | 0.14 ± 0.15 | 0.53 ± 0.14 | 0.38 ± 0.14 | |
| 1, 2, 3ɫ | 0.11 ± 0.05 | 0.10 ± 0.05 | 0.05 ± 0.05 | 0.15 ± 0.05 | 0.17 ± 0.05 | 0.01 ± 0.06 | 0.18 ± 0.05 | 0.08 ± 0.05 | |
| 2018-19 | 2,3 & 2,3ǂ | 0.07 ± 0.01 | 0.04 ± 0.02 | 0.05 ± 0.02 | 0.06 ± 0.02 | 0.05 ± 0.02 | 0.04 ± 0.02 | 0.06 ± 0.02 | 0.07 ± 0.02 |
ɫ Data combined across harvests; ǂ Data combined across years; All heritability estimates greater than 2 SE are significant.
Table 5.
Expected gains per cycle of selection based on half-sib family means for dry matter yield (DM yield) and forage quality traits in gamba grass cultivar Planaltina, estimated only for heritability greater than 2 SE.
Table 5.
Expected gains per cycle of selection based on half-sib family means for dry matter yield (DM yield) and forage quality traits in gamba grass cultivar Planaltina, estimated only for heritability greater than 2 SE.
| Year | Harvest | DM Yield (t/ha) |
CP (g.kg-1) |
IVDMD (g.kg-1) |
NDF (g.kg-1) |
ADF (g.kg-1) |
ADL (g.kg-1) |
CEL (g.kg-1) |
HEMIC (g.kg-1) |
| 2018 | 2 | 2.19 | - | 284.48 | 156.46 | 159.39 | 33.94 | 135.34 | 36.90 |
| 3 | 1.97 | 57.90 | - | - | - | - | 68.60 | - | |
| 2, 3ɫ | - | 37.14 | - | - | - | - | - | - | |
| 2019 | 1 | - | - | - | 88.90 | 116.62 | - | 107.48 | - |
| 2 | 0.37 | - | - | 68.18 | 85.01 | - | 87.01 | - | |
| 3 | 0.46 | 57.11 | 198.08 | 90.06 | 109.63 | - | 116.50 | 55.26 | |
| 1, 2, 3ɫ | 0.17 | 22.41 | - | 52.12 | 57.57 | - | 58.97 | - | |
| 2018-19 | 2,3 & 2,3ǂ | 0.22 | - | 51.19 | 30.16 | 23.28 | 4.18 | 25.21 | 16.51 |
ɫ Data combined across harvests; ǂ Data combined across years.
Table 6.
Half-sib family heritability estimates and associated standard errors (SE) for dry matter yield (DM yield) and forage quality traits in gamba grass cultivar BRS Sarandi.
Table 6.
Half-sib family heritability estimates and associated standard errors (SE) for dry matter yield (DM yield) and forage quality traits in gamba grass cultivar BRS Sarandi.
| Year | Harvest | DM Yield | CP | IVDMD | NDF | ADF | ADL | CEL | HEMIC |
| 2018 | 2 | 0.53 ± 0.14 | 0.51 ± 0.14 | 0.34 ± 0.14 | 0.09 ± 0.15 | 0.21 ± 0.15 | 0.36 ± 0.14 | 0.26 ± 0.15 | 0.21 ± 0.15 |
| 3 | 0.32 ± 0.15 | 0.18 ± 0.15 | 0.13 ± 0.15 | 0.16 ± 0.15 | 0.19 ± 0.15 | 0.16 ± 0.15 | 0.24 ± 0.15 | 0.08 ± 0.15 | |
| 2, 3 ɫ | 0.15 ± 0.07 | 0.13 ± 0.07 | 0.09 ± 0.07 | 0.02 ± 0.08 | 0.11 ± 0.08 | 0.03 ± 0.08 | 0.07 ± 0.08 | 0.01 ± 0.08 | |
| 2019 | 1 | 0.43 ± 0.14 | 0.47 ± 0.14 | 0.56 ± 0.14 | 0.46 ± 0.14 | 0.39 ± 0.14 | 0.22 ± 0.15 | 0.39 ± 0.14 | 0.09 ± 0.15 |
| 2 | 0.42 ± 0.14 | 0.55 ± 0.14 | 0.39 ± 0.14 | 0.27 ± 0.15 | 0.24 ± 0.15 | 0.33 ± 0.14 | 0.22 ± 0.15 | 0.39 ± 0.14 | |
| 3 | 0.25 ± 0.15 | 0.43 ± 0.14 | 0.49 ± 0.14 | 0.27 ± 0.15 | 0.15 ± 0.15 | 0.23 ± 0.15 | 0.14 ± 0.15 | 0.23 ± 0.15 | |
| 1, 2, 3 ɫ | 0.27 ± 0.05 | 0.24 ± 0.05 | 0.24 ± 0.05 | 0.12 ± 0.05 | 0.07 ± 0.05 | 0.11 ± 0.05 | 0.08 ± 0.05 | 0.09 ± 0.05 | |
| 2018-19 | 2,3 & 2,3ǂ | 0.07 ± 0.01 | 0.11 ± 0.01 | 0.08 ± 0.01 | 0.02 ± 0.02 | 0.04 ± 0.02 | 0.02 ± 0.02 | 0.04 ± 0.02 | 0.02 ± 0.02 |
ɫ Data combined across harvests; ǂ Data combined across years; All heritability estimates greater than 2 SE are significant.
Table 7.
Expected gains per cycle of selection based on half-sib family means for dry matter yield (DM yield) and forage quality traits in gamba grass cultivar Sarandi, estimated only for heritability greater than 2 SE.
Table 7.
Expected gains per cycle of selection based on half-sib family means for dry matter yield (DM yield) and forage quality traits in gamba grass cultivar Sarandi, estimated only for heritability greater than 2 SE.
| Year | Harvest | DM Yield (t/ha) |
CP (g.kg-1) |
IVDMD (g.kg-1) |
NDF (g.kg-1) |
ADF (g.kg-1) |
ADL (g.kg-1) |
CEL (g.kg-1) |
HEMIC (g.kg-1) |
| 2018 | 2 | 1.58 | 84.40 | 163.92 | 35.30 | 50.87 | 35.77 | 64.84 | 62.31 |
| 3 | 1.29 | - | - | - | - | - | - | - | |
| 2, 3 ɫ | 0.58 | - | - | - | - | - | - | - | |
| 2019 | 1 | 0.83 | 97.07 | 317.02 | 106.69 | 98.84 | 11.98 | 94.03 | 14.75 |
| 2 | 0.58 | 105.57 | 177.41 | - | - | 17.76 | 56.67 | 70.25 | |
| 3 | - | 71.90 | 222.67 | - | - | - | - | - | |
| 1, 2, 3 ɫ | 0.47 | 59.83 | 154.57 | 43.12 | - | 9.11 | - | - | |
| 2018-19 | 2,3 & 2,3ǂ | 0.24 | 29.40 | 64.13 | - | - | - | - | - |
ɫ Data combined across harvests; ǂ Data combined across years.
Disclaimer/Publisher’s Note: The statements, opinions and data contained in all publications are solely those of the individual author(s) and contributor(s) and not of MDPI and/or the editor(s). MDPI and/or the editor(s) disclaim responsibility for any injury to people or property resulting from any ideas, methods, instructions or products referred to in the content. |
© 2025 by the authors. Licensee MDPI, Basel, Switzerland. This article is an open access article distributed under the terms and conditions of the Creative Commons Attribution (CC BY) license (http://creativecommons.org/licenses/by/4.0/).
Copyright: This open access article is published under a Creative Commons CC BY 4.0 license, which permit the free download, distribution, and reuse, provided that the author and preprint are cited in any reuse.


