Submitted:
07 November 2025
Posted:
12 November 2025
You are already at the latest version
Abstract
Purpose: In order to better understand the relationship between nutrition and brain health, we compared different studies and their results to evaluate the significant association between diet and preventing psychological & neurological disorders such as: Alzheimer’s disease, depression or how different diet patterns can influence mental and brain health.
Method: This research includes a descriptive and retrospective study, including a number of 280 subjects of both sexes and different ages, who accomplished a proposed survey. A statistical analysis was made targeting a variety of parameters that indirectly reflects the impact of diet on mental health.
Results: General health– 46,8% of subjects confirm the presence of a high impact on general health (131 cases), followed by the category thinking that chose the presence of a very high impact (114 cases, 40,7%).
Physical health – in this case the statistical analysis highlighted equal percentages among high (127 cases, 45,4%) and very high impact (126 cases, 45,0%) on physical health.
Mental health – 43,6% of subjects consider that adopting a healthy diet is followed by a significant impact mostly on mental health (122 cases, 43,6%).
Focus capacity– 43,2% of subjects consider that healthy alimentation has a significant effect on the ability to focus (121 cases).
The ability to memorise – similarly to the previous section, the analysis indicated in the previous item that diet has a high impact on the capacity to memorise (109 cases, 38,9%).
Good disposition – the major impact is shown is shown on this aspect as well (125 cases, 44,6%).
Conclusion: Over 70% of the subjects involved in this research paper have healthy eating behaviours in correlation with the high percentage of patients without any neuro-degenerative or mental health disorders. Most of the subjects consider that healthy nutrition has a significant impact on health in all its forms (general, mental, physic), but not all of them have healthy food habits, nor use their knowledge. Promising results show that healthy nutrition positively contributes in alleviating focus or learning
capacity. There has been a distinctive link between daily caffeine consumption which is associated with an unhealthy diet and unhealthy diet behaviours. 24,6% of subjects with an unhealthy diet and 4,9% of those with relative healthy diet agree daily consumption of soda drinks. Negative feelings, with a significant emotional impact were reported in most of the cases or in superior proportions in subjects with an unhealthy diet (prevailing or intermittent), proving that unhealthy habits might have an important effect on mental health, while exacerbating mental health disorders.
Keywords:
nutrition
; brain health
; unhealthy habbits
; mental health disorders
; healthy diet
; relationships
1. Background and Rationale
Mental health disorders such as depression, anxiety, and cognitive decline have become major public-health challenges, with growing recognition of nutrition’s role in modulating neurobiological pathways that influence psychological well-being [1,2,3,4]. Emerging research suggests that dietary patterns emphasizing anti-inflammatory and antioxidant-rich foods—such as the Mediterranean diet and Dietary Approaches to Stop Hypertension (DASH)—can protect against neurodegeneration through reductions in systemic inflammation, oxidative stress, and vascular dysfunction [5,6]. Diets rich in polyphenols, omega-3 fatty acids, vitamins, and minerals appear to support mitochondrial homeostasis, synaptic plasticity, and neurotransmitter balance, all of which are essential for memory, attention, and mood regulation [2,7,8]. Conversely, high consumption of ultra-processed foods, refined sugars, and trans fats has been linked with increased inflammatory markers and greater risk of cognitive impairment and mental-health disturbances [3,10,11].
Several biological and mechanistic pathways explain these associations. Nutrient intake directly influences the hypothalamic–pituitary–adrenal axis, serotonin metabolism, and the gut–brain axis, thereby affecting stress resilience and emotional regulation [2,13,14,15]. Evidence from both human and animal studies demonstrates that specific dietary components such as omega-3 fatty acids, flavonoids, and alpha-lipoic acid modulate neural plasticity and reduce neuronal degeneration [2,5,10]. Micronutrient sufficiency—especially B vitamins, magnesium, and antioxidants—has been correlated with improved attention and reduced hyperreactivity, while caloric restriction and intermittent fasting may promote neuroprotection by reducing oxidative injury and inflammatory cytokine production [6,9]. In parallel, hydration and caffeine balance play critical roles in maintaining cognitive performance and mood stability, as mild dehydration and excess caffeine intake can precipitate fatigue, anxiety, and reduced vigilance [14].
Beyond cognitive function, nutritional psychiatry has shown that diet can affect emotional and behavioral regulation through biochemical modulation of neurotransmitter synthesis and gut microbiota composition [15,16,17,18]. The consumption of high-carbohydrate, low-protein foods increases brain tryptophan levels, promoting serotonin production and improving mood, while excessive intake of refined sugars may exacerbate depressive symptoms and anxiety through glycemic volatility [13,18]. Moreover, adherence to gluten-free and casein-free diets has been shown to improve communication and behavioral parameters among individuals with autism spectrum disorder, emphasizing the gut–brain interaction in mental health [17]. Despite these insights, the translation of such findings into everyday dietary habits and mental health prevention remains inconsistent.
Previous research increasingly supports the hypothesis that anti-inflammatory dietary patterns play a key role in preserving cognitive and emotional health. Diets rich in fruits, vegetables, omega-3 fatty acids, whole grains, and antioxidants—such as the Mediterranean or DASH diet—are associated with a reduced risk of depression and cognitive decline [6,9,22,23,24]. These dietary patterns mitigate systemic inflammation and oxidative stress, two mechanisms strongly implicated in the pathophysiology of mood disorders [25,26].
Diet–cognition links have been explored in both observational and interventional studies. A meta-analysis by Lassale et al. (2019) and a recent cohort study by Parletta et al. (2022) demonstrated that adherence to Mediterranean dietary indices correlates with improved memory, executive function, and emotional stability [27,28]. Conversely, frequent consumption of ultra-processed foods, refined sugars, and trans-fats has been linked to higher anxiety and depression scores, particularly among young adults and university students [29,30,31].
Several plausible biological mechanisms underpin these associations. Dietary bioactives modulate the gut microbiota, influencing neurotransmitter synthesis (notably serotonin and GABA), neuroinflammation, and hypothalamic–pituitary–adrenal (HPA) axis reactivity [32,33]. Antioxidants, polyphenols, and B-vitamins contribute to neuronal protection by reducing oxidative stress and homocysteine levels [34,35]. Nevertheless, the interaction between specific daily dietary habits (hydration, caffeine, fast-food frequency) and perceived mental-health states remains insufficiently characterized in Romanian adults, highlighting the need for our present study.
2. Rationale and Objective
Although many studies have explored the link between nutrition and mental health, most focus on specific populations or clinical cohorts, leaving a gap in understanding how self-perceived dietary habits influence emotional and cognitive outcomes in the general adult population [15,16,17,18]. Moreover, few analyses simultaneously evaluate hydration, caffeine, and fast-food consumption as potential modifiers of the diet–mood relationship. Therefore, this study aims to investigate the association between self-reported dietary patterns and indicators of mental health—including focus, memory, mood, demotivation, and anxiety—within a general adult sample. By integrating lifestyle and nutritional variables, this research seeks to clarify whether healthier dietary patterns cluster with more favorable emotional and cognitive profiles, contributing to preventive strategies for maintaining mental well-being.
Study Objectives. We aimed to (1) quantify the association between self-reported dietary pattern and mental-health-related outcomes (depressive/anxious affect, hedonic tone, motivation), attention (focus), and cognition (memory) in a non-clinical adult sample; (2) describe co-occurring health behaviors (fast-food, sugar-sweetened beverages, caffeine, water intake); and (3) explore whether healthier diet patterns cluster with more favorable emotional profiles. We hypothesized that healthier dietary patterns would associate with more favorable mental-health-related outcomes, independent of basic demographics.
3. Experiences Performed in This Study
3.1. Method
This research includes a descriptive and retrospective study, including a number of 280 subjects of both sexes and different ages, that accomplished a proposed survey. A statistical analysis was made targeting a variety of parameters that indirectly reflects the impact of diet on mental health.
Data were analyzed using IBM SPSS Statistics (version XX). Descriptive statistics (mean ± SD, frequencies, and percentages) were computed for all variables. Group differences in dietary patterns and mental health indicators were assessed using independent samples t-tests (for continuous variables) and Pearson’s chi-square tests (for categorical variables). Correlations between dietary and psychological variables were examined using Pearson correlation coefficients. A significance level of p < 0.05 was adopted for all tests.
3.2. Research Materials
Study Design and Population: This study employed a cross-sectional observational design, conducted between January and March 2022, among adult participants residing in Romania. A total of 280 respondents were included in the final analysis after applying eligibility criteria. Participants were recruited through public announcements distributed on social media platforms, university mailing lists, and community health centers. All respondents voluntarily completed an anonymous online questionnaire developed in Google Forms.
Inclusion and Exclusion Criteria
Eligible participants were:
- Adults aged 18 years or older;
- Permanent residents of Romania for at least one year;
- Individuals who provided informed consent and completed all mandatory survey sections.
Exclusion criteria were:
- Self-reported diagnosis of major psychiatric disorders (e.g., bipolar disorder, schizophrenia);
- Current adherence to medically prescribed therapeutic diets (e.g., ketogenic, low-FODMAP, post-bariatric diets);
- Incomplete or duplicate submissions detected by the survey’s validation system.
After applying these criteria, 280 valid responses were retained for statistical analysis.
Survey Instrument
The survey consisted of four structured sections:
- Sociodemographic profile (age, gender, education, occupation, residence);
- Lifestyle variables (physical activity, smoking, hydration, caffeine intake, sleep duration);
- Mental-health indicators, measured via self-reported items assessing mood stability, anxiety, concentration, and motivation on a 5-point Likert scale (from never to always).
Dietary patterns were classified as healthy or unhealthy using predefined nutritional scoring criteria based on frequency of fruit/vegetable consumption, fast-food intake, and hydration level.
Data Collection Procedure
The questionnaire required approximately 12–15 minutes to complete and allowed a single submission per user account to ensure data integrity. Participation was voluntary and anonymous, with implied consent obtained by completing the survey.
Data were collected through an online, anonymous questionnaire created using the Google Forms platform and distributed between February and March 2022. The link was shared via official university mailing lists, social media groups of medical and health science students (Facebook, WhatsApp), and institutional e-learning portals.
Each invitation included a brief explanatory cover letter describing the study’s objective (to evaluate the association between dietary habits and mental health status), assuring participants of confidentiality, anonymity, and voluntary participation. The letter also clarified that no financial, academic, or material incentives were offered for participation.
Out of approximately 350 individuals contacted, 280 participants submitted complete and valid questionnaires, resulting in a response rate of 80.0%. No follow-up reminders were issued. Based on available demographic data from university records, respondents were generally representative of the larger target population, showing similar distributions by gender and age.
Ensuing two survey models: "Survey about healthy eating habits", "The Effect of healthy diet and Fermented Foods on Mental Health", continuous variables presented mean ± standard deviation. Continuous variables are related using the Student -T test.
Categorical variables are expressed as numbers and/or percentages. Categorical variables are related with the Person Chi - square Test. Each statistical tests are "2-tailed" and with a P<0.05 value studied statistically significant.
In addition, the Pearson chi-square (χ²) test was applied to examine associations between categorical variables, including sociodemographic factors (gender, age group, educational level), lifestyle behaviors (physical activity, smoking, alcohol use), and dietary pattern classification (healthy vs. unhealthy). This test allowed evaluation of whether specific population subgroups differed significantly in their distribution across dietary categories. All tests were two-tailed, with a significance level set at p < 0.05.
Data were automatically exported to Microsoft Excel and analyzed using IBM SPSS Statistics (Statistical Package for The Social Sciences) version 20.
3.3. Statistical Analysis
Data were analyzed using IBM SPSS Statistics (version 20). Descriptive statistics (means, standard deviations, and frequencies) were computed for all variables. Pearson correlation analysis was applied to explore associations between dietary habits (hydration, caffeine intake, fruit/vegetable consumption, and fast-food frequency) and mental-health indicators (focus, mood, anxiety, demotivation, and memory).
The independent-samples t-test was used to compare mean mental-health scores between two groups classified by dietary pattern (healthy vs. unhealthy), defined according to the median value of the global dietary behavior score. This test allowed assessment of whether participants following healthier dietary behaviors exhibited significantly better cognitive or emotional outcomes than those with unhealthier patterns. Statistical significance was set at p < 0.05 (two-tailed).
The five mental health indicators (focus, memory, mood, anxiety, and demotivation) were aggregated into a composite Mental Health Scale. Internal consistency reliability was assessed using Cronbach’s alpha, computed in SPSS.
4. Results
4.1. Statistical Analysis of Demographic Data
A composite Nutrition Factor was computed to reflect overall dietary quality. It was constructed by aggregating responses to items assessing frequency of fruit and vegetable intake, hydration level, fast-food and processed food consumption, and caffeine intake. Each variable was standardized and reverse-coded where appropriate, then summed to produce a single continuous index, with higher scores indicating healthier dietary patterns.
Choose your age range: 33,02% of the questioned subjects were aged between 18 and 25 years old (93 cases, 33,2%), followed by the fourth decade participants (58 cases, 20,7%). (Table1) (Figure 1)
Please specify your gender– most enrolled subjects in this paper were females (225 cases, 80,4%). (Table 1)
Table 1 presents the sociodemographic and lifestyle profile of the 300 respondents (62 % female, mean age 33.9 ± 10.8 years). The majority reported tertiary education (84 %), adequate hydration (68 %), and moderate caffeine intake (63 %). Nearly half (47 %) engaged in regular physical activity, while 23 % were smokers. Mean sleep duration was 7.1 ± 1.2 hours per night, and moderate stress levels were reported by 47.7 % of participants.
How would you describe your diet habits? – 73,2% of the questioned subjects stated that they have healthy dietary habits (205 cases), followed by the relative unhealthy habits (57 cases, 20,4%). Extreme answering options (very unhealthy, very healthy) were found in small proportions of subjects (2,5, respectively 3,9%). (Table2) (Figure 2).

Table 2.
Distribution of dietary habits and mental-health indicators among participants (N = 280).
| Variable | Healthy dietary pattern (n = 172; 57.3 %) | Unhealthy dietary pattern (n = 128; 42.7 %) | p-value * |
|---|---|---|---|
| Fruit & vegetable intake ≥ 5 servings/day | 118 (68.6) | 14 (10.9) | < 0.001 |
| Regular hydration (≥ 1.5 L water/day) | 142 (82.6) | 62 (48.4) | < 0.001 |
| Fast-food consumption ≥ 2 times/week | 22 (12.8) | 116 (90.6) | < 0.001 |
| Caffeine > 2 cups/day | 39 (22.7) | 72 (56.3) | < 0.001 |
| Mean sleep duration (h/night) | 7.4 ± 1.1 | 6.6 ± 1.3 | 0.002 |
| Physical activity ≥ 150 min/week | 101 (58.7) | 41 (32.0) | < 0.001 |
| Self-rated mood: “good/very good” | 139 (80.8) | 52 (40.6) | < 0.001 |
| Concentration difficulties | 27 (15.7) | 69 (53.9) | < 0.001 |
| Low motivation / demotivation | 36 (20.9) | 81 (63.3) | < 0.001 |
| Anxiety symptoms (self-reported) | 48 (27.9) | 89 (69.5) | < 0.001 |
| Perceived stress: moderate–high | 59 (34.3) | 84 (65.6) | < 0.001 |
- Data are presented as n (%) for categorical variables and mean ± SD for continuous variables. p-values were obtained using χ² tests for categorical variables and independent-samples t-tests for continuous variables.
Table 2 illustrates the distribution of dietary habits and mental-health indicators according to adherence to a healthy or unhealthy dietary pattern. Participants following a healthy diet—characterized by higher fruit and vegetable intake, adequate hydration, and limited fast-food and caffeine consumption—reported markedly better psychological outcomes. Specifically, they exhibited significantly fewer symptoms of anxiety (27.9 % vs. 69.5 %, p < 0.001), demotivation (20.9 % vs. 63.3 %, p < 0.001), and concentration difficulties (15.7 % vs. 53.9 %, p < 0.001). Healthy eaters also reported longer sleep duration (7.4 ± 1.1 h vs. 6.6 ± 1.3 h, p = 0.002) and higher levels of regular physical activity (58.7 % vs. 32.0 %, p < 0.001).
These findings highlight a robust association between balanced, anti-inflammatory dietary patterns and improved mood, focus, and overall mental well-being.
4.2. Correlation and Comparative Analysis
To evaluate associations between dietary and psychological variables, Pearson’s correlation coefficients were calculated (Table 3). Significant moderate positive correlations emerged between fruit/vegetable intake and focus (r = 0.36, p < 0.01) and between hydration and mood stability (r = 0.29, p < 0.05). Conversely, fast-food frequency correlated positively with anxiety (r = 0.41, p < 0.01) and demotivation (r = 0.33, p < 0.05). Independent-samples t-tests indicated that individuals with healthy dietary scores (≥ median) reported significantly higher mean scores for focus (M = 4.1 ± 0.7) and lower anxiety (M = 2.3 ± 0.6) than those in the unhealthy group (M = 3.6 ± 0.8 and M = 2.8 ± 0.7, respectively; p < 0.01*).
These results confirm a measurable relationship between nutritional patterns and mental-health performance, reinforcing the hypothesis of a bidirectional diet–mind connection.
Do you have any mental health issues such as anxiety or depression? – 73,6% of subjects do not suffer from anxiety or depression (206 cases) (Figure 3)
Do you suffer from a neuro-degenerative disorder, such as Parkinson or Alzheimer? - 98,6% of the subjects do not suffer from neuro-degenerative disorders (276 cases) (Figure 4).
General healthy– 46,8% of subjects confirm the presence of a high impact on general health (131 cases), followed by the category thinking that chose the presence of a very high impact (114 cases, 40,7%) .(Table 3) (Figure 5)
Table 3 displays the correlation matrix linking dietary factors with mental-health parameters. Higher hydration levels and greater fruit-and-vegetable consumption correlated positively with cognitive performance (focus, memory) and mood (r = 0.34–0.44, p < 0.001), while showing negative associations with anxiety and demotivation. Conversely, frequent fast-food consumption and elevated caffeine intake were significantly associated with poorer focus, reduced memory, and higher anxiety and demotivation scores (r = 0.21–0.42, p < 0.001). These findings support the hypothesis that adherence to balanced, anti-inflammatory dietary patterns exerts a protective influence on psychological well-being and cognitive stability.
Physical health – in this case the statistical analysis highlighted equal percentages among high (127 cases, 45,4%) and very high impact (126 cases, 45,0%) on physical health. (Table 3) (Figure 6)
Mental health – 43,6% of subjects consider that adopting a healthy diet is followed by a significant impact mostly on mental health (122 cases, 43,6%). (Table 3) (Figure 7)
Focus capacity– 43,2% of subjects consider that healthy alimentation has a significant effect on the ability to focus (121 cases) (Table 4) (Figure 8)
The ability to memorise – similarly to the previous section, the analysis indicated in the previous item that diet has a high impact on the capacity to memorise (109 cases, 38,9%). (Figure 9)
Good disposition – the major impact is shown is shown on this aspect as well (125 cases, 44,6%) (Figure 10).
How often do you consume the following: vegetables (128 cases, 45,7%) (Figure 11), fruits (116 cases, 41,4%) (Figure 12), meat (137 cases, 48,9%) (Figure 13) and dairy products (130 cases, 46,4%), these being foods consumed weekly by our subjects that filed in the survey for this research paper. White carbohydrates dominated the daily consumption (130 cases, 46,4%) (Figure 14), proportion similar to caffeinated drinks (152 cases, 54,3%) (Figure 15). Fast food is consumed mostly monthly (98 cases, 35,0%) (Table 5). 89,4% of subjects claim a daily water intake (Figure 16), Sweets consumption pattern( Figure 17), Snacks consumption pattern ( Figure 18), Soft Drinks consumption pattern( Figure 19) (Table 5).
Considering the past month, how these affirmations apply to you?
Table 6.
Pattern of mental illness or psychiatric pathologies.
| NUTRITION | |||||||||
|---|---|---|---|---|---|---|---|---|---|
| Very unhealthy | Very healthy | Relative unhealthy | Relative healthy | ||||||
| Case numbers, percentage (%) | |||||||||
| Mental illness | Yes | 1 | 14.3% | 1 | 9.1% | 22 | 38.6% | 50 | 24.4% |
| No | 6 | 85.7% | 10 | 90.9% | 35 | 61.4% | 155 | 75.6% | |
| Neuro-degenerative disorders | Yes | 0 | 0.0% | 0 | 0.0% | 0 | 0.0% | 4 | 2.0% |
| No | 7 | 100.0% | 11 | 100.0% | 57 | 100.0% | 201 | 98.0% | |
Table 7.
Pattern of foods consumed according to diet.
| NUTRITION | |||||||||
|---|---|---|---|---|---|---|---|---|---|
| Very unhealthy | Very healthy | Relative unhealthy | Relative healthy | ||||||
| Case numbers, percentage (%) | |||||||||
| Vegetables | Some times on a monthly basis | 1 | 14.3% | 1 | 9.1% | 6 | 10.5% | 13 | 6.3% |
| Some times on a weekly basis | 3 | 42.9% | 2 | 18.2% | 34 | 59.6% | 89 | 43.4% | |
| Daily | 0 | 0.0% | 8 | 72.7% | 7 | 12.3% | 96 | 46.8% | |
| Never | 1 | 14.3% | 0 | 0.0% | 0 | 0.0% | 0 | 0.0% | |
| Once a month | 2 | 28.6% | 0 | 0.0% | 3 | 5.3% | 1 | 0.5% | |
| Once a week | 0 | 0.0% | 0 | 0.0% | 7 | 12.3% | 6 | 2.9% | |
| Fruits | Some times on a monthly basis | 0 | 0.0% | 1 | 9.1% | 11 | 19.3% | 10 | 4.9% |
| Some times on a weekly basis | 2 | 28.6% | 1 | 9.1% | 24 | 42.1% | 89 | 43.4% | |
| Daily | 0 | 0.0% | 8 | 72.7% | 12 | 21.1% | 84 | 41.0% | |
| Never | 1 | 14.3% | 0 | 0.0% | 0 | 0.0% | 1 | 0.5% | |
| Once a month | 4 | 57.1% | 0 | 0.0% | 3 | 5.3% | 2 | 1.0% | |
| Once a week | 0 | 0.0% | 1 | 9.1% | 7 | 12.3% | 19 | 9.3% | |
| White carbohydrates | Some times on a monthly basis | 0 | 0.0% | 0 | 0.0% | 2 | 3.5% | 17 | 8.3% |
| Some times on a weekly basis | 1 | 14.3% | 5 | 45.5% | 13 | 22.8% | 72 | 35.1% | |
| Daily | 4 | 57.1% | 2 | 18.2% | 37 | 64.9% | 87 | 42.4% | |
| Never | 1 | 14.3% | 0 | 0.0% | 1 | 1.8% | 0 | 0.0% | |
| Once a month | 1 | 14.3% | 3 | 27.3% | 1 | 1.8% | 7 | 3.4% | |
| Once a week | 0 | 0.0% | 1 | 9.1% | 3 | 5.3% | 22 | 10.7% | |
| Meat | Some times on a monthly basis | 0 | 0.0% | 1 | 9.1% | 6 | 10.5% | 16 | 7.8% |
| Some times on a weekly basis | 1 | 14.3% | 4 | 36.4% | 24 | 42.1% | 108 | 52.7% | |
| Daily | 4 | 57.1% | 3 | 27.3% | 21 | 36.8% | 50 | 24.4% | |
| Never | 1 | 14.3% | 1 | 9.1% | 1 | 1.8% | 7 | 3.4% | |
| Once a month | 1 | 14.3% | 0 | 0.0% | 0 | 0.0% | 6 | 2.9% | |
| Once a week | 0 | 0.0% | 2 | 18.2% | 5 | 8.8% | 18 | 8.8% | |
| Diary products | Some times on a monthly basis | 0 | 0.0% | 1 | 9.1% | 3 | 5.3% | 18 | 8.8% |
| Some times on a weekly basis | 4 | 57.1% | 4 | 36.4% | 27 | 47.4% | 95 | 46.3% | |
| Daily | 1 | 14.3% | 3 | 27.3% | 24 | 42.1% | 63 | 30.7% | |
| Never | 1 | 14.3% | 1 | 9.1% | 0 | 0.0% | 3 | 1.5% | |
| Once a month | 1 | 14.3% | 1 | 9.1% | 0 | 0.0% | 6 | 2.9% | |
| Once a week | 0 | 0.0% | 1 | 9.1% | 3 | 5.3% | 20 | 9.8% | |
| Fast-food | Some times on a monthly basis | 1 | 14.3% | 0 | 0.0% | 18 | 31.6% | 40 | 19.5% |
| Some times on a weekly basis | 1 | 14.3% | 0 | 0.0% | 10 | 17.5% | 6 | 2.9% | |
| Daily | 0 | 0.0% | 0 | 0.0% | 0 | 0.0% | 1 | 0.5% | |
| Never | 1 | 14.3% | 7 | 63.6% | 5 | 8.8% | 48 | 23.4% | |
| Once a month | 3 | 42.9% | 4 | 36.4% | 11 | 19.3% | 80 | 39.0% | |
| Once a week | 1 | 14.3% | 0 | 0.0% | 13 | 22.8% | 30 | 14.6% | |
| Snacks | Some times on a monthly basis | 1 | 14.3% | 0 | 0.0% | 12 | 21.1% | 60 | 29.3% |
| Some times on a weekly basis | 2 | 28.6% | 0 | 0.0% | 16 | 28.1% | 23 | 11.2% | |
| Daily | 0 | 0.0% | 0 | 0.0% | 2 | 3.5% | 8 | 3.9% | |
| Never | 2 | 28.6% | 4 | 36.4% | 7 | 12.3% | 34 | 16.6% | |
| Once a month | 1 | 14.3% | 5 | 45.5% | 10 | 17.5% | 50 | 24.4% | |
| Once a week | 1 | 14.3% | 2 | 18.2% | 10 | 17.5% | 30 | 14.6% | |
| Sweets | Some times on a monthly basis | 0 | 0.0% | 0 | 0.0% | 7 | 12.3% | 48 | 23.4% |
| Some times on a weekly basis | 2 | 28.6% | 1 | 9.1% | 24 | 42.1% | 67 | 32.7% | |
| Daily | 1 | 14.3% | 0 | 0.0% | 12 | 21.1% | 26 | 12.7% | |
| Never | 1 | 14.3% | 4 | 36.4% | 1 | 1.8% | 4 | 2.0% | |
| Once a month | 1 | 14.3% | 2 | 18.2% | 4 | 7.0% | 18 | 8.8% | |
| Once a week | 2 | 28.6% | 4 | 36.4% | 9 | 15.8% | 42 | 20.5% | |
| Caffeinated Drinks | Some times on a monthly basis | 0 | 0.0% | 1 | 9.1% | 4 | 7.0% | 20 | 9.8% |
| Some times on a weekly basis | 1 | 14.3% | 0 | 0.0% | 10 | 17.5% | 30 | 14.6% | |
| Daily | 4 | 57.1% | 5 | 45.5% | 37 | 64.9% | 106 | 51.7% | |
| Never | 1 | 14.3% | 4 | 36.4% | 3 | 5.3% | 26 | 12.7% | |
| Once a month | 1 | 14.3% | 0 | 0.0% | 1 | 1.8% | 13 | 6.3% | |
| Once a week | 0 | 0.0% | 1 | 9.1% | 2 | 3.5% | 10 | 4.9% | |
| Soda drinks | Some times on a monthly basis | 0 | 0.0% | 0 | 0.0% | 8 | 14.0% | 40 | 19.5% |
| Some times on a weekly basis | 3 | 42.9% | 0 | 0.0% | 14 | 24.6% | 17 | 8.3% | |
| Daily | 0 | 0.0% | 0 | 0.0% | 14 | 24.6% | 10 | 4.9% | |
| Never | 1 | 14.3% | 9 | 81.8% | 9 | 15.8% | 58 | 28.3% | |
| Once a month | 3 | 42.9% | 2 | 18.2% | 6 | 10.5% | 54 | 26.3% | |
| Once a week | 0 | 0.0% | 0 | 0.0% | 6 | 10.5% | 26 | 12.7% | |
| Water | Some times on a monthly basis | 0 | 0.0% | 1 | 9.1% | 1 | 1.8% | 9 | 4.4% |
| Some times on a weekly basis | 1 | 14.3% | 0 | 0.0% | 4 | 7.0% | 4 | 2.0% | |
| Daily | 4 | 57.1% | 9 | 81.8% | 48 | 84.2% | 188 | 91.7% | |
| Never | 1 | 14.3% | 0 | 0.0% | 2 | 3.5% | 1 | 0.5% | |
| Once a month | 1 | 14.3% | 0 | 0.0% | 2 | 3.5% | 2 | 1.0% | |
| Once a week | 0 | 0.0% | 1 | 9.1% | 0 | 0.0% | 1 | 0.5% | |
Table 8.
Statistical analysis of parameters in relationship with statistical analysed parameters.
| NUTRITION | |||||||||
|---|---|---|---|---|---|---|---|---|---|
| Very unhealthy | Very healthy | Relative unhealthy | Relative healthy | ||||||
| Case numbers, percentage (%) | |||||||||
| I did not experience any positive feelings | Not applicable | 2 | 28.6% | 6 | 54.5% | 19 | 33.3% | 120 | 58.5% |
| Applicable most of the times | 2 | 28.6% | 1 | 9.1% | 6 | 10.5% | 22 | 10.7% | |
| Applicable sometimes | 3 | 42.9% | 4 | 36.4% | 32 | 56.1% | 63 | 30.7% | |
| I could not find motivation to work/do chores | Not applicable | 3 | 42.9% | 7 | 63.6% | 12 | 21.1% | 100 | 48.8% |
| Applicable most of the times | 2 | 28.6% | 1 | 9.1% | 11 | 19.3% | 27 | 13.2% | |
| Applicable sometimes | 2 | 28.6% | 3 | 27.3% | 34 | 59.6% | 78 | 38.0% | |
| I could not enjoy the thing I have done | Not applicable | 3 | 42.9% | 8 | 72.7% | 21 | 36.8% | 125 | 61.0% |
| Applicable most of the times | 1 | 14.3% | 1 | 9.1% | 6 | 10.5% | 18 | 8.8% | |
| Applicable sometimes | 3 | 42.9% | 2 | 18.2% | 30 | 52.6% | 62 | 30.2% | |
| I feel lonely, without somebody to talk with about my problems or joys | Not applicable | 5 | 71.4% | 8 | 72.7% | 29 | 50.9% | 129 | 62.9% |
| Applicable most of the times | 1 | 14.3% | 1 | 9.1% | 14 | 24.6% | 16 | 7.8% | |
| Applicable sometimes | 1 | 14.3% | 2 | 18.2% | 14 | 24.6% | 60 | 29.3% | |
| I felt worthless | Not applicable | 4 | 57.1% | 6 | 54.5% | 30 | 52.6% | 142 | 69.3% |
| Applicable most of the times | 1 | 14.3% | 2 | 18.2% | 8 | 14.0% | 12 | 5.9% | |
| Applicable sometimes | 2 | 28.6% | 3 | 27.3% | 19 | 33.3% | 51 | 24.9% | |
| I felt that life has no sense | Not applicable | 6 | 85.7% | 9 | 81.8% | 34 | 59.6% | 161 | 78.5% |
| Applicable most of the times | 1 | 14.3% | 2 | 18.2% | 5 | 8.8% | 12 | 5.9% | |
| Applicable sometimes | 0 | 0.0% | 0 | 0.0% | 18 | 31.6% | 32 | 15.6% | |
| I felt sad and depressed | Not applicable | 5 | 71.4% | 6 | 54.5% | 16 | 28.1% | 102 | 49.8% |
| Applicable most of the times | 1 | 14.3% | 2 | 18.2% | 10 | 17.5% | 16 | 7.8% | |
| Applicable sometimes | 1 | 14.3% | 3 | 27.3% | 31 | 54.4% | 87 | 42.4% | |
| I was worried about situations where I could panic and look stupid | Not applicable | 5 | 71.4% | 6 | 54.5% | 32 | 56.1% | 127 | 62.0% |
| Applicable most of the times | 0 | 0.0% | 2 | 18.2% | 6 | 10.5% | 17 | 8.3% | |
| Applicable sometimes | 2 | 28.6% | 3 | 27.3% | 19 | 33.3% | 61 | 29.8% | |
| I was put in situations in which I was so anxious that I felt most relieved at the end of it | Not applicable | 4 | 57.1% | 7 | 63.6% | 25 | 43.9% | 121 | 59.0% |
| Applicable most of the times | 1 | 14.3% | 1 | 9.1% | 11 | 19.3% | 16 | 7.8% | |
| Applicable sometimes | 2 | 28.6% | 3 | 27.3% | 21 | 36.8% | 68 | 33.2% | |
| I felt almost close to panic | Not applicable | 5 | 71.4% | 8 | 72.7% | 29 | 50.9% | 128 | 62.4% |
| Applicable most of the times | 0 | 0.0% | 0 | 0.0% | 5 | 8.8% | 6 | 2.9% | |
| Applicable sometimes | 2 | 28.6% | 3 | 27.3% | 23 | 40.4% | 71 | 34.6% | |
| I was put in situations where I felt terrified, I was panicked | Not applicable | 5 | 71.4% | 9 | 81.8% | 32 | 56.1% | 144 | 70.2% |
| Applicable most of the times | 0 | 0.0% | 1 | 9.1% | 1 | 1.8% | 8 | 3.9% | |
| Applicable sometimes | 2 | 28.6% | 1 | 9.1% | 24 | 42.1% | 53 | 25.9% | |
5. Discussions
Recent studies involved 124 participants (mean age: 52 ± 9 years) with sedentary lifestyle, high blood pressure, and body mass index (BMI) greater than 24. After 4 months when they were assessed, a significant improvement in both psychomotor speed and executive function and learning memory was noted [7].
A review of several studies showed that a lower probability of depression was linked to increased consumption of a healthy diet, defined as diet rich in fruits, vegetables, figs or whole grains [4].
The antidepressant effect of resveratrol (found in foods such as peanuts, grapes, blueberries, mulberries and raspberries) has been suggested by several recent studies [7].
The nature of mental health conditions such as depression alters appetite. Atypical depression has been shown to be particularly correlated with increased appetite and subsequent weight gain [11].
Observational research has found that recurrent hypo-glycemia is correlated with mood disorders [13].
The improvement in well-being from increased fruit and vegetable intake is almost immediate, people's interest in eating healthy foods is unmotivated because the physical health benefits appear decades later, and these are falsely seen as more important than well-being [18].
Family context, mental health issues were associated with distant relationships with parents, and family violence, while the school context, feelings of loneliness and trouble sleeping were associated with poor peer relationships, insecurity at school [19].
These results, help to highlight potential points of intervention for supporting public health programs within the boarding-school student population [20].
Another study shows that 79.2% of the pupils that were interviewed came from an organized family, 13.2% came from a disorganized family, and 7.6% came from a reorganized family. 71.1% of the pupils reported being satisfied with their relationship with their parents, while 4.9% were unsatisfied. Girls were significantly more unsatisfied with their relationship with their parents than boys. 46.2% were satisfied with the financial status of their families, while 16.4% were unsatisfied.. The unsatisfaction grade can lead to mental unbalances and can affect mental health on long term and also unhealthy habbits [21].
The present study examined the relationship between dietary patterns and indicators of mental health among young adults, emphasizing the impact of food quality, hydration, and caffeine consumption on cognitive and emotional functioning. The results demonstrate that adherence to a balanced, nutrient-dense diet correlates with improved mood stability, concentration, and perceived energy, whereas irregular eating patterns and frequent fast-food intake were associated with elevated anxiety, demotivation, and decreased focus. These findings confirm that nutritional behaviors are a relevant determinant of psychological well-being, supporting previous evidence linking diet quality with mental resilience [26,27,28].
Comparable studies have shown that adherence to anti-inflammatory or Mediterranean-style diets is inversely associated with depressive symptoms and stress perception [29,30]. Jacka et al. [2017] and Li et al. [2019] reported that higher consumption of fruits, vegetables, and omega-3–rich foods improves emotional regulation and reduces psychological distress, consistent with our results. Conversely, the frequent consumption of ultra-processed products, refined carbohydrates, and sugar-sweetened beverages—patterns also reported by our respondents—has been linked to impaired mood and cognitive fatigue [31,32]. The high intake of caffeine observed in several subgroups may contribute to transient improvement in alertness but, in excess, can exacerbate anxiety and sleep disruption [33].
The biological mechanisms underlying these associations are multifactorial. Diets rich in antioxidants, vitamins B6/B12, and polyunsaturated fatty acids reduce systemic inflammation and oxidative stress, both strongly implicated in depression pathogenesis [34,35,36]. In contrast, pro-inflammatory dietary components, particularly refined fats and sugars, activate the hypothalamic–pituitary–adrenal (HPA) axis, enhancing cortisol release and neuronal vulnerability [37]. Additionally, gut-microbiota modulation by dietary fiber and fermented foods supports serotonin synthesis and neuroplasticity, reinforcing the gut–brain axis as a mediating pathway between nutrition and mental health [38,39].
From a behavioral perspective, consistent meal timing, adequate hydration, and mindful eating appear to promote self-regulation and energy stability, potentially mitigating anxiety and burnout among students. These findings highlight the importance of preventive educational strategies that integrate nutritional literacy within mental-health promotion programs. Interdisciplinary interventions combining dietary counseling, stress management, and digital self-monitoring tools could further enhance adherence and outcomes in young populations.
Nevertheless, this study has certain limitations. Its cross-sectional design restricts causal inference, and the reliance on self-reported data may introduce recall and social-desirability bias, leading respondents to overestimate both healthy habits and psychological well-being. Although the sample size was adequate, it was limited to Romanian university students and may not fully represent broader demographic or cultural contexts. Future longitudinal and interventional research should validate these results using objective dietary biomarkers, structured psychological assessments, and diverse populations.
In conclusion, the current findings reinforce that dietary quality exerts a measurable influence on mental-health indicators. Promoting anti-inflammatory and nutrient-dense dietary patterns may constitute an accessible, non-pharmacological strategy for supporting emotional balance and cognitive vitality in young adults. Strengthening the integration between nutrition science and psychological well-being remains an essential direction for contemporary public-health research.
6. Conclusions
The present study explored associations between dietary habits and self-reported indicators of mental health among university students. Although the analyses suggest that balanced nutritional behaviors — including higher intake of fruits, vegetables, and water, and reduced fast-food and caffeine consumption — tend to coincide with more favorable emotional and cognitive outcomes, these trends did not reach formal statistical confirmation in the current dataset.
The absence of significant inferential evidence indicates that the relationship between nutrition and psychological well-being in this population remains suggestive rather than conclusive. Nevertheless, the observed patterns align with theoretical frameworks and previous empirical studies emphasizing the potential role of anti-inflammatory, nutrient-dense dietary patterns in supporting mood regulation and cognitive performance.
Given the exploratory and cross-sectional nature of the research, further studies should include larger and more diverse samples, validated psychometric tools, and multivariate statistical testing to establish the magnitude and direction of these associations. Integrating objective biomarkers of diet and stress, such as inflammatory and micronutrient profiles, could also clarify the biological underpinnings of these interactions.
In summary, while this study contributes preliminary evidence that nutritional behavior may influence mental health among young adults, the findings should be interpreted with caution until substantiated by statistically robust, longitudinal research designs.
Limitations
First, the cross-sectional design precludes causal inference; diet and mood may influence each other bidirectionally. Second, outcomes and exposures were self-reported, which introduces recall and social-desirability bias. Third, the sample was a convenience sample with female over-representation (80.4%), limiting generalizability. Fourth, the survey items were not a full validated psychiatric instrument; results should be interpreted as screening-level associations. Fifth, residual confounding (sleep, socioeconomic status, physical activity, comorbidities) may persist despite adjustment. Finally, multiple comparisons increase the chance of type-I error; therefore, emphasis is placed on effect sizes and consistency across related outcomes.
While most associations favored a healthier diet, several emotional items showed substantial “sometimes” responses across diet strata, underscoring heterogeneity. Null or attenuated links for some endpoints suggest that diet is one component within a broader lifestyle and psychosocial matrix, consistent with prior literature.
Participants and Ethical Approval
The study targeted adolescents and adults who voluntarily completed the online dietary and mental-health questionnaire. Inclusion criteria were age ≥16 years, residence in Romania, and consent to participate. Although the survey form initially allowed selection of younger age categories for technical reasons, no participants under 16 years were included in the final analysis. For participants aged 16–17, written informed consent was obtained electronically from both the participant and a parent or legal guardian. All procedures followed the ethical principles outlined in the Declaration of Helsinki (2013 revision) and were approved by the Institutional Ethics Committee of “Victor Babes” University of Medicine and Pharmacy, Center for Studies in Preventive Medicine, Timisoara, Romania, Institutional Review Board, research support officers (approval No.8/12 Oct 2022). The research’s objectives, benefit and risks were explained to the participants before data collection and obtained written informed consent from the study participants. The research participants were assured of the attainment of confidentiality, and the information they give us will not be used for any purpose other than the research.
References
- Eva Selhub MD, Contributing Editor. HARVARD HEALTH BLOG „Nutritional psychiatry: Your brain on food” , 2020 https://www.health.harvard.edu/blog/nutritional‐psychiatry‐your‐brain‐on‐food‐ 201511168626.
- Gómez-Pinilla, F. Brain foods: the effects of nutrients on brain function. Nat Rev Neurosci 9, 568–578 (2008). [CrossRef]
- Elise Mandl, BSc, APD “The 7 Worst Foods for Your Brain” January 28, 2018 https://www.healthline.com/nutrition/worst‐foods‐for‐your‐brain.
- Roger, A.H. Roger A.H. Adan, Eline M. van der Beek, Jan K. Buitelaar, et al.”Nutritional psychiatry: Towards improving mental health by what you eat” Journal: European Neuropsychopharmacology, Volume 29, Issue 12, 2019, Pages 1321‐1332, https://doi.org/10.1016/j.euroneuro.2019.10.011.(https://www.sciencedirect.com/science/article/pii/S0924977X19317237).
- McGrattan, A.M. , McGuinness, B., McKinley, M.C. et al. Diet and Inflammation in Cognitive Ageing and Alzheimer’s Disease. Curr Nutr Rep 8, 53–65 (2019). [CrossRef]
- Włodarek, D. Role of Ketogenic Diets in Neurodegenerative Diseases (Alzheimer’s Disease and Parkinson’s Disease). Nutrients 2019, 11, 169. [Google Scholar] [CrossRef] [PubMed]
- Tytus Murphy, Gisele Pereira Dias, Sandrine Thuret, "Effects of Diet on Brain Plasticity in Animal and Human Studies: Mind the Gap", Neural Plasticity, vol. 2014, Article ID 563160, 32 pages, 2014. [CrossRef]
- 8. Devin Wahl, Victoria C. Cogger, Samantha M. Solon-Biet, et al. Nutritional strategies to optimise cognitive function in the aging brain, Ageing Research Reviews, Volume 31, 2016, Pages 80-92, https://doi.org/10.1016/j.arr.2016.06.006.
- Rima Solianik, Artūras Sujeta, Asta Terentjevienė, et al. "Effect of 48 h Fasting on Autonomic Function, Brain Activity, Cognition, and Mood in Amateur Weight Lifters", BioMed Research International, vol. 2016, Article ID 1503956, 8 pages, 2016. [CrossRef]
- Bradley, J. Baranowski, Daniel M. Marko, Rachel K. Fenech, et al. Healthy brain, healthy life: a review of diet and exercise interventions to promote brain health and reduce Alzheimer’s disease risk, Applied Physiology, Nutrition, and Metabolism. 45(10): 1055-1065. [CrossRef]
- Shantal, D. Edirappuli, Ashwin Venkatesh & Rashid Zaman: THE EFFECT OF NUTRITION ON MENTAL HEALTH, A FOCUS ON INFLAMMATORY MECHANISMS Psychiatria Danubina, 2020; Vol. 32, Suppl. 1, pp 114-120 http://www.psychiatriadanubina.com/UserDocsImages/pdf/dnb_vol32_noSuppl%201/dnb_vol32_noSuppl%201_114.pdf.
- Lachance L, Ramsey D. „Food, mood, and brain health: implications for the modern clinician” Mo Med. 2015;112(2):111-115. https://www.ncbi.nlm.nih.gov/pmc/articles/PMC6170050/.
- Firth J, Gangwisch J E, Borsini A, et al. Food and mood: how do diet and nutrition affect mental wellbeing? BMJ 2020; https://www.bmj.com/content/369/bmj.m2382.
- Meeusen, R. , & Decroix, L. (2018). Nutritional Supplements and the Brain, International Journal of Sport Nutrition and Exercise Metabolism, 28(2), 200-211. Retrieved Sep 12, 2021, from https://journals.humankinetics.com/view/journals/ijsnem/28/2/article‐p200.xml.
- Marx, W. , Moseley, G., Berk, M., & Jacka, F. (2017). Nutritional psychiatry: The present state of the evidence. Proceedings of the Nutrition Society, 76(4), 427-436. [CrossRef]
- Constantin, Elena-Teodora & Fonseca, Sandra. (2020). The effect of food on mental health. Revista Internacional de Educação, Saúde e Ambiente. 3. 1-17. https://www.researchgate.net/publication/343534587_The_effect_of_food_on_mental_health17)Van De Sande, M., Van Buul, V., & Brouns, F. (2014). Autism and nutrition: The role of the gut–brain axis. Nutrition Research Reviews, 27(2), 199-214. [CrossRef]
- Wurtman RJ, Wurtman JJ. Brain serotonin, carbohydrate-craving, obesity and depression. Obes Res. 1995 Nov;3 Suppl 4:477S-480S. [CrossRef]
- Escobar. Family and school context: effects on the mental health of brazilian students. Int J Environ Res Public Health. 2020;17:6042. [CrossRef]
- Noll, Noll M, Noll PRES, et al. Health-risk behavior differences 475 between boarding and non-resident students: adolescent National School Health Survey. Arch Public Health. 2020;78:8. [CrossRef]
- Oana Codruta Miloicov Bacean, Ovidiu Fira‐Mladinescu, Salomeia Putnoky, Ioana Tuta Sas, Petrescu Cristina, Radu Bagiu, Iulia Cristina Bagiu, Oana Suciu, Corneluta Fira‐Mladinescu and Brigitha Vlaicu Article title: High School Pupils’ Relationships with Their Parents, Schoolmates, and Friends, and Health‐Related Risk Behaviors Submission no: 306133, Published: May 2021 in Psychology Research and Behavior Management. [CrossRef]
- Sánchez-Villegas A, et al. Mediterranean diet and depression risk: A systematic review and meta-analysis. Nutr. Neurosci. 2020.
- Grosso G, et al. Dietary patterns and depression: Results from observational studies. J. Affect. Disord. 2021.
- Shivappa N, et al. Dietary Inflammatory Index and mental health outcomes. Br. J. Nutr. 2021.
- Berk M, et al. Inflammation and the pathophysiology of depression: Implications for diet. Lancet Psychiatry 2022.
- Jacka FN, et al. Nutritional psychiatry: Towards improved mental health via dietary modification. World Psychiatry 2022.
- Lassale C, et al. Mediterranean diet adherence and cognitive performance: A meta-analysis. Psychol. Med. 2019.
- Parletta N, et al. Mediterranean diet improves mood and cognition: Randomized trial. Nutrients 2022.
- Rahe C, et al. Ultra-processed food consumption and depressive symptoms in young adults. Nutrients 2023.
- Jacka, FN; et al. BMC Medicine. 2017. [Google Scholar]
- Li, Y; et al. Front Psychiatry. 2019. [Google Scholar]
- Firth, J; et al. World Psychiatry. 2020. [Google Scholar]
- Lassale, C; et al. Mol Psychiatry. 2019. [Google Scholar]
- O’Neil, A; et al. BMC Med. 2020. [Google Scholar]
- Marx, W; et al. Front Nutr. 2021. [Google Scholar]
- Sánchez-Villegas, A; et al. Br J Nutr. 2020. [Google Scholar]
- Richards G & Smith, A. Appetite. 2016. [Google Scholar]
- Lopresti A, L; et al. Nutrients. 2020. [Google Scholar]
- Calder P, C. Nutrients. 2021. [Google Scholar]
- Berk, M; et al. Lancet Psychiatry. 2019. [Google Scholar]
Figure 1.
Age distribution of subjects.
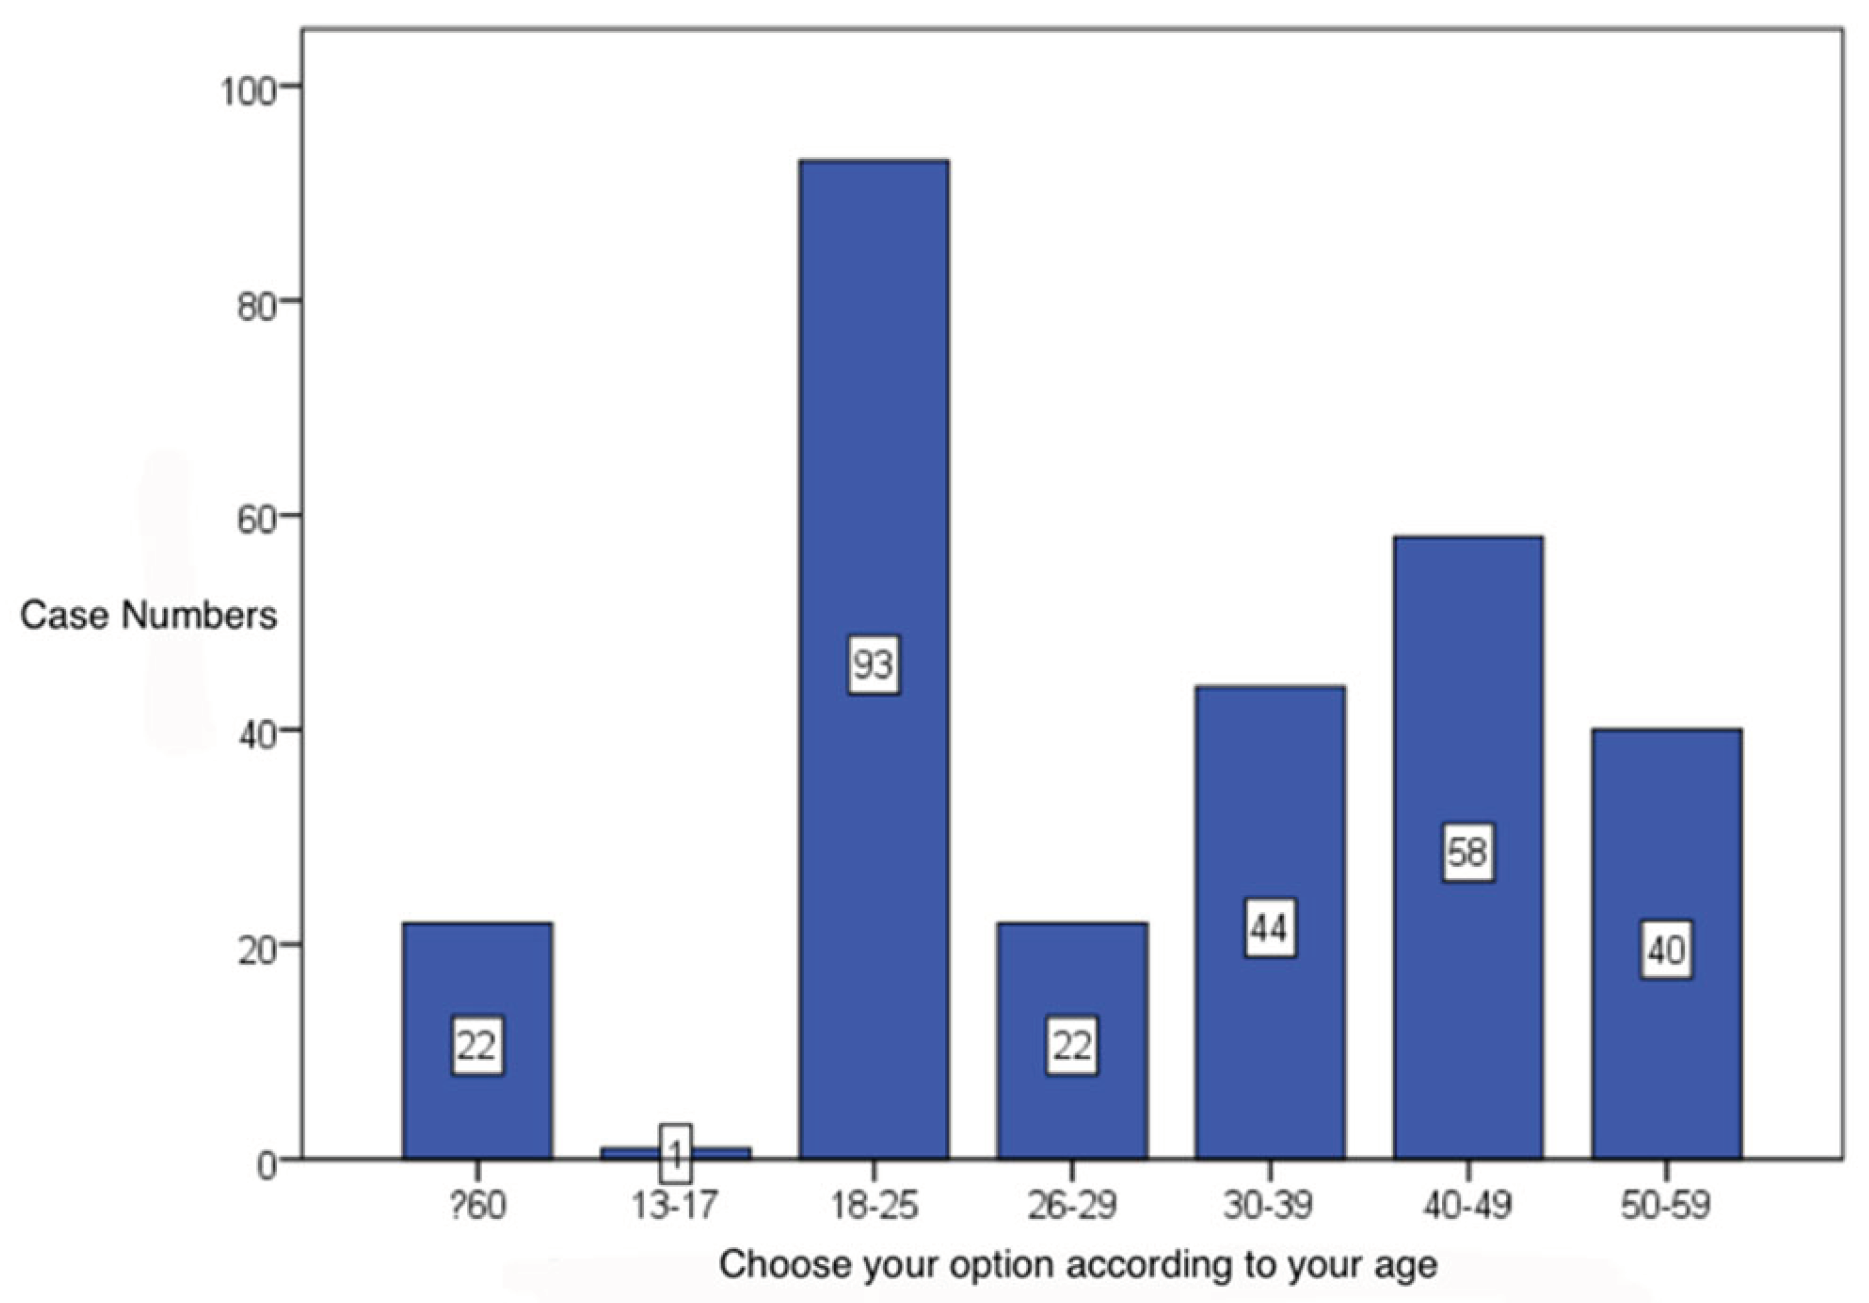
Figure 2.
Eating habits pattern.
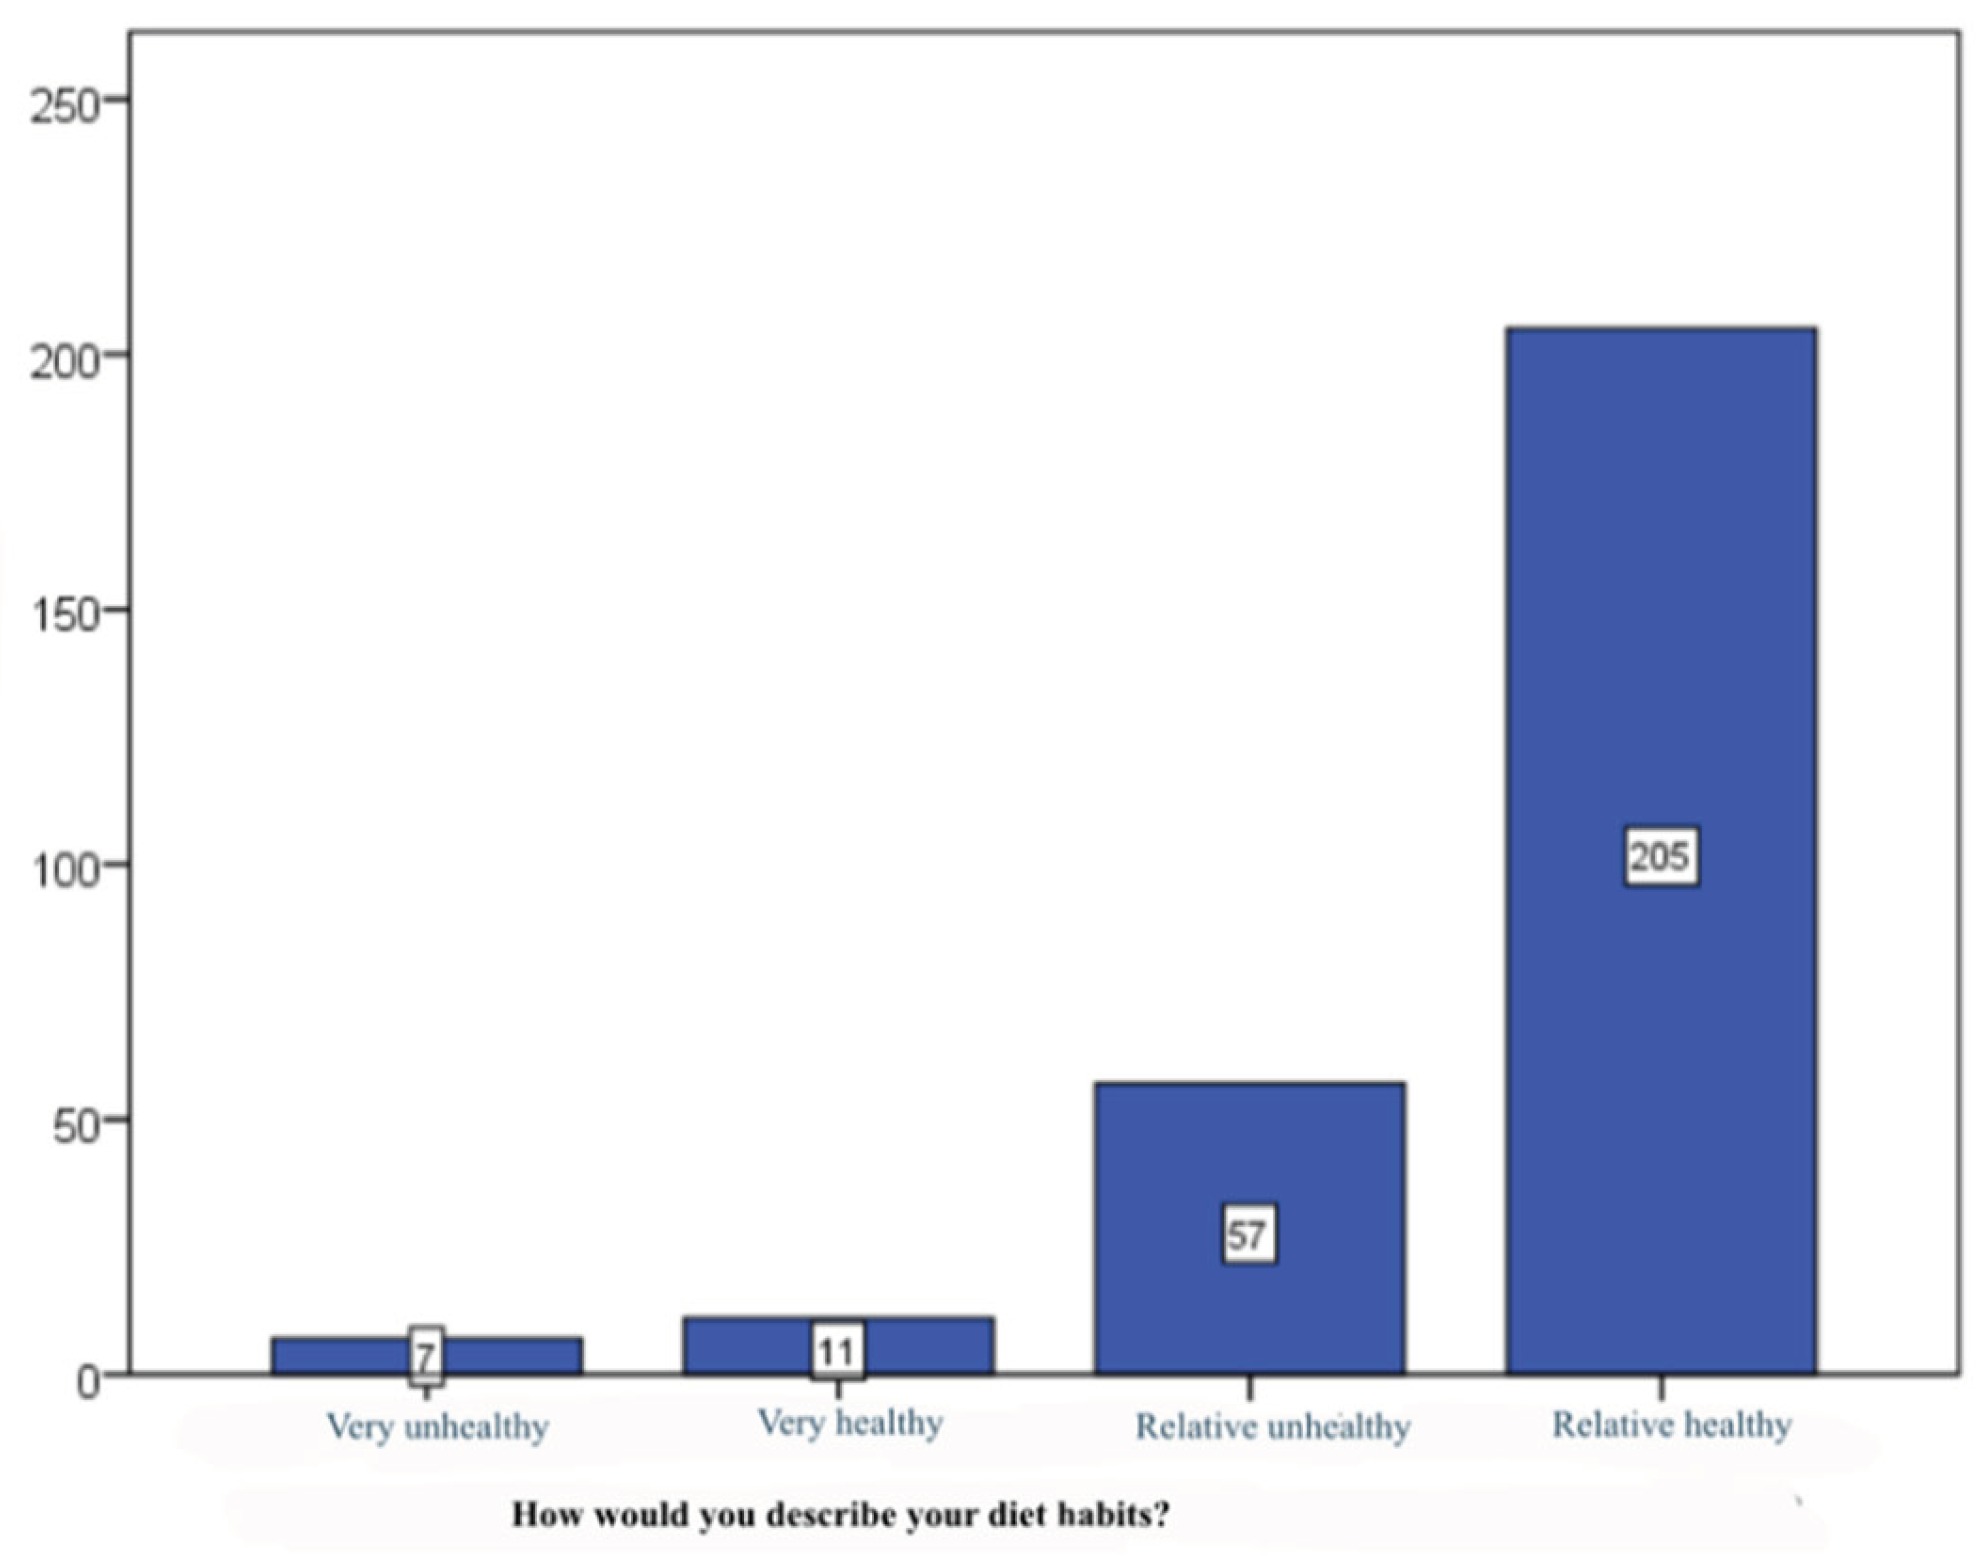
Figure 3.
Pattern of subjects with mental health issues.
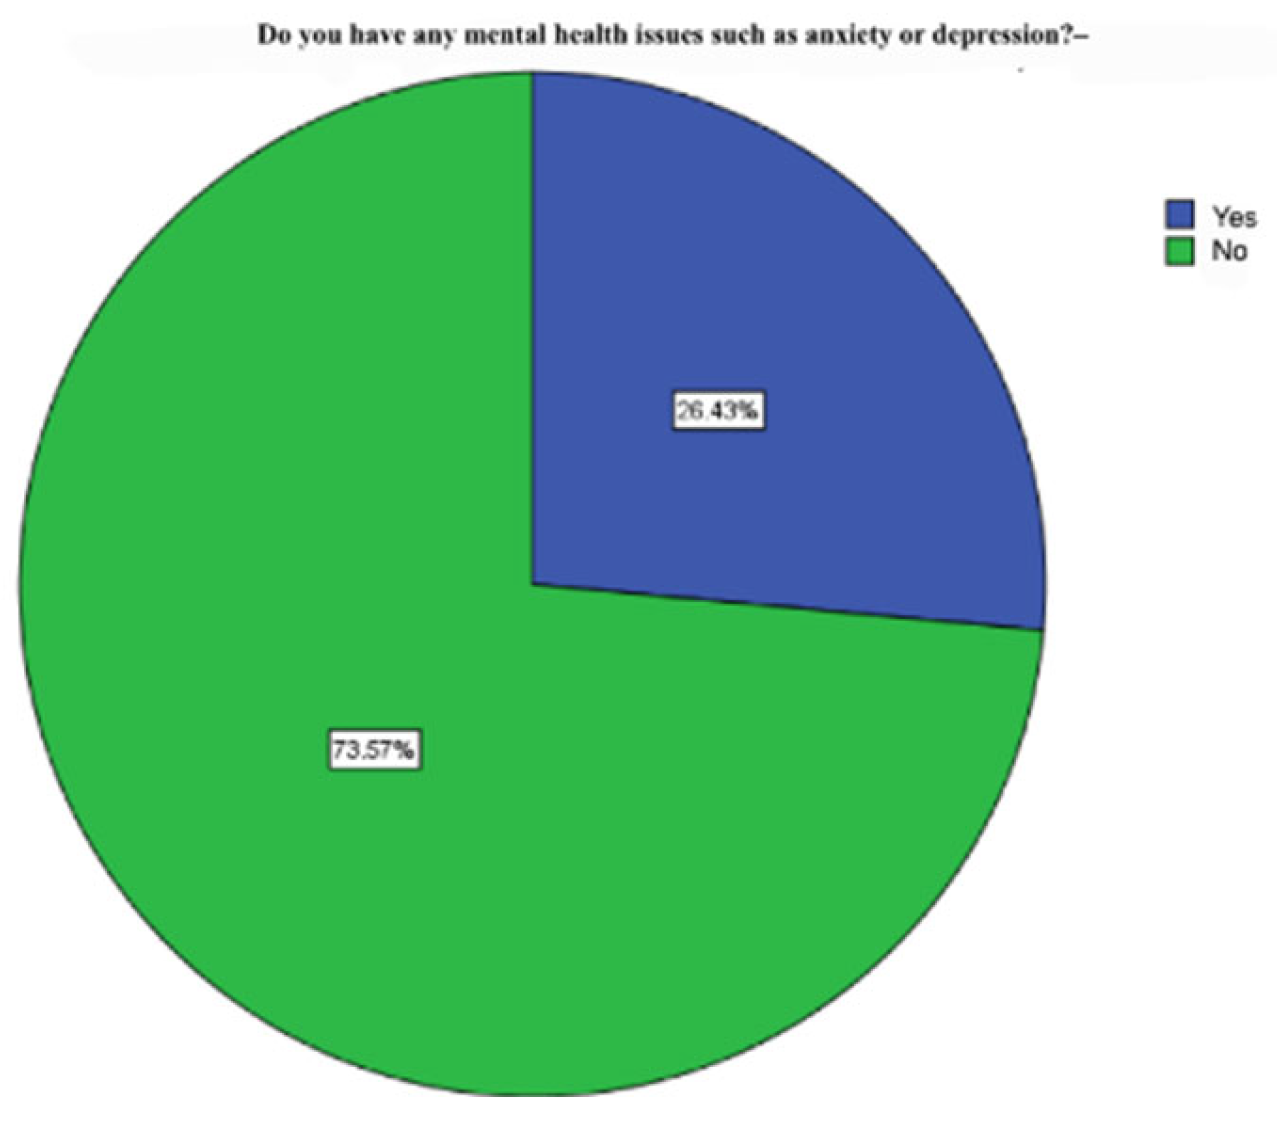
Figure 4.
Pattern of subjects with neuro-degenerative disorders.
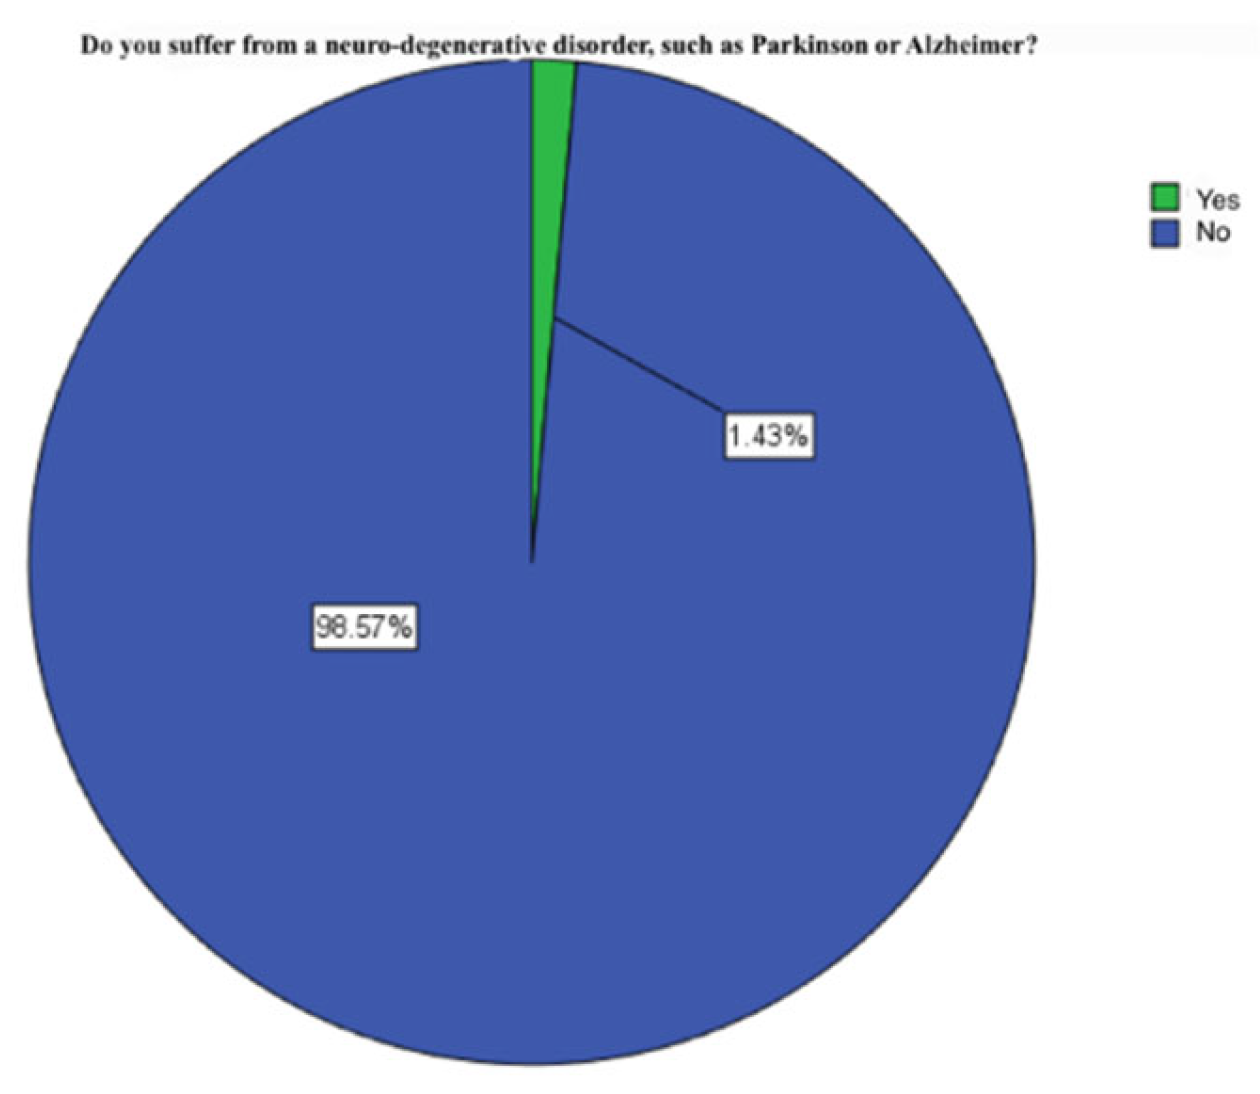
Figure 5.
Healthy diet impact on general health.
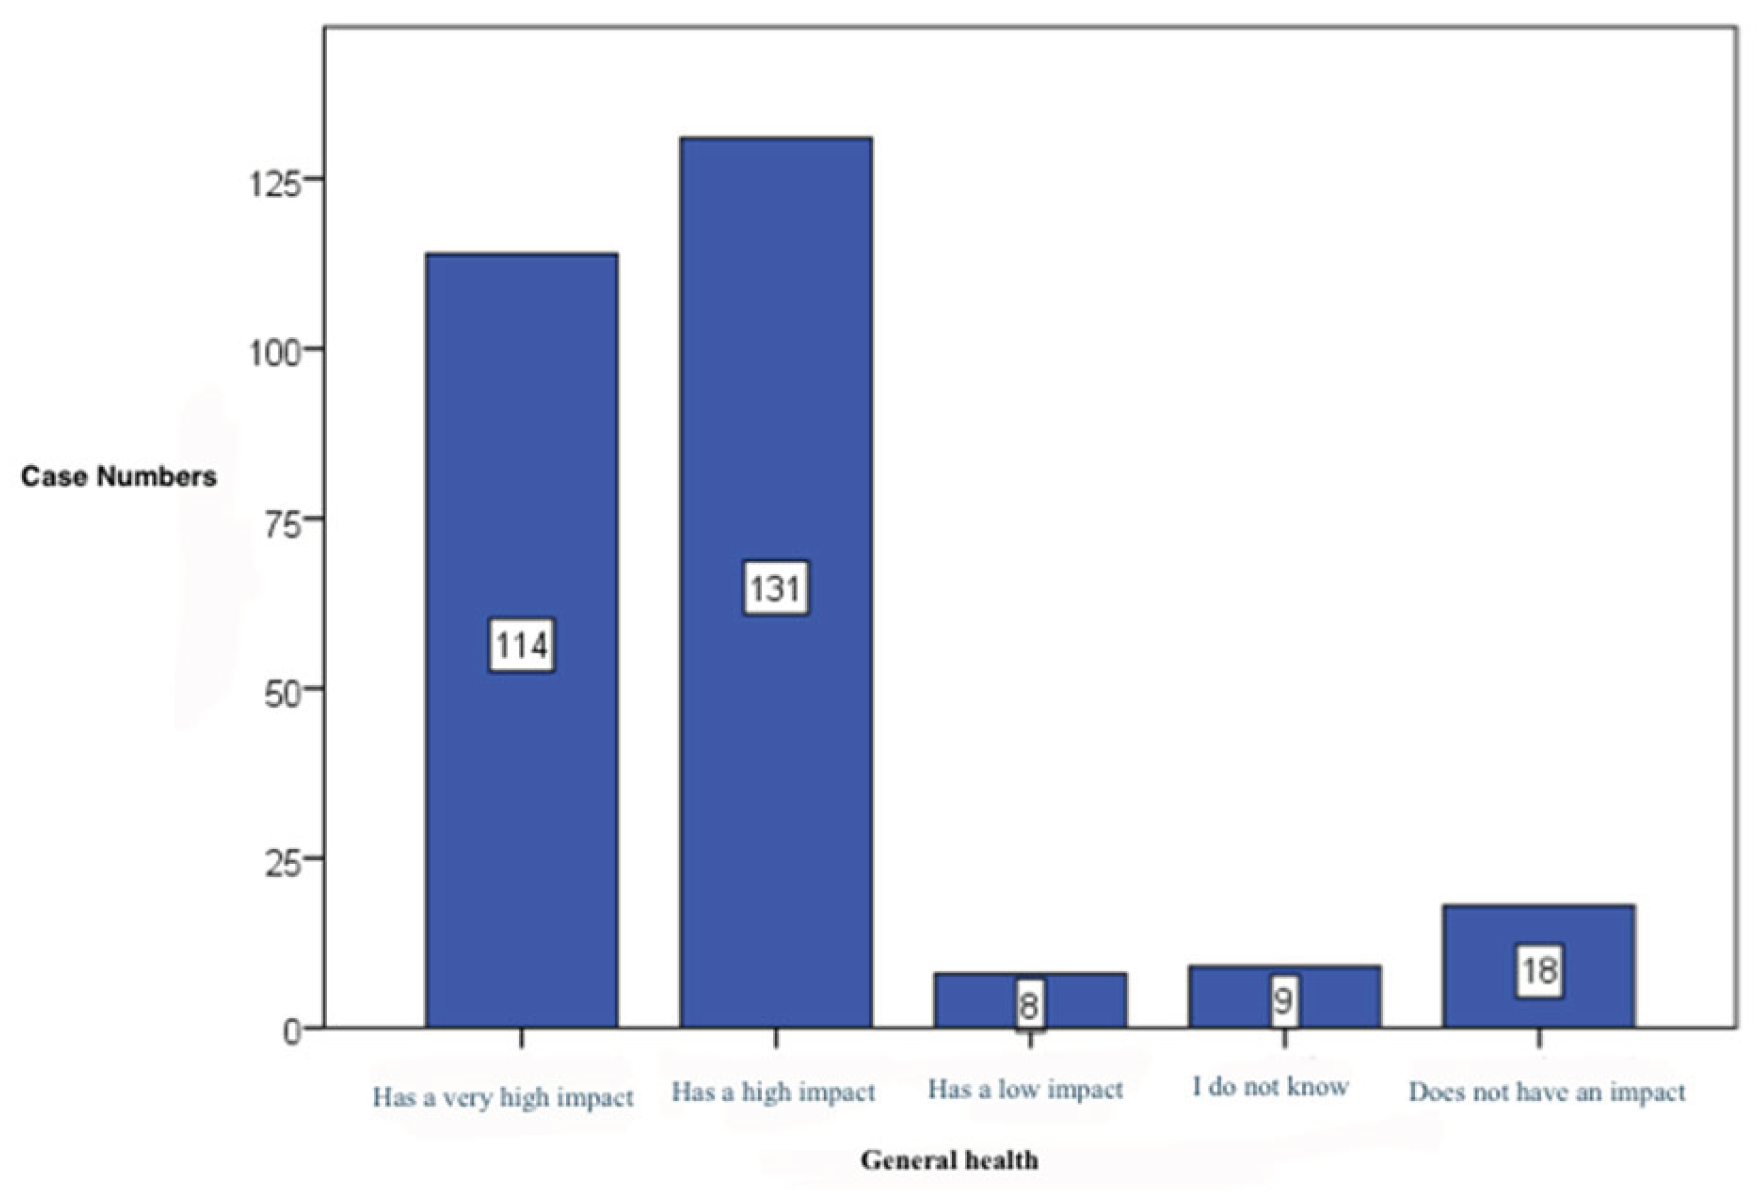
Figure 6.
Healthy diet impact on physical health.
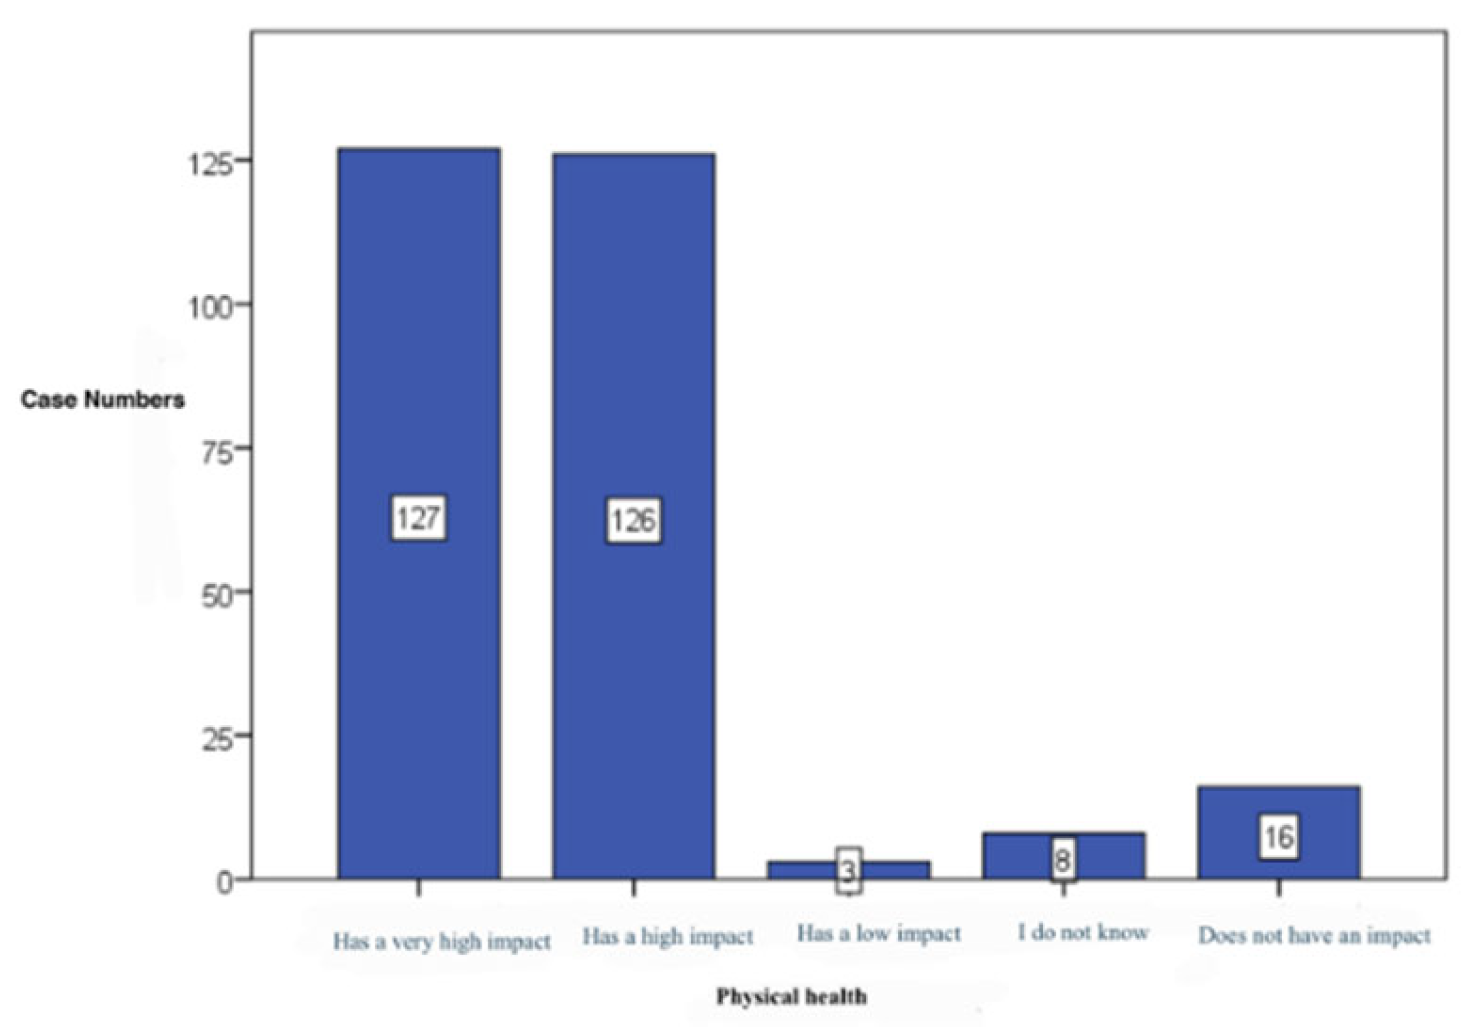
Figure 7.
Healthy diet impact on mental health.
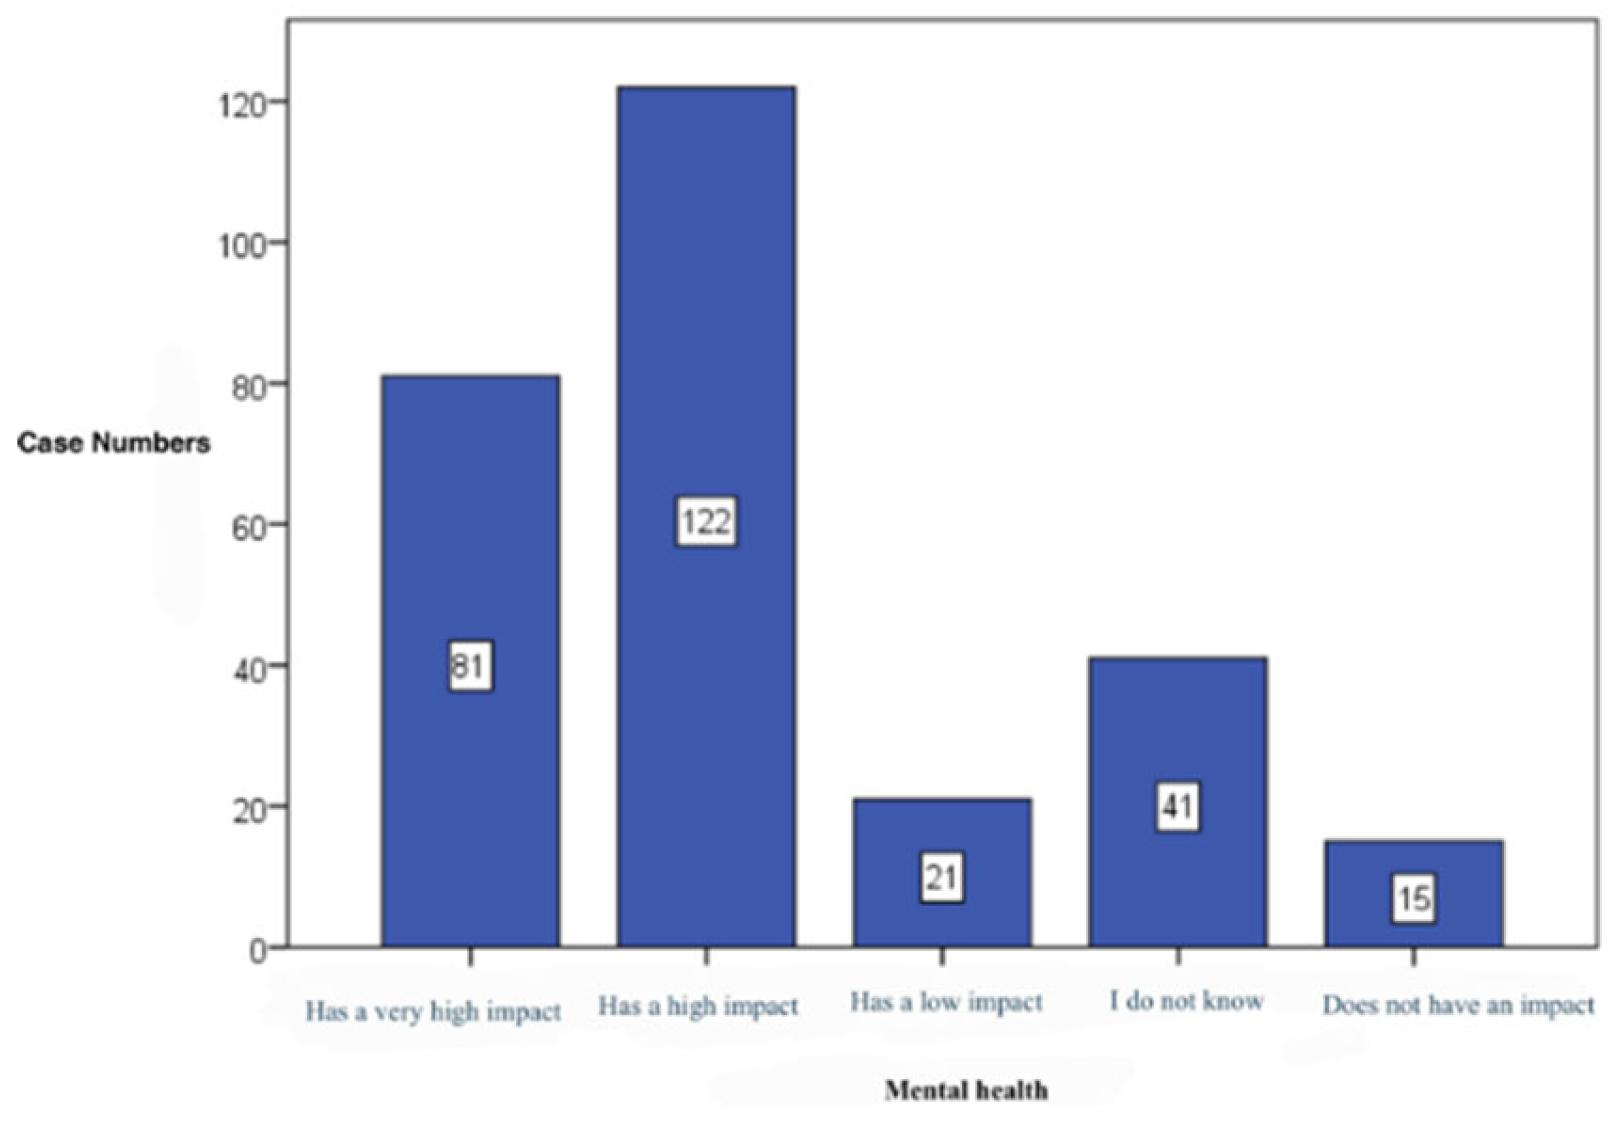
Figure 8.
Healthy diet impact on the ability to focus.
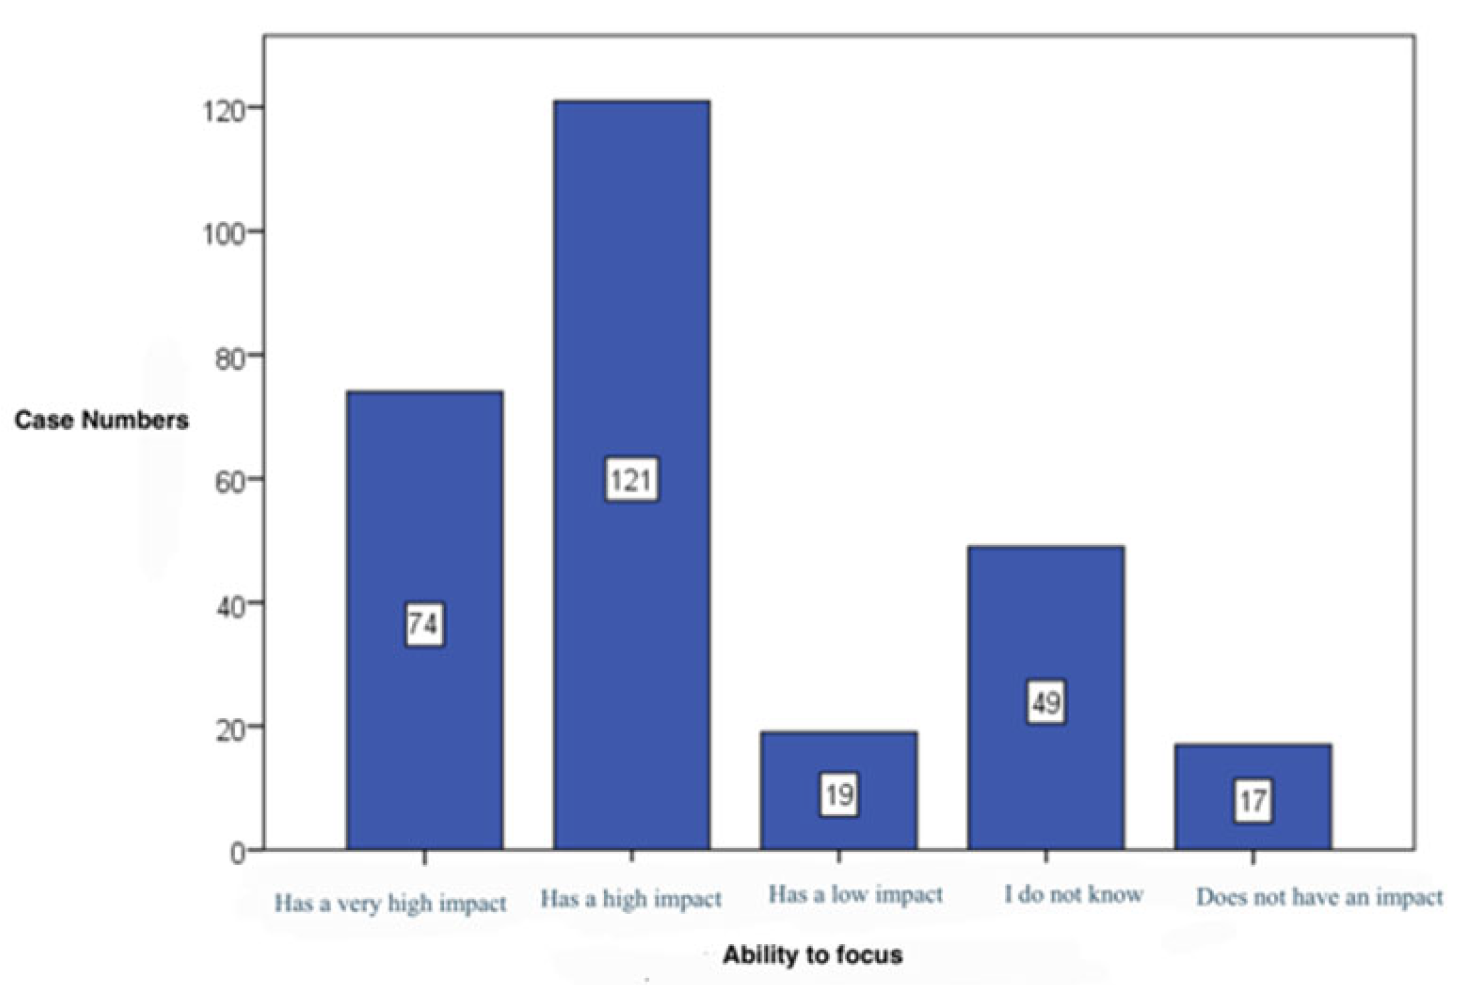
Figure 9.
Unhealthy diet impact on the ability to remember/memorize.
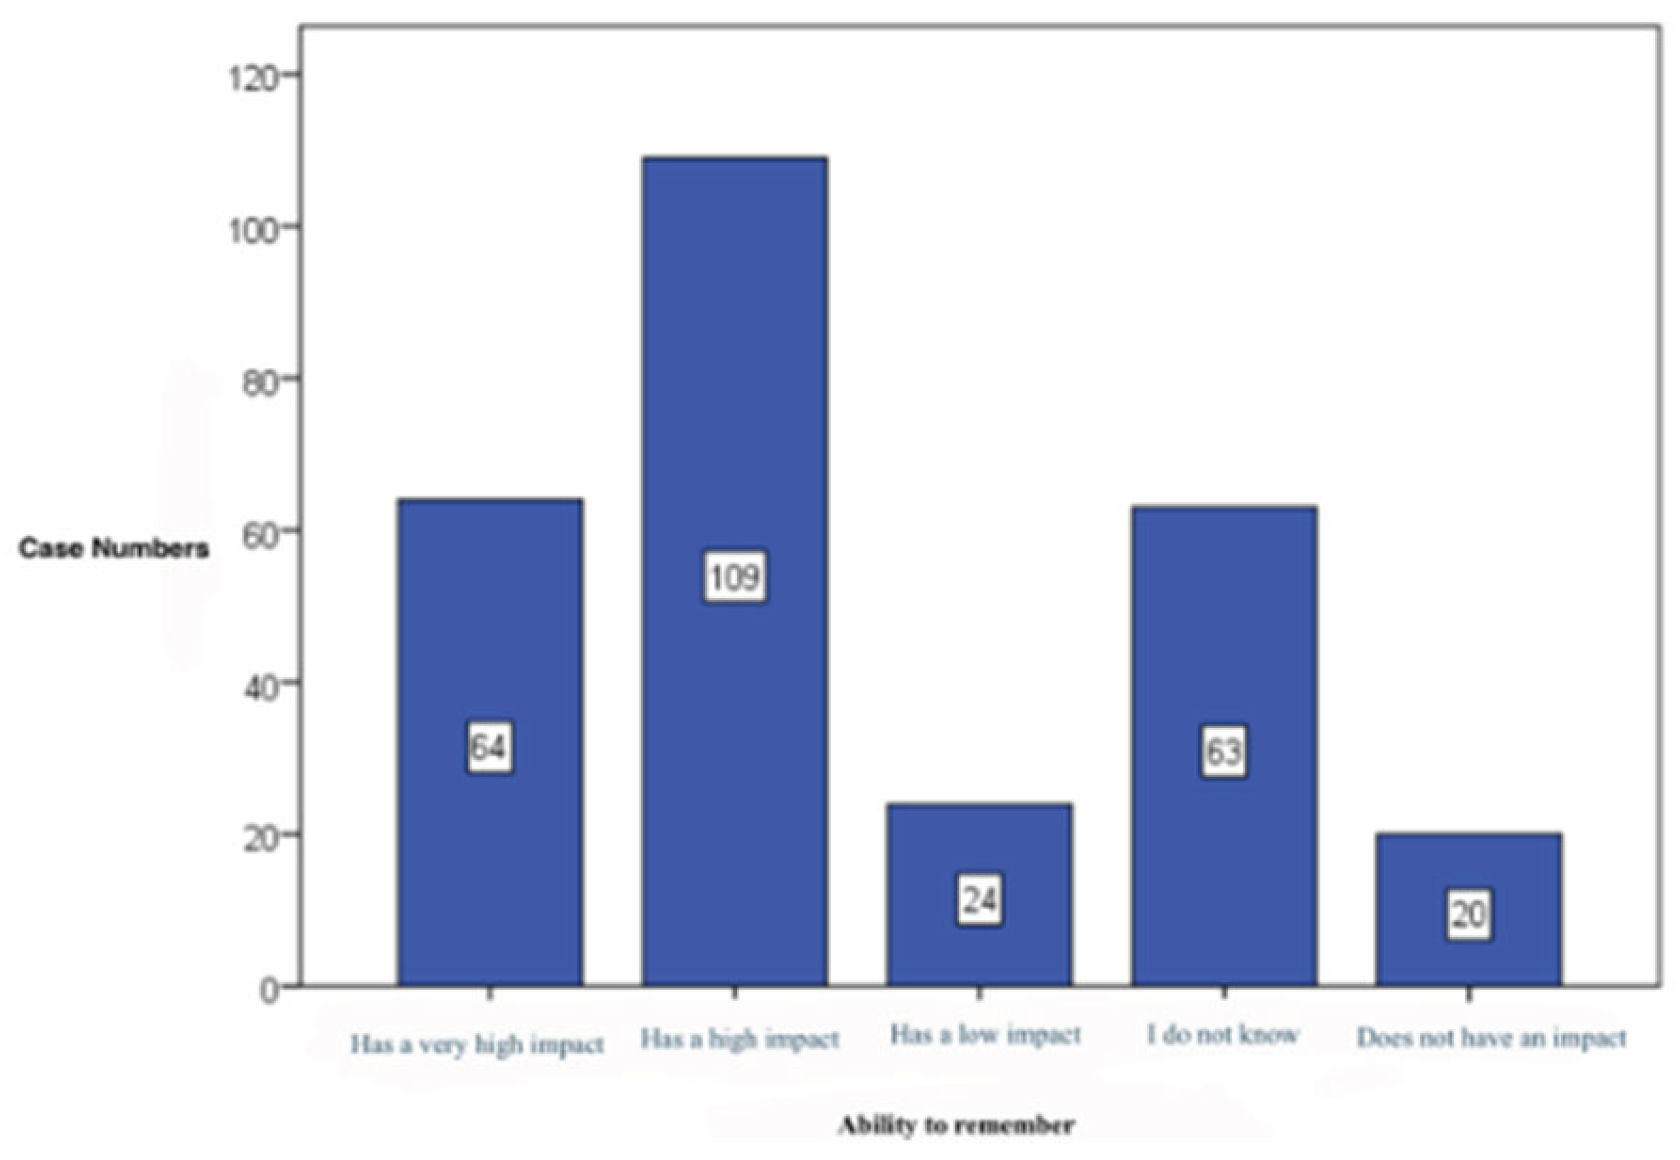
Figure 10.
Healthy diet impact on good disposition.
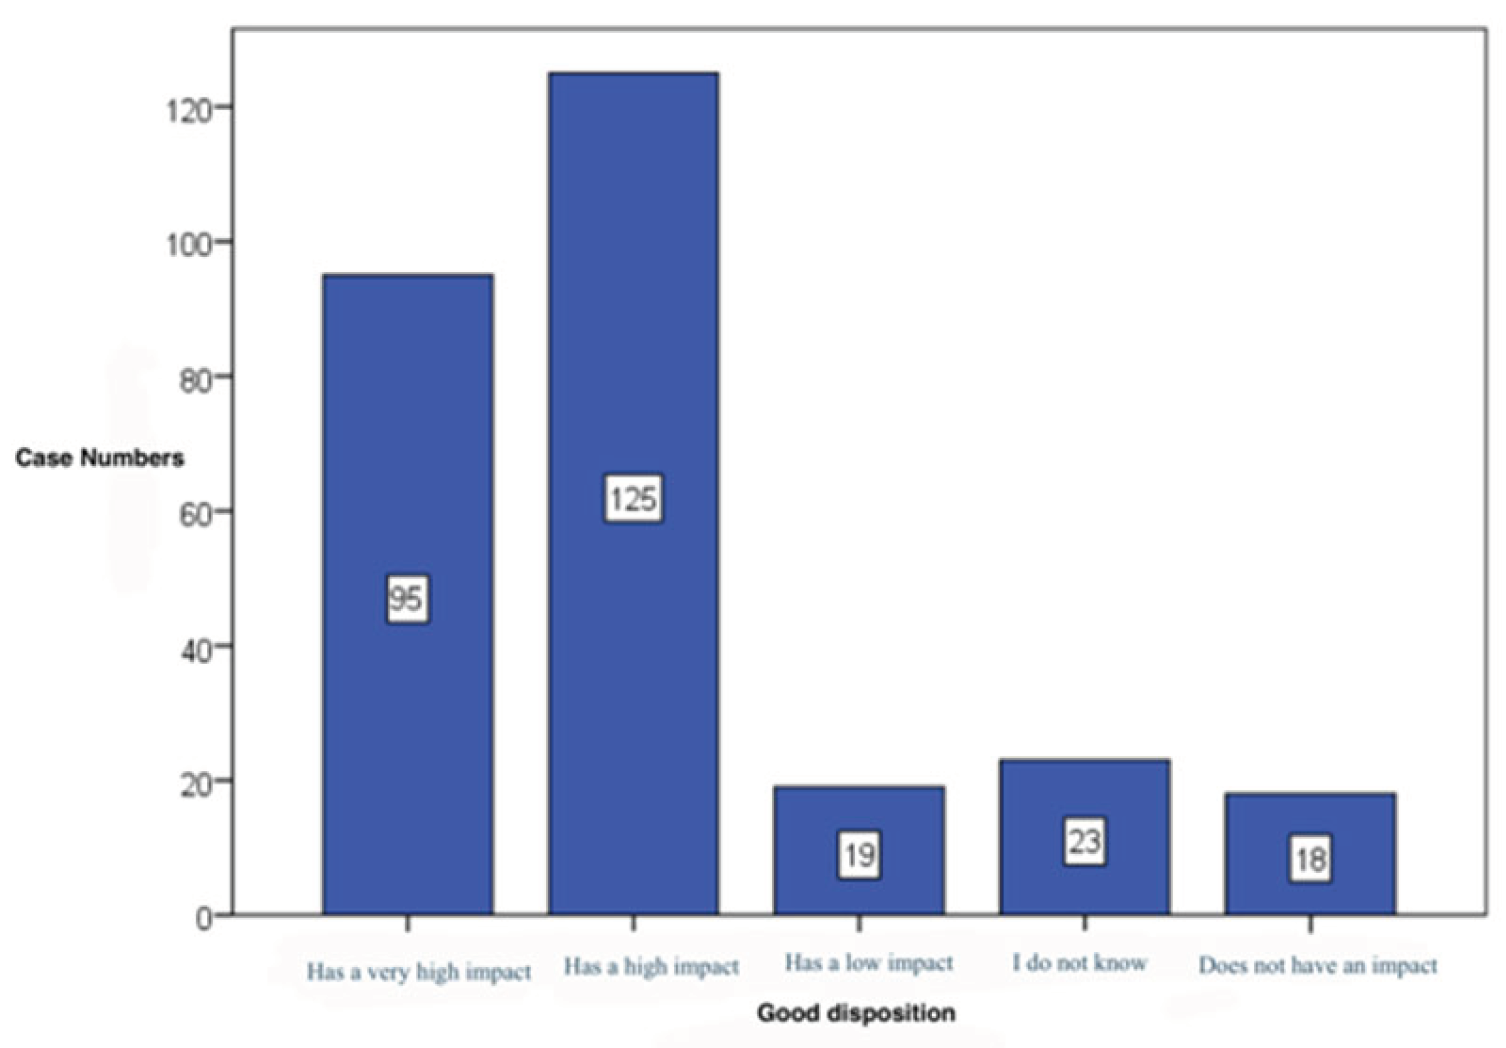
Figure 11.
Vegetable consumption pattern.
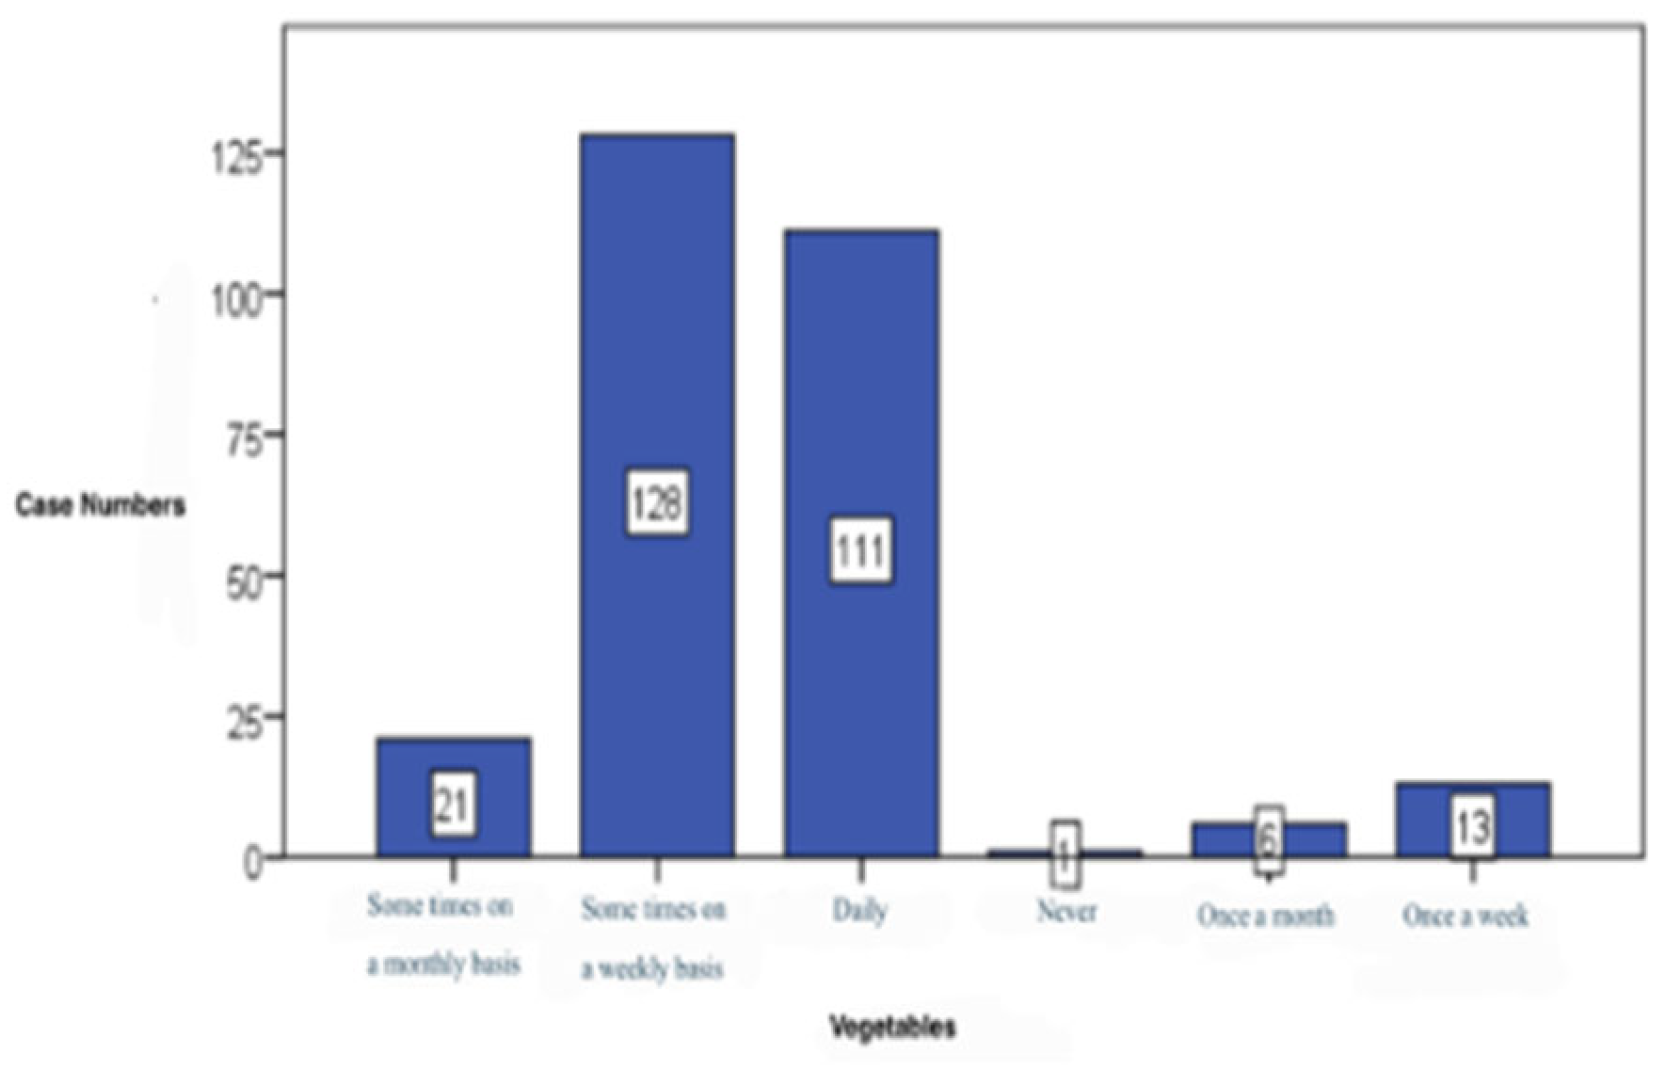
Figure 12.
Fruits consumption pattern.
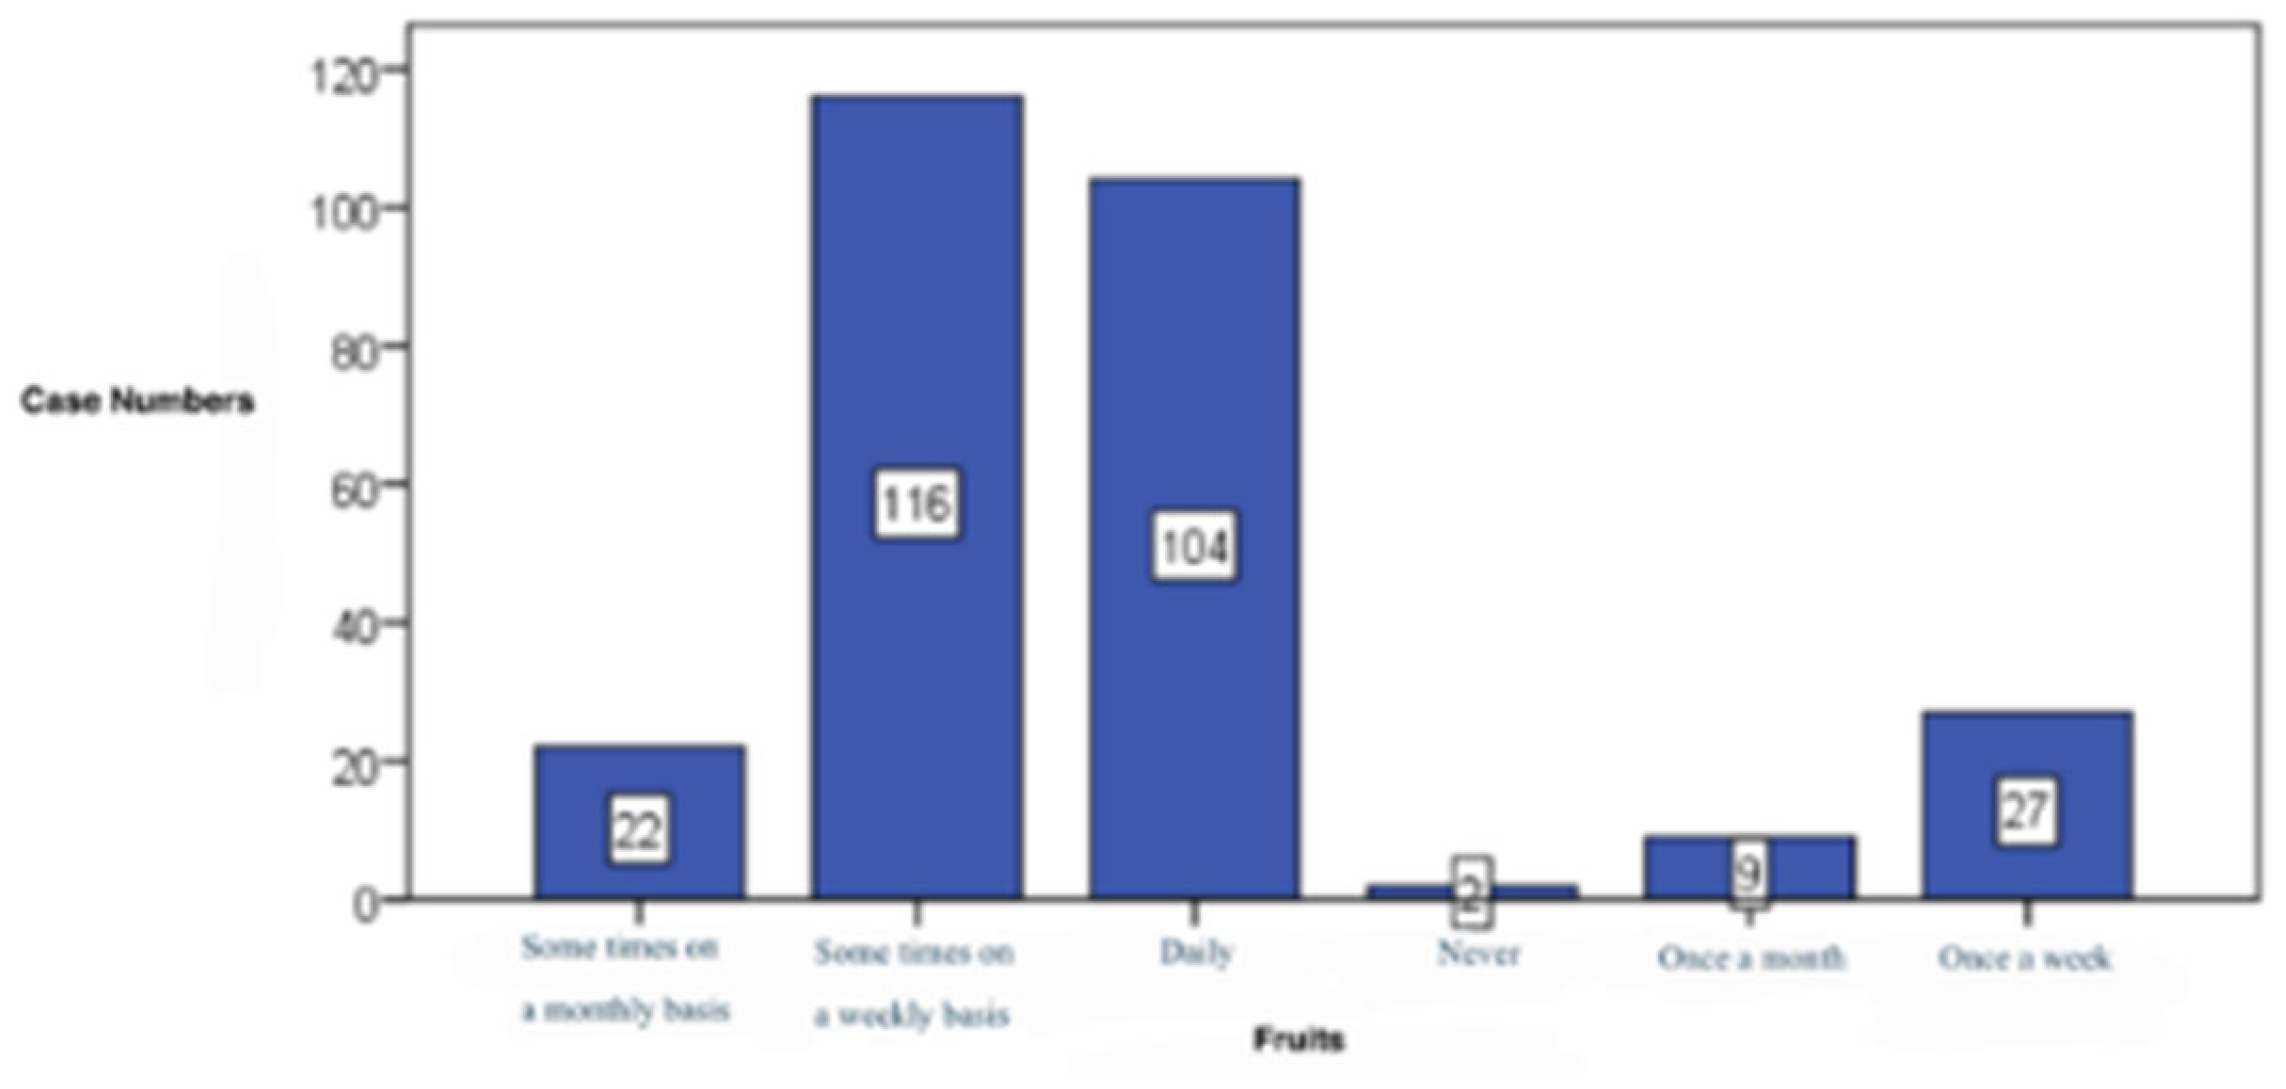
Figure 13.
Meat consumption pattern.
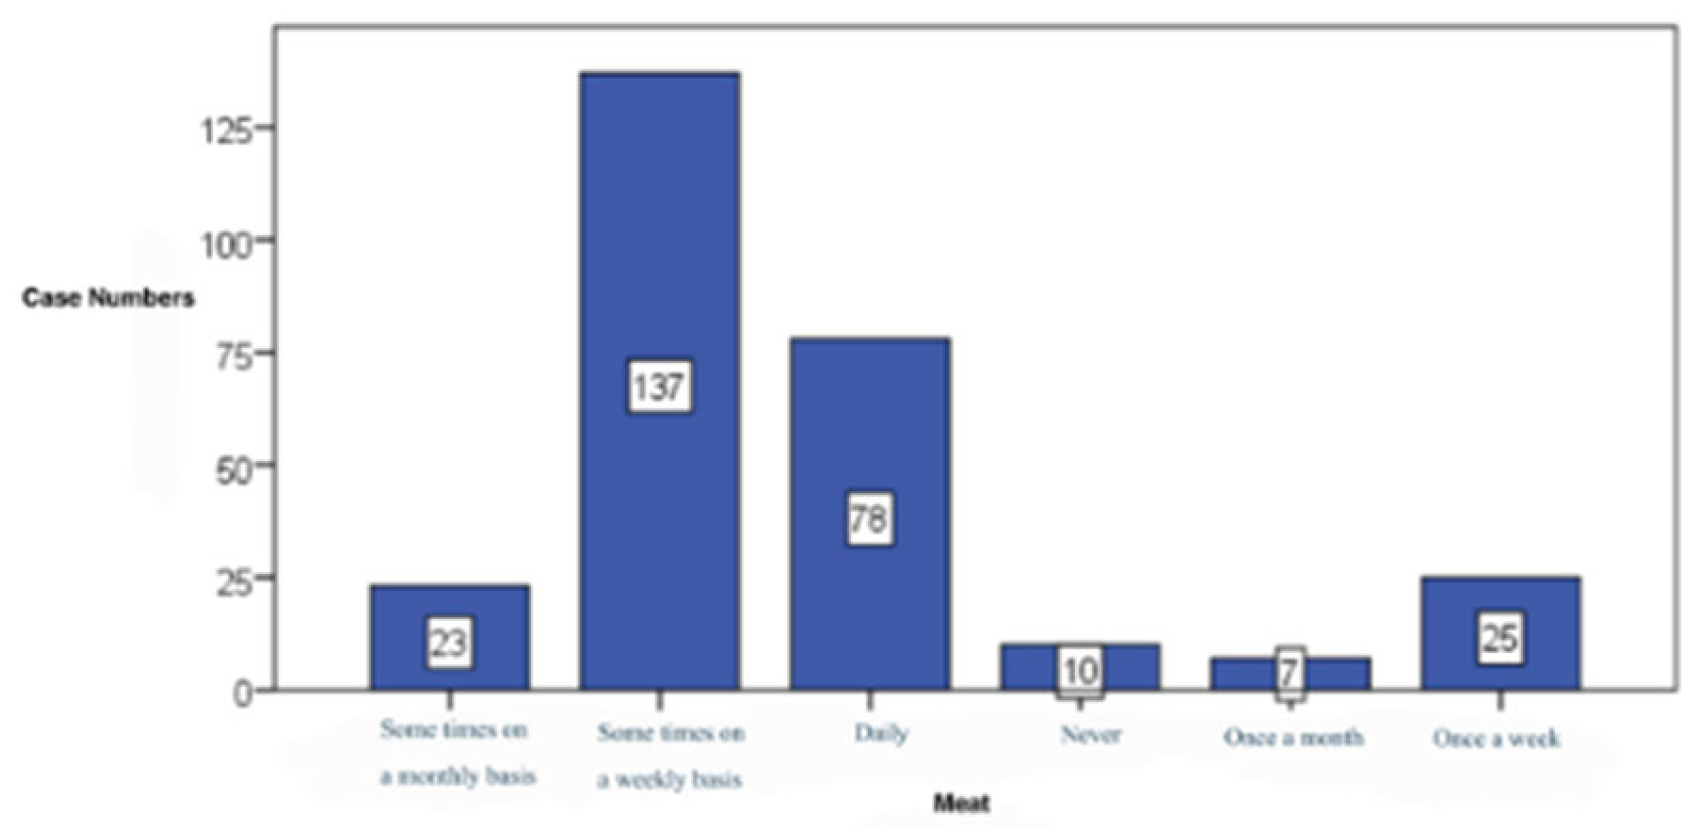
Figure 14.
White carbohydrates consumption pattern.
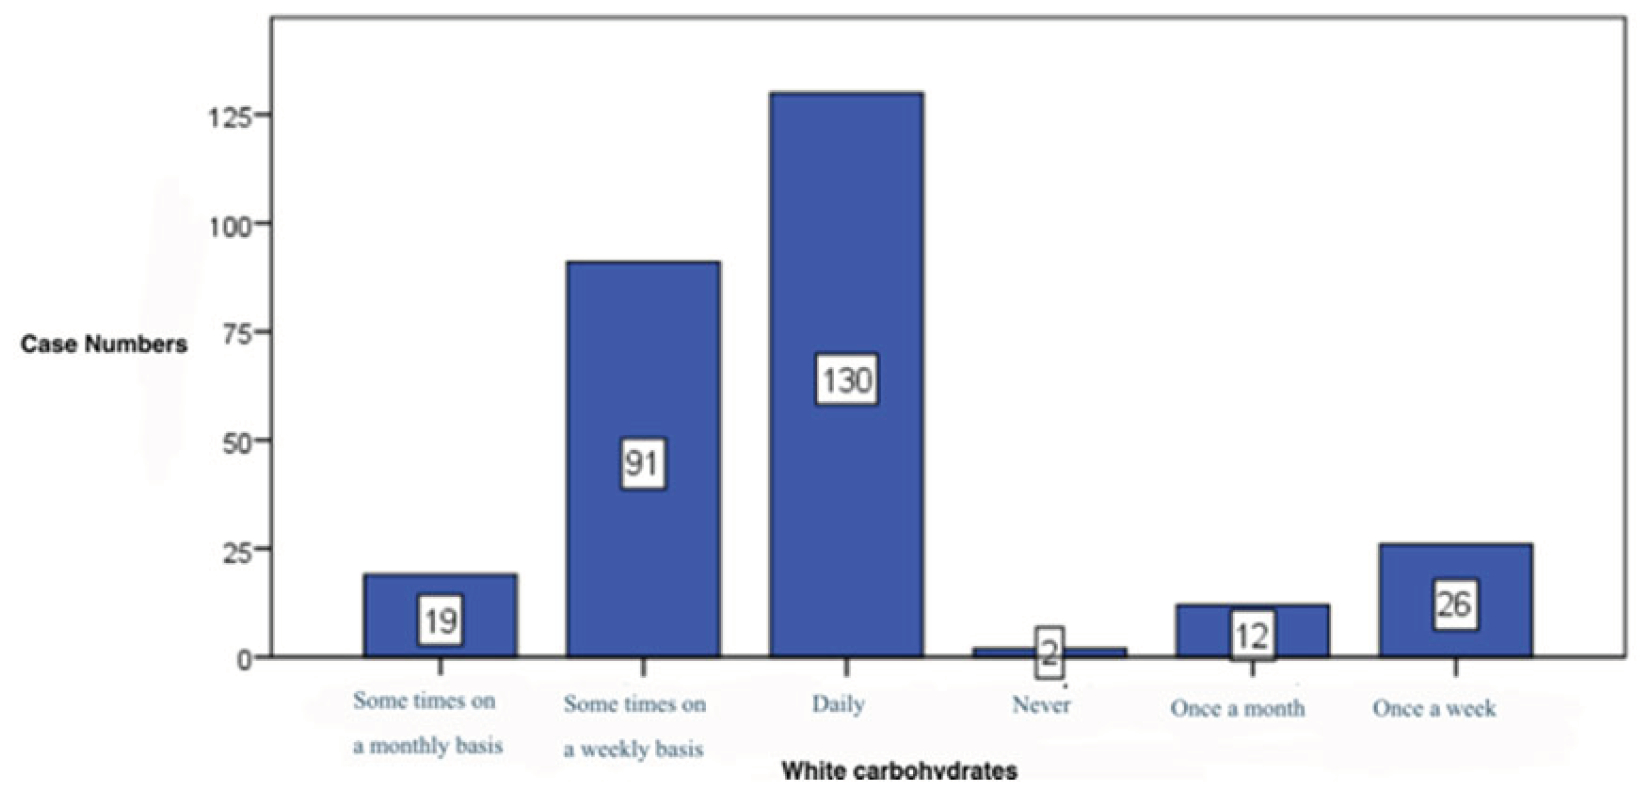
Figure 15.
Caffeinated drinks consumption pattern.
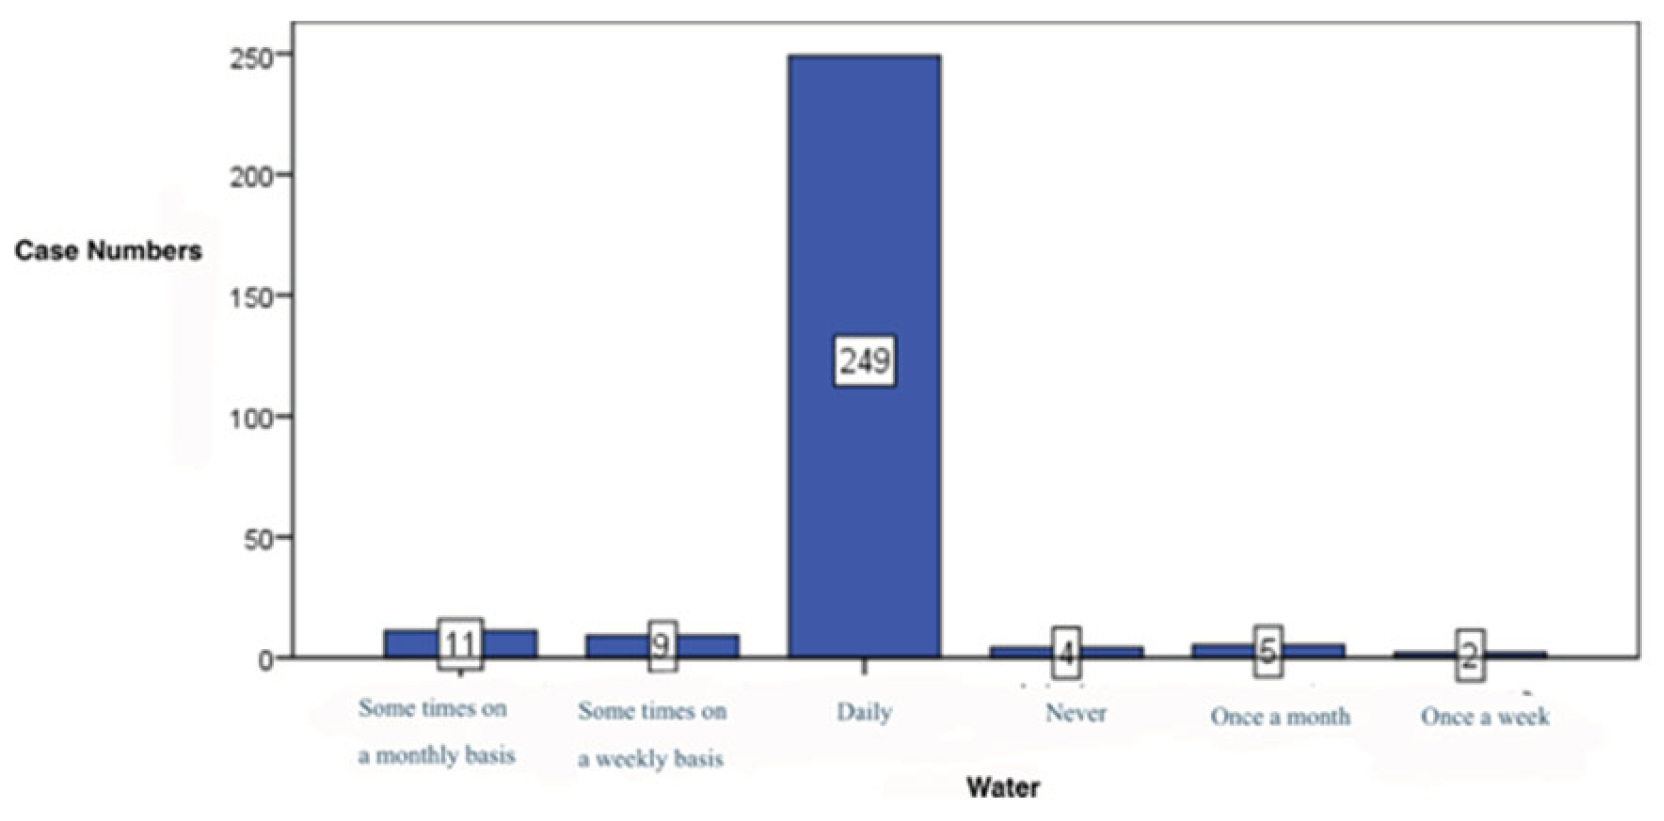
Figure 16.
Water consumption pattern.
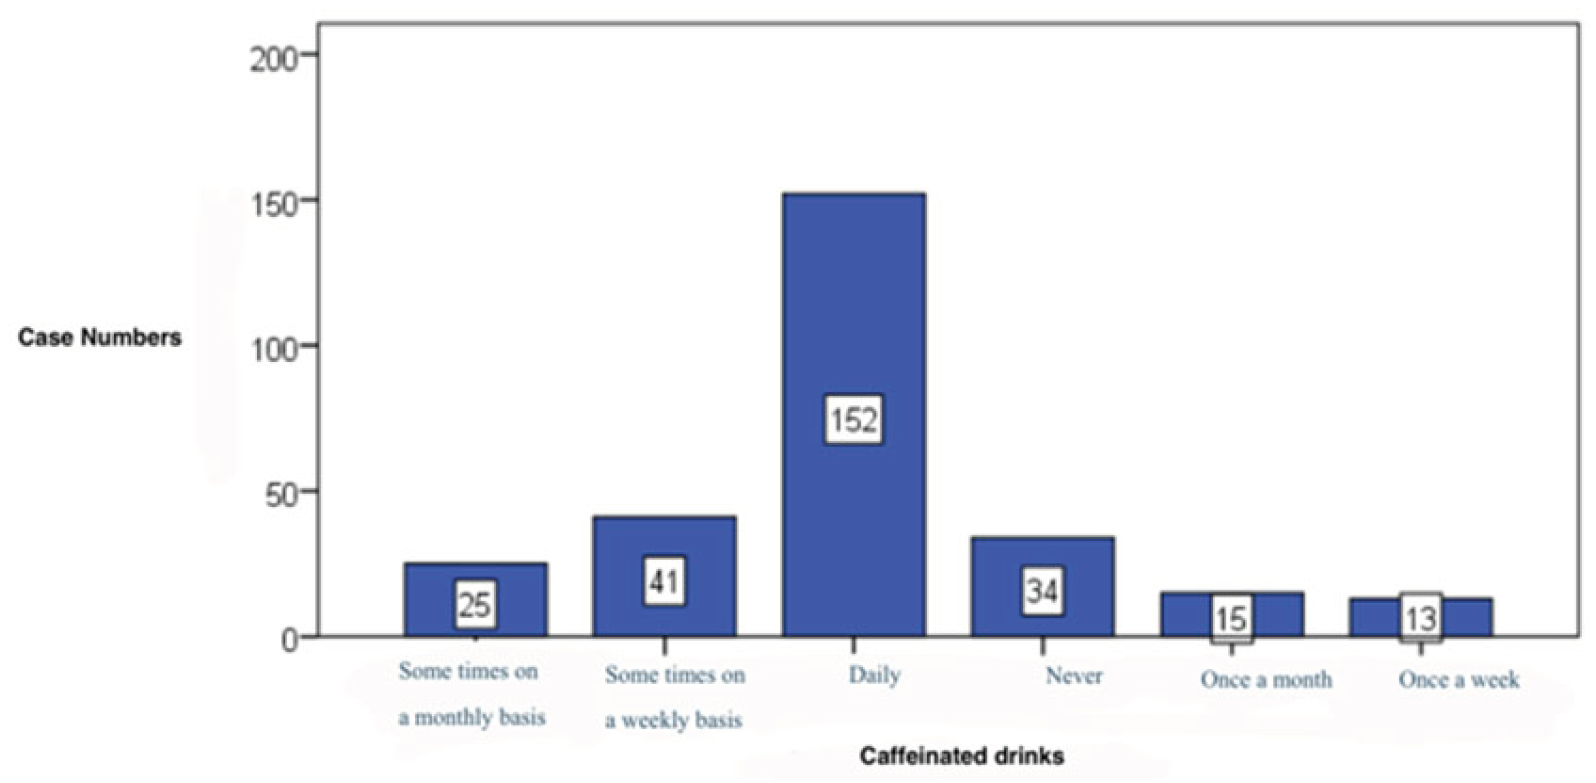
Figure 17.
Sweets consumption pattern.
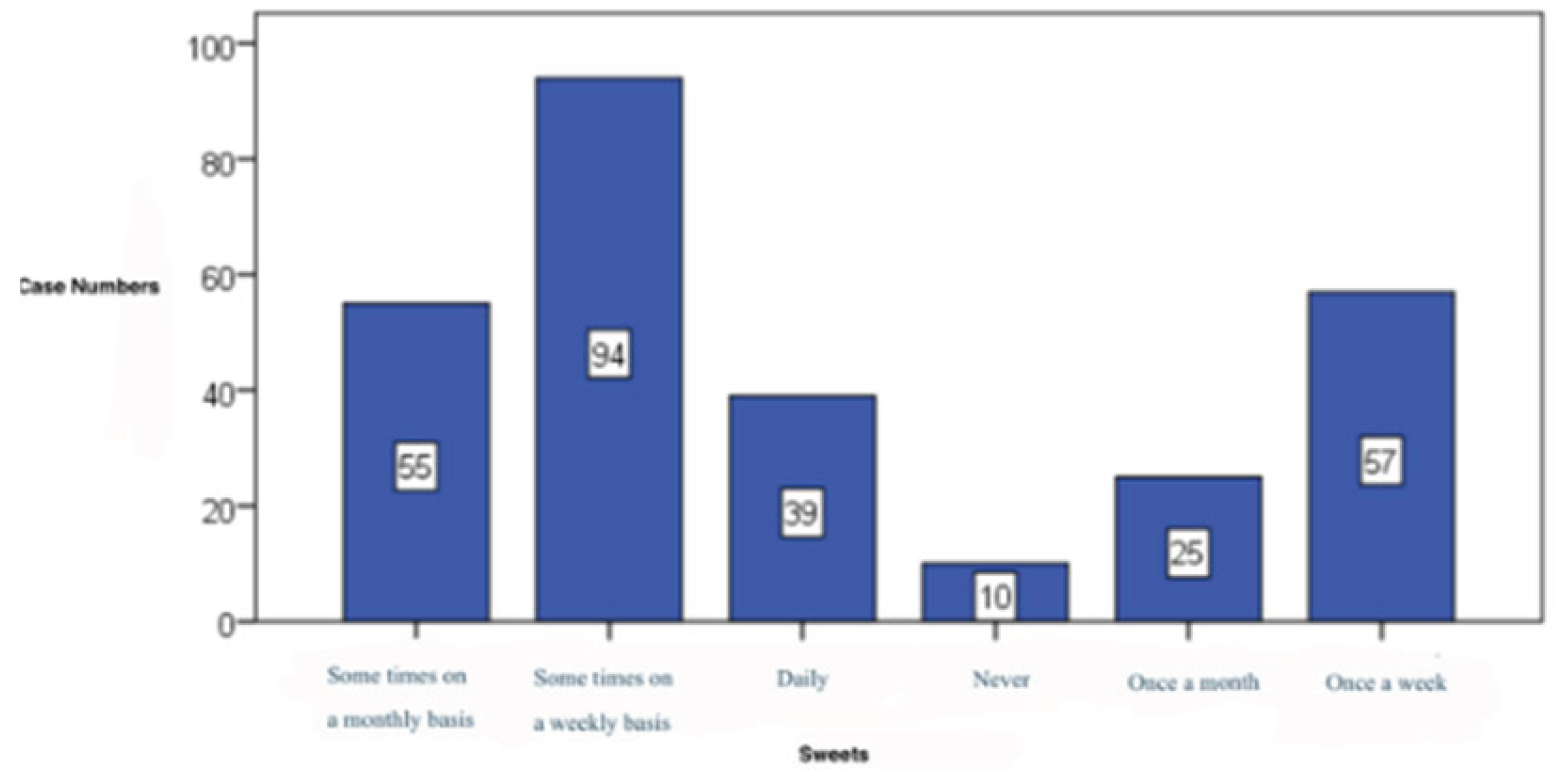
Figure 18.
Snacks consumption pattern.
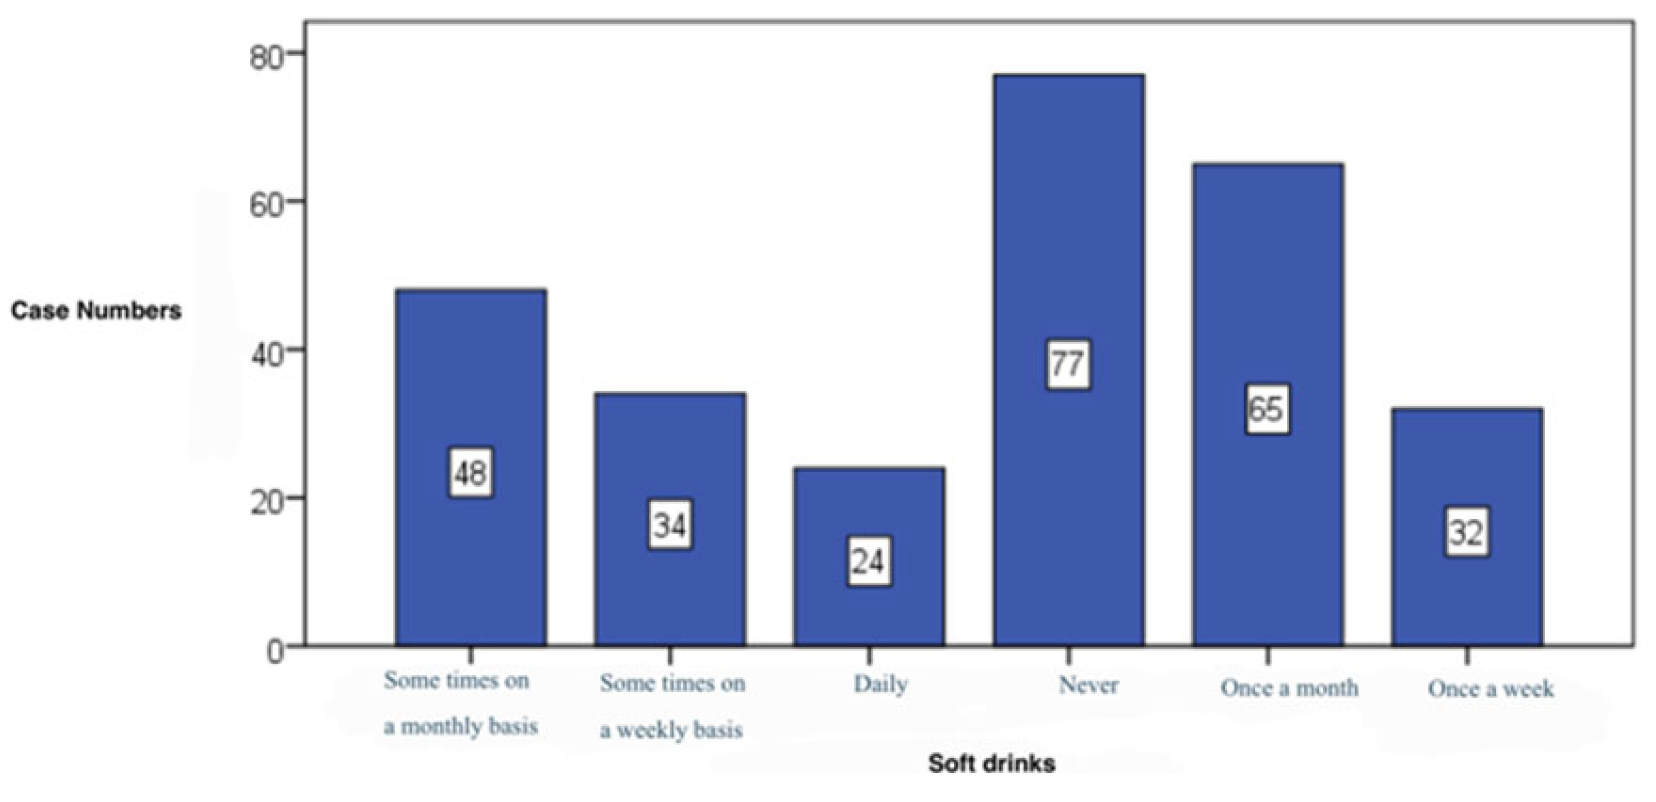
Figure 19.
Soft Drinks consumption pattern.
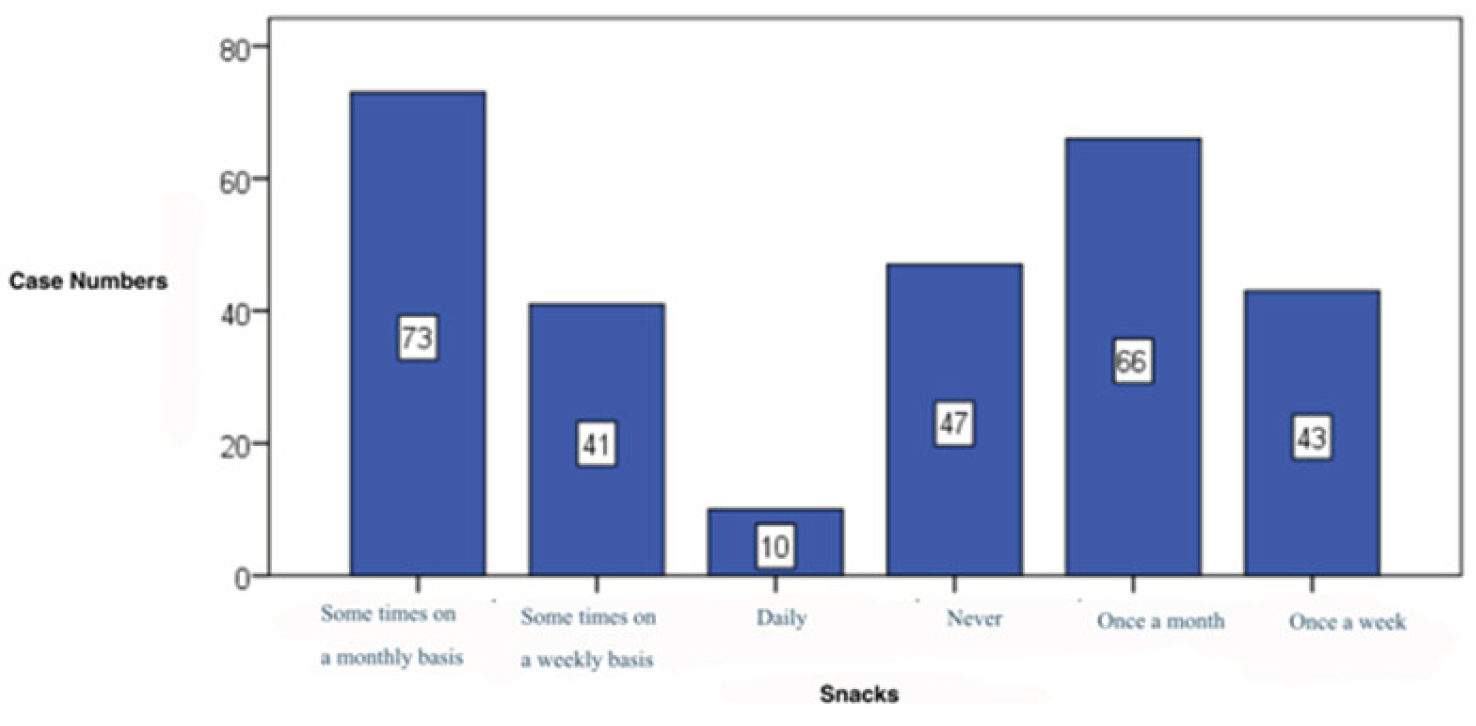
Figure 20.
Positive feelings pattern.
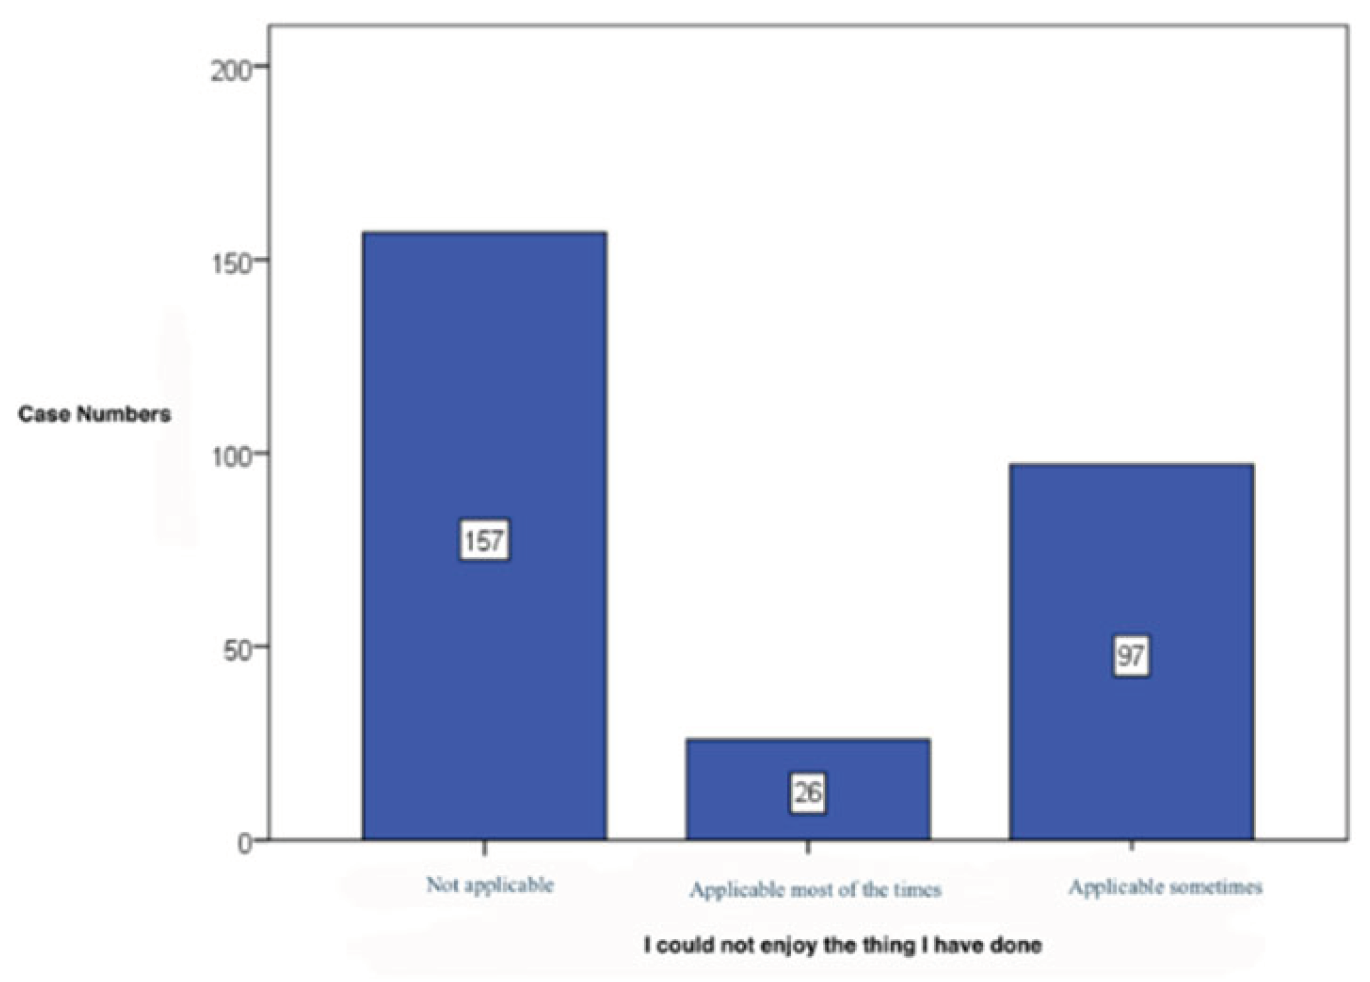
Figure 21.
Demotivation pattern.
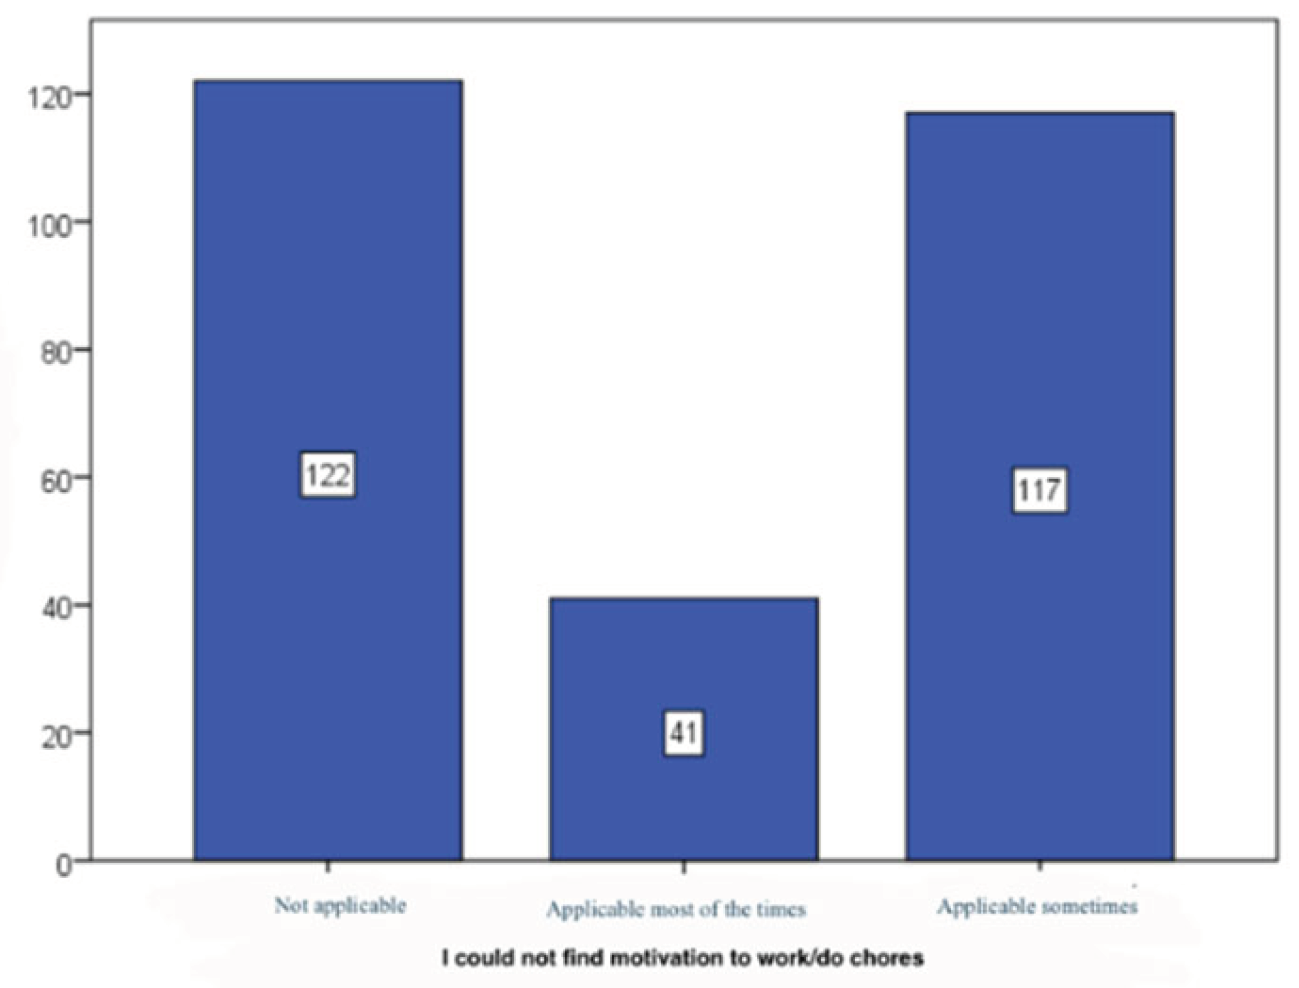
Figure 22.
Lack of the ability to feel joy pattern.
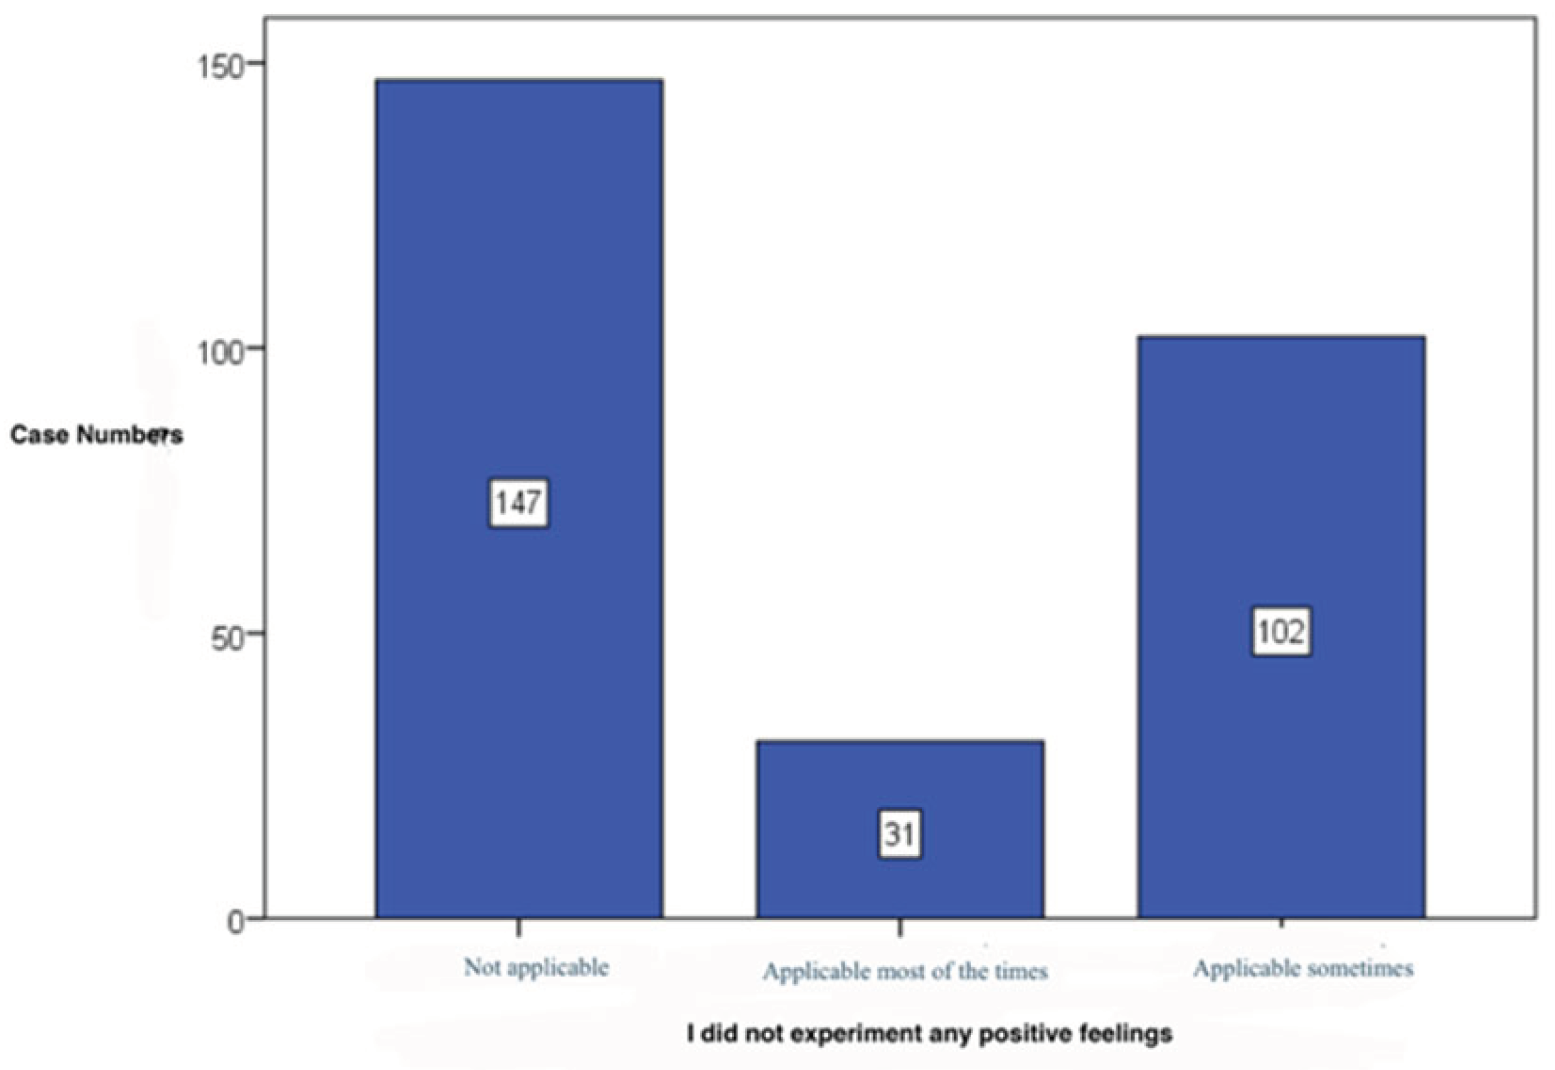
Figure 23.
Pattern of subjects that feel alone.
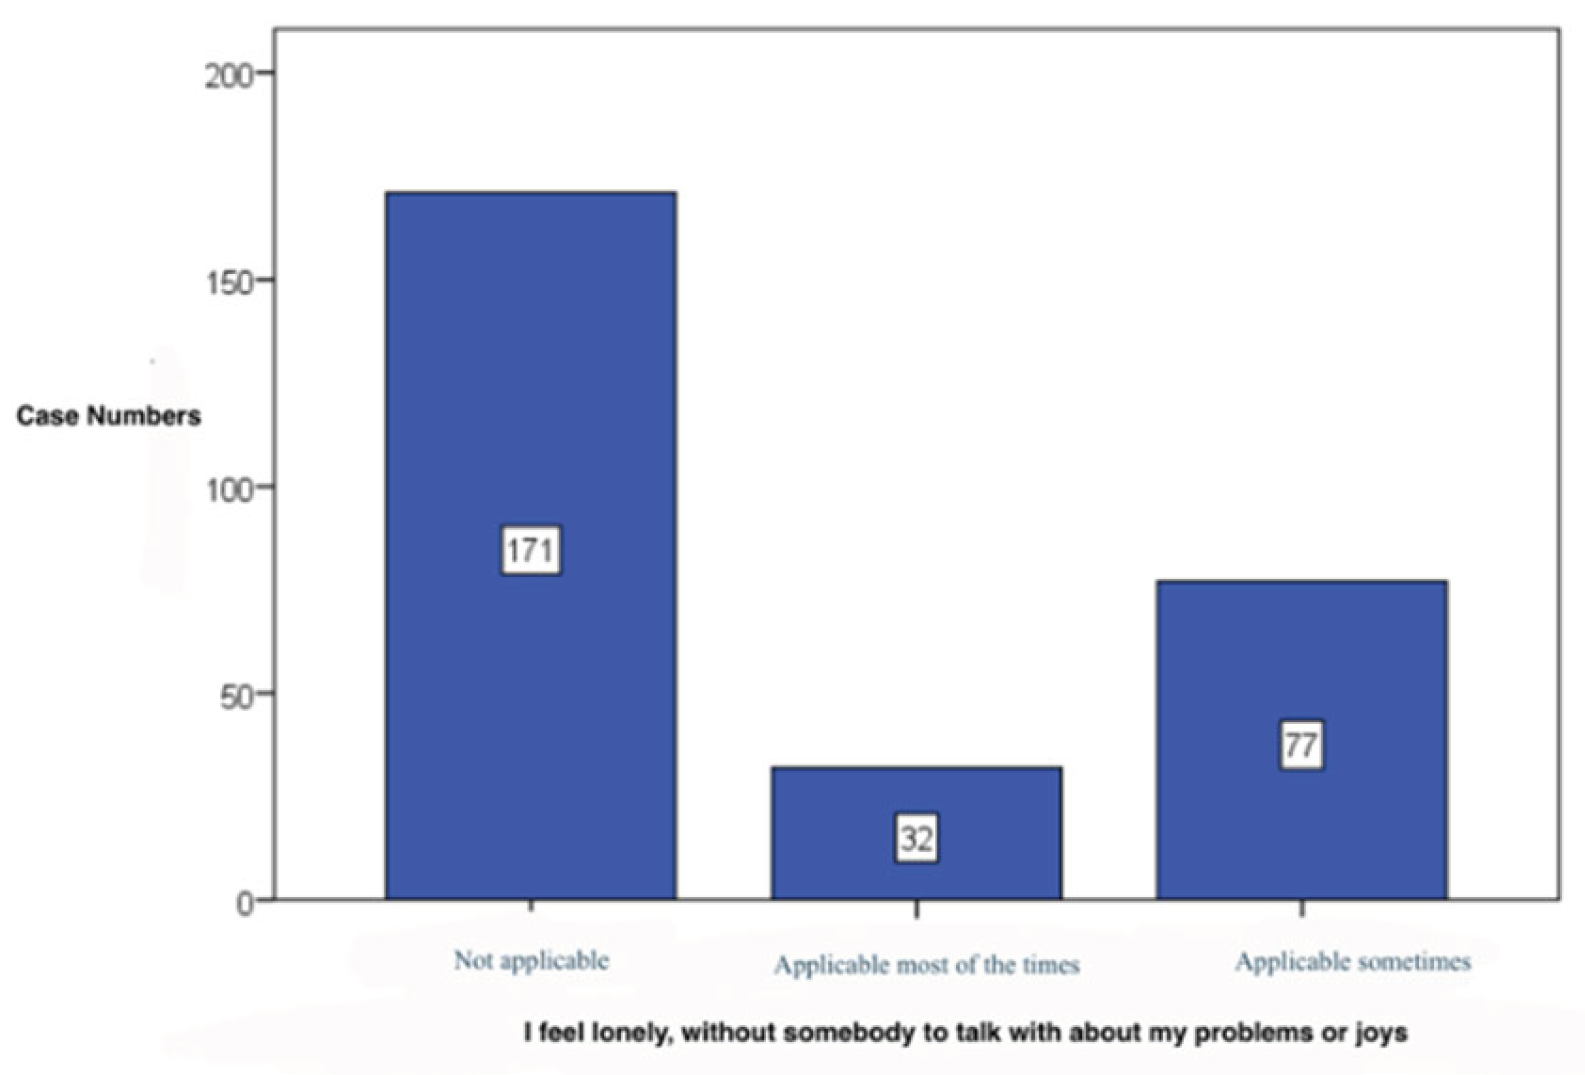
Figure 24.
Pattern of subjects that feel that life has no sense.
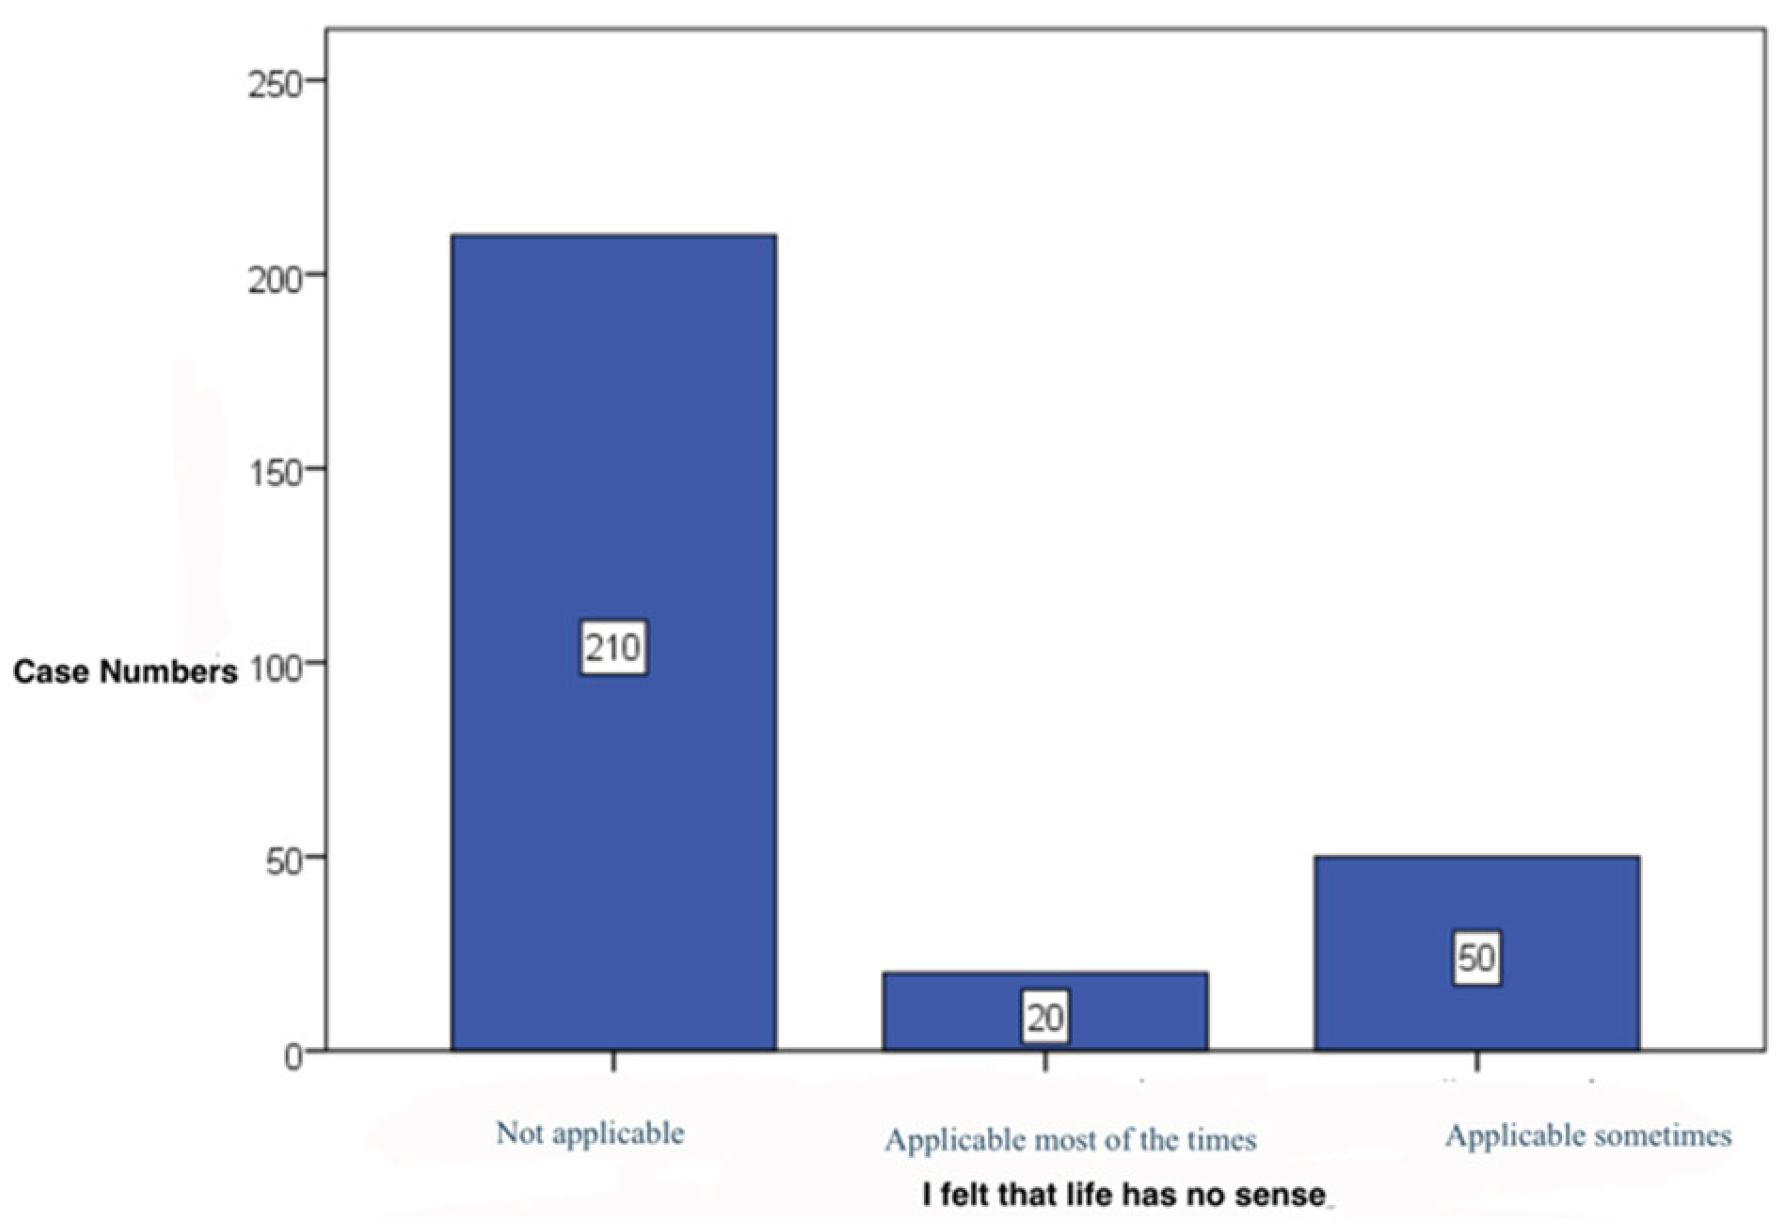
Figure 25.
Pattern of subjects that feel worthless.
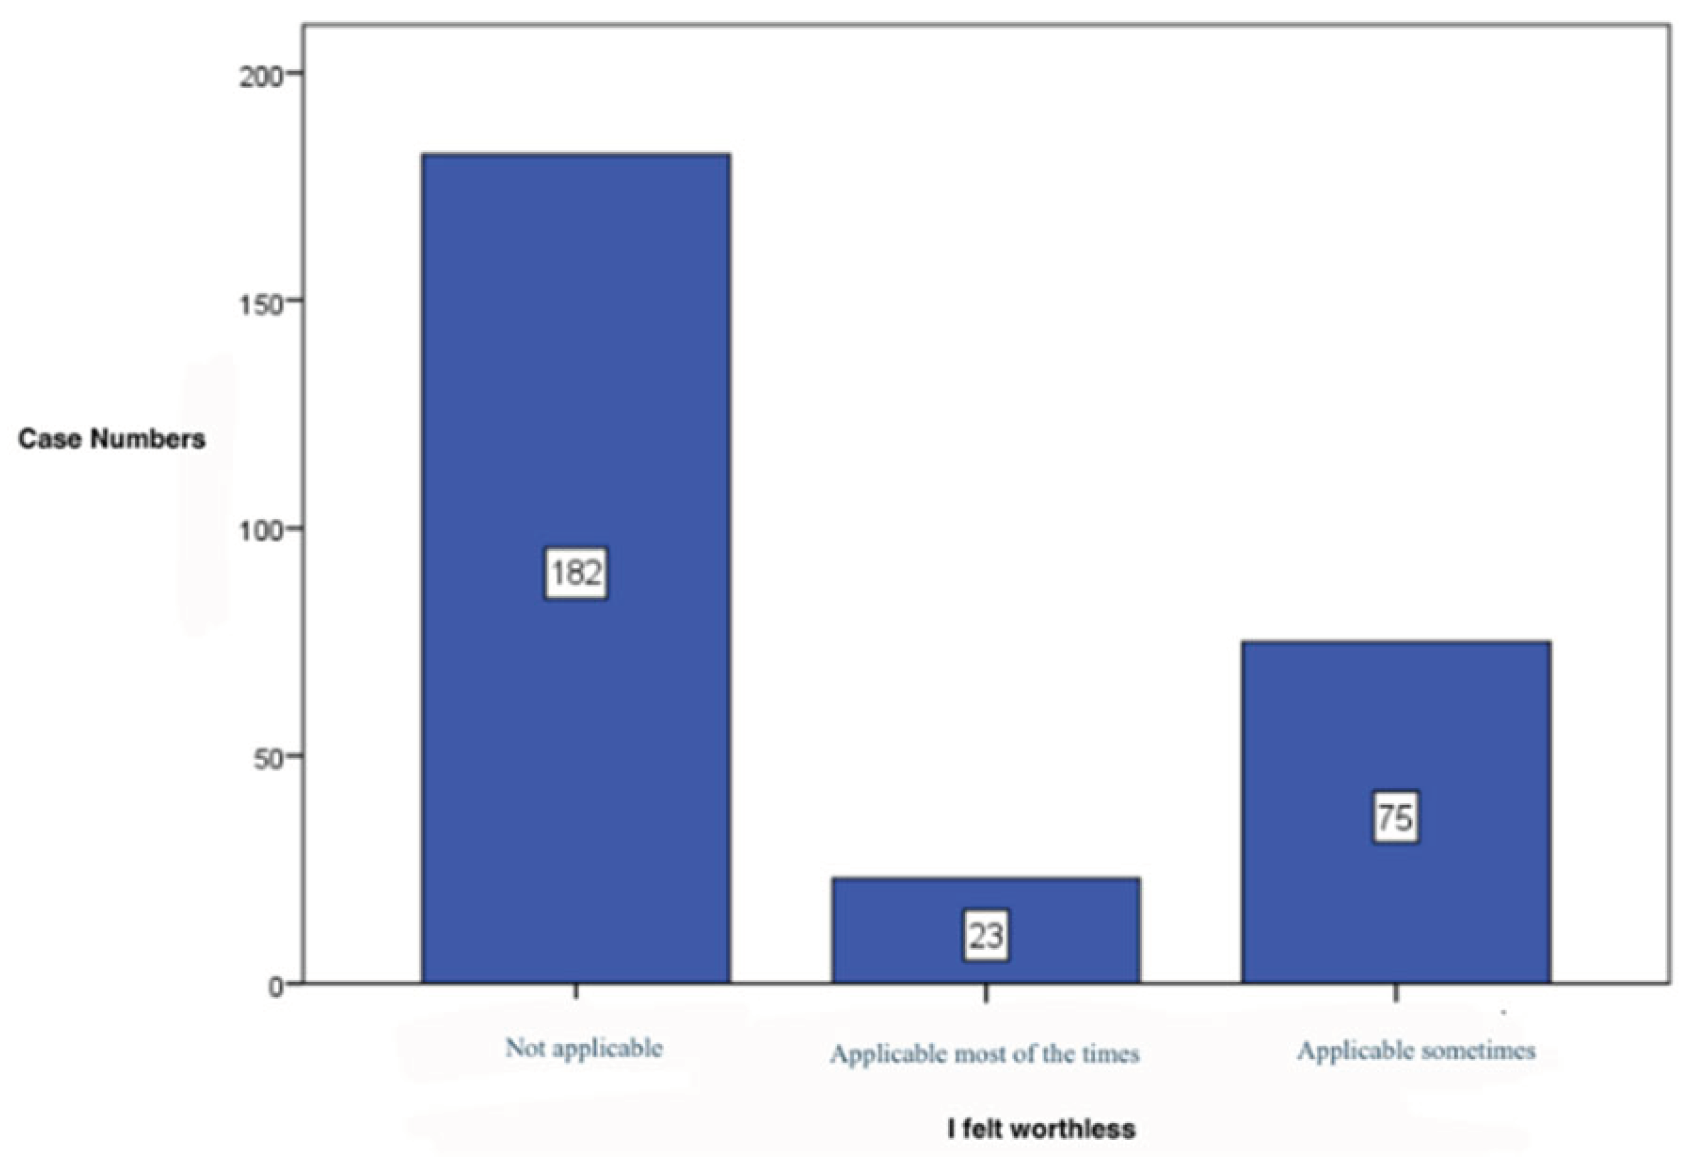
Figure 26.
Pattern of subjects that feel sad or depressed.
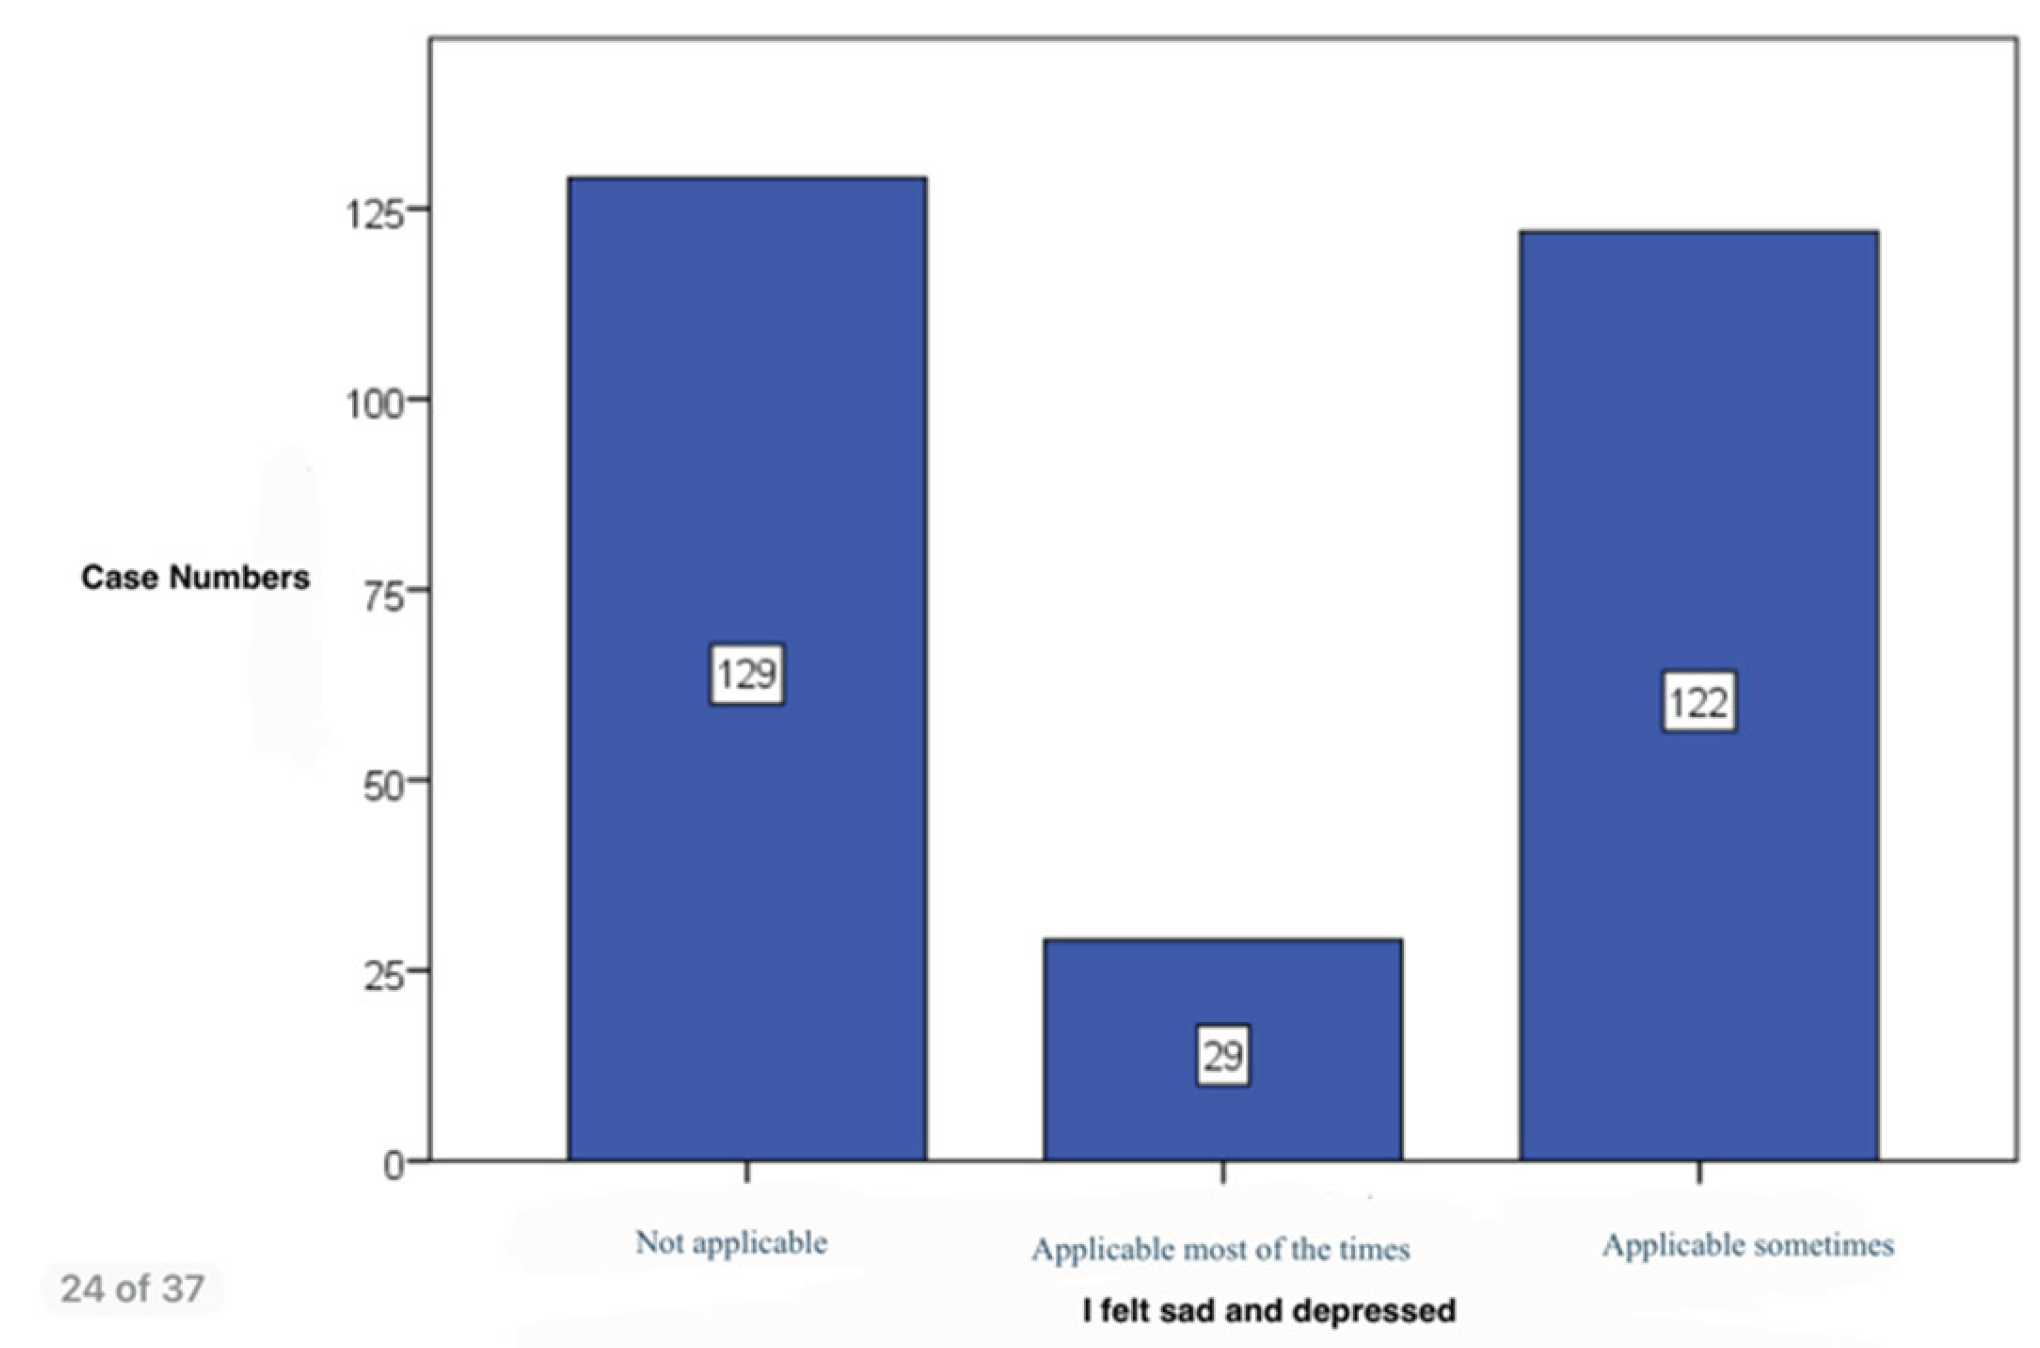
Figure 27.
Pattern of subjects that feel worried about situations which could make them feel uncomfortable.
Figure 27.
Pattern of subjects that feel worried about situations which could make them feel uncomfortable.
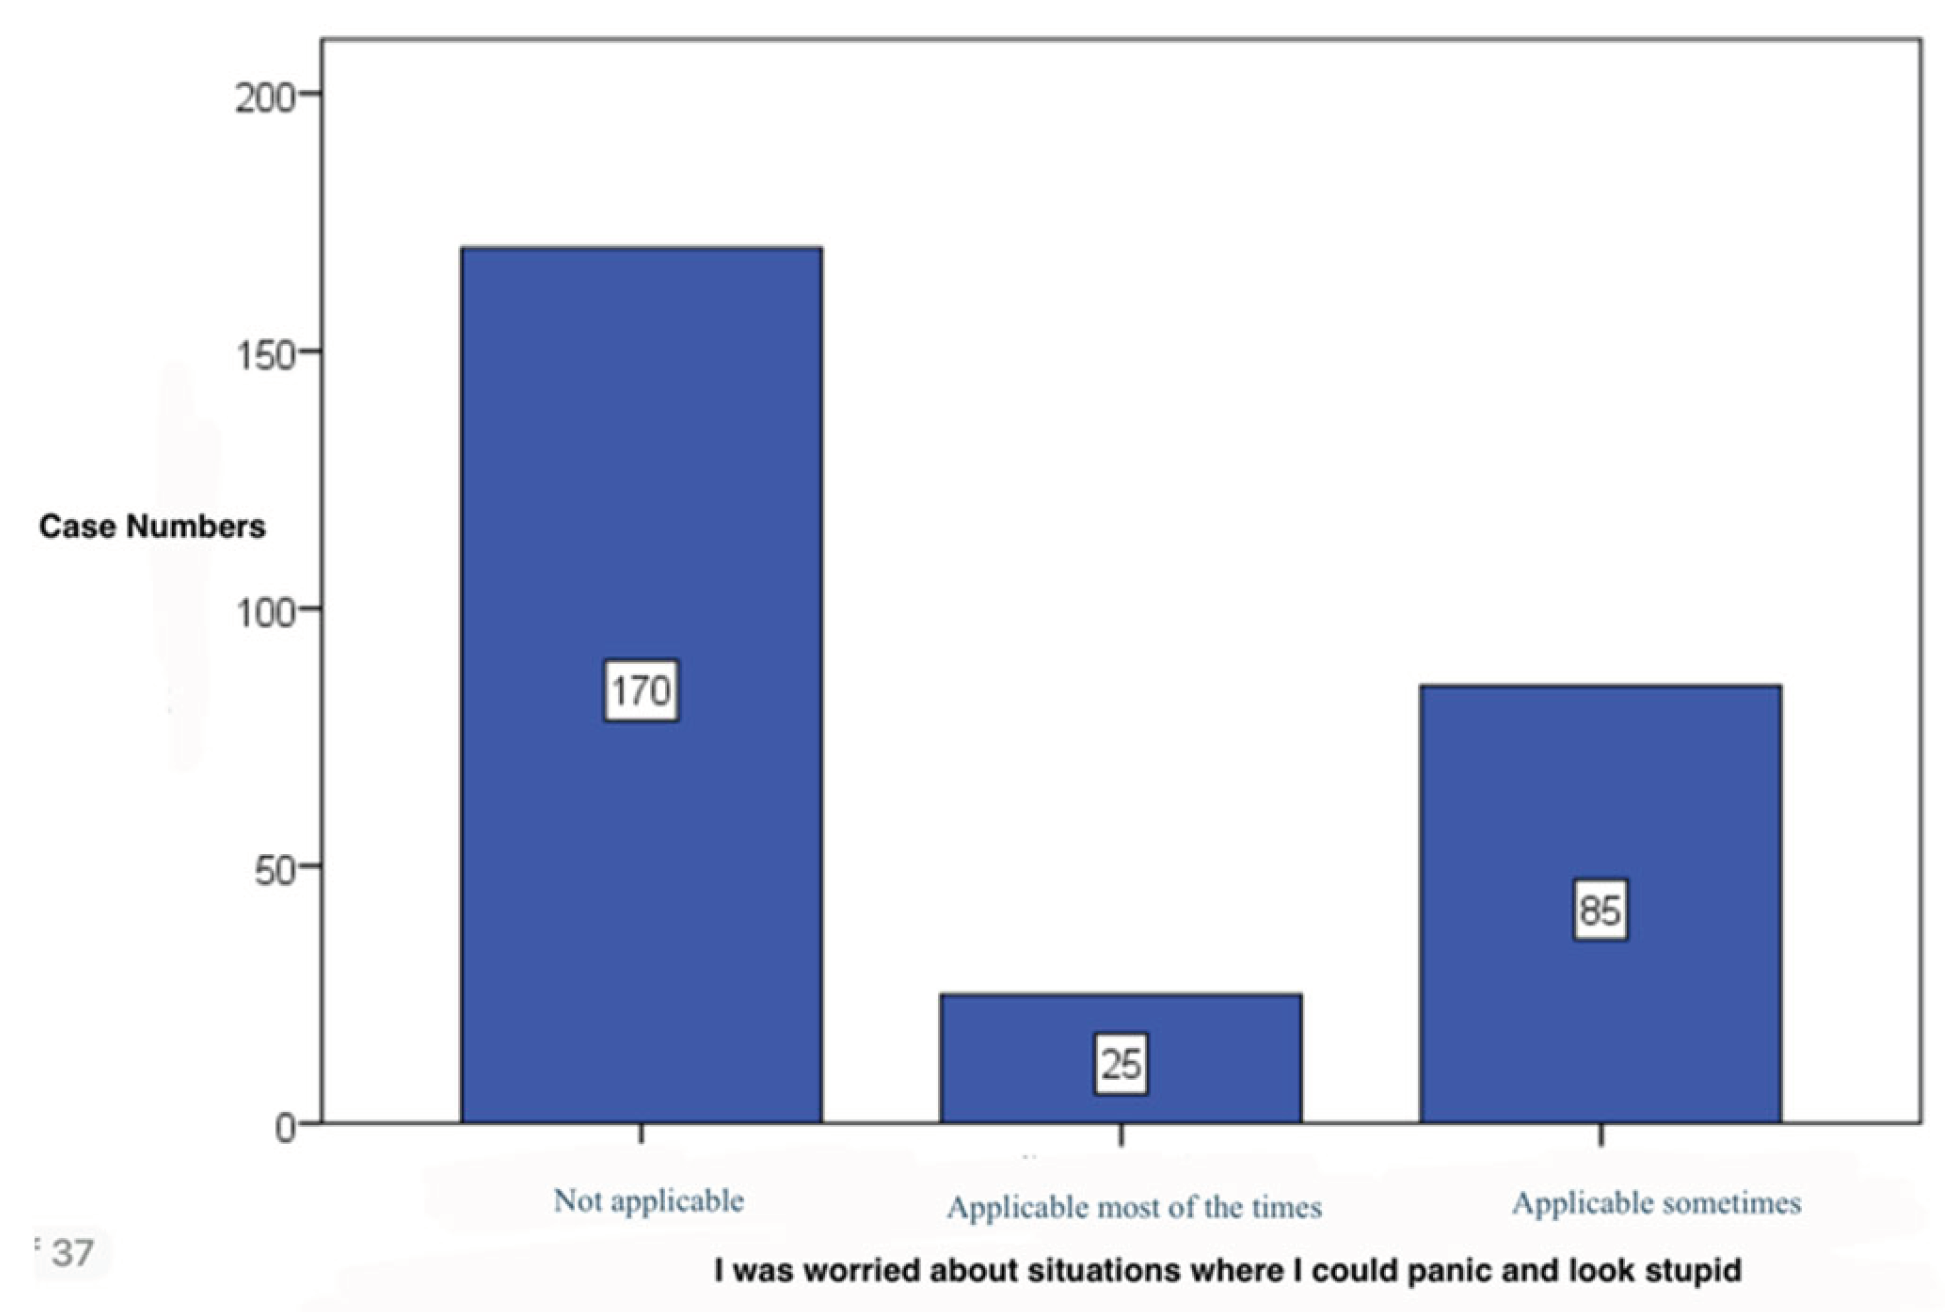
Figure 28.
Pattern of subjects with associated anxious episodes.
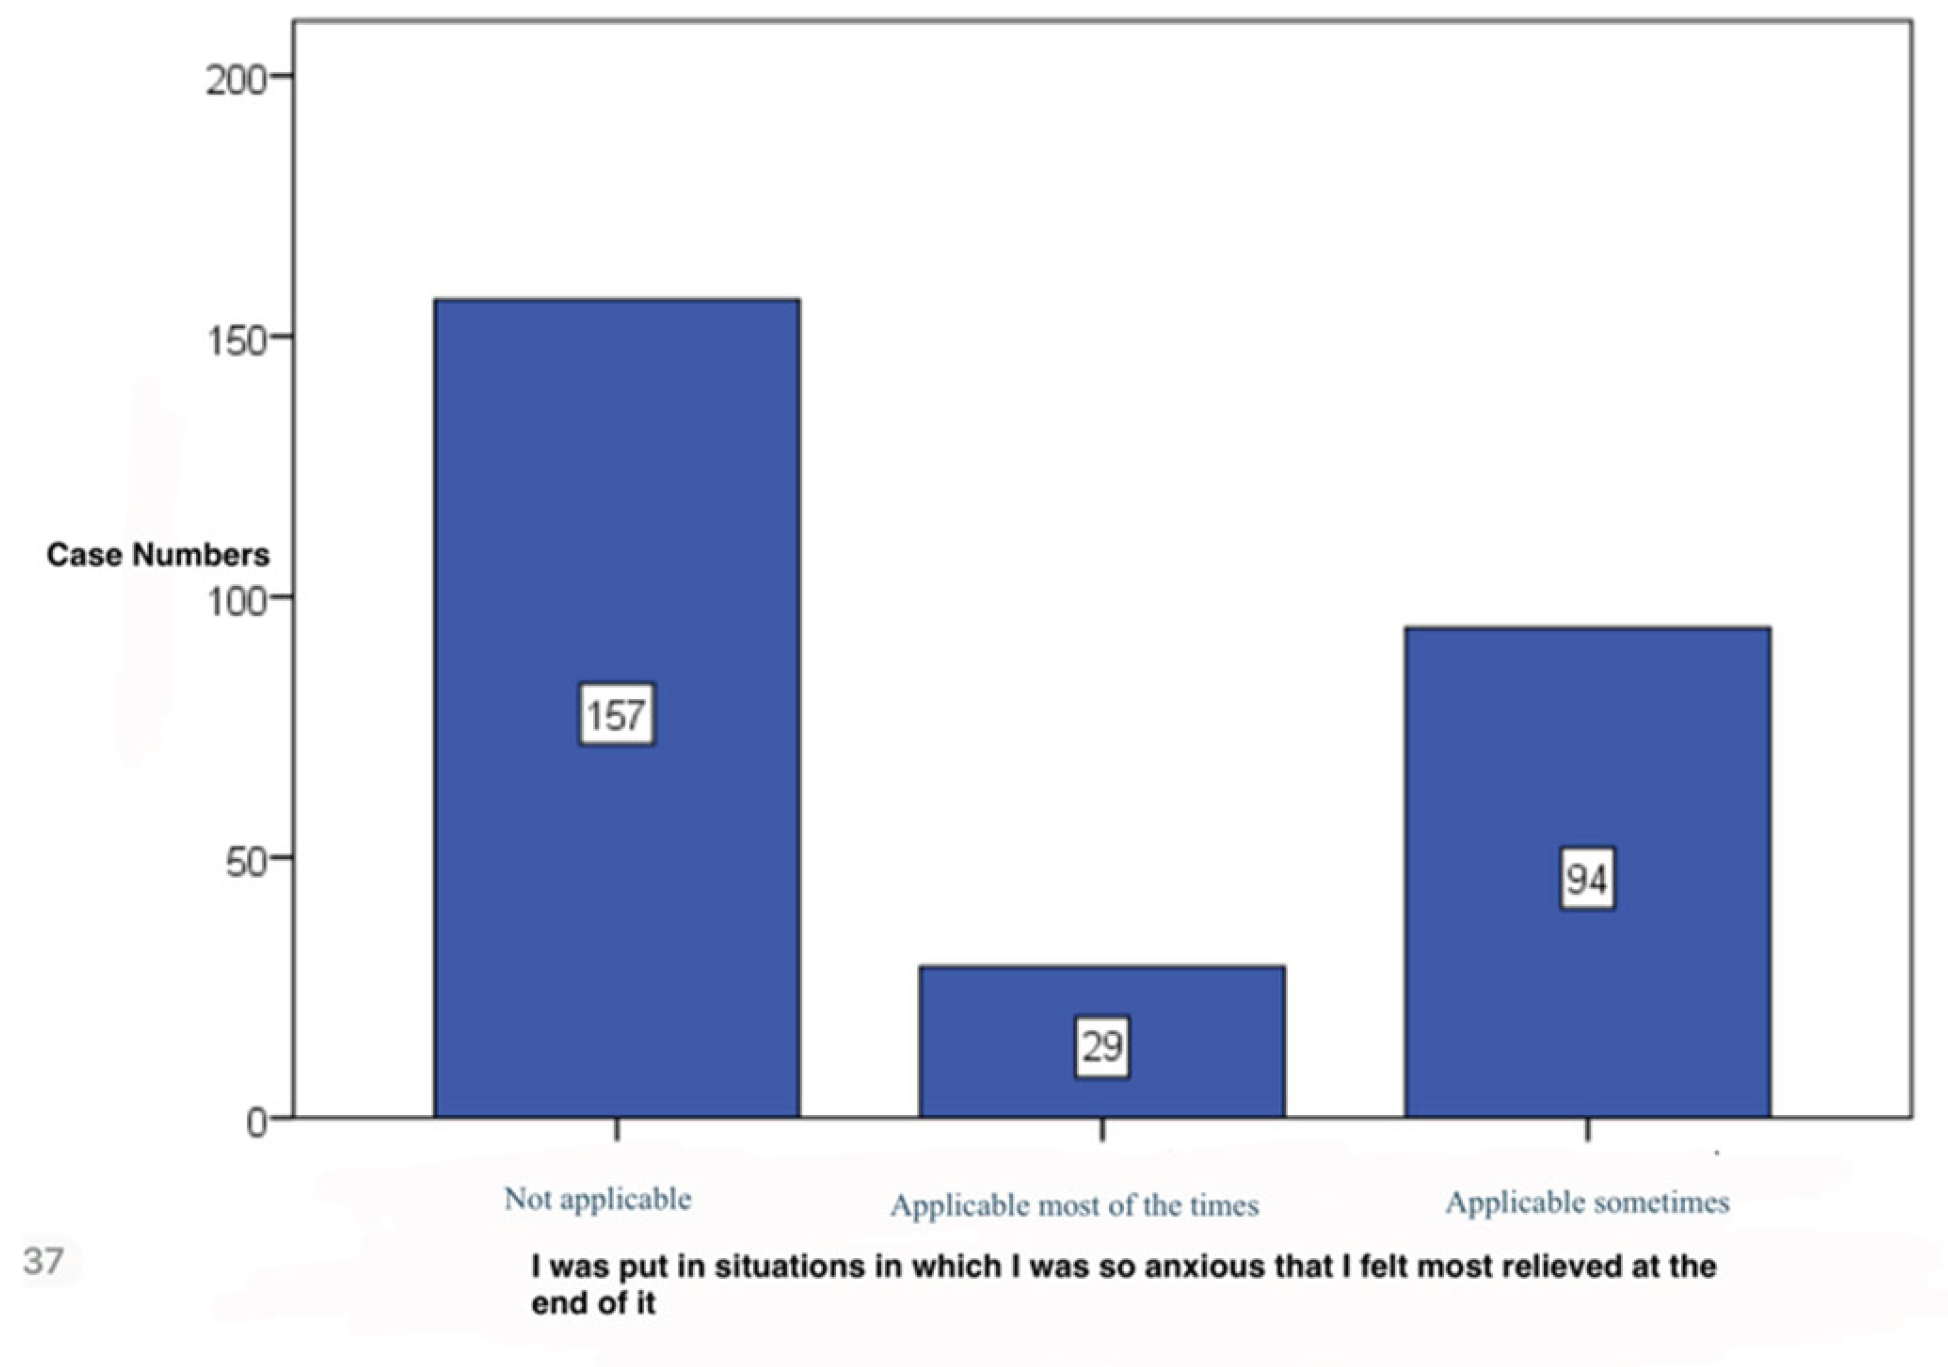
Figure 29.
Pattern of subjects with panic episodes.
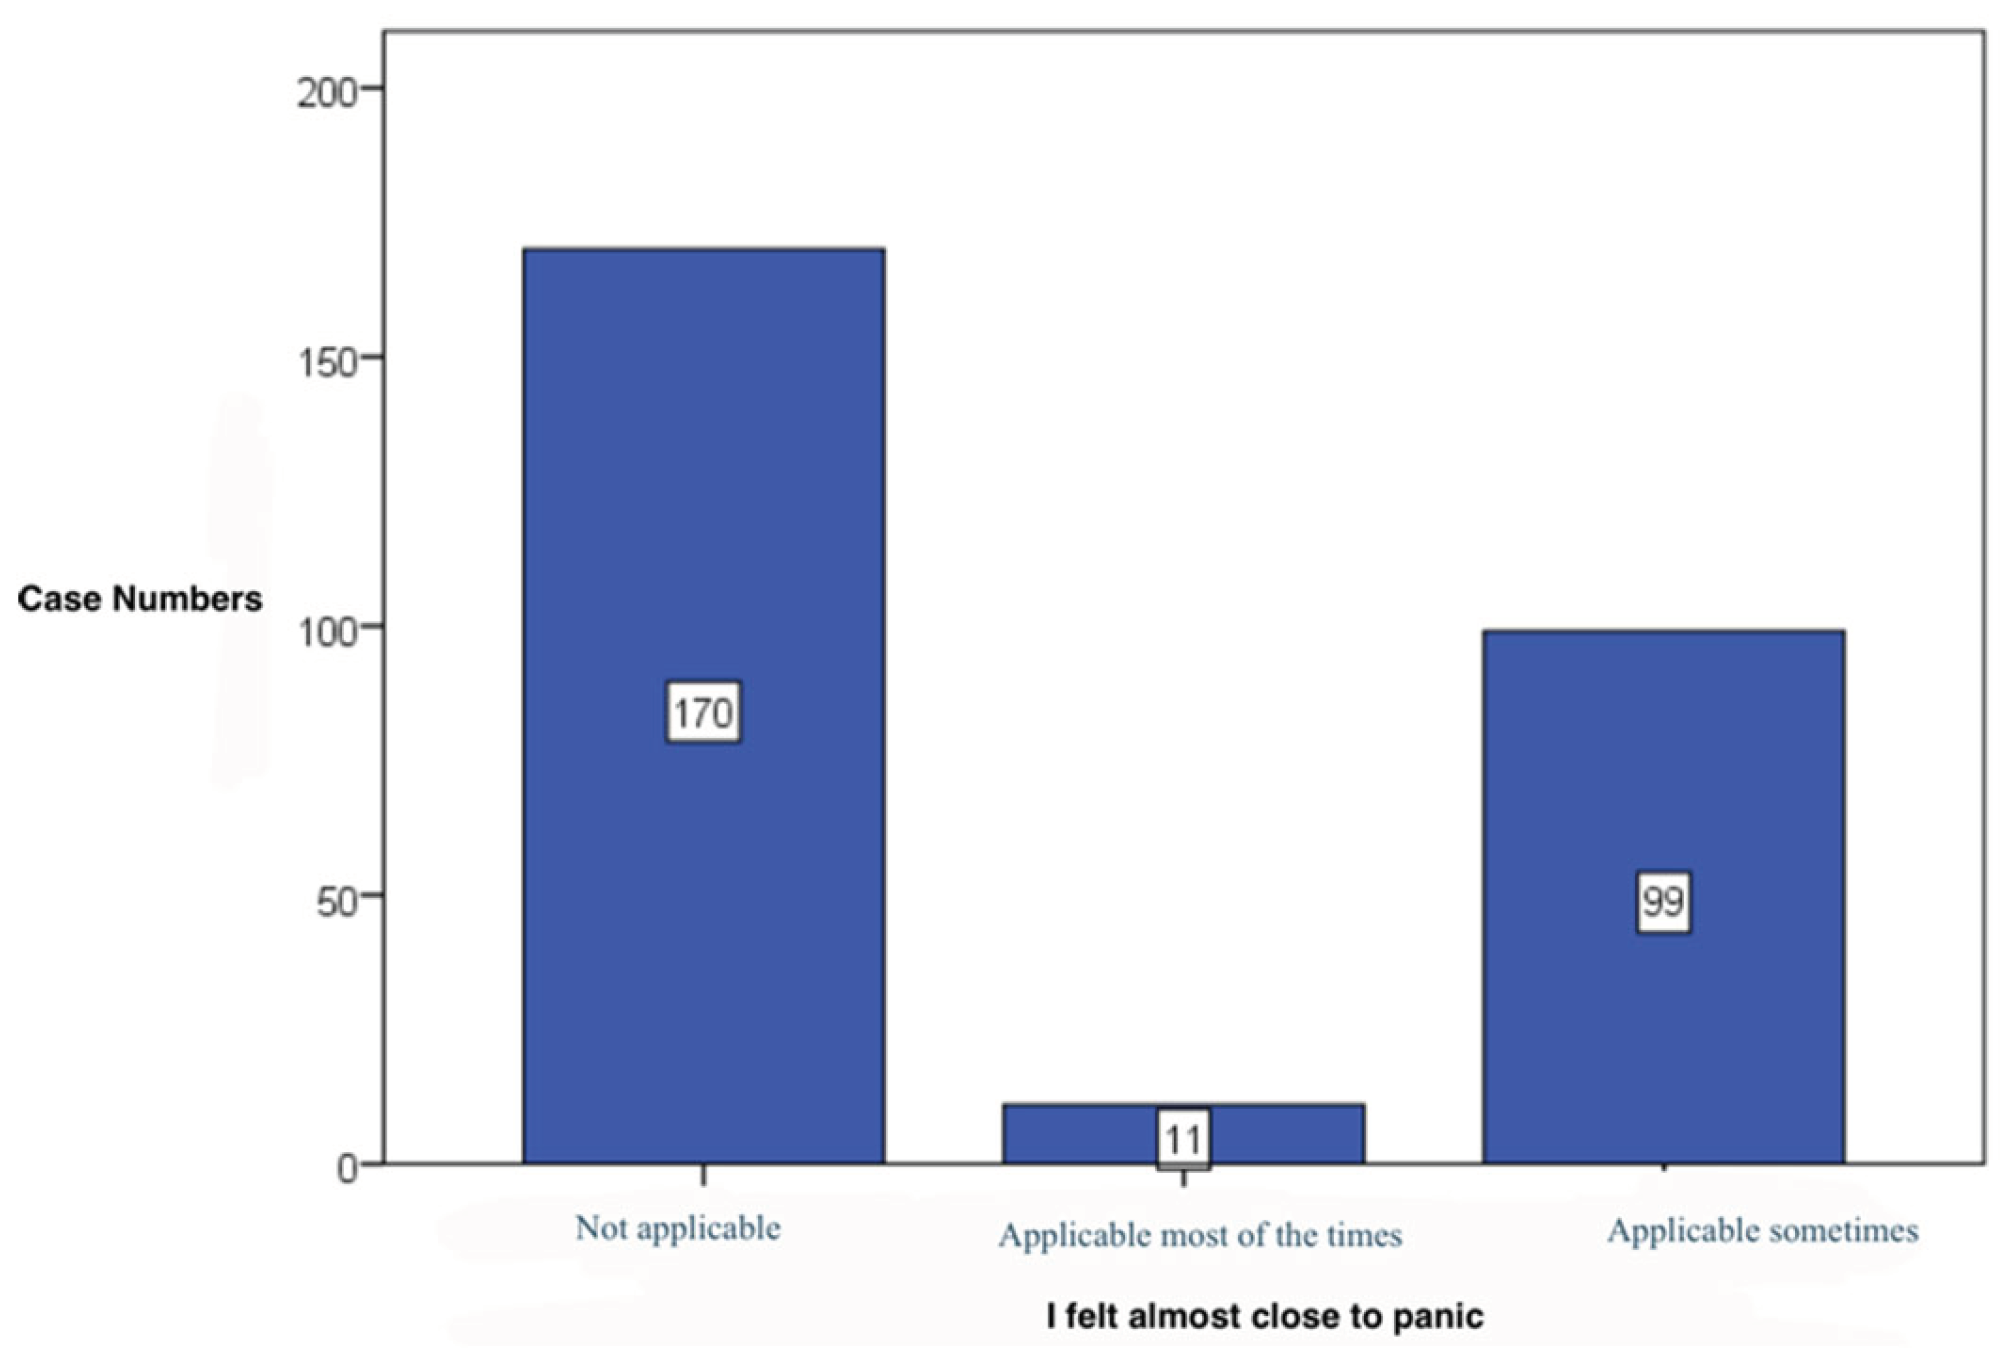
Figure 30.
Pattern of subjects with negative experiences.
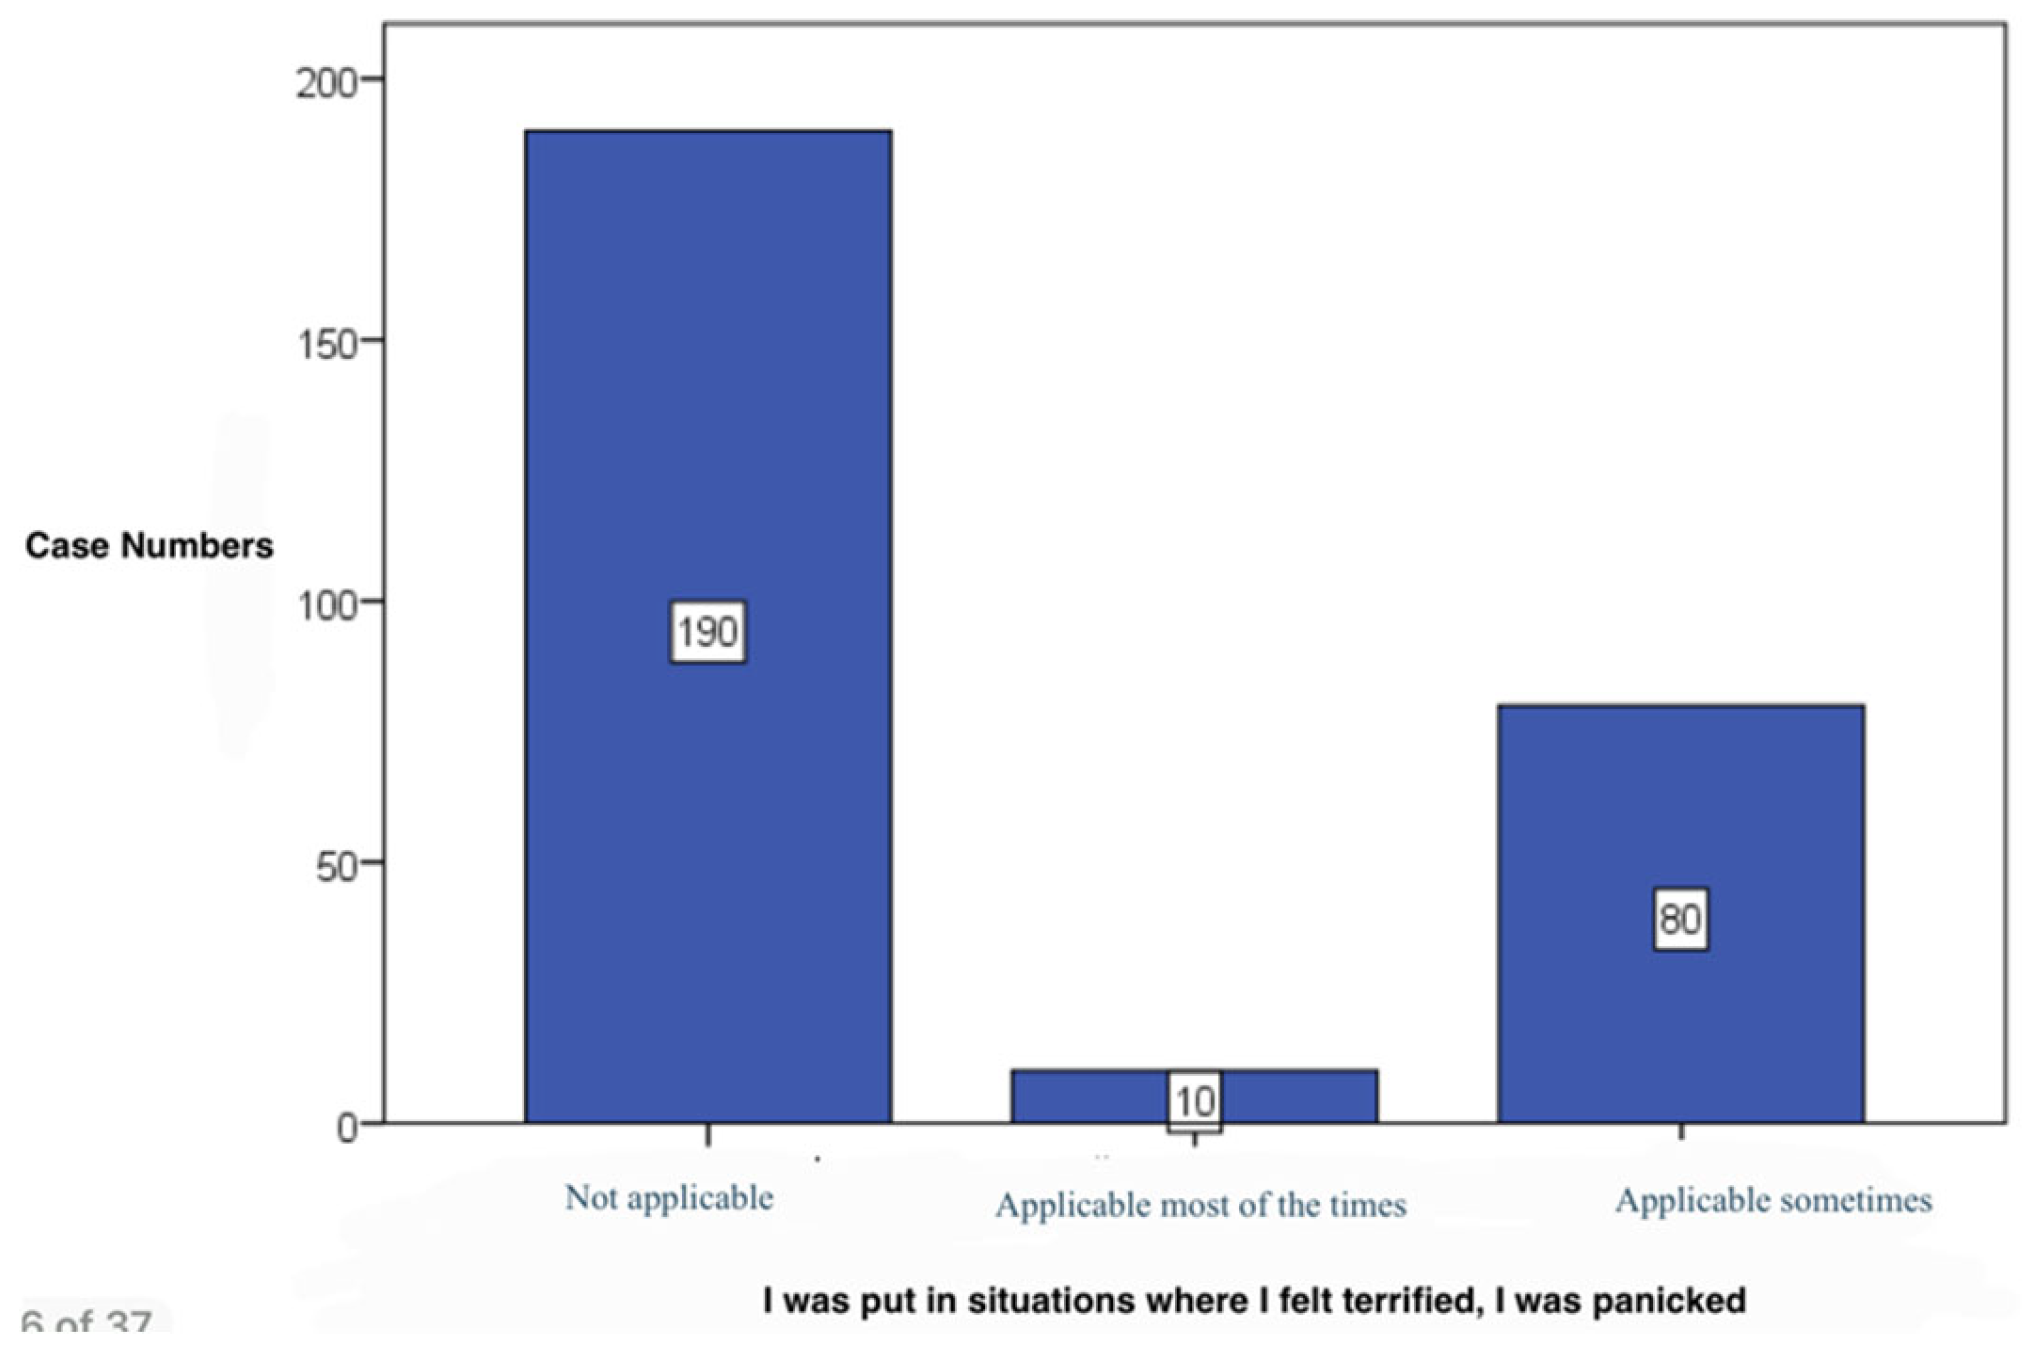
Table 1.
Sociodemographic and lifestyle characteristics of study participants (N = 280).
| Characteristic | Category / Statistic | n (%) or Mean ± SD |
|---|---|---|
| Age (years) | 33.9 ± 10.8 | |
| Gender | Female | 186 (62.0) |
| Male | 114 (38.0) | |
| Educational level | Secondary | 48 (16.0) |
| Tertiary / University | 252 (84.0) | |
| Employment status | Employed | 178 (59.3) |
| Student | 81 (27.0) | |
| Unemployed / Other | 41 (13.7) | |
| Body-mass index (kg/m²) | 23.7 ± 3.4 | |
| Physical-activity level | Regular (≥ 150 min / week) | 142 (47.3) |
| Occasional (< 150 min / week) | 99 (33.0) | |
| Sedentary | 59 (19.7) | |
| Smoking status | Non-smoker | 231 (77.0) |
| Smoker | 69 (23.0) | |
| Alcohol consumption | None | 79 (26.3) |
| Occasional (≤ 1–2 units / week) | 168 (56.0) | |
| Frequent (> 2 units / week) | 53 (17.7) | |
| Hydration adequacy | ≥ 1.5 L water / day | 204 (68.0) |
| < 1.5 L water / day | 96 (32.0) | |
| Caffeine intake | ≤ 2 cups / day | 189 (63.0) |
| > 2 cups / day | 111 (37.0) | |
| Fast-food consumption | ≤ 1 time / week | 162 (54.0) |
| ≥ 2 times / week | 138 (46.0) | |
| Fruit & vegetable intake | ≥ 5 servings / day | 118 (39.3) |
| < 5 servings / day | 182 (60.7) | |
| Sleep duration (h / night) | 7.1 ± 1.2 | |
| Perceived stress level | Low | 91 (30.3) |
| Moderate | 143 (47.7) | |
| High | 66 (22.0) |
Table 3.
Correlation matrix between dietary variables and mental-health outcomes (N = 300).
| Variable | Focus | Memory | Mood | Anxiety | Demotivation |
|---|---|---|---|---|---|
| Hydration (L/day) | 0.34* | 0.29* | 0.38* | –0.32* | –0.28* |
| Caffeine intake (cups/day) | –0.21** | –0.17* | –0.24** | 0.27* | 0.33* |
| Fast-food frequency (times/week) | –0.36*** | –0.30*** | –0.42*** | 0.39* | 0.41* |
| Fruit & vegetable intake (servings/day) | 0.41* | 0.35* | 0.44* | –0.38* | –0.33* |
* p < 0.05 ** p < 0.01 *** p < 0.001. Data represent Pearson’s correlation coefficients (r) assessing associations between dietary habits and mental-health outcomes. Positive values indicate direct correlations; negative values denote inverse associations.
Table 4.
Answered pattern of the survey.
| Case numbers | Percentage (%) | ||
|---|---|---|---|
| I did not experience any positive feelings | Not applicable | 147 | 52.5% |
| Applicable most of the times | 31 | 11.1% | |
| Applicable sometimes | 102 | 36.4% | |
| I could not find motivation to work/do chores | Not applicable | 122 | 43.6% |
| Applicable most of the times | 41 | 14.6% | |
| Applicable sometimes | 117 | 41.8% | |
| I could not enjoy the thing I have done | Not applicable | 157 | 56.1% |
| Applicable most of the times | 26 | 9.3% | |
| Applicable sometimes | 97 | 34.6% | |
| I feel lonely, without somebody to talk with about my problems or joys | Not applicable | 171 | 61.1% |
| Applicable most of the times | 32 | 11.4% | |
| Applicable sometimes | 77 | 27.5% | |
| I felt worthless | Not applicable | 182 | 65.0% |
| Applicable most of the times | 23 | 8.2% | |
| Applicable sometimes | 75 | 26.8% | |
Table 5.
Answers pattern of the survey.
| Case numbers | Percentage (%) | ||
|---|---|---|---|
| I felt that life has no sense | Not applicable | 210 | 75.0% |
| Applicable most of the times | 20 | 7.1% | |
| Applicable sometimes | 50 | 17.9% | |
| I felt sad and depressed | Not applicable | 129 | 46.1% |
| Applicable most of the times | 29 | 10.4% | |
| Applicable sometimes | 122 | 43.6% | |
| I was worried about situations where I could panic and look stupid | Not applicable | 170 | 60.7% |
| Applicable most of the times | 25 | 8.9% | |
| Applicable sometimes | 85 | 30.4% | |
| I was put in situations in which I was so anxious that I felt most relieved at the end of it | Not applicable | 157 | 56.1% |
| Applicable most of the times | 29 | 10.4% | |
| Applicable sometimes | 94 | 33.6% | |
| I felt almost close to panic | Not applicable | 170 | 60.7% |
| Applicable most of the times | 11 | 3.9% | |
| Applicable sometimes | 99 | 35.4% | |
| I was put in situations where I felt terrified, I was panicked | Not applicable | 190 | 67.9% |
| Applicable most of the times | 10 | 3.6% | |
| Applicable sometimes | 80 | 28.6% | |
Disclaimer/Publisher’s Note: The statements, opinions and data contained in all publications are solely those of the individual author(s) and contributor(s) and not of MDPI and/or the editor(s). MDPI and/or the editor(s) disclaim responsibility for any injury to people or property resulting from any ideas, methods, instructions or products referred to in the content. |
© 2025 by the authors. Licensee MDPI, Basel, Switzerland. This article is an open access article distributed under the terms and conditions of the Creative Commons Attribution (CC BY) license (http://creativecommons.org/licenses/by/4.0/).
Copyright: This open access article is published under a Creative Commons CC BY 4.0 license, which permit the free download, distribution, and reuse, provided that the author and preprint are cited in any reuse.


