
Submitted:
11 August 2025
Posted:
13 August 2025
You are already at the latest version
Abstract
After peripheral nerve lesion, the role of reactive oxygen species has not been clarified during Wallerian degeneration. The present study examined the participation of oxidant stress after rat sciatic nerve injury induced by two experimental models (crush and transection). Here, biochemical parameters indicative of oxidant stress, nitric oxide (NO) metabolism, cell proliferation, apoptosis and bioenergetics were determined in injured and contralateral sciatic nerves, and caudofemoralis muscle, by measuring production of ROS by-products and conjugated dienes, H2DCF-DA reacting by-products content, production of free radicals detected by chemiluminescence, rate of protein oxidation (carbonyl groups), NO metabolism, parameters indicative of cell proliferation, activity of caspase-3, changes in the cell redox state (cytoplasmic), mitochondrial cytochrome oxidase activity in crushed and transected sciatic nerves. The results show a different response pattern of injury between transected and crushed nerves during Wallerian degeneration and between contralateral nerves as well. The contralateral nerves also had changes in these parameters, but in a differential manner depending on the type of nerve lesion. In conclusion, present data strongly suggest that changes in the patterns of lipid peroxidation are not merely consequences of cell damage and death but rather are exerting a controlling role in the progression of Wallerian degeneration.
Keywords:
crushed injury
; transected injury
; thymidine kinase
; ornithine decarboxylase
; NAD/NADH redox state
; reactive oxygen species
1. Introduction
The rat sciatic nerve is one of the most frequently employed models for studying peripheral nervous system (PNS) Wallerian degeneration and regeneration of nerve injury [1]. Several events are initiated in the proximal and distal stump nerves after crush injury or transection for accomplishing a successful re-growth of proximal nerve, including myelin breakdown and clearance, de-differentiation and activation of repair Schwann cells, and the survival and activation of neurons [2,3,4].
The time course of the cellular and molecular events during Wallerian degeneration in the distal stump after nerve injury has been described [4]; that includes cytoskeletal collapse, degeneration of axons and fragmentation of axons and myelin sheaths, followed by debris clearance by both Schwann cells and macrophages recruited from the circulation [5,6]. As a prompt response to axonal loss, Schwann cells dedifferentiate, proliferate and activate as repair Schwann cells (or Büngner cells) that form guidance tracks for regenerating axons or Büngner’s bands, which serve as guide tubes for sprouting axons during re-innervation [3]. Moreover, the excess number of Schwann cells produced during axon regeneration must be reduced by apoptosis to attain one-to-one relationship between Schwann cells and axons during peripheral nerve regeneration [1,2,3,4]. All these metabolic and structural changes occur rapidly after nerve injury; however, signaling pathways that initiate axon loss that is translated into actual dismantling of axons with its orchestrated events between intra- axonal and glial, remain as fascinating issues for investigation.
Nitric oxide (NO) which is generated by three isoforms of NO synthase (NOS) appears to be a critical factor in neuronal degenerative and regenerative processes, during degradation of myelin debris and allowing axon re-growth to the distal stump [7,8]. The inducible (iNOS) and neuronal (nNOS) isoforms appear to be important during peripheral nerve injury. Experiments using knockout mice of iNOS [9] or nNOS [10] show a delay in regeneration, preceded by slowed Wallerian degeneration, due to a delay in the breakdown of myelinated fiber and axonal degradation, and in the myelinization of axons during nerve regeneration, associated with a delayed recovery of sensor and motor function. This suggests that the release of NO might be important in supporting the needs of successful Wallerian degeneration and regeneration of peripheral nerves. However, high levels of NO may be toxic to healthy cells and contribute to pathological changes. NO is an important inflammatory mediator, and high concentrations of NO results in damage of the myelin sheath and subsequent demyelination, playing an important role in inflammatory demyelinating diseases [7,11]. An in vitro model of Schwann cell-neuron co-cultures show that high concentrations of NO induced robust demyelination and axonal outgrowth arrest, and that the loss of myelin is the result of selective damage to axons, not to Schwann cells [7]; and when NOS inhibitor has been applied for 10 days following nerve transection an enhanced regeneration of axons is associated compared to normal [12], suggesting that high levels of NO maybe toxic to regenerating axons. Therefore, to avoid NO toxicity, the levels of NO need to be regulated in the progression of axon degeneration/regeneration, which characterizes Wallerian degeneration.
On the other hand, in this complex scenario, the role of reactive oxygen species (ROS) has not been clarified during Wallerian degeneration. For instance, after nerve crush, the number of myelinated fibers is significantly lower in vitamin E-deficient rat nerves, suggesting that the potent antioxidant vitamin E could be important factor of the normal process of nerve regeneration [13]. In fact, early motor fibers degeneration of rat sciatic nerve is accompanied by a marked diminished activity of the antioxidant enzymes superoxide dismutase and glutathione reductase and increased lipid peroxidation (LP), and nodal sprouting regeneration is more affected by deficiency of vitamin E [14]. Also, excessive NO formation increases LP, as well as degeneration of both myelin sheath and axon, and this increase level of LP is partly reduced by NOS inhibition in the early ischemia-reperfusion of the sciatic nerve [15], which gives further support to the involvement of ROS and its by-products during Wallerian degeneration. Nonetheless, it has become evident that LP occurring in living cells can also regulate several cellular processes, such as proliferation, differentiation, and apoptosis of normal and neoplastic cells, mainly through the participation of its aldehydic by-products or by hydrogen peroxide [16].
Hence, the present work is a long-lasting follow Wallerian degeneration, induced by crushing or transecting rat sciatic nerves, as well as its relationships with proliferative, apoptotic and metabolic events taking place throughout the recovery period. Results indicate that ROS-mediated oxidant stress not only participate in the early axonal degenerative phase, but rather it can constitute an important part in the coordination of the underlying mechanisms participating in the regeneration of peripheral nerves.
2. Material and Methods
2.1. Experimental Models.
All procedures involving animals were carried out in accordance with the Official Mexican Norm for production, care and use of laboratory animals (NOM-062-ZOO-1999). Protocol (48447-Q) approved by the Bioethics Committee of the School of Medicine of the Universidad Autónoma del Estado de México, minimizing the number of animals used and their suffering. Male Wistar rats (200–300 g) were used in all experiments. Rats were killed by CO2 overexposure.
Male Wistar rats (3.5-months old, n=120) were anesthetized with CO2 and anhydrous ether during the surgical procedures, which were done using aseptic conditions. Then, the left leg muscles were separated at the mid-thigh level to uncover the sciatic nerve, which was then crushed with fine forceps # 7 (Dumont, Switzerland) for 30 s, and rats were allowed to recover for 1, 3, 5, 7, 10, 15, 20, 25, 28 and 32 days after crush [17]. For transection the nerve is cut and a stitch of the proximal stump to the muscle is used to prevent proximal regenerating axons from entering the distal stump and encourage nerve degeneration [17]. Proximal and distal parts of the injured nerves were separated, and rats were allowed to recover for the same time-course after transection. The undamaged contralateral was also extracted in both models and normal sciatic nerve was used as control.
2.2. Obtaining Nerve Samples.
The nerves were split into manageable strands and then gently homogenized in a 20 mM phosphate buffer solution (pH 7.4). The homogenates were spun at 1200 g by 15 min at 4ºC, and the supernatants were then used to determine parameters indicative of cell proliferation, apoptosis, and oxidant stress, as well as to quantify the activity of cytochrome oxidase. Another set of nerve strand was directly homogenized in cold-perchloric acid (8% w/v, final concentration), centrifuged to remove denaturalized proteins, and in neutralized supernatants from these extracts, the redox- pair metabolites (lactate and pyruvate) were determined. The denaturalized nerve strands contained 5 to 7 mg of whole protein.
2.3. Sampling Other Organs.
Homogenates of brain, liver, anterior (brachial) nerves, as well as contralateral and surrounding caudofemoralis muscles in the zone of the injured sciatic nerve, were also obtained.
2.4. Assays for LP and Protein Carbonyl Groups.
In samples from normal, injured and contralateral nerves, The ROS by-products levels in sub-cellular fractions were estimated through the method described by Viarengo et al. [18], using the fluorescence signal generated by ROS reacting with 2′,7′-dichlorodihydrofluorescein di-acetate (H2DCF-DA, Molecular Probes). The LP-related conjugated dienes were assessed as previously described [19], whereas the “production” of free radicals was determined by a technique based on luminol-chemiluminiscence [20]. The protein carbonyl content in nerve preparations, as an index of oxidative damage, was estimated according to Levine et al. [21].
2.5. Estimation of DNA Synthesis and Compensatory Cell Proliferation During Wallerian Degeneration of the Sciatic Nerve
The cytosolic thymidine kinase (TK; EC 2.7.1.21) activity was determined by the technique of Sauer and Wilmanns [22], using [methyl-3H]thymidine (sp. act. 2 Ci/mmol; Dupont New England Nuclear Co., Boston, MA, USA). Ornithine decarboxylase (ODC; EC 4.1.1.17) activity was assayed by a radiometric technique using [1-14C]-ornithine (sp. act. 54 mCi/mmol) as substrate [23].
2.6. Assessment of Apoptosis.
To gain some insight in the onset of apoptosis, we measured rate of apoptosis through determining activity of caspase-3, assayed with a colorimetric kit (Chemicon, Temecula, CA, USA), based on the principles described by Thonberry [24].
2.7. Determination of Redox-Pair Cytosolic Metabolites, NO Metabolism and Activity of Cytochrome Oxidase
Perchloric acid extracts obtained from freezing clamped sciatic nerves were neutralized with 5 mol/L of K2CO3 and used for metabolite determinations by enzymatic methods for lactate and pyruvate [25]. In homogenate of sciatic nerves, the activity of cytochrome oxidase (EC 1.9.3.1) was quantified by monitoring oxygen consumption [25]. The amount of NO produced by healthy and injured nerves was estimated by measuring the sum of nitrites and nitrates, as well of citrulline, through colorimetric methods, as previously reported [26].
2.8. Calculations and Statistics
Cytosolic and mitochondrial redox states were calculated from the lactate/pyruvate ratio in accordance with Stubbs et al. [27]. Estimation of the NAD/NADH ratio from the cytoplasmic compartment was done using the following equation: NAD+/NADH + H+ = [oxidized substrate]/[reduced substrate] • 1/Keq of lactate dehydrogenase (1.11 x 10⁻⁴ M). The data are reported as mean ± standard deviation (SD) for each group. All statistical analyses were performed using PRISM version 4.0 (GraphPad). Inter-group differences were analyzed by one-way ANOVA, followed by Tukey’s multiple comparison test as a post-test to compare the group means if overall P < 0.01, and considered this P as statistically significant.
3. Results
3.1. Production of ROS By-Products and Conjugated Dienes in the Injured Sciatic Nerve After Crushing or Transection
The crushed rat sciatic nerve increased the amount of LP, as assessed by the content of H2DCF-DA reacting by-products, after injury (Figure 1A), eliciting mainly three peaks at 10, 20, and 25 days The maximum peak of LP activity was achieved on day 25 after injury (almost 10-fold over controls) and drop further (Figure 1A). After transection, both nerve sections rapidly increased production of H2DCF-DA reacting by-products which were normalized between 5 to 10 days. Both sections, distal and proximal injured nerves increased LP again, maintaining a rate of LP up to day 20. At later times (starting at day 20), crushed nerve shows a LP pattern as a “mirror-image” of that obtained in transected nerve (Figure 1A). Unexpectedly, contralateral (intact) nerves also showed enhanced levels of H2DCF-DA reacting by-products, which was more drastic in crushed nerves; while the profile was opposite regarding early times after injury, increased levels of LP followed the same patterns at later times in both transected and crushed nerves (Figure 1A).
Despite that we also found increased amounts of conjugated dienes present in cell membranes from injured nerves (Figure 1B), the patterns were different when compared to those of H2DCF-DA reacting by-products (Figure 1A). For instance, enhanced rate of formed conjugated dienes was noted starting 10 days after injury and maintained high in both models (Figure 1B). Unexpectedly, membrane conjugated dienes were found significantly increased earlier in the contralateral nerves, mainly in those animals subjected to transection; in both cases, conjugated dienes did not return to control values (32 days after injury; Figure 1B).
3.2. H2DCF-DA Reacting By-Products Content in Other Tissues During Wallerian Degeneration of Crushed Nerves
Looking for whether other tissues were able to respond to the injured sciatic nerve, as a systemic response, we determined the rate of H2DCF-DA reacting by-products in brain, liver, intact brachial nerve (anterior right rat paw), and the caudofemoralis muscle surrounding the sciatic nerve from animals subjected to crush injury (Table 1). In the brain cortex non-significant changes were observed, while the brachial nerve showed a significant decrease in H2DCF-DA reacting by-products levels after crushing the homolateral sciatic nerve (Table 1). The liver only showed an unexpected increase of H2DCF-DA reacting by-products on day 7 after crushing, while the caudofemoralis muscle from the injured zone clearly had two peaks of enhanced H2DCF-DA reacting by-products (at 3 and 20 days after injury; Table 1). Hence, we also studied several parameters in the caudofemoralis muscles (from the injured and contralateral zones) obtained from rats subjected to crush injury (Figure 4).
The results are expressed as means ± SD of 5 individual observations per experimental point for LP by-products identified by the fluorescence generated by the complex with the H2DCF-DA probe. The braquial nerve corresponded to the main nerve found in the anterior rat’s paw (“arms”). Statistical significance: *p<0.01 against the control values.
3.3. Production of Free Radicals Detected by Chemiluminescence in Crushed or Transected Sciatic Nerves
After transection, production of free radicals barely increased in proximal and distal nerves, except for the first day post-injury in the proximal nerves (Figure 1C), clearly contrasting with the higher rates of H2DCF-DA reacting by-products found in these nerves (Figure 1A,C), while crushed nerves show a significant peak of free radicals’ production on day 20 (Figure 1C). Interestingly, the contralateral nerves from crushed nerves have two peaks of chemiluminescence at 5 and 25 days after injury (Figure 1C), not present in transected nerves that show a lower production of free radicals even when compared with the control group (Figure 1C).
3.4. Rate of Protein Oxidation (Carbonyl Groups) in Crushed or Transected Nerves
Very early after transection both, proximal and distal nerves, presented an enhanced content of carbonyl groups in proteins, indicative of their oxidation. Both profiles (proximal vs. distal) were very similar, except on day 5, where a mirror-image was observed (Figure 1D). In contrast, crushed nerves show a similar rate of oxidized proteins to control nerves (up to day 10), but a small peak of carbonyl protein groups was recorded on day 25 and declined thereafter (Figure 1D). As could be anticipated, in the contralateral nerves, we did not find enhanced oxidation of sciatic nerve proteins, except for an unexpected sharp peak noted on day 5 after transection (Figure 1D).
3.5. NO Metabolism in Crushed and Transected Sciatic Nerves
To assess NO production of injured nerves, the levels of nitrates, nitrites and citrulline were determined (Figure 2). In both crushed and transected nerves, a consistent decrease of nitrates + nitrites was observed, suggesting a diminished NO production, which slowly normalized at the end of the experiment and has a peak at day 28 in the distal stump (Figure 2A). Interestingly, in the other major product from NO synthase, namely citrulline, normal levels were found in the injured nerves, and a peak was also observed at day 28 in the distal stump (Figure 2B). As for the contralateral nerves, the sum of nitrites and nitrates was non-significant, different from control samples, in both models of injury (Figure 2B). For citrulline, the levels were maintained higher when compared to the control in crushed nerves, while in transected nerves the citrulline levels were practically unaltered (Figure 2B). In conclusion, the results show a decrease in NO metabolism in injured nerves.
3.6. Parameters Indicative of Cell Proliferation in Crushed and Transected Sciatic Nerves
In crushed nerves, there was an early elevation in the TK activity, reflecting an active DNA synthesis, which suddenly decreased at day 5, but showed a second peak at day 20, and progressively returned to the control level (Figure 3A). After transection, a drastic increase of TK activity was also observed at day 1 in both distal and proximal stumps but being more dramatic in the distal nerve (more than 12 times; Figure 3A). In fact, DNA synthesis in the distal nerve remained enhanced during the first 10 days after transection, declining at day 15; on the contrary, the proximal nerve showed a second peak of TK activity (day 10) which returned very slowly to the control levels for TK activity (Figure 3A). Unexpectedly, the contralateral nerves also changed TK activity. After crushing, a small peak at day 7 was observed (Figure 3A), in contrast, early after transection the TK activity drastically increased in the contralateral nerve, remaining high and decreasing at day 15 (Figure 3A).
The activity of ODC (polyamine synthesis), was also increased after nerve injury, but it had a different pattern compared to TK activity along the times tested during Wallerian degeneration (Figure 3B). In crushed nerves, ODC activity increased starting from day 10 and had a peak by day 20 returning to normal levels by day 30. As for transection, the distal nerve depicted an early increase in ODC activity, followed by two more peaks at days 7 and 15, returning to the control range (Figure 3B). The proximal nerve had two peaks of maximum ODC activity at days 3 and 10 normalizing by day 25 after surgery (Figure 3B). Again, contralateral nerves showed significantly enhanced ODC activity up to day 25 after crushing, whereas after transection, only two significant peaks at days 3 and 7 was observed (Figure 3B).
3.7. Activity of Caspase-3 in the Injured Sciatic Nerve After Crushing or Transection
The activity of caspase-3, as a reliable marker for apoptosis, was measured in both models (Figure 3C). Early after crushing, the injured nerve had significantly increased activity for caspase-3 at day 5, rapidly returning to the control range. However, this enzyme activity was further progressively increased (starting at day 20) showing a peak of maximum activity on day 28 and remained significantly increased thereafter (Figure 3C).
In contrast, in both proximal and distal transected nerves the level of caspase-3 activity was significantly low or lower than the controls (Figure 3C). Unexpectedly, in contralateral nerves the activity of caspase-3 was increased in both experimental models, practically along all the experimental times tested (Figure 3C).
3.8. Changes in the Cell Redox State (Cytoplasmic) in the Injured Sciatic Nerve After Crushing or Transection
The Wallerian degeneration achieved by crushed or transected sciatic nerve, was accompanied by changes in the tissue concentrations of lactate and pyruvate, hence, modifying the cytoplasmic redox NAD/NADH potential (Figure 4). After crushing, the injured nerve had lower lactate/pyruvate ratio which was reflected in an increased NAD/NADH ratio (day 1); however, this more oxidized cytoplasmic redox state was rapidly normalized, thereafter (Figure 4A and B).
On the contrary, after transection both proximal and distal nerves showed lower lactate/pyruvate ratio, which led to a much-oxidized cytoplasmic redox state along the experimental times tested, which was strongly in the distal nerve (Figure 4A and B). In contralateral nerves, the NAD/NADH ratio was largely increased in crushed and transected nerves, representing a more oxidized cytoplasmic redox state, (Figure 4A and B), which was preceded by a discrete reduction of this redox state and returned to control values (Figure 4A and B).
3.9. Mitochondrial Cytochrome Oxidase Activity in the Injured Sciatic Nerve After Crushing or Transection
The activity of cytochrome oxidase can partially reflect mitochondrial metabolism, and this enzyme activity has been used to assess neurogenesis [28]. Crushed nerves showed a drastic reduction of cytochrome oxidase activity which remained low up to the end of the experiment (Figure 4C). A similar pattern was observed in the distal nerve after transection, while the proximal nerve showed a significant drop in the cytochrome oxidase activity until day 5, followed by enhanced levels of activity of this enzyme (Figure 4C). As to the contralateral nerves, crushed nerves showed an increase in mitochondrial activity until day 10, normalizing thereafter (Figure 4C), while in transected nerves, an unexpected decrease of this mitochondrial enzyme activity was recorded up to day 20 after surgery, and returning later to control values (Figure 4C).
3.10. Parameters Are Indicative of Oxidant Stress, Proliferation and Apoptosis in Leg Muscles After Crushing the Right Sciatic Nerve
As mentioned before, the caudofemoralis muscle clearly had two peaks of enhanced H2DCF-DA reacting by-products at day 5 and 20 after injury, which did not correlate with either conjugated dienes or protein carbonyl groups that did not change (Figure 5A, B and E). On the contrary, the contralateral muscle showed low rate of oxidant changes compared to control nerves, except for the increased H2DCF-DA reacting by-products level found at day 15 (Figure 5A). However, the activity of TK and ODC in the muscles from both the crushed and the contralateral zone showed a progressive increase (Figure 5C and D), but its time-course was quite opposite (mirror-image) to that found in injured nerves (Figure 5C and D). In the contralateral muscle, TK activity was also increased even at earlier times after crushing; on the contrary, ODC activity was slightly increased at day 10 (Figure 5C and D). Interestingly, activity of caspase- 3 was robustly increased in the muscle from the injured zone showing two peaks at days 3 and 15, while in the contralateral zone, caspase-3 activity was not found significantly modified (Figure 5F).
3.11. Correlations Among Parameters Indicative of Oxidant Stress, Cell Proliferation, Apoptosis, and Onset of Mitochondrial Biogenesis in Crushed and Transected Sciatic Nerves with Their Respective Contralateral Nerves
We looked for possible relationships between parameters indicative of oxidant stress, namely H2DCF-DA reacting products, with cell proliferation and apoptosis, and mitochondrial function. Fluctuations in the production of LP by-products highly correlated with ROS generation in both crushed and contralateral nerves (Figure 6A), while a lower direct correlation was noted in the transected proximal injured nerve (Figure 6B) and not a significant correlation was found when examining the transected distal injured nerve (Figure 6C). Production of H2DCF-DA reacting compounds also correlated well with the presence of carbonyl groups in proteins (oxidized) and, to a lower extent, the corresponding contralateral nerve (Figure 6D) and a similar correlation was found in the transected proximal nerve (Figure 6E). On the contrary, not significant correlations were observed in the transected distal nerve nor in the corresponding contralateral nerves (Figure 6E,F). The H2DCF-DA fluorescence also correlated with active caspase-3 in the crushed and was surprising that in the contralateral nerve correlated even better between LP by products and caspase-3 activity (Figure 6G). We did not find a significant correlation between these two parameters in the transected proximal nerve (Figure 6H) and neither in the distal nerve (Figure 6I); interestingly, the contralateral nerves showed a weak but significant correlation between H2DCF-DA fluorescence and caspase-3 activity (Figure 6H,I). As regards cell proliferation (most probably Schwann cells and macrophages), the H2DCF-DA fluorescence correlated with ODC activity in the crushed nerve whereas, as it could be anticipated, no correlation was recorded in the contralateral nerve vs. ODC (Figure 6J). Meanwhile in the transected proximal we did not note any correlation between these parameters (Figure 6K), in the transected distal nerve a weak but significant straight correlation was found between H2DCF-DA fluorescence and ODC activity (Figure 6L). Again, the contralateral nerves of the transected injured nerves had a weak but inverse relationship between these parameters (Figure 6K,L). Increased presence of LP by-products inversely correlated with the cytochrome oxidase activity; this effect also observed in the corresponding contralateral nerve (Figure 6M). On the contrary, we found a weak direct correlation between H2DCF-DA fluorescence and cytochrome oxidase in the transected proximal nerve (Figure 6N), while the injured distal nerve had a robust inverse correlation between these parameters (Figure 6O). Interestingly, the corresponding contralateral nerves showed a significant inverse correlation between H2DCF-DA fluorescence by-products and the cytochrome oxidase activity (Figure 6N,O) (r = -0.343 and -0.320, in injured proximal and intact contralateral nerves, respectively; p<0.05). Panel N, H2DCF-DA fluorescence vs. ODC (r = 0.204 and -0.379, in injured proximal and intact contralateral nerves, respectively; n.s. and p<0.05), and in panel O, the same but in the injured distal nerve (r = -0.649, p<0.01) and in the intact contralateral nerve (r = -0.379, p<0.05). Symbols for the experimental group as indicated at the top of the figure.
4. Discussion
Our results show that there are important differences between crushed or transected sciatic nerve injury in all the parameters studied, showing a different response between the process of degeneration after transection, and a regulated process where the nerve degenerates and regenerates in a crush injury. Changes were also observed in the contralateral nerves in both injuries, but with a different pattern than those shown in the injured nerve.
The involvement of free radicals and LP during the metabolic adjustment occurring in proliferating tissues is an important issue. It has been established that the close relationship between the periodicities of thymidine kinase activity and decreased microsomal LP has some role in modulating the cell division process (Figure 1 and Figure 3) [29]. This agrees with the low NAD phosphate–dependent microsomal LP exhibited in tissues that have a substantial rate of cell division (Figure 1 and Figure 3) [30]. It is known the involvement of ROS in the toxic effects produced by various agents on many cellular systems, but it is also accepted that low levels (“low tone”) of ROS could control factors involved in cell homeostasis [31], such as increasing the growth response of mammalian cells [32], whereas scavenging ROS can suppress cell proliferation [33,34]. Present results from parameters indicative of oxidant stress clearly show changes in ROS by-products in crushed nerves, while transected nerves remained lower during Wallerian degeneration (Figure 1).
In LP by-products and protein oxidation (Figure 1) an early increase was observed in samples from crushed- or transected nerves. However, the secondary increases found in ROS by-products did not correlate so well with the rate and pattern of protein oxidation but rather were more related to parameters indicative of an active cell proliferation (Figure 1 and Figure 3). This phenomenon has been previously observed by our research group in tissues with high rates of cell proliferation such as liver and gastric mucosa. For instance, the LP promoted by partial hepatectomy in rats is quantitatively distinct among sub-cellular fractions, being a normal cell event in the proliferating rat liver [35], as well as in the recovery of surface epithelium of rat gastric mucosa [19]. Both processes (hepatocytes and gastric mucosal cells proliferation) were highly sensitive to the in vivo administration of a potent antioxidant, namely vitamin E. In the regenerating liver, treatment with vitamin E prior surgery elicited an earlier termination of the preparative events [36].
During peripheral nerve regeneration, quiescent mitotically Schwann cells proliferate quickly in the distal nerve and converse to repair Schwann cells, to form the regeneration tracks or Büngner’s bands, which provide the pathway to direct axons to their targets [3]. Our data clearly demonstrated that oxidant stress (ROS by-products) could also regulate proliferation of Schwann cells, temporality and in magnitude with ODC activity (Figures 1,3 and 6). This might indicate that active synthesis of polyamines is a step involved in the axonal regeneration during Wallerian degeneration [37]. Changes in cerebral ODC activity during specific stages of development has been attributed to cytoplasmic intermediates which regulate ODC activity, demonstrating that this enzyme could play a role in both developing and mature brain function [38]. In fact, during brain development, there is a reciprocal regulation of choline kinase and ODC by their respective by-products [39]. A polyamine-stress response, as in the mature brain, appears to be a constructive reaction implicated in neuronal cell death, and to hypoxia-induced brain cell damage [40]. The ODC expression and activity can be controlled through ROS [41], as well by an increased calcium efflux accompanied by decreased PKC activity [42]. These findings support the statement that an increase in polyamine synthesis may have profound effects on neurogenesis and neuro-differentiation.
In this context, the ODC activity in the ipsilateral muscle of the injured nerve also seemed to be triggered by increased LP by-products (Figure 5). An initial increase in polyamine levels, through enhanced ODC activity, is associated with muscle hypertrophy and muscle fiber regeneration [43]. Therefore, our results show that ODC activity could play an important role at the onset of Wallerian degeneration of the rat sciatic nerve, where systemic factors such as insulin, somatomedin, sexual hormones, and catecholamines, could be deeply involved.
During Wallerian degeneration Schwann cells clear myelin debris through phagocytosis and by recruiting macrophages to the site of injury, a process dependent on the breakdown of the blood nerve barrier. Macrophages themselves produce factors to promote Schwann cell proliferation [44]. A large body of evidence points to macrophages, present in high numbers in the inflamed peripheral nerve, and Schwann cells as the predominant source of NO, through the expression of iNOS [7,45]. The release of NO following peripheral nerve injury seems to be a crucial factor in the successful degeneration/regeneration process, and enhanced expression of iNOS is involved in the clearance of axon and myelin breakdown prior to regeneration [46]. However, excessive local levels of NO during inflammation may damage axons and growth cones [46]. High levels of iNOS-mediated production of NO may be involved in the production of detrimental effects in the recovery, favoring PNS cell-mediated demyelination [47], and higher concentrations of NO, can cause strand breaks and fragmentation in the DNA of target cells and [48]. This suggests that a balance between NO production and axon regrowth needs to be maintained and is necessary to neutralize local NO to save axons from NO mediated degeneration to support axon growth. This is also because not all the axons and Schwann cells are at the same stage of degeneration/regeneration, because Wallerian degeneration is an asynchronous process [17].
Our results indeed showed that Wallerian degeneration occurs accompanied with changes in NO metabolism, but they were unexpected. During the first day, nitrates, nitrites and citrulline (in a lesser magnitude) were slightly increased in crushed nerves and this amino acid was also early increased in the distal stump after transection (Figure 2). However, in the injured nerves, nitrites and nitrates were strongly decreased along the time studied which could suggest that progression of Wallerian degeneration requires low levels of NO production. Moreover, citrulline (another NOS product), which did not follow the same kinetics that nitrites, could have interesting effects by itself [49].
It is well known that in response to nerve injury axons and myelin are degraded by the cooperative action of Schwann cells and macrophages, followed by Schwann cell division, the highest rate of multiplication is reached by day 3 to 7 after lesion and decreases after that [50,51]. This process is also enhanced by the increase of ornithine decarboxylase (ODC) activity [8,52]. Our results with thymidine kinase show a progressive increase in proliferation in the distal stump with 6 times increase on day 10, and in the proximal stump a small increase only on day 10 is observed. The results on the transected nerves correlate with the high increase in ODC activity on both stumps.
However, in crushed nerves there is a small increase of TD on days 1 and 3 but then it decreases below the control values and rises again on day 20 and 25. This result does not agree with what has been reported [50] and with what we have observed in our laboratory, where an increase initiates on day 1 and increases massively on day 3 to day 7 followed with a decreasing frequency for 2.3 weeks. Purines are synthesized via two principal routes: the de novo and salvage pathways [53,54] Thymidine kinase is involved in the salvage pathway of DNA synthesis and correlates with the proliferative activity of transected nerves (Figure 3A). However, in crushed nerves, maybe proliferation is carried out by de novo pathway, which is metabolically very costly but highly regulated through multiple mechanisms which might be necessary for nerve regeneration.
It is known that Schwann cells prepared from degenerating axons show differentiation and finally undergo spontaneous apoptosis in vitro [55]. Nonetheless, neurons appear to have at least two self-destruct programs, presenting the “classical” caspase-dependent apoptotic program, with the participation of caspase-3 as the final responsible for apoptotic neuronal death during Wallerian degeneration and another for selective axon degeneration. [56,57]. Our data could support that statement, since the neuronal cell death seemed to depend on the milieu or microenvironment where Wallerian degeneration takes place, and support the view that caspases do no contribute to Wallerian degeneration. Caspase activation is not detected during axonal degeneration, although it is activated in a neuronal dying cell and caspase inhibitors do not block or retard axon degeneration, but inhibit apoptosis of neurons [56].
For instance, in crushed nerves, it was clear that caspase-3 activity progressively increased with a peak on day 25 (Figure 3C). It is possible that at the beginning when regeneration is taking place, only a small number of cells died by apoptosis, but later, when regeneration is over, the excess of Schwann cells or macrophages died by apoptosis (Figure 3). Oppositely, in both proximal and distal stumps of the transected sciatic nerve, despite Schwann cells death could occur, the caspase-3 activity was not significantly different from that of controls (Figure 3C). These results suggest that there is more than one mechanism for controlling the number of dedifferentiated Schwann cells. Surprisingly and independent of the lesion type, contralateral nerves depicted an early and sustained activation of the pro-apoptotic caspase-3 (Figure 3C), that is very different from the injured nerve, suggesting that while in the injured nerve the process is highly regulated, is different in the contralateral nerve.
In fact, there is increasing evidence that unilateral nerve lesions affect both injured (ipsilateral) and uninjured (contralateral) nerves. Although the neuroanatomy does not show connections between neurons that innervate homologous areas of the right and left sides of the body. These effects are qualitatively like those occurring at the ipsilateral side, but of small magnitude and time course [57,58]. The biological significance of these contralateral effects is unclear, but the existence of these changes implies the presence of unrecognized signaling mechanisms that link the two sides of the body [58]. This bilateral communication also shows that the effects are not systemic. In this study, most of the parameters we studied show changes in the contralateral nerves. It has been suggested that in different models of nerve injury invasion of macrophages into the contralateral dorsal root ganglion may be mediated by lost motoneurons or by interneurons, responding to retrograde transport of factors produced during Wallerian degeneration or their delivery by blood flow [59]. In transected rat nerves, a profound, long lasting, nerve-branch-specific loss of distal innervation is present in both contralateral and ipsilateral nerves, even after 5 months [59]. Also, some patients after unilateral injury develop contralateral changes including limb edema, loss of strength and changes in bone metabolism [60]. In the degeneration of retina ganglion cells, the contralateral uninjured retinas show molecular changes, significant neuronal death and glial activation, and suggests that the bilateral communication is believed to be orchestrated by the spinal cord [61]. Therefore, despite it is argued against a peripheral mechanism (blood-borne circulating factors), it could be more accepted a central mechanism, probably signaling via the system of commissural interneurons that is present in spinal cord and brainstem.
It was very surprising to find that contralateral nerves had drastic increase in parameters indicative of oxidant stress and cell proliferation, which closely followed the time course of those seen injured nerves. However, opposite patterns were also noted, mainly regarding NO production and apoptotic events, between injured and contralateral nerves. We think that this is the first demonstration that changes underlying progression of Wallerian degeneration are closely reflected in the contralateral side, in a long follow-up study. Hence, despite it has been considered that excessive NO formation accelerates LP, as well as axonal degeneration in the sciatic nerve [15], changes of LP and antioxidant status are related with the nerve fiber degradation in the neuropathy induced by some toxics [62], or in the diabetic neuropathy [63], we believe that LP is also serving as a signaling mechanism for Wallerian degeneration. Our statement is supported for changes occurring in the contralateral nerve without evidence of damage, as well as the findings in the ipsilateral and contralateral leg muscles surrounding the intact and injured sciatic nerves.
It has been suggested that Wallerian degeneration is regulated by NAD dependent processes and might exert its effects through the SIRT1 pathway [64], and genetic studies have attributed a slow Wallerian degeneration phenotype (Wlds) to the overexpression of Nmnat1 [65]. These findings indicate the importance of a NAD-dependent process in axon protection. Our results indicate important changes in NAD availability and on cytoplasmic redox potential during the progression of crush or transection-induced Wallerian degeneration (Figure 4B). In the distal stump of the transected sciatic nerve, NAD availability was increased along the time studies (Figure 4B), as reflected by a significant lower lactate/pyruvate ratio, whereas the proximal portion of the injured nerve essentially had two maximum peaks of increased NAD availability at 10 and 25 days after transection, respectively (Figure 4). The fact that in the model of crush-induced sciatic nerve injury, the NAD/NADH ratio was not increased during progression of Wallerian degeneration, would suggest that besides the already commented effect of NAD in protecting nerve viability, this parameter (cytoplasmic NAD/NADH ratio) is also reflecting the relative contribution of metabolic pathways providing cellular energy.
In addition, deprivation of ATP blocks axon retraction caused by inhibition of microtubule assembly, which suggests that axon retraction is an active process that requires intimate interaction between actin and the microtubule cytoskeleton [66]. Moreover, the notion that distal portions of the transected axons die passively for lack of nutritional support, has been challenged by the fact that distal axons can survive for a long time after transection in the Wlds mice [67]. In this context, our data revealed that during Wallerian degeneration, mitochondrial metabolism was readily diminished, as apparently as reflected by decreased activity of cytochrome oxidase. The latter, associated with increased cytoplasmic NAD/NADH ratio, could lead us to suggest that support of metabolic energy, in the form of ATP availability, is mainly accounted for by a very active glycolytic pathway. However, it can also be a signal for increasing mitochondrial oxidative metabolism at the onset for Wallerian degeneration (Figure 4C). It is known that there is not re-innervation of muscles or the subsequent maturation of the regenerating motor nerve fibers during progression of Wallerian degeneration [68], and myotonia is diminished and disappeared in muscles shortly after the nerves had undergone Wallerian degeneration [69]. In this study, it was clear that the surrounding caudofemoralis muscle isolated from both, the injured and contralateral nerves, presented striking responses to that is happening in the sciatic nerves, even when it is not the nerve target re-innervation. This tissue showed an increase of LP, dramatically accompanied by enhanced activities of enzymes indicative of cell proliferation and apoptosis. On the other hand, in the contralateral muscle, TK and ODC activities were significantly increased, despite that an augmented antioxidant capacity was seen in this tissue. The occurrence of these changes in intact non-proliferating tissue strongly suggests that molecular signals acting in the nerves flow to the surrounding muscle, and also responds to the damage. The results also show a different respond pattern of injury between transected and crushed nerves during Wallerian degeneration/regeneration. Differences between these two types of injury have already been shown, Wallerian degeneration is a rapid, asynchronous, progressive and wave-like process, but it can change its orientation depending on the lesion type [70,71]. All these differences correlate well with the differential changes in oxidative, proliferative, and metabolic events reported here.
5. Conclusion
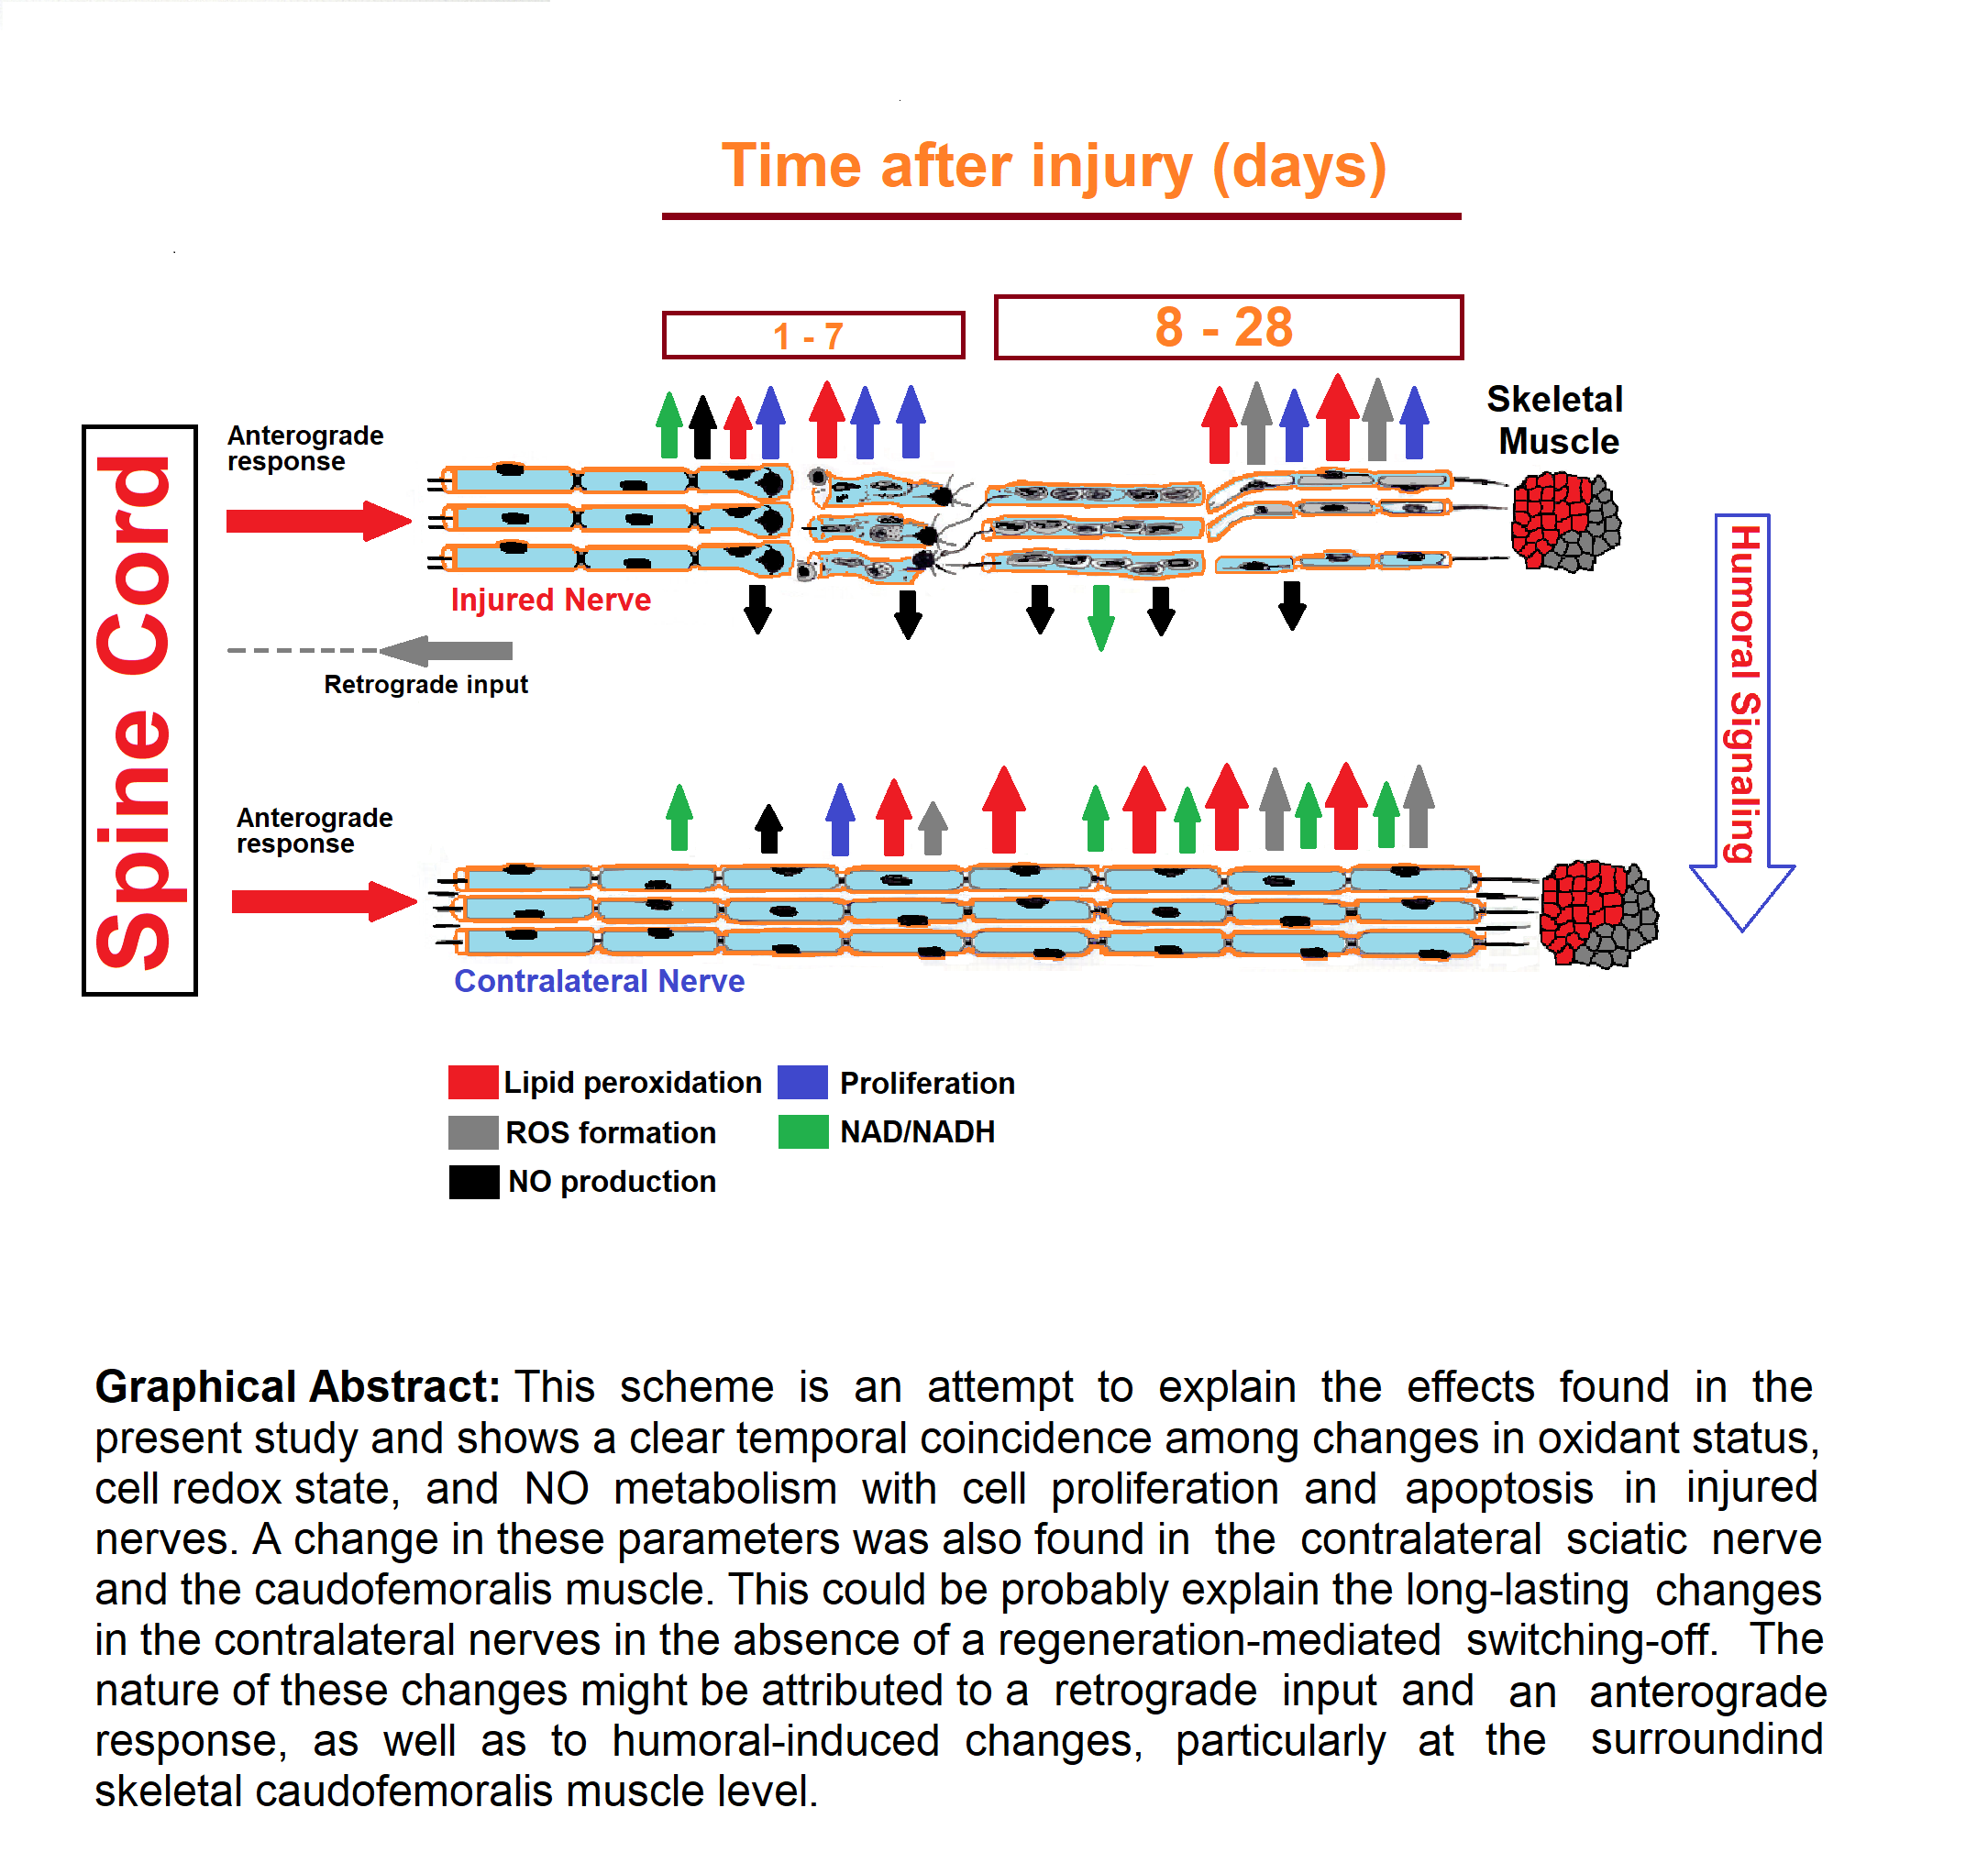
The data presented here strength our hypothesis that changes in the patterns of LP are not merely consequence of cell damage and subsequent death but rather are exerting a controlling role in the progression of Wallerian degeneration induced in the rat sciatic nerve through two different models of nerve injury (Graphical abstract). The expected opposite patterns of cell proliferation and death correlated well with that of LP events (Figure 6). It is also possible that, besides a possible action of ROS on the cell cycle, LP by-products also influence the metabolic environment of the injured and intact neurons, as effectively reflected by changes in the cell redox state and probably of mitochondrial metabolism (Figure 6). Also, parameters indicative of oxidant stress, nitric oxide (NO) metabolism, cell proliferation, apoptosis and nerve energy metabolism in transected or crushed nerves show a different response pattern during Wallerian degeneration/regeneration.
Author Contributions
M.A.R.D. and R.H.M. conceived the original idea, and A.M.-G., carried out most of the biochemical determinations. All the authors analyzed data and contributed to writing the manuscript. All authors have read and agreed to the present version of the manuscript.
Funding
This work was partly supported by UAEMex grant 4515/2018/Cl.
Institutional Review Board Statement
We establish that “Our research was approved by the Animal Experiments Institutional Ethics Committee (Protocol code = CICUAL RHM134-22), according to the Federal Regulations for Animal Experimentation (Ministry of Agriculture, SAGARPA, Mexico).
Data Availability Statement
Data is available after reasonable requests to the corresponding author.
Acknowledgements
We thank MVZ Claudia Rivera-Cerecedo for providing us with part of the rats used in this work.
Conflicts of Interest
The authors do not have any conflicts of interest.
References
- Faroni, A.; Mobasseri, S.A.; Kingham, P.J.; Reid, A.J. Peripheral nerve regeneration: experimental strategies and future perspectives. Adv. Drug Deliv. Rev. 2015, 82-83, 160-167. [PubMed: 25446133]. [CrossRef]
- Ide, C. Peripheral nerve regeneration. Neurosci. Res. 1996, 25, 101–121, [PubMed: 8829147].. [Google Scholar] [CrossRef] [PubMed]
- Jessen, K.R.; Mirsky, R. The repair Schwann cell and its function in regenerating nerves. J. Physiol. 2016, 594, 3521–3531, [PubMed: 26864683]. [Google Scholar] [CrossRef]
- Tricaud, N.; Park, H.T. Wallerian demyelination: chronicle of a cellular cataclysm. Cell Mol. Life Sci. 2017, 74, 4049–4057, [PubMed: 28600652]. [Google Scholar] [CrossRef] [PubMed]
- Stoll, G.; Griffin, J.W.; Li, C.Y.; Trapp, B.D. Wallerian degeneration in the peripheral nervous system: participation of both Schwann cells and macrophages in myelin degradation. J. Neurocytol. 1989, 18, 671–683, [PubMed: 2614485]. [Google Scholar] [CrossRef]
- Chen, P.; Piao, X.; Bonaldo, P. Role of macrophages in Wallerian degeneration and axonal regeneration after peripheral nerve injury. Acta Neuropathol. 2015, 130, 605–618, [PubMed: 26419777]. [Google Scholar] [CrossRef]
- Lehmann, H.C.; Köhne, A.; Meyer zu Hörste, G.; Dehmel, T.; Kiehl, O.; Hartung, H.P.; Kastenbauer, S.; Kieseier, B.C. Role of nitric oxide as mediator of nerve injury in inflammatory neuropathies. J. Neuropathol. Exp. Neurol. 2007, 66, 305–312, [PubMed: 17413321]. [Google Scholar] [CrossRef] [PubMed]
- Panthi, S.; Gautam, K. Roles of nitric oxide and ethyl pyruvate after peripheral nerve injury. Inflamm. Regen. 2017, 2;37:20. [PubMed: 29259719].
- Levy, D.; Kubes, P.; Zochodne, D.W. Delayed peripheral nerve degeneration, regeneration, and pain in mice lacking inducible nitric oxide synthase. J. Neuropathol. Exp. Neurol. 2001, 60, 411–421, [PubMed: 11379816]. [Google Scholar] [CrossRef]
- Keilhoff, G.; Fansa, H.; Wolf, G. Differences in peripheral nerve degeneration/regeneration between wild-type and neuronal nitric oxide synthase knockout mice. J. Neurosci. Res. 2002, 68, 432–441, [PubMed: 11992469]. [Google Scholar]
- Smith, K.J.; Kapoor, R. Felts; P.A. Demyelination: the role of reactive oxygen and nitrogen species. Brain Pathol. 1999, 9, 69–92, [PubMed: 9989453]. [Google Scholar]
- Zochodne, D.W.; Misra, M.; Cheng, C.; Sun, H. Inhibition of nitric oxide synthase enhances peripheral nerve regeneration in mice. Neurosci. Lett. 1997, 228, 71–4, [PubMed: 9209101]. [Google Scholar] [CrossRef]
- Cecchini, T.; Cuppini, R.; Ciaroni, S.; Del Grande, P. Effect of vitamin E-deficiency on regeneration of the sciatic nerve. Arch. Ital. Anat. Embriol. 1990, 95, 155–165, [PubMed: 2078094]. [Google Scholar]
- Cuppini, R.; Cecchini, T.; Ciaroni, S.; Ambrogini, P.; Del Grande, P. Nodal and terminal sprouting by regenerating nerve in vitamin E-deficient rats. J. Neurol. Sci. 1993, 117, 61–67, [PubMed: 8410068]. [Google Scholar] [CrossRef] [PubMed]
- Sayan, H.; Ugurlu, B.; Babül, A.; Take, G.; Erdogan, D. Effects of L-arginine and NG-nitro L-arginine methyl ester on lipid peroxide, superoxide dismutase and nitrate levels after experimental sciatic nerve ischemia-reperfusion in rats. Int. J. Neurosci. 2004, 114, 349–364, [PubMed: 14754660]. [Google Scholar] [CrossRef] [PubMed]
- Barrera, G.; Pizzimenti, S.; Dianzani, M.U. Lipid peroxidation: control of cell proliferation, cell differentiation and cell death. Mol. Aspects Med. 2008, 29, 1–8, [PubMed: 18037483]. [Google Scholar] [CrossRef]
- Lara-Ramírez, R.; Segura-Anaya, E.; Martínez-Gómez, A.; Dent, M.A.R. Expression of interleukin-6 receptor alpha in normal and injured rat sciatic nerve. Neuroscience 2008, 152, 601–608, [PubMed: 18313228]. [Google Scholar] [CrossRef] [PubMed]
- Viarengo, A.; Burlando, B.; Cavaletto, M.; Marchi, B.; Ponzano, E.; Blasco, J. Role of metallothionein against oxidative stress in the mussel Mytilus galloprovincialis. Am. J. Physiol. 1999, 277, R1612–1619, [PubMed: 10600906]. [Google Scholar]
- Hernández-Muñoz, R.; Montiel-Ruíz, C.; Vázquez-Martínez, O. Gastric mucosal cell proliferation in ethanol-induced chronic mucosal injury is related to oxidative stress and lipid peroxidation in rats. Lab. Invest. 2000, 80, 1161–1169, [PubMed: 10950107]. [Google Scholar] [CrossRef]
- Cadenas, E.; Sies, H. Low-level chemiluminescence as an indicator of singlet molecular oxygen in biological systems. Methods Enzymol. 1984, 5, 221–231, [PubMed: 6328183]. [Google Scholar]
- Levine, R.L.; Garland, D.; Oliver, C.N.; Amici, A.; Climent, I.; Lenz, A.G.; Ahn, B.W.; Shaltiel, S.; Stadtman, E.R. Determination of carbonyl content in oxidatively modified proteins. Methods Enzymol. 1990, 186, 464–478, [PubMed: 1978225]. [Google Scholar]
- Sauer, H.; Wilmanns, H. Thymidine kinase. In: Bermeyer H. U., ed. Methods of Enzymatic Analysis, Vol. 3. Deerfield Beach, FL: VCH, 1985, pp. 468-473.
- Diehl, A.M.; Wells, M.; Brown, N.D.; Thorgeirsson, S.S.; Steer, C.J. Effect of ethanol on polyamine synthesis during liver regeneration in rats. J. Clin. Invest. 1990, 85, 385–390, [PubMed: 2298913]. [Google Scholar] [CrossRef]
- Thornberry, N.A. Interleukin-1 beta converting enzyme. Methods Enzymol. 1994, 244, 615–631, [PubMed: 7845238]. [Google Scholar] [PubMed]
- Olguín-Martínez, M.; Hernández-Espinosa, D.R.; Hernández-Muñoz, R. α-Tocopherol administration blocks adaptive changes in cell NADH/NAD+ redox state and mitochondrial function leading to inhibition of gastric mucosa cell proliferation in rats. Free Radic. Biol. Med. 2013, 65, 1090–1100, [PubMed: 23994576]. [Google Scholar] [CrossRef] [PubMed]
- Ramírez-Zamora, S.; Méndez-Rodríguez, M.L.; Olguín-Martínez, M.; Sánchez-Sevilla, L.; Quintana-Quintana, M.; García-García, N.; Hernández-Muñoz, R. Increased erythrocytes by-products of arginine catabolism are associated with hyperglycemia and could be involved in the pathogenesis of type 2 diabetes mellitus. PLoS One. 2013, 24;8(6):e66823. [PubMed: 23826148].
- Stubbs, M.; Veech, R.L.; Krebs, H.A. Control of the redox state of the nicotinamide-adenine dinucleotide couple in rat liver cytoplasm. Biochem. J. 1972, 126, 59–65, [PubMed: 4342386]. [Google Scholar] [CrossRef] [PubMed]
- Wilkins, H.M.; Harris, J.L.; Carl, S.M.; Lezi, E.; Lu, J.; Eva Selfridge, J.; Roy, N.; Hutfles, L.; Koppel, S.; Morris, J.; Burns, J.M.; Michaelis, M.L.; Michaelis, E.K.; Brooks, W.M.; Swerdlow, R.H. Oxaloacetate activates brain mitochondrial biogenesis, enhances the insulin pathway, reduces inflammation and stimulates neurogenesis. Hum. Mol. Genet. 2014, 23, 6528–6541, [PubMed: 25027327]. [Google Scholar] [CrossRef]
- Cheeseman, K.H.; Collins, M.; Maddix, S.; Milia, A.; Proudfoot, K.; Slater, T.F.; Burton, G.W.; Webb, A.; Ingold, K.U. Lipid peroxidation in regenerating rat liver. FEBS Lett. 1986, 209, 191–196, [PubMed: 3098579]. [Google Scholar] [CrossRef]
- Alison, M.R. Regulation of hepatic growth. Physiol. Rev. 1986, 66, 499–541, [PubMed: 2426724]. [Google Scholar] [CrossRef]
- Martin, K.R.; Barrett, J.C. Reactive oxygen species as double-edged swords in cellular processes: low-dose cell signaling versus high-dose toxicity. Hum. Exp. Toxicol. 2002, 21, 71–75, [PubMed: 12102499]. [Google Scholar] [CrossRef]
- Burdon, R.H. Superoxide and hydrogen peroxide in relation to mammalian cell proliferation. Free Radic. Biol. Med. 1995, 18, 775–794, [PubMed: 7750801]. [Google Scholar] [CrossRef]
- Cuppini, R.; Ciaroni, S.; Cecchini, T.; Ambrogini, P.; Ferri, P.; Del Grande, P.; Papa, S. Alpha-tocopherol controls cell proliferation in the adult rat dentate gyrus. Neurosci. Lett. 2001, 303, 198–200, [PubMed: 11323119]. [Google Scholar] [CrossRef]
- Neuzil, J.; Zhao, M.; Ostermann, G.; Sticha, M.; Gellert, N.; Weber, C.; Eaton, J.W.; Brunk, U.T. Alpha-tocopheryl succinate, an agent with in vivo anti-tumour activity, induces apoptosis by causing lysosomal instability. Biochem. J. 2002, 362, 709–715, [PubMed: 11879199]. [Google Scholar] [CrossRef]
- Aguilar-Delfín, I.; López-Barrera, F.; Hernández-Muñoz, R. Selective enhancement of lipid peroxidation in plasma membrane in two experimental models of liver regeneration: partial hepatectomy and acute CC14 administration. Hepatology 1996, 24, 657–662, [PubMed: 8781339]. [Google Scholar] [CrossRef]
- Trejo-Solís, C.; Chagoya De Sánchez, V.; Aranda-Fraustro, A.; Sánchez-Sevilla, L.; Gómez-Ruíz, C.; Hernández-Muñoz, R. Inhibitory effect of vitamin e administration on the progression of liver regeneration induced by partial hepatectomy in rats. Lab. Invest. 2003, 83, 1669–1679, [PubMed: 14615420]. [Google Scholar] [CrossRef]
- Meyer, M.; Matsuoka, I.; Wetmore, C.; Olson, L.; Thoenen, H. Enhanced synthesis of brain-derived neurotrophic factor in the lesioned peripheral nerve: different mechanisms are responsible for the regulation of BDNF and NGF mRNA. J. Cell Biol. 1992, 119, 45–54, [PubMed: 1527172]. [Google Scholar] [CrossRef] [PubMed]
- Zawia, N.H.; Harry, G.J. Correlations between developmental ornithine decarboxylase gene expression and enzyme activity in the rat brain. Brain Res. Dev. Brain Res. 1993, 71, 53–57, [PubMed: 8431999]. [Google Scholar] [CrossRef]
- Gilad, G.M.; Gilad, V.H.; Eliyayev, Y.; Rabey, J.M. Developmental regulation of the brain polyamine-stress-response. Int. J. Dev. Neurosci. 1998, 16, 271–278, [PubMed: 9785123]. [Google Scholar] [CrossRef]
- Gilad, G.M.; Gilad, V.H. Reciprocal regulation of ornithine decarboxylase and choline kinase activities by their respective reaction products in the developing rat cerebellar cortex. J. Neurochem. 1984, 43, 1538–1543, [PubMed: 6092541]. [Google Scholar] [CrossRef] [PubMed]
- Paulraj, R.; Behari, J. Biochemical changes in rat brain exposed to low intensity 9. 9 GHz microwave radiation. Cell Biochem. Biophys. 2012, 63, 97–102, [PubMed: 22426826]. [Google Scholar] [CrossRef] [PubMed]
- Saito, K.; Packianathan, S.; Longo, L.D. Free radical-induced elevation of ornithine decarboxylase activity in developing rat brain slices. Brain Res. 1997, 763, 232–238, [PubMed: 9296564]. [Google Scholar] [CrossRef] [PubMed]
- Lee, N.K.; MacLean, H.E. Polyamines, androgens, and skeletal muscle hypertrophy. J. Cell Physiol. 2011, 226, 1453–1460, [PubMed: 21413019]. [Google Scholar] [CrossRef] [PubMed]
- Zochodne, D.W.; Levy, D. Nitric oxide in damage, disease and repair of the peripheral nervous system. Cell Mol. Biol. (Noisy-le-grand). 2005, 51, 255–267, [PubMed: 16191393]. [Google Scholar]
- Chakraborti, S.; Mandal, M.; Das, S.; Mandal, A.; Chakraborti, T. Regulation of matrix metalloproteinases: an overview. Mol. Cell Biochem. 2003, 253, 269–285, [PubMed: 14619979]. [Google Scholar] [CrossRef] [PubMed]
- Conti, G.; Rostami, A.; Scarpini, E.; Baron, P.; Galimberti, D.; Bresolin, N.; Contri, M.; Palumbo, C.; De Pol, A. Inducible nitric oxide synthase (iNOS) in immune-mediated demyelination and Wallerian degeneration of the rat peripheral nervous system. Exp. Neurol. 2004, 187, 350–358, [PubMed: 15144861]. [Google Scholar] [CrossRef]
- Lee, Y.; Shin, T. Expression of constitutive endothelial and inducible nitric oxide synthase in the sciatic nerve of Lewis rats with experimental autoimmune neuritis. J. Neuroimmunol. 2002, 126, 78–85, [PubMed: 12020959]. [Google Scholar] [CrossRef]
- Förstermann, U.; Sessa, W.C. Nitric oxide synthases: regulation and function. Eur. Heart J. 2012, 33, 829–837, [PubMed: 21890489]. [Google Scholar] [CrossRef]
- Jegatheesan, P.; De Bandt, J.P. Hepatic steatosis: a role for citrulline. Curr. Opin. Clin. Nutr. Metab. Care 2016, 19, :360–365, [PubMed: 27380311]. [Google Scholar] [CrossRef]
- Navarro, X.; Vivó, M. Valero-Cabré; A Neural plasticity after peripheral nerve injury and regeneration. Prog. Neurobiol. 2007, 82, 163–201, [PubMed: 17643733]. [Google Scholar]
- Stoll, G.; Müller, HW. Nerve injury, axonal degeneration and neural regeneration: basic insights. Brain Pathol. 1999, 9, 313–325, [PubMed: 10219748]. [Google Scholar] [CrossRef] [PubMed]
- Hirata, H.; Hibasami, H.; Hineno, T.; Shi, D.; Morita, A.; Inada, H.; Fujisawa, K.; Nakashima, K.; Ogihara, Y. Role of ornithine decarboxylase in proliferation of Schwann cells during Wallerian degeneration and its enhancement by nerve expansion. Muscle Nerve 1995, 18, 1341–1343, [PubMed: 7565936]. [Google Scholar] [CrossRef]
- Lane, A.N.; Fan, T.W. Regulation of mammalian nucleotide metabolism and biosynthesis. Nucleic Acids Res. 2015, 43:2466-2485. [PubMed: 25628363].
- Tran, D.H.; Kim, D.; Kesavan, R.; Brown, H.; Dey, T.; Soflaee, M.H.; Vu, H.S.; Tasdogan, A.; Guo, J.; et al. De novo and salvage purine synthesis pathways across tissues and tumors. Cell 2024, 187, 3602–3618, [PubMed: 38823389]. [Google Scholar] [CrossRef] [PubMed]
- Hirata, H.; Hibasami, H.; Yoshida, T.; Morita, A.; Ohkaya, S.; Matsumoto, M.; Sasaki, H.; Uchida, A. Differentiation and apoptosis without DNA fragmentation in cultured Schwann cells derived from Wallerian-degenerated nerve. Apoptosis 1998, Oct;3(5):353-360. [PubMed: 14646482].
- Raff, M.C.; Whitmore, A.V.; Finn, J.T. Axonal self-destruction and neurodegeneration. Science 2002, 296(5569), 868-871. [PubMed: 11988563].
- Koltzenburg, M.; Wall, P.D.; McMahon, S.B. Does the right side know what the left is doing? Trends Neurosci. 1999, 22, 122–127, [PubMed: 10199637]. [Google Scholar] [CrossRef]
- Oaklander, A.L.; Brown, J.M. Unilateral nerve injury produces bilateral loss of distal innervation. Ann. Neurol. 2004, 55, 639–644, [PubMed: 15122703]. [Google Scholar] [CrossRef]
- Dubový, P.; Tucková, L.; Jancálek, R.; Svízenská, I.; Klusáková, I. Increased invasion of ED-1 positive macrophages in both ipsi- and contralateral dorsal root ganglia following unilateral nerve injuries. Neurosci. Lett. 2007, 427, 88–93, [PubMed: 17931774]. [Google Scholar] [CrossRef]
- Kozin, F.; Genant, H.K.; Bekerman, C.; McCarty, D.J. The reflex sympathetic dystrophysyndrome. II. Roentgenographic and scintigraphic evidence of bilaterality and of periarticular accentuation. Am. J Med. 1976, 60, 332–338, [PMID: 56892]. [Google Scholar]
- Lucas-Ruiz, F.; Galindo-Romero, C.; Albaladejo-García, V.; Vidal-Sanz, M.; Agudo-Barriuso, M. Mechanisms implicated in the contralateral effect in the central nervous system after unilateral injury: focus on the visual system. Neural Regen. Res. 2021, 16, 2125–2131, [PubMed: 33818483]. [Google Scholar] [CrossRef]
- Wang, Q.S.; Xie, K.Q.; Zhang, C.L.; Zhu, Y.J.; Zhang, LP.; Guo, X.; Yu, S.F. Allyl chloride-induced time dependent changes of lipid peroxidation in rat nerve tissue. Neurochem. Res. 2005, 30, 1387–1395, [PubMed: 16341935]. [Google Scholar] [CrossRef]
- Kumar, A.; Kaundal, R.K.; Iyer, S.; Sharma, S.S. Effects of resveratrol on nerve functions, oxidative stress and DNA fragmentation in experimental diabetic neuropathy. Life Sci. 2007, 80, 1236–1244, [PubMed: 17289084]. [Google Scholar] [CrossRef]
- Araki, T.; Sasaki, Y.; Milbrandt, J. Increased nuclear NAD biosynthesis and SIRT1 activation prevent axonal degeneration. Science 2004, 305(5686), 1010-1013. [PubMed: 15310905].
- Mack, T.G.; Reiner, M.; Beirowski, B.; Mi, W.; Emanuelli, M.; Wagner, D.; Thomson, D.; Gillingwater, T.; Court, F.; et al. Wallerian degeneration of injured axons and synapses is delayed by a Ube4b/Nmnat chimeric gene. Nat. Neurosci. 2001, 4, 1199–1206, [PubMed: 11770485]. [Google Scholar] [CrossRef] [PubMed]
- Rone, M.B.; Cui, Q.L.; Fang, J.; Wang, L.C.; Zhang, J.; Khan, D.; Bedard, M.; Almazan, G.; Ludwin, S.K.; et al. Oligodendrogliopathy in Multiple Sclerosis: Low Glycolytic Metabolic Rate Promotes Oligodendrocyte Survival. J. Neurosci. 2016, 36, 4698–4707, [PubMed: 27122029]. [Google Scholar] [CrossRef]
- Glass, J.D.; Brushart, T.M.; George, E.B.; Griffin, J.W. Prolonged survival of transected nerve fibres in C57BL/Ola mice is an intrinsic characteristic of the axon. J. Neurocytol. 1993, 22, 311–321, [PubMed: 8315413]. [Google Scholar] [CrossRef] [PubMed]
- Williams, I.R.; Gilliatt, R.W. Regeneration distal to a prolonged conduction block. J. Neurol. Sci. 1977 33, 267-273. [PubMed: 409804].
- Wee, A.S. Effects of acute and chronic denervation on human myotonia. Electromyogr. Clin. Neurophysiol. 2004, 44, 443–446, [PubMed: 15559079]. [Google Scholar] [PubMed]
- Lunn, E.R.; Brown, M.C.; Perry, V.H. The pattern of axonal degeneration in the peripheral nervous system varies with different types of lesion. Neuroscience 1990, 35, 157–165, [PubMed: 2359492]. [Google Scholar] [CrossRef] [PubMed]
- Beirowski, B.; Adalbert, R.; Wagner, D.; Grumme, D.S.; Addicks, K.; Ribchester, R.R.; Coleman, M.P. The progressive nature of Wallerian degeneration in wild-type and slow Wallerian degeneration (WldS) nerves. BMC Neurosci. 2005, Feb 1;6:6. [PubMed: 15686598].
Figure 1.
Production of ROS, lipid peroxidation by-products, and carbonyl groups (oxidized proteins) in injured sciatic nerves after crush and transection and in the respective contralateral (intact) nerves. Results are expressed as mean ± SD of 5 determinations for experimental point. Control values range is represented by the shadowed horizontal bar, for H2DCF-DA fluorescence products (panel A), conjugated dienes (panel B), ROS-produced chemiluminiscence (panel C), and for carbonyl groups in proteins (panel D). Symbols for the experimental group are shown at the top of the figure, as follows: crushed nerves (open circles, dotted lines) and proximal (filled circles) and distal (filled triangles) stumps, after transection (solid lines). Statistical significance = *p<0.01.
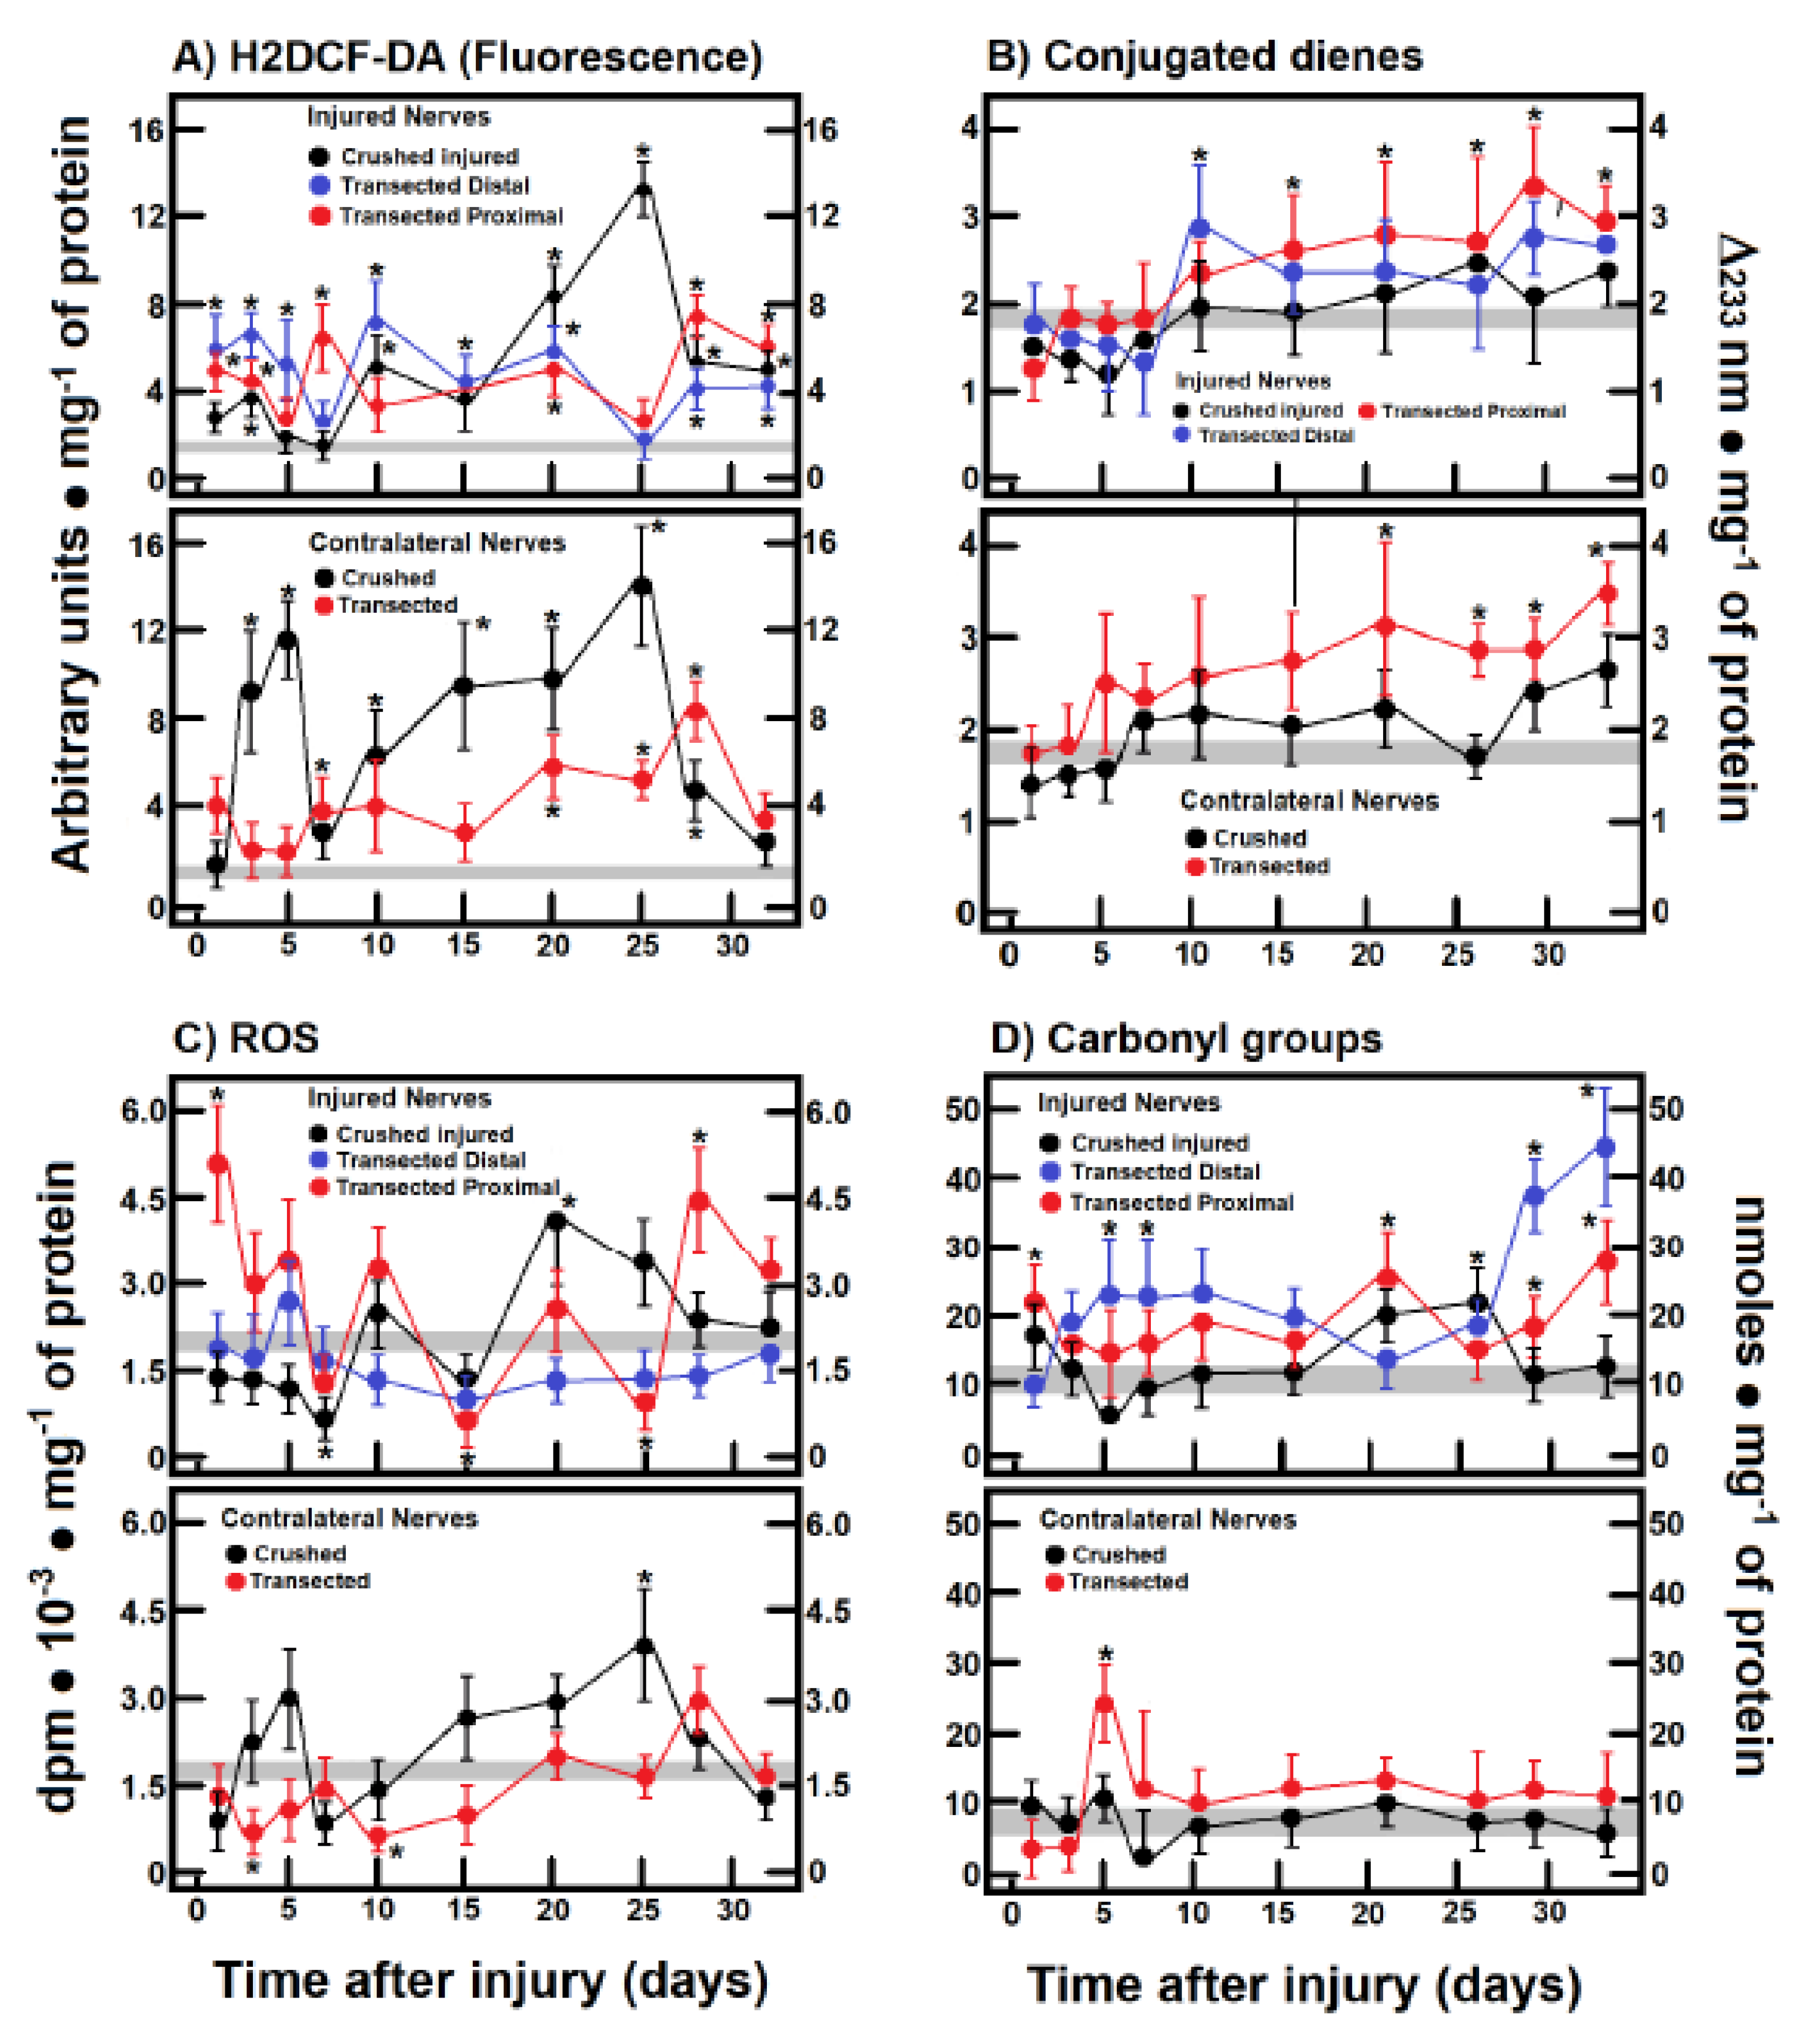
Figure 2.
Production of NO by-products in injured sciatic nerves after crush and transection and in the respective contralateral (intact) nerves. Results are expressed as mean ± SD of 5 determinations for experimental point for nitrates + nitrites sum (panel A), as well as for citrulline (panel B). The control value range is represented by the shadowed horizontal bar. Symbols for the experimental group as indicated at the top of the figure and as described in Figure 1. Statistical significance = *p<0.01.
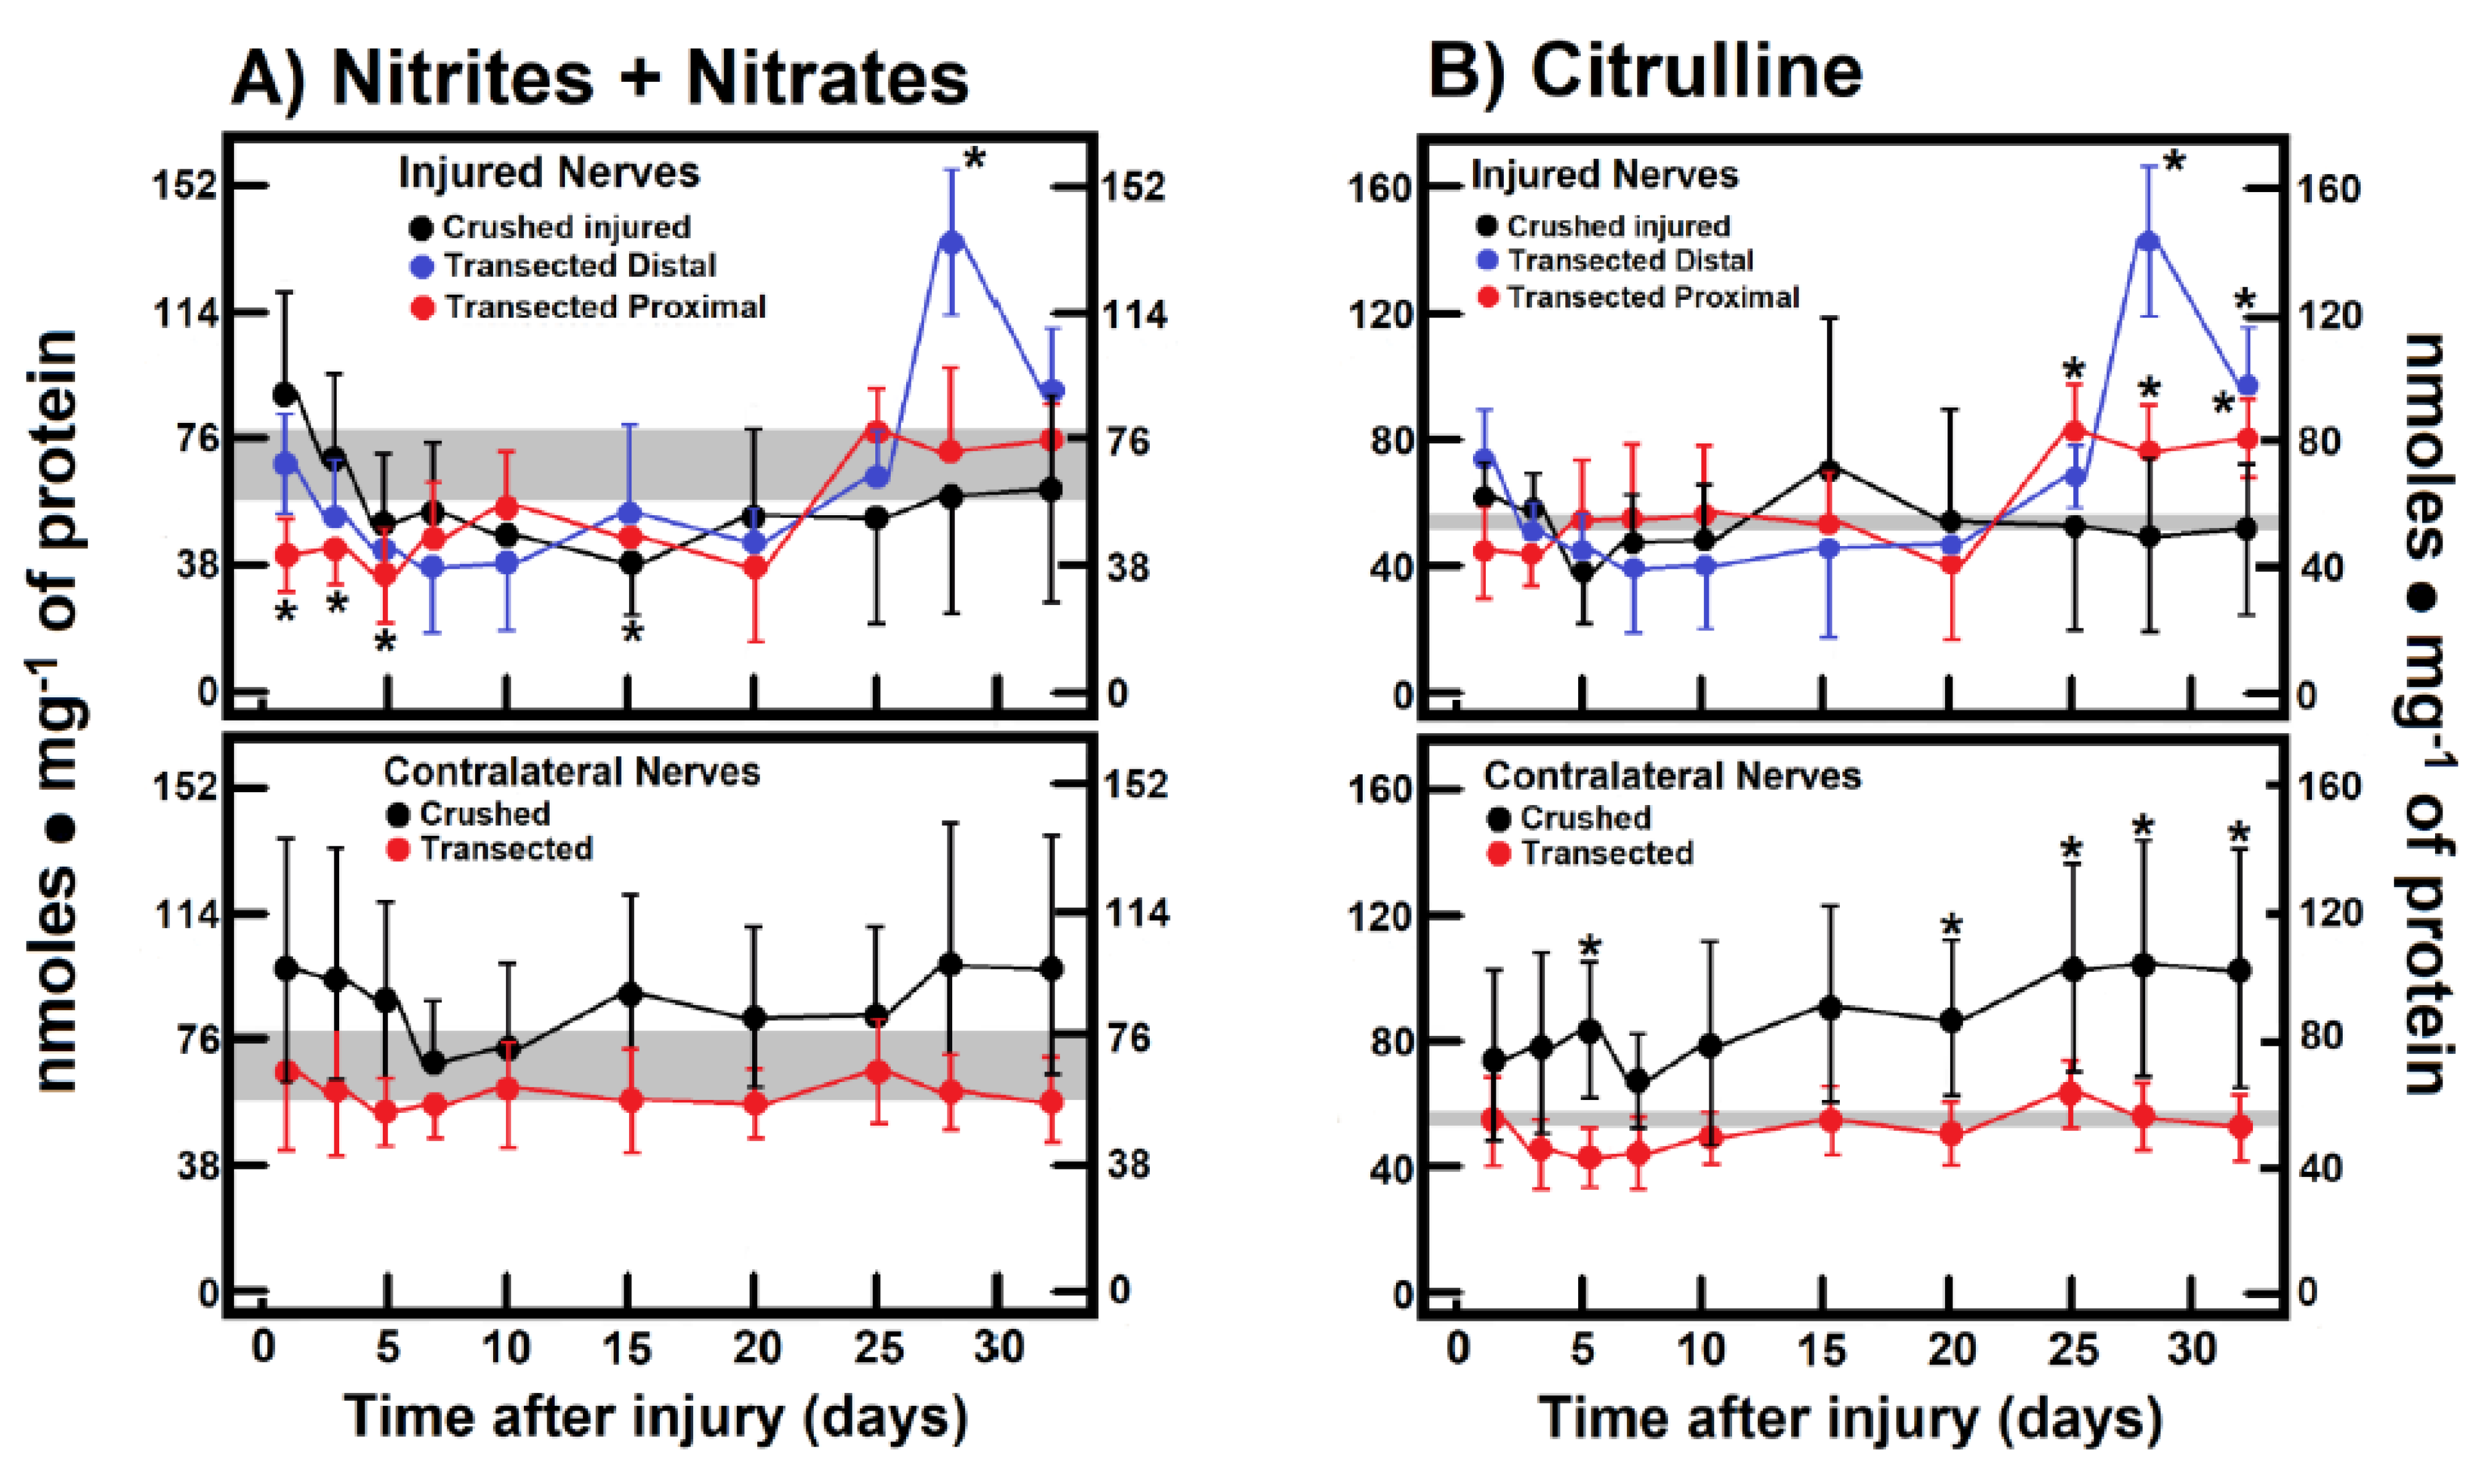
Figure 3.
Parameters indicative of cell proliferation and apoptosis in injured sciatic nerves after crush and transection and in the respective contralateral (intact) nerves. Results are expressed as mean ± SD of 5 determinations for experimental point for the thymidine kinase (TK; panel A) and ornithine decarboxylase (ODC; panel B) activities, as well as for active caspase-3 (panel C). The control values range is represented by the shadowed horizontal bar. Symbols for the experimental group as indicated at the top of the figure and as described in Figure 1. Statistical significance = *p<0.01.
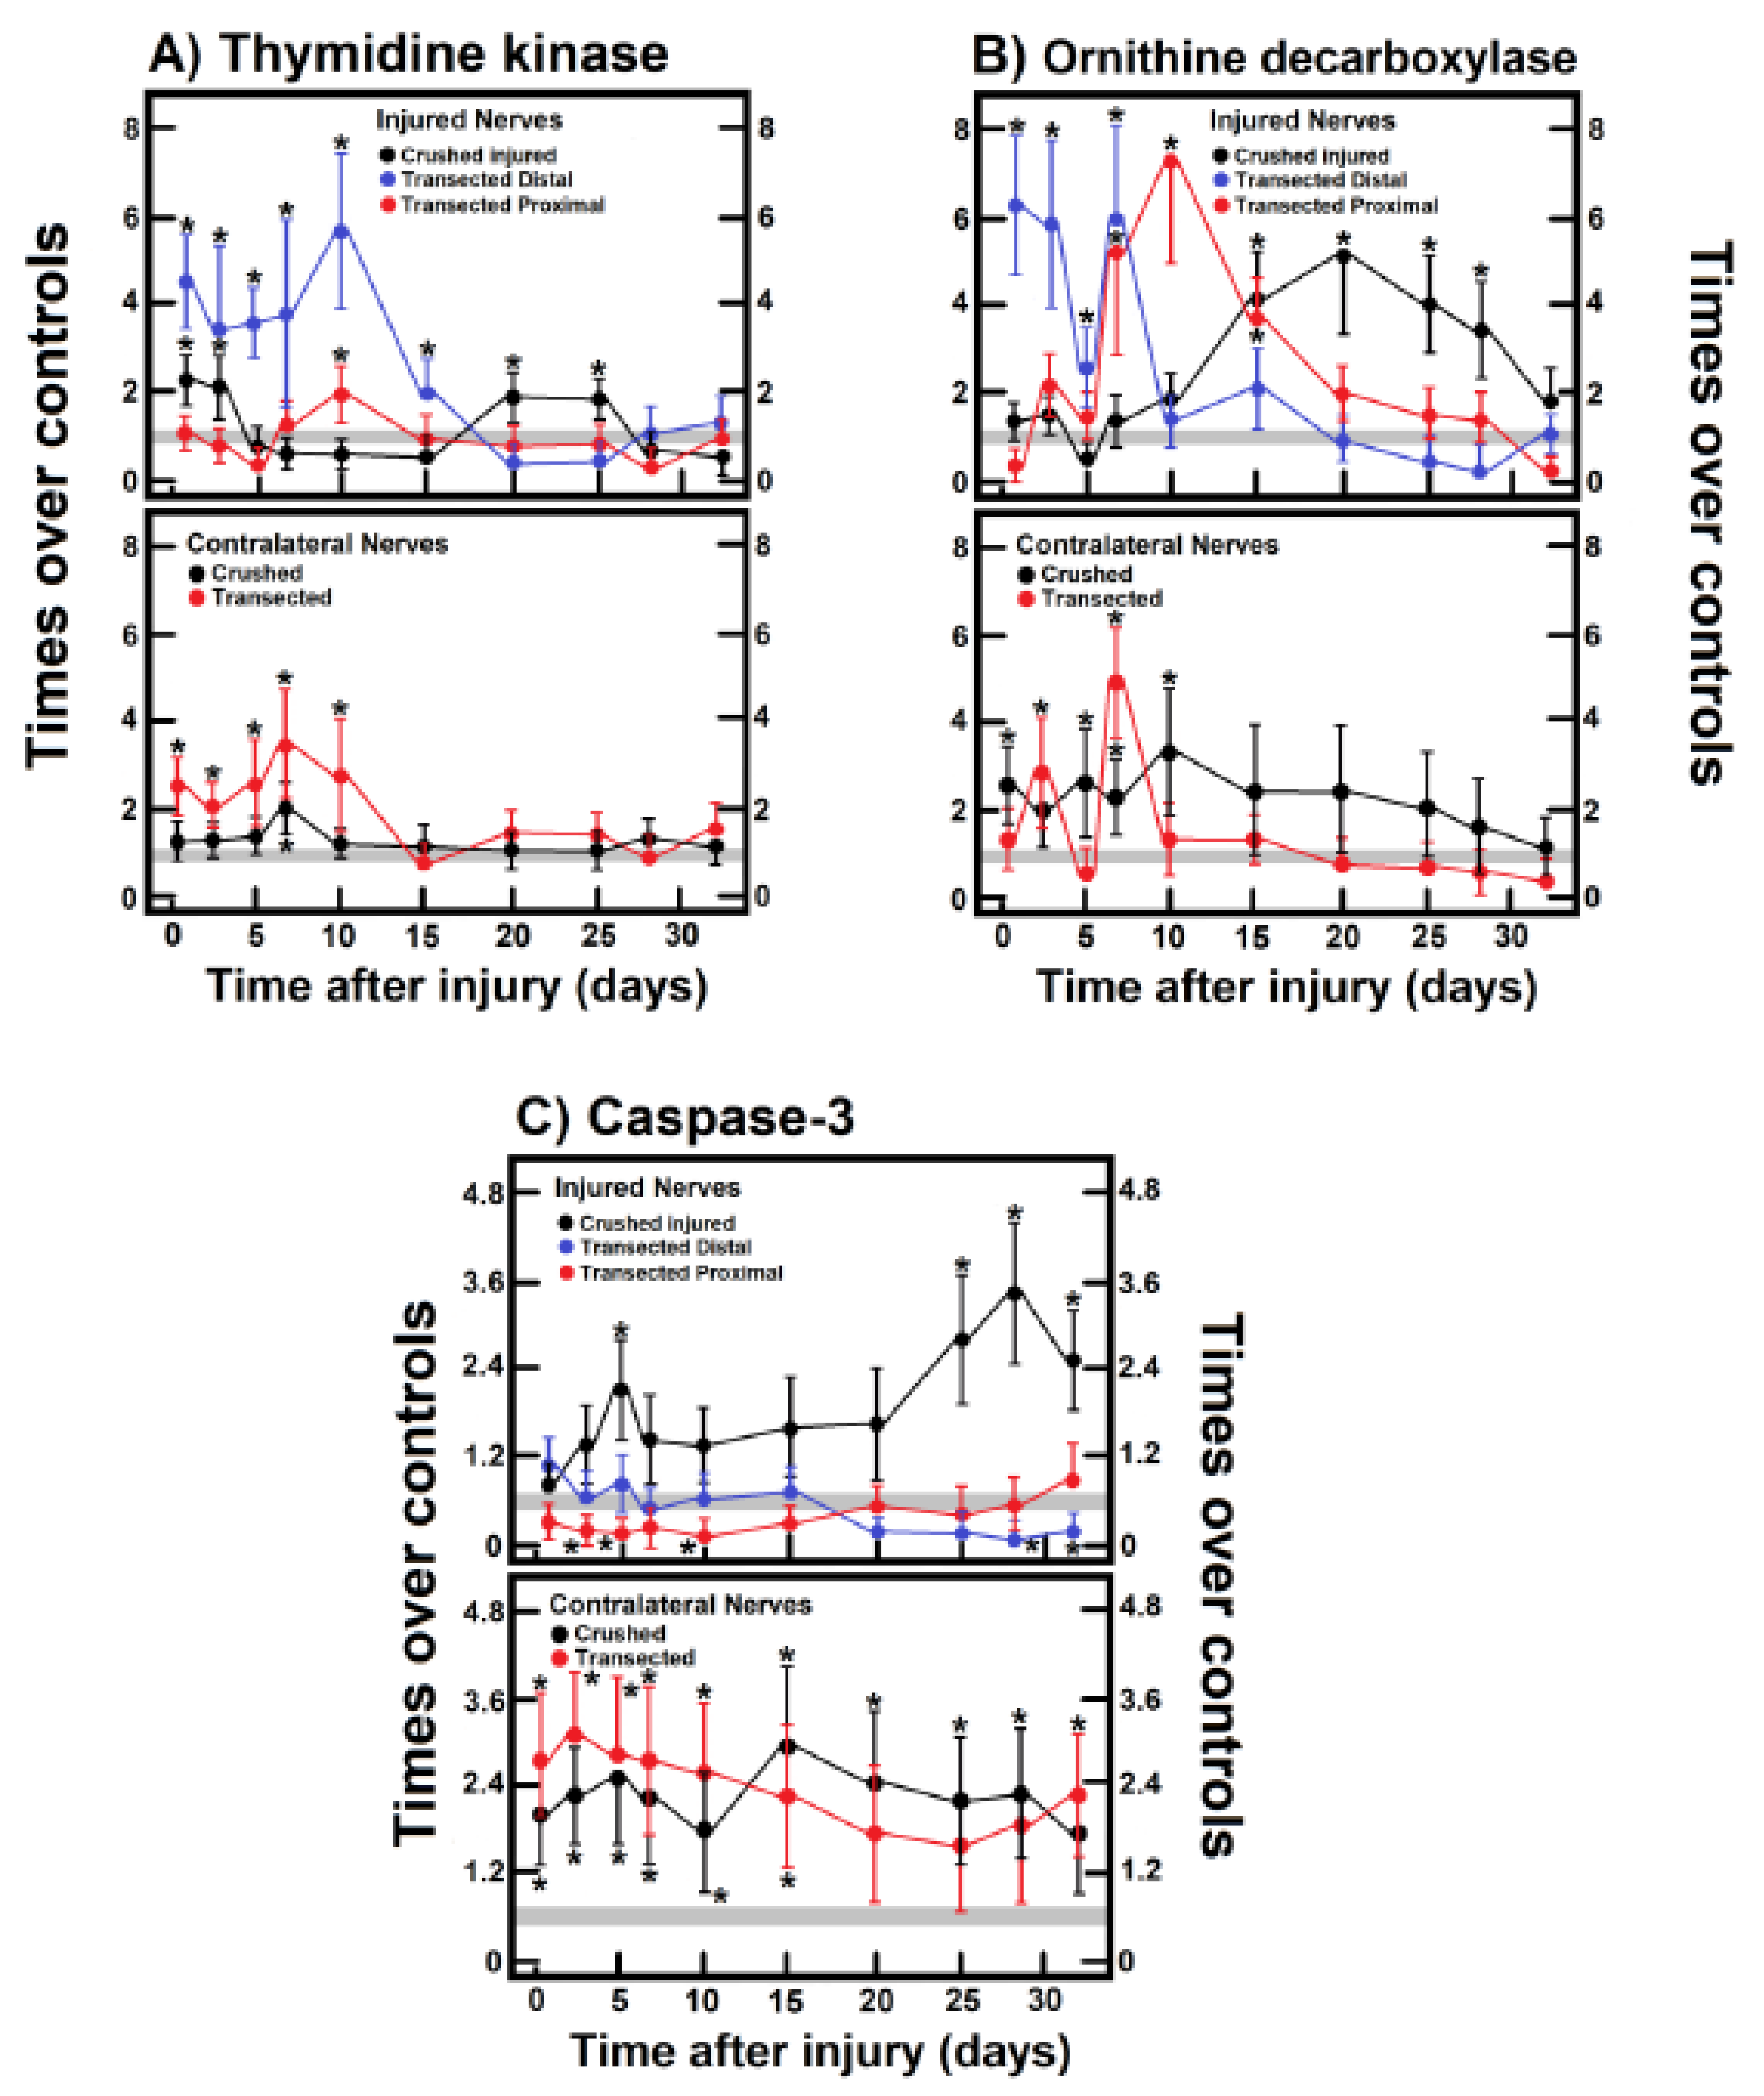
Figure 4.
The lactate/pyruvate ratio, cytoplasmic NAD/NADH potential, and cytochrome oxidase activity in injured sciatic nerves after crush and transection and in the respective contralateral (intact) nerves. Results are expressed as mean ± SD of 5 determinations for experimental point for the lactate/pyruvate ratio (panel A), the NAD/NADH ratio (panel B), as well as for the activity of cytochrome oxidase (panel C). The control value range is represented by the shadowed horizontal bar. Symbols for the experimental group as indicated at the top of the figure and as described in Figure 1. Statistical significance = *p<0.01.
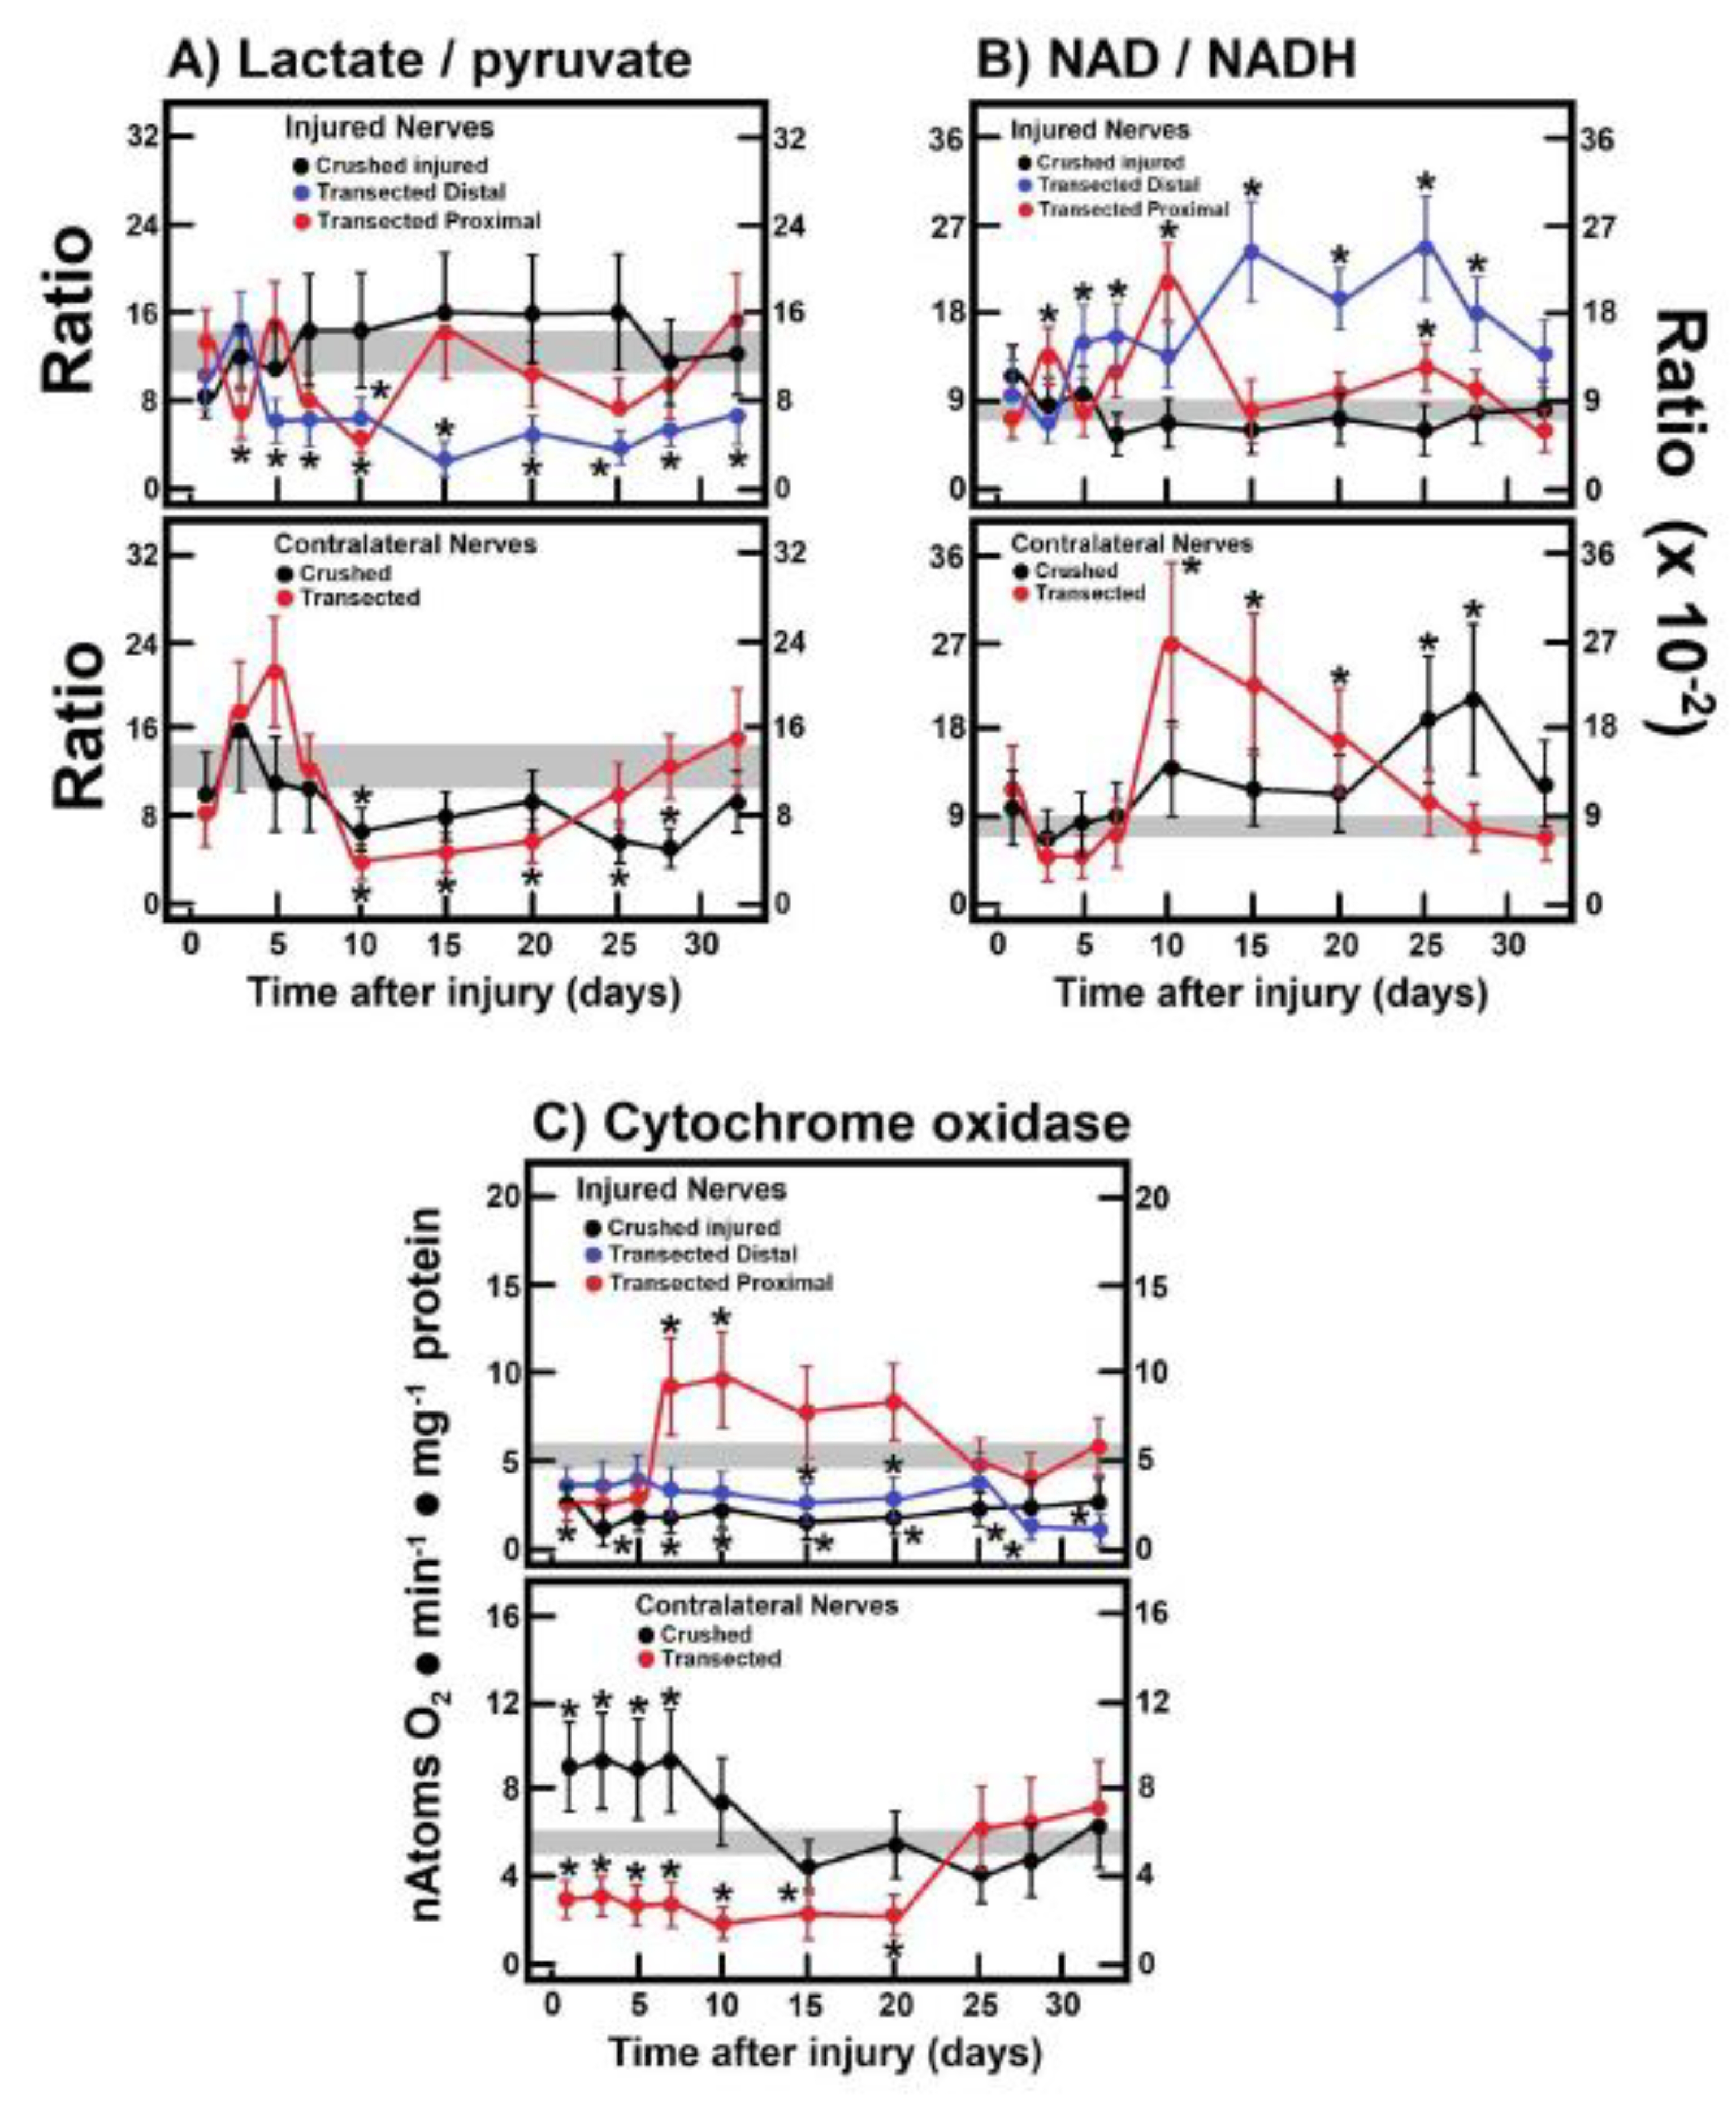
Figure 5.
Parameters indicative of oxidant stress, proliferation and apoptosis in caudofemoralis muscle after crushing the right sciatic nerve. The results are expressed as mean ± SEM of 5 determinations for experimental point. Amount of dienes would correspond to those conjugated in membrane layers and carbonyl(s) groups to oxidized proteins. The shadowed horizontal bar is the control range and symbols in red represent muscle homogenates from the injured zone, as well as those from the contralateral zone (black circles). Statistical significance = *p<0.01.
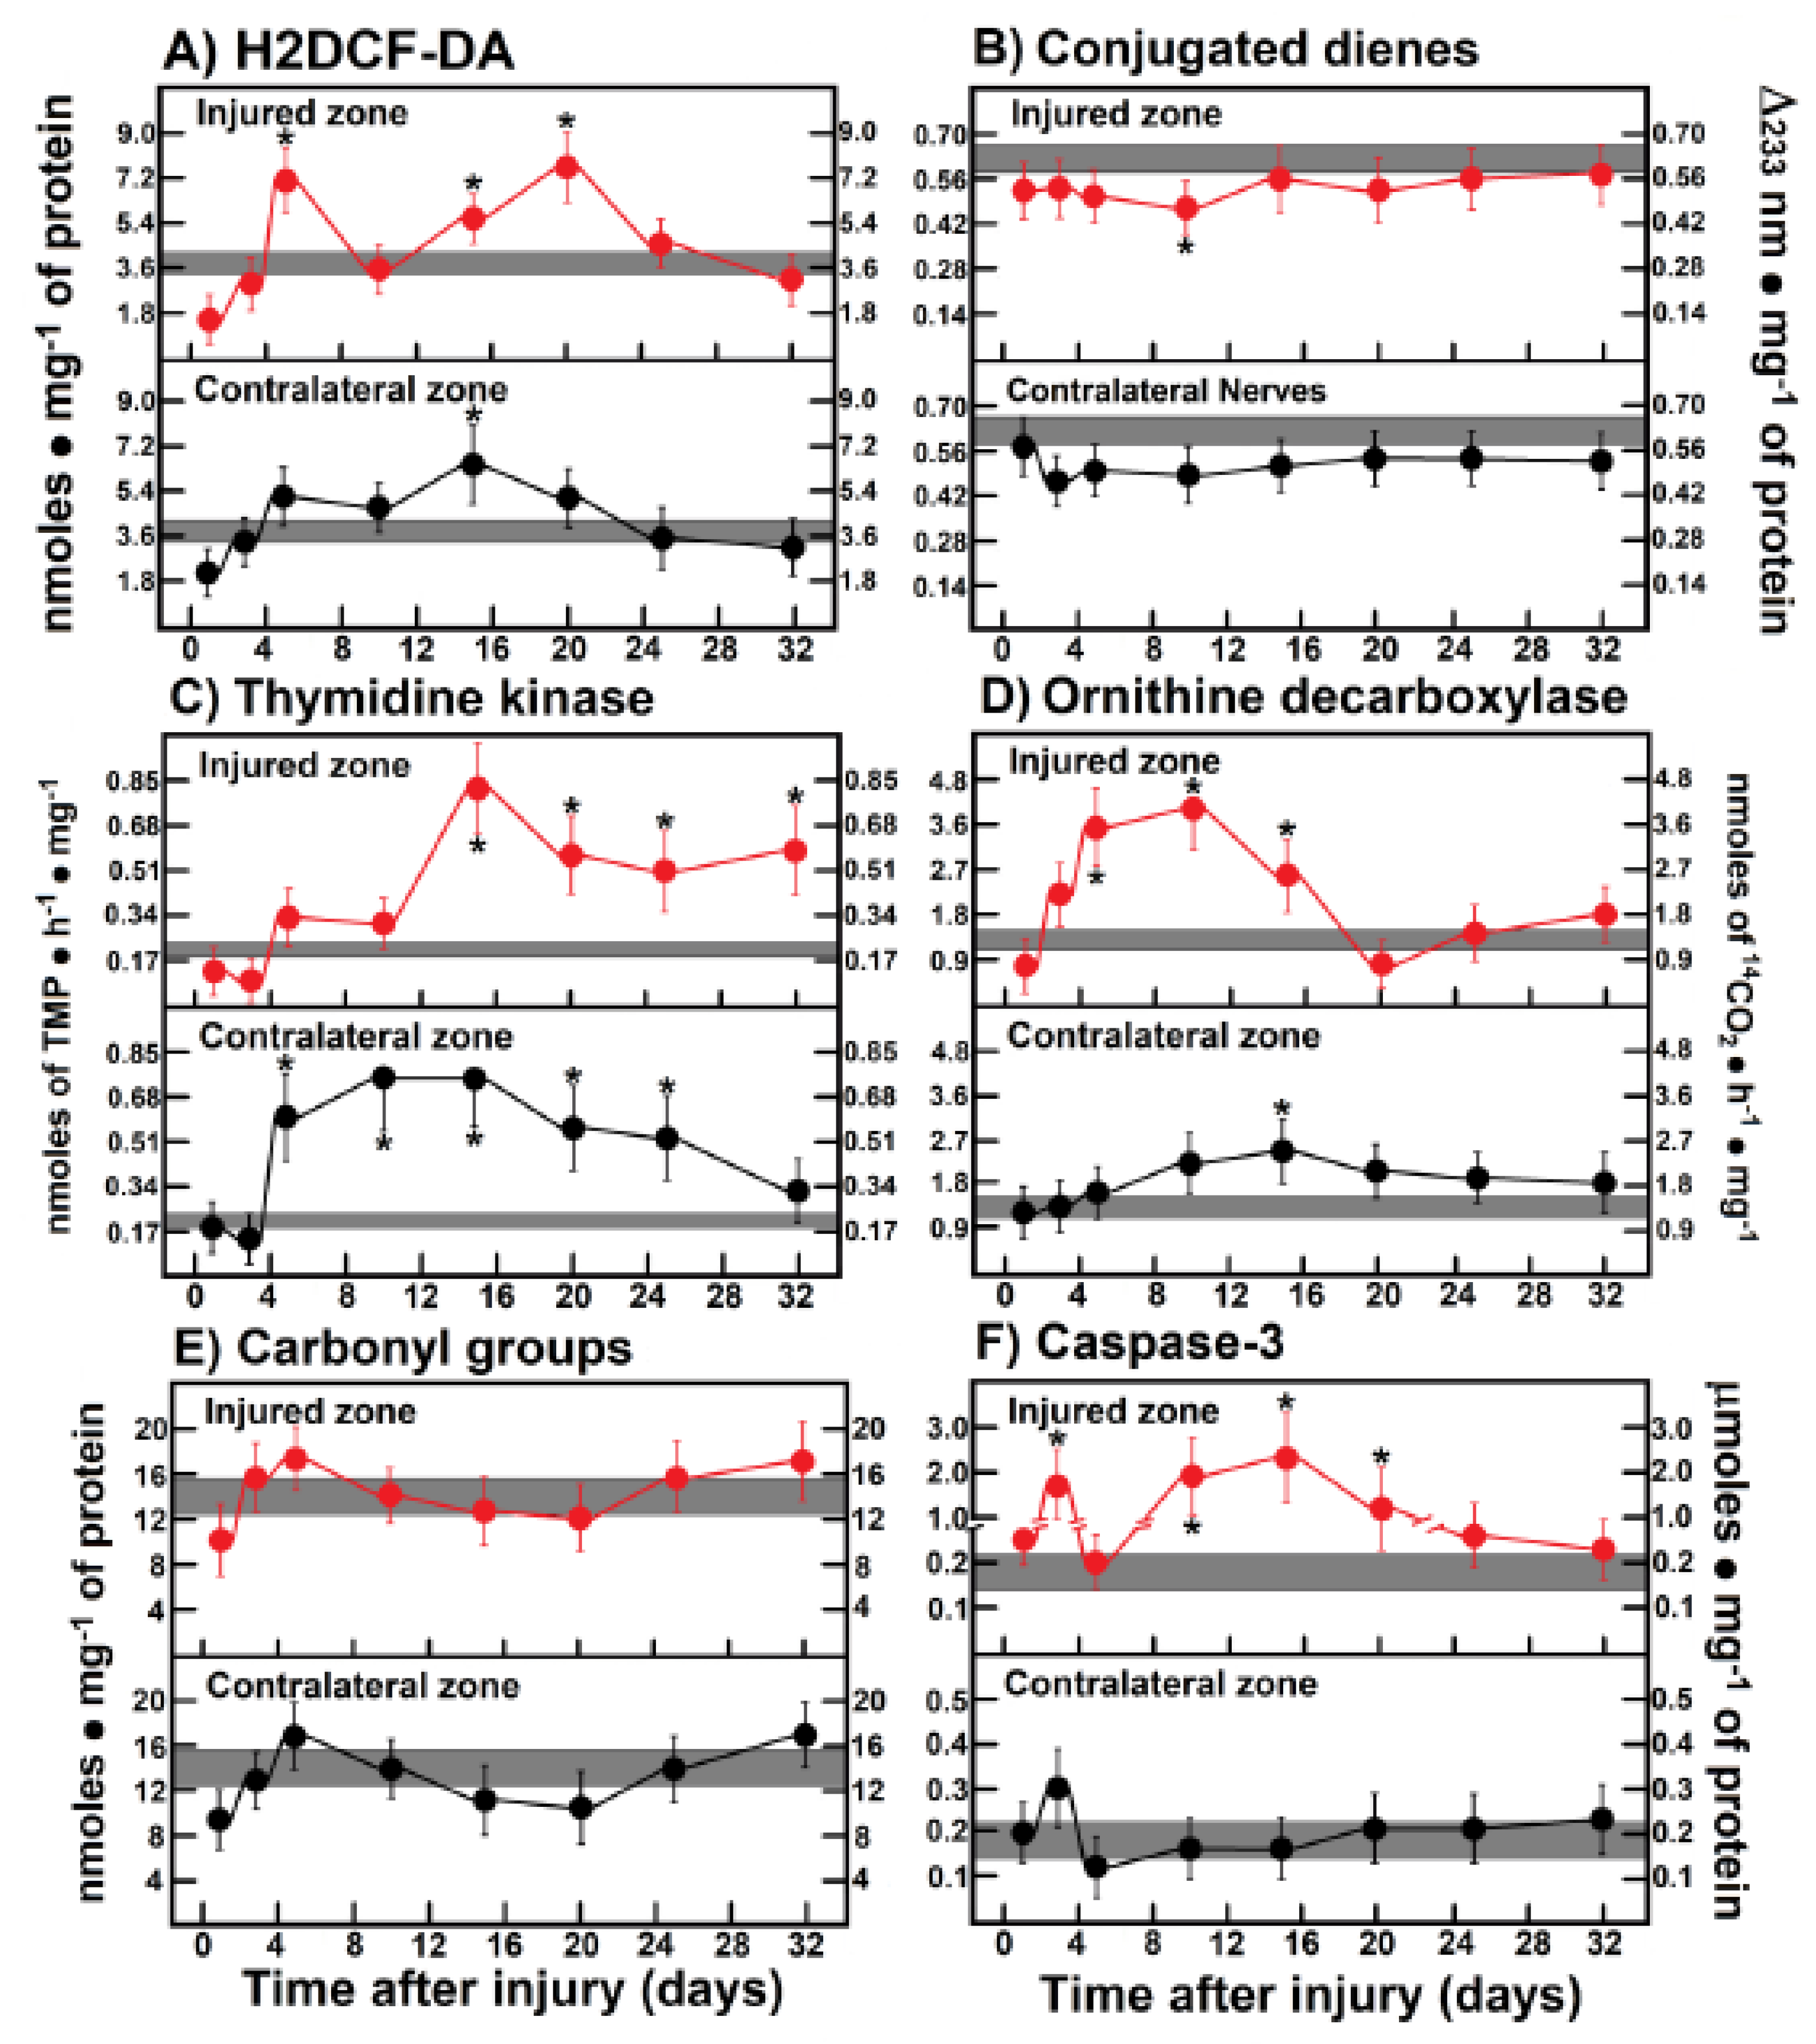
Figure 6.
Correlations among parameters indicative of oxidant stress, cell proliferation, apoptosis, and onset of mitochondrial biogenesis in injured sciatic nerves after crush and transection and in the respective contralateral (intact) nerves. Scatter plots show the relation between two sets of data. This relation is summarized in the Pearson’s correlation coefficient (r) for each relation in each scatter plot: panel A, H2DCF-DA fluorescence vs. ROS (chemiluminescence) (r = 0.727 and 0.822, in injured and intact contralateral nerves, respectively; p<0.005). Panel B, H2DCF-DA fluorescence vs. ROS (chemiluminescence) (r = 0.300 and 0.744, in injured proximal and intact contralateral nerves, respectively; p<0.05 and p<0.005), and in panel C, the same but in the injured distal nerve (r = -0.123, n.s.) and in the intact contralateral nerve (r = 0.744, p<0.005). Panel D, H2DCF-DA fluorescence vs. carbonyl groups (r = 0.685 and 0.345, in injured and intact contralateral nerves, respectively; p<0.01 and p<0.05). Panel E, H2DCF-DA fluorescence vs. carbonyl groups (r = 0.586 and -0.002, in injured proximal and intact contralateral nerves, respectively; p<0.01 and n.s.), and in panel F, the same but in the injured distal nerve (r = 0.169, n.s.) and in the intact contralateral nerve (r = -0.002, n.s.). Panel G, H2DCF-DA fluorescence vs. caspase-3 (r = 0.312 and 0.629, in injured and intact contralateral nerves, respectively; p<0.05 and p<0.01). Panel H, H2DCF-DA fluorescence vs. caspase-3 (r = 0.061 and -0.281, in injured proximal and intact contralateral nerves, respectively; n.s. and p<0.05), and in panel I, the same but in the injured distal nerve (r = 0.186, p<0.05) and in the intact contralateral nerve (r = -0.281, p<0.05). Panel J, H2DCF-DA fluorescence vs. ODC (r = 0.731 and 0.038, in injured and intact contralateral nerves, respectively; p<0.005 and n.s.). Panel K, H2DCF-DA fluorescence vs. ODC (r = 0.066 and -0.294, in injured proximal and intact contralateral nerves, respectively; n.s. and p<0.05), and in panel L, the same but in the injured distal nerve (r = 0.250, p<0.05) and in the intact contralateral nerve (r = -0.294, p<0.05). Finally, panel M, H2DCF-DA fluorescence vs. cytochrome oxidase activity (r = -0.343 and -0.320, in injured proximal and intact contralateral nerves, respectively; p<0.05). Panel N, H2DCF-DA fluorescence vs. cytochrome oxidase (r = 0.204 and -0.379, in injured proximal and intact contralateral nerves, respectively; n.s. and p<0.05), and in panel O, the same but in the injured distal nerve (r = -0.649, p<0.01) and in the intact contralateral nerve (r = -0.379, p<0.05). Symbols for the experimental group as indicated at the top of the figure.
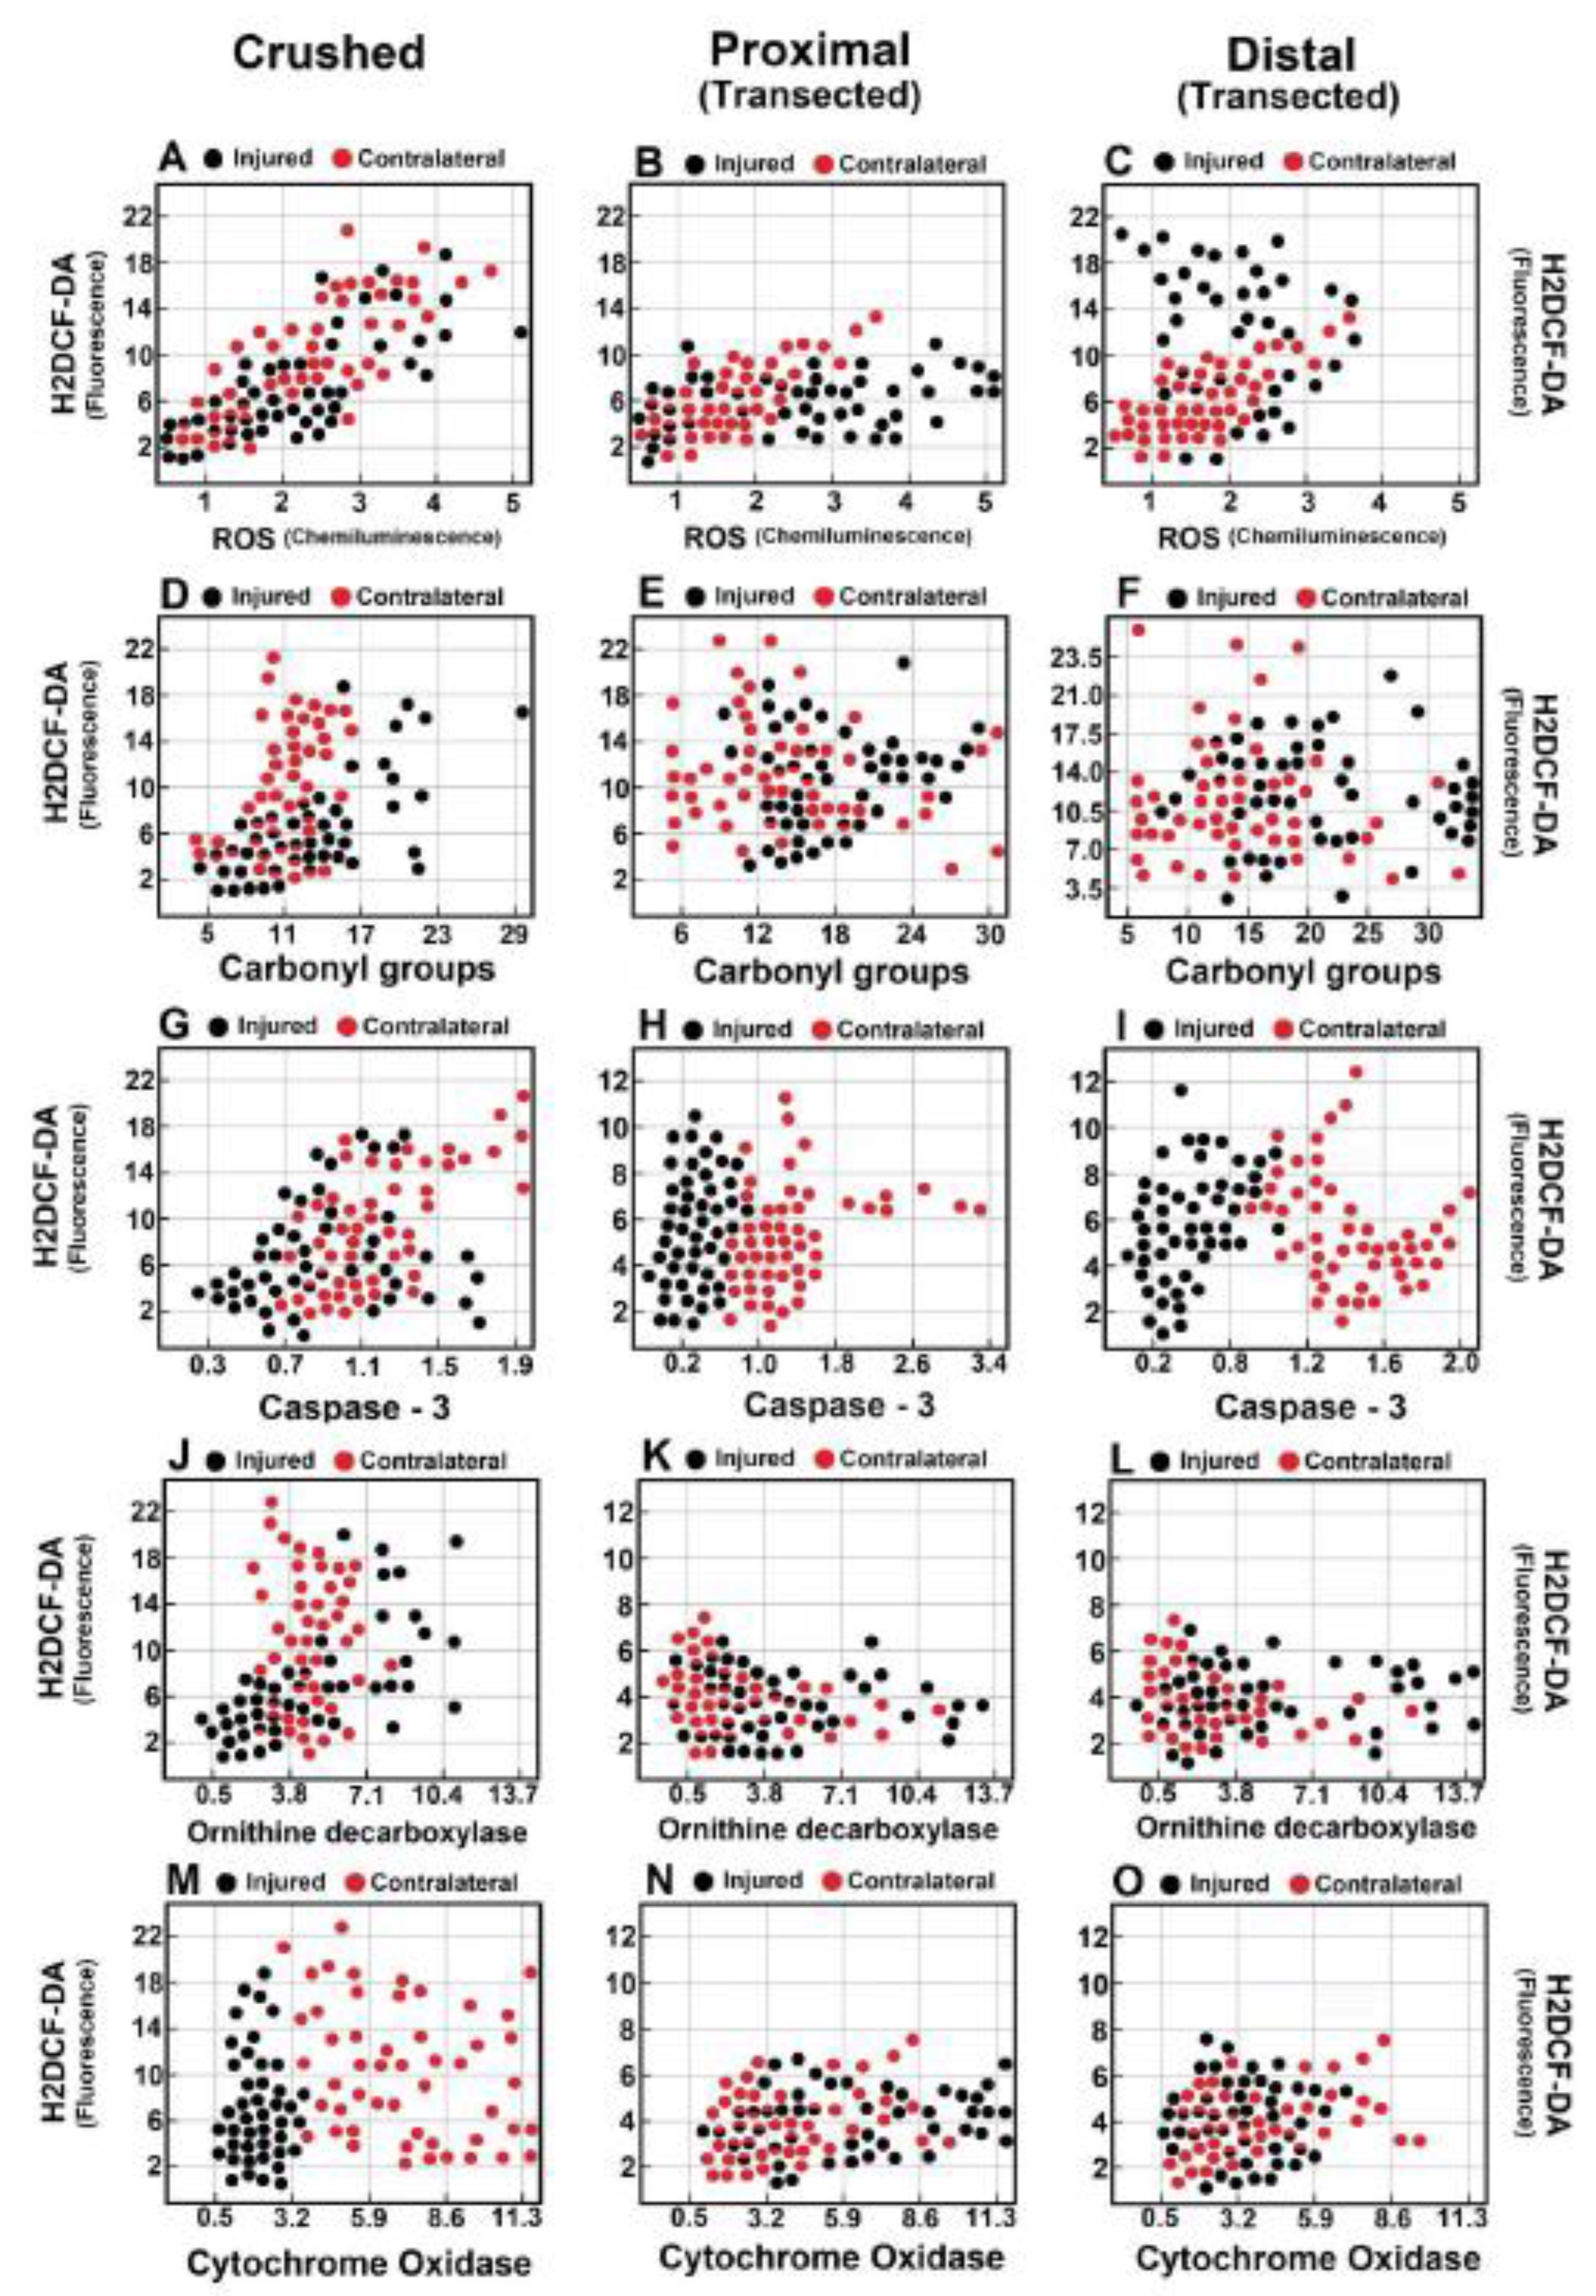

Table 1.
Rate of lipid peroxidation in several organs after crushing the right sciatic nerve.
| Parameter | Lipid Peroxidation (Arbitrary units ∙ 102 ∙ mg-1 of protein) | |||
|---|---|---|---|---|
| Organ | Brain Cortex | Brachial Nerve | Liver | Muscle |
| Control values | 5.8 ± 1.6 | 2.7 ± 0.7 | 1.3 ± 0.4 | 1.4 ± 0.5 |
| Time after Surgery | ||||
| Day 1 | 6.1 ± 1.8 | 2.3 ± 0.7 | 1.2 ± 0.4 | 3.0 ± 0.7* |
| Day 3 | 6.2 ± 2.0 | 1.7 ± 0.4* | 1.3 ± 0.4 | 4.1 ± 0.4* |
| Day 5 | 6.1 ± 4.0 | 1.3 ± 0.4* | 1.2 ± 0.2 | 1.4 ± 0.4 |
| Day 7 | 6.0 ± 4.0 | 2.0 ± 0.7 | 3.3 ± 1.3* | 1.6 ± 0.4 |
| Day 10 | 5.9 ± 4.0 | 2.7 ± 1.1 | 2.0 ± 0.7 | 1.7 ± 0.5 |
| Day 15 | 6.0 ± 1.8 | 1.8 ± 0.7 | 1.5 ± 0.4 | 2.4 ± 0.7* |
| Day 20 | 5.7 ± 1.8 | 1.6 ± 0.7 | 1.4 ± 0.4 | 3.0 ± 0.7* |
Disclaimer/Publisher’s Note: The statements, opinions and data contained in all publications are solely those of the individual author(s) and contributor(s) and not of MDPI and/or the editor(s). MDPI and/or the editor(s) disclaim responsibility for any injury to people or property resulting from any ideas, methods, instructions or products referred to in the content. |
© 2025 by the authors. Licensee MDPI, Basel, Switzerland. This article is an open access article distributed under the terms and conditions of the Creative Commons Attribution (CC BY) license (http://creativecommons.org/licenses/by/4.0/).
Copyright: This open access article is published under a Creative Commons CC BY 4.0 license, which permit the free download, distribution, and reuse, provided that the author and preprint are cited in any reuse.


