Submitted:
11 August 2025
Posted:
12 August 2025
You are already at the latest version
Abstract
Background Obstruction of endolymph flow by saccular otoconia has been linked to endolymphatic hydrops and is a key pathological hypothesis for Ménière’s disease. The inner ear hosts several macrophage populations. Endolymphatic sac macrophages can phagocytose otoconia, and spiral limbus macrophages express genes for fluid shear stress sensing and bone remodelling. Since macrophages are strongly affected by in-flammatory status, a role for them in otolith removal could provide a link between in-flammation and hydrops. However, no data are available so far about macrophages around reuniting and endolymphatic duct, the two thin structures where blockage is most likely to happen.
Methods We performed tissue clearing and lightsheet imaging on rat temporal bones. Autofluorescence and immunolabeling for collagen IV, SMA and Iba1 were used to identify and quantify inner ear structures, blood vessels and macrophages.
Results The connective tissue layer underlying the reuniting duct branched from the cochlear spiral limbus and was connected to it through its microvascular network. Reuniting duct and spiral limbus hosted a continuous macrophage population, con-taining both ameboid and branched cells. Macrophages also surrounded the underly-ing vestibulocochlear artery. A separate macrophage population, similar to that found in the saccular connective tissue, was found around the endolymphatic sinus and utriculo-endolymphatic valve; macrophage features changed pattern in the vestibular aqueduct and again at the endolymphatic sac.
Conclusion Macrophages appear localized at strategical positions for the sensing of endolymphatic and perilymphatic pressure, and for the removal of clogging material, such as otolith aggregates, from reuniting and endolymphatic ducts.
Keywords:
inner ear
; macrophage
; tissue clearing
; otolith
; hydrops
; immunology of the ear
; utriculo-endolymphatic valve
; endolymphatic duct
; reuniting duct
; inflammation
1. Introduction
Obstruction of endolymph flow by otoliths or otolith aggregates from the saccule has been linked to endolymphatic hydrops and is a key pathological hypothesis for Ménière’s disease [1,2,3,4,5,6,7]. Blockage of the reuniting duct (RD), which connects the saccule to the cochlear scala media [5], has been associated with cochlear hydrops [6], while obstruction [6,7] or backflow [8] at the endolymphatic duct (ED) has been associated to vestibular hydrops.
Most anatomical studies of RD and ED rely on high-resolution CT (cone-beam or microCT) to infer soft tissue structures from bone landmarks [3,9]; more recently other volumetric imaging technique such as X-ray tomography [8] or tissue clearing [5] have allowed the direct visualization of soft tissues in situ. Tissue clearing also enables cell type-specific labelling [10]. In the present study we used a tissue clearing method which allows observation of the labyrinth [11] and associated immune structures [14,15,16] to quantify macrophage populations associated with RD and ED in the rat.
Besides hydrops, Ménière’s disease has been associated with inflammation [12], and in a single cell transcriptome study of the crista ampullaris, macrophages expressed several genes which have been associated to Meniére’s disease [13]. Macrophages could therefore link inflammatory status and hydrops [18,19,20,21]. In this light, it is interesting to note that macrophages are “siphoned” into the vestibular aqueduct upon osmotic imbalance [14], and a macrophage population in the stria vascularis has been directly involved in endolymph production [15]. Macrophage populations located around RD and ED could affect endolymph flow by phagocytosing otoconia, as they have been found to do within the endolymphatic sac [16], or by altering duct width and local permeability when activated by inflammatory stimuli.
Here, we used tissue clearing and light-sheet microscopy (as in [17]) to reconstruct both ducts in the rat inner ear, along with associated vasculature and resident macrophages.
2. Materials and Methods
2.1. Animals
Experiments were performed on adult inbred Wistar rats of both sexes (Table 1). Five temporal bones from four rats were used. Data from three animals (R1, R3, R4) were previously used to build a volumetric atlas of the rat inner ear [11]. Sample R2 was part of the same batches but was not previously analysed.
This study was carried out in accordance with the recommendations of Act 26/2014, Italian Ministry of Health. The protocol (number 155/2017-PR) was approved by the Italian Ministry of Health and University of Pavia Animal Welfare Office (OPBA). All efforts were made to minimize the number of animals used and animal suffering.
Image stacks used for this work come from the same samples studied for the reconstruction of temporal bone marrow [17] and implementation of inner ear atlas [11]: therefore, all sample treatments were as in [17]. Sample R2 was part of the same batches but was not previously analysed. Tissue clearing was performed with a variant of iDISCO+ [18] which allowed to image both brain and temporal bone [19]. Fluorescent labelling was performed as in [17]; the antibodies used in the present paper were: mouse anti-SMA (Abcam amab7817, 1:200), rabbit anti-ColIV (Abcam ab6586, 1:200) and rabbit anti-Iba1 (WAKO 019–19,741, 1:200); secondary antibodies were donkey anti-rabbit and anti-mouse conjugated with Alexa 488, 555 or 647 (Invitrogen, 1:200). The collagen IV antibody was nonspecific for isoforms, and labelled both vascular and nonvascular structures [20]; however, vessels were easily isolated. Cleared samples were imaged with a mesoSPIM lightsheet microscope (Voigt et al. 2019) at the Wyss Center for Bio and Neuroengineering in Geneva, Switzerland, as in [17]. Voxel sizes for each animal are given in Table 1.
2.2. Image Analysis
Segmentation of the inner ear labyrinth from image stacks was performed in a semiautomated way using FIJI [21] and ITK-SNAP [22] with the pipeline outlined in [11]. Three experts performed independent segmentations and volumes were considered acceptable when volume overlap was >90%. Segmentations were based on the autofluorescence signal at 488 and 647 nm, as described in [17]. In addition, the signals from SMA, ColIV and Iba1 labeling were used to segment arteries, blood vessels, and macrophages, respectively.
Volumes of segmented objects were directly measured as ITK-SNAP voxel counts, scaled to voxel size. Distances were measured manually with 3DSlicer Markups module, by placing markers along the path to be measured.Macrophage populations
After the structures of interest (RD and ED and their associated vessels) were manually segmented from the autofluorescence signal using ITK-SNAP, a ROI dataset was extracted with a custom FIJI script. The dataset was used as a mask on Iba-1 signal image stacks; ROIs were dilated to include all surrounding macrophages. Macrophages were then segmented from masked image stacks in a semi-automated way by thresholding the Iba-1 signal, and segmentation was adjusted manually. Macrophages were then quantified with ImageJ 3D Object counter.
To differentiate macrophage populations, we calculated macrophage solidity, i.e. the ratio between the volume of the convex hull enclosing the entire macrophage, and the volume of the macrophage itself [23]. This measure allowed us to distinguish ramified and ameboid cells.
Solidity calculation was performed as follows:
- The .tif files were loaded into MATLAB and binarized
- Objects were defined using the bwlabeln function with 26 connectivity
- Object volumes were measured with the regionprops3 function
- Small objects (<100 voxels) were removed with the function bwareaopen
- Outliers deriving from segmentation artefacts were removed with rmoutlier
- Normality of data was checked with chi2gof at 5% significance
- The presence of multiple populations was checked with fitgmdist, choosing the number of populations (between 1 and 10) that minimized Akaike information criterion. Best numbers were three for total population, and two for reuniting and ED populations.
- Sum of gaussians fit was performed using the nlsLM function in R. The parameters A, µ, and σ indicated amplitude, mean and spread for each gaussian component.
Inner ear segmentations and accompanying label descriptions are available upon reasonable request to the authors.
3. Results
3.1. Reuniting Duct
The rat RD (Figure 1) is a flattened ribbon connecting the cochlear duct to the saccule, which tapers to an oval section measuring in our samples 95±25 µm by 20±3 µm (n=4). Underneath the duct, a connective tissue layer is present (Figure 1A1), which emerges without any visible transition from the modiolar side of the spiral limbus, and merges on the other side into the connective tissue lining the saccule (Figure 1B; see also Figure 3 in [11]). Several macrophages are embedded within the RD connective tissue, and a few are found projecting to perilymph (Figure 1A2).
The connective tissue below the RD is highly vascularized: the vestibulocochlear artery (VCA) is visible as a SMA+ tortuous vessel coursing through bone below the duct (Figure 1C) and branching into capillaries feeding the spiral limbus (Figure 2), RD (Figure 2), and saccule (Figure 3A). From the capillary network, veins gathered at the endolymphatic sinus and converged into the vein of the vestibular aqueduct (Figure 3A).
Except for one sample, the VCA branched into a straight vessel which left the connective tissue at the RD end (Figure 3B), crossing the scala vestibuli and reaching the utricular limiting membrane, similar to an arachnoid trabecule. Macrophage populations were observed in association of both the tortuous and trabecular artery, as well as in association to RD, ED and vestibular aqueduct vein (Figure 3B).
3.2. Endolymphatic Duct
The ED starts with an endolymphatic sinus connecting to the saccule through a saccular duct, and to the utricle through the utriculo-endolymphatic (Bast’s) valve, which is usually closed [24]. After Bast’s valve, the duct enters the vestibular aqueduct, and at the opposite end of the aqueduct it forms the endolymphatic sac within the dura. The rat ED and sac are similar to human, albeit simpler [25], and the sinus only tapers before entering the saccule and folds at Bast’s valve without clear saccular or utricular ducts.
The ED is joined by the vestibular aqueduct vein at its entry into the vestibular aqueduct (Figure 4). The endolymphatic sinus, on the other hand, is only contacted by small veins draining the saccule, on the side opposite Bast’s valve (Figure 3A). The ED is surrounded by Iba1+ macrophages throughout its length and three clusters can be distinguished: 1- around the sinus (Figure 3B), ramified macrophages patrol the perilymphatic side of the structure, including Bast’s valve (Figure 4B); 2- in the aqueduct (Figure 4A), a reticular network of macrophages surrounds in a single layer the duct and the vein, forming a complete cuff; 3- in the endolymphatic sac, a more complex macrophage pattern is seen, with the intervention of a third irregular layer (this population could not be quantified because of the strong autofluorescence of the endolymphatic sac).
The endolymphatic sinus is located in the perilymphatic space, close to the nonsensory part of the utricle, where the limiting membrane trabecules are anchoring the utricle to bone. The presence of macrophages in association with Bast’s valve (as seen in Figure 4B) suggests a mechanism with which inflammatory processes could affect utricle geometry and endolymphatic flow between the vestibular organs and the endolymphatic sac.
The vestibular aqueduct contains two parallel networks of macrophages surrounding the duct and vein. In a sample where complete reconstruction was possible, macrophages occupied 7% of the vestibular aqueduct volume. Bone canalicules lined with macrophages connect the aqueduct to local bone marrow; in the present work, however, we have focused to macrophages within the aqueduct, since the connections to bone marrow were addressed in a previous study [17].
3.3. Macrophage Features
We quantified macrophage numbers and shape around several inner ear structures (Figure 5, Table 2). Macrophages around the RD displayed a mixture of amoeboid and ramified shape, whereas those associated to the vestibulocochlear artery were elongated or ramified.
In the ED, macrophages associated with the sinus also displayed a mixture of shapes, although they were on average more ramified than those of the RD.
Macrophages were counted after segmentation of Iba1 signal in a completely reconstructed sample.
4. Discussion
The inner ear immune system is emerging as a very complex system [26,27], and includes several macrophage populations with different origins [26,28,29,30,31] and roles, from protective [28], to cytotoxic [29] to phagocytic [30]. A recent single-cell transcriptome study found five macrophage subpopulations in the mouse cochlea [31], which appear very relevant in the light of the present study. Although no mention was made of macrophages associated to RD, the CD206+ macrophage population found in Chiot study (which the study named as beta and gamma) was limited to the spiral limbus and spiral lamina, and the CD206+CD163+ subpopulation (named gamma) was enriched in genes important for fluid shear stress and bone metabolism. Since we observed that the connective tissue and macrophage population of RD appear continuous with that of the spiral limbus, duct macrophages could be specialized to sense endolymph blockage and pressure buildup. Even more interesting, CD206+CD163+ macrophages in Chiot study were affected by aging and were slowly replenished by bone marrow derived cells, especially in basal turns, in contrast with the remaining cochlear macrophages [31]. This parallels the age dependence of endolymphatic hydrops [32] and could reflect the geometry of local bone marrow clusters, which associate separately to the cochlear apex and base [17].
Although the purely anatomical approach of the present work does not allow a clear definition of duct macrophage functions, our observations, together with Chiot study findings about fluid stress sensing and bone remodeling gene expression in spiral limbus macrophages, would suggest a role for these cells in unclogging the duct from debris. More in detail:
In the present study we have observed a layer of macrophages within the connective tissue lining the RD , and perivascular macrophages located around the underlying vestibulocochlear artery. Macrophage branches reached the perilymph in association to vessels or at the edge of the connective tissue ledge. This localization strongly suggests that both connective tissue and perivascular macrophages can sense perilymphatic stimuli. Moreover, the presence of macrophages tethered to a freely mobile vessel within the scala vestibuli would suggest the ability to transduce not only chemical but also mechanical stimuli into inflammatory responses (as has been observed in other systems [33,34]). It is very interesting to note that, even in our limited sample, not all animals displayed a free vessel within the perilymphatic space. This anatomical heterogeneity, which parallels the arachnoid cistern complexity in the human inner ear [35], could explain (at least in part) the variable responses to positive pressure therapies in Meniére’s disease [36]. Further studies will assess whether these macrophages correspond to beta and gamma populations in [31], which express genes related to fluid shear stress, and whether human duct macrophages and vessels show similar features.
Besides sensing fluid flow and pressure, RD macrophages may act as phagocytes and free endolymph from debris, including otoconia. The latter are formed by a mineralized protein core [37] which is connected to a loose protein network [38]. Otoconia size is variable, but measures range from below 1 µm to up to 30 µm [39], and saccular otoconia appear smaller than utricular ones [40,41]. Therefore, a single otoconium appears unlikely to effectively block the RD , but a clump of otoconia could easily do it, and otoconial aggregates have been found in human inner ears from Meniére’s disease patients [42,43]. Dislodged otoconia spontaneously degrade in low-Ca2+ endolymph, and this is assumed to be the reason BPPV episodes spontaneously recover [44]. However, the dissolution time course for otoconia trapped in a small volume such as the RD is not known, and the degradation mechanisms for otolithic membrane fragments and for the proteinaceous network tying otoconia together are similarly not clear. Macrophages could be involved in debris removal through phagocytosis and/or secretion of lytic enzymes (such as MMP14, which is expressed in CD206+ macrophages [31]). In the endolymphatic sac, a population of macrophages has been found to access the sac lumen and act as phagocytes in regard to several objects, including otoconia [30]. In this line of reasoning, the aberrant behaviour of these macrophages (due, for example, to chronic inflammation) or their disappearance (possibly also due to systemic factors reducing bone marrow-derived cell inflow) may lead to the accumulation of debris.
Macrophages located in the ED displayed morphological differences from those of RD , being on average more ramified. Although a transcriptome analysis will be necessary to pinpoint functional differences, one important point to consider is the association of endolymphatic duct macrophages to a venous vessel rather than an artery as for the RD . In the dorsal root ganglion, CD163+ macrophages associated with the vascular network display different features between the arterial and venous compartments [45]. Aqueductal macrophages are known to include a migrating component that enters the duct upon osmotic imbalances [14]. Moreover, the thinner part of the endolymphatic duct, the isthmus, is not located at the beginning of the duct but after the sinus and Bast’s valve. Therefore, it appears more likely for otoconia to stop at the isthmus than at the valve. Since opening of the valve involves changes in utricle geometry, and since the endolymphatic sinus is contained in the perilymphatic space rather than in the aqueduct connective tissue, a speculation on the role of macrophages around Bast’s valve could regard a role for them in local permeability or stiffness changes affecting sinus and/or utricle fluid flow.
5. Conclusions
The presence of macrophage populations associated with RD and ED and associated vessels suggests that they may affect endolymph circulation in the labyrinth. Macrophages associated with RD may sense local pressure variations and be involved in removal of otoconia debris plugging duct lumen. Macrophages associated with ED appear different and related to the venous rather than arterial compartment. However, their role, especially around Bast’s valve, although intriguing, remains obscure.
Author Contributions
Conceptualization, P.P.; methodology, P.P., D.C., and E.V.; software, D.C.; validation, P.P., D.C., and E.V.; data curation, P.P., D.C., and E.V.; writing—original draft preparation, P.P.; writing—review and editing, P.P, E.V.; visualization, P.P., D.C., and E.V.; supervision, P.P.; project administration, P.P.; funding acquisition, P.P. All authors have read and agreed to the published version of the manuscript.
Funding
This research was funded by the Banca del Monte di Lombardia Foundation, contribution to Prof. Roberto Pizzala, Dipartimento di Medicina Molecolare, University of Pavia 2021. The funders had no role in study design, data collection and analysis, decision to publish, or preparation of the manuscript.
Institutional Review Board Statement
The study was conducted in accordance with the Declaration of Helsinki, and approved by the Italian Ministry of Health (protocol number 155/2017-PR). The study was approved and supervised also by the University of Pavia Animal Welfare Office (OPBA) together with the Board of the local animal house core facility with protocol #PT117. This study was carried out in accordance with the recommendations of Act 26/2014, Italian Ministry of Health.
Data Availability Statement
Data are available from the Authors upon request.
Acknowledgments
The Authors want to acknowledge the contribution of Laura Batti and Ivana Gantar with lightsheet acquisition, and of Roberto Pizzala with discussion and manuscript preparation.
Conflicts of Interest
The authors declare no conflicts of interest.
Abbreviations
The following abbreviations are used in this manuscript:
| BPPV | Benign paroxysmal positional vertigo |
| ColIV | Collagen IV |
| ED | Endolymphatic duct |
| MMP14 | Matrix metalloprotease 14 |
| RD | Reuniting duct |
| ROI | Region of interest |
| SMA | Smooth muscle actin |
| VCA | Vestibulocochlear artery |
References
- Hornibrook, J. Saccular otoconia as a cause of Ménière’s disease: hypothesis based on two theories. J Laryngol Otol 2018, 132, 771–774. [Google Scholar] [CrossRef]
- Álvarez De Linera-Alperi M, Dominguez P, Blanco-Pareja M, Menéndez Fernández-Miranda P, Manrique-Huarte R, Liaño G, et al. Is endolymphatic hydrops, as detected in MRI, a truly cochleocentric finding? Front Neurol 2024, 15, 1477282. [CrossRef]
- Yamane H, Sunami K, Iguchi H, Sakamoto H, Imoto T, Rask-Andersen H. Assessment of Meniere’s disease from a radiological aspect - saccular otoconia as a cause of Meniere’s disease? Acta Otolaryngol (Stockh) 2012, 132, 1054–1060. [Google Scholar] [CrossRef]
- Hornibrook J, Bird P. A New Theory for Ménière’s Disease: Detached Saccular Otoconia. Otolaryngol--Head Neck Surg Off J Am Acad Otolaryngol-Head Neck Surg 2017, 156, 350–352. [Google Scholar] [CrossRef]
- Smith CM, Curthoys IS, Plontke SK, Menzel M, Mukherjee P, Wong C, et al. Insights into Inner Ear Function and Disease Through Novel Visualization of the Ductus Reuniens, a Seminal Communication Between Hearing and Balance Mechanisms. J Assoc Res Otolaryngol JARO 2022, 23, 633–645. [Google Scholar] [CrossRef]
- Kimura RS, Schuknecht HF, Ota CY, Jones DD. Obliteration of the ductus reuniens. Acta Otolaryngol (Stockh) 1980, 89, 295–309. [Google Scholar] [CrossRef] [PubMed]
- Konishi, S. The ductus reuniens and utriculo-endolymphatic valve in the presence of endolymphatic hydrops in guinea-pigs. J Laryngol Otol 1977, 91, 1033–1045. [Google Scholar] [CrossRef] [PubMed]
- Li H, Rajan GP, Shaw J, Rohani SA, Ladak HM, Agrawal S, et al. A Synchrotron and Micro-CT Study of the Human Endolymphatic Duct System: Is Meniere’s Disease Caused by an Acute Endolymph Backflow? Front Surg 2021, 8, 662530. [CrossRef]
- Yamane H, Takayama M, Sunami K, Sakamoto H, Imoto T, Anniko M. Visualization and assessment of saccular duct and endolymphatic sinus. Acta Otolaryngol (Stockh) 2011, 131, 469–473. [Google Scholar] [CrossRef] [PubMed]
- Susaki, EA. Unlocking the potential of large-scale 3D imaging with tissue clearing techniques. Microsc Oxf Engl 2025, 74, 179–188. [Google Scholar] [CrossRef]
- Cossellu D, Vivado E, Batti L, Gantar I, Pizzala R, Perin P. Volumetric atlas of the rat inner ear from microCT and iDISCO+ cleared temporal bones. PeerJ 2025, 13, e19512. [Google Scholar] [CrossRef]
- Frejo L, Lopez-Escamez JA. Cytokines and Inflammation in Meniere Disease. Clin Exp Otorhinolaryngol 2022, 15, 49–59. [Google Scholar] [CrossRef] [PubMed]
- Wilkerson BA, Zebroski HL, Finkbeiner CR, Chitsazan AD, Beach KE, Sen N, et al. Novel cell types and developmental lineages revealed by single-cell RNA-seq analysis of the mouse crista ampullaris. eLife 2021, 10, e60108. [Google Scholar] [CrossRef]
- Jansson B, Rask-Andersen H. Osmotically induced macrophage activity in the endolymphatic sac. On the possible interaction between periaqueductal bone marrow cells and the endolymphatic sac. ORL J Oto-Rhino-Laryngol Its Relat Spec 1992, 54, 191–197. [Google Scholar] [CrossRef]
- Ito T, Kurata N, Fukunaga Y. Tissue-Resident Macrophages in the Stria Vascularis. Front Neurol 2022, 13, 818395. [Google Scholar] [CrossRef]
- Imoto T, Rask-Andersen H, Bagger-Sjöbäck D. The role of the endolymphatic sac in statoconial formation and degradation. Acta Otolaryngol (Stockh) 1983, 96, 227–235. [Google Scholar] [CrossRef]
- Perin P, Cossellu D, Vivado E, Batti L, Gantar I, Voigt FF, et al. Temporal bone marrow of the rat and its connections to the inner ear. Front Neurol 2024, 15, 1386654. [Google Scholar] [CrossRef]
- Renier N, Wu Z, Simon DJ, Yang J, Ariel P, Tessier-Lavigne M. iDISCO: a simple, rapid method to immunolabel large tissue samples for volume imaging. Cell 2014, 159, 896–910. [Google Scholar] [CrossRef] [PubMed]
- Perin P, Voigt FF, Bethge P, Helmchen F, Pizzala R. iDISCO+ for the Study of Neuroimmune Architecture of the Rat Auditory Brainstem. Front Neuroanat 2019, 13, 15. [Google Scholar] [CrossRef]
- Barozzi S, Soi D, Intieri E, Giani M, Aldè M, Tonon E, et al. Vestibular and audiological findings in the Alport syndrome. Am J Med Genet A 2020, 182, 2345–2358. [Google Scholar] [CrossRef] [PubMed]
- Schindelin J, Arganda-Carreras I, Frise E, Kaynig V, Longair M, Pietzsch T, et al. Fiji: an open-source platform for biological-image analysis. Nat Methods 2012, 9, 676–682. [Google Scholar] [CrossRef] [PubMed]
- Yushkevich PA, Yang Gao null, Gerig G. ITK-SNAP: An interactive tool for semi-automatic segmentation of multi-modality biomedical images. Annu Int Conf IEEE Eng Med Biol Soc IEEE Eng Med Biol Soc Annu Int Conf 2016, 2016, 3342–3345. [Google Scholar] [CrossRef]
- Schnitzerlein M, Greto E, Wegner A, Möller A, Aust O, Ben Brahim O, et al. Cellular morphodynamics as quantifiers for functional states of resident tissue macrophages in vivo. PLoS Comput Biol 2025, 21, e1011859. [Google Scholar] [CrossRef]
- Gulya, AJ. Anatomy of the Temporal Bone with Surgical Implications. 3rd ed. Boca Raton: CRC Press; 2007. [CrossRef]
- Dahlmann A, von Düring M. The endolymphatic duct and sac of the rat: a histological, ultrastructural, and immunocytochemical investigation. Cell Tissue Res 1995, 282, 277–289. [Google Scholar] [CrossRef]
- Keithley, EM. Inner ear immunity. Hear Res 2022, 419, 108518. [Google Scholar] [CrossRef]
- Perin P, Marino F, Varela-Nieto I, Szczepek AJ. Editorial: Neuroimmunology of the Inner Ear. Front Neurol 2021, 12, 635359. [Google Scholar] [CrossRef] [PubMed]
- Manickam V, Gawande DY, Stothert AR, Clayman AC, Batalkina L, Warchol ME, et al. Macrophages Promote Repair of Inner Hair Cell Ribbon Synapses following Noise-Induced Cochlear Synaptopathy. J Neurosci Off J Soc Neurosci 2023, 43, 2075–2089. [Google Scholar] [CrossRef]
- Pan J, Wang K, Qu J, Chen D, Chen A, You Y, et al. Activated tissue-resident macrophages contribute to hair cell insults in noise-induced hearing loss in mice. Commun Biol 2024, 7, 1078. [Google Scholar] [CrossRef]
- Jansson B, Rask-Andersen H. Erythrocyte removal and blood clearance in the endolymphatic sac. An experimental and TEM study. Acta Otolaryngol (Stockh) 1996, 116, 429–434. [CrossRef]
- Chiot A, Felgner MJ, Brownell D, Rott KH, Bogachuk A, Rosmus D-D, et al. Single-cell, spatial, and fate-mapping analyses uncover niche dependent diversity of cochlear myeloid cells. BioRxiv Prepr Serv Biol 2024. [CrossRef]
- Dieterich M, Hergenroeder T, Boegle R, Gerb J, Kierig E, Stöcklein S, et al. Endolymphatic space is age-dependent. J Neurol 2023, 270, 71–81. [Google Scholar] [CrossRef]
- Tang Y, Zhao C, Zhuang Y, Zhong A, Wang M, Zhang W, et al. Mechanosensitive Piezo1 protein as a novel regulator in macrophages and macrophage-mediated inflammatory diseases. Front Immunol 2023, 14, 1149336. [Google Scholar] [CrossRef]
- Xie Y, Hang L. Mechanical gated ion channel Piezo1: Function, and role in macrophage inflammatory response. Innate Immun 2024, 30, 32–39. [Google Scholar] [CrossRef]
- Mei X, Schart-Morén N, Li H, Ladak HM, Agrawal S, Behr R, et al. Three-dimensional imaging of the human internal acoustic canal and arachnoid cistern: a synchrotron study with clinical implications. J Anat 2019, 234, 316–326. [Google Scholar] [CrossRef]
- Webster KE, George B, Galbraith K, Harrington-Benton NA, Judd O, Kaski D, et al. Positive pressure therapy for Ménière’s disease. Cochrane Database Syst Rev 2023, 2, CD015248. [Google Scholar] [CrossRef]
- Lundberg YW, Zhao X, Yamoah EN. Assembly of the otoconia complex to the macular sensory epithelium of the vestibule. Brain Res 2006, 1091, 47–57. [Google Scholar] [CrossRef] [PubMed]
- Kao WTK, Parnes LS, Chole RA. Otoconia and otolithic membrane fragments within the posterior semicircular canal in benign paroxysmal positional vertigo. The Laryngoscope 2017, 127, 709–714. [Google Scholar] [CrossRef] [PubMed]
- Lim, DJ. Formation and fate of the otoconia. Scanning and transmission electron microscopy. Ann Otol Rhinol Laryngol 1973, 82, 23–35. [Google Scholar] [CrossRef] [PubMed]
- Dickman JD, Huss D, Lowe M. Morphometry of otoconia in the utricle and saccule of developing Japanese quail. Hear Res 2004, 188, 89–103. [Google Scholar] [CrossRef]
- Lins U, Farina M, Kurc M, Riordan G, Thalmann R, Thalmann I, et al. The otoconia of the guinea pig utricle: internal structure, surface exposure, and interactions with the filament matrix. J Struct Biol 2000, 131, 67–78. [Google Scholar] [CrossRef]
- Quick ME, Bird PA. A review of Meniere’s disease - reflection of published MRI, ECochG and newer otoconial theory from Aotearoa New Zealand. J R Soc N Z 2025, 55, 441–450. [Google Scholar] [CrossRef]
- Yamane H, Takayama M, Sunami K, Sakamoto H, Imoto T, Anniko M. Blockage of reuniting duct in Meniere’s disease. Acta Otolaryngol (Stockh) 2010, 130, 233–239. [Google Scholar] [CrossRef] [PubMed]
- Zucca G, Valli S, Valli P, Perin P, Mira E. Why do benign paroxysmal positional vertigo episodes recover spontaneously? J Vestib Res Equilib Orientat 1998, 8, 325–329. [Google Scholar] [CrossRef]
- Lund H, Hunt MA, Kurtović Z, Sandor K, Kägy PB, Fereydouni N, et al. CD163+ macrophages monitor enhanced permeability at the blood-dorsal root ganglion barrier. J Exp Med 2024, 221, e20230675. [Google Scholar] [CrossRef] [PubMed]
Figure 1.
Figure 1. RD connective tissue and macrophages. A: Single optical sections from autofluorescence signal only (A1, sample R3) and Iba1 signal plus autofluorescence (A2, sample R1b). The connective tissue under the RD is continuous with the spiral limbus and hosts macrophages that reach the perilymph of the scala vestibuli. B: Volumetric reconstruction of the RD in connection with the saccule (sa) and cochlear scala media. The labyrinth is shown in its physiological orientation, as seen from a frontolateral point of view aligned with the anterior semicircular canal plane. Spiral limbus is shown in lilac, the connective tissue of the saccule in dark green. The line in panel B displays the section plane for panel A, the plane displays the orientation of C. C: maximal intensity projection of a 40 µm stack from autofluorescence (gray) and SMA signal (red), evidencing the location of VCA. Abbreviations: rd: reuniting duct; rm: Reissner’s membrane; rw: round window; sg: spiral ganglion; sl: spiral limbus; slig: spiral ligament; sm: scala media; st: scala tympani; stv: stria vascularis; sv: scala vestibuli, VCA: vestibulocochlear artery.
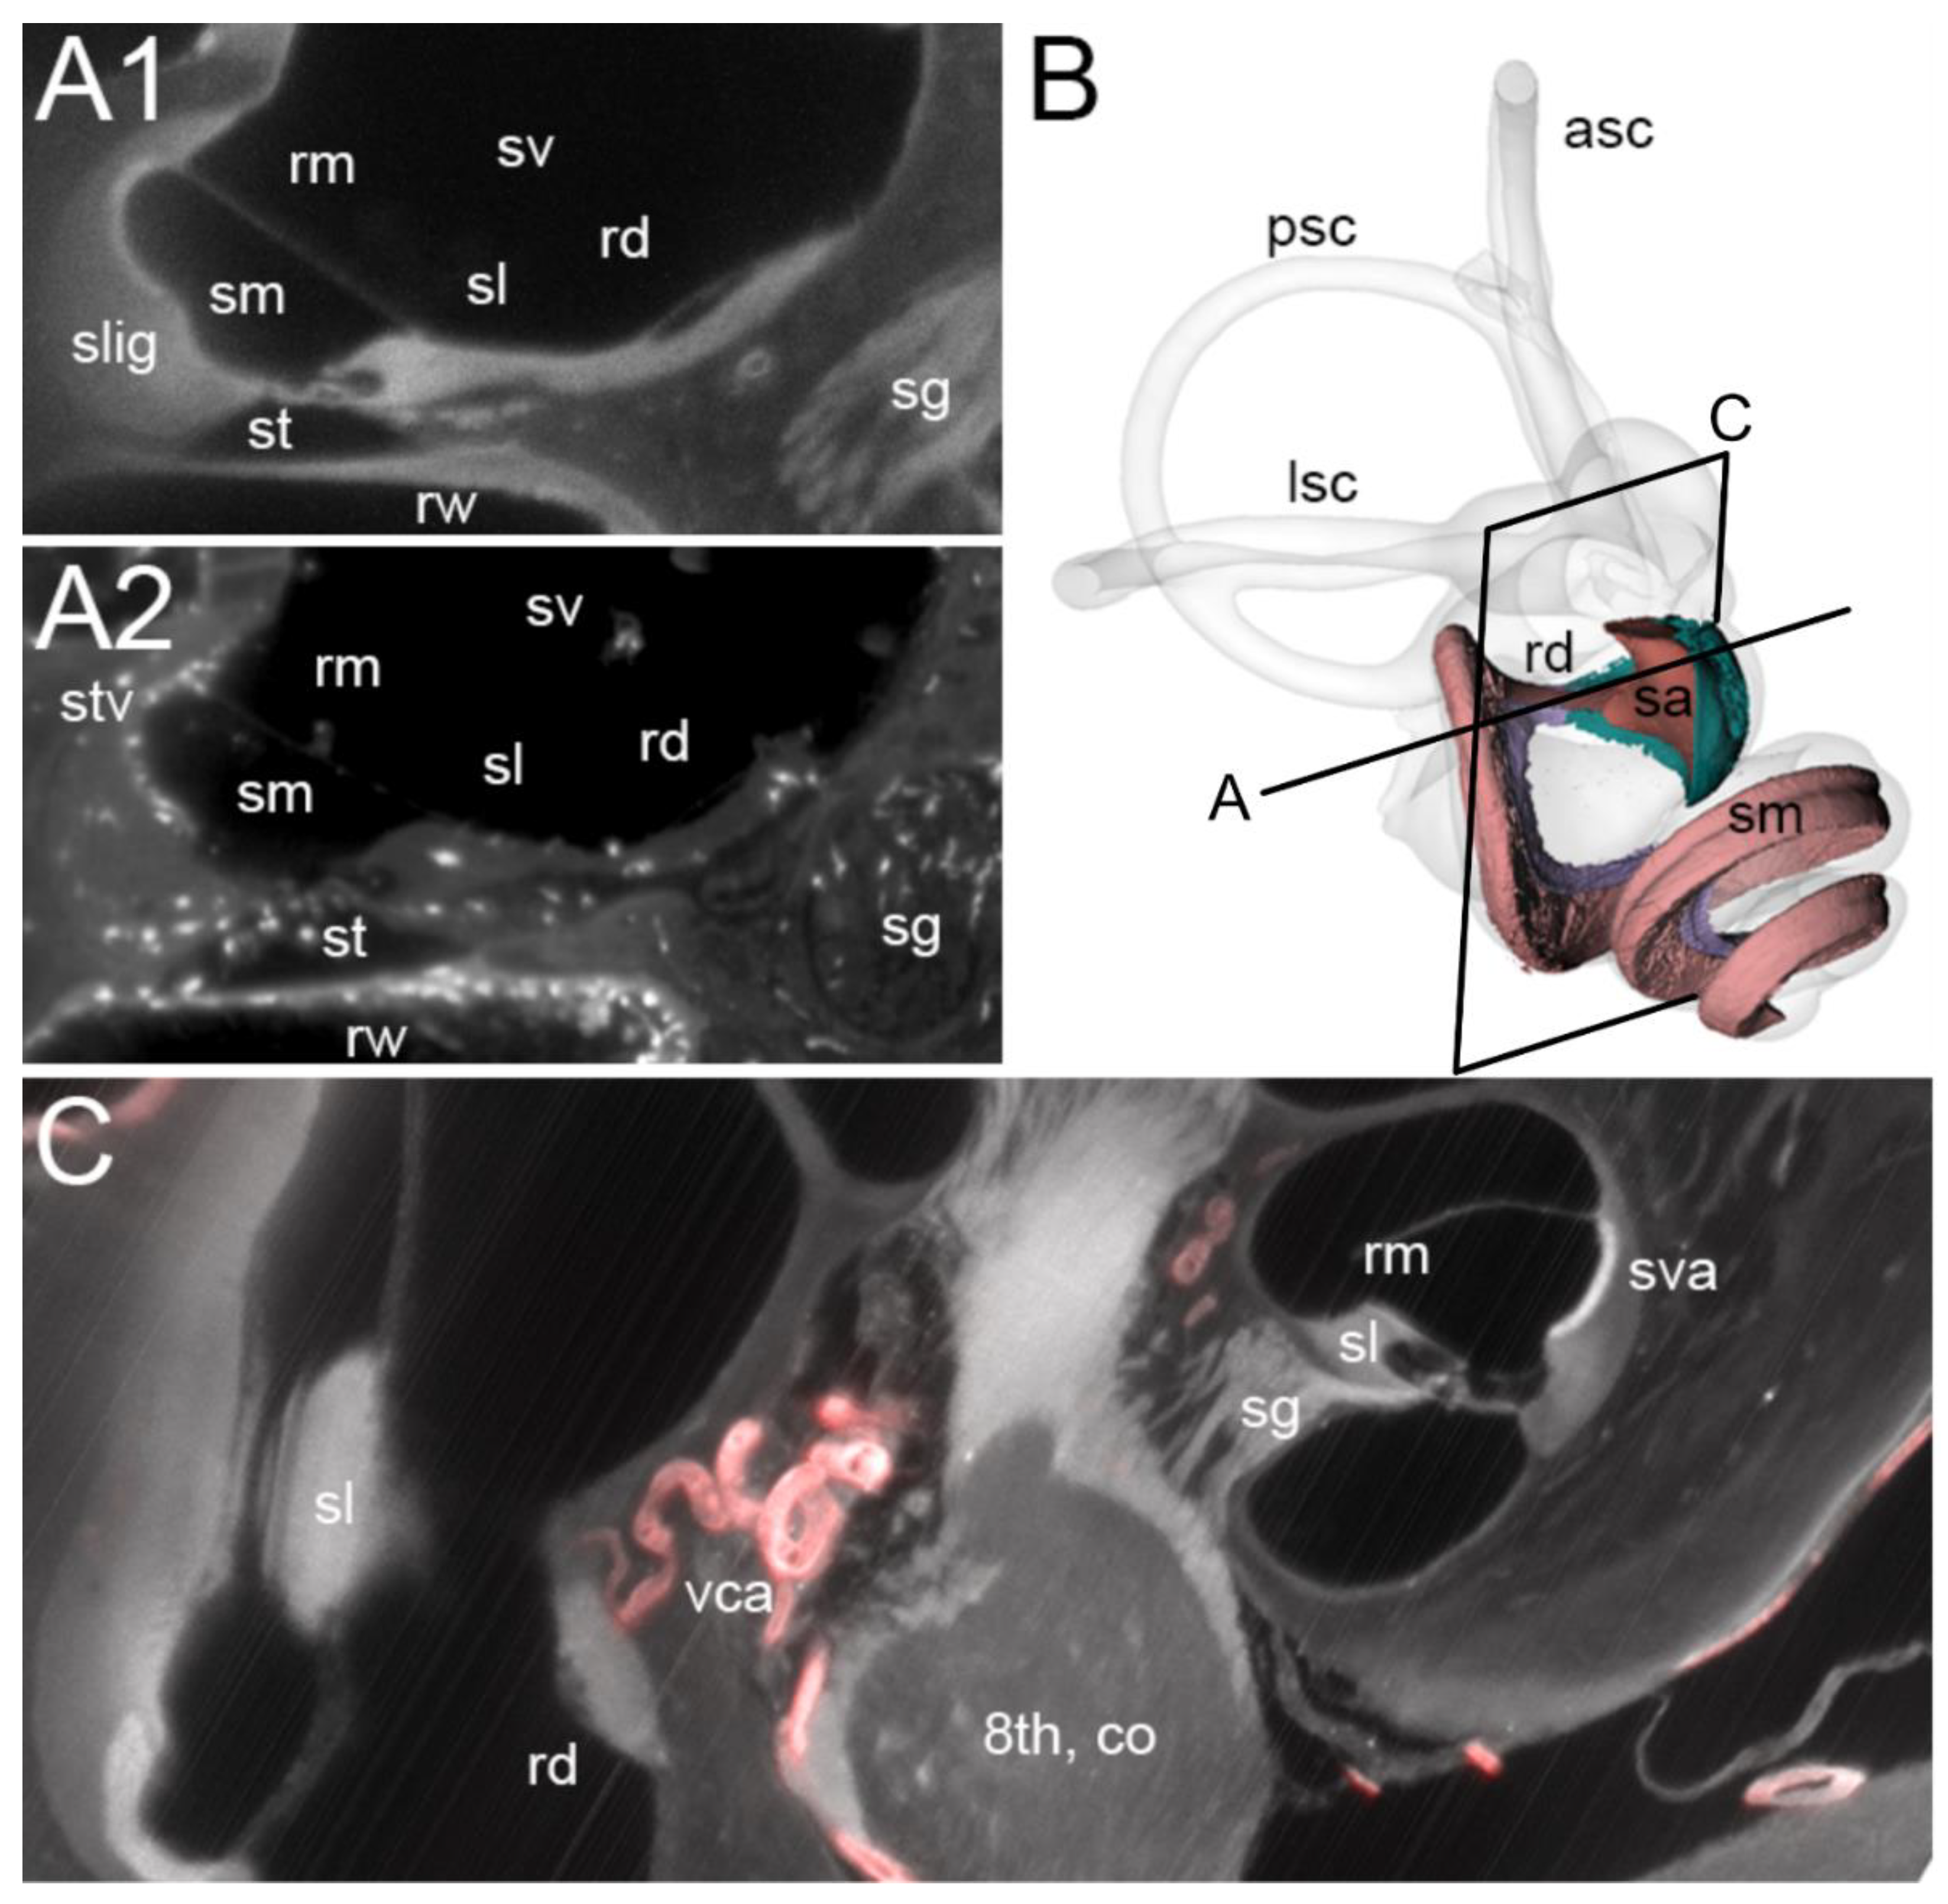
Figure 2.
Figure 2. Volumetric reconstruction of the vascular network (from ColIV labelling) in the spiral limbus and RD. The connective tissue below the RD, shown in a darker color, displays no clear junction with the spiral limbus, (the separation line was arbitrarily added following the RD). The capillary network branched from the VCA below the RD; in a higher position within the cochlear duct, the spiral artery in the modiolus fed into the same anastomosed network (not shown). Models on the right are turned 180 degrees versus models on the left. Models at the bottom are semi-transparent to show the whole capillary network. Saccule and cochlear scala media are not shown for clarity. Abbreviations: rd: reuniting duct; rdc: RD connective tissue; sl: spiral limbus; vca: vestibulocochlear artery.
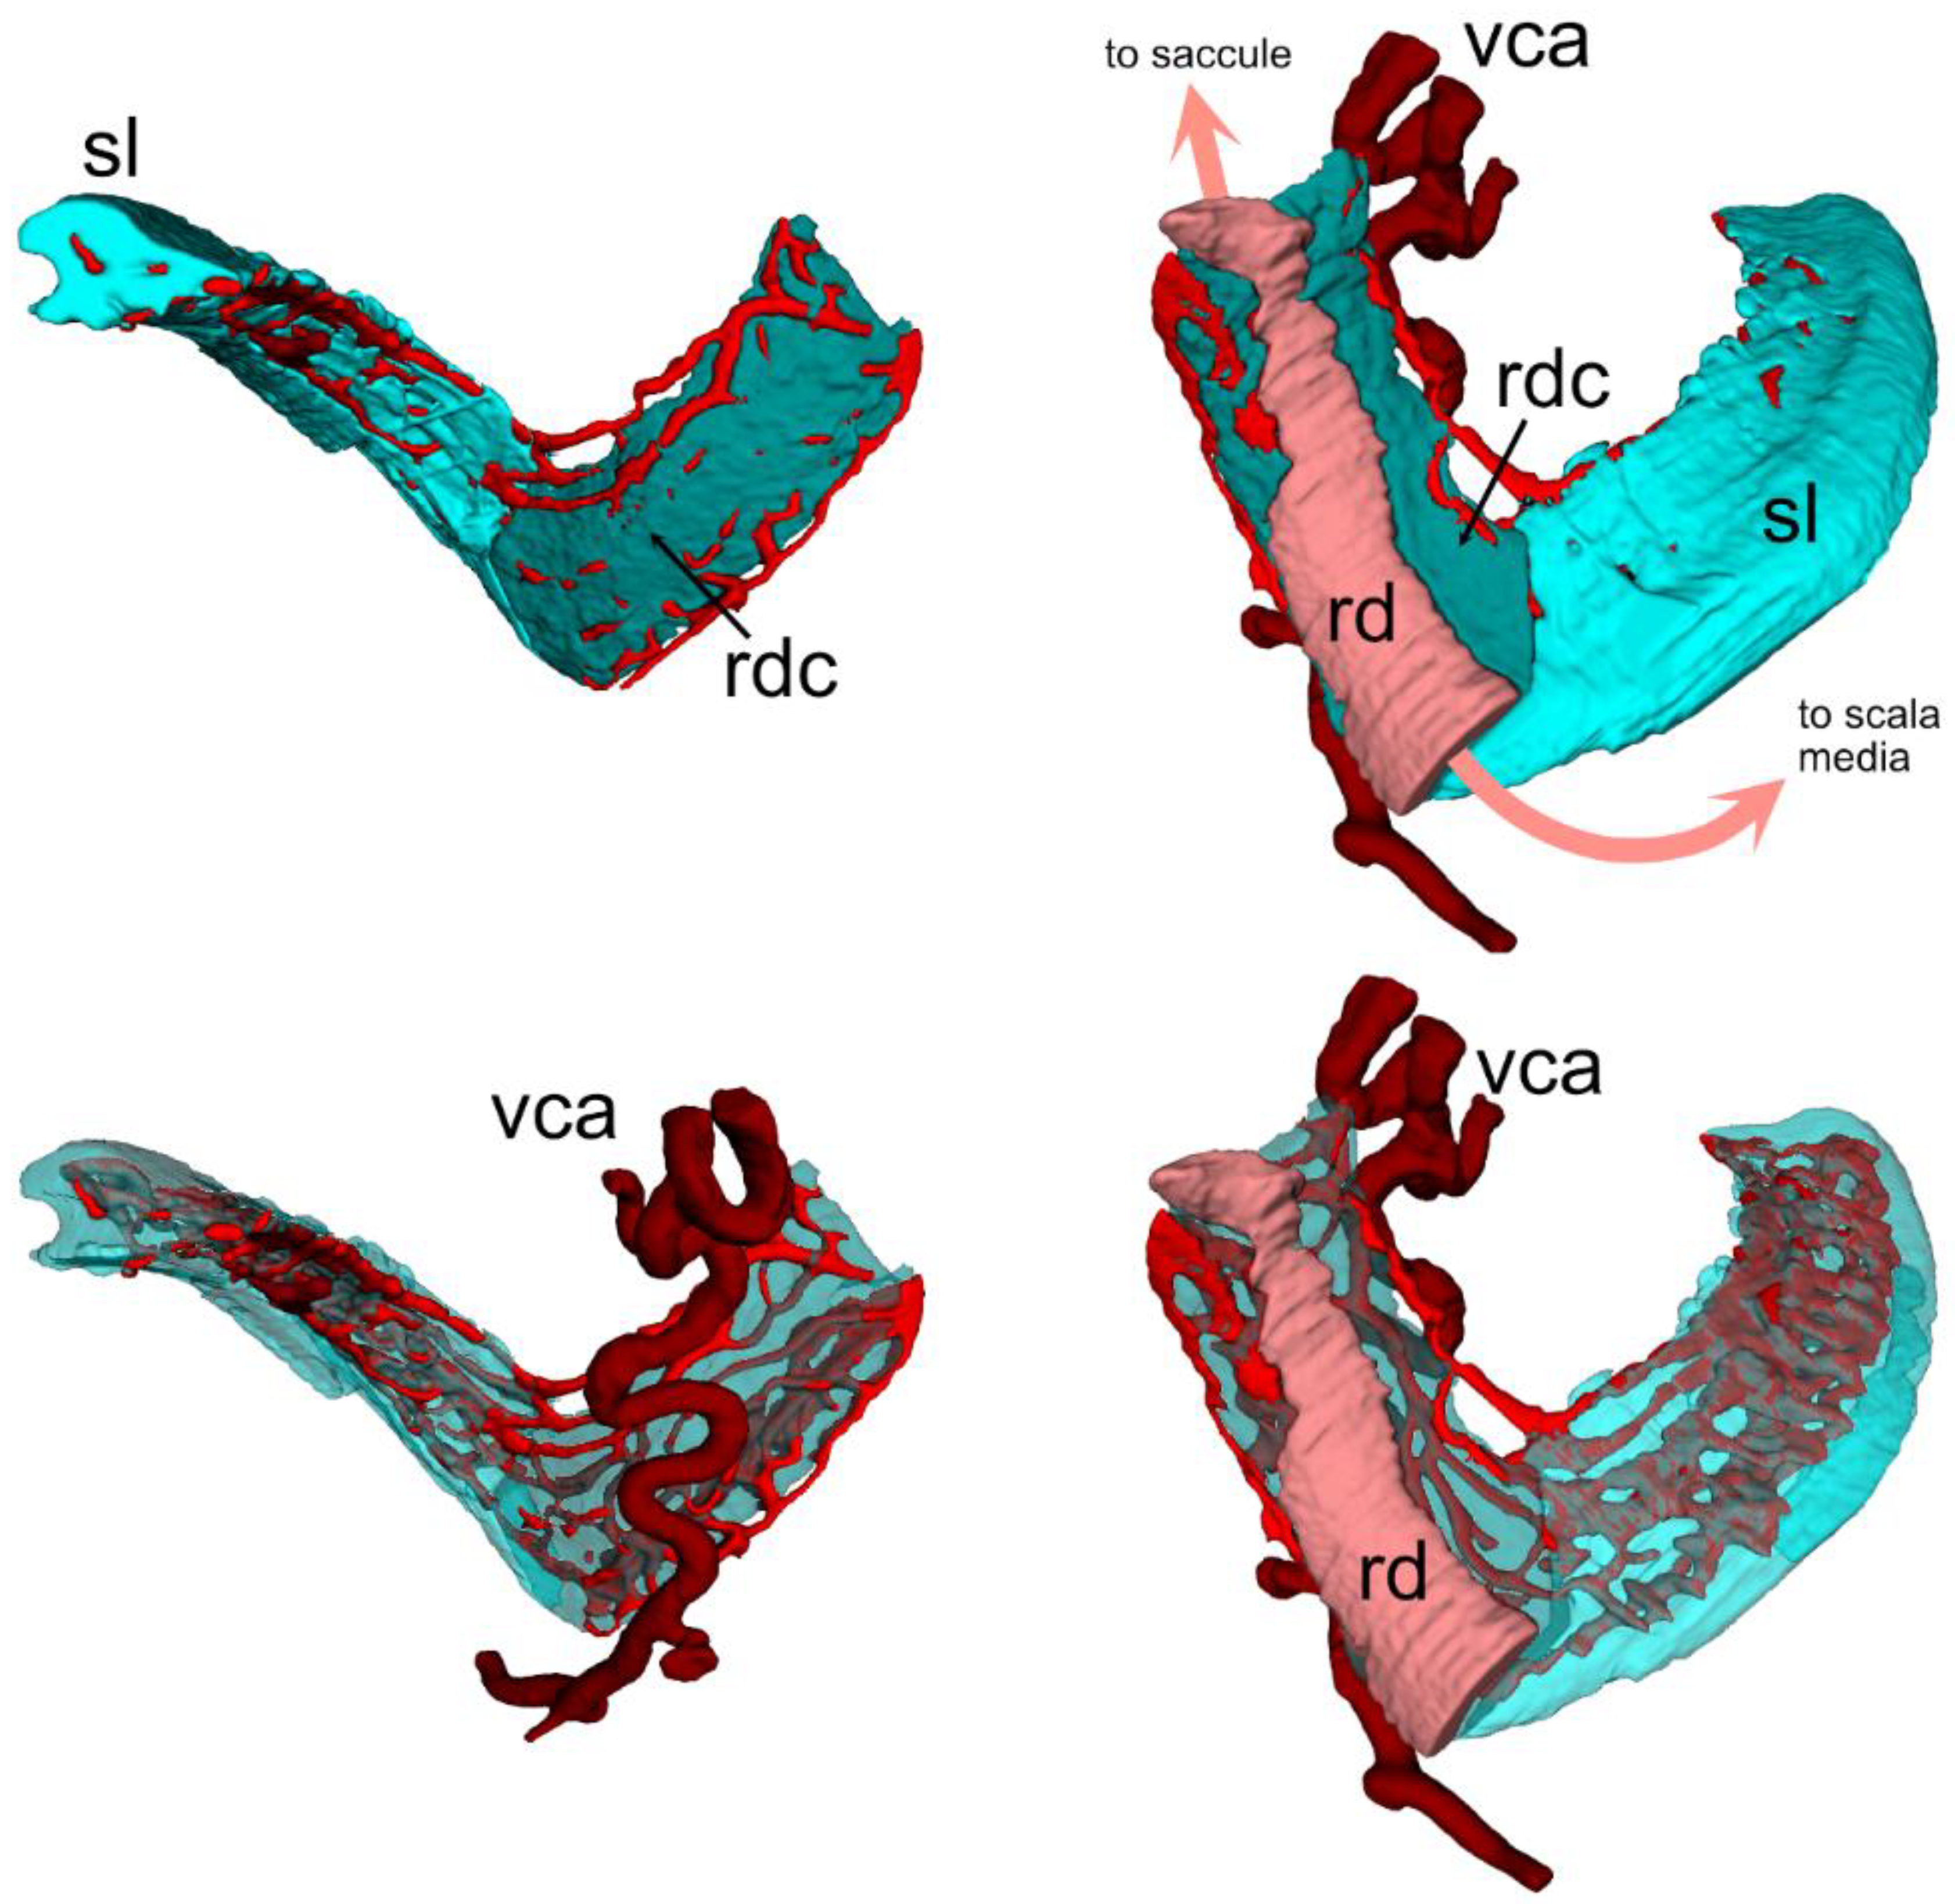
Figure 3.
Vascular network and macrophages associated to inner ear ducts. A1: maximal intensity projection of a 200 µm stack from ColIV signal showing the saccule vascular network. A2: volumetric reconstruction of the structures shown in A1 (the spiral limbus was removed in A1 for clarity). The VCA is visible as a tortuous vessel associated to the RD , whereas the ED received venous inflow. The two ducts are therefore different regarding their vascular surrounding. B: Volumetric reconstruction of macrophage populations associated to vessels, RD and proximal parts of the ED. Abbreviations: esm: endolymphatic sinus macrophages; rdm: RD macrophages; sacm: saccular macrophages; vcatm: vestibulocochlear artery (tortuous) macrophages; vcasm: vestibulocochlear artery (straight) macrophages; vvam: vein of the vestibular aqueduct macrophages..
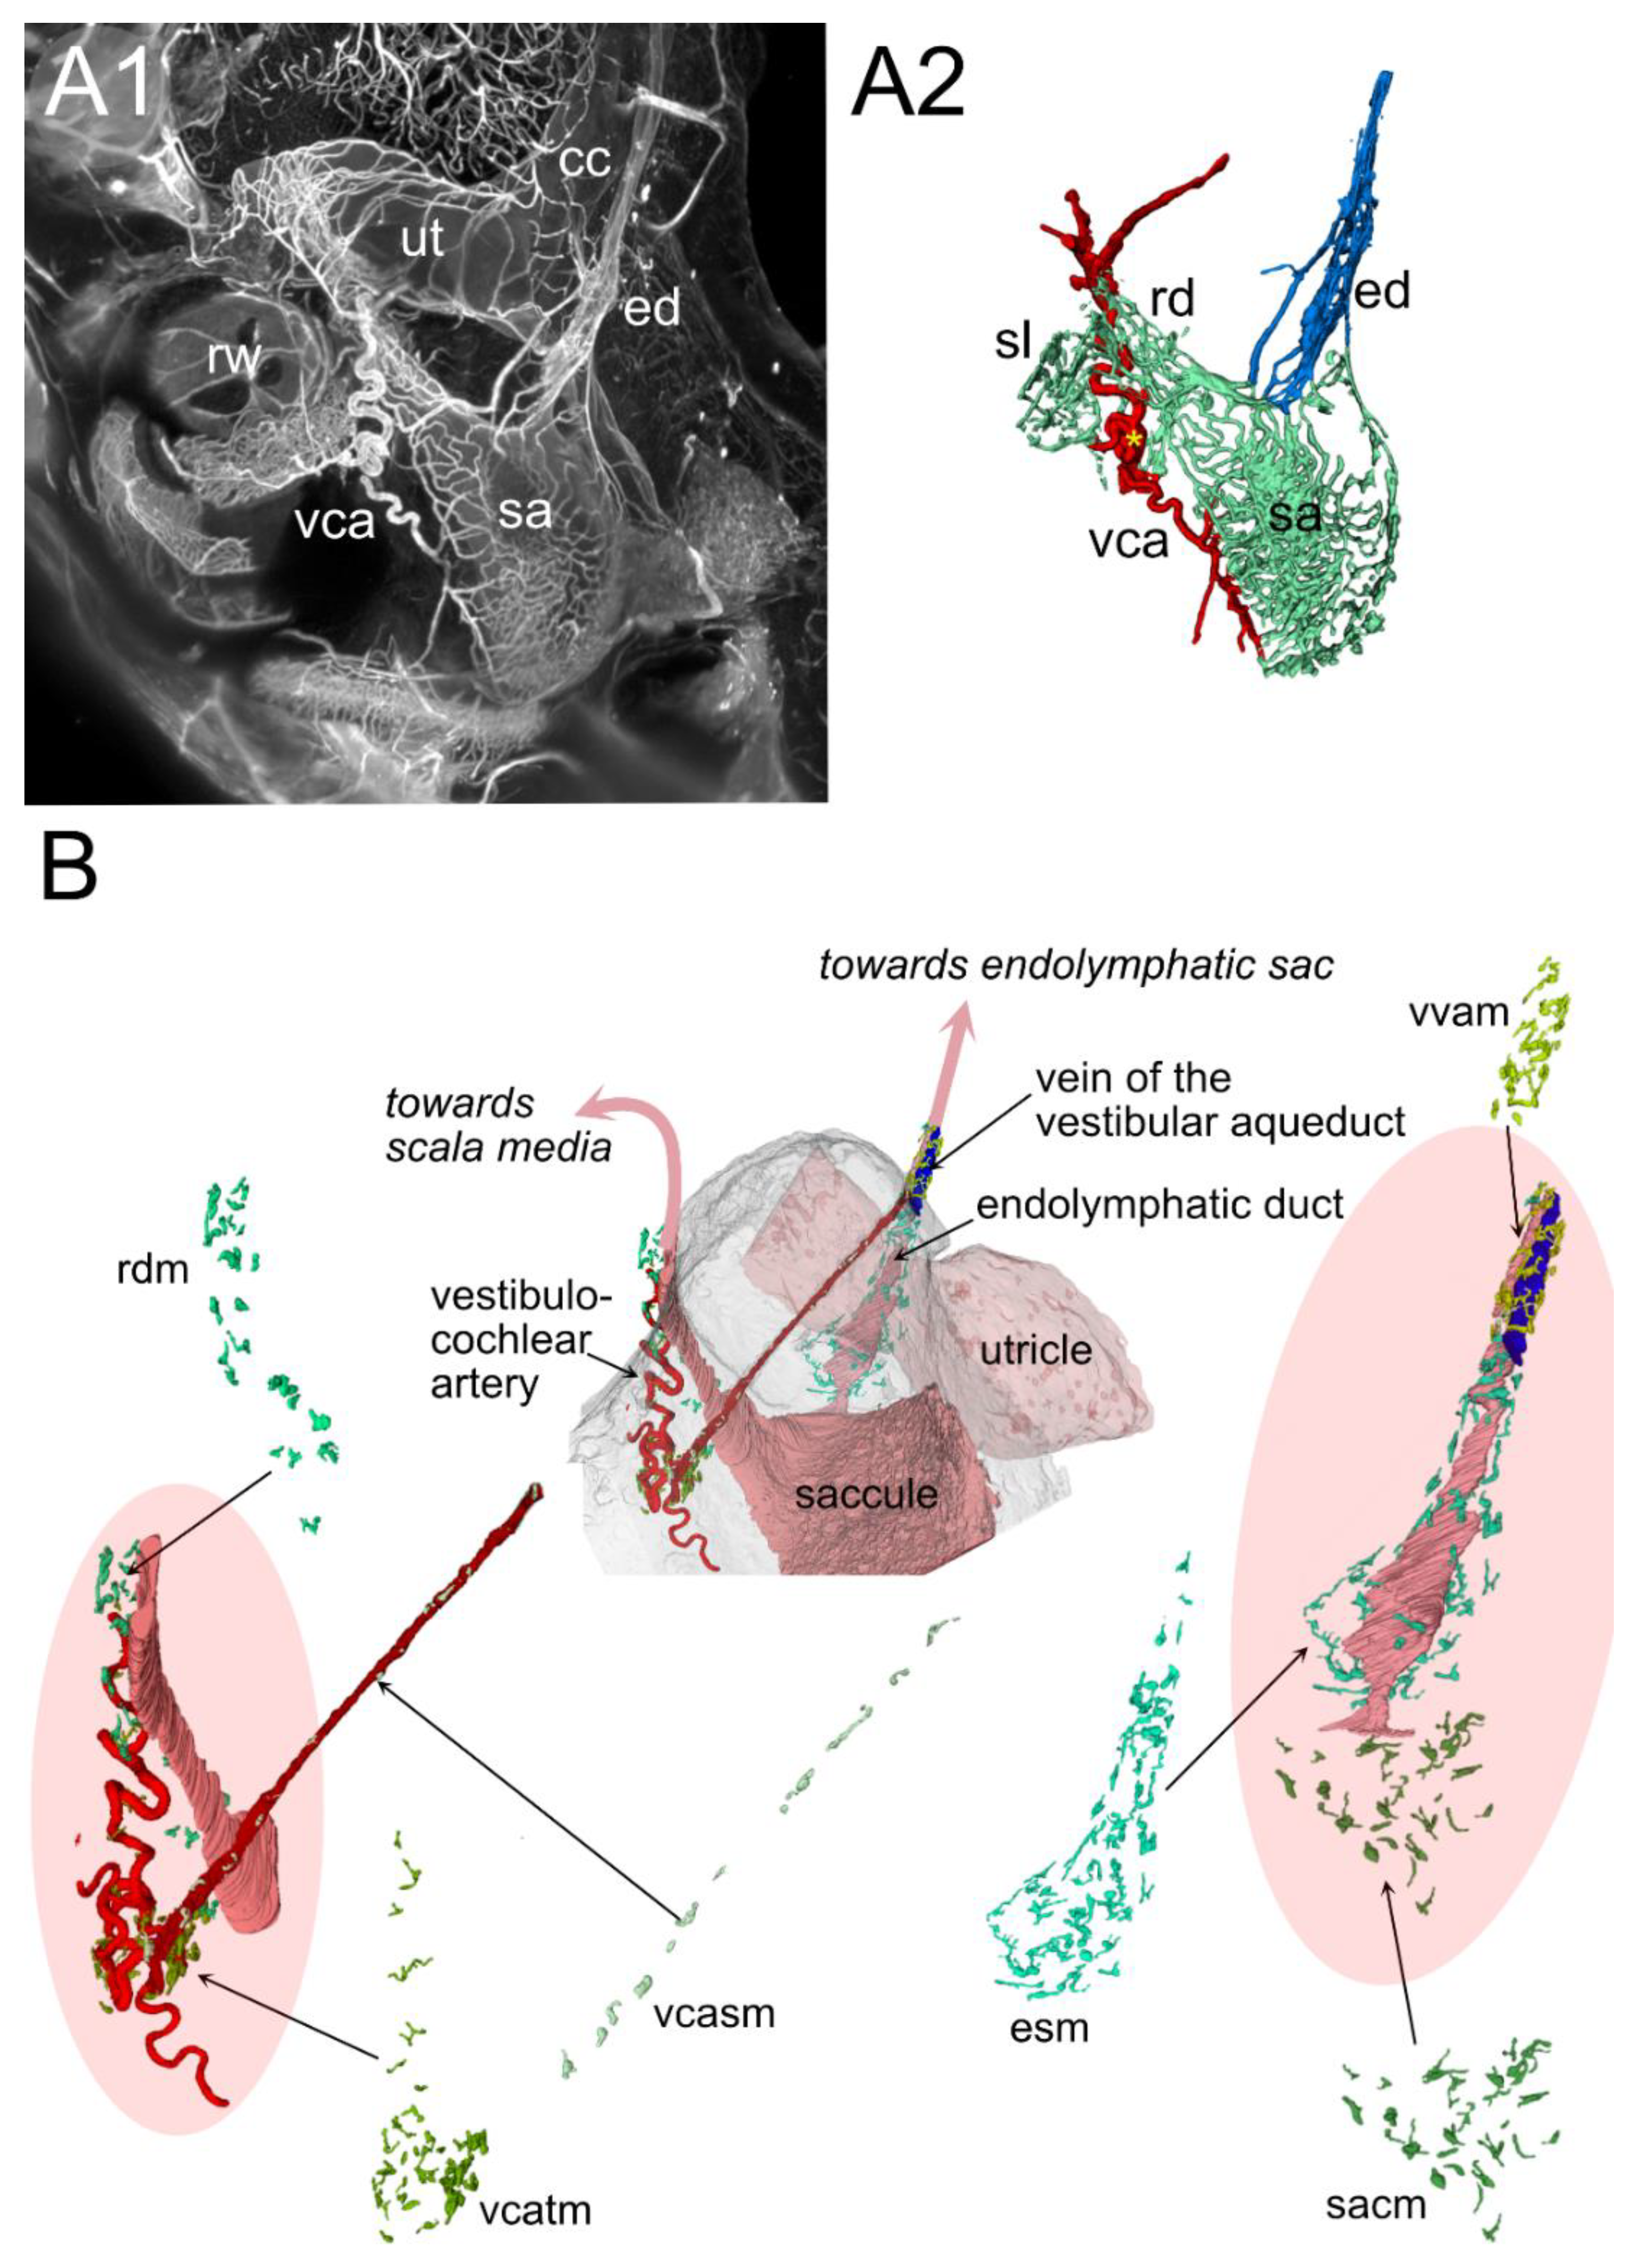
Figure 4.
Figure 4. ED. A: Volumetric reconstruction of the vestibular aqueduct and related macrophages. Three populations are visible, associated to the ED (red), vestibular aqueduct vein (green), and vestibular aqueduct connective tissue (yellow), respectively. Two optical sections are shown with segmentations, at the level of the duct isthmus (bottom section) and proximal sac (top section). B: volumetric reconstruction of the endolymphatic sinus, displayed from the utricular face to show Bast’s valve (visible as a fold in the sinus). The black line indicates the plane of optical sections indicated above. Left section: autofluorescence, showing the curled sinus at Bast’s valve. Right section: Iba1 signal, showing the presence of macrophages directly at the valve.
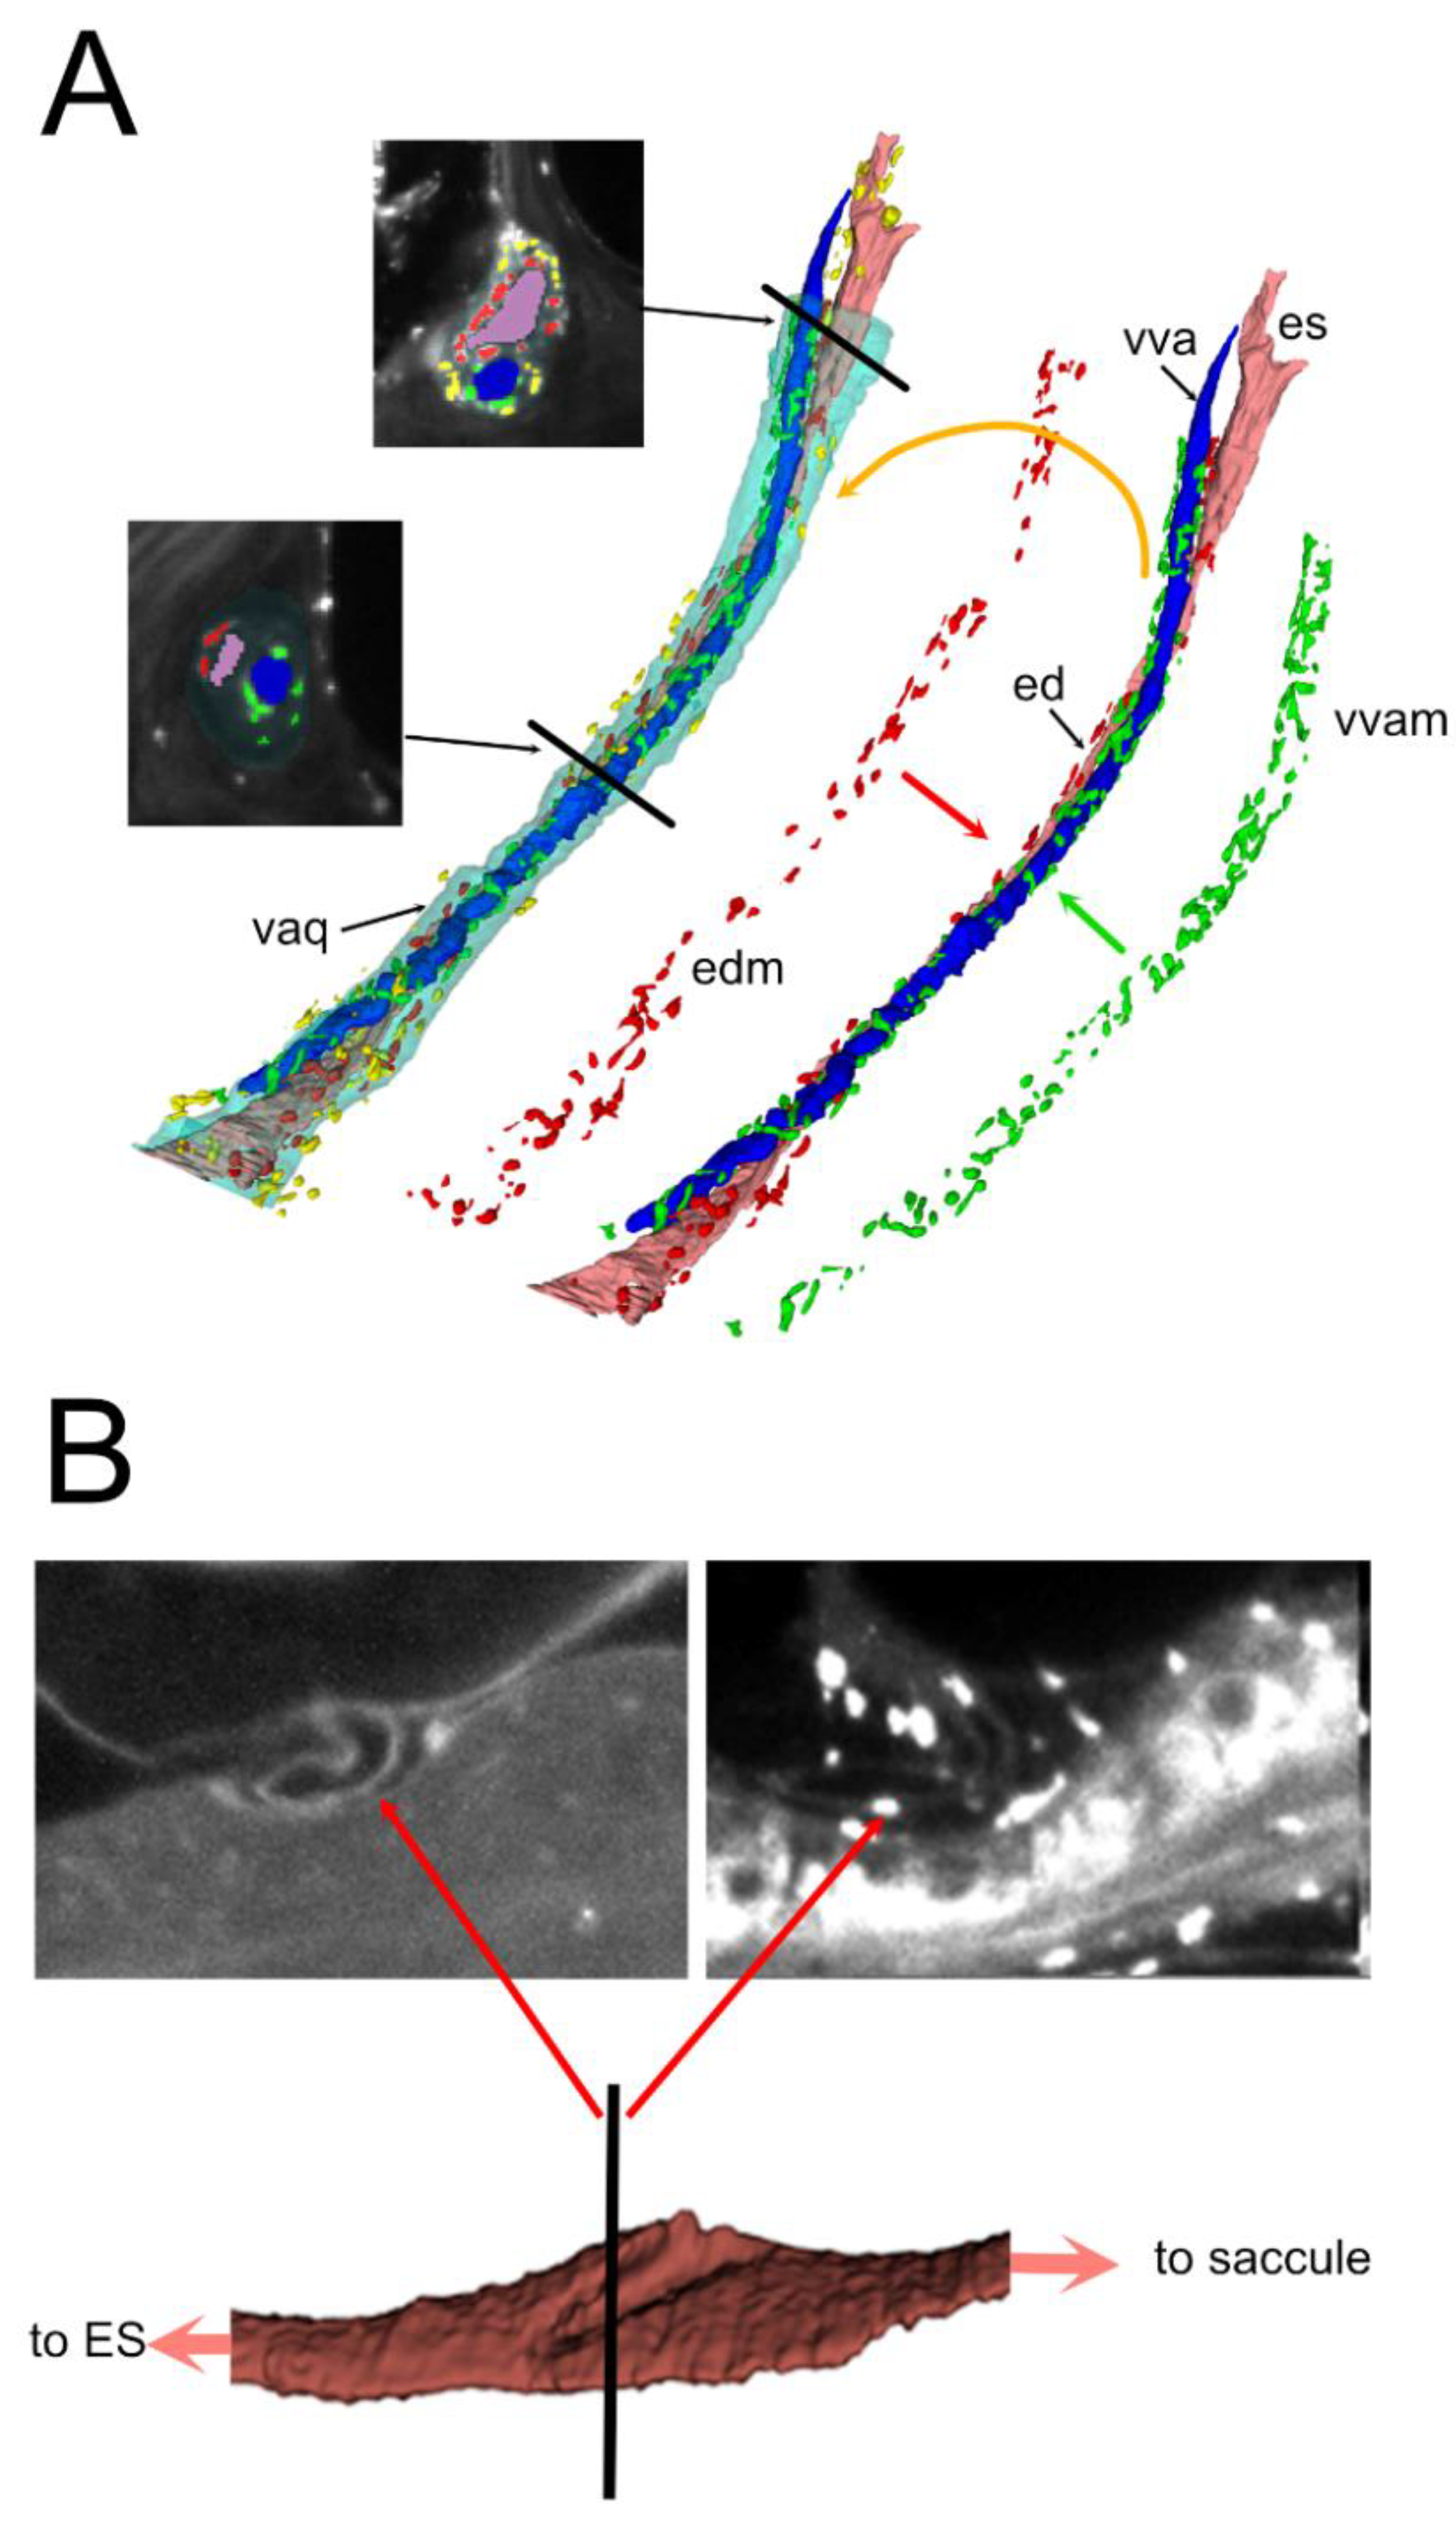
Figure 5.
Macrophage features. A. Macrophage solidity distribution. The global population was best fit by the sum of three gaussians, and both the population around the RD and ED by two gaussians. Best fit parameters were: Total A1: 18.5±4.2, µ1: 0.33±0.02, σ1: 0.1±0.02; A2: 24.9±1.8, µ2: 0.62±0.03, σ1: 0.15±0.03; A3: 24.9±20, µ3: 0.81±0.01, σ1: 0.02±0.02. ED A1: 9.5±15.0, µ1: 0.31±0.03, σ1: 0.1±0.07; A2: 12.2±5.4, µ2: 0.52±0.2, σ1: 0.18±0.11. RD A1: 14.1±1.3, µ1: 0.64±0.03, σ1: 0.18±0.02; A2: 25.9±31.9, µ2: 0.8±0.01, σ1: 0.02±0.02. B: Comparison between macrophages with high solidity (0.84, left) and low solidity (0.12, right)..
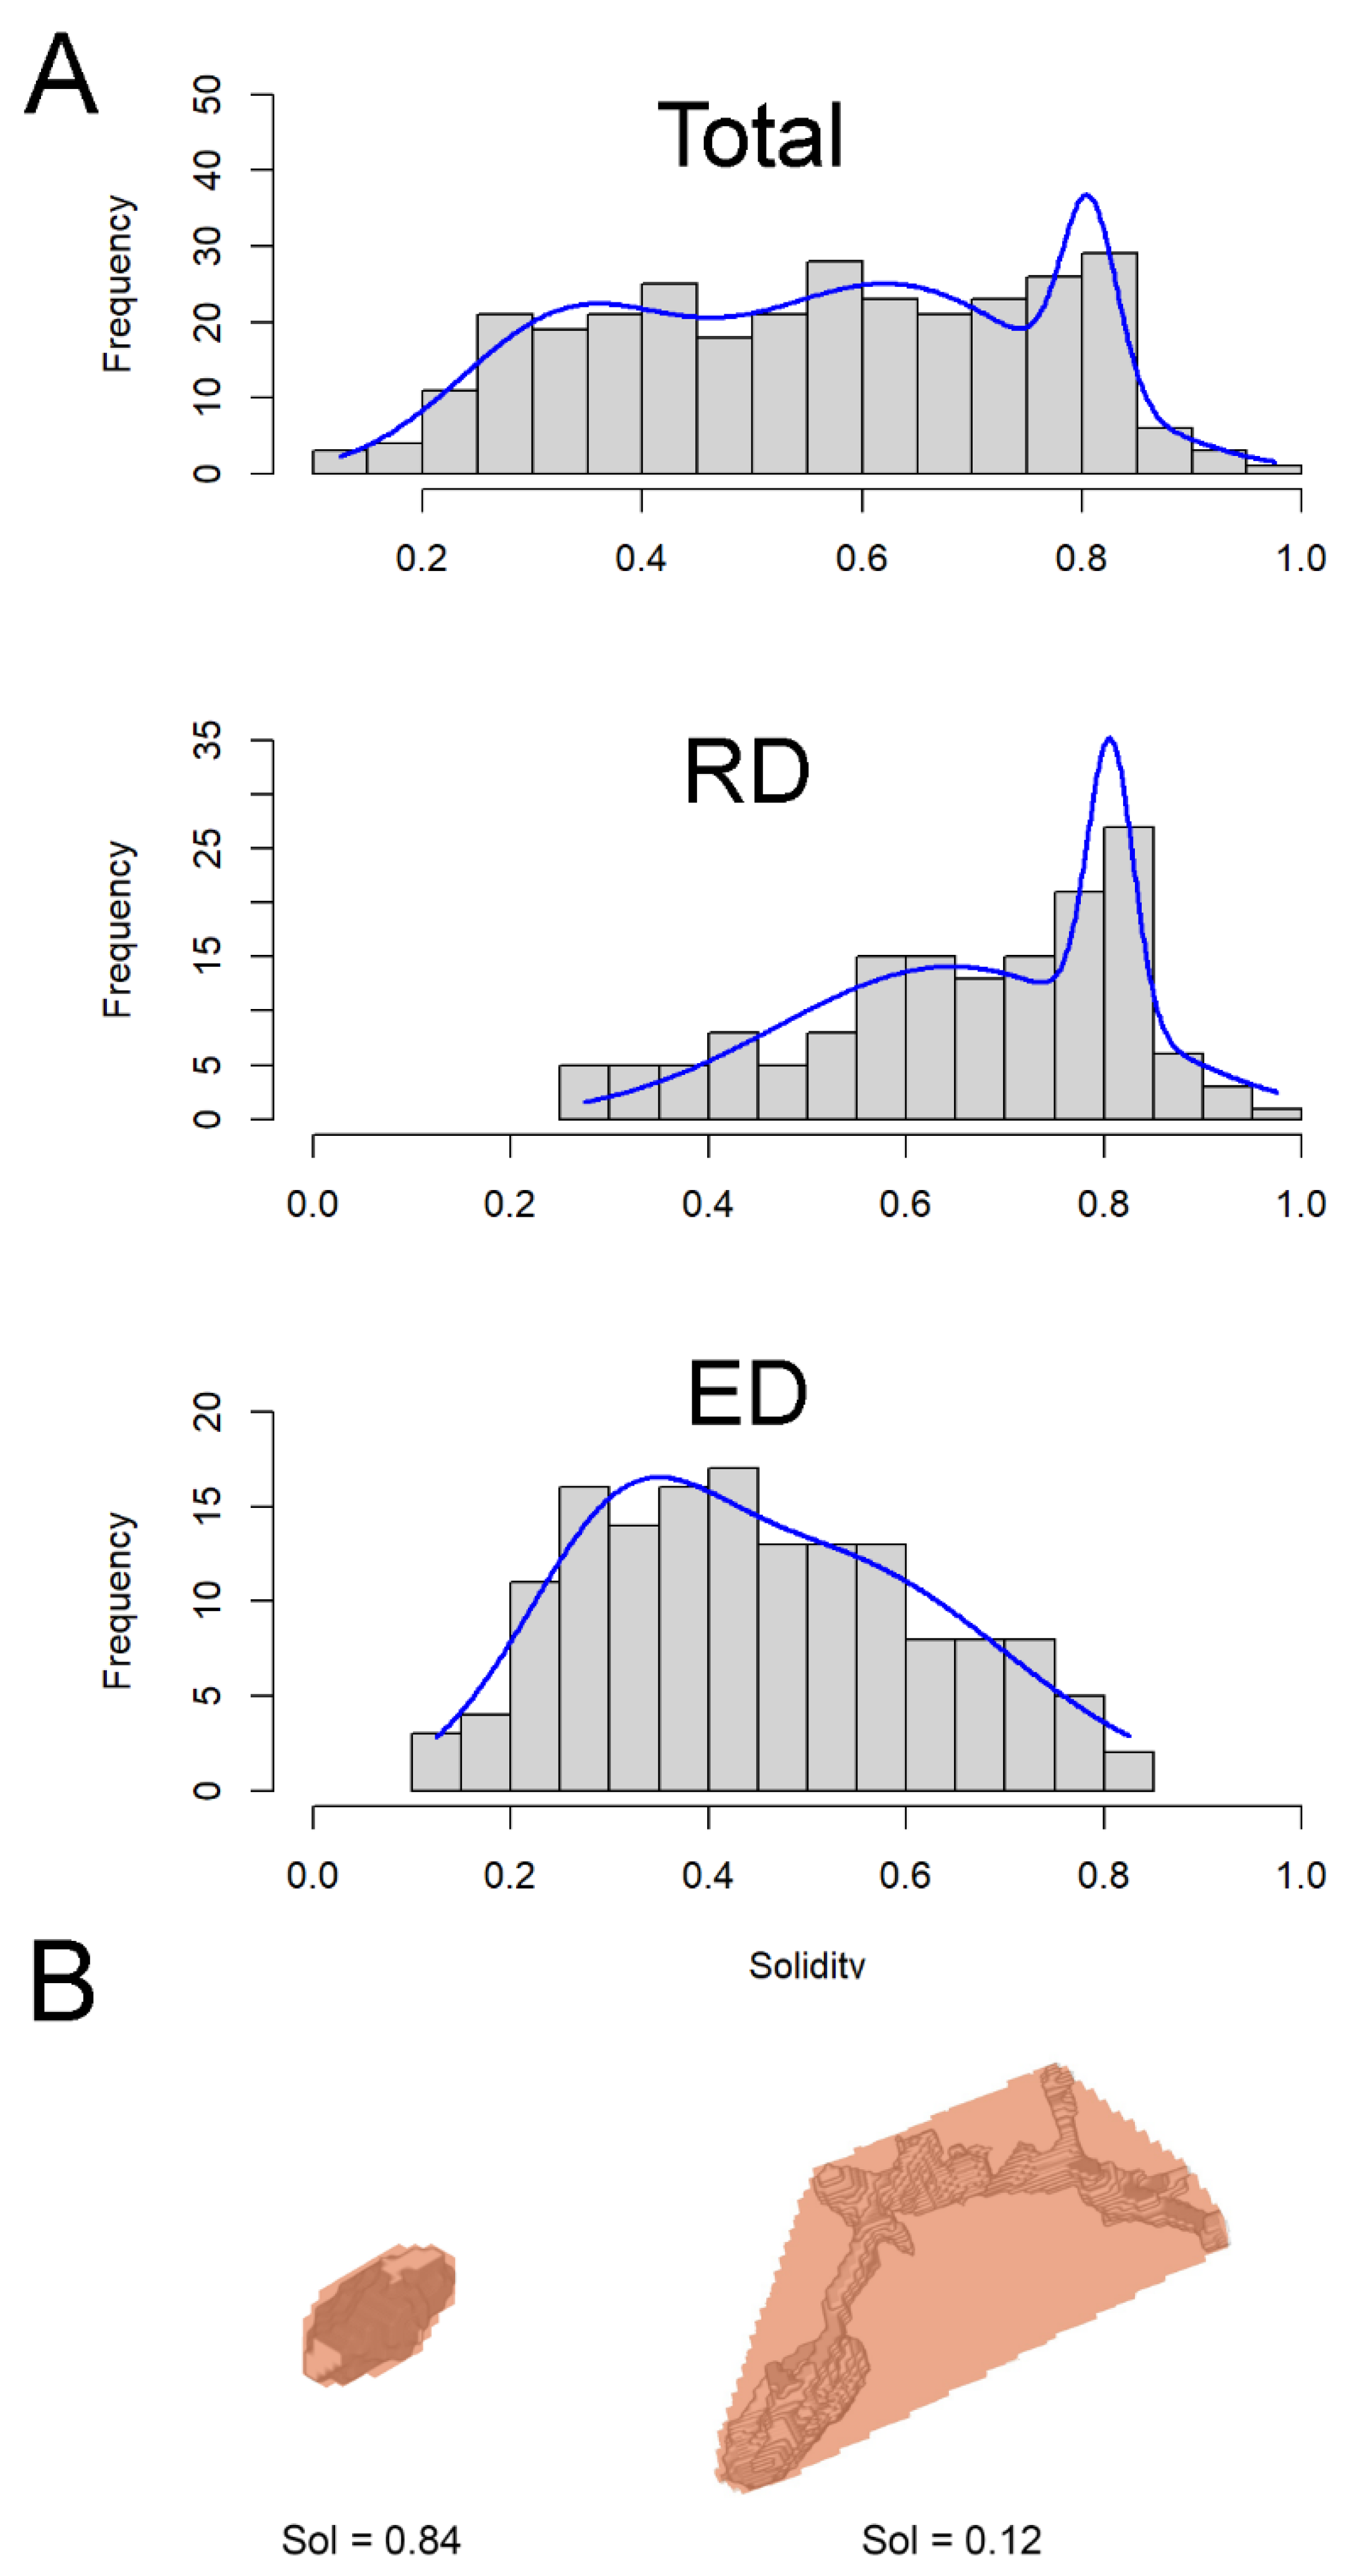

Table 1.
List of temporal bone samples.
| Sample | Age(Days) | Sex | Signal | Voxel Size (µm) |
| R1a,b | 111 | F | Auto, Iba-1 | 2 |
| R2 | 95 | F | Auto, Iba-1 | 2 |
| R3 | 494 | M | Auto, SMA | 3.26 |
| R4 | 79 | M | ColIV | 4.08 |
Table 2.
Macrophage population sizes.
| Region | Macrophage Number |
| All | 311 |
| Endolymphatic sinus | 56 |
| Endolymphatic duct | 54 |
| Reuniting duct | 18 |
| Vestibulocochlear artery, tortuous | 33 |
| Vestibulocochlear artery, straight | 15 |
| Vestibular aqueduct vein | 68 |
| Vestibular aqueduct | 67 |
Disclaimer/Publisher’s Note: The statements, opinions and data contained in all publications are solely those of the individual author(s) and contributor(s) and not of MDPI and/or the editor(s). MDPI and/or the editor(s) disclaim responsibility for any injury to people or property resulting from any ideas, methods, instructions or products referred to in the content. |
© 2025 by the authors. Licensee MDPI, Basel, Switzerland. This article is an open access article distributed under the terms and conditions of the Creative Commons Attribution (CC BY) license (http://creativecommons.org/licenses/by/4.0/).
Copyright: This open access article is published under a Creative Commons CC BY 4.0 license, which permit the free download, distribution, and reuse, provided that the author and preprint are cited in any reuse.


