Submitted:
10 August 2025
Posted:
12 August 2025
You are already at the latest version
Abstract
Background: Centrosome amplification, a hallmark of cell cycle dysregulation, drives carcinogenesis through aneuploidy induction and invasive phenotype acquisition. In pancreatic adenocarcinoma– a malignancy characterized by profound genomic instability – the molecular circuitry of centrosome amplification remains enigmatic. Critical gaps persist in understanding its spatiotemporal dynamics in tumor microenvironment remodeling and therapy resistance. Methods: This study integrated centrosome amplification-related genes from TCGA and Genecards, established a prognostic risk model through univariate Cox regression-LASSO penalized Cox regression-multivariate Cox regression analyses, and validated it using GEO datasets. Single-cell sequencing analyses dissected transcriptional heterogeneity and intercellular communication networks, while spatially resolved transcriptomics unveiled spatiotemporal expression patterns and molecular regulatory mechanisms of core genes. With further experimental validation via PCR analysis of patient-derived tissue samples confirming key gene expression patterns. Results: This study identified 23 centrosome amplification-related prognostic genes in pancreatic adenocarcinoma, establishing IFI27, KIF20A, KLK10, SPINK7, and TOP2A as highly specific diagnostic and prognostic biomarkers. The constructed signature was established as an independent prognostic indicator correlating with aggressive clinicopathological characteristics and chemoresistance. Mechanistically linked to enhanced DNA repair capacity and accelerated cell cycle progression, also synergizes with KRAS mutational profiles. Tumor microenvironment analysis revealed significant associations with immunosuppressive. Single-cell resolution demonstrated cellular specificity of IFI27/KLK10 in ductal epithelial cells and fibroblasts, with intercellular communication networks exhibiting multidimensional regulatory features. Spatially resolved transcriptomics delineated tumor-region-specific expression patterns of core genes. While PCR validation on matched tumor/normal tissues confirmed significant differential expression of IFI27, KIF20A, KLK10, and TOP2A. Conclusions: This study deciphers the multidimensional clinic-molecular network orchestrated by centrosome amplification in PDAC, revealing its dual-pathogenic mechanism in fueling tumor aggressiveness through coordinated induction of genomic instability and immunosuppressive microenvironment reprogramming. These findings establish a translational framework for developing centrosome dynamics-based prognostic stratification and molecularly targeted therapeutic strategies.
Keywords:
pancreatic cancer
; centrosome amplification
; prognosis
; diagnosis
; tumor microenvironment
; drug sensitivity
1. Introduction
Pancreatic cancer is among the most malignant tumors of the digestive system, and surgical resection remains the preferred therapeutic strategy for pancreatic adenocarcinoma (PAAD). Due to the extremely poor prognosis of this invasive disease, compounded by the fact that most patients are diagnosed at an advanced stage, only 15–20% of patients are eligible for surgical intervention at diagnosis, leading to one-year and five-year survival rates of 24% and 9%, respectively [1]. In recent years, the combination of first-line chemotherapy regimens such as FOLFIRINOX with agents including nivolumab (a PD-1 inhibitor) and nimotuzumab (an EGFR inhibitor) has modestly improved the survival rate of patients with PAAD. However, the overall therapeutic efficacy remains unsatisfactory [2,3]. Consequently, there is an urgent need to develop new therapeutic targets and establish prognostic models capable of evaluating patient outcomes to guide clinical decision-making.
The centrosome is the primary microtubule (MT) organizing center in animal cells, playing a pivotal role in cell polarity, migration, and cell division. It consists of a pair of orthogonally oriented centrioles that replicate during the S phase of the cell cycle and are equally distributed to the two daughter cells during mitosis, thereby forming the two poles of the mitotic spindle [4]. Over a century ago, Boveri first proposed that an increase in the number of centrosomes could lead to tumorigenesis [5]. In recent years, centrosome amplification—an aberrant increase in the number of centrosomes within a cell—has been recognized as a hallmark of cancer [6]. However, the specific factors that induce centrosome amplification and how they influence tumor development remain to be fully elucidated. Existing research indicates that alterations in the proteins involved in centrosome replication can trigger abnormal centrosome amplification. For instance, dysregulation of PLK4 disrupts centriole replication and causes abnormal numbers of centrosomes; Mittal K et al. identified a hypoxia-inducible factor 1α (HIF1α)/PLK4 axis that drives centrosome amplification in cancer cells, promoting cell migration and invasion [7]. Additionally, the cell division cycle protein Cdc6, which interacts with Sas-6 under Plk4 regulation, suppresses excessive centrosome replication. One study demonstrated that knocking down Cdc6 promotes apoptotic cell death, accompanied by the activation of calpain-1 and caspase-9; these processes play crucial roles in the proliferation, cell cycle progression, and death of pancreatic cancer cells [8]. Nevertheless, most previous work has focused on the functions of individual genes rather than on a global transcriptomic analysis of centrosome amplification–related genes (CARGs). Therefore, a systematic investigation of CARGs in PAAD is warranted to gain novel insights into the underlying mechanisms of tumorigenesis and to identify new targets for cancer prevention and therapy.
In this study, we performed a comprehensive analysis of CARGs in 177 PAAD patients from The Cancer Genome Atlas (TCGA) dataset. We initially retrieved 724 Centrosome amplification-related genes from the GeneCards database. Of these, 23 showed elevated expression in PAAD tissues. Subsequently, using univariate Cox, LASSO-penalized Cox regression and multivariate Cox, we identified a five-gene signature (IFI27, KIF20A, KLK10, SPINK7, and TOP2A) from these 23 CARGs. We next investigated the associations between this centrosome amplification–related prognostic signature and immune infiltration, pathway enrichment, genetic mutations, and chemosensitivity in pancreatic cancer. Single-cell RNA sequencing data were utilized to investigate the expression patterns of the 5-gene signature across different pancreatic cell types and their intricate intercellular communication networks. Spatial transcriptomic analysis revealed the spatial distribution and molecular biological interactions associated with the signature. Finally, qPCR validation was performed using surgical specimens of pancreatic cancer.
2. Materials and Methods
2.1. Data Sources
We collected clinical and pathological information (including age, sex, tumor grade, tumor stage, tumor type, tumor location, TNM stage, survival time, and vital status) for 177 pancreatic cancer (PAAD) tissue samples retrieved from The Cancer Genome Atlas (TCGA) database (originally 178 samples, with one excluded due to missing survival data). We also obtained the corresponding transcriptome sequencing data (seq-TPM, seq-count) for these 177 PAAD samples (2025.03.22). In addition, transcriptome sequencing data (seq-TPM, seq-count) for 180 normal pancreatic tissues were downloaded from the GTEx database, and all transcriptomic data underwent normalization. Furthermore, GSE183795 and GSE62452 from the GEO database were selected as validation cohorts, and GSE155698 (comprising single-cell RNA sequencing [scRNA-seq] data from 10 PAAD tumor samples) was used for single-cell analysis. GSE274557(spatial transcriptomics data)was used for spatial transcriptomic analysis.
2.2. Methods
2.2.1. Differential Gene Expression Analysis Between PAAD and Non-Tumor Tissues and Identification of Centrosome Amplification–Related Differential Genes
To identify transcriptional differences between PAAD and non-tumor tissues, we downloaded 177 PAAD tumor samples from The Cancer Genome Atlas (TCGA) database (https://www.cancer.gov/ccg/research/genome-sequencing/tcga) and 180 normal pancreatic tissue samples from the Genotype-Tissue Expression (GTEx) database (https://gtexportal.org/home/). Using the DESeq2 package in R, we screened for differentially expressed genes (DEGs) between tumor and non-tumor samples, applying the thresholds |fold change| > 1.5 and adjusted p < 0.05. The ggplot package was used to visualize these DEGs. From GeneCards (https://www.genecards.org/, accessed on March 22, 2025), we retrieved 739 centrosome amplification–related genes. We then used the VennDiagram package in R to identify and visualize overlapping genes between the PAAD DEGs and the centrosome amplification–related gene set. Ultimately, 23 genes that were both upregulated in PAAD and associated with centrosome amplification were selected for subsequent analyses.
2.2.2. Construction and Validation of a Prognostic Signature Based on Centrosome Amplification–Related Genes
To construct a prognostic model based on the aforementioned 23 CARGs, we first employed a univariate Cox proportional hazards model to identify prognostic-related genes (PRGs) among the CARGs, with a p-value < 0.05 considered statistically significant. We then performed least absolute shrinkage and selection operator (LASSO) regression to minimize the risk of overfitting and used the “glmnet” package in R to select the most significant survival-related CARGs in PAAD. Subsequently, a multivariate Cox regression analysis was conducted to determine the coefficients (β) of each gene ultimately included in the prognostic model. The following formula was used to calculate each patient’s risk score in the TCGA dataset:
Risk Score = βmRNA 1 ×Expression of mRNA 1 + βmRNA 2 ×Expression of mRNA 2 + …+βmRNA n ×Expression of mRNA n
Using this risk prediction model, we calculated the risk score for each patient. All patients in the TCGA-PAAD dataset were then classified into low-risk or high-risk groups based on the median risk score. Next, we applied the “survival” and “survminer” packages in R to generate Kaplan-Meier survival curves and perform log-rank tests, evaluating the survival differences between the two groups. Additionally, receiver operating characteristic (ROC) curves were generated, and the area under the ROC curve (AUC) was determined using the “timeROC” package to assess the sensitivity and specificity of the prognostic model in predicting 2-, 3-, and 5-year survival rates. Furthermore, we downloaded another independent PAAD dataset from GSE78229, GSE62452, and GSE183795 to validate the robustness and effectiveness of the CARG-based prognostic model.
Next, both univariate and multivariate Cox proportional hazards models were employed to assess whether the CARG-based prognostic model demonstrates robust predictive power independent of other clinicopathological characteristics, including age, sex, grade, T stage, M stage, N stage, history of previous malignancy, tumor status at follow-up, tumor location, DCC histological subtype, history of radiotherapy, residual tumor, and history of chronic pancreatitis. Subsequently, a prognostic nomogram was constructed by integrating variables identified in the univariate model. A calibration curve was then generated to evaluate the concordance between the nomogram-predicted survival outcomes and the actual observations.
2.2.3. Identification of Differentially Expressed Genes Between High- and Low-Risk Groups and Functional Enrichment Analysis
To identify the differentially expressed genes (DEGs) between high- and low-risk PAAD patient groups defined by the predictive model, we used DESeq2 with ∣fold-change∣>1|\text{fold-change}| > 1∣fold-change∣>1 and adjusted p < 0.05 as cutoffs. These DEGs (referred to as DEGs 2) were then subjected to Gene Ontology (GO) and Kyoto Encyclopedia of Genes and Genomes (KEGG) enrichment analyses using the ClusterProfiler package to further explore their biological functions. The GO analysis covered cellular components (CC), biological processes (BP), and molecular functions (MF), and the results were recorded accordingly.
To estimate the biological functions and signaling pathways associated with the centrosome amplification–related gene signature, we conducted Gene Set Variation Analysis (GSVA). Specifically, we used the GSVA package to score each patient’s molecular features in the TCGA dataset, employing the gene set h.all.v7.0.symbols.gmth.all.v7.0.symbols.gmth.all.v7.0.symbols.gmt. Differences in pathway activity between the high- and low-risk groups were assessed using the DESeq2 package, and significant pathways (adjusted p<0.05p < 0.05p<0.05) were visualized with the pheatmap and ggpubr packages.
To further analyze the functional enrichment of the DEGs in various biological pathways, we performed Gene Set Enrichment Analysis (GSEA). First, we ranked the DEGs based on their log2FoldChange values. Then, we carried out GSEA using the c2.cp.reactome.v7.0.entrez.gmt gene set. After identifying significantly enriched pathways, we used the gseaplot2 function to visualize the selected pathways.
2.2.4. Tumor Microenvironment and Immune Infiltration Analysis
We employed the CIBERSORT algorithm to deconvolute the immune microenvironment of tumor samples, estimating the infiltration levels of 22 immune cell types (e.g., activated B cells, CD4+ T cells, and CD8+ T cells). We compared immune cell infiltration levels between high- and low-risk groups using box plots generated by the ggpubr and reshape2 packages, with statistical significance evaluated via the Wilcoxon rank-sum test. Spearman’s correlation analysis was applied to assess the relationships between the risk score and the 22 immune cell types, as well as between the expression of the five signature genes and these cell types.Next, we performed single-sample Gene Set Enrichment Analysis (ssGSEA) to derive enrichment scores for 28 immune cell types and their associated immune functions, then compared immune checkpoint expression between the two risk groups. We also utilized the ESTIMATE algorithm to quantify tumor purity, immune infiltration, and stromal infiltration, and examined correlations between immune/stromal scores and the risk score using scatter plots and linear regression. To estimate immunotherapy responses, we applied the TIDE (Tumor Immune Dysfunction and Exclusion) algorithm and visualized the results. We further analyzed correlations between key genes and immune cells. In addition, we leveraged the TCIA database to examine immune scores under various immune checkpoint inhibitor regimens (e.g., CTLA4 and PD-1), comparing high- versus low-risk groups via box plots and the Wilcoxon rank-sum test.
2.2.5. Mutation Analysis
Using the “maftools,” “remodeling2,” and “ggpubr” packages in R, we evaluated and compared the mutation burden and mutation profiles of the high- and low-risk groups, and generated waterfall plots to visualize the main mutated genes in each group. We then integrated the risk scores with tumor mutation burden (TMB) data, compared TMB levels between the two risk groups, and visualized the results in box plots (using ggpubr) with statistical significance testing. Based on the median TMB, samples were further divided into high- and low-TMB groups. A chi-square test was conducted to assess the distribution of high and low TMB across the two risk groups, with proportion bar plots for visualization.
2.2.6. Drug Sensitivity Evaluation
The oncoPredict R package predicts clinical drug responses based solely on baseline tumor gene expression data. This is accomplished via statistical models trained on cell line gene expression and drug sensitivity data from the Cancer Genome Project (CGP). Using oncoPredict in R, we estimated half-maximal inhibitory concentrations (IC50) for 198 chemotherapy and targeted drugs for each patient in the TCGA-PAAD dataset (n = 177). Patients were stratified into a high-risk group (n = 88) and a low-risk group (n = 89), and IC50 values were determined accordingly.
2.2.7. Single-Cell RNA Sequencing Analysis
Single-cell RNA-seq (scRNA-seq) data were obtained from the Gene Expression Omnibus (GEO) database under the accession GSE155698 (https://www.ncbi.nlm.nih.gov/geo/query/acc.cgi?acc=GSE155698), comprising 10 PAAD tumor samples. Data processing was carried out using the “Seurat V4.0” R package. Cells expressing fewer than 200 or more than 5000 genes, or those with >5% mitochondrial genes, were excluded. We applied “LogNormalize” (scale factor = 10,000), identified 2,000 highly variable genes, and scaled these genes.Principal component analysis (PCA) was used for dimension reduction, followed by the Harmony algorithm to correct batch effects. Clusters were identified using “harmony” results, and visualized via UMAP and t-SNE. Cell clusters were annotated based on known marker genes.To examine prognostically relevant genes, we used “FeaturePlot” to visualize their expression on t-SNE plots. We also defined gene sets, calculated module scores, and added these scores to the single-cell data. The “FeaturePlot” and “VlnPlot” functions were used to display module-score distributions across clusters.
2.2.8. Cell–Cell Communication
Cell–cell communication analysis was performed on the single-cell RNA-seq data using the CellChat R package (version 1.6.1). This tool predicts potential intercellular communication networks based on known signaling ligand–receptor interactions and related cofactors. First, specific gene sets were used to calculate module scores, which were then applied to group the cell populations. Next, we utilized the “secreted signaling” subset from the human ligand–receptor interaction database (CellChatDB.human) to conduct a detailed analysis of intercellular communications.
Following data processing, we inferred the signaling pathways among different cell types by calculating and filtering communication probabilities, and we visualized the resulting network. Additionally, we performed centrality analyses on various signaling pathways and used heatmaps, bubble charts, and other visualization methods to evaluate and display the roles and interaction patterns of different cell types in the signaling processes.
2.2.9. Spatial Transcriptomics Analysis
Spatial transcriptomic (ST) data (GSE274557) were processed through an integrated computational pipeline: initial quality control involved spot-level filtering based on nCount_Spatial and nFeature_Spatial thresholds to exclude low-quality regions, followed by SCTransform normalization (Seurat v5) and PCA-based feature selection (dims=1:15). Unsupervised clustering (FindClusters, resolution=0.8) and UMAP visualization revealed spatial domains, while RCTD-based integration with GSE155698 scRNA-seq data enabled cell-type mapping and core gene localization. Ductal epithelial trajectories were reconstructed via DDRTree pseudotime analysis (Monocle3), and SpaCET with TCGA PAAD reference data identified malignant cell distributions. Tumor-stroma interfaces were delineated through topological feature extraction, with multi-core parallelization (8 threads) accelerating subclone refinement. Spatial colocalization networks were statistically validated by permutation testing (FDR<0.05) and visualized using Cytoscape, revealing IFI27/KLK10 expression gradients across tumor niches.
2.2.10. Quantitative Real-Time PCR Analysis and HPA Immunohistochemistry Validation
Total RNA was extracted using the Trizol method, and its integrity was confirmed by agarose gel electrophoresis. The first-strand cDNA was synthesized using the Advantage® RT-for-PCR Kit (Takara). Quantitative real-time PCR was performed on an Applied Biosystems QuantStudio 5 system with a 20 μL reaction mixture containing AceQ® SYBR® Green Master Mix (Vazyme), 0.4 μM gene-specific primers, and diluted cDNA templates. The thermal cycling protocol included an initial pre-denaturation step at 95°C for 5 min, followed by 40 cycles of 95°C for 15 sec and 60°C for 30 sec. Data analysis was conducted using the 2−ΔΔCt method: ΔCt values were calculated as Ct(target gene) − Ct(GAPDH) to normalize inter-sample variations, ΔΔCt was defined as ΔCt(tumor tissue) − ΔCt(paired adjacent normal tissues), and the relative fold change in gene expression was determined by 2−ΔΔCt. Additionally, immunohistochemistry (IHC) data were downloaded from the Human Protein Atlas (HPA, http://www.proteinatlas.org) to evaluate the high and low expression patterns of 5 genes in pancreatic cancer tissues.
2.3. Statistical Analysis
All statistical analyses were performed using R (versions 4.1.3 and 4.3.2) along with relevant R packages. Kaplan-Meier survival curves were generated, and log-rank tests were used to compare survival differences across risk groups. Univariate and multivariate Cox regression models were constructed to evaluate the prognostic value of clinicopathological variables and risk scores. Chi-square or Fisher’s exact tests were employed to examine relationships between risk scores and clinical characteristics. Group comparisons were conducted using the Mann-Whitney U test (Wilcoxon rank-sum test). A two-sided p-value < 0.05 was considered statistically significant (*p < 0.05; **p < 0.01; ***p < 0.001; ****p < 0.0001).
3. Results
3.1. Identification of Differentially Expressed Genes in Pancreatic Cancer
To uncover key genes involved in the development and progression of PAAD, we first investigated DEGs between 177 PAAD tumor tissues from the TCGA database and 180 normal pancreatic tissues from the GTEx database. As shown in Figure 1a, using the “DESeq2” package (cutoffs: log2FC > 1.5, q < 0.05), we identified 3,701 upregulated genes and 924 downregulated genes in pancreatic cancer tissues, yielding a total of 4,625 DEGs.
3.2. Construction and Validation of a Centrosome Amplification–Related Prognostic Gene Model in PAAD
To identify key centrosome amplification–related genes (CARGs) involved in PAAD progression, we collected a set of CARGs from the GeneCards database. We then generated a Venn diagram to overlap the 739 centrosome replication–associated genes with the 3,701 upregulated DEGs, ultimately identifying 23 CARGs (Figure 1b). Principal component analysis (PCA) further demonstrated that these 23 CARGs effectively distinguish non-tumor from tumor samples (Figure S1).
Next, we performed Gene Ontology (GO) enrichment analysis to gain insights into the molecular mechanisms by which these differentially expressed CARGs might contribute to PAAD development. Results showed that these CARGs are enriched in condensed chromosomes, centromeres, microtubules, and the spindle, as well as pathways involving the cell cycle and the Hippo signaling pathway (Figure 1c–f), including processes such as mitotic nuclear division, chromosome segregation, mitotic cell cycle phase transition, and microtubule cytoskeleton organization during mitosis. This suggests a critical role for centrosome amplification in PAAD through cell cycle regulation.
Subsequently, we applied univariate Cox regression to these 23 CARGs and identified 17 prognostic genes (Figure 2a). These genes were further subjected to LASSO-penalized Cox regression (Figure 2b, c) and multivariate Cox regression, yielding 5 final genes—IFI27, KIF20A, KLK10, SPINK7, and TOP2A (Figure S2)—all of which exhibited higher expression levels in PAAD tissues compared to normal pancreatic tissues. To develop a prognostic risk score, the mRNA expression of each gene was multiplied by its corresponding multivariate Cox coefficient and summed to generate an individual risk score:
Risk score=(0.085×IFI27 expression)+(0.631×KIF20A expression)+(0.211×KLK10 expression)+(0.305×SPINK7 expression)+(0.114×TOP2A expression).
Using the median risk score (2.8052) as the cutoff, patients in the TCGA-PAAD cohort (n = 177) were divided into low-risk (risk score < 2.8052, n = 89) and high-risk (risk score ≥ 2.8052, n = 88) groups. A heatmap revealed higher expression levels of IFI27, KIF20A, KLK10, SPINK7, and TOP2A in the high-risk group (Figure 3e). Scatter plots indicated that higher risk scores were associated with poorer overall survival (OS) (Figure 3c). Consistently, Kaplan-Meier curves and log-rank tests showed significantly worse OS for patients in the high-risk group compared to those in the low-risk group (p < 0.0001; Figure 3a). Time-dependent receiver operating characteristic (ROC) curves confirmed that this 5-gene signature had strong prognostic performance, with areas under the ROC curve (AUCs) of 0.752, 0.826, and 0.764 at 2, 3, and 5 years, respectively (Figure 3d).
We further validated the 5-gene signature in an independent dataset, GSE183795 (n = 134), by stratifying patients according to the median risk score derived from the TCGA cohort. Consistent with the TCGA results, high-risk patients had higher mortality rates and poorer survival outcomes than low-risk patients (p < 0.001; Figure 2g,h). The AUCs for predicting 2-, 3-, and 5-year OS in this validation cohort were 0.787, 0.818, and 0.817, respectively (Figure 4a,b). Similar findings were obtained in other independent datasets (GSE78299 and GSE62452), as illustrated in Figure 4c–f. Collectively, these results underscore the robust prognostic utility of the 5-gene centrosome amplification–related signature in PAAD.
3.3. The Centrosome Amplification–Related Prognostic Signature Is an Independent Prognostic Factor in PAAD
We next evaluated whether the centrosome amplification–related risk score could serve as an independent prognostic factor in PAAD. A univariate Cox regression analysis was performed, incorporating the risk score as well as multiple clinicopathological features—age, sex, tumor grade, T stage, M stage, N stage, history of previous malignancy, tumor status at follow-up, tumor location, DCC histological subtype, history of radiotherapy, residual tumor, and chronic pancreatitis. Univariate Cox results indicated that age (HR = 1.0279, 95% CI: 1.0071–1.0492), N stage (HR = 2.0961, 95% CI: 1.2486–3.5188), histological grade (HR = 2.3502, 95% CI: 1.443–2.287), tumor status at follow-up (HR = 2.4912, 95% CI: 1.0770–5.7623), history of radiotherapy (HR = 0.4525, 95% CI: 0.2566–0.7980), DCC subtype (HR = 1.7700, 95% CI: 1.0773–2.9080), and residual tumor (HR = 1.7703, 95% CI: 1.0971–2.8568) were predictive of clinical outcomes in the TCGA cohort (Figure S3a). In the multivariate Cox regression, the centrosome amplification–related risk score emerged as a significant factor for prognosis, independent of other clinical variables (Figure S3b).
We subsequently combined these 7 variables with the risk score in a multivariate Cox regression and constructed a stepwise prognostic Cox model to predict 2-, 3-, and 5-year OS, culminating in a nomogram (Figure 5a). The nomogram parameters included the risk score, age, N stage, histological grade, tumor status at follow-up, history of radiotherapy, DCC subtype, and residual tumor. The AUCs for predicting 2-, 3-, and 5-year OS based on the nomogram were 0.850, 0.872, and 0.865, respectively Figure 5b). Calibration curves closely aligned with the 45° diagonal, indicating a strong concordance between nomogram-predicted survival and observed survival in the TCGA-PAAD cohort (Figure 5c).
Additionally, clinicopathological relevance analyses demonstrated that the risk score was significantly associated with tumor status at follow-up, history of radiotherapy, presence of residual tumor, and DCC histological subtype (Figure 6a–e).
3.4. Correlation Analysis of the CARG Signature with Immune Infiltration and the Tumor Microenvironment
To explore the relationship between the CARG signature, immune infiltration, and the tumor microenvironment, we performed immune deconvolution analysis on tumor samples using the CIBERSORT algorithm and compared the infiltration levels of immune cells between the high-risk and low-risk groups (Figure 7a-b). The results showed significantly higher infiltration of M0 macrophages (p < 0.01) in the high-risk group, while monocytes (p < 0.01) and CD8+ T cells (p < 0.05) exhibited significantly higher levels in the low-risk group. Spearman’s correlation analysis of infiltration levels versus the risk score revealed that monocytes, CD8+ T cells, activated B cells, and naive B cells were negatively correlated with the risk score, whereas M1 and M0 macrophages, activated dendritic cells, memory B cells, and eosinophils were positively correlated with the risk score (all p < 0.05) (Figure 8a-c).
We further conducted single-sample Gene Set Enrichment Analysis (ssGSEA) to compare immune cell enrichment between the two risk groups. Compared to the high-risk group, the low-risk group showed significantly higher enrichment scores for eosinophils, monocytes, and macrophages (p < 0.001), and elevated but slightly less significant scores for activated B cells and macrophages (p < 0.01). The myeloid-derived suppressor cells (MDSCs) and mast cell scores were also significantly higher (p < 0.05) in the low-risk group. In contrast, the low-risk group displayed a notably lower abundance of activated CD4+ T cells (p < 0.001) and Type 2 T helper cells (p < 0.05) than the high-risk group (Figure 9a). As for immune functions, the low-risk group had significantly higher Type_II_IFN_Response and cytolytic activity scores, yet lower Type_I_IFN_Response, parainflammation, MHC_class_I, and APC_co_inhibition scores (Figure 9b). Regarding immune checkpoint expression, genes including CD274, CD276, CD44, and TNFSF9 were more highly expressed in the high-risk group (p < 0.001) (Figure 9c).
Using the ESTIMATE algorithm, we examined the relationship between the CARG signature and the tumor microenvironment in 177 PAAD patients from the TCGA (n = 177). ESTIMATE analysis indicated that stromal score (p = 0.027), immune score (p = 0.019), and ESTIMATE score (p = 0.02) were higher in the low-risk group (all p < 0.05). Immunotherapy, including immune checkpoint blockade (ICB) and cell-based treatments, has yielded durable clinical responses and transformative cancer therapies 999. However, there is currently no established immunotherapy regimen for pancreatic malignancies. Hence, unraveling the molecular mechanisms governing the immunosuppressive microenvironment is essential for improving immunotherapy outcomes and patient prognosis in PAAD. As TIDE offers a computational predictor of ICB responses, we applied the TIDE tool (http://tide.dfci.harvard.edu/) to assess the potential clinical efficacy of ICB for different risk scores (Figure.6f). According to TIDE, the group predicted to respond to immunotherapy had lower risk scores than the non-responding group (p = 0.00028), suggesting that high-risk patients are less likely to benefit from ICB (Figure 9d). Additionally, TCIA-based analysis revealed no statistically significant difference in immune scores between the high- and low-risk groups under various immune checkpoint inhibitor combinations (e.g., CTLA4 plus PD-1) (Figure 9e).
3.5. Functional Analysis of the CARG Gene Set
To investigate the biological behavior underlying different CARG risk scores, we performed functional annotation using the GSVA R package on TCGA-PAAD samples. Heatmap visualization of the GSVA-KEGG results (Figure 10c) showed significant enrichment of DNA repair pathways (e.g., non-homologous end joining, base excision repair, homologous recombination repair, nucleotide excision repair, mismatch repair), cell cycle and DNA replication pathways, the pentose phosphate pathway, the p53 signaling pathway, and proteasome pathway in the high-risk group. Conversely, pathways related to amino acid metabolism (e.g., valine, leucine, and isoleucine degradation; tryptophan metabolism; β-alanine metabolism), fatty acid metabolism, primary bile acid biosynthesis, taurine and hypotaurine metabolism, and the neuroactive ligand-receptor interaction pathway were significantly enriched in the low-risk group.
GSVA-HALLMARK analysis further revealed that cell cycle–related pathways, such as the mitotic spindle, DNA repair, mismatch repair, the unfolded protein response, G2M checkpoint, E2F targets, and MYC targets, were significantly enriched in the high-risk group, consistent with GSVA-KEGG findings and indicative of enhanced cell cycle progression (Figure 10c). Additionally, stress and cell death–related pathways, including apoptosis and hypoxia, were also enriched. Notably, cancer-related pathways, such as PI3K/AKT/mTOR, Notch, p53, and TGF-β signaling, were more active in the high-risk group compared to the low-risk group (Figure 10a-b).
To further elucidate differences in gene expression associated with the CARG risk score, we identified differentially expressed genes (DEGs_2) between high-risk and low-risk samples and performed GSEA. GSEA showed that the high-risk group was primarily enriched in pathways related to the cell cycle, mitotic cell cycle, and keratinization (including the formation of the cornified envelope), whereas the low-risk group exhibited enrichment in pathways involved in synaptic transmission, G protein–coupled receptor activity, the nervous system, as well as digestion and absorption (Figure 10d).
Subsequently, we performed GO-KEGG enrichment analysis using the org.Hs.eg.db and clusterProfiler packages. The results indicated that, in terms of biological processes, genes were concentrated in signaling, secretion, and transport functions, such as signal release, regulation of synaptic transmission, and membrane potential. For cellular components, key structures included neuronal cell bodies, synaptic membranes, transporter complexes, transport vesicles, and ion channel complexes, potentially contributing to tumor microenvironment changes. As for molecular functions, the enriched terms were predominantly related to ion channels and transmembrane transport, including metal ion transmembrane transporter activity, gated channel activity, and single-ion gated channel activity. KEGG pathway analysis revealed that genes were mainly enriched in secretion, metabolic processes, and signaling pathways, including neuroactive ligand-receptor interaction, pancreatic secretion, and cAMP signaling (Figure 10e-h). Taken together, the GO and KEGG findings indicate that centrosome amplification–related genes are primarily involved in cell signaling, secretion, and transport processes. Such functions and pathways may be closely linked to PAAD development and metastasis, underscoring the potential role of centrosome amplification in remodeling the tumor microenvironment and driving cancer progression.
3.6. Mutation Analysis
We further characterized the genomic mutation profiles associated with the CARG gene set, including mutation counts and mutation spectra, using the Maftools package in R to visualize mutation patterns in 177 PAAD patients from the TCGA-PAAD cohort. Notably, the key cell cycle regulator TP53 and the core signaling factor KRAS showed higher mutation rates in the high-risk group than in the low-risk group (TP53: 76% vs. 45%, KRAS: 83% vs. 46%, Figure 11a-b). Moreover, most KRAS mutations in the high-risk group were missense mutations that lead to constitutive activation of KRAS, which in turn activates MAPK/ERK and PI3K/AKT pathways, both of which are critical for cell proliferation, differentiation, and survival. This observation may partially explain the hyperactivated proliferative and differentiative signaling in the high-risk group. Additionally, we noted a higher frequency of CDKN2A mutations in the high-risk group and SMAD4 mutations in the low-risk group, suggesting potential distinct oncogenic processes. Regarding tumor mutation burden (TMB), the proportion of high-TMB samples was higher in the low-risk group than in the high-risk group, with a statistically significant difference (Figure 11c-d, p = 0.00011). This finding aligns with the hypothesis that high-risk patients may respond less favorably to immunotherapy.
3.7. Chemotherapy Response Prediction and the CARG-Based Risk Score
Using the Cancer Genome Project (CGP) cell line data, we predicted the IC50 values of commonly used chemotherapeutic agents for PAAD in different risk groups. Gemcitabine is a frontline therapy for pancreatic cancer [11]. Our analysis showed that its half-maximal inhibitory concentration (IC50) was significantly lower in the high-risk group compared to the low-risk group, suggesting increased sensitivity to gemcitabine-based chemotherapy among high-risk patients (Figure 12a). Similarly, 5-fluorouracil (5-FU), paclitaxel, AKT inhibitor VIII, gefitinib, trametinib (a MEK inhibitor), and erlotinib all exhibited lower IC50 values in the high-risk group (Figure 12b, c, g, h, i, j), indicating that these patients may also respond better to regimens containing these agents. Conversely, several key anti-pancreatic cancer drugs—namely irinotecan, oxaliplatin, and cisplatin—had markedly lower IC50 values in the low-risk group, suggesting potential benefit for patients with low CARG risk scores.
3.8. Validation of the Five-Gene Signature Using Single-Cell Sequencing
To further elucidate the role of the CARG signature in PAAD progression, we conducted single-cell RNA sequencing (scRNA-seq) analysis on GSE155698 to examine the expression profiles of CARGs within the malignant pancreatic tumor microenvironment. After quality control and filtering, 24,094 cells were obtained from 10 primary pancreatic tumors and grouped into 22 clusters (Figure 13a). Subsequent merging, clustering, and annotation classified these cells—based on known marker genes—into T cells, macrophages, endothelial cells, pancreatic ductal cells, acinar cells, endocrine cells, fibroblasts, B cells, and pancreatic tumor stem cells (Figure 13b).
We then visualized the expression patterns of the five centrosome amplification–related genes (IFI27, KIF20A, KLK10, SPINK7, and TOP2A) (Figure 13c). IFI27 showed high expression in ductal cells and fibroblasts, whereas KLK10 was strongly expressed in ductal cells, suggesting that IFI27 and KLK10 could be closely linked to the development of pancreatic ductal carcinoma. TOP2A was minimally expressed in B cells, and SPINK7 and KIF20A had relatively low expression across tissue types. To quantify the integrated expression of these genes in different cell populations, we calculated a module score based on the five genes. This module score reflects their collective expression at the single-cell level, revealing that ductal epithelial cells and fibroblasts displayed the highest expression (Figure 13d), indicating a potential critical role of centrosome amplification in these cell types. Using the median score as the cutoff, cells were separated into high- and low-risk groups. We further noted that high-risk cells showed elevated proportions of ductal epithelial and acinar cell populations, alongside reduced infiltration of T cells and macrophages, suggesting less robust immune responses and heightened tumor proliferation in the high-risk group.
3.9. Cell–Cell Communication
To investigate intercellular interactions in the tumor microenvironment, we grouped the ductal epithelial cell subtype by high versus low module scores and analyzed the cellular communication network among various cell types in PAAD tumor tissues. Our findings demonstrated that high-scoring ductal epithelial cells, fibroblasts, and macrophages exhibited more active cross-talk, with complex intercellular connections among these cell subsets (Figure 14a). This observation points to a potential role for fibroblasts and macrophages in promoting malignant transformation.
We further examined the signaling pathways relayed from each cell subtype to others (Figure 15) as well as outgoing and incoming signals for each cell type (Figure 14d, e). The analysis indicated that each cell population possesses a complex network of incoming and outgoing signals. Notably, significant differences emerged in the MIF-(CD74+CD44) and MIF-(CD74+CXCR4) axes between high- and low-scoring ductal epithelial cell populations and B cells. Additionally, an MIF pathway network map was constructed, with each node representing a cell type and edge thickness indicating the intensity of MIF signal transmission (Figure 14b, c). This visualization underscores the intricate and vital role of MIF signaling in mediating cell–cell communication within the tumor microenvironment.
3.10. Spatial Transcriptomic Analyses of Five Core Genes
The spatial distribution characteristics of 5 core genes in pancreatic cancer tissues were investigated through spatial transcriptomic analysis of ST data (GSE274557) (Figure 16a). RTCD deconvolution-based annotation was performed on the ST data using single-cell annotation data from GSE155698, resulting in annotated cell subtypes including cancer stem cells, ductal epithelial cells, endothelial cells, fibroblasts, and macrophages (Figure 16b, c, d). Spatial mapping revealed IFI27's predominant localization in ductal epithelial regions, aligning with scRNA-seq profiles, while other genes exhibited dispersed low-expression patterns (Figure 17d, e, f, g, h). SpaCET-based malignant subtyping (Figure 17a, b) identified IFI27 as a hallmark of high-grade malignancy subcluster B (tumor purity >80%, p<1e-5) (Figure 17c). Pseudotemporal trajectory analysis demonstrated Cell developmental trajectory (Figure 18a, b, c) and developmental-stage-specific dynamics. IFI27 expression progressively escalated in late-stage malignant cells, KIF20A/TOP2A peaked during mid-pseudotime phases, whereas KLK10/SPINK7 showed pseudotime-independent patterns, suggesting microenvironment-regulated expression (Figure 18d, e, g, h). Spatial colocalization networks revealed endothelia niches co-enriched with M2 macrophages and CAF, also, CAF co-enriched with M1 and M2 macrophages, corroborating their synergistic roles in tumor progression (Figure 19).
3.11. In PCR Validation of CARG-Related Prognostic Genes and HPA Immunohistochemistry in PAAD
To confirm the expression and function of the prognostic marker genes IFI27, KIF20A, KLK10, SPINK7, and TOP2A, we measured their mRNA levels by qRT-PCR. IFI27, KIF20A, KLK10, and TOP2A were highly expressed in tumor cells, supporting their potential as prognostic biomarkers in PAAD. Results showed that IFI27, KIF20A, KLK10 and TOP2A were significantly upregulated in tumor cells relative to normal cells, whereas SPINK7 showed no differential expression (Figure 20). The IHC results for proteins corresponding to the four genes (IFI27, KIF20A, SPINK7, and TOP2A) are available on the HPA. Based on IHC analysis, the distribution and staining intensity of these proteins in representative PAAD samples varied from low to high expression (Figure 21).
4. Discussion
A growing body of both preclinical and clinical evidence suggests that centrosome amplification–related genes may serve as potential therapeutic targets in PAAD. Nevertheless, the precise role of centrosome amplification in tumorigenesis remains to be fully elucidated. In the present study, we conducted functional enrichment analysis of DEGs between PAAD and paired non-tumor tissues, providing preliminary evidence for the pivotal role of centrosome amplification in PAAD. We identified 23 genes that were both overexpressed in PAAD and associated with centrosome amplification. Subsequently, we developed a five-gene CARG-based signature that demonstrated robust diagnostic and prognostic performance in patients with PAAD. Collectively, our work offers a comprehensive transcriptomic analysis of centrosome amplification–related genes, shedding light on the function of centrosomes in PAAD.
Our CARG-based signature comprises IFI27, KIF20A, KLK10, SPINK7, and TOP2A. IFI27 (Interferon Alpha Inducible Protein 27), which is induced by interferon-α and located on chromosome 14q32 [12], is upregulated in multiple malignancies and associated with tumor proliferation, invasion, metastasis, and drug resistance. Originally cloned in the estrogen-induced MCF-7 breast cancer cell line, IFI27 has been linked to enhanced proliferation and migration in breast cancer, potentially by promoting epithelial–mesenchymal transition (EMT) [13]. IFI27 also plays roles in the progression and drug resistance of ovarian cancer, esophageal squamous cell carcinoma, and gastric cancer [14,15,16]. Moreover, IFI27 has been proposed as a potential prognostic biomarker in pancreatic cancer, where its overexpression correlates with increased cell proliferation, metastasis, and malignant progression [17]. Notably, IFI27 might modulate immune evasion and cell survival in pancreatic cancer cells by interfering with RIG-I signaling, although further study is warranted [18].
KIF20A (kinesin family member 20A) binds to microtubules and generates mechanical force through ATP hydrolysis, playing a crucial role in cell division [19]. Studies have revealed that KIF20A promotes tumor growth by regulating chromosome segregation, whereas its inhibition markedly attenuates the proliferation of pancreatic cancer cells. Overexpression of KIF20A in pancreatic tumors typically correlates with increased invasiveness and poor prognosis [20,21], suggesting its potential as a therapeutic target.
KLK10 (kallikrein-related peptidase 10), also known as normal epithelial cell–specific 1 (NES1), is a member of the human kallikrein-related peptidase family. Located on chromosome 19q13.3, it encodes a serine protease involved in cell proliferation, differentiation, and apoptosis [22]. High KLK10 levels are associated with poor prognosis in certain cancers, including pancreatic cancer, where it may drive malignant progression by facilitating cell proliferation and migration. Moreover, KLK10 is aberrantly upregulated in pancreatic ductal adenocarcinoma (PDAC) and pancreatic intraepithelial neoplasia (PanIN), further implicating KLK10 in PDAC initiation and progression [23].
SPINK7 (serine peptidase inhibitor, Kazal type 7) was initially identified in studies aiming to uncover genes linked to human esophageal cancer [24]. Interestingly, SPINK7 has been reported to promote apoptosis by directly binding uPA, potentially suppressing tumor progression via the p53 pathway and playing an important role in overcoming drug resistance in esophageal squamous cell carcinoma [25]. Contrary to these findings, our data indicate that SPINK7 is highly expressed in pancreatic cancer tissues and correlates with poor prognosis. Few studies have addressed SPINK7 in PAAD, and no significant relationship has been reported between SPINK7 short tandem repeat (STR) polymorphisms and reduced pancreatic cancer risk or improved overall survival [26]. Hence, the role of SPINK7 in pancreatic cancer warrants further investigation.
TOP2A (topoisomerase IIα) is overexpressed in pancreatic cancer and linked to worse survival outcomes [27]. By activating the Wnt/β-catenin pathway, TOP2A accelerates pancreatic tumor proliferation and migration. Knocking down TOP2A substantially hinders these oncogenic processes, underscoring its potential as a therapeutic target [28]. Consistent with previous reports, our findings suggest that these five genes strongly correlate with aggressive tumor behavior and chemotherapy resistance. Moreover, our results confirm that this five-gene signature is an independent predictor of overall survival, even when adjusting for established clinicopathological risk factors.
At present, CA19-9 remains the most widely employed blood-based biomarker for PAAD diagnosis, but its sensitivity is only 68.8% [29]. While CA19-9 is useful, its limited sensitivity necessitates the combined application of other diagnostic methods to enhance accuracy. Notably, our five-gene signature exhibits considerable sensitivity and specificity in distinguishing PAAD patients from both healthy controls and those with premalignant lesions. Therefore, this CARG-based signature may serve as a valuable biomarker for the diagnosis and prognosis of patients with PAAD.
To further elucidate the potential mechanisms by which centrosome amplification contributes to malignant progression and poor prognosis in PAAD patients, we investigated its relationship with the cell cycle and the tumor microenvironment. Dysregulated cell cycle progression leads to tumorigenesis and cancer development and is widely recognized as an important characteristic of cancer [30]. Indeed, uncontrolled cell proliferation—mediated by aberrant cell cycle regulation and activation of cyclin-dependent kinases (CDKs)—is central to the pathological processes of cancer. Cell cycle regulators have long been pivotal targets in cancer therapy. For example, the next-generation selective CDK4/6 inhibitor palbociclib has been approved for treating HR+/HER2− advanced breast cancer [31]. Samuraciclib, a novel noncovalent, ATP-competitive CDK7 inhibitor, can effectively suppress proliferation of various cancer cells at lower concentrations and significantly inhibit tumor growth in a mouse xenograft model of colon cancer without evident side effects [32]. Under normal conditions, centrosome amplification is tightly controlled throughout the cell cycle, but when cell division fails, disrupted CDK activity triggers centrosome expansion, resulting in multipolar spindle formation and erroneous chromosome segregation—ultimately leading to aneuploidy and malignant transformation [33,34]. Consistent with these findings, our study showed that patients in the high-CARGs-risk group had significantly enriched cell cycle–related pathways, highlighting a close association between cell cycle dysregulation and centrosome amplification. In addition, patients with high CARGs scores appeared to exhibit greater activity in the PI3K/AKT/mTOR, Notch, p53, and TGF-β pathways, suggesting that centrosome amplification is intricately linked to multiple oncogenic signaling cascades.
In our drug-sensitivity analysis, high-risk patients demonstrated a greater propensity for resistance to DNA synthesis inhibitors (gemcitabine, 5-FU), platinum-based drugs (oxaliplatin and cisplatin, which form platinum-DNA adducts blocking DNA replication and transcription) and the topoisomerase I inhibitor (irinotecan) [35,36,37,38]. Their efficacy in the low-risk group may be attributed to these tumors’ reliance on DNA damage responses. Enhanced DNA repair can facilitate the correction of topoisomerase I inhibitor–induced DNA breaks, diminishing the cytotoxic impact of irinotecan [39], which may correlate with our observation that DNA repair pathways are enriched in the high-risk group. As a microtubule inhibitor [40], paclitaxel displayed lower IC50 values in the high-risk group, potentially because cells with more active cell cycle–related pathways are faster-dividing and thus more vulnerable to microtubule disruption. Likewise, certain tyrosine kinase inhibitors (TKIs)—such as gefitinib and erlotinib, which primarily target the EGFR pathway [41]—may exert enhanced antitumor effects in the high-risk group because of the elevated activity of EGFR and its downstream PI3K/AKT/mTOR signaling in these patients. Trametinib, a MEK inhibitor that acts on the RAS downstream MEK/ERK pathway [42], could also be more effective in the high-risk group, given the high-level activation of RAS signaling in pancreatic cancer.
A high KRAS mutation frequency is one of the most prominent characteristics of pancreatic cancer. The MAPK pathway, which is closely integrated with the cell cycle, orchestrates Ras activation to promote tumor cell proliferation, survival, and migration [43]. The Ras oncogene can signal centrosome amplification through cyclin D1/Cdk4 and Nek2, promoting tumorigenesis [44]. TP53, a tumor suppressor gene closely linked to cell cycle control, has been implicated in early centrosome amplification, with some studies suggesting that its function is lost due to both the loss of wild-type TP53 expression and hotspot mutations [45]. In our study, KRAS and TP53 mutations were significantly more frequent in the high-risk group than in the low-risk group, further affirming that TP53 and KRAS mutations play critical roles in centrosome amplification.
Previous research indicates that centrosome amplification can induce spindle multipolarity during cell division, leading to chromosomal missegregation and ultimately chromosomal instability (CIN). CIN, a hallmark in many cancers, has been shown to correlate with tumor progression and poor prognosis [46]. Apart from directly increasing genomic instability in tumor cells, CIN caused by centrosome amplification also alters the tumor microenvironment by secreting various cytokines and chemokines. These secreted factors can recruit and reprogram macrophages, promoting M0 macrophage infiltration and polarization toward an M2 phenotype—for instance, tumor-secreted chemokines such as CCL2 can attract M0 macrophages and induce M2 polarization via signaling pathways such as STAT3 [47]. Importantly, aneuploidy in tumor cells is associated with increased M2 macrophage populations and reduced cytotoxic T cells [48]. Similarly, CIN tumors show activation of suppressive inflammatory pathways (including cGAS/STING/APP), inducing immunosuppressive signals such as TGF-β and IL-10 that drive M0 macrophages toward M2 differentiation and exhibit defective MHC class I antigen presentation [49]. In agreement with previous reports, our findings demonstrated that, from an immune-function perspective, the low-risk group exhibited significantly higher Type II IFN Response and cytolytic activity than the high-risk group, whereas the Type I IFN Response, para-inflammation, MHC class I expression, and APC co-inhibition scores were significantly lower than those of the high-risk group. These observations imply that the low-risk group has stronger antitumor immunity, while the high-risk group displays more pronounced immunosuppressive features. Patients with high CARGs scores showed reduced infiltration of antitumor immune cells—such as activated CD8+ T cells, activated B cells, and monocytes—alongside an elevated infiltration of immunosuppressive Th2 cells. Additionally, increased infiltration of M0 macrophages in the high-risk group may represent an undifferentiated macrophage state prone to M2 polarization under proper stimuli, thereby facilitating tumor progression and immune evasion. Although our study noted a marked elevation in activated CD4+ T cells in the high-risk group, this observation does not necessarily contradict the conclusion of enhanced immunosuppression. CD4+ T cells can differentiate into a variety of subtypes, including helper T cells (Th1, Th2, Th17) and regulatory T cells (Tregs). While activated CD4+ T cell counts may be higher in the high-risk group, a larger proportion could be Tregs, which exert immunosuppressive effects, thereby augmenting the overall immunosuppressive environment. Moreover, the higher MDSC scores observed in the low-risk group might reflect an immune editing mechanism that modulates immune responses. Several immune checkpoints, including CD274 (PD-L1), CD276, CD44, and TNFSF9, were also elevated in patients with high CARGs scores. Therapeutics targeting these molecules may hold promise for high-risk individuals and warrant further investigation. However, the TCIA analysis indicated no clear difference in response to CTLA-4 or PD-L1 blockade therapy between the risk groups, possibly attributable to pancreatic tumors being viewed as “cold tumors” [50], which generally respond poorly to immunotherapy. Hence, immunotherapeutic strategies for pancreatic malignancies require deeper investigation. Predictions of ICB therapy indicate that high-risk tumors may experience greater immune escape, leading to inferior responses to ICB. Thus, the CARGs score could serve as a biomarker to identify patients more likely to benefit from such treatments.
Our single-cell analysis revealed that CARGs-related genes are primarily expressed in ductal epithelial cells, with IFI27 and KLK10 exhibiting high expression in pancreatic ductal cells, and IFI27 also presenting high expression in fibroblasts. These findings suggest a strong association of these genes with malignant transformation and progression of ductal epithelial cells in pancreatic cancer. By contrast, these genes showed relatively low expression in immune cells (T cells, B cells, macrophages) and cancer stem cells, possibly reflecting the immunologically “cold tumor” property of pancreatic cancer [50], where immune cell activity is suppressed by a strong immunosuppressive microenvironment. Cell–cell communication analysis highlighted complex interactions between cell populations, particularly elevated crosstalk among high-scoring ductal epithelial cells, fibroblasts, and macrophages. Notably, the MIF signaling pathway was significantly implicated, suggesting a protumor function for fibroblasts—especially cancer-associated fibroblasts (CAFs)—and macrophages, as well as a pivotal role for MIF in modulating immune responses and promoting pancreatic tumor cell proliferation. Future work employing functional studies to validate these key signaling pathways and explore their therapeutic potential in PAAD is warranted.
Further spatial transcriptomic analysis demonstrated that the expression of IFI27 aligns with single-cell annotation data, predominantly localized in ductal epithelial cells. Notably, IFI27 exhibited significantly elevated expression in the highly malignant Subcluster B (comprising ductal epithelial and neoplastic cell subpopulations), with its expression levels progressively increasing during tumor cell developmental stages, suggesting its potential involvement in late-stage regulation of malignant transformation. This finding reinforces its putative role in tumor epithelial-mesenchymal transition (EMT) or invasive phenotypes. Pseudotime trajectory analysis revealed that KIF20A and TOP2A peaked in expression during mid-cell developmental phases, implicating their primary participation in tumor cell proliferation stages, particularly mitotic regulation, which is mechanistically linked to centrosome amplification processes. Spatial colocalization networks identified significant co-enrichment of endothelial niches with M2 tumor-associated macrophages (M2-TAMs) and cancer-associated fibroblasts (CAFs), while CAFs coexisted with both M1 and M2 macrophages, potentially reflecting their synergistic contributions to immunosuppressive microenvironment formation and coupling of angiogenesis with invasive progression.
Overall, our study offers the first systematic analysis of centrosome amplification in PAAD. We uncovered an aberrant centrosome amplification–associated expression profile and demonstrated the oncogenic effects of centrosome amplification in PAAD. Moreover, we established a centrosome amplification–related predictive signature—IFI27, KIF20A, KLK10, SPINK7, and TOP2A—that shows high sensitivity and specificity in diagnosing and prognosticating PAAD patients. In addition, this CARG-based feature is closely tied to tumor aggressiveness, an immunosuppressive tumor microenvironment, and chemotherapeutic responses. Collectively, a comprehensive evaluation of centrosome amplification–associated genes in PAAD advances our understanding of the disease’s mechanisms and paves the way for innovative therapeutic interventions.
Supplementary Materials
The following supporting information can be downloaded at the website of this paper posted on Preprints.org.
Author Contributions
Yuan Sun, Ming Li designed the study. Yuan Sun, and Yan Li performed data analysis. Yuan Sun and Tao Hu drafted the manuscript. Ming Li revised the manuscript. All authors read and approved the final manuscript.
Funding
None.
Ethics Approval and Consent to Participate
Not applicable.
Consent for Publication
Not applicable.
Data Availability Statement
Original contributions presented in the study are included in public repository, further inquiries can be directed to the corresponding author.
Acknowledgments
We would like to thank TCGA and GEO databases for the availability of the data.
Conflicts of Interest
Authors declare no competing interests.
References
- Klein, A.P. Pancreatic cancer epidemiology: understanding the role of lifestyle and inherited risk factors. Nat. Rev. Gastroenterol. Hepatol. 2021, 18, 493–502. [Google Scholar] [CrossRef]
- Padrón, L.J.; Maurer, D.M.; O'Hara, M.H.; et al. Sotigalimab and/or nivolumab with chemotherapy in first-line metastatic pancreatic cancer: clinical and immunologic analyses from the randomized phase 2 PRINCE trial. Nat. Med. 2022, 28, 1167–1177. [Google Scholar] [CrossRef] [PubMed]
- Qin, S.; Li, J.; Bai, Y.; et al. Nimotuzumab Plus Gemcitabine for K-Ras Wild-Type Locally Advanced or Metastatic Pancreatic Cancer. J. Clin. Oncol. 2023, 41, 5163–5173. [Google Scholar] [CrossRef]
- Nigg, E.A. Origins and consequences of centrosome aberrations in human cancers [published correction appears in Int J Cancer 2007, 121, 698]. Int J Cancer 2006, 119, 2717–2723. [Google Scholar] [CrossRef]
- Boveri, T. Concerning the origin of malignant tumours by Theodor Boveri. Translated and annotated by Henry Harris. J. Cell Sci. 2008, 121 (Suppl. 1), 1–84. [Google Scholar] [CrossRef]
- Arnandis, T.; Monteiro, P.; Adams, S.D.; et al. Oxidative Stress in Cells with Extra Centrosomes Drives Non-Cell-Autonomous Invasion. Dev. Cell 2018, 47, 409–424.e9. [Google Scholar] [CrossRef]
- Mittal, K.; Kaur, J.; Sharma, S.; et al. Hypoxia Drives Centrosome Amplification in Cancer Cells via HIF1α-dependent Induction of Polo-Like Kinase 4. Mol. Cancer Res. 2022, 20, 596–606. [Google Scholar] [CrossRef] [PubMed]
- Nagao, S.; Onishi, H.; Kawamoto, M.; et al. C4orf47 contributes to the dormancy of pancreatic cancer under hypoxic conditions. J. Cancer 2023, 14, 306–317. [Google Scholar] [CrossRef] [PubMed]
- Morad, G.; Helmink, B.A.; Sharma, P.; Wargo, J.A. Hallmarks of response, resistance, and toxicity to immune checkpoint blockade [published correction appears in Cell 2022, 185, 576. https://doi.org/10.1016/j.cell.2022.01.008]. Cell 2021, 184, 5309-5337. Cell. [CrossRef]
- Jiang, P.; Gu, S.; Pan, D.; et al. Signatures of T cell dysfunction and exclusion predict cancer immunotherapy response. Nat. Med. 2018, 24, 1550–1558. [Google Scholar] [CrossRef]
- Stoop, T.F.; Theijse, R.T.; Seelen, L.W.F.; et al. Preoperative chemotherapy, radiotherapy and surgical decision-making in patients with borderline resectable and locally advanced pancreatic cancer. Nat. Rev. Gastroenterol. Hepatol. 2024, 21, 101–124. [Google Scholar] [CrossRef]
- Guo, K.; Li, L. Prediction of Key Candidate Genes for Platinum Resistance in Ovarian Cancer. Int. J. Gen. Med. 2021, 14, 8237–8248. [Google Scholar] [CrossRef]
- Cervantes-Badillo, M.G.; Paredes-Villa, A.; Gómez-Romero, V.; et al. IFI27/ISG12 Downregulates Estrogen Receptor α Transactivation by Facilitating Its Interaction With CRM1/XPO1 in Breast Cancer Cells. Front. Endocrinol. 2020, 11, 568375. [Google Scholar] [CrossRef]
- Han, L.; Guo, X.; Du, R.; Guo, K.; Qi, P.; Bian, H. Identification of key genes and pathways related to cancer-associated fibroblasts in chemoresistance of ovarian cancer cells based on GEO and TCGA databases. J. Ovarian Res. 2022, 15, 75. [Google Scholar] [CrossRef] [PubMed]
- Li, T.; Zhou, J.; Jiang, Y.; et al. The Novel Protein ADAMTS16 Promotes Gastric Carcinogenesis by Targeting IFI27 through the NF-κb Signaling Pathway. Int. J. Mol. Sci. 2022, 23, 11022. [Google Scholar] [CrossRef] [PubMed]
- Zhang, Y.; Chen, C.; Liu, Z.; et al. PABPC1-induced stabilization of IFI27 mRNA promotes angiogenesis and malignant progression in esophageal squamous cell carcinoma through exosomal miRNA-21-5p. J. Exp. Clin. Cancer Res. 2022, 41, 111. [Google Scholar] [CrossRef] [PubMed]
- Choy, L.; Norris, S.; Wu, X.; et al. Inhibition of Aurora Kinase Induces Endogenous Retroelements to Induce a Type I/III IFN Response via RIG-I. Cancer Res. Commun. 2024, 4, 540–555. [Google Scholar] [CrossRef]
- Villamayor, L.; López-García, D.; Rivero, V.; Martínez-Sobrido, L.; Nogales, A.; DeDiego, M.L. The IFN-stimulated gene IFI27 counteracts innate immune responses after viral infections by interfering with RIG-I signaling. Front. Microbiol. 2023, 14, 1176177. [Google Scholar] [CrossRef]
- Hirokawa, N.; Noda, Y.; Okada, Y. Kinesin and dynein superfamily proteins in organelle transport and cell division. Curr. Opin. Cell Biol. 1998, 10, 60–73. [Google Scholar] [CrossRef]
- Taniuchi, K.; Nakagawa, H.; Nakamura, T.; et al. Down-regulation of RAB6KIFL/KIF20A, a kinesin involved with membrane trafficking of discs large homologue 5, can attenuate growth of pancreatic cancer cell. Cancer Res. 2005, 65, 105–112. [Google Scholar] [CrossRef]
- Morita, H.; Matsuoka, A.; Kida, J.I.; Tabata, H.; Tohyama, K.; Tohyama, Y. KIF20A, highly expressed in immature hematopoietic cells, supports the growth of HL60 cell line. Int. J. Hematol. 2018, 108, 607–614. [Google Scholar] [CrossRef]
- Borgoño, C.A.; Diamandis, E.P. The emerging roles of human tissue kallikreins in cancer. Nat. Rev. Cancer 2004, 4, 876–890. [Google Scholar] [CrossRef]
- Wu, M.; Li, X.; Zhang, T.; Liu, Z.; Zhao, Y. Identification of a Nine-Gene Signature and Establishment of a Prognostic Nomogram Predicting Overall Survival of Pancreatic Cancer. Front. Oncol. 2019, 9, 996. [Google Scholar] [CrossRef]
- Cui, Y.; Wang, J.; Zhang, X.; et al. ECRG2, a novel candidate of tumor suppressor gene in the esophageal carcinoma, interacts directly with metallothionein 2A and links to apoptosis. Biochem. Biophys. Res. Commun. 2003, 302, 904–915. [Google Scholar] [CrossRef]
- Liao, C.; Wang, Q.; An, J.; et al. SPINKs in Tumors: Potential Therapeutic Targets. Front. Oncol. 2022, 12, 833741. [Google Scholar] [CrossRef]
- Yusenko, M.V.; Kovacs, G. Identifying CD82 (KAI1) as a Marker for Human Chromophobe Renal Cell Carcinoma. Histopathology 2009, 55, 687–695. [Google Scholar] [CrossRef] [PubMed]
- Telford, W.G. Multiparametric Analysis of Apoptosis by Flow Cytometry. Methods Mol. Biol. 2024, 2779, 217–257. [Google Scholar] [CrossRef]
- Liu, S.L.; Cai, C.; Yang, Z.Y.; et al. DGCR5 is activated by PAX5 and promotes pancreatic cancer via targeting miR-3163/TOP2A and activating Wnt/β-catenin pathway. Int. J. Biol. Sci. 2021, 17, 498–513. [Google Scholar] [CrossRef] [PubMed]
- Luo, G.; Jin, K.; Deng, S.; et al. Roles of CA19-9 in pancreatic cancer: Biomarker, predictor and promoter. Biochim. Biophys. Acta Rev. Cancer 2021, 1875, 188409. [Google Scholar] [CrossRef]
- Oropeza, E.; Seker, S.; Carrel, S.; et al. Molecular portraits of cell cycle checkpoint kinases in cancer evolution, progression, and treatment responsiveness. Sci. Adv. 2023, 9, eadf2860. [Google Scholar] [CrossRef] [PubMed]
- O'Leary, B.; Finn, R.S.; Turner, N.C. Treating cancer with selective CDK4/6 inhibitors. Nat. Rev. Clin. Oncol. 2016, 13, 417–430. [Google Scholar] [CrossRef]
- Wilson, G.A.; Vuina, K.; Sava, G.; et al. Active growth signaling promotes senescence and cancer cell sensitivity to CDK7 inhibition. Mol. Cell 2023, 83, 4078–4092.e6. [Google Scholar] [CrossRef] [PubMed]
- Sharma, S.S.; Ma, L.; Bagui, T.K.; Forinash, K.D.; Pledger, W.J. A p27Kip1 mutant that does not inhibit CDK activity promotes centrosome amplification and micronucleation. Oncogene 2012, 31, 3989–3998. [Google Scholar] [CrossRef] [PubMed]
- Sharma, S.S.; Ma, L.; Bagui, T.K.; Forinash, K.D.; Pledger, W.J. A p27Kip1 mutant that does not inhibit CDK activity promotes centrosome amplification and micronucleation. Oncogene 2012, 31, 3989–3998. [Google Scholar] [CrossRef]
- Pandit, B.; Royzen, M. Recent Development of Prodrugs of Gemcitabine. Genes 2022, 13, 466. [Google Scholar] [CrossRef]
- Kang, L.; Tian, Y.; Xu, S.; Chen, H. Oxaliplatin-induced peripheral neuropathy: clinical features, mechanisms, prevention and treatment. J. Neurol. 2021, 268, 3269–3282. [Google Scholar] [CrossRef]
- Dasari, S.; Tchounwou, P.B. Cisplatin in cancer therapy: molecular mechanisms of action. Eur. J. Pharmacol. 2014, 740, 364–378. [Google Scholar] [CrossRef]
- LaCourse, K.D.; Zepeda-Rivera, M.; Kempchinsky, A.G.; et al. The cancer chemotherapeutic 5-fluorouracil is a potent Fusobacterium nucleatum inhibitor and its activity is modified by intratumoral microbiota. Cell Rep. 2022, 41, 111625. [Google Scholar] [CrossRef]
- Alagoz, M.; Gilbert, D.C.; El-Khamisy, S.; Chalmers, A.J. DNA repair and resistance to topoisomerase I inhibitors: mechanisms, biomarkers and therapeutic targets. Curr. Med. Chem. 2012, 19, 3874–3885. [Google Scholar] [CrossRef] [PubMed]
- Alqahtani, F.Y.; Aleanizy, F.S.; El Tahir, E.; Alkahtani, H.M.; AlQuadeib, B.T. Paclitaxel. Profiles Drug Subst. Excip. Relat. Methodol. 2019, 44, 205–238. [Google Scholar] [CrossRef]
- Wang, X.S.; Bai, Y.F.; Verma, V.; et al. Randomized Trial of First-Line Tyrosine Kinase Inhibitor With or Without Radiotherapy for Synchronous Oligometastatic EGFR-Mutated Non-Small Cell Lung Cancer [published correction appears in J Natl Cancer Inst 2023, 115, 773. https://doi.org/10.1093/jnci/djad084]. J. Natl. Cancer Inst. 2023, 115, 742-748. J. Natl. Cancer Inst. [CrossRef]
- Zeiser, R.; Andrlová, H.; Meiss, F. Trametinib (GSK1120212). Recent Results Cancer Res. 2018, 211, 91–100. [Google Scholar] [CrossRef]
- Luo, J. KRAS mutation in pancreatic cancer. Semin. Oncol. 2021, 48, 10–18. [Google Scholar] [CrossRef]
- Zeng, X.; Shaikh, F.Y.; Harrison, M.K.; et al. The Ras oncogene signals centrosome amplification in mammary epithelial cells through cyclin D1/Cdk4 and Nek2. Oncogene 2010, 29, 5103–5112. [Google Scholar] [CrossRef]
- Lopes, C.A.M.; Mesquita, M.; Cunha, A.I.; et al. Centrosome amplification arises before neoplasia and increases upon p53 loss in tumorigenesis. J. Cell Biol. 2018, 217, 2353–2363. [Google Scholar] [CrossRef]
- Fukasawa, K. Centrosome amplification, chromosome instability and cancer development. Cancer Lett. 2005, 230, 6–19. [Google Scholar] [CrossRef] [PubMed]
- Lingle, W.L.; Barrett, S.L.; Negron, V.C.; et al. Centrosome amplification drives chromosomal instability in breast tumor development. Proc. Natl. Acad. Sci. USA 2002, 99, 1978–1983. [Google Scholar] [CrossRef]
- Zhu, J.; Tsai, H.J.; Gordon, M.R.; Li, R. Cellular Stress Associated with Aneuploidy. Dev. Cell 2018, 44, 420–431. [Google Scholar] [CrossRef] [PubMed]
- Tripathi, R.; Modur, V.; Senovilla, L.; Kroemer, G.; Komurov, K. Suppression of tumor antigen presentation during aneuploid tumor evolution contributes to immune evasion. Oncoimmunology 2019, 8, 1657374. [Google Scholar] [CrossRef] [PubMed]
- Barriga, F.M.; Tsanov, K.M.; Ho, Y.J.; et al. MACHETE identifies interferon-encompassing chromosome 9p21.3 deletions as mediators of immune evasion and metastasis. Nat. Cancer 2022, 3, 1360–1385. [Google Scholar] [CrossRef]
Figure 1.
(a) Volcano plot illustrating differentially expressed genes (DEGs) between PAAD tumor tissues and normal pancreatic tissues. (b)Venn diagram showing the intersection between upregulated DEGs (blue circle) and centrosome amplification–related genes (red circle) .(c–e) Bubble charts depicting Gene Ontology (GO) enrichment analyses of the 23 overlapping genes. (c) Biological process (BP) terms; (d) Cellular component (CC) terms; and (e) Molecular function (MF) terms. (f) KEGG pathway enrichment analysis of the 23 overlapping genes.
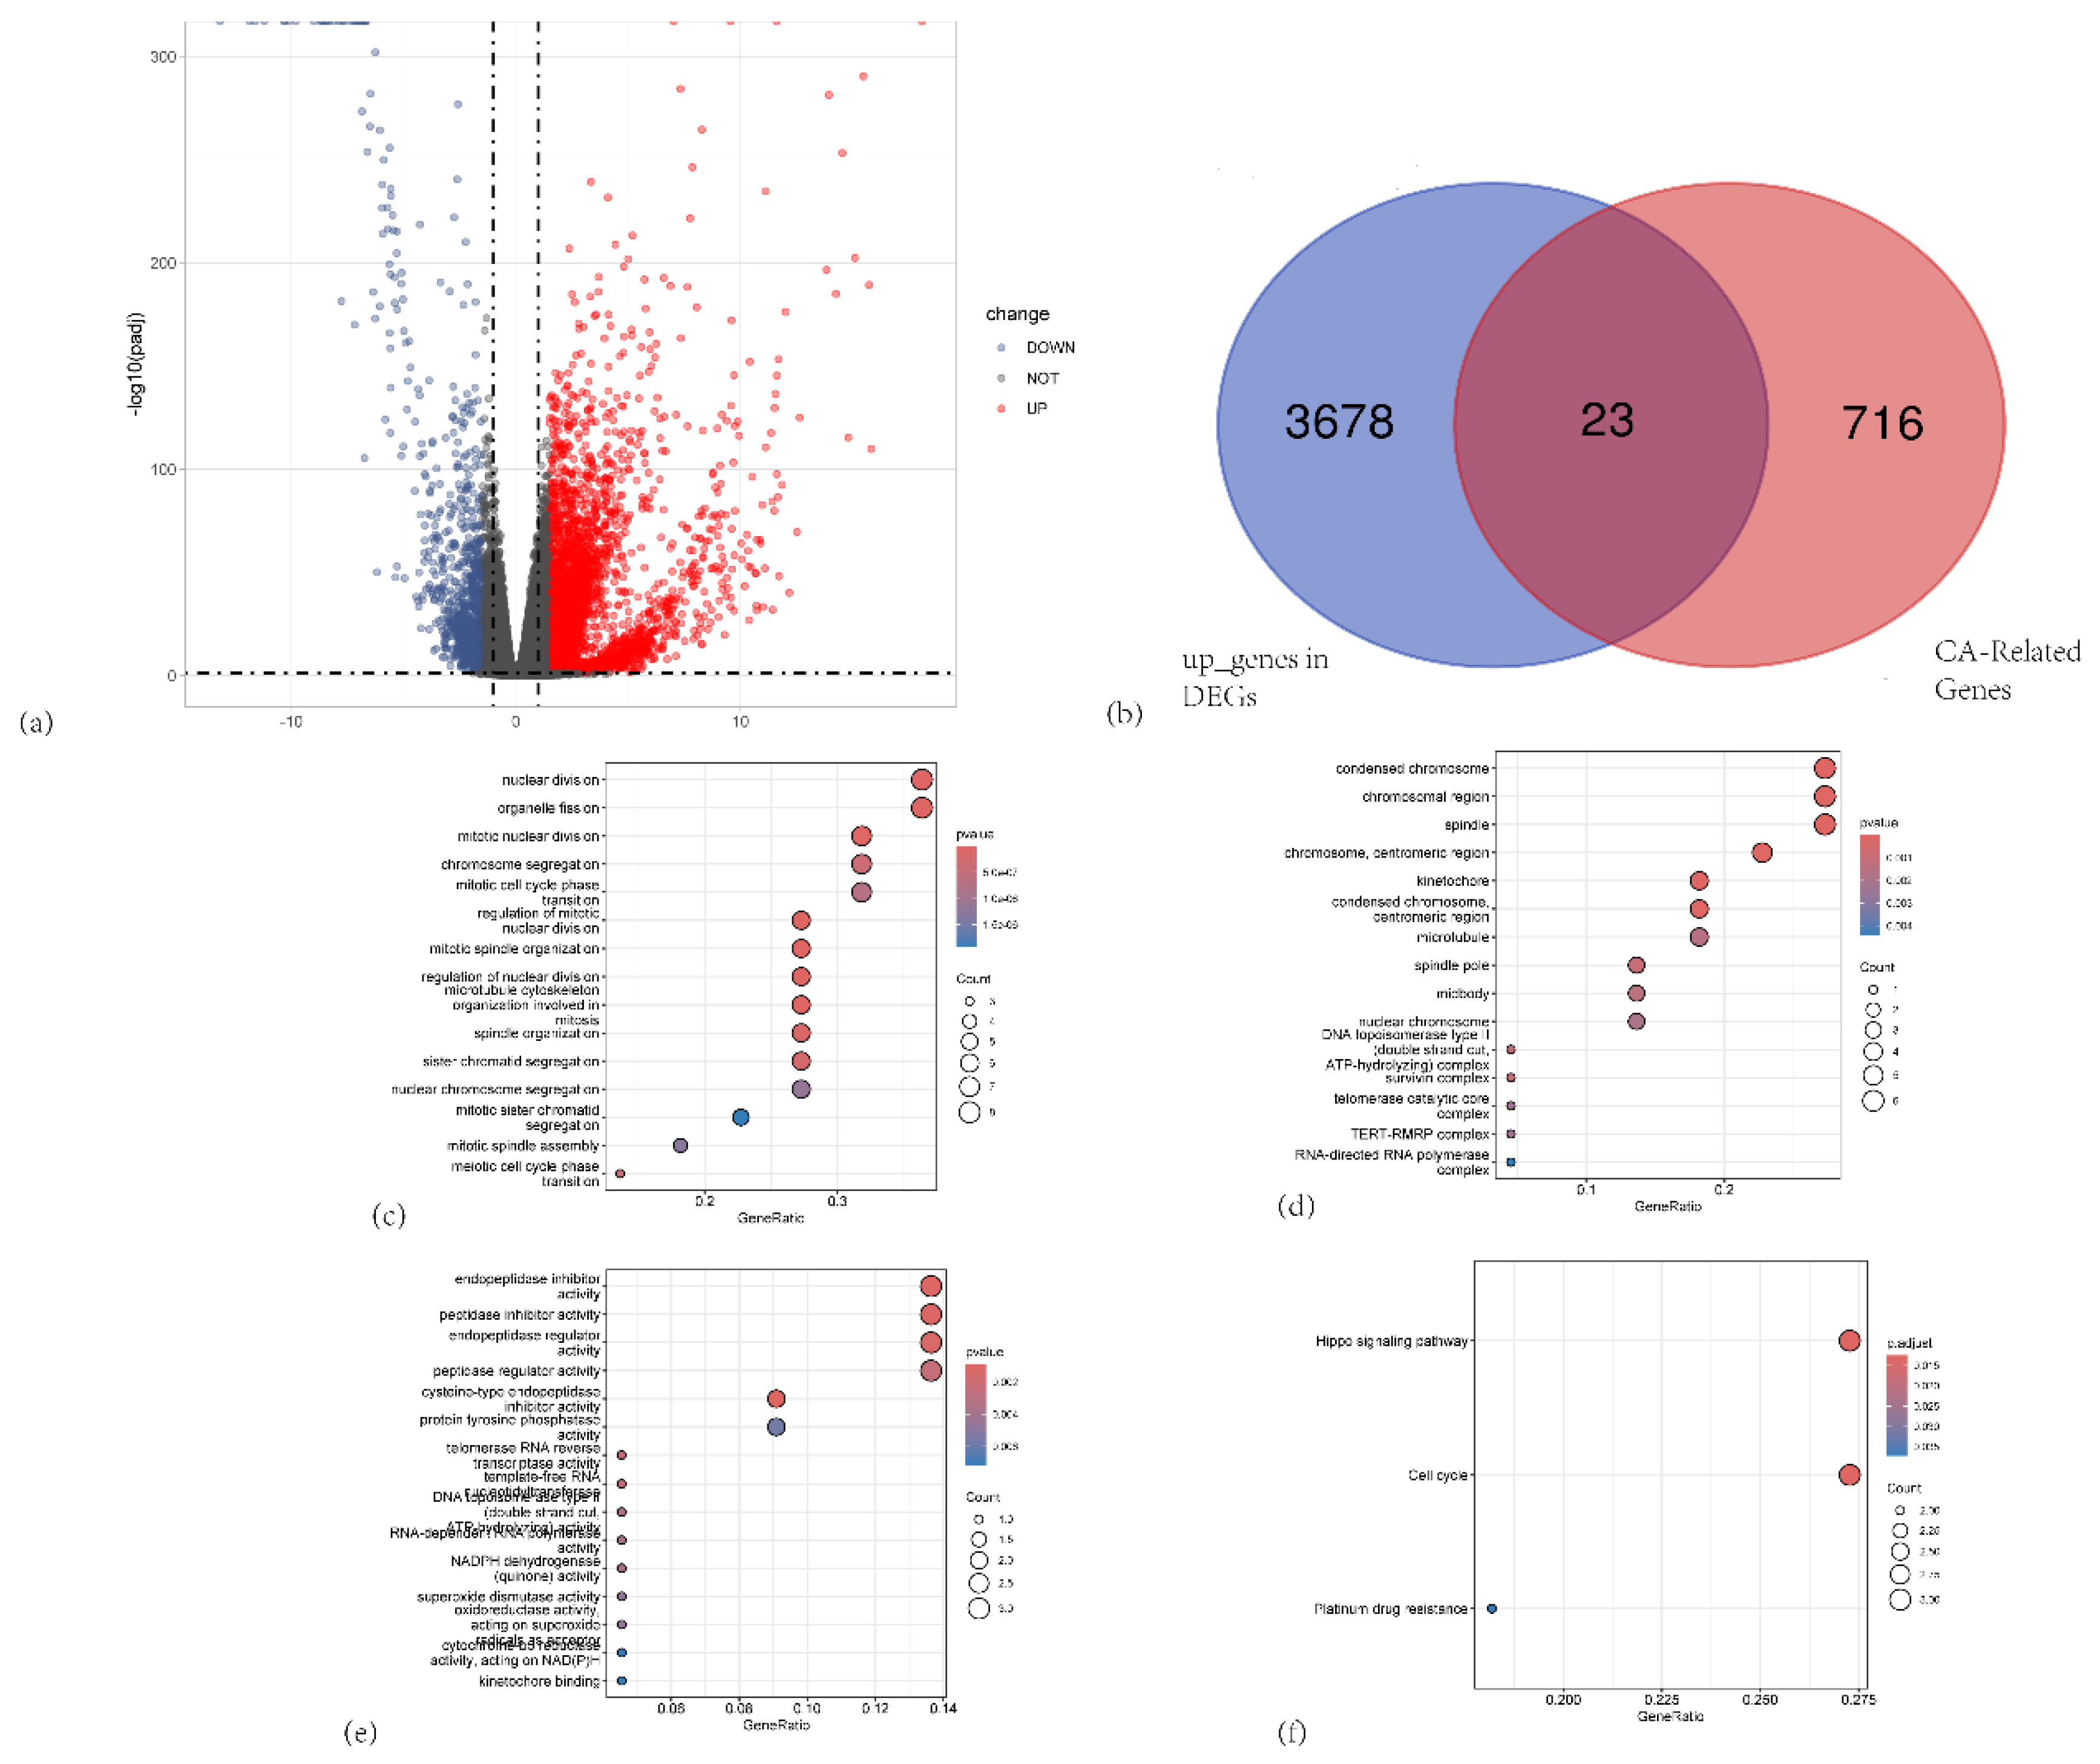
Figure 2.
(a) Forest plot from univariate Cox proportional hazards analysis of the centrosome amplification–related genes in PAAD. (b) LASSO regression model selection using 10-fold cross-validation. (c) Coefficient profiles of the survival-associated genes as a function of log(λ).
Figure 2.
(a) Forest plot from univariate Cox proportional hazards analysis of the centrosome amplification–related genes in PAAD. (b) LASSO regression model selection using 10-fold cross-validation. (c) Coefficient profiles of the survival-associated genes as a function of log(λ).
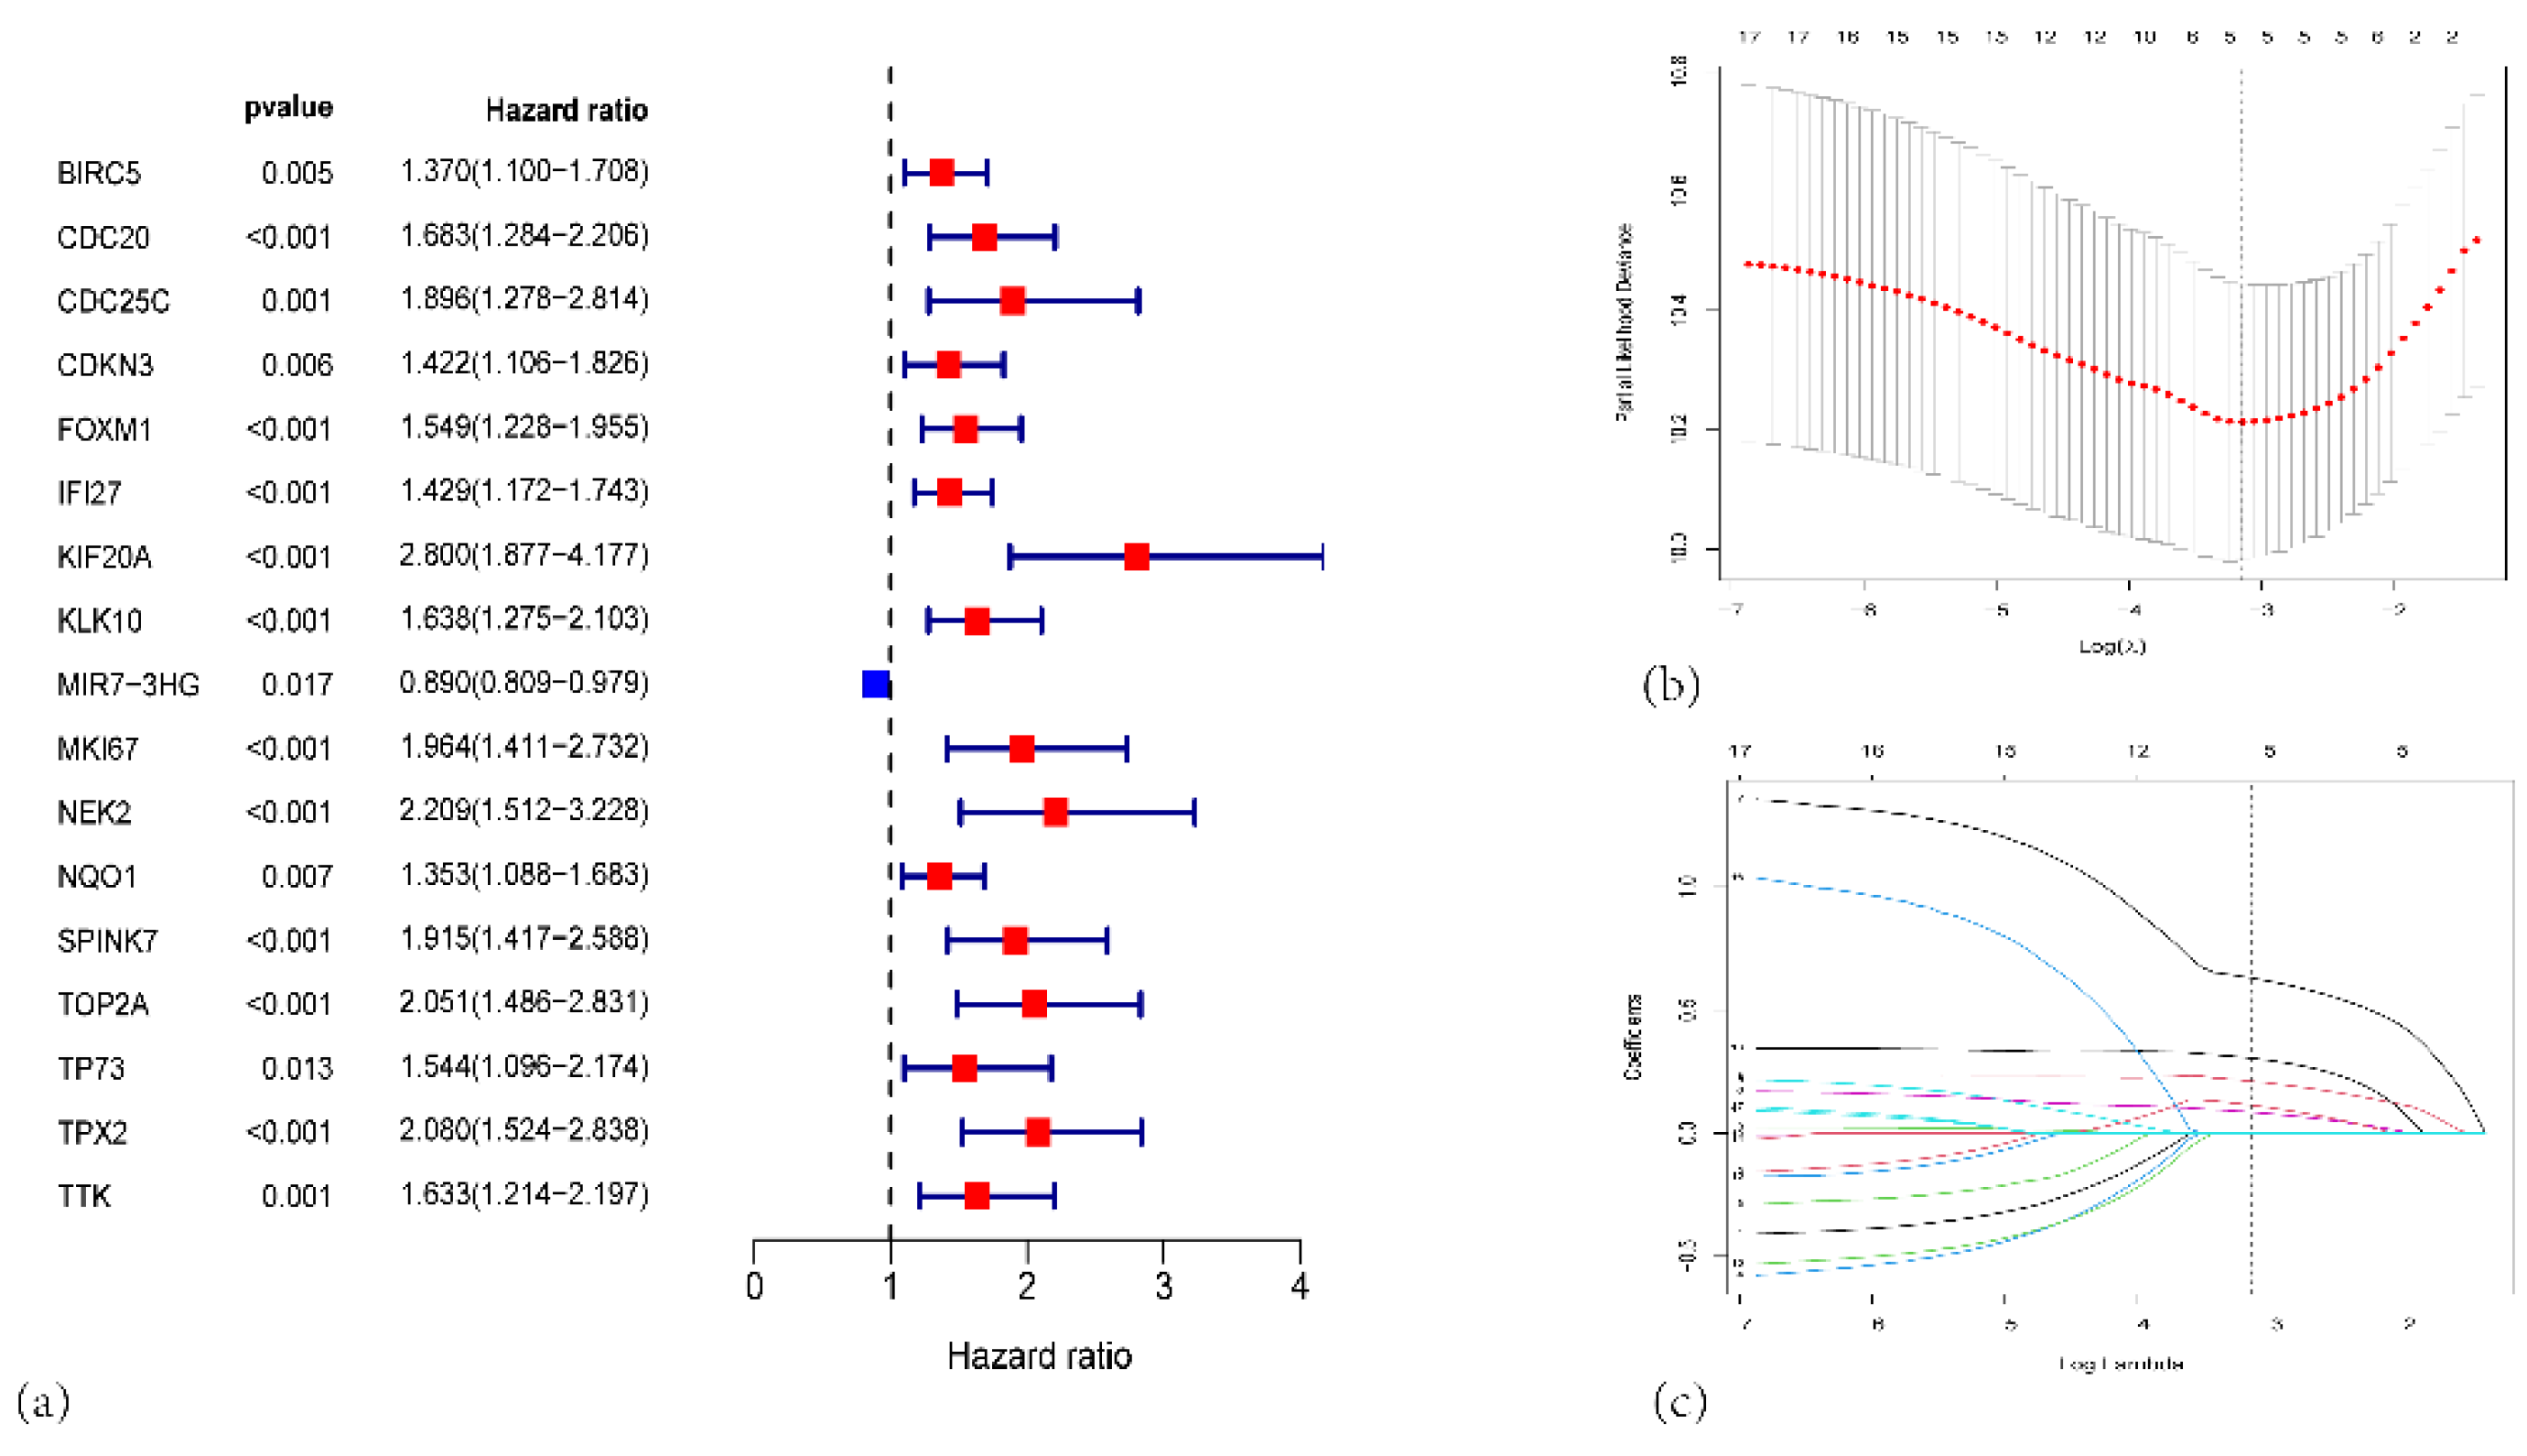
Figure 3.
(a) Kaplan-Meier survival curves for the high-risk (red, n=88) and low-risk (blue, n=89) groups in the TCGA-PAAD cohort. (b) Risk score distribution plot. Each dot represents an individual patient. (c) Scatter plot showing each patient’s survival status (alive or dead) and OS time. (d) Time-dependent ROC curves for 2-, 3-, and 5-year OS prediction. (e) Heatmap illustrating the expression patterns of the five signature genes (IFI27, SPINK7, KLK10, KIF20A, and TOP2A) in high-risk (red) and low-risk (blue) patients.
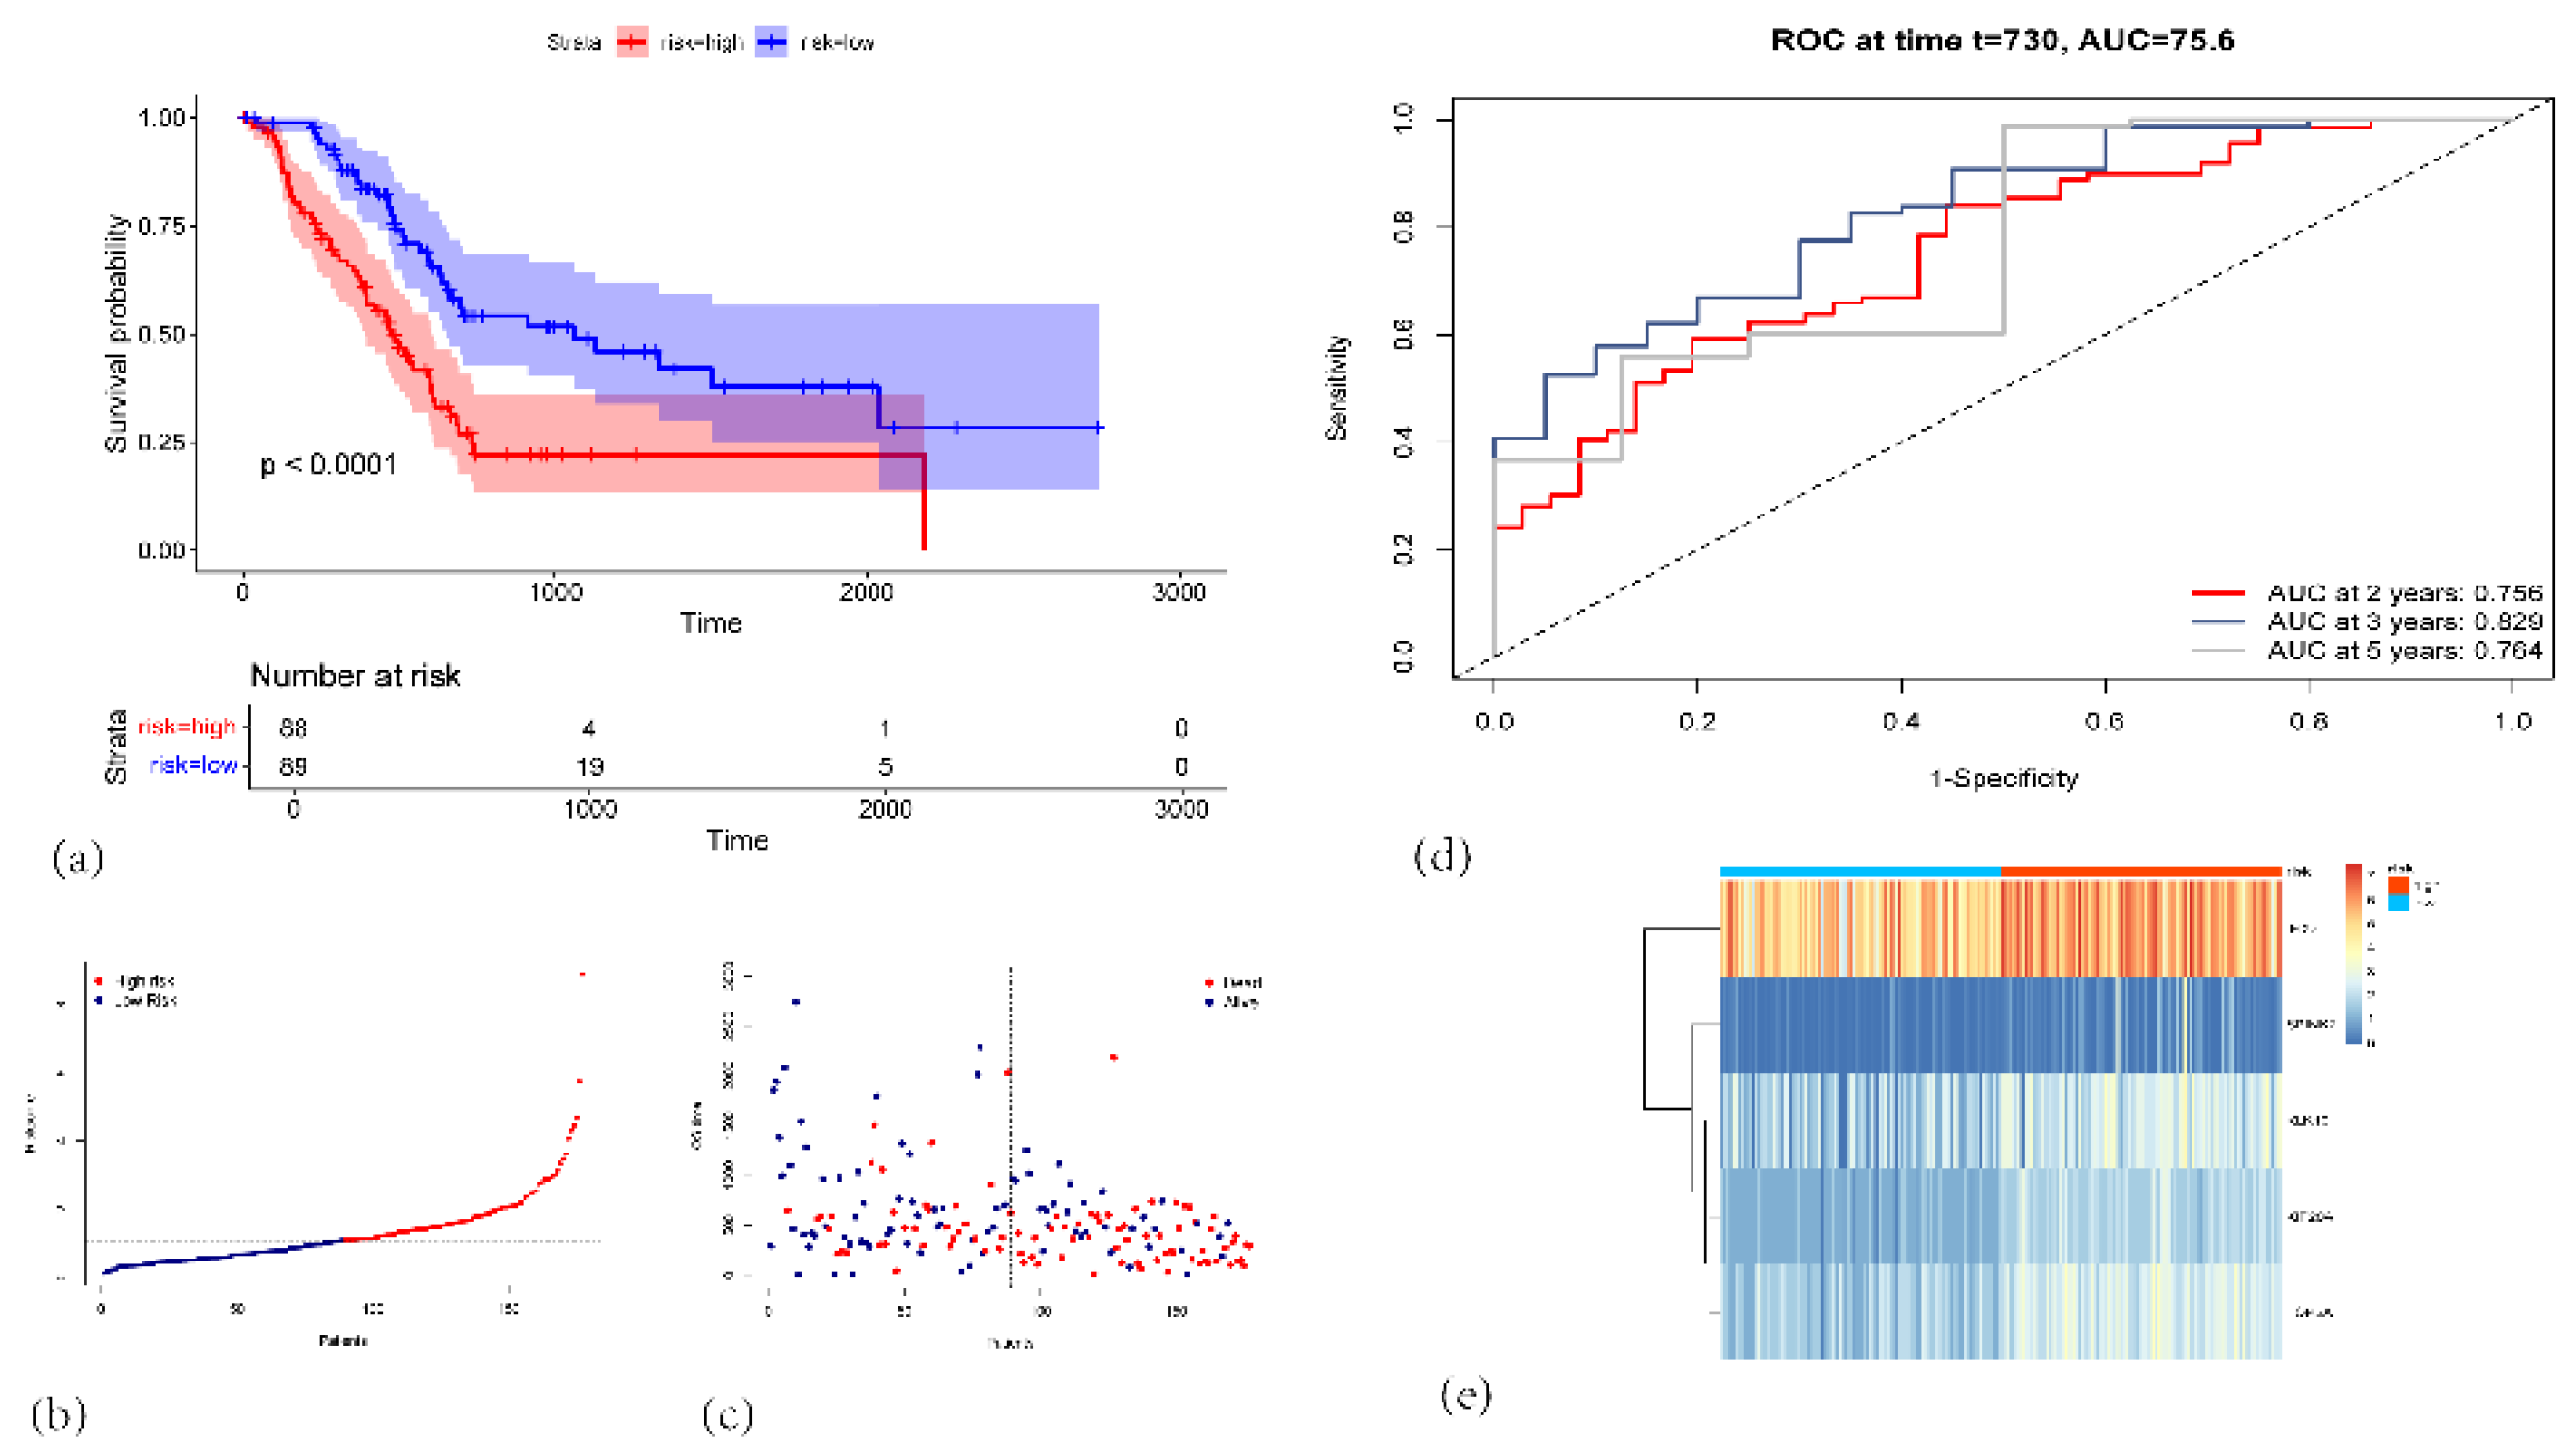
Figure 4.
(a) KM survival curves for the high-risk (red) and low-risk (blue) groups in GSE62452 validation cohort. (b)Corresponding ROC curves for predicting 2-, 3-, and 5-year overall survival (OS), with the respective AUC values indicated in GSE62452 validation cohort. (c)KM survival curves for high-risk versus low-risk groups in GSE78229 validation cohort. (d) Time-dependent ROC curves at 2, 3, and 5 years, illustrating the predictive performance of the signature in GSE78229 validation cohort. (e) KM survival curves showing significant differences in OS between high-risk and low-risk groups in GSE183795 validation cohort. (f) ROC curves demonstrating the model’s performance at 2, 3, and 5 years in GSE183795 validation cohort.
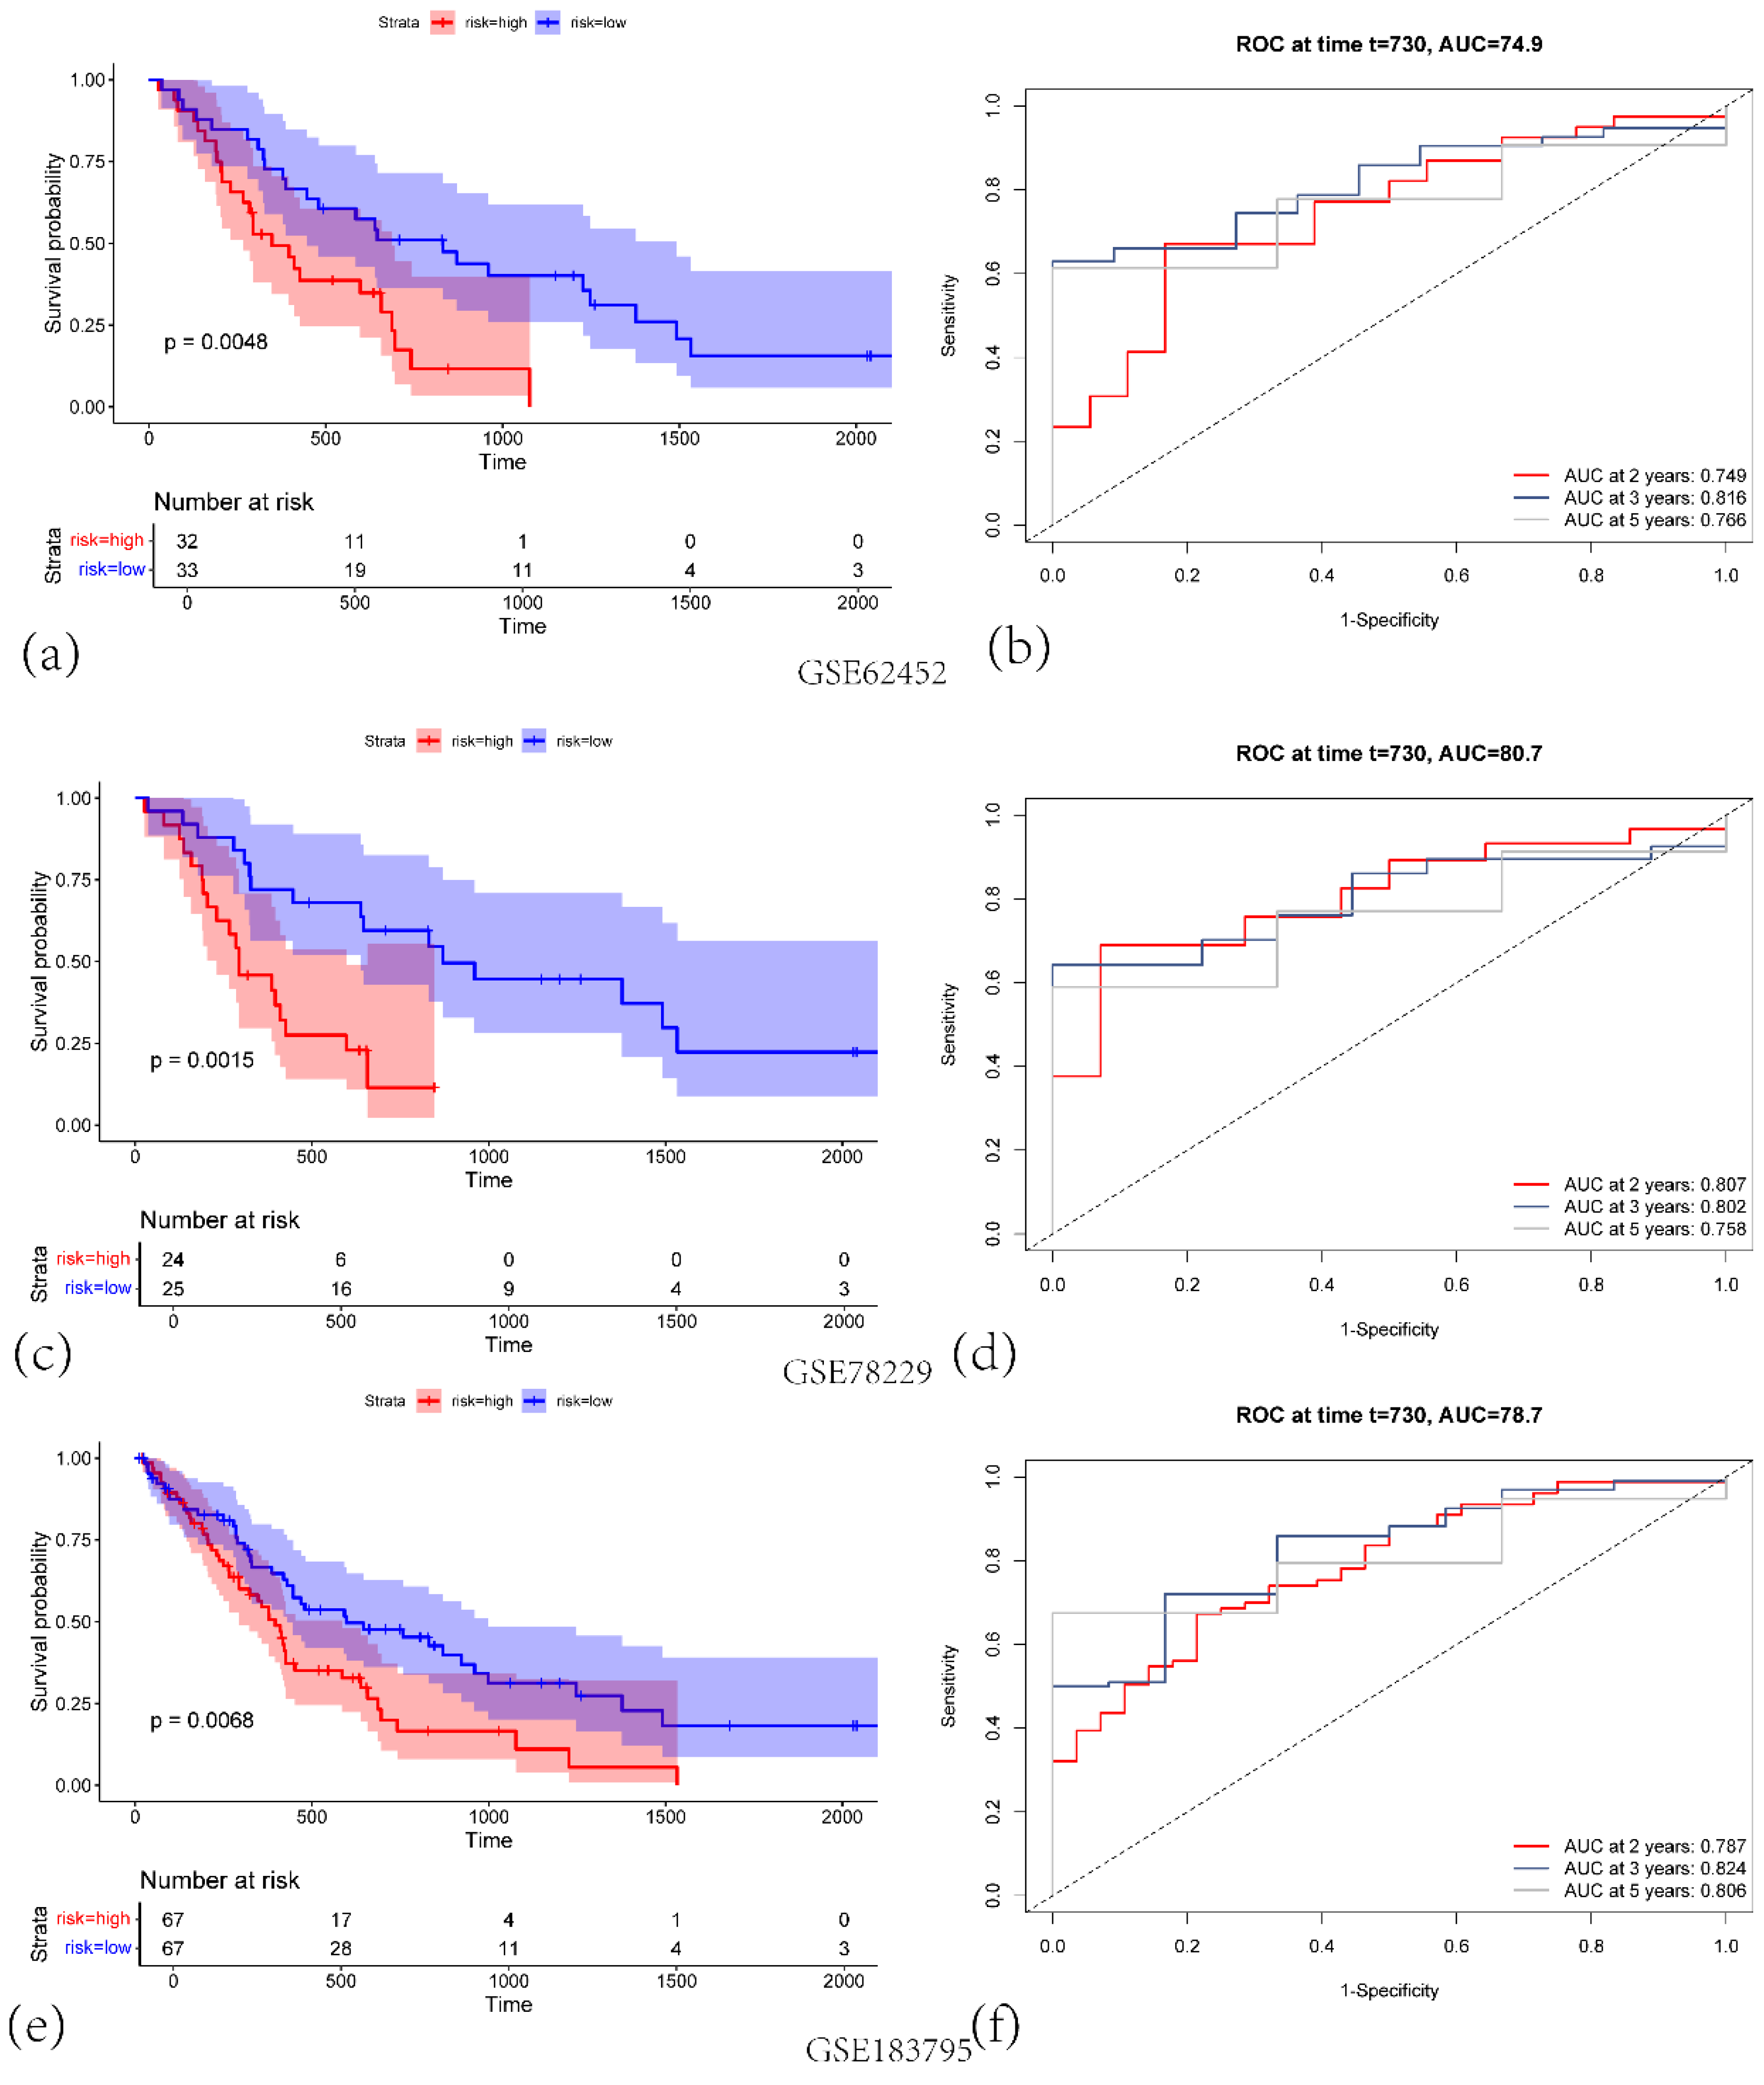
Figure 5.
(a) Nomogram for predicting 2-year, 3-year, and 5-year overall survival (OS) in PAAD patients. (b)Time-dependent ROC curves of the nomogram for predicting 2-year, 3-year, and 5-year survival. (c) Calibration plots for predicted survival at 2 years (orange), 3 years (green), and 5 years (black).
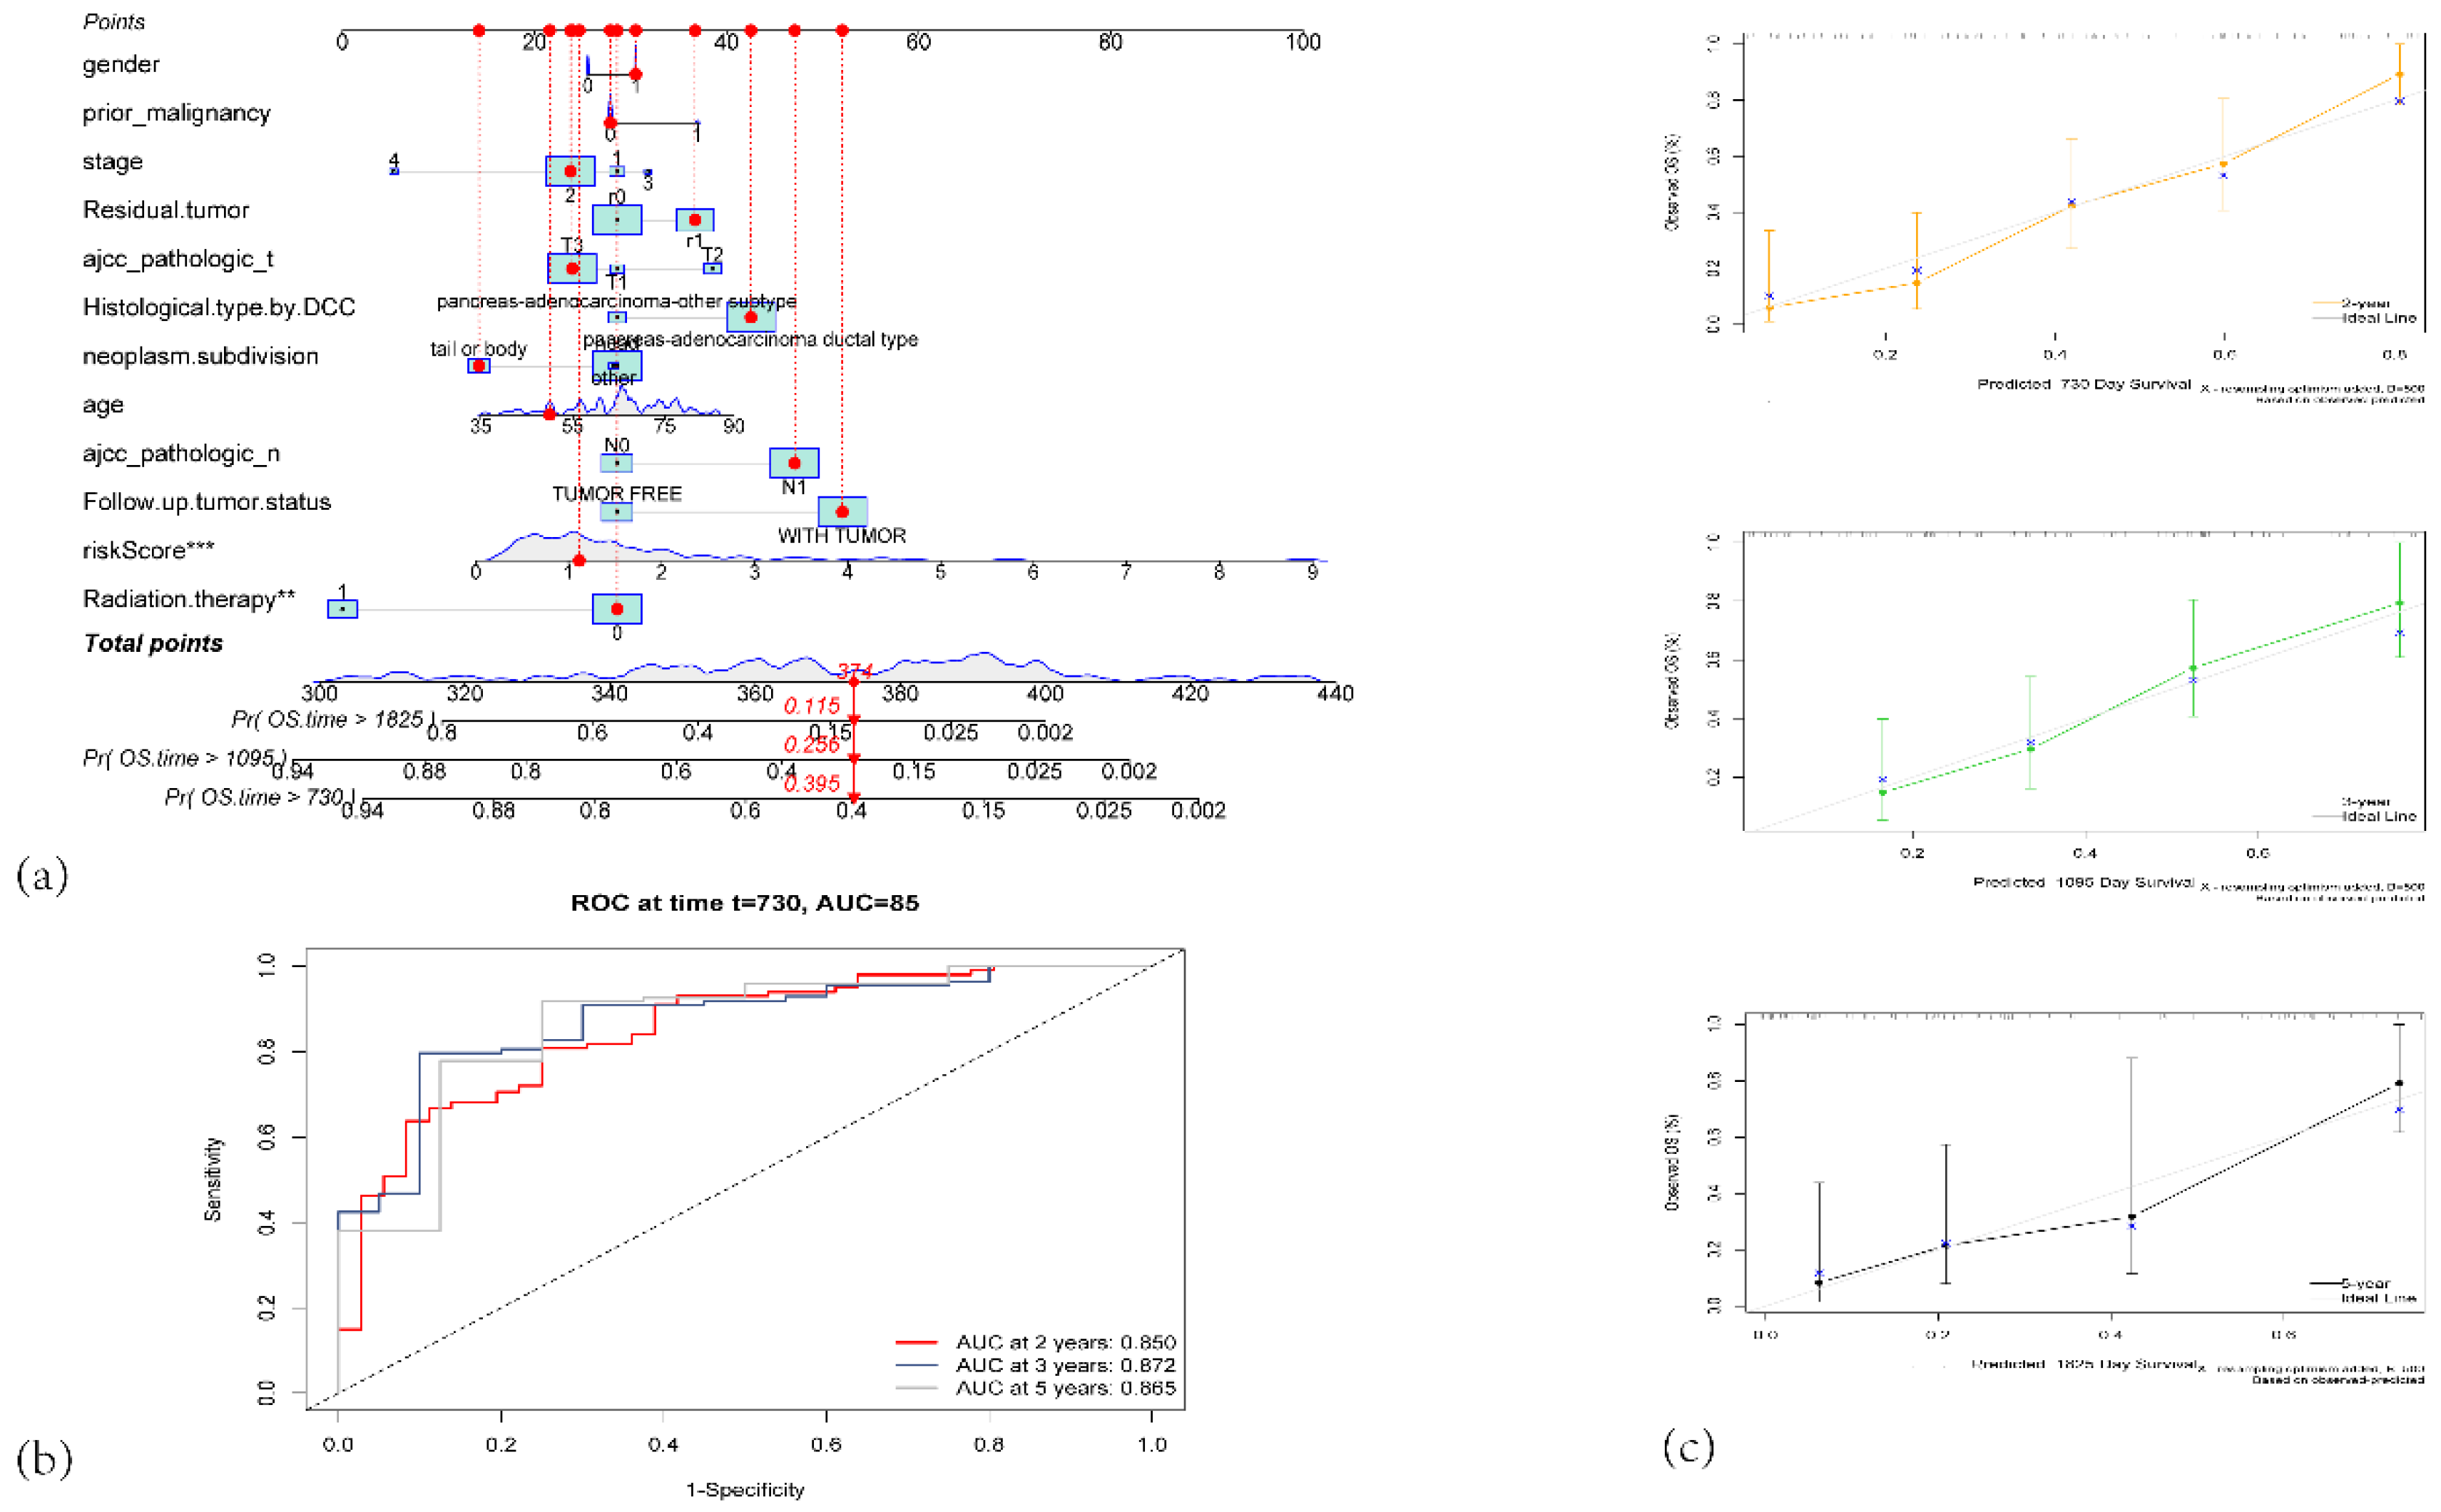
Figure 6.
(a) A heatmap showing the distribution of clinical features and risk scores across high-risk and low-risk groups. (b) Boxplot showing the risk score expression distribution based on the follow-up tumor status. (c) Boxplot comparing the risk score expression based on histological type by DCC. (d) Boxplot of risk score expression based on residual tumor status. (e) Boxplot of risk score expression based on radiation therapy status.
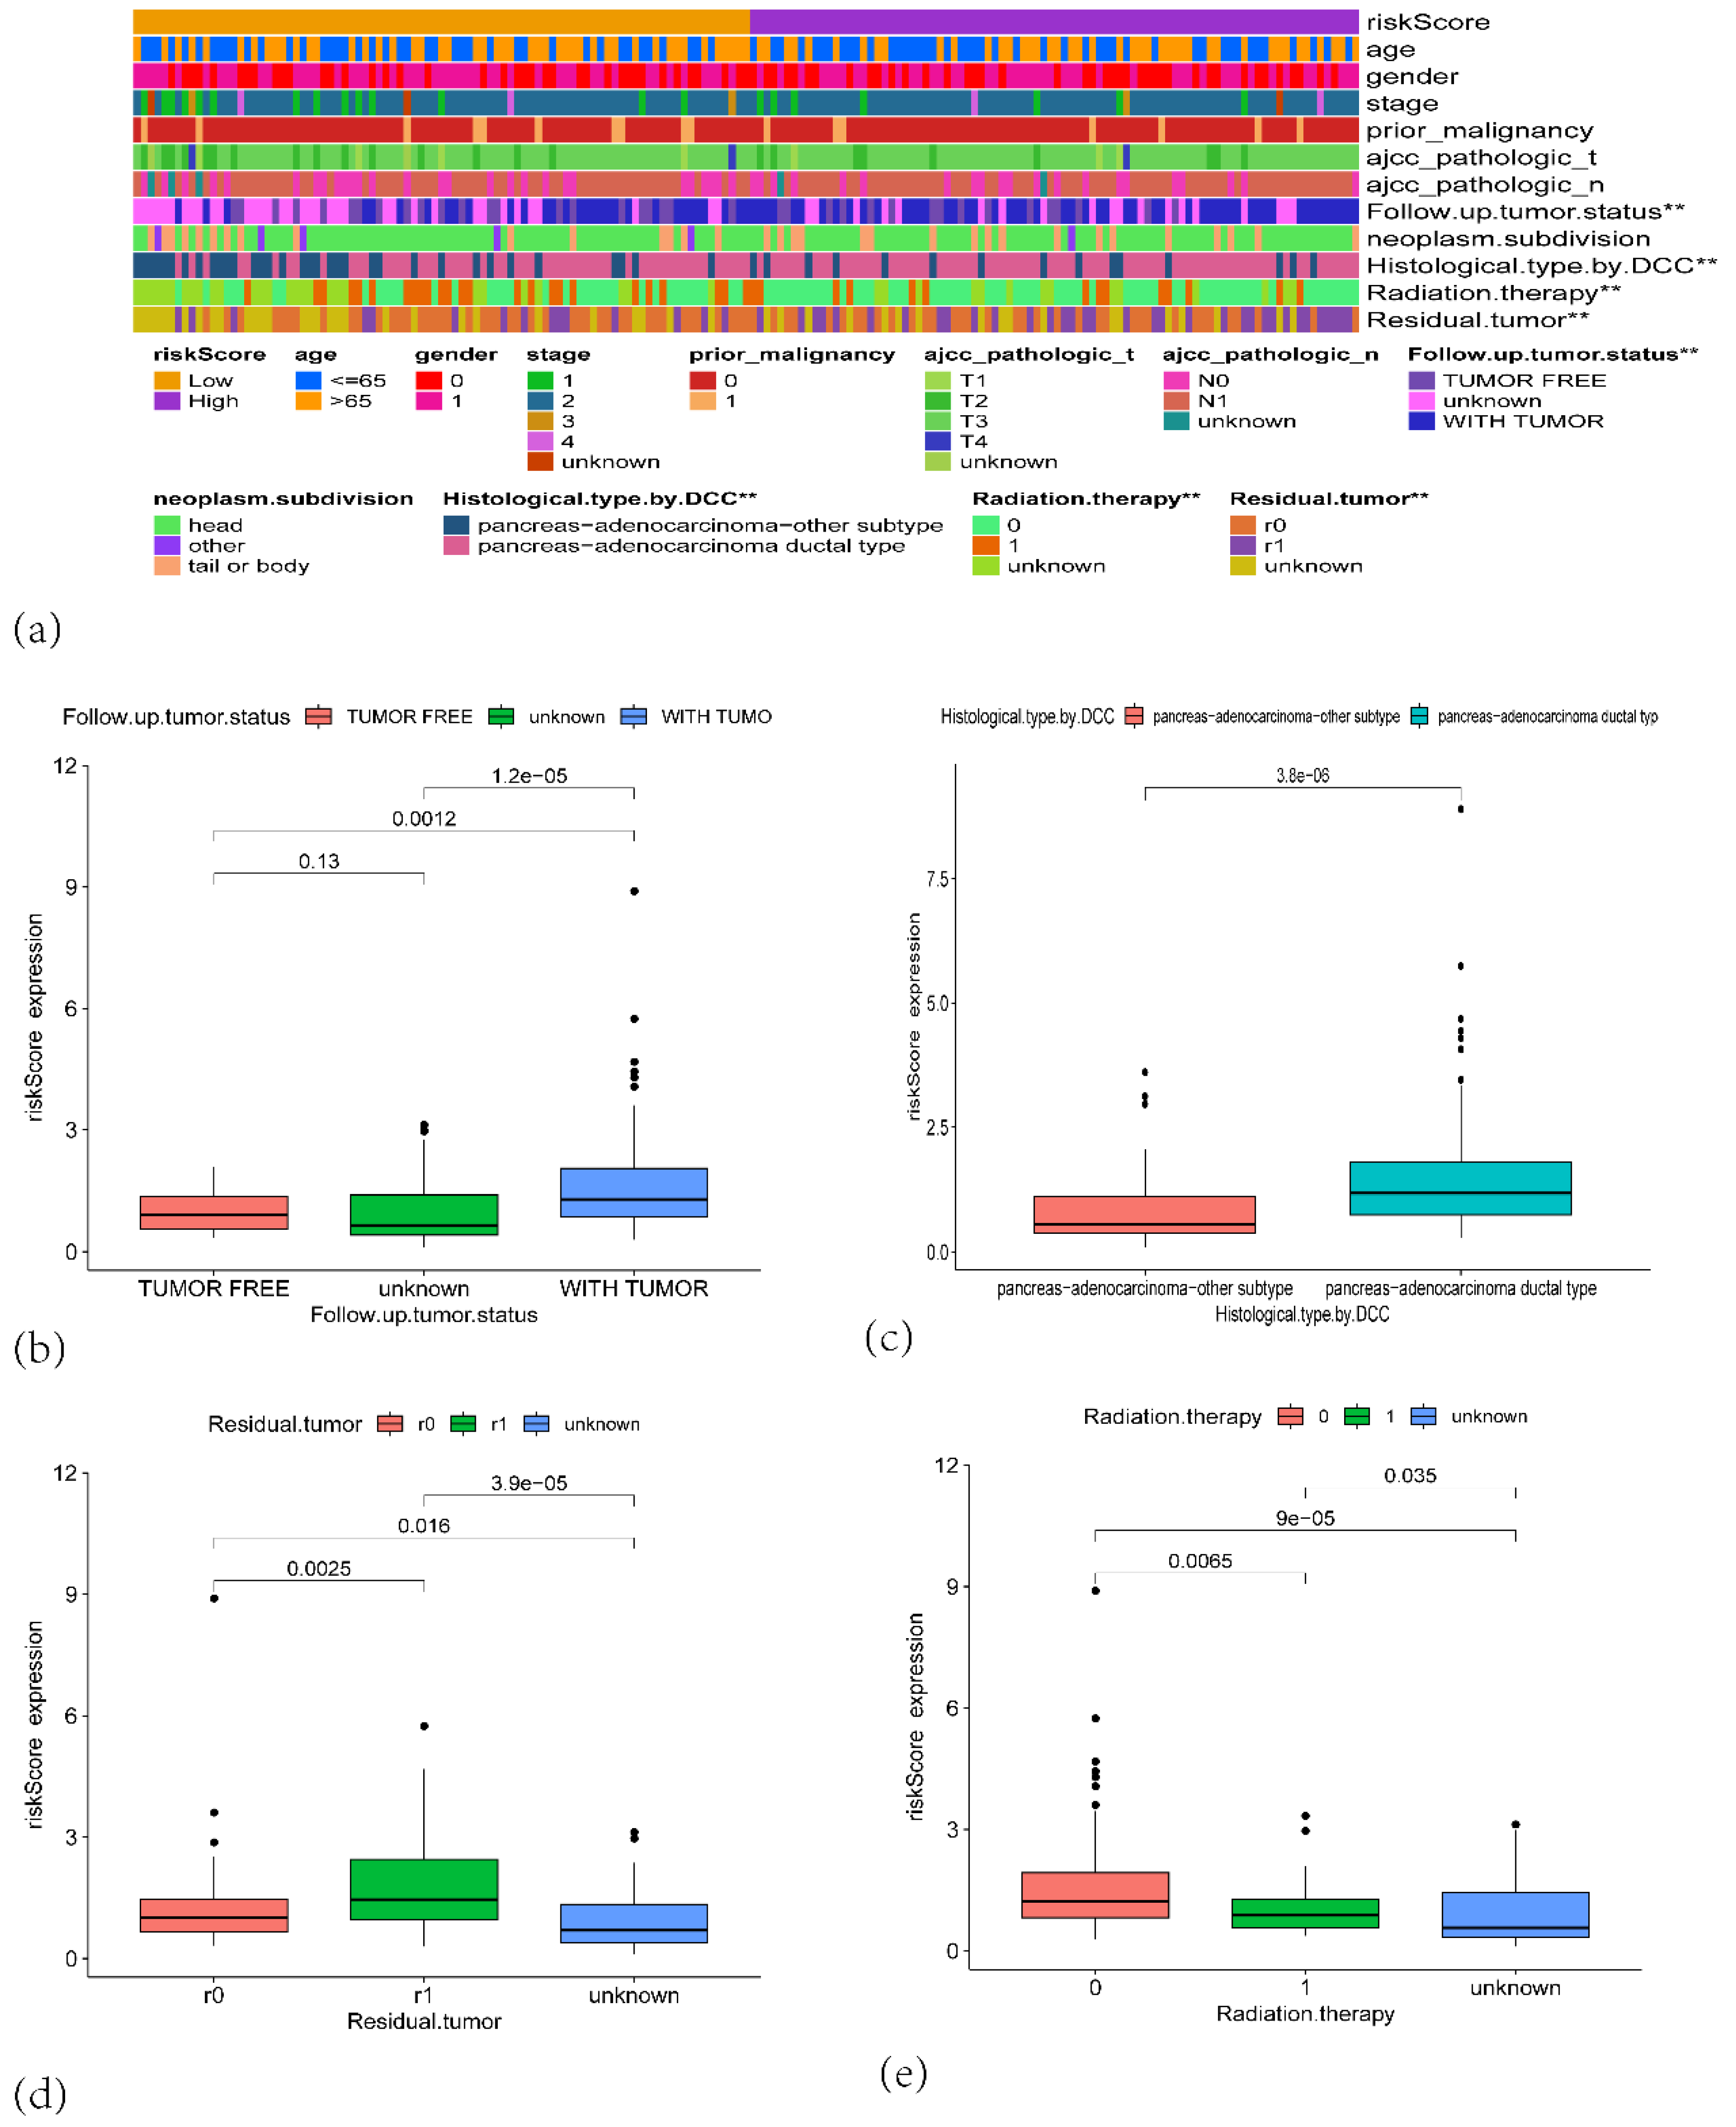
Figure 7.
(a) Stacked bar plot showing the proportion of different immune cell types across the PAAD patients in TCGA. (b) Violin plots depicting the distribution of immune cell fractions across high-risk (red) and low-risk (blue) groups.
Figure 7.
(a) Stacked bar plot showing the proportion of different immune cell types across the PAAD patients in TCGA. (b) Violin plots depicting the distribution of immune cell fractions across high-risk (red) and low-risk (blue) groups.
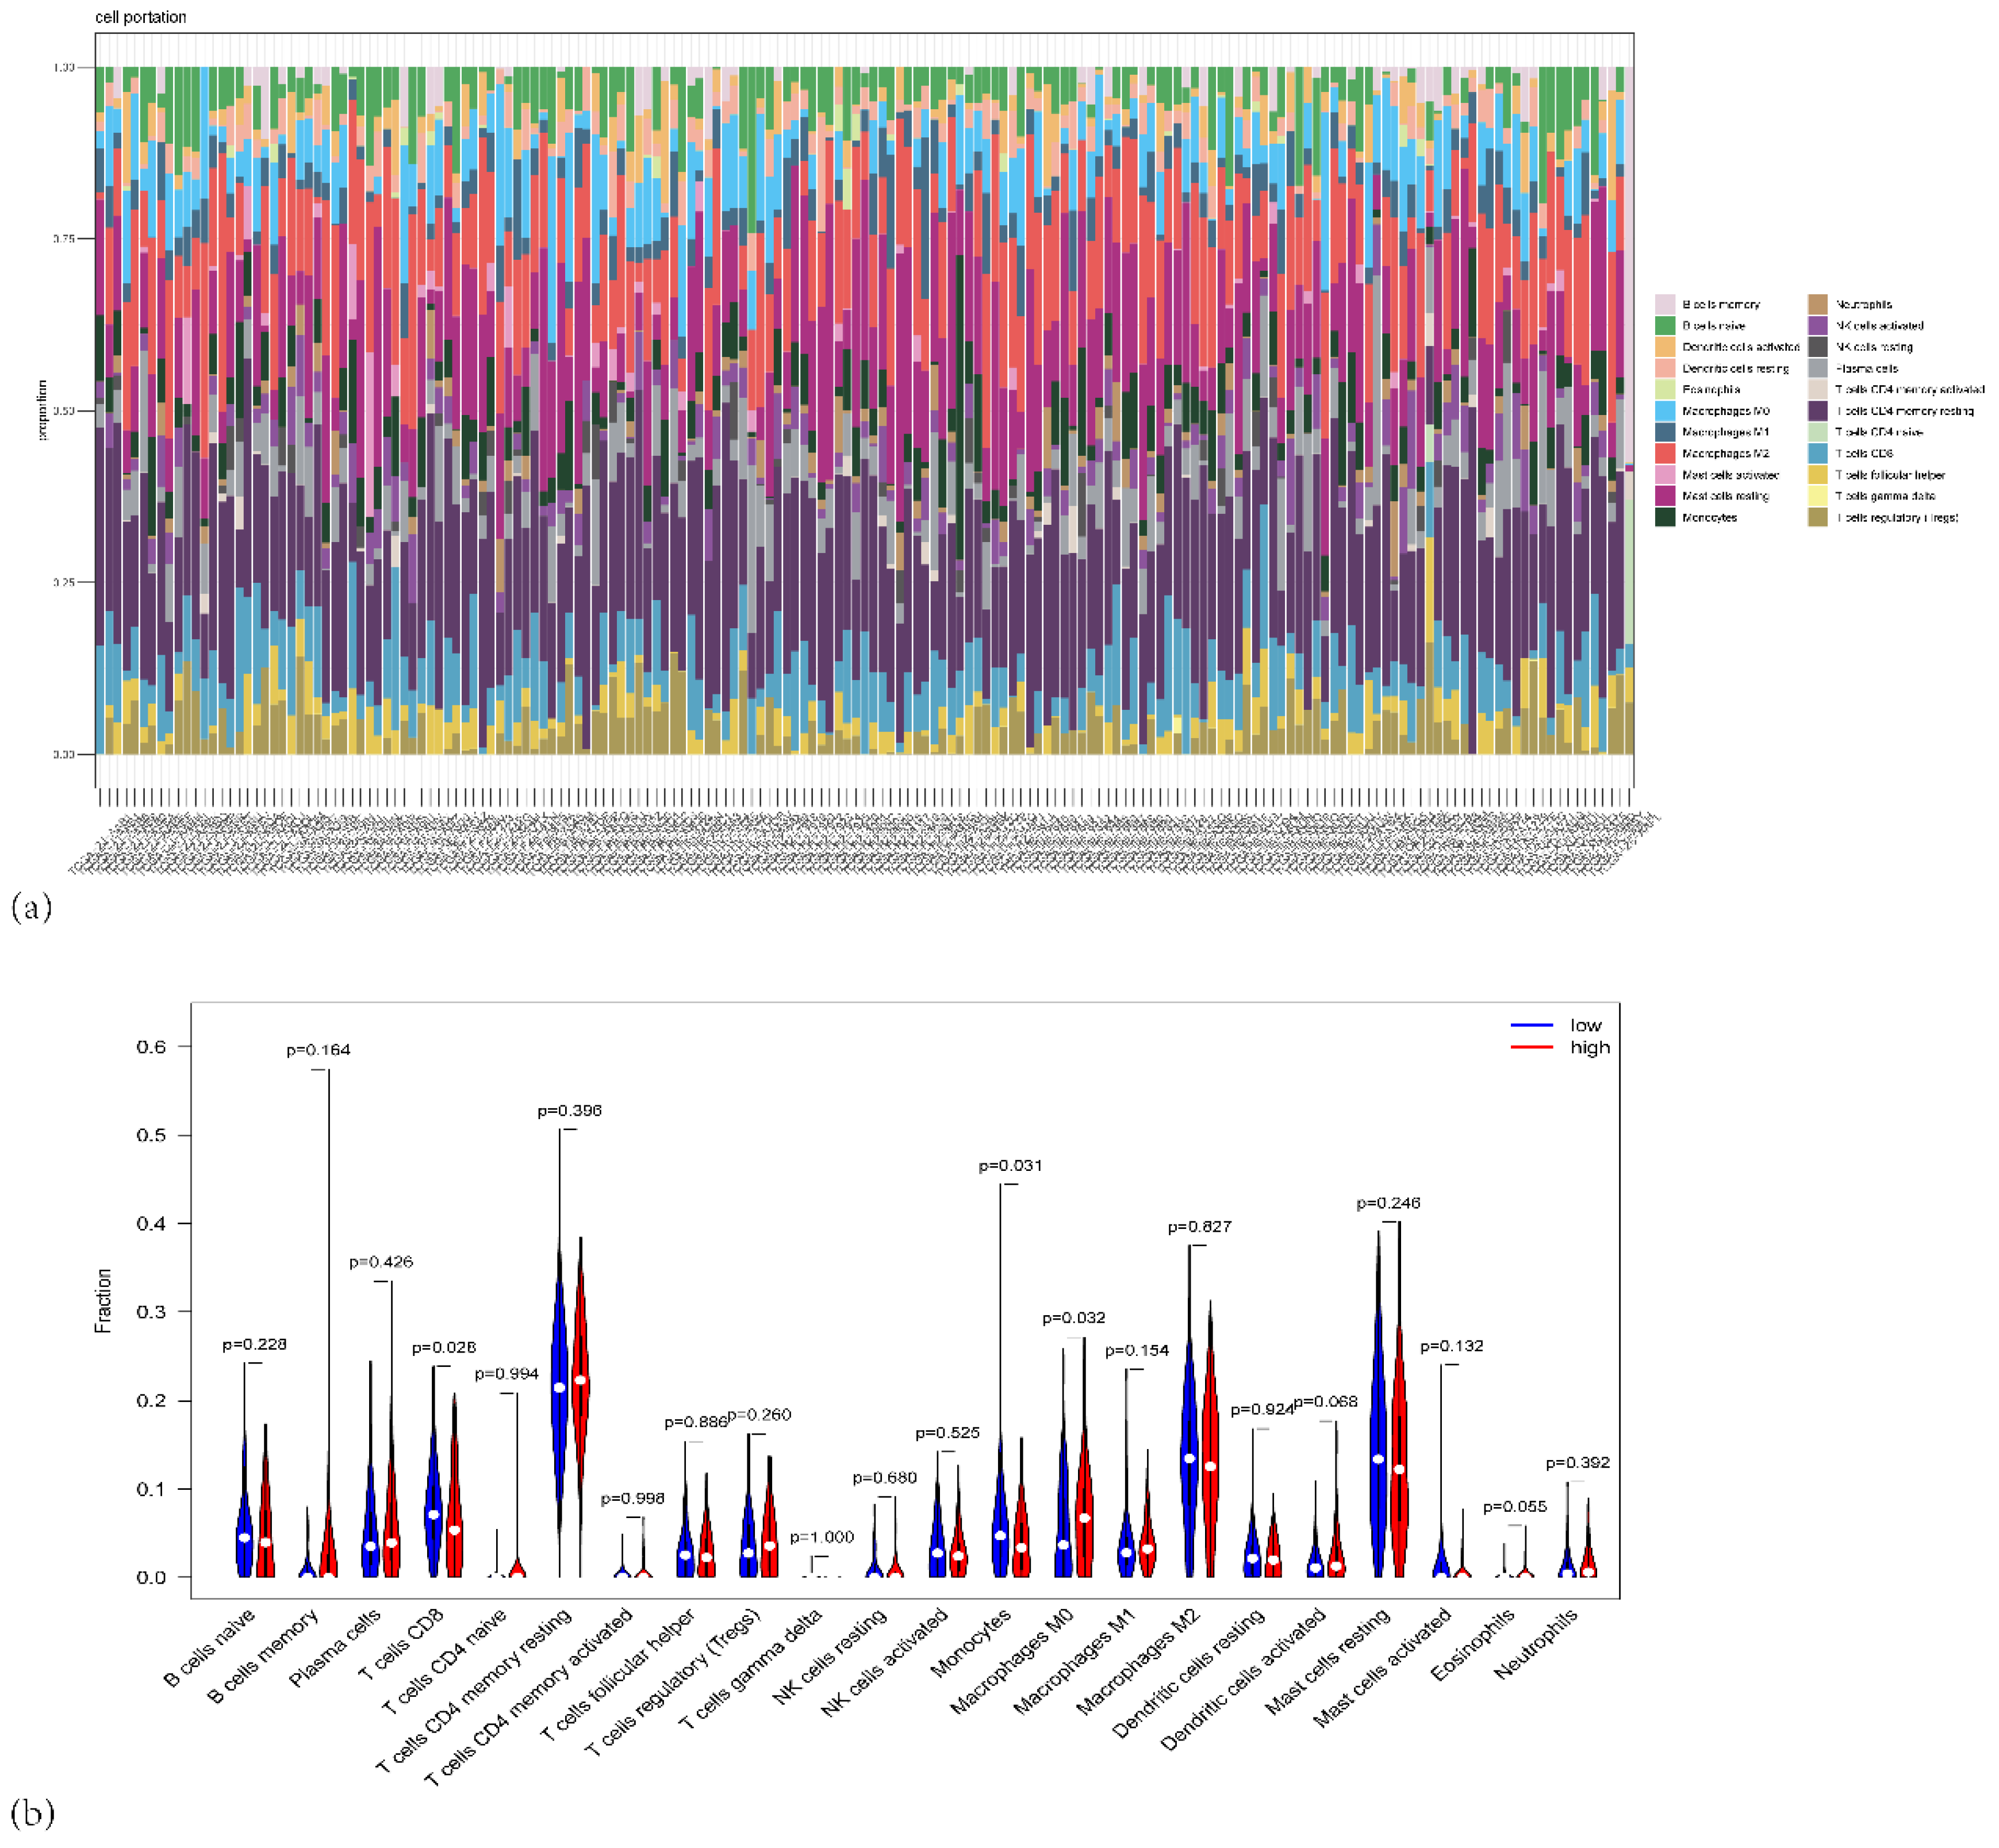
Figure 8.
(a) Forest plot of the correlation between the proportion of different immune cells and risk scores. (b) Heatmap showing the correlation matrix between the different immune cell fractions. (c) Scatter plots showing the relationship between risk scores and specific immune cell types.
Figure 8.
(a) Forest plot of the correlation between the proportion of different immune cells and risk scores. (b) Heatmap showing the correlation matrix between the different immune cell fractions. (c) Scatter plots showing the relationship between risk scores and specific immune cell types.
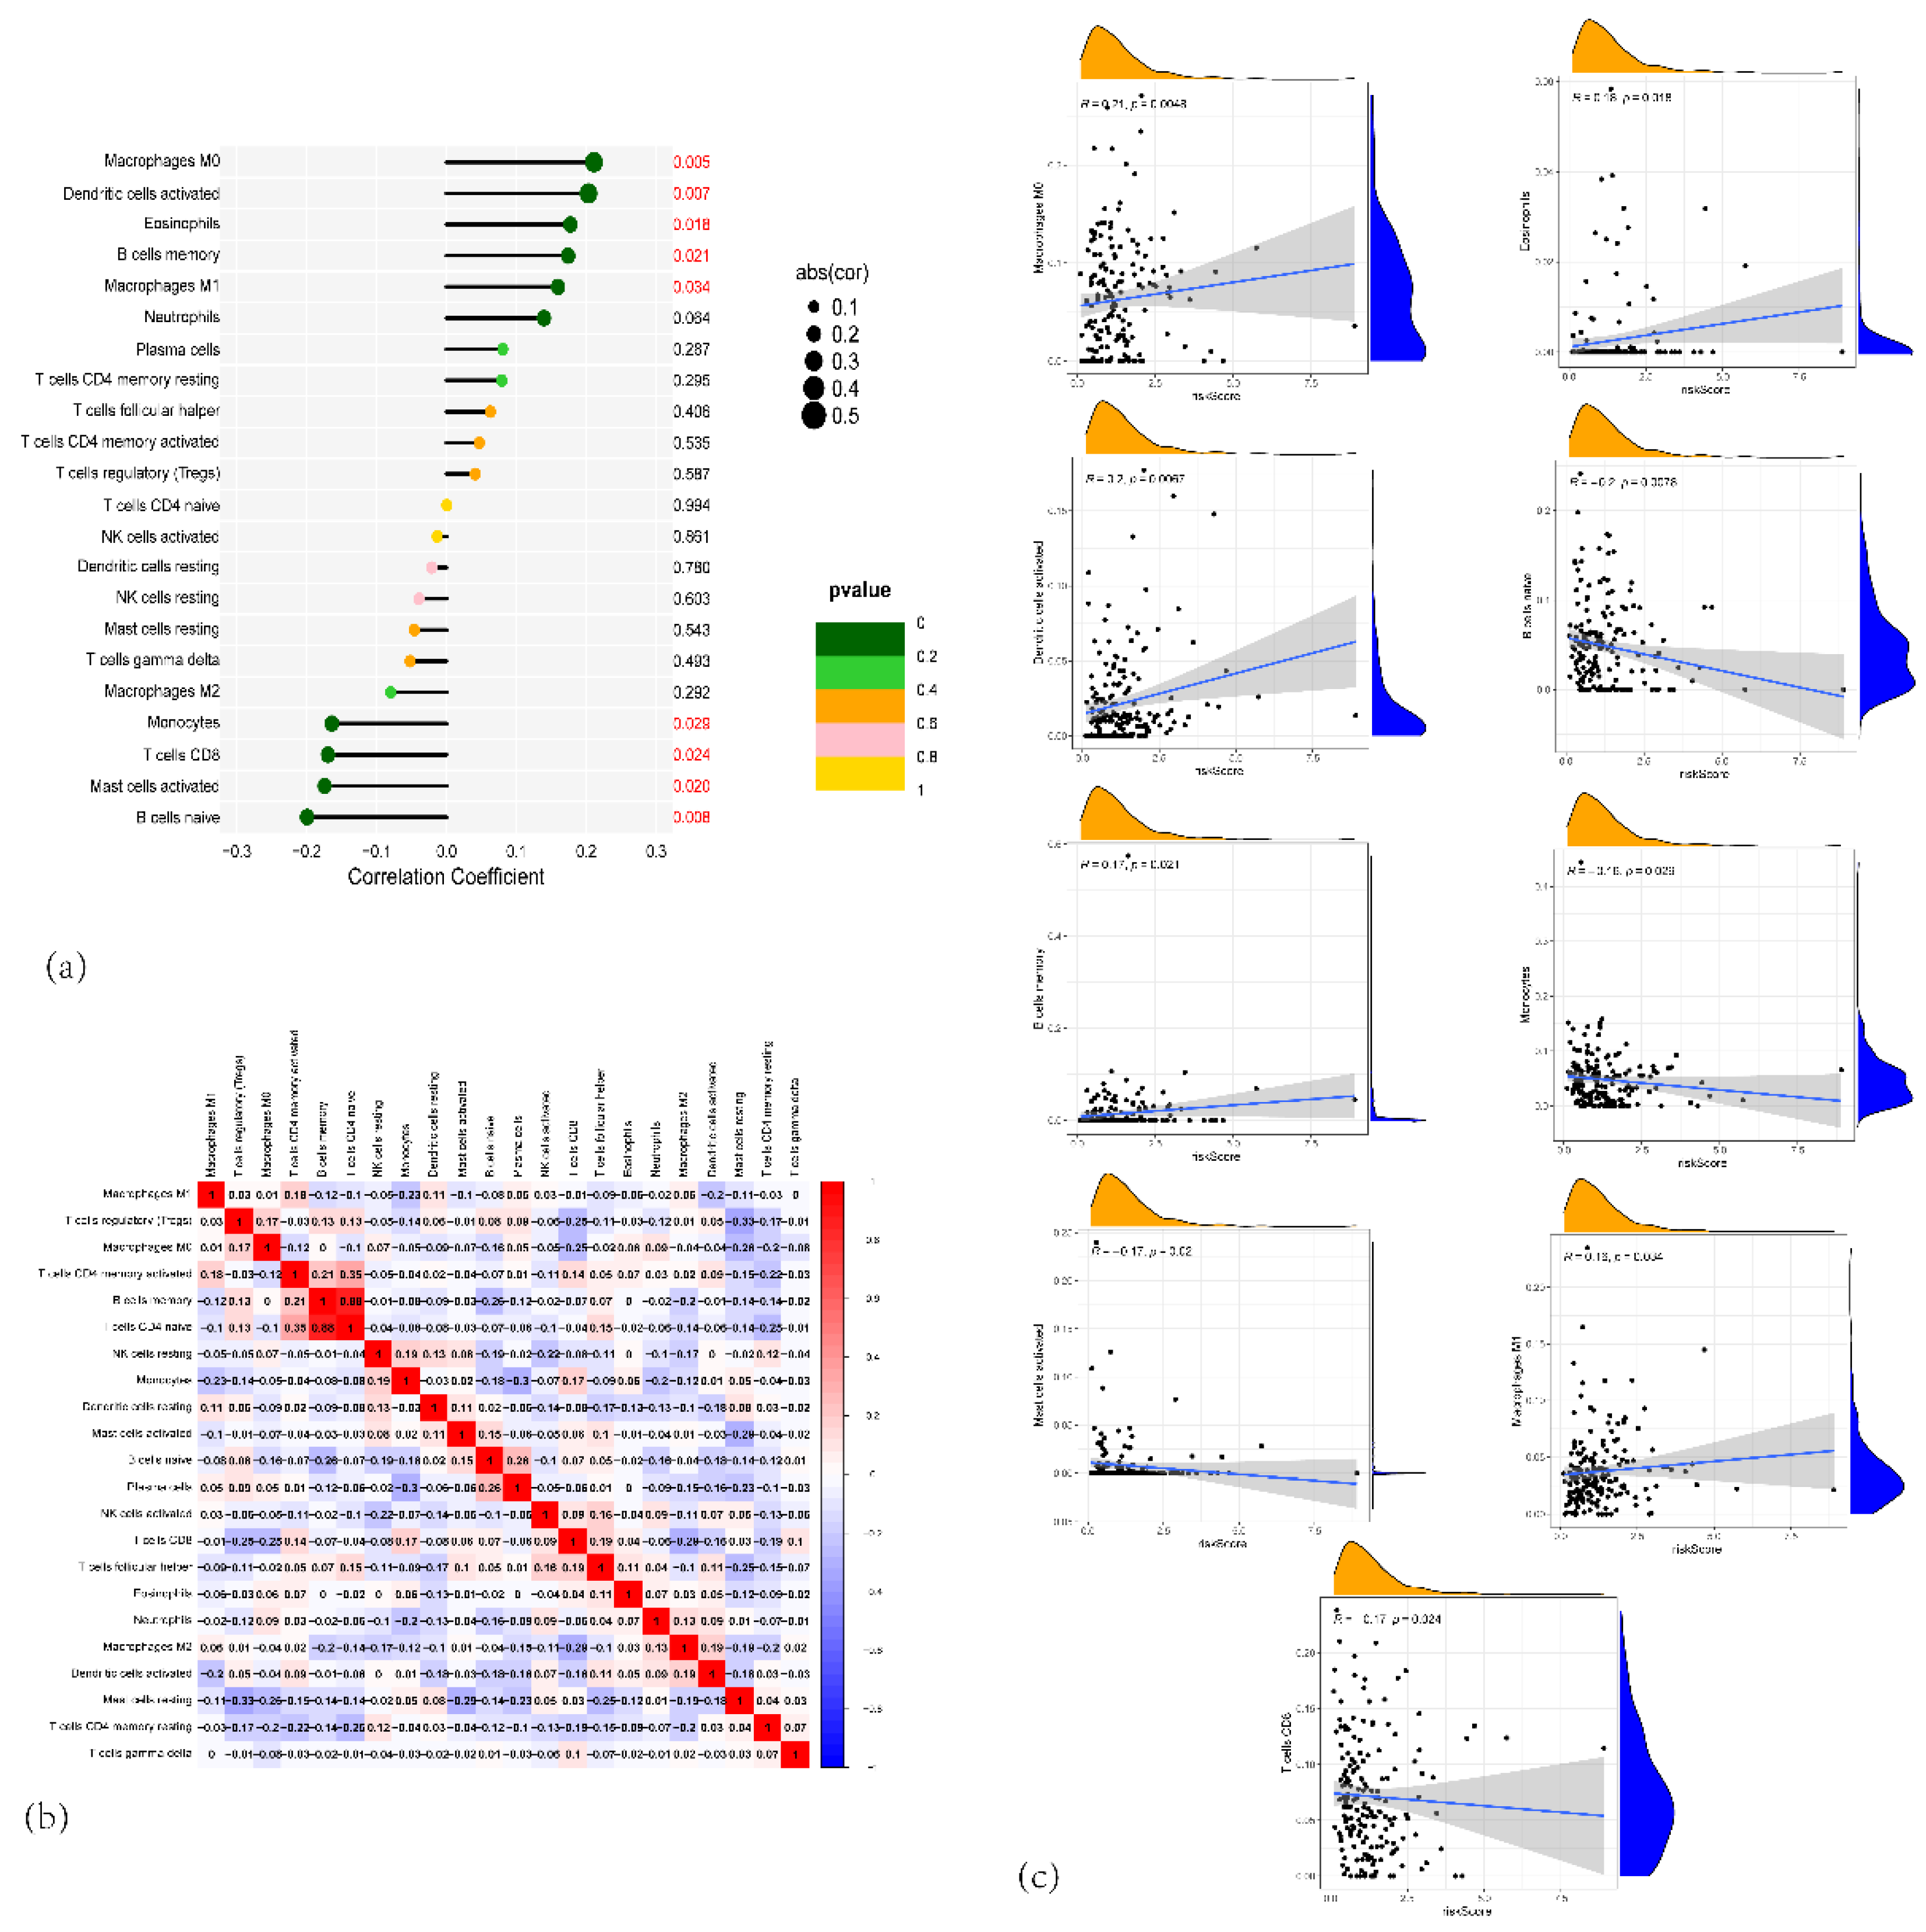
Figure 9.
(a) Box plots showing the immune scores for various immune cells across high-risk and low-risk groups in PAAD. (b) Box plots showing the differences in immune-related function between the high-risk and low-risk groups. (c) Box plots showing the gene expression of immune checkpoint genes such as CD201, CD276, CD70, HLA, and others, comparing high-risk and low-risk PAAD patients. (d) Violin plots showing the TIDE scores between high-risk (red) and low-risk (blue) groups, indicating the potential of immune evasion in the two risk groups. (e) Violin plots comparing the IPS (Immune-related Pathway Signature) scores between high-risk and low-risk PAAD patients, (f) Violin plots showing the differences in ImmuneScore, StromalScore, and ESTIMATEScore, calculated by the ESTIMATE algorithm, comparing high-risk and low-risk PAAD patients.
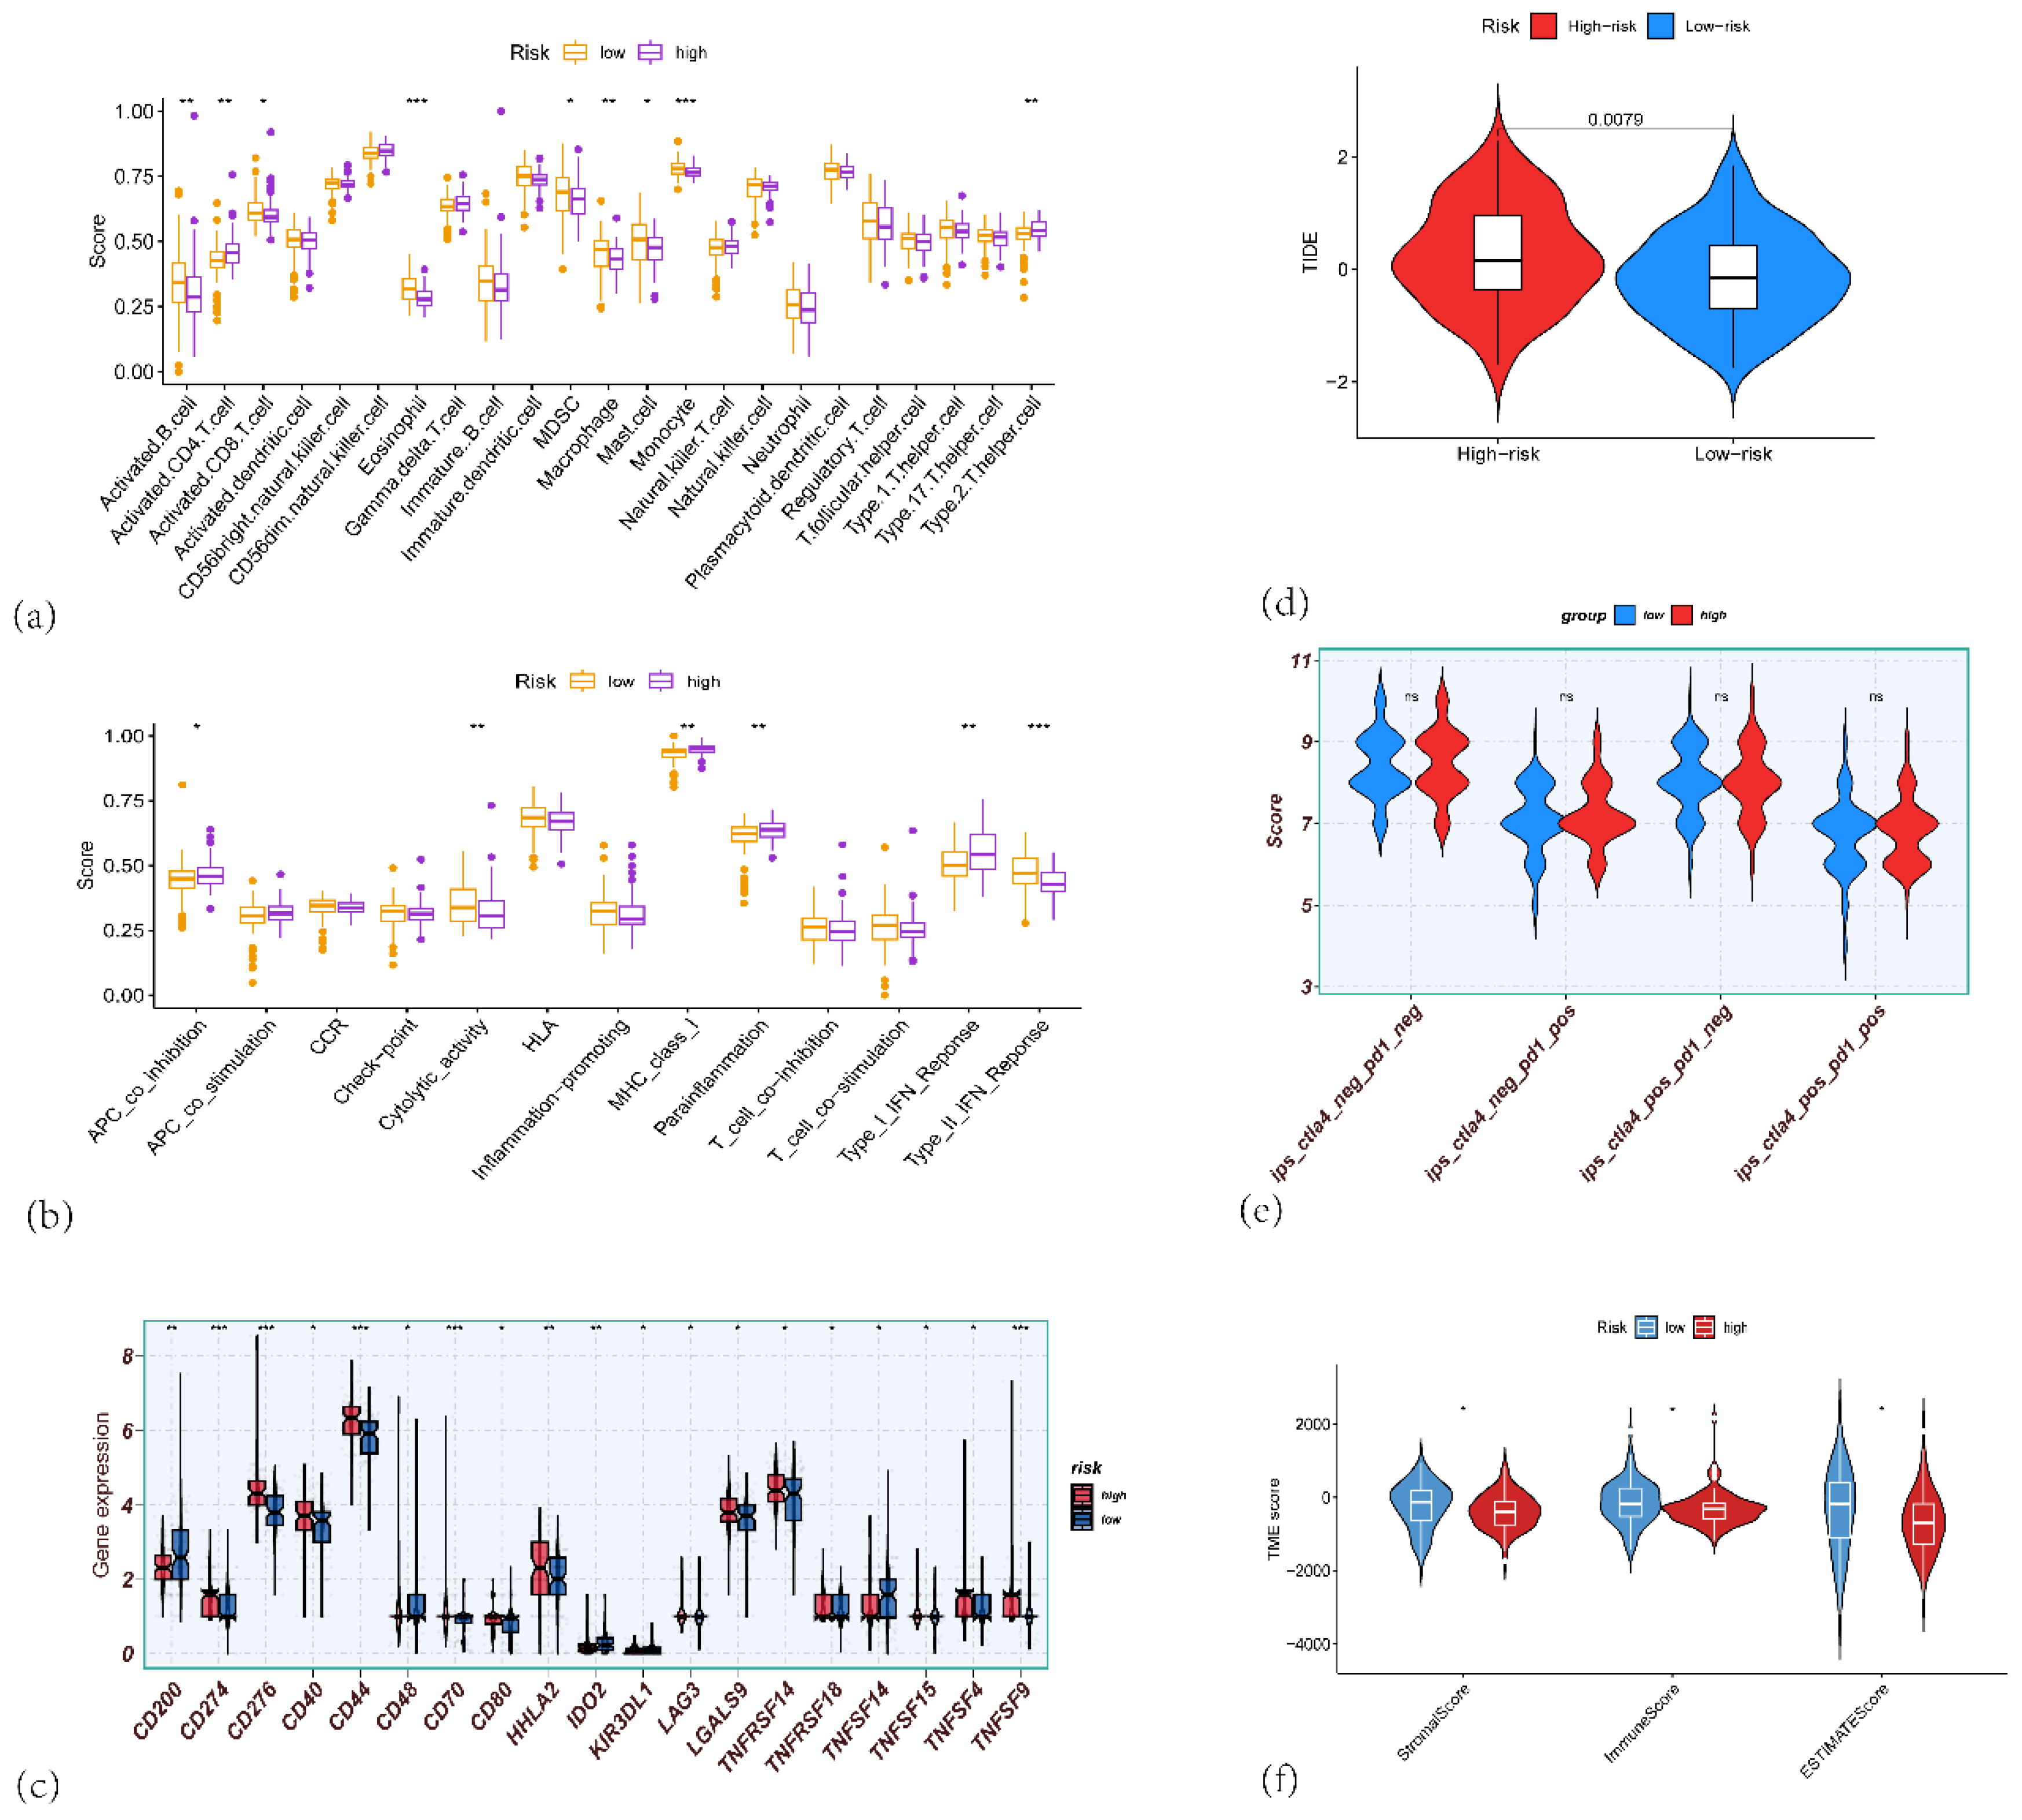
Figure 10.
(a) Heatmap showing the enrichment of hallmark gene sets between high-risk and low-risk groups. (b) Bar plot depicting the number of differentially expressed hallmark gene sets between high-risk and low-risk groups. (c) Heatmap showing the enrichment of KEGG gene sets in high-risk and low-risk groups. (d)The important pathway of Gene set enrichment analysis (GSEA) plot comparing the high-risk and low-risk groups. (e–g) Bubble charts depicting Gene Ontology (GO) enrichment analyses of different genes in high-risk and low-risk groups. (c) Biological process (BP) terms; (d) Cellular component (CC) terms; and (e) Molecular function (MF) terms. (h) KEGG pathway enrichment analysis of different genes in high-risk and low-risk groups.
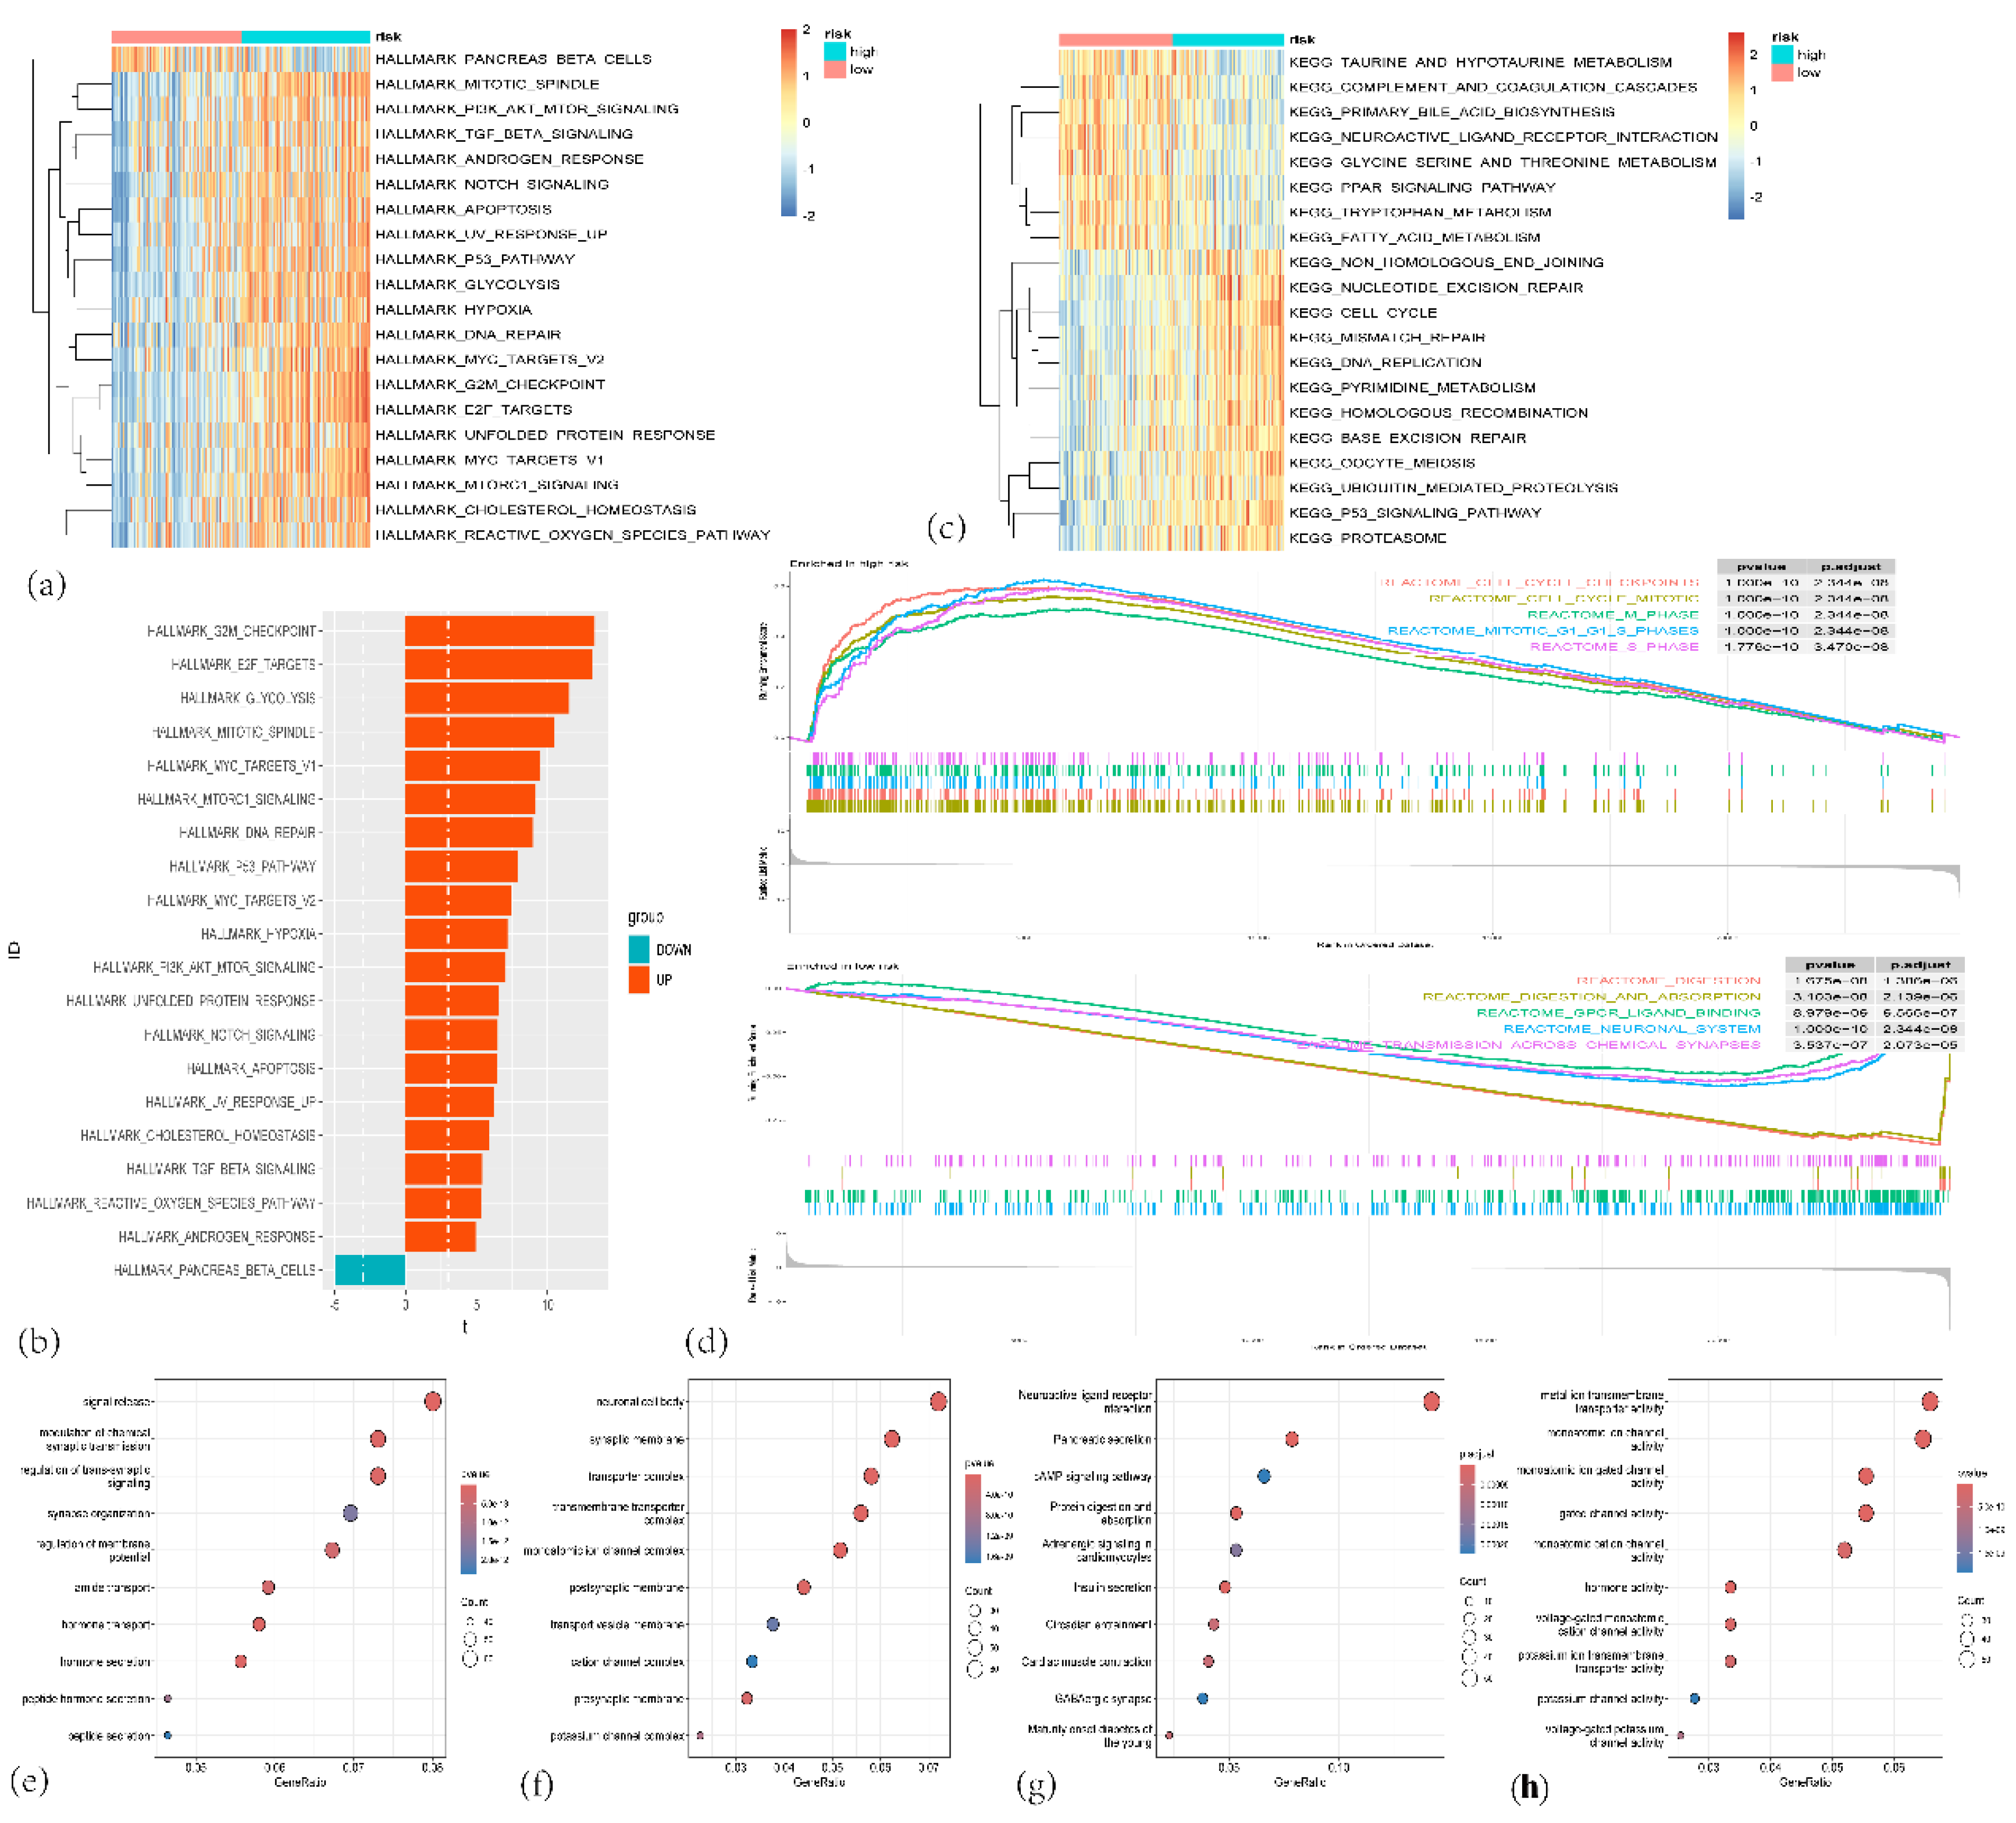
Figure 11.
(a) Oncoprint of mutations in the top 10 most frequently altered genes in the high-risk group. (b) Oncoprint of mutations in the top 10 most frequently altered genes in the low-risk group. (c) Violin plot comparing the total number of mutations (total mutation count per megabase) between the low-risk (blue) and high-risk (orange) groups. (d) Stacked bar plot showing the percentage distribution of patients in the high-risk and low-risk groups based on mutation burden.
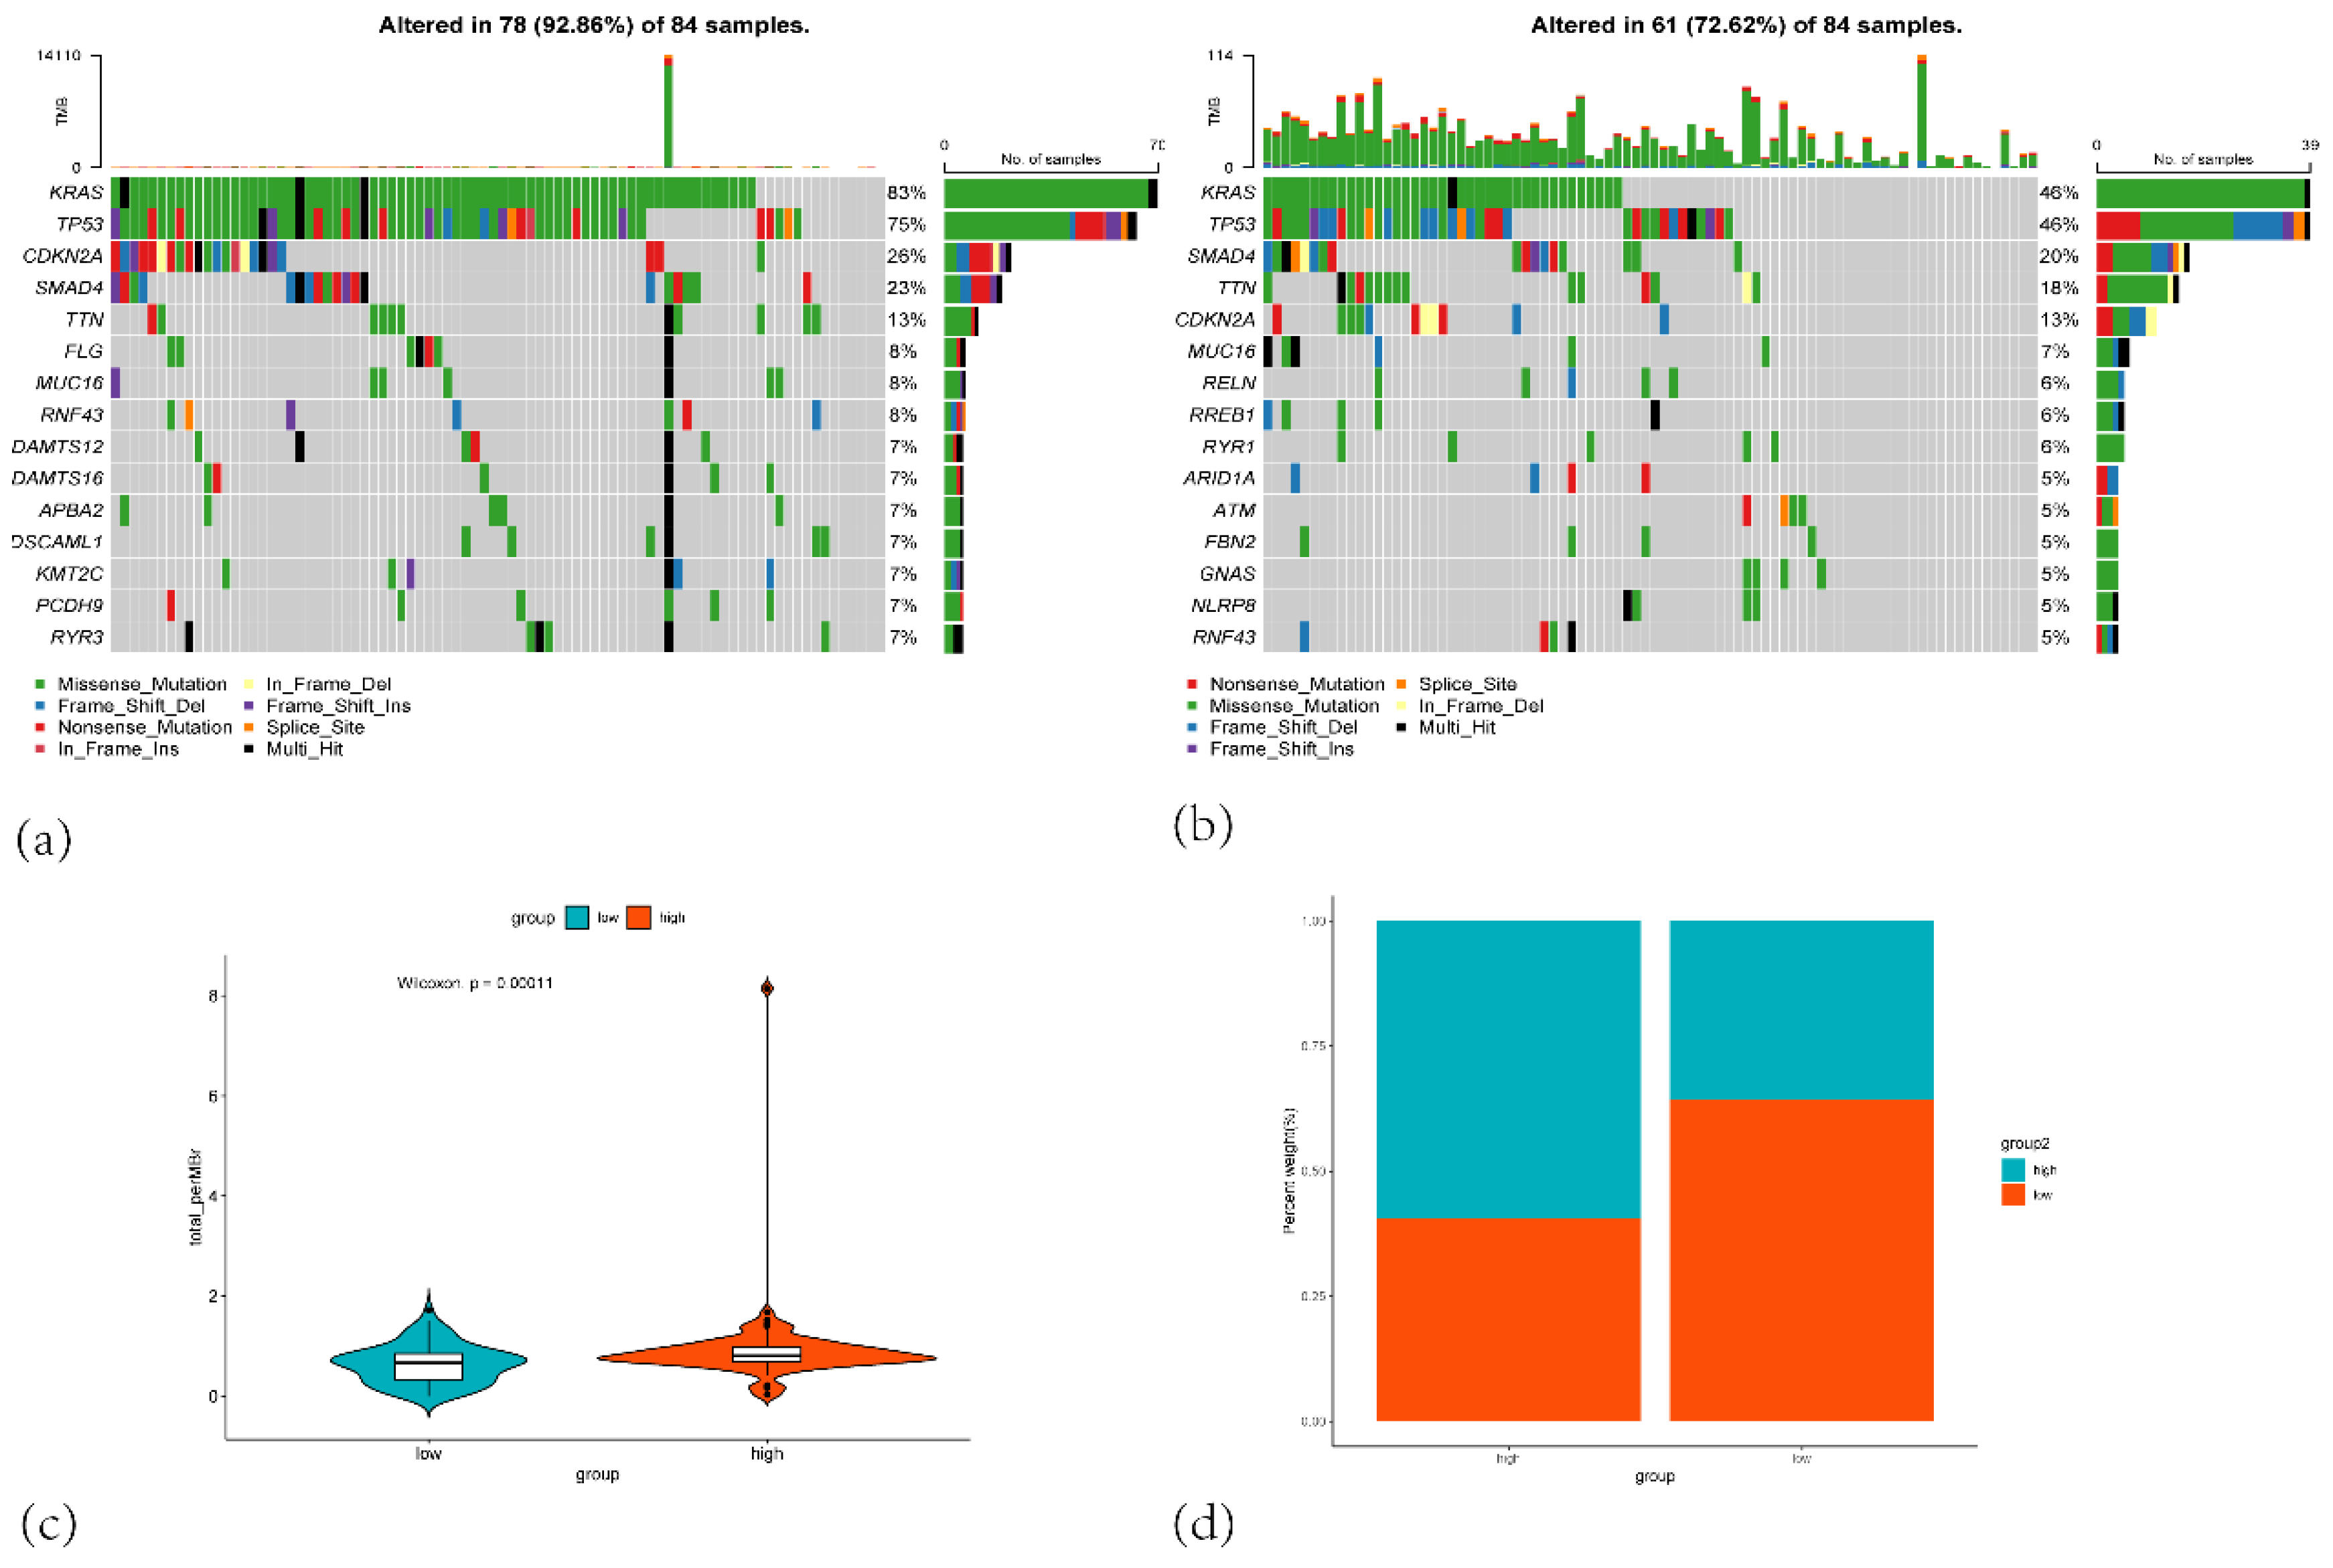
Figure 12.
(a) Correlation plot showing the correlation between the risk score and the IC50 of Gemcitabine and Boxplots of the estimated IC50 of Gemcitabine in the high-risk and low-risk group. (b) Correlation plot showing the correlation between the risk score and the IC50 of 5-fluorouracil and Boxplots of the estimated IC50 of 5-fluorouracil in the high-risk and low-risk group. (c) Correlation plot showing the correlation between the risk score and the IC50 of paclitaxel and Boxplots of the estimated IC50 of paclitaxel in the high-risk and low-risk group. (d) Correlation plot showing the correlation between the risk score and the IC50 of oxaliplatin and Boxplots of the estimated IC50 of oxaliplatin in the high-risk and low-risk group. (e) Correlation plot showing the correlation between the risk score and the IC50 of cisplatin and Boxplots of the estimated IC50 of cisplatin in the high-risk and low-risk group. (f) Correlation plot showing the correlation between the risk score and the IC50 of irinotecan and Boxplots of the estimated IC50 of irinotecan in the high-risk and low-risk group. (g) Correlation plot showing the correlation between the risk score and the IC50 of AKT inhibitor VIII and Boxplots of the estimated IC50 of AKT inhibitor VIII in the high-risk and low-risk group. (h) Correlation plot showing the correlation between the risk score and the IC50 of erlotinib and Boxplots of the estimated IC50 of erlotinib in the high-risk and low-risk group. (i) Correlation plot showing the correlation between the risk score and the IC50 of trametinib and Boxplots of the estimated IC50 of trametinib in the high-risk and low-risk group. (j) Correlation plot showing the correlation between the risk score and the IC50 of gefitinib and Boxplots of the estimated IC50 of gefitinib in the high-risk and low-risk group.
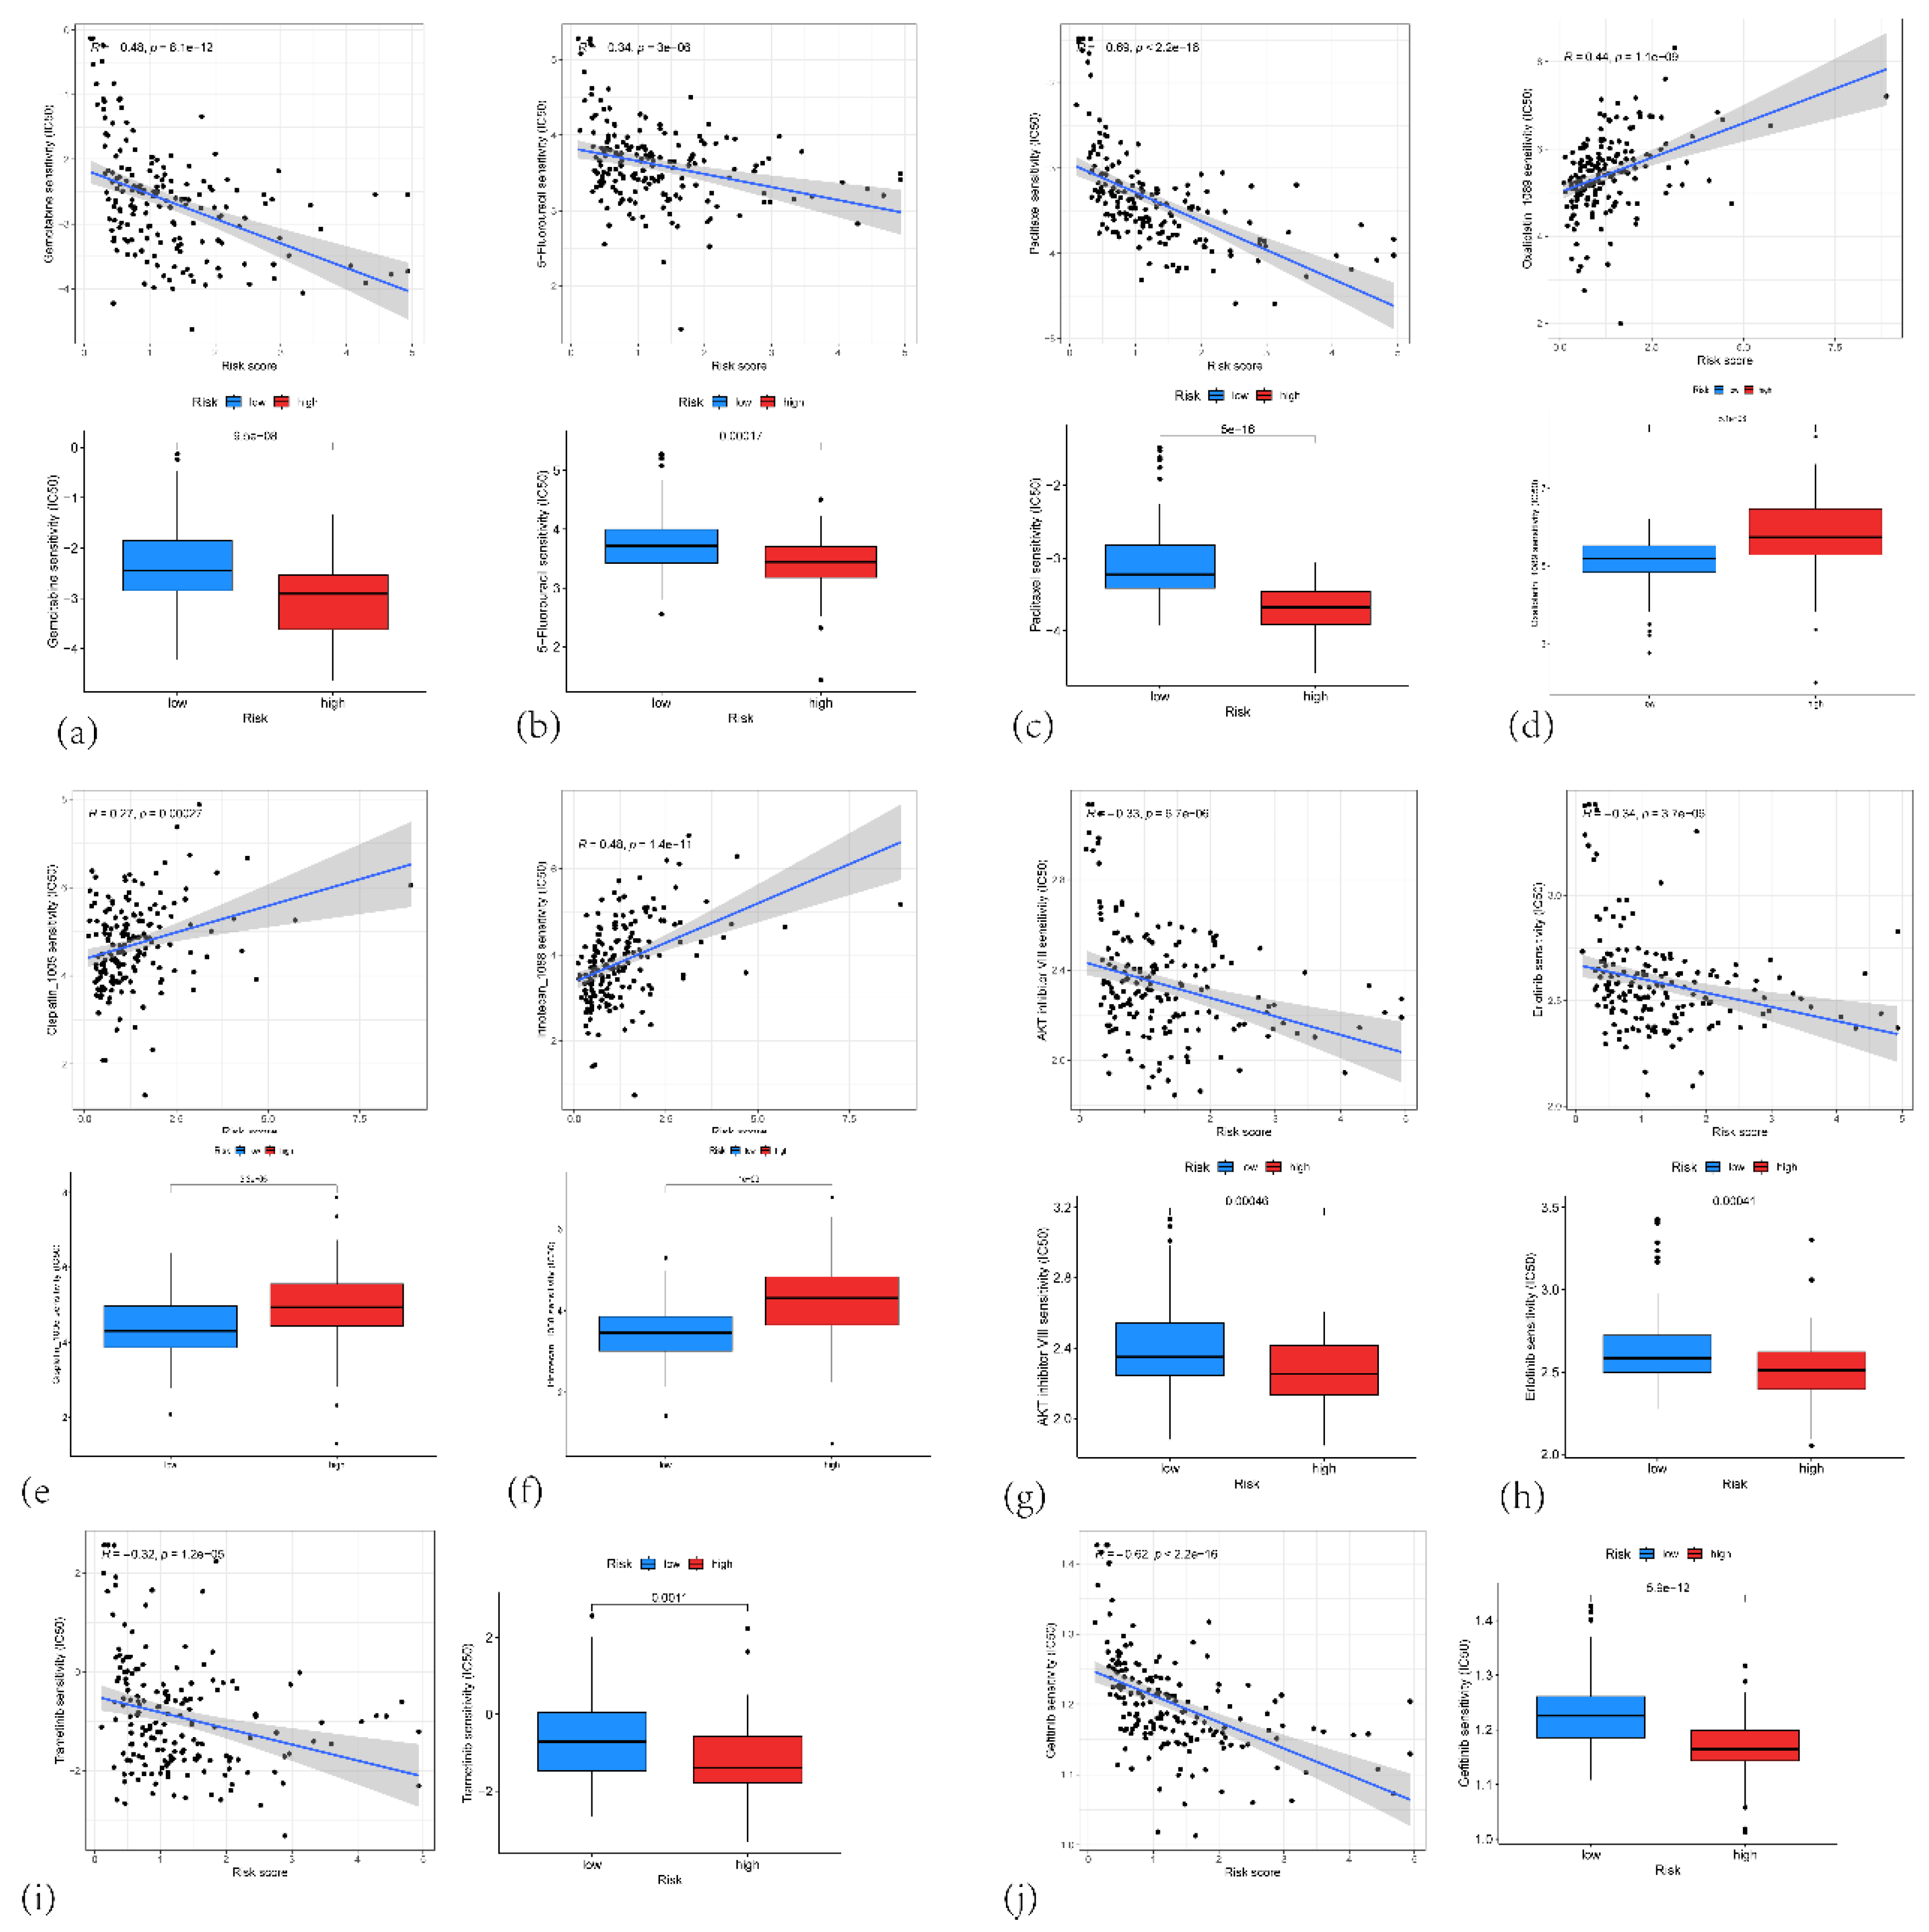
Figure 13.
(a) t-SNE plot showing the clustering of single-cell RNA sequencing data from PAAD samples. (b) t-SNE plot showing the clustering of single-cell RNA sequencing data with Cell type annotations (c) t-SNE plot highlighting the expression of IFI27, KLK10, TOP2A, SPINK7 and KIF20A in the single cells. (d) Violin plot showing the expression of 5 genes in various cell types.
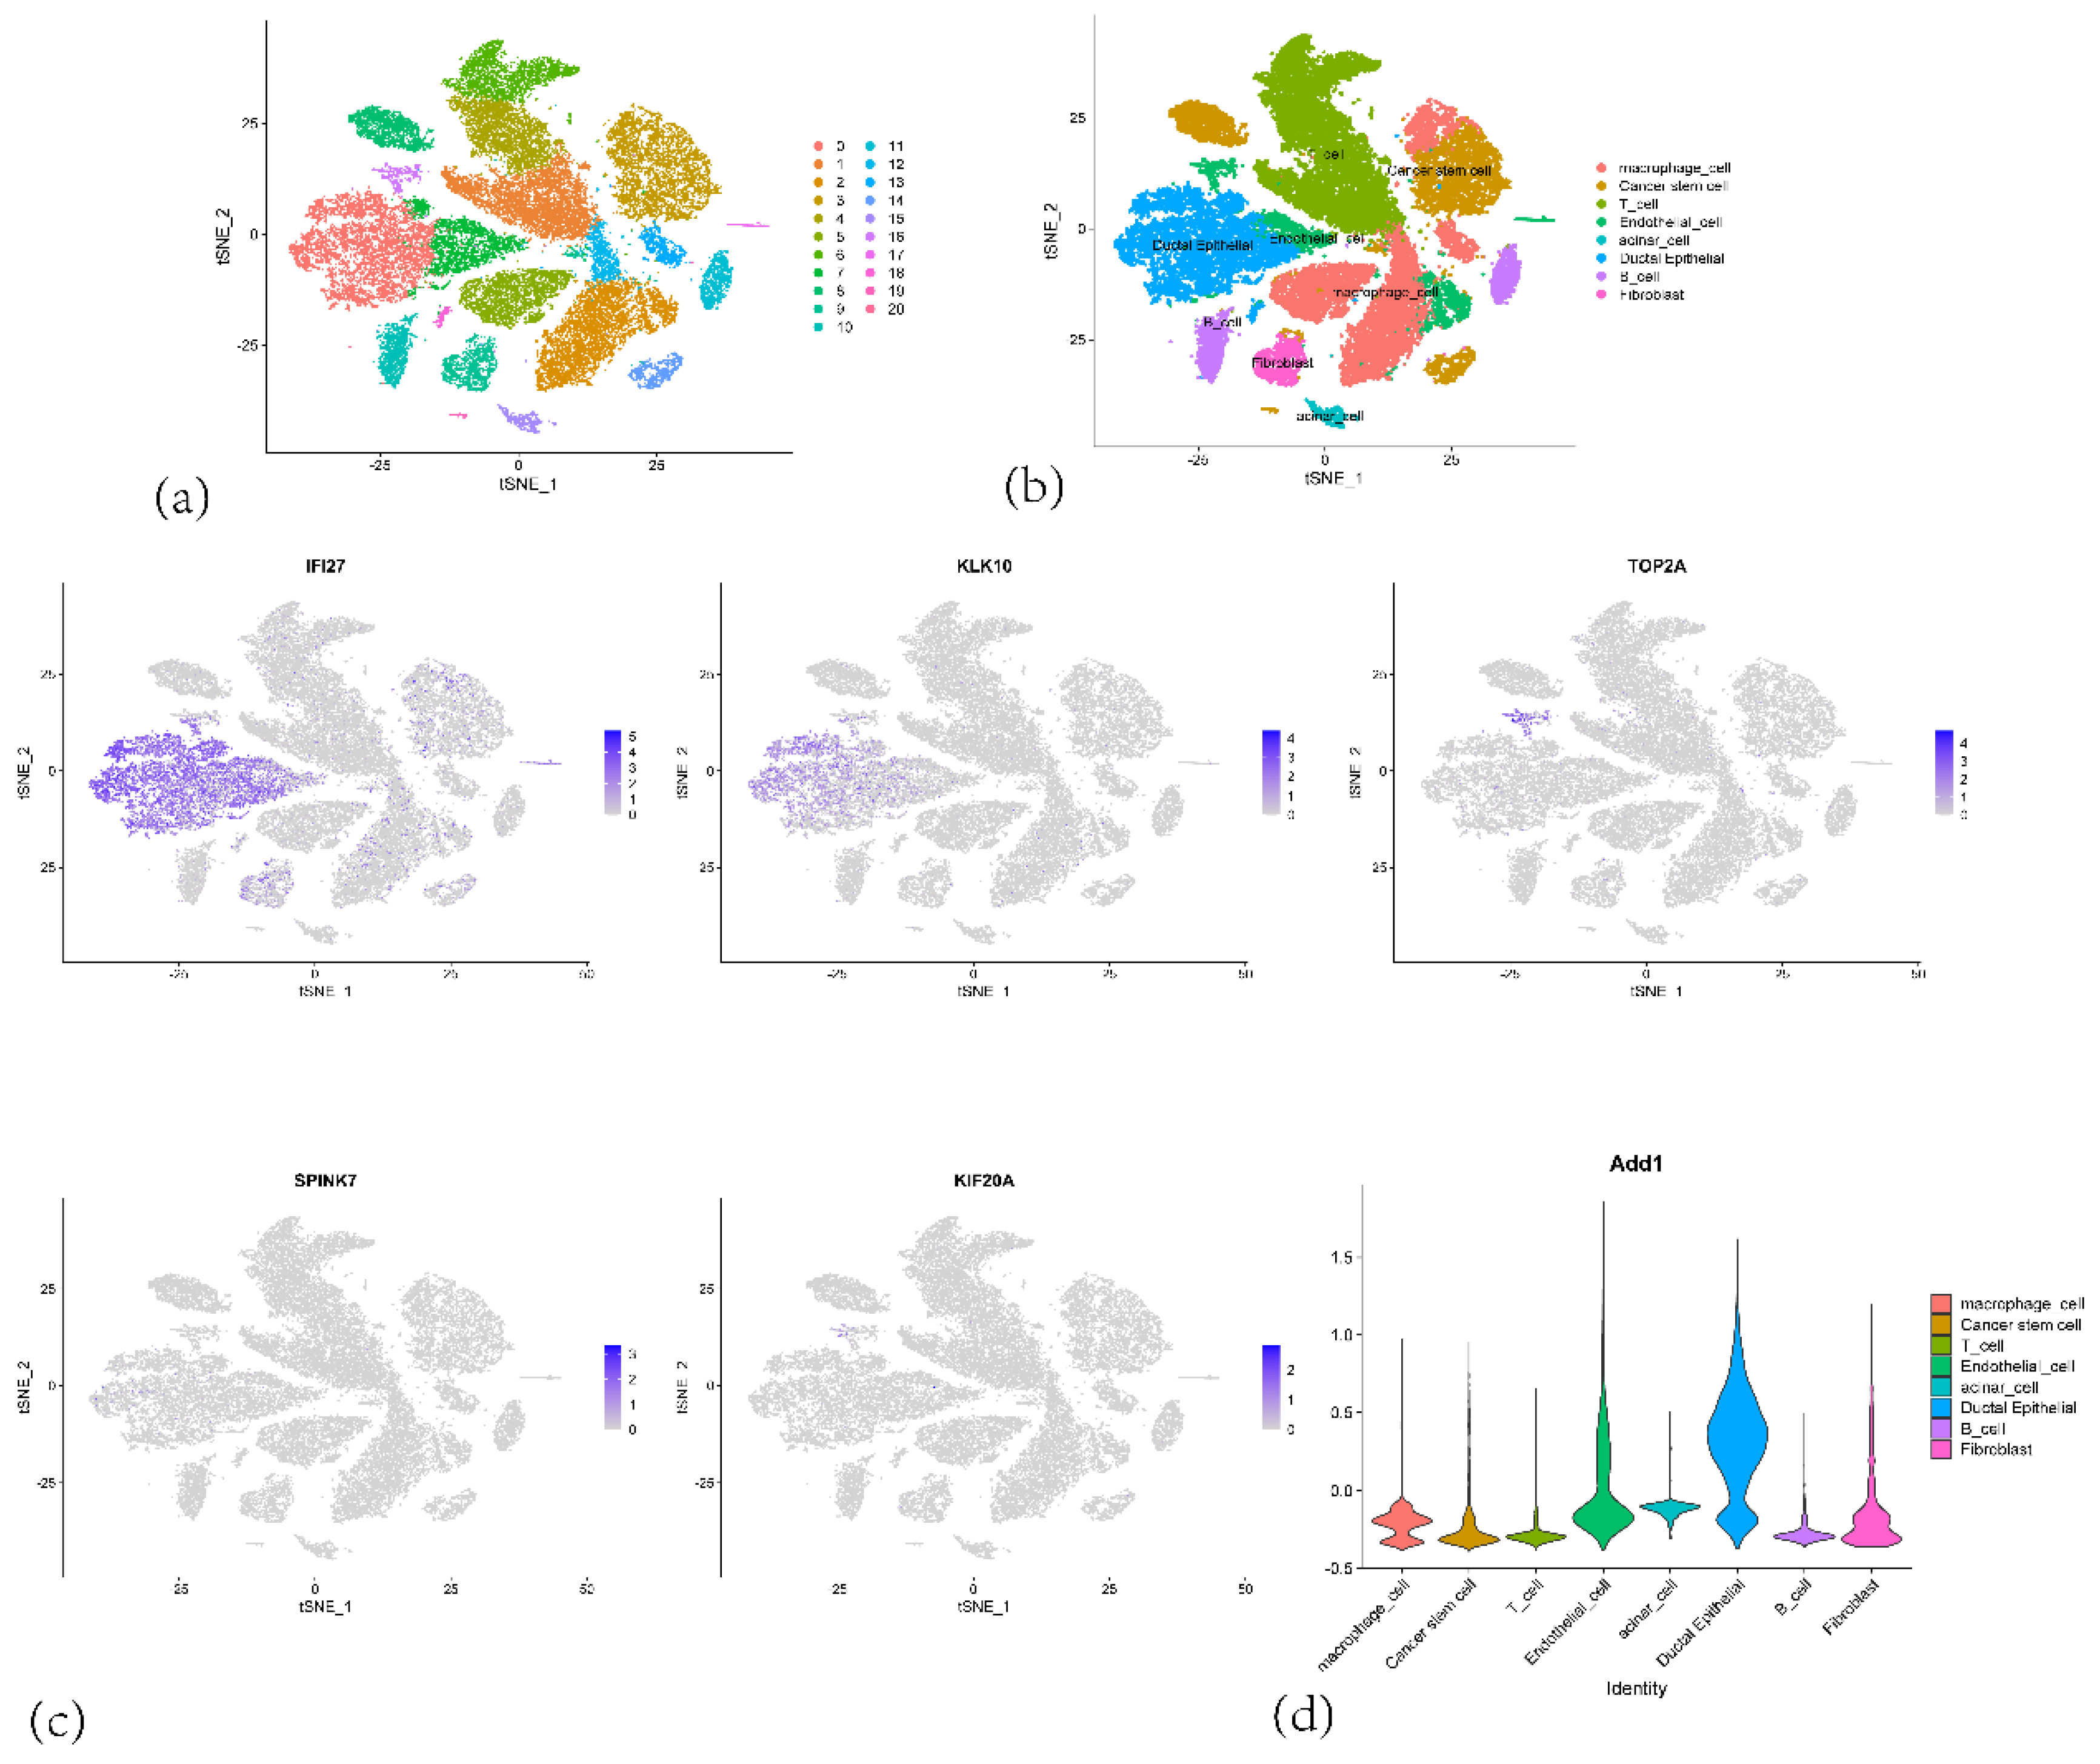
Figure 14.
(a) A network graph showing the number of interactions between different cell types in the tumor microenvironment. (b) A hierarchical layout diagram of the MIF (Macrophage Migration Inhibitory Factor) signaling pathway network. (c) A network diagram of the MIF (Macrophage Migration Inhibitory Factor) signaling pathway network.(d) A heatmap displaying outgoing signaling patterns from the different cell types. (e) A heatmap displaying incoming signaling patterns to the different cell types.
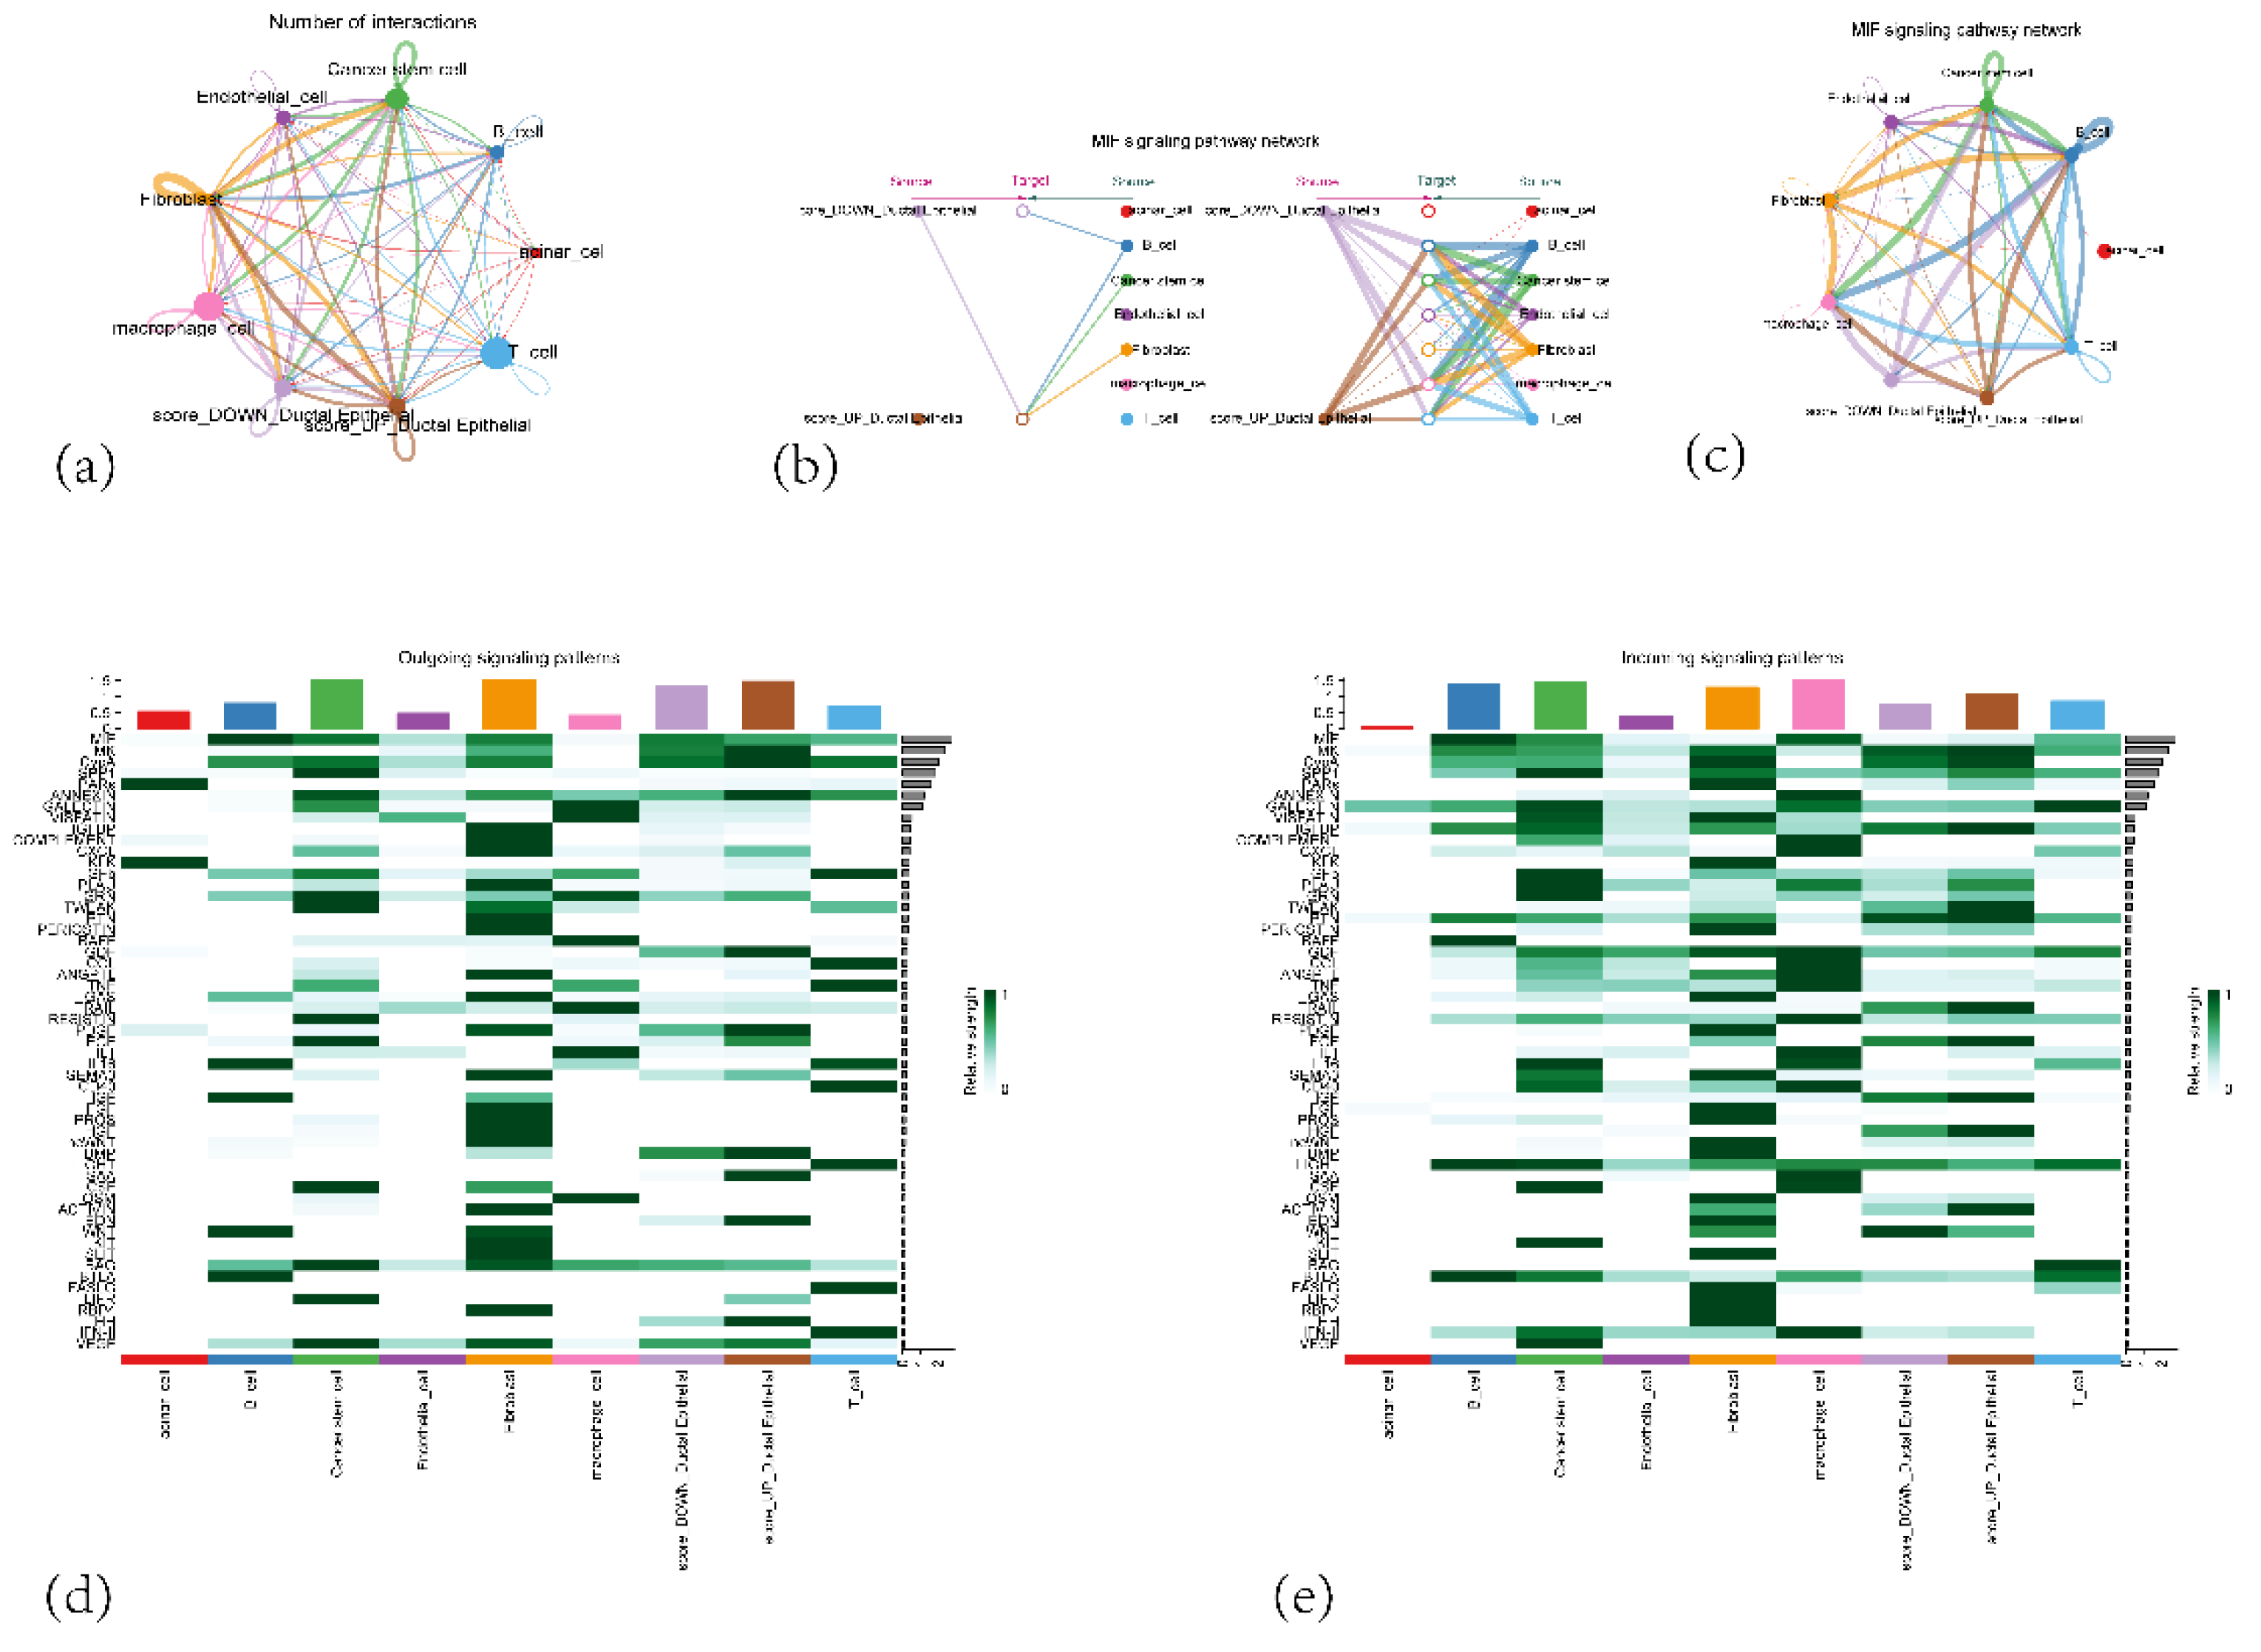
Figure 15.
A heatmap showing the interaction probabilities between different signaling pathways and cell to cell relationship.
Figure 15.
A heatmap showing the interaction probabilities between different signaling pathways and cell to cell relationship.
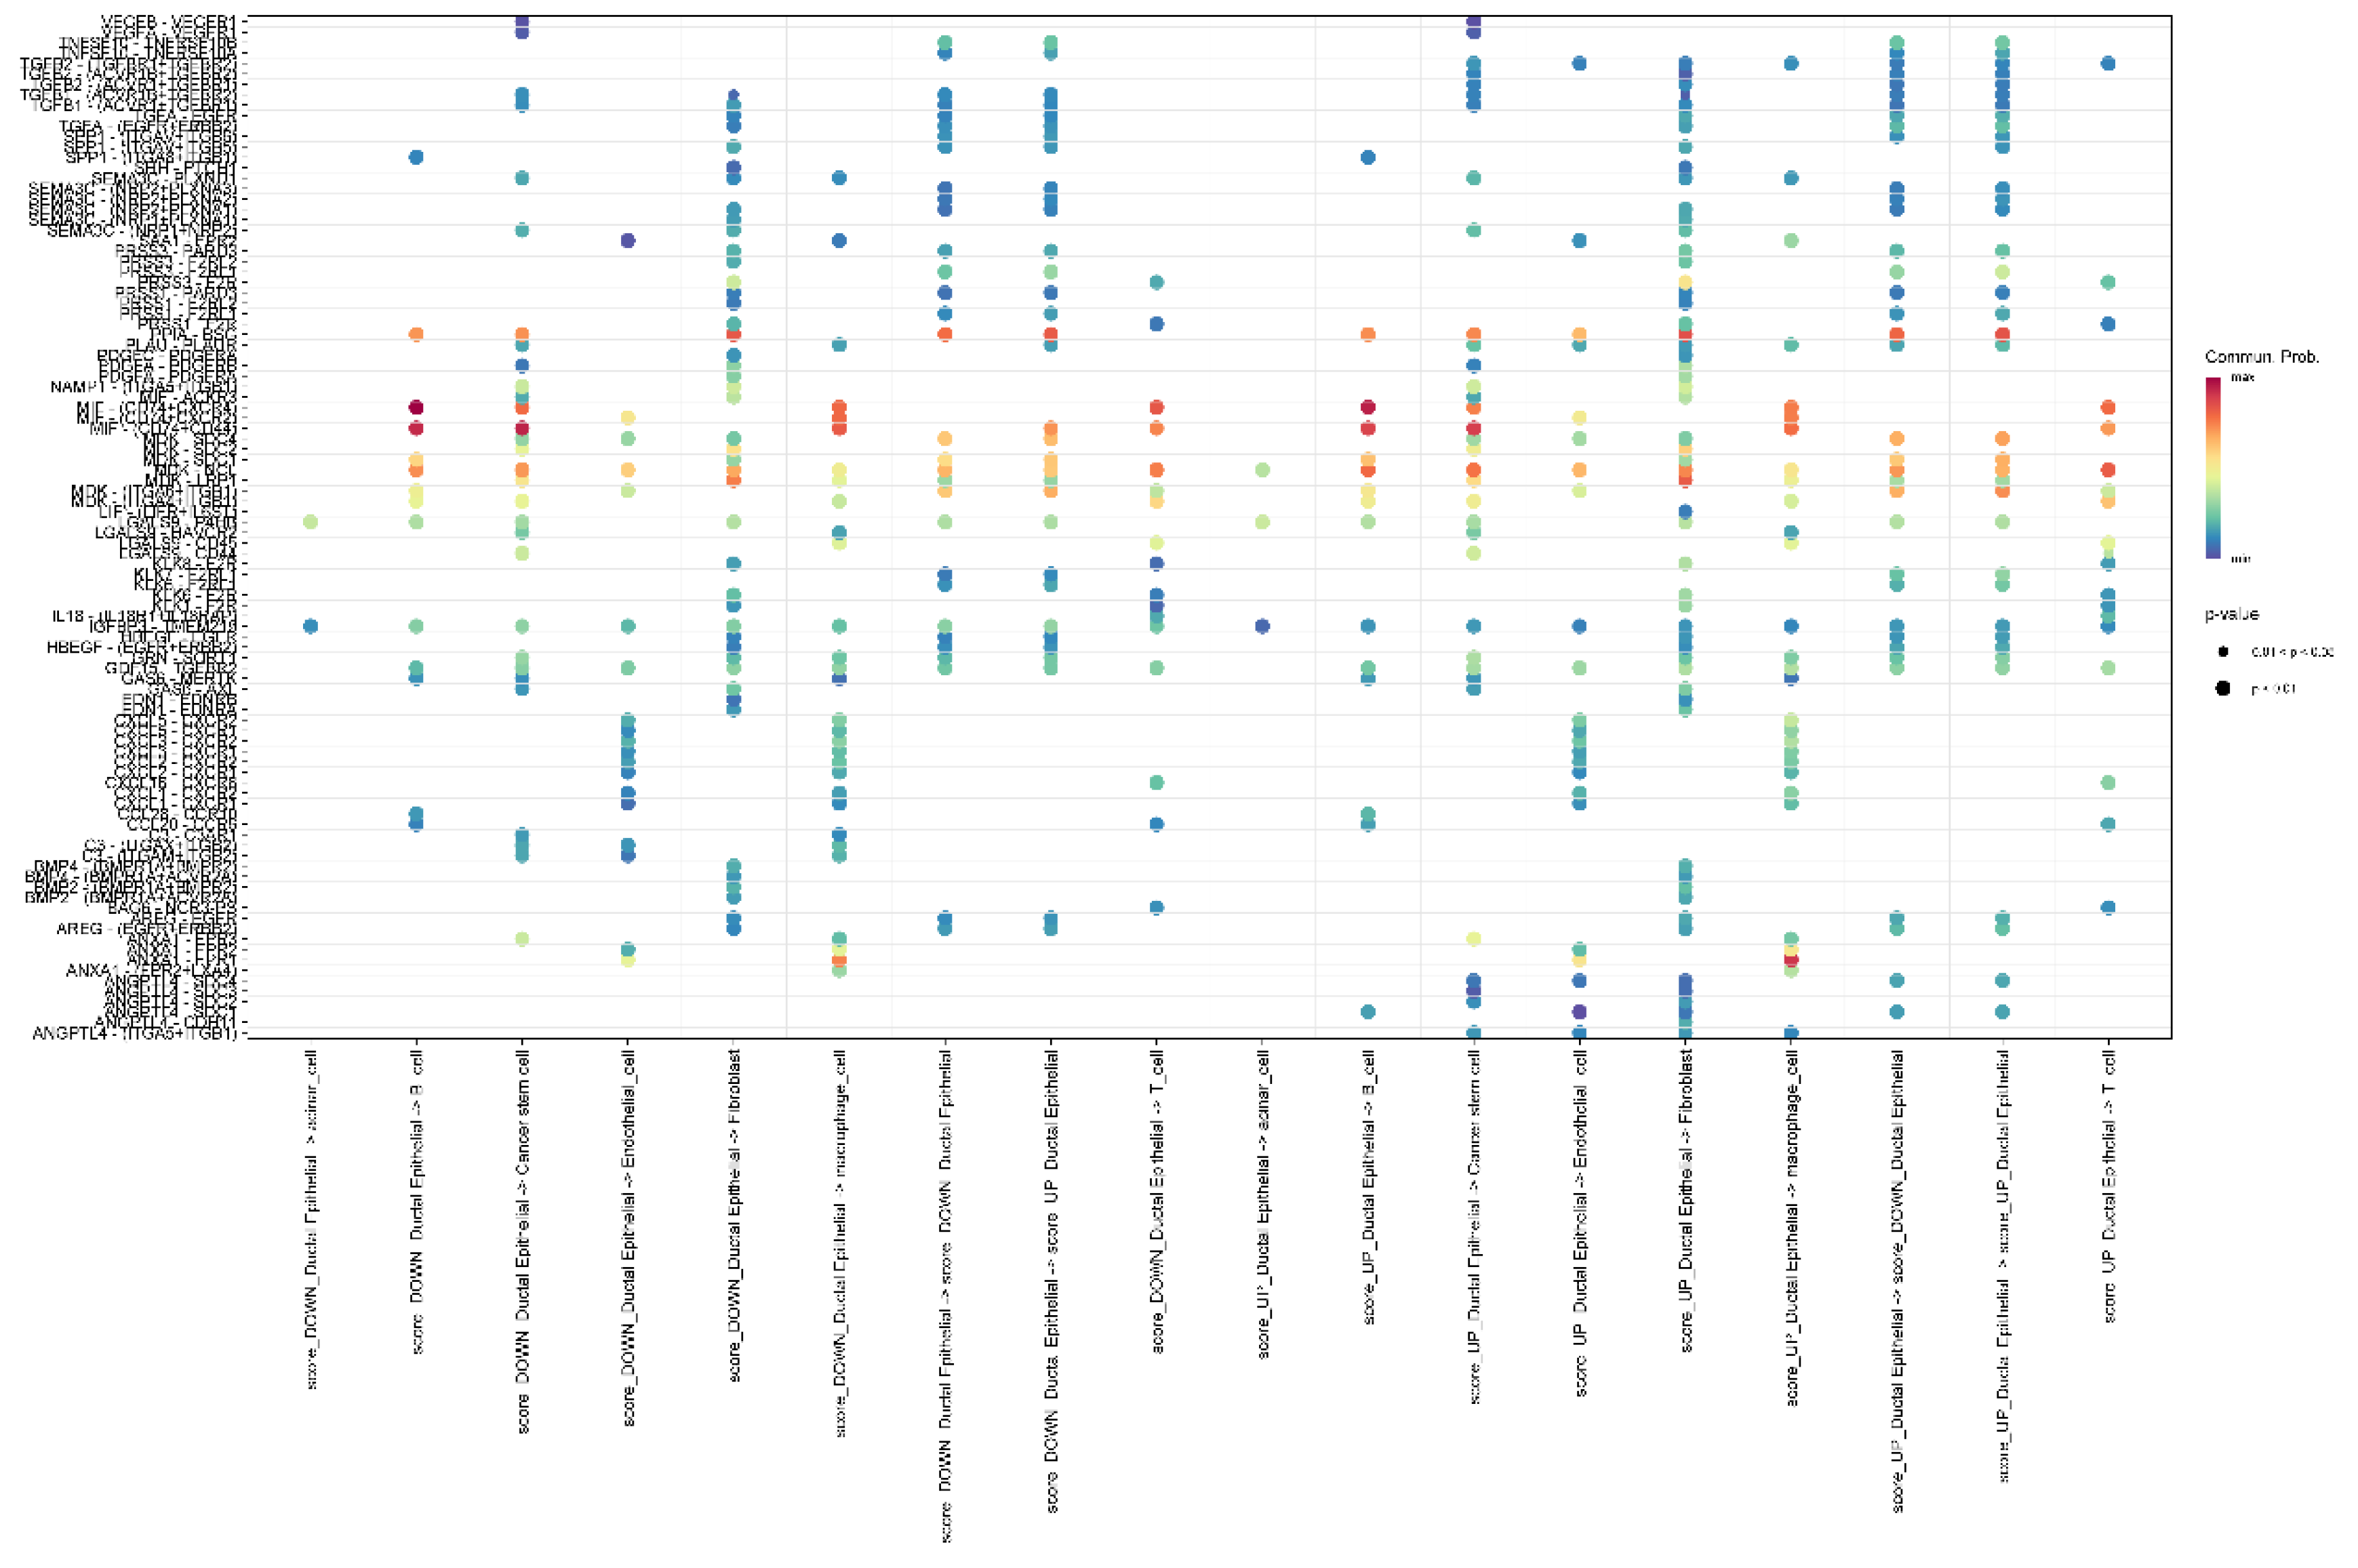
Figure 16.
(a) Pancreatic tumor tissue section (b) Spatial distribution patterns of UMIs and gene counts on the tissue section (c) UMAP dimensionality reduction plot showing the clustering of ST from PAAD tissue (d) Cell type annotation of the tissue section by RCTD deconvolution algorithm.
Figure 16.
(a) Pancreatic tumor tissue section (b) Spatial distribution patterns of UMIs and gene counts on the tissue section (c) UMAP dimensionality reduction plot showing the clustering of ST from PAAD tissue (d) Cell type annotation of the tissue section by RCTD deconvolution algorithm.
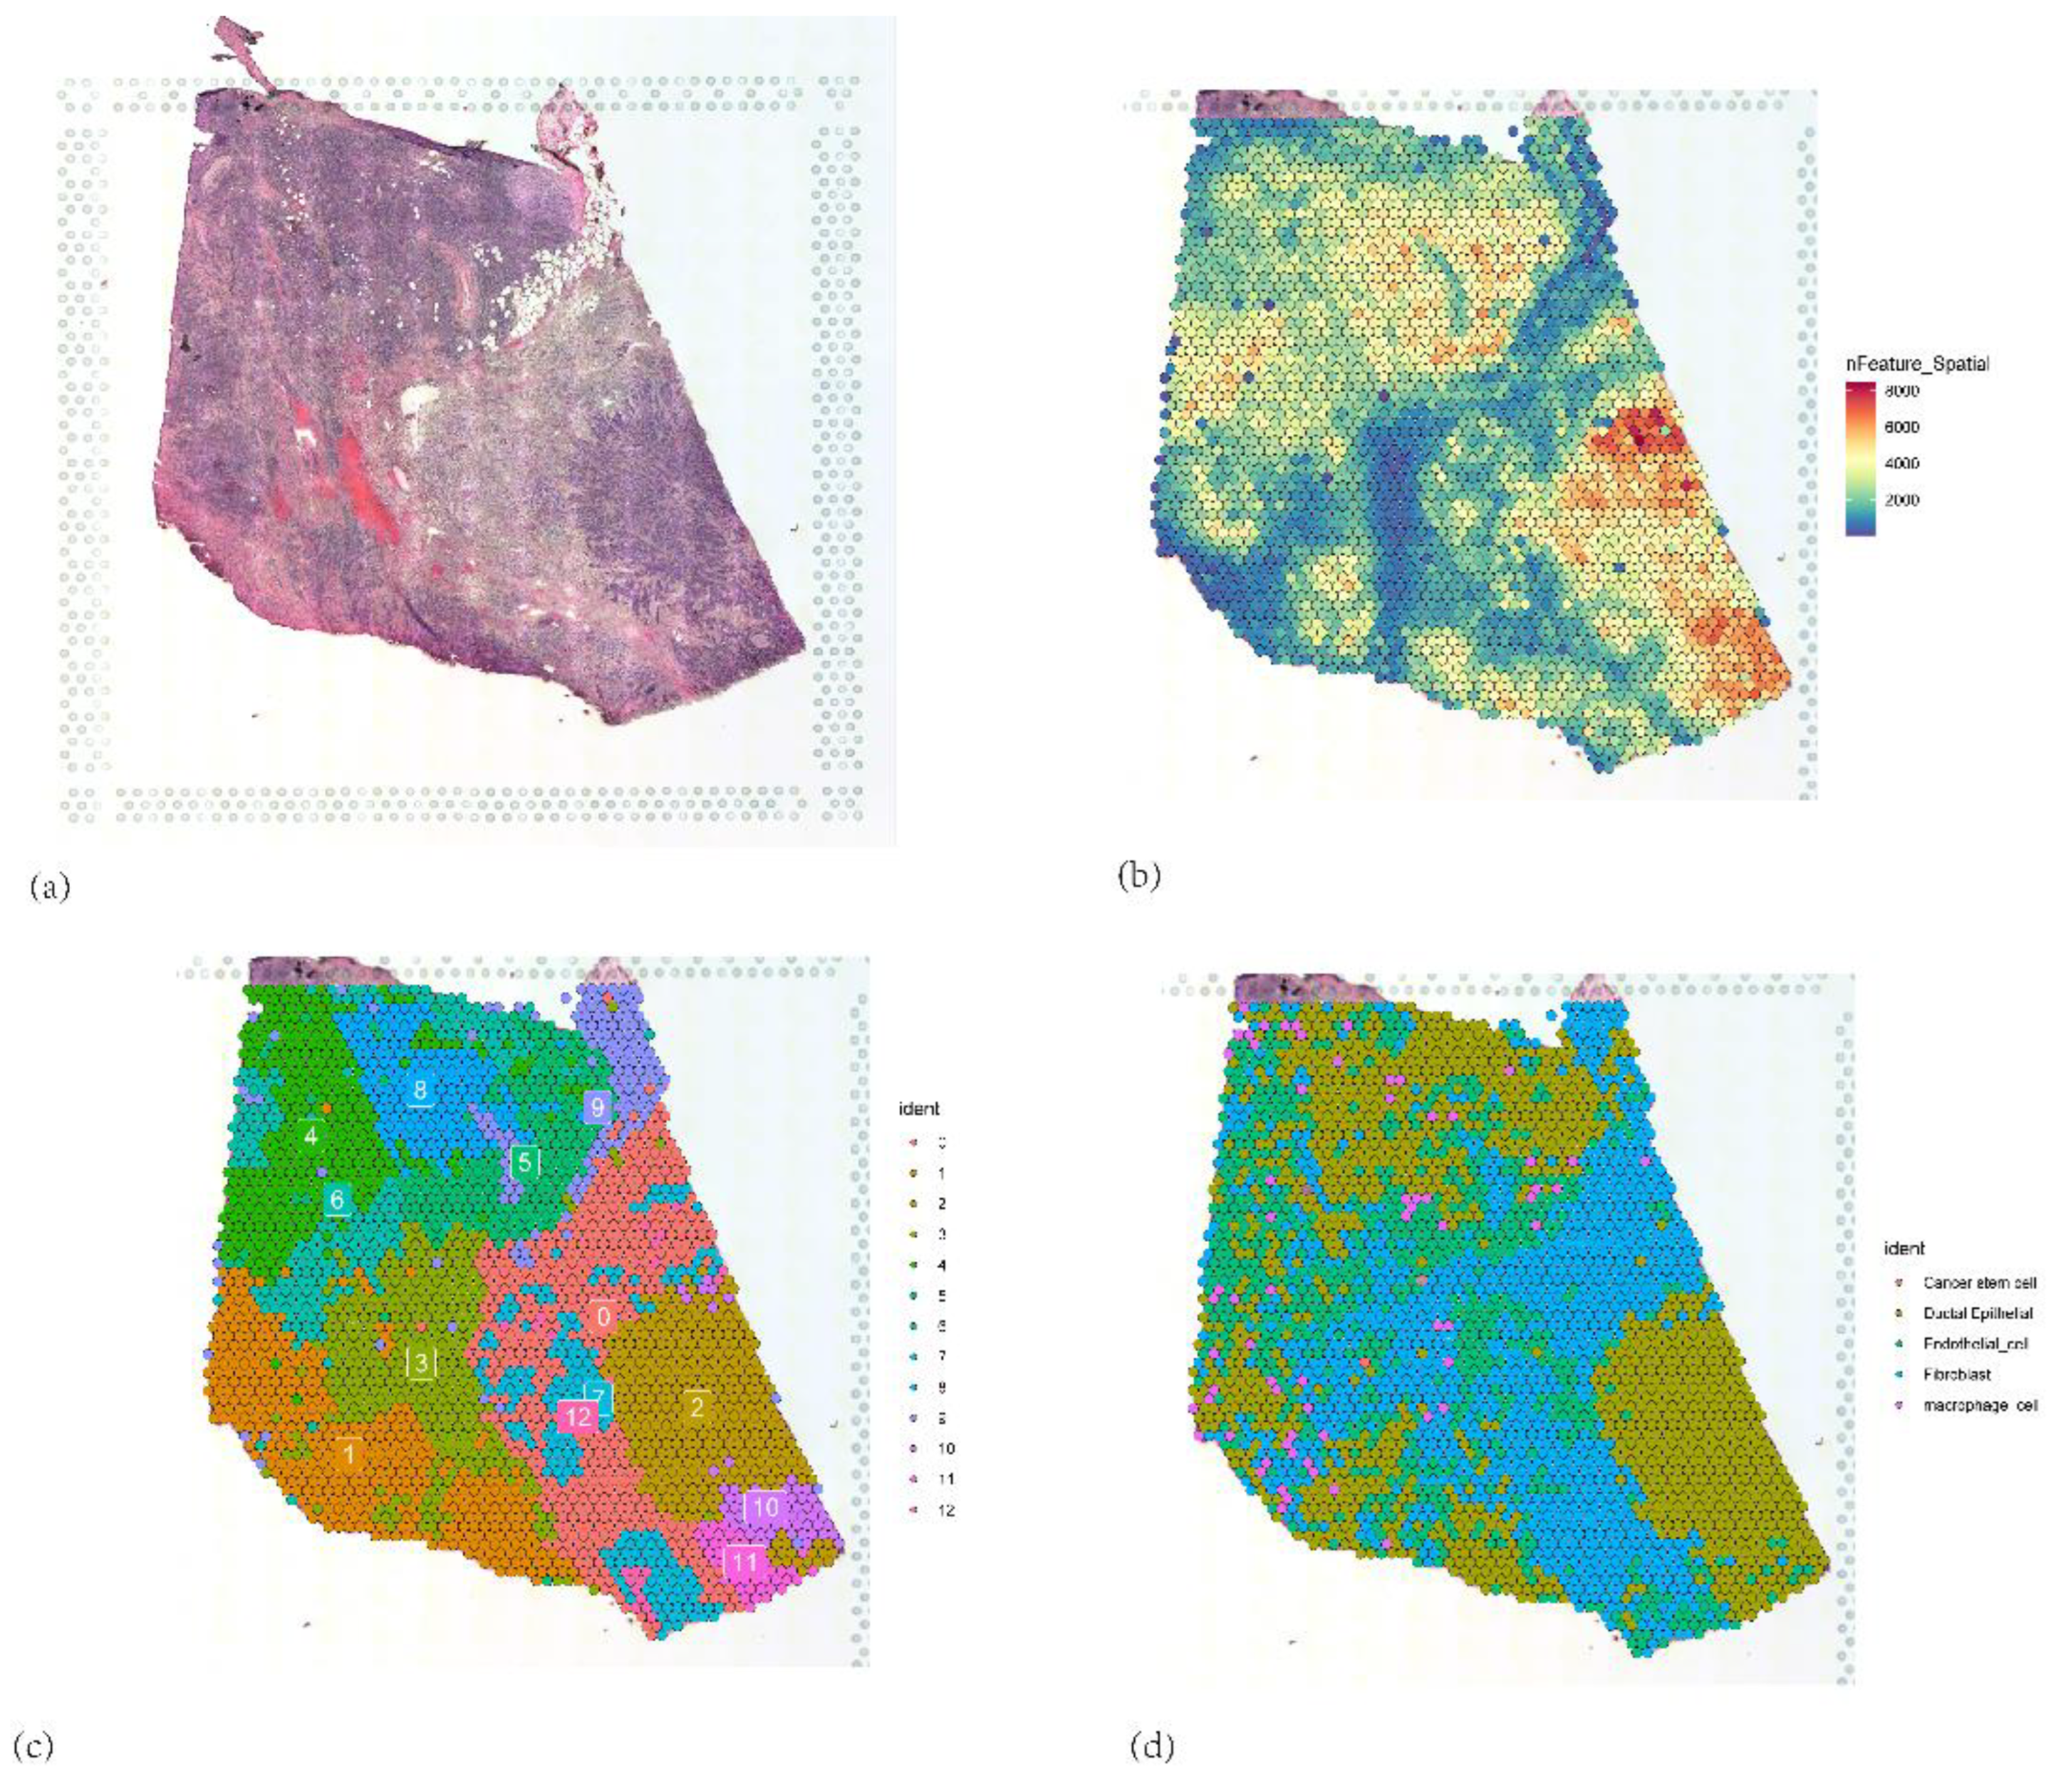
Figure 17.
(a) Identification and distribution of malignant tumor cells. (b) Interface of malignant tumor cells (c) Staging of malignant tumor cells. (d, e, f, g, h) Expression of 5 core genes.
Figure 17.
(a) Identification and distribution of malignant tumor cells. (b) Interface of malignant tumor cells (c) Staging of malignant tumor cells. (d, e, f, g, h) Expression of 5 core genes.
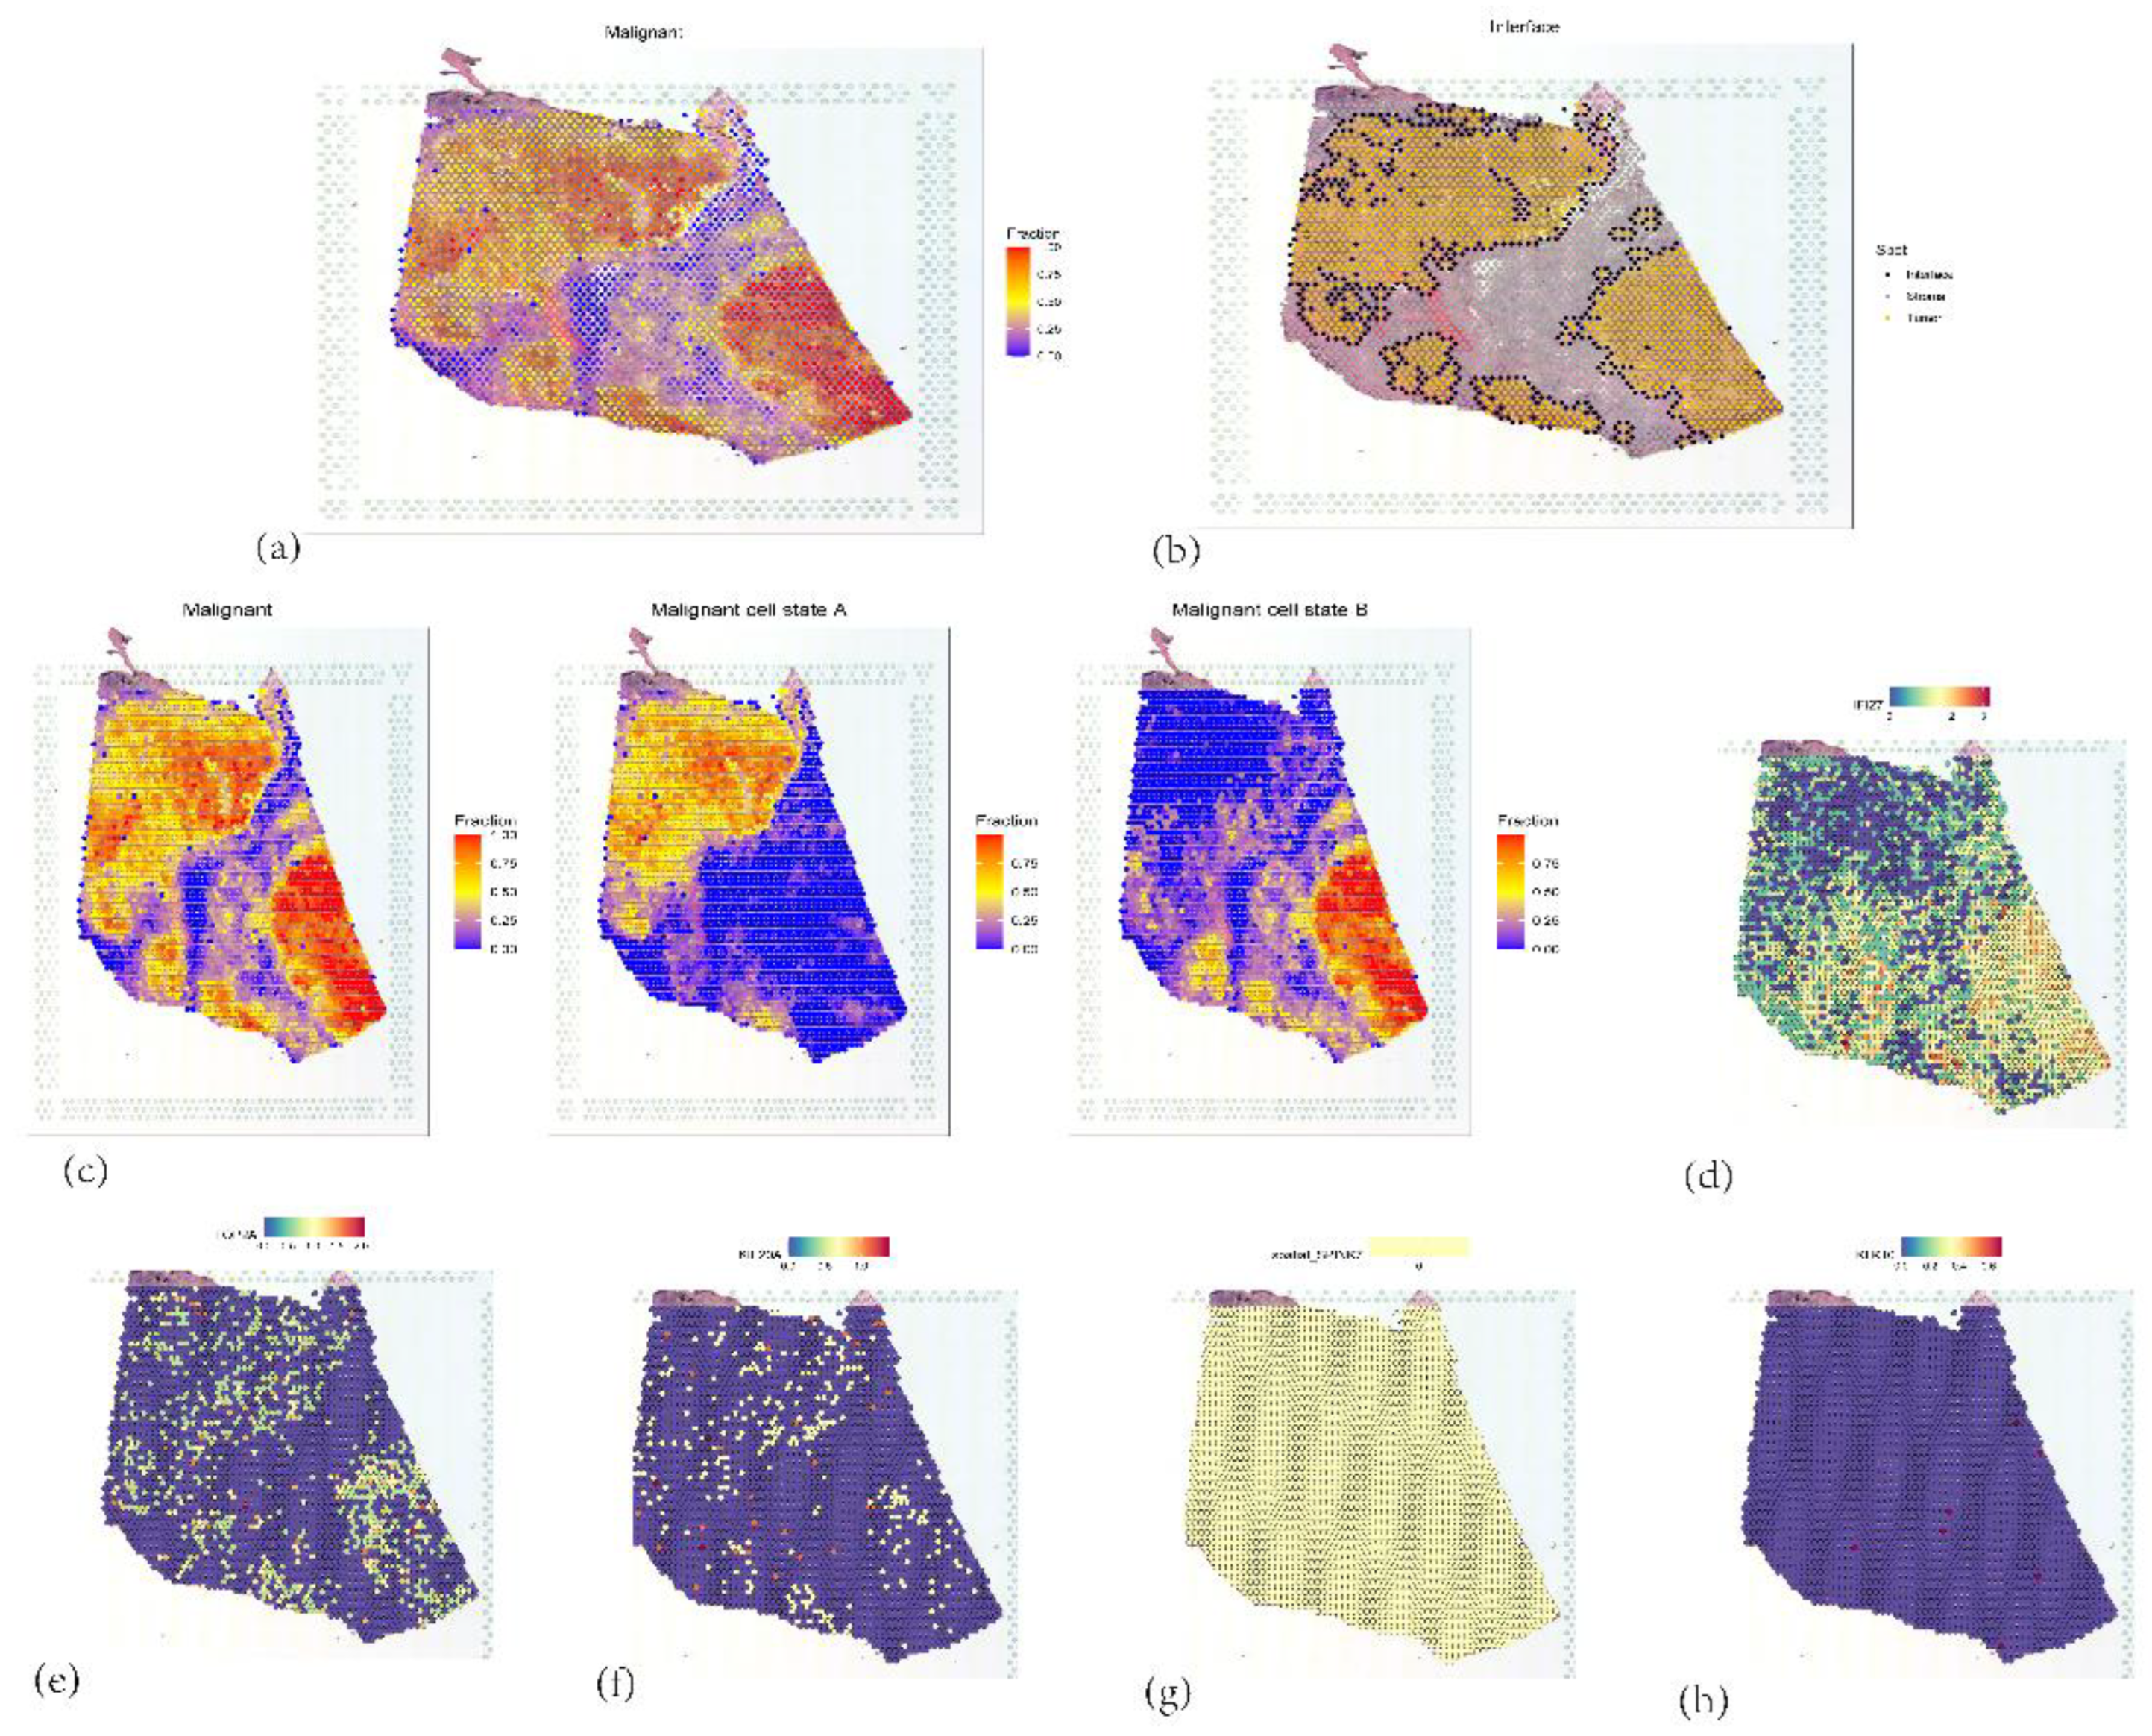
Figure 18.
(a) Relationship between gene expression intensity and stability in ductal epithelial cells. (b) Branch states of ductal epithelial cell subpopulations (c) Spatial distribution of pseudotime values, with color gradient reflecting the temporal progression of cellular differentiation. (d, e, f, g, h) Expression patterns of five core genes in relation to pseudotime.
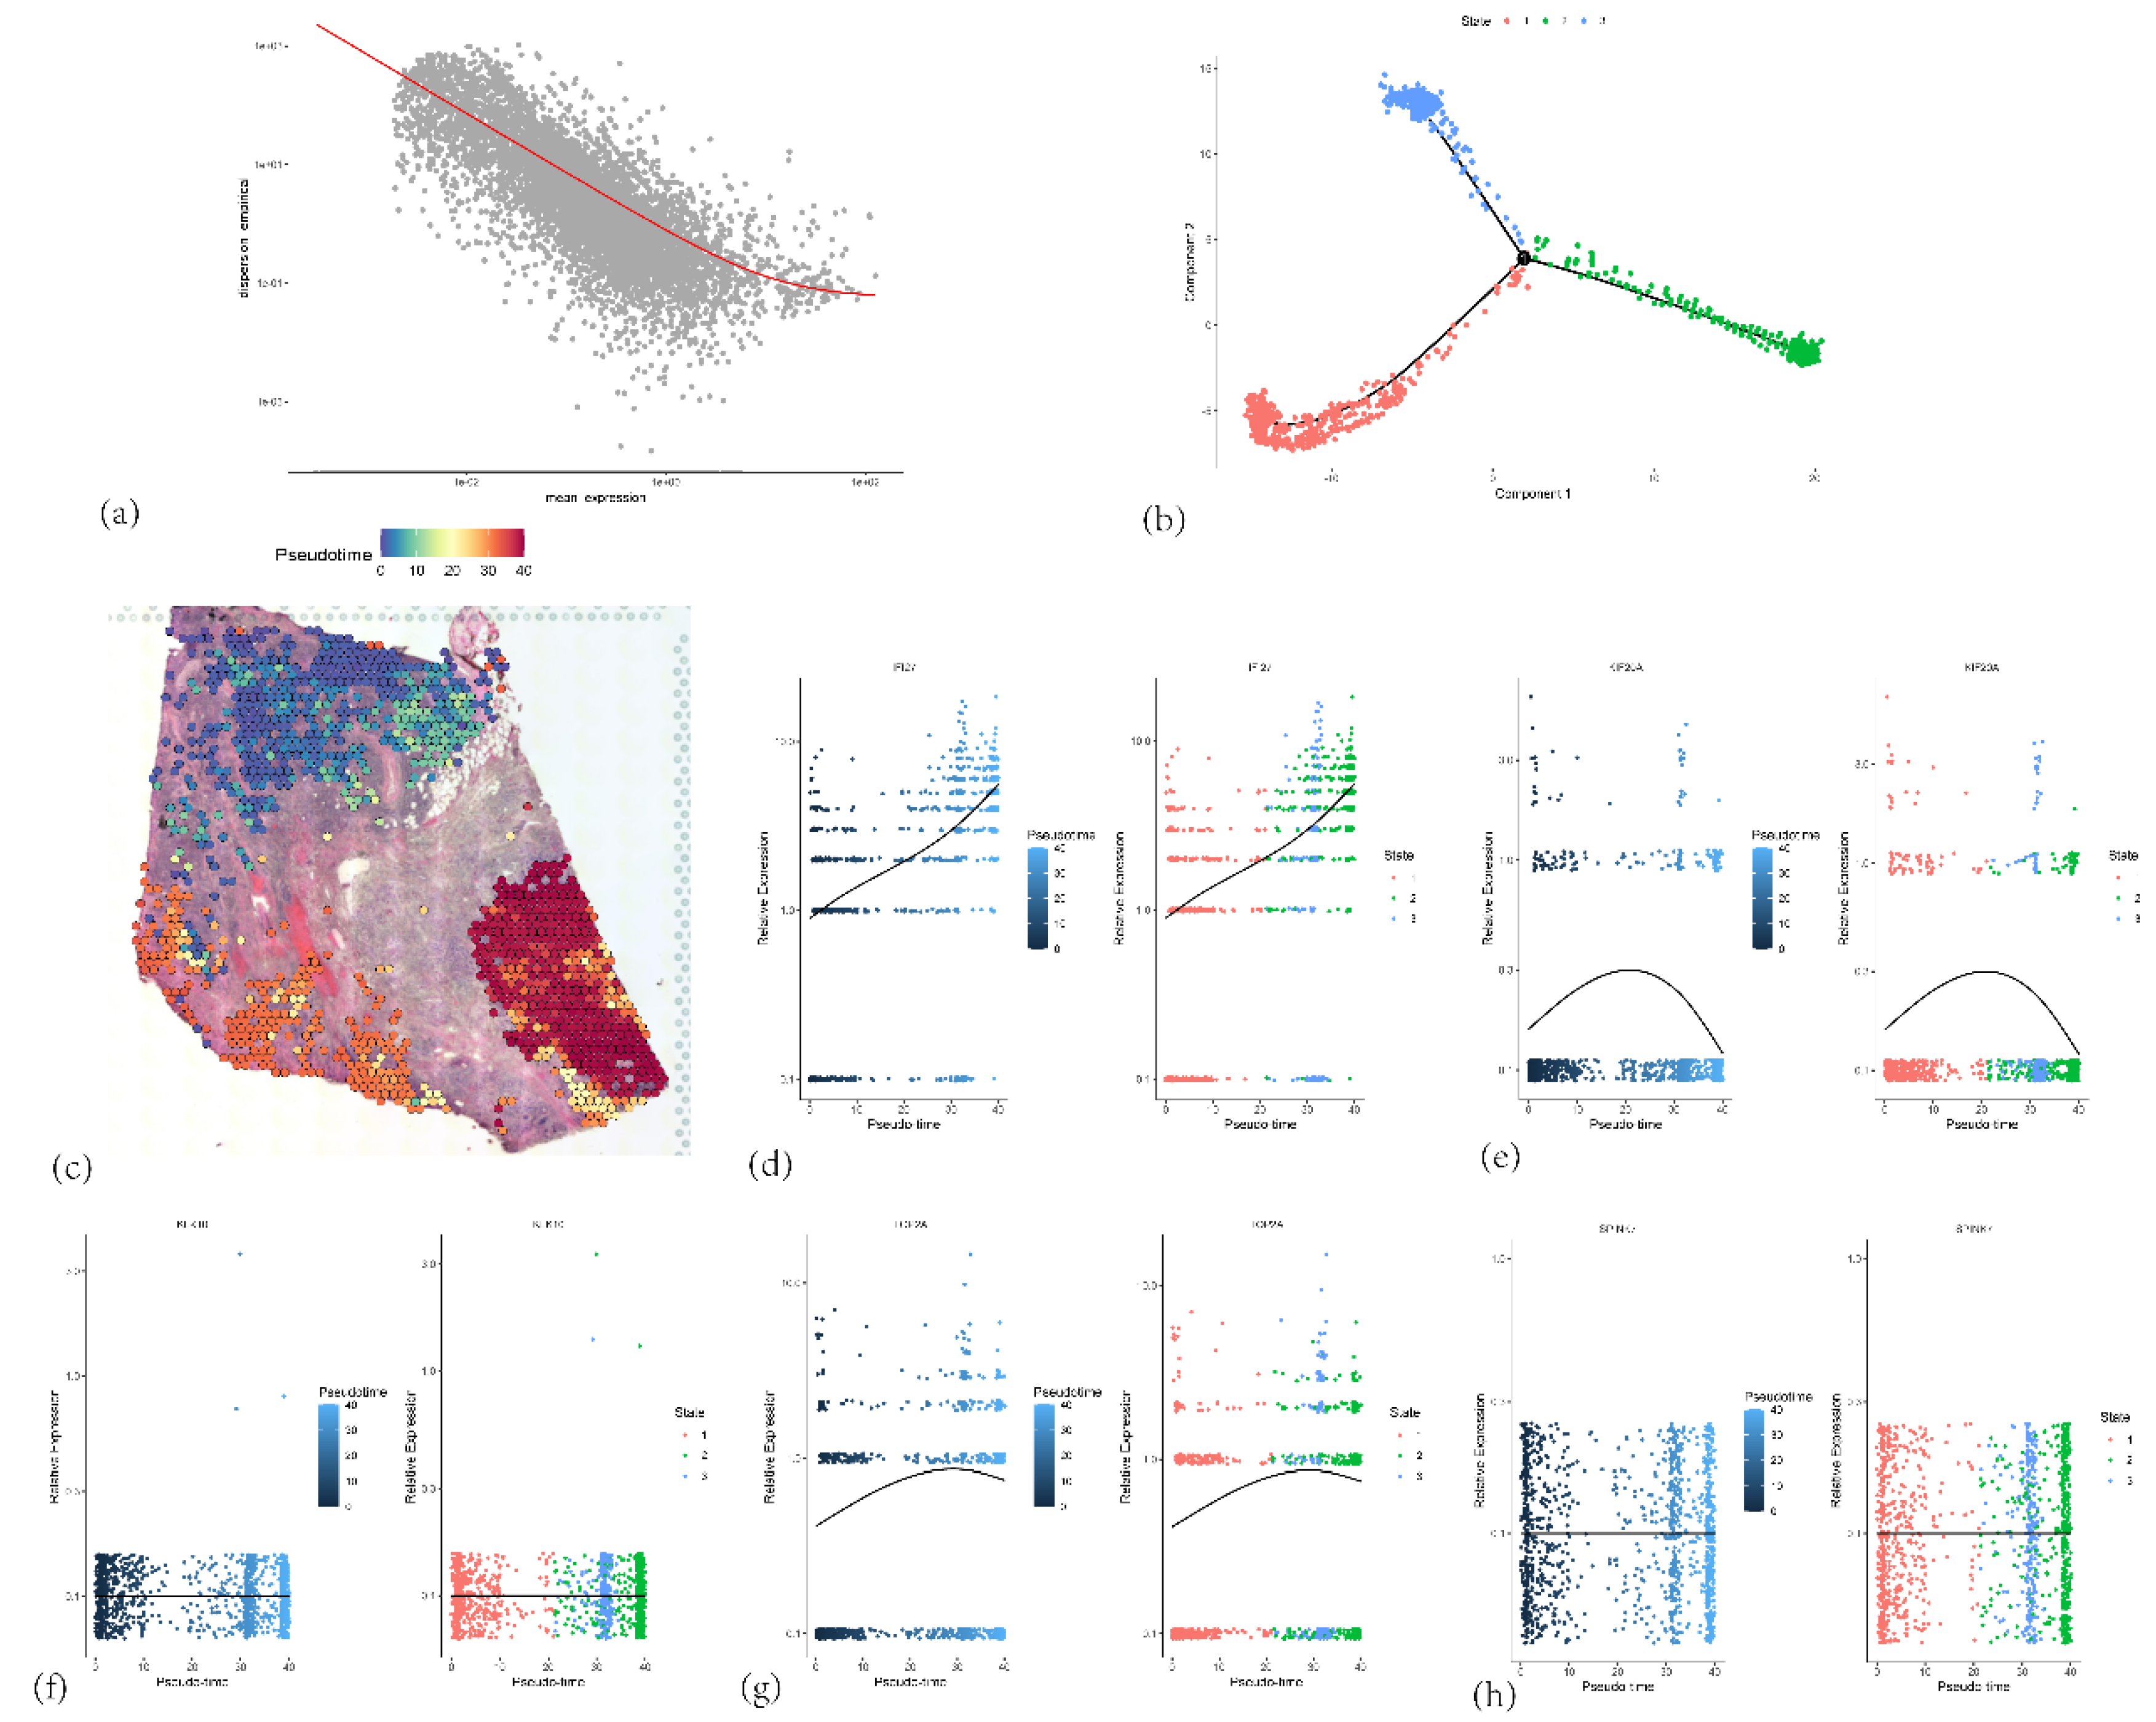
Figure 19.
The spatial colocalization characteristics and correlations of different cell types in the tumor microenvironment.
Figure 19.
The spatial colocalization characteristics and correlations of different cell types in the tumor microenvironment.
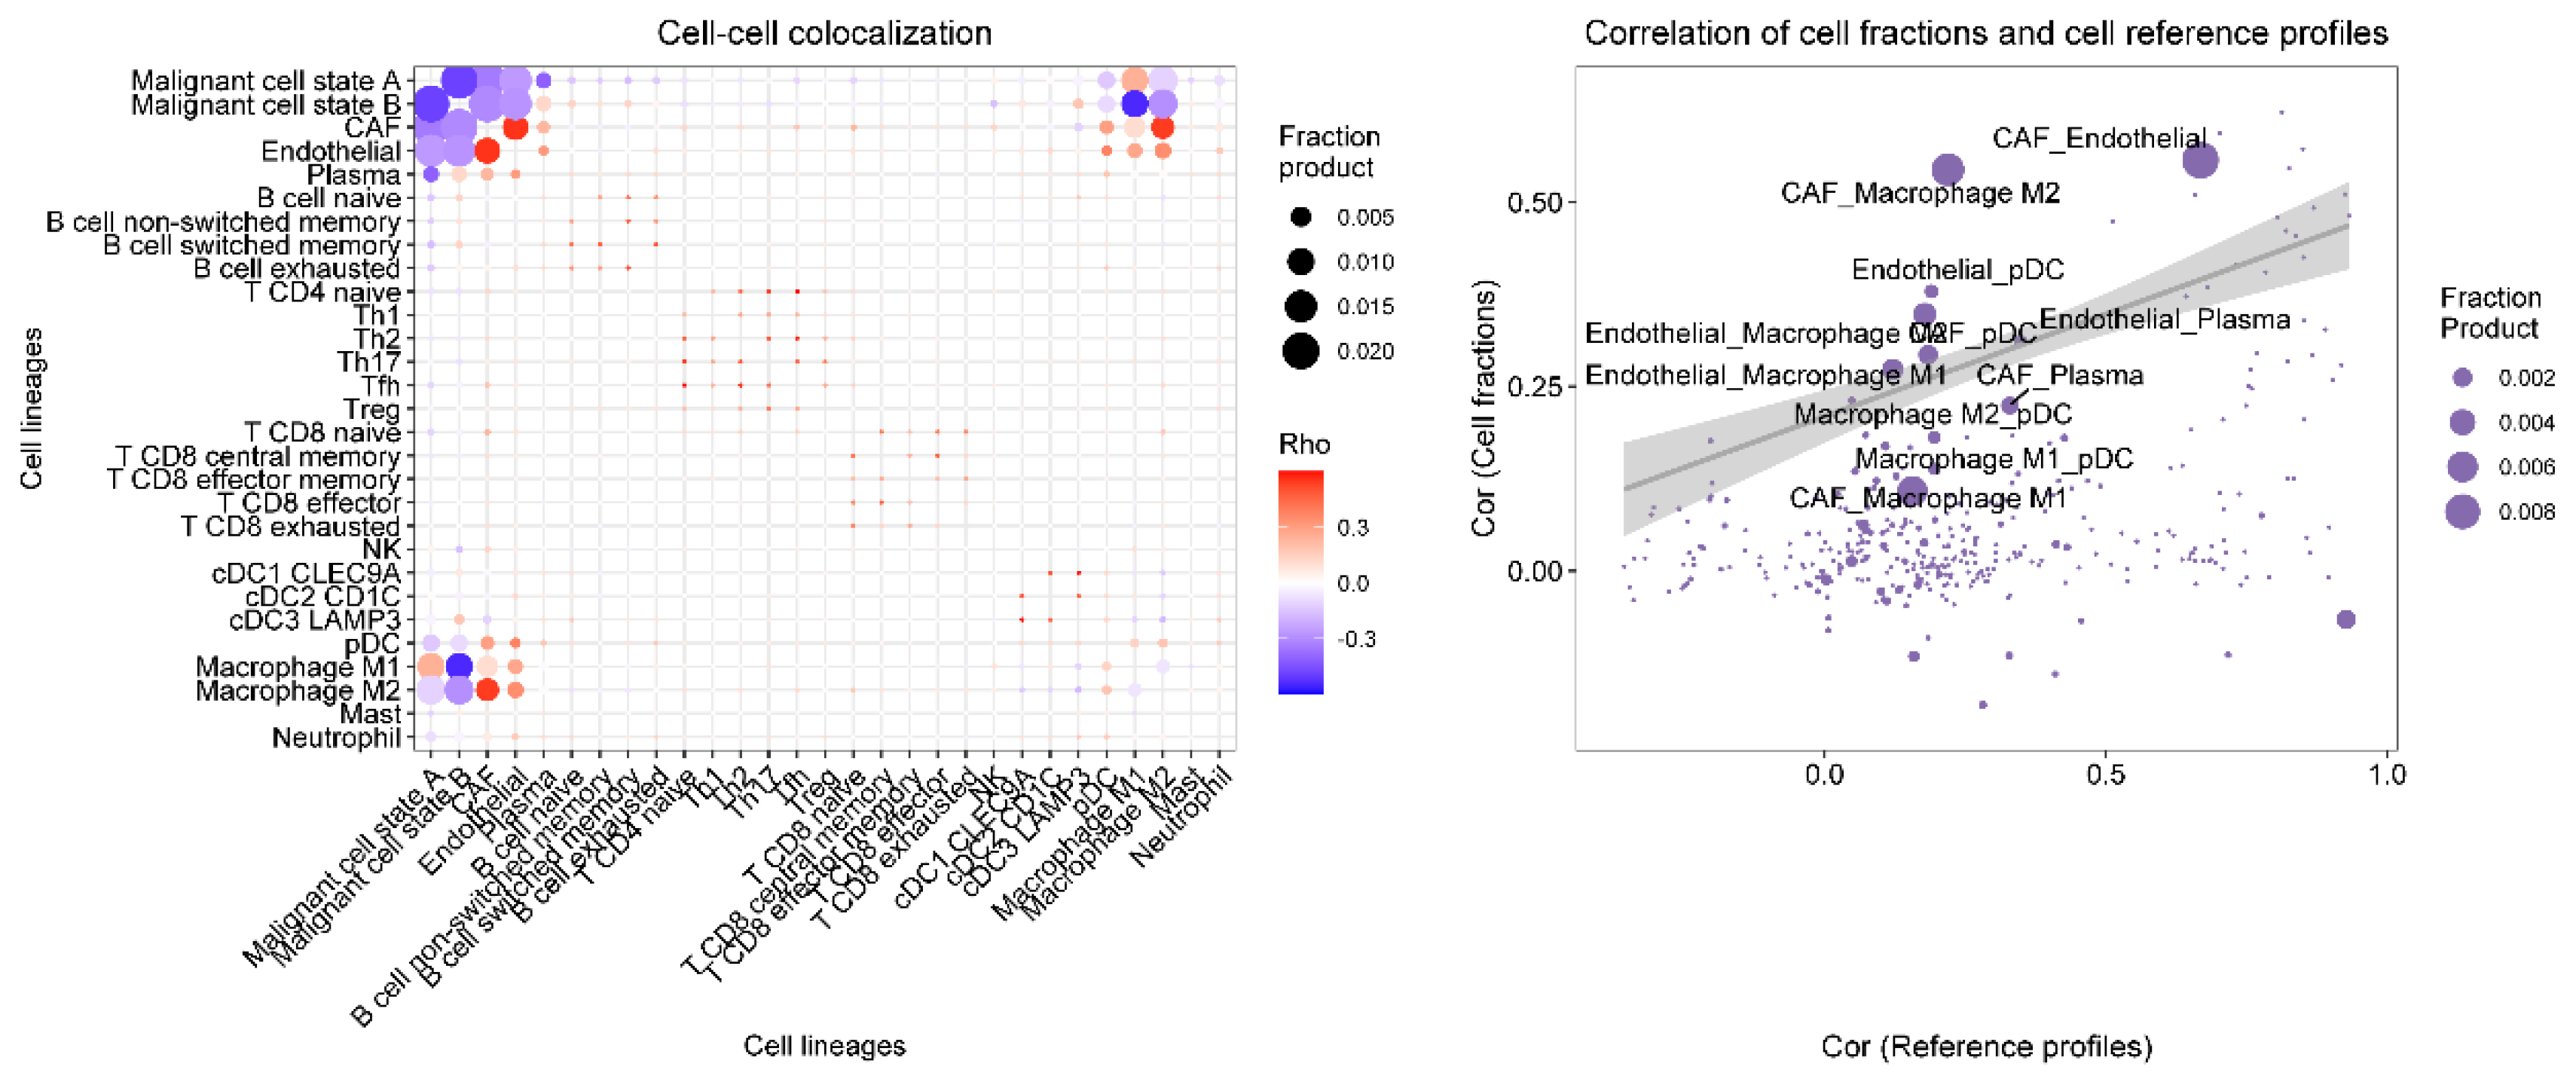
Figure 20.
The expression levels of 5 core genes in pancreatic cancer tissues and normal tissues based on PCR analysis.
Figure 20.
The expression levels of 5 core genes in pancreatic cancer tissues and normal tissues based on PCR analysis.
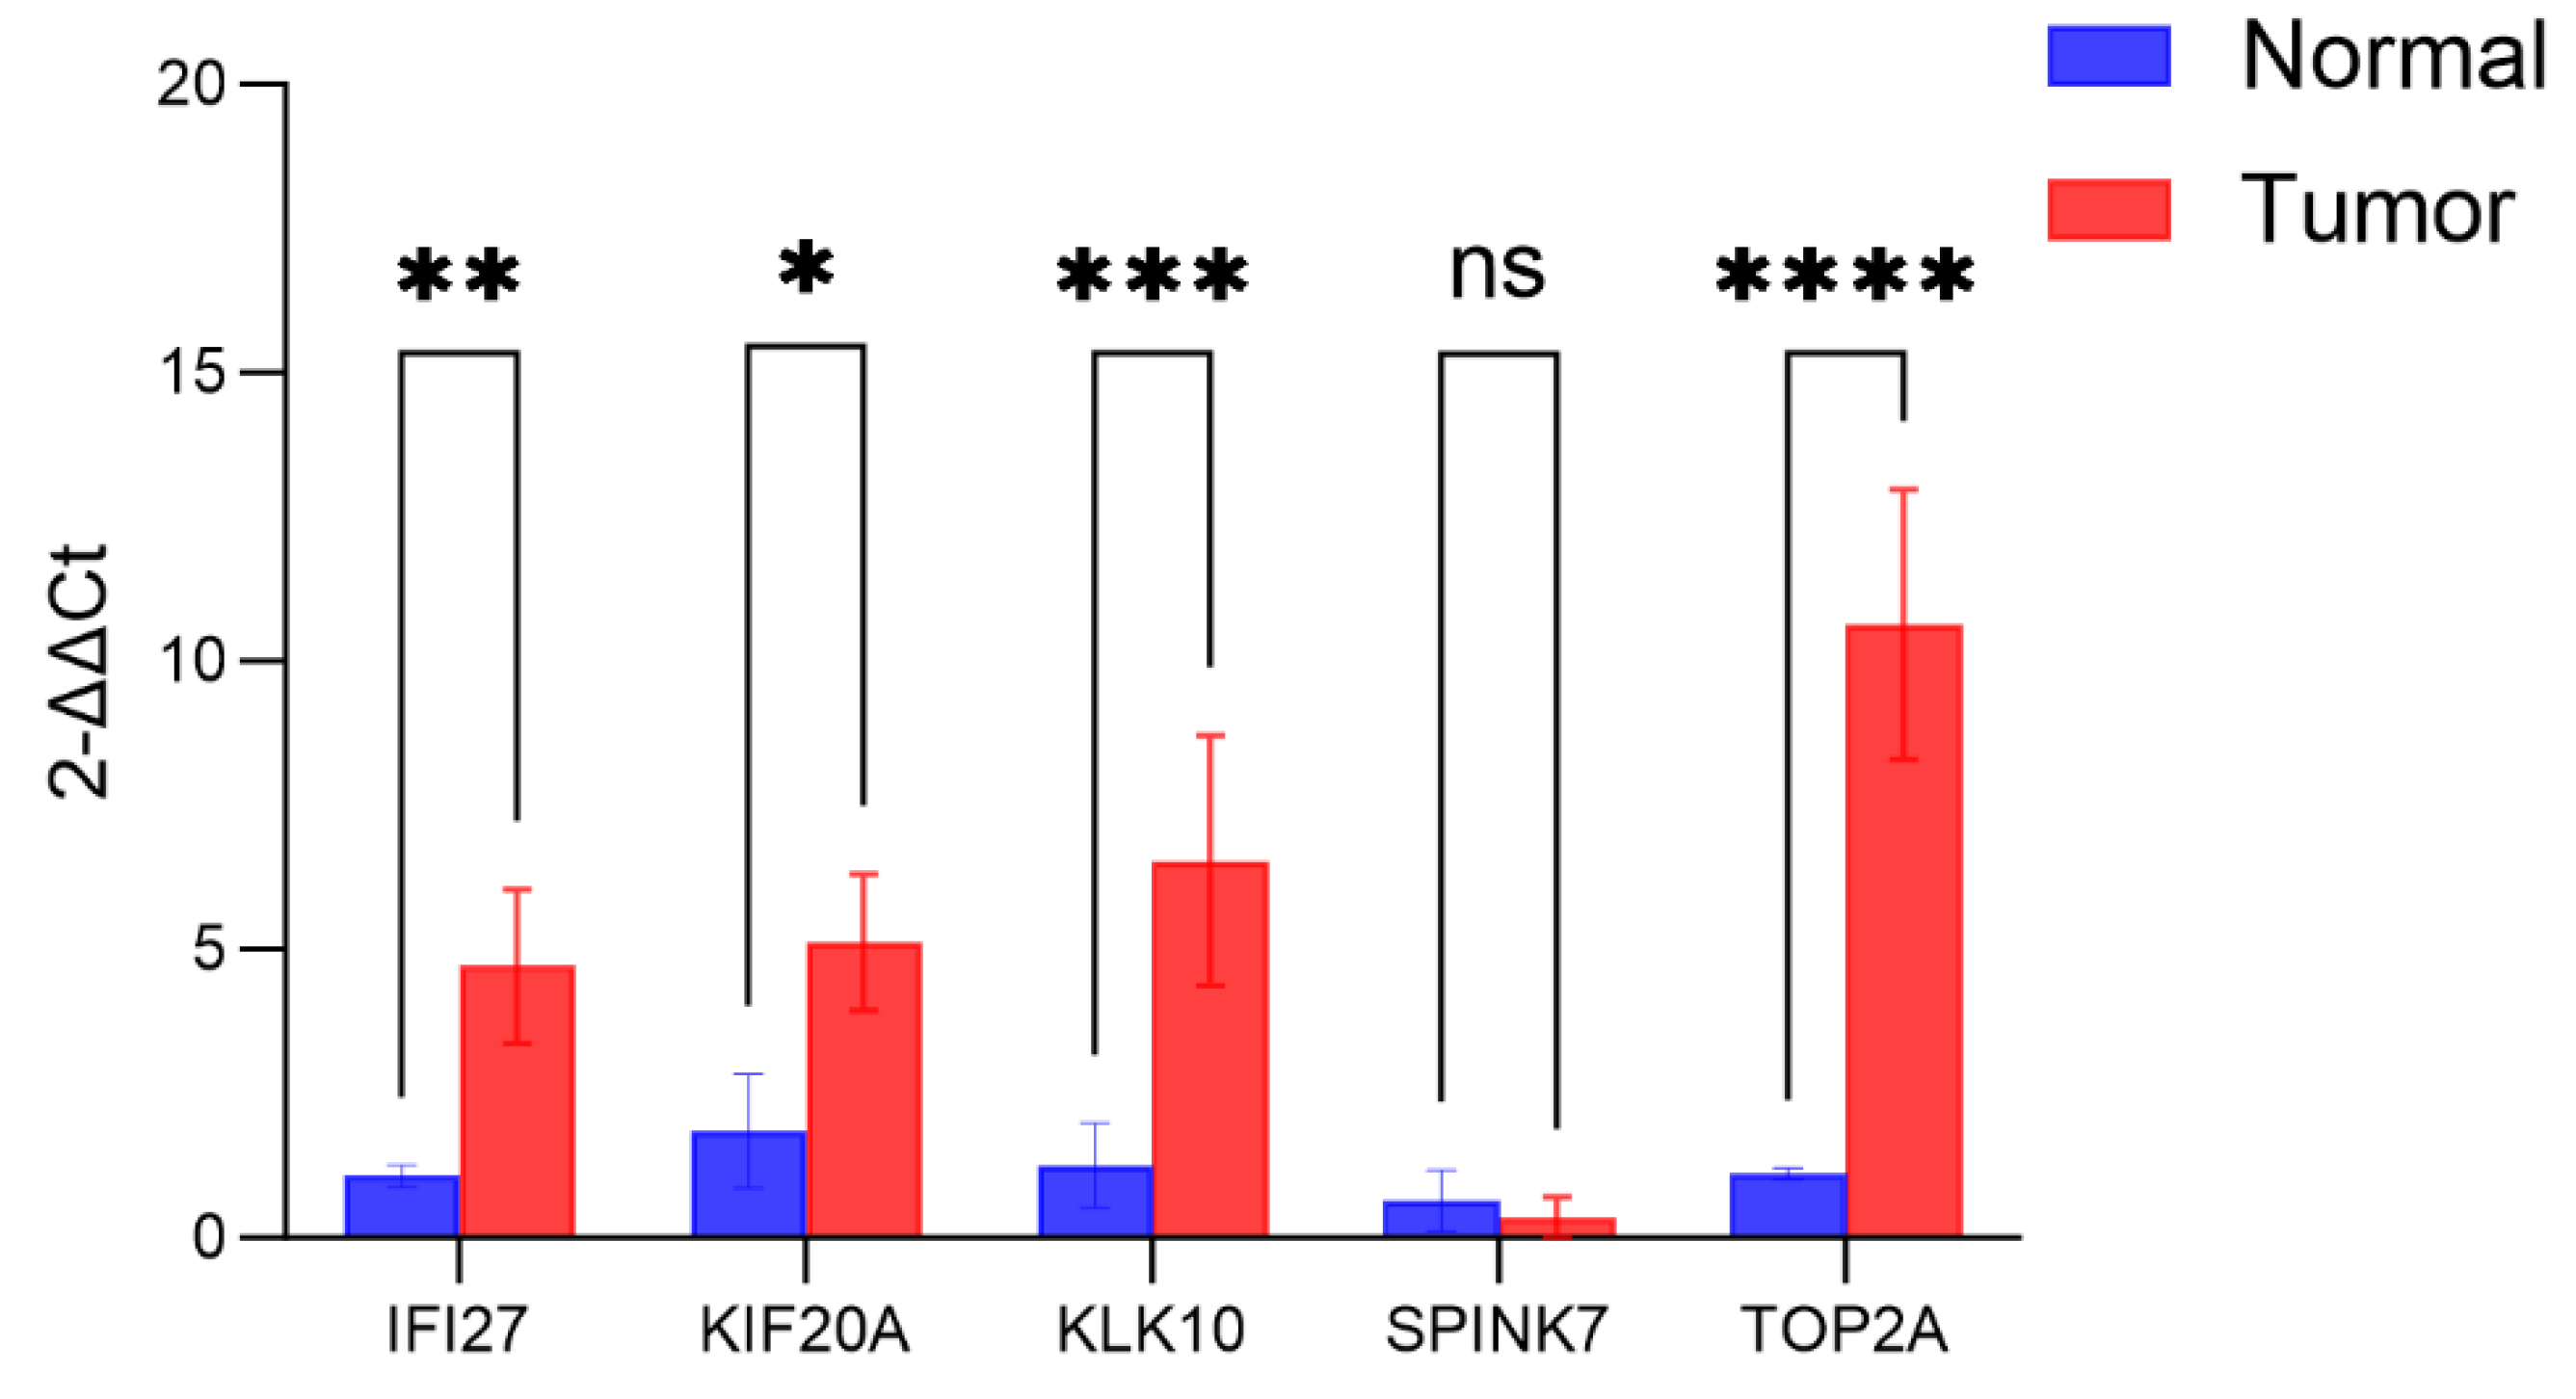
Figure 21.
Protein expression levels of IFI27, KIF20A, SPINK7 and TOP2A in PAAD tumor tissues.
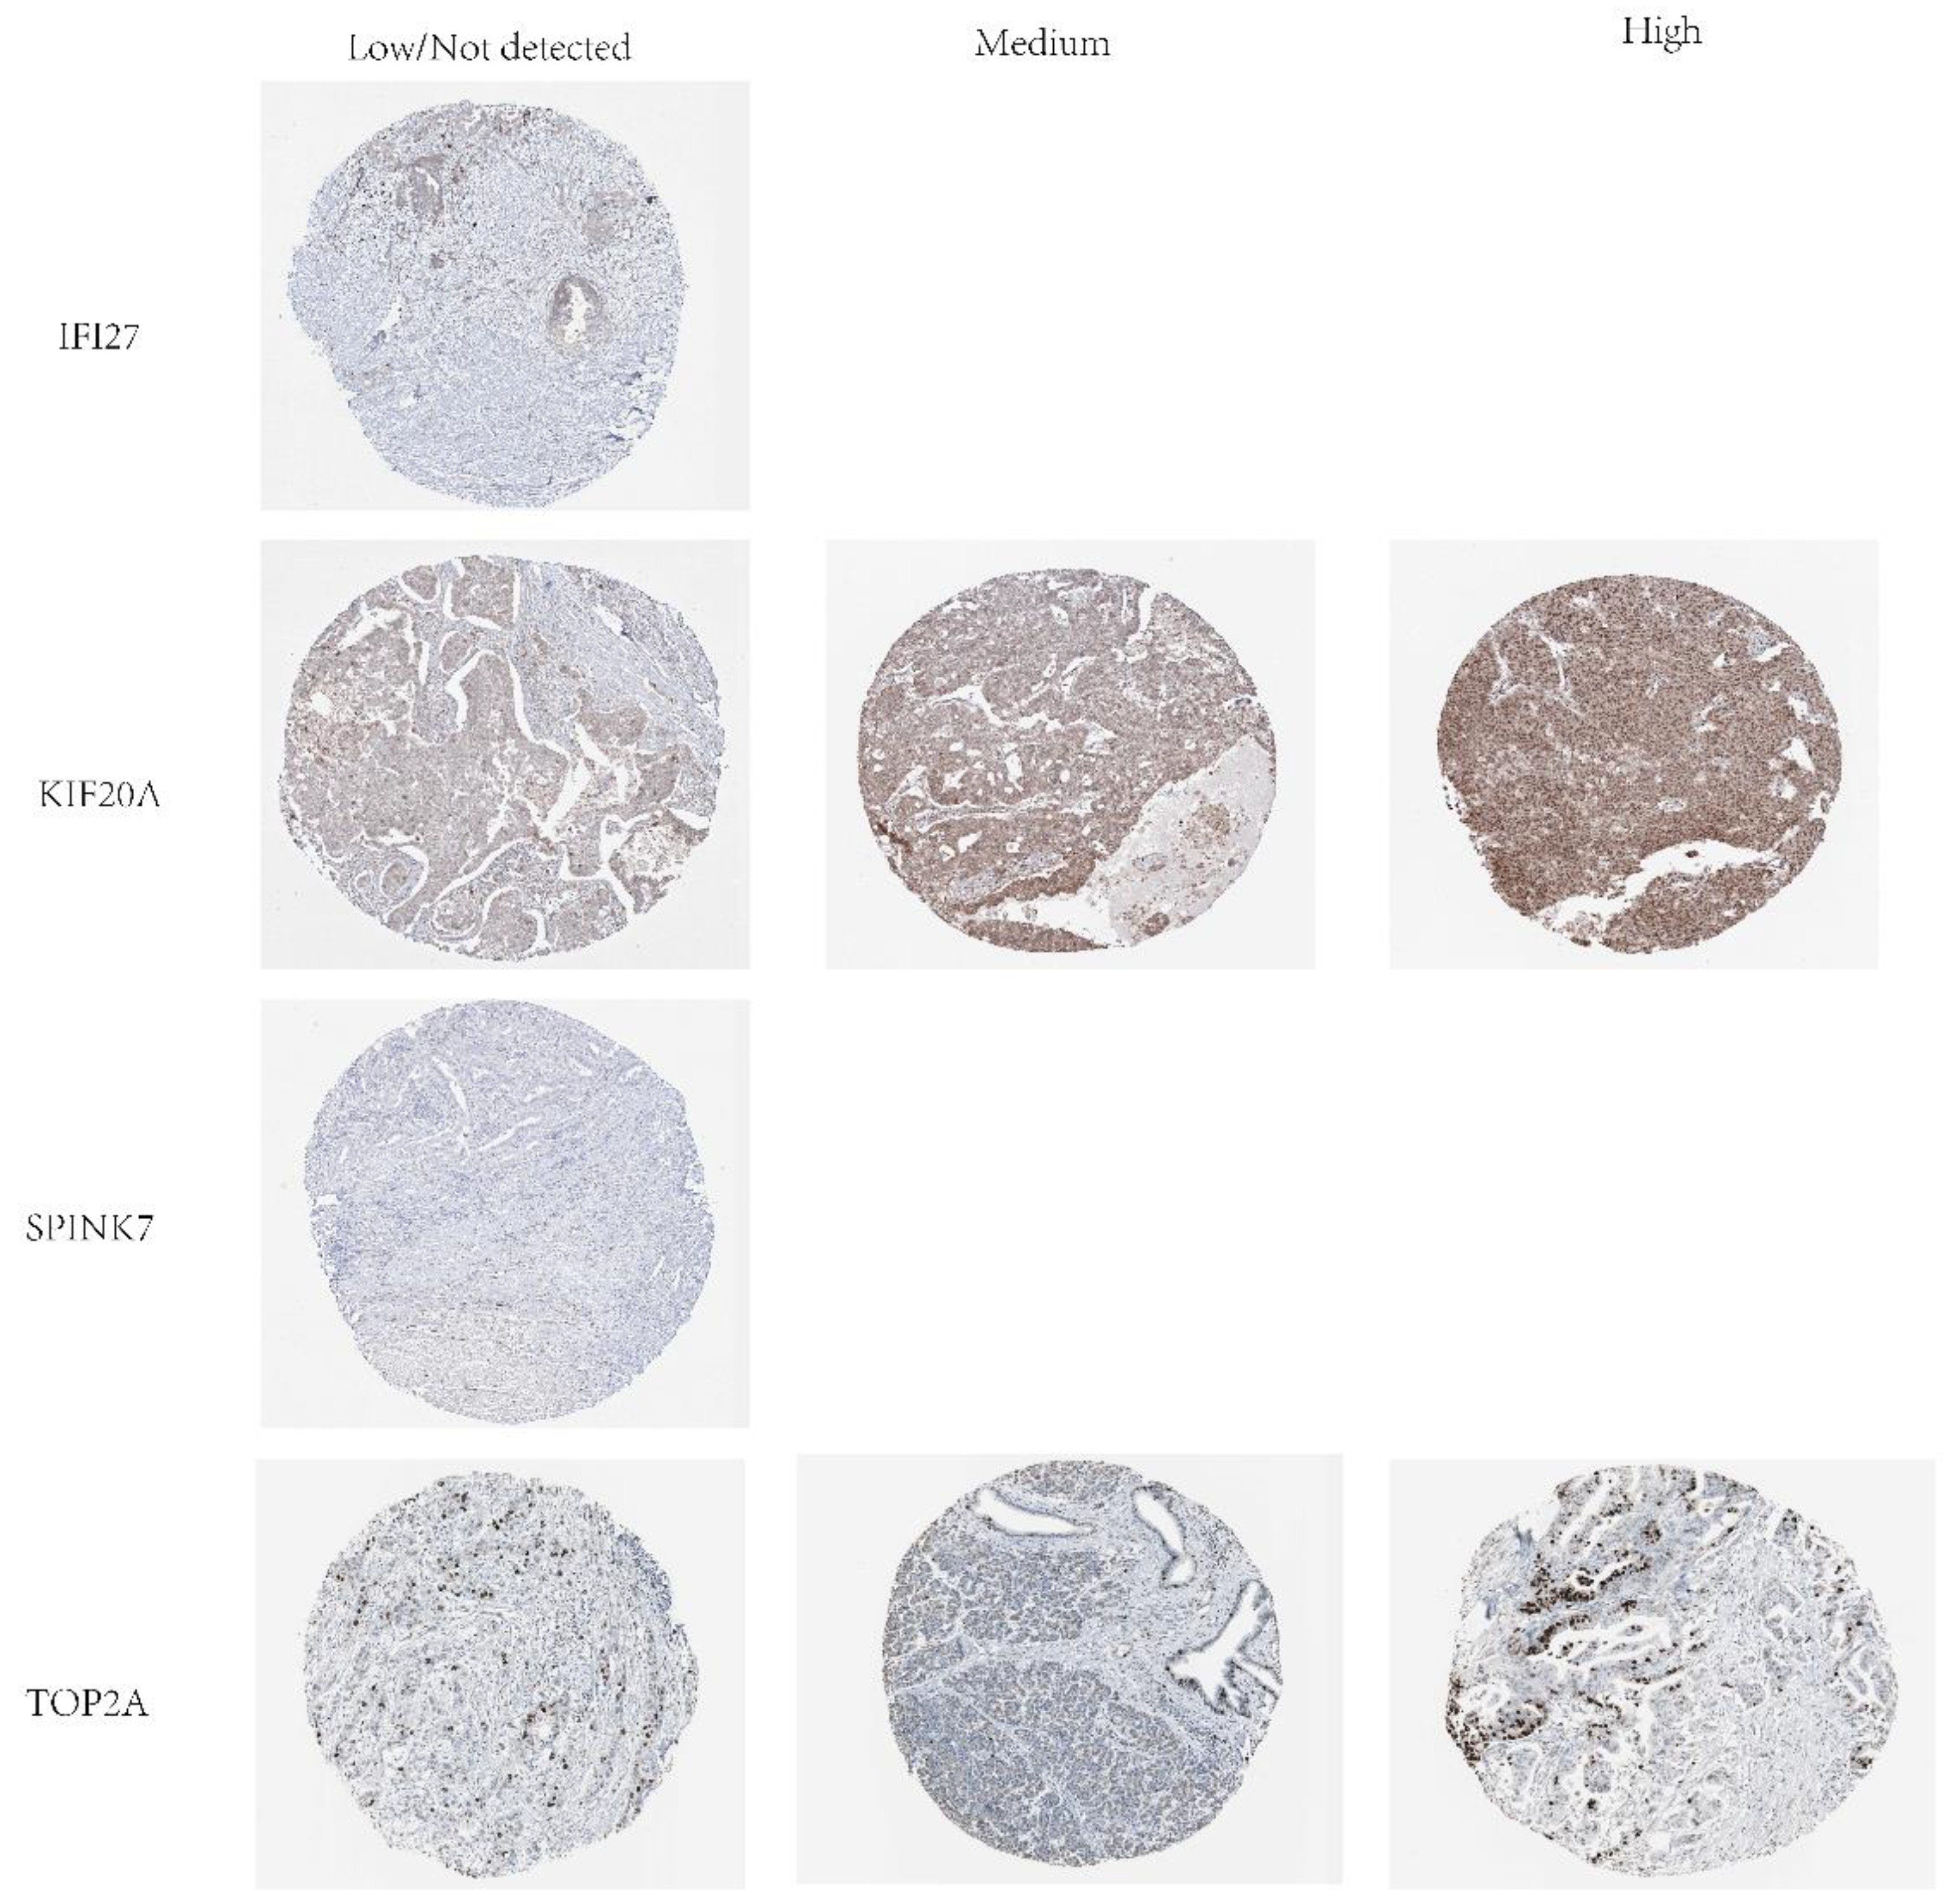
Disclaimer/Publisher’s Note: The statements, opinions and data contained in all publications are solely those of the individual author(s) and contributor(s) and not of MDPI and/or the editor(s). MDPI and/or the editor(s) disclaim responsibility for any injury to people or property resulting from any ideas, methods, instructions or products referred to in the content. |
© 2025 by the authors. Licensee MDPI, Basel, Switzerland. This article is an open access article distributed under the terms and conditions of the Creative Commons Attribution (CC BY) license (http://creativecommons.org/licenses/by/4.0/).
Copyright: This open access article is published under a Creative Commons CC BY 4.0 license, which permit the free download, distribution, and reuse, provided that the author and preprint are cited in any reuse.


