Submitted:
09 August 2025
Posted:
11 August 2025
You are already at the latest version
Abstract
Background: Prediabetes is on the rise and can progress to type 2 diabetes and related cardiometabolic complications if left untreated. Nutrition plays a critical role in blood glucose regulation, and evaluating the effects of whole foods on indices of glycemic control and body composition within individuals with prediabetes is important. This study examined whether consuming one average fresh mango daily for 24 weeks could improve blood glucose indices and body composition in individuals with prediabetes.
Methods: Participants were randomly assigned to either a treatment group (~300g mango daily for 24 weeks) or a control group (an isocaloric granola bar daily for 24 weeks). Laboratory visits were conducted at baseline and at weeks 6, 12, and 24 to distribute the study regimen and collect anthropometric measurements, body composition data, and blood samples.
Results: Twenty-three participants completed the study (treatment: n = 11; control: n = 12). At week 24, the treatment group had lower fasting blood glucose (p < 0.02), improved insulin sensitivity (QUICKI, p = 0.02), and reduced insulin resistance (HOMA-IR, p = 0.05) compared with the control. Mean HbA₁c remained stable in the treatment group but increased in the control group (p = 0.02). In the treatment group, body fat percentage decreased (p = 0.05) and fat-free mass increased (p < 0.03), with no significant changes in the control group.
Conclusions: Daily consumption of mango for 24 weeks enhanced glycemic control, insulin sensitivity, and body composition in adults with prediabetes, supporting its potential as a practical dietary intervention for metabolic health.
Keywords:
prediabetes
; glycemic control
; blood glucose
; body composition
; mango
1. Introduction
According to the Centers for Disease Control and Prevention (CDC), more than 130 million adults in the United States are currently living with diabetes or prediabetes, including an estimated 98 million individuals with prediabetes—a condition that, without timely management, can progress to type 2 diabetes, heart disease, and stroke [1]. Projections indicate that by 2030, nearly 40% of U.S. adults will be affected by prediabetes [2]. Early identification and prevention during the prediabetic stage are critical, as many individuals remain unaware of their condition until symptoms or complications arise[3].
Nutrition plays a vital role in glycemic control, and healthy eating supports both improved blood glucose management and long-term overall health [4,5,6]. In the Diabetes Prevention Program, lifestyle intervention reduced the incidence of type 2 diabetes by 58%, whereas metformin reduced it by 31% compared with placebo [7]. As such, identifying accessible, natural strategies to mitigate these risk factors may be key to delaying the onset of diabetes and reducing associated complications[8,9,10,11,12]. Dietary interventions rich in fruits, vegetables, and bioactive compounds have demonstrated positive effects on glycemic control and metabolic health [13,14]. Mango (Mangifera indica L.) is a tropical fruit that contains several bioactive compounds—including carotenoids, ascorbic acid, dietary fiber, phenolic compounds, gallic acid, and quercetin—that may contribute to its potential health benefits [15]. Preclinical studies have shown that freeze-dried mango supplementation can positively influence body composition and improve glucose and lipid profiles in mice fed a high-fat diet [16]. Limited human studies have similarly reported improvements in postprandial glucose, insulin sensitivity, and inflammatory markers in individuals with obesity and type 2 diabetes following mango consumption [17,18].
Despite these promising results, no controlled, long-term studies have directly assessed how daily mango consumption affects both short- and long-term glycemic control and body composition in individuals with prediabetes. Therefore, the aim of this study was to evaluate the effects of 24 weeks of daily mango consumption on indices of glycemic control and body composition in this at-risk population. We hypothesized that daily consumption of one average fresh mango (Tommy Atkins, approximately ~500 g with edible portion of about 300 g) would reduce fasting plasma glucose and insulin resistance, while improving body composition indices, which could further support better glucose management.
2. Materials and Methods
The study was conducted at Florida State University and was approved by the Florida State University Institutional Review Board (IRB Study ID: STUDY00002545) and registered in Clinicaltrials.gov (NCT05571800). Independent-living adult men and postmenopausal women between the ages of 50 and 70 years, with a body mass index (BMI) between 18.5 kg/m² and 34.9 kg/m² and fasting blood glucose levels ranging from 100 to 125 mg/dL or HbA1c between 5.7 to 6.4% were included in the study. Exclusion criteria included a diagnosis of diabetes, cardiovascular disease, uncontrolled hypertension (≥160/100 mmHg), active chronic diseases (e.g., cancer, thyroid, kidney, liver, or pancreatic disease), hormone replacement therapy, adherence to any specific diet, smoking, or heavy alcohol consumption (>12 alcoholic drinks per week). Individuals who reported frequent mango consumption (more than five mangoes in the past two weeks) were excluded.
A sample size of 24 participants was determined to provide >80% power to detect significant differences in primary outcomes (P < 0.05). The sample size was calculated using G*Power (version 3.0.10) for a two-group repeated-measures design with four time points, assuming an alpha of 0.05, power of 80%, and an effect size of 0.25 for changes in fasting blood glucose, considered a clinically meaningful outcome [19].
2.1. Screening, Enrollment, and Randomization
Volunteers were recruited using community-based strategies in the greater Tallahassee area, including flyers, printed flyers, social media, and emails. Screening and baseline assessments were conducted across two visits. At the screening visit, a member of the research team collected fasting blood glucose, HbA1c, blood pressure, and anthropometric measurements at the Sandels Building Clinical Area, Florida State University (FSU). Participants who met the eligibility criteria were provided with verbal and written explanations of the study and were given opportunities to ask questions. Participants then signed an informed consent form, and a copy of the signed consent form was provided to them.
Participants (n = 24) were randomized into treatment and control groups using GraphPad QuickCalcs. The treatment group received approximately 300 g of fresh mango daily, while the control group received a calorie-matched granola bar each day. Table 1 presents a comparison of the nutrient composition between Tommy Atkins mango and the granola bar [20,21].
We chose to compare the effects of consuming one average mango (~300 g edible portion) with those of a calorie-matched popular snack in the United States to isolate the unique impact of whole fruit, as a healthy carbohydrate source, on postprandial glycemia and body composition. By matching the calorie content between groups, we controlled for energy load and instead assessed whether the intrinsic matrix of mango—rich in fiber, vitamins, and polyphenols [22]—would yield more favorable glycemic and body composition responses compared to a processed snack.
2.2. Baseline Visit
At the baseline visit, a 20 mL venous blood sample was collected from participants in a fasted state, and anthropometric and body composition measurements were conducted. Each participant received their first 6-week supply of their assigned regimen. Participants were instructed to maintain their habitual diets and refrain from intentionally changing their body weight or physical activity levels during the study period. A compliance calendar was provided to each participant to track daily intake and record any missed or leftover portions at baseline, 6, 12, and 24-week visits. Compliance was defined as ≥80% adherence to the assigned regimen; participants falling below this threshold were considered noncompliant and removed from analysis. Follow-up appointments at weeks 6, 12, and 24 were scheduled, and participants were notified via phone and email.
2.3. Anthropometric Measurements
Height, weight, and waist and hip circumferences were measured at baseline, and at 6, 12, and 24 weeks, following the WHO STEPS protocol[23]. Height was measured without shoes using a stadiometer; weight was measured using a digital scale (Seca, Chino, CA). Circumferences were measured using a Gulick fiberglass measuring tape with a tension handle (Creative Health Products, Ann Arbor, MI).
2.4. Body Composition Analysis
Body composition was assessed using ImpediMed SFB7 BIS (ImpediMed, Carlsbad, CA), which measured fat mass, lean mass, and total body water. The device applied a small alternating current through the body to measure electrical impedance, which varies between tissues based on their water and electrolyte content.
2.5. Finger Stick Blood Testing
Fingerstick blood samples were collected at the screening visit to assess fasting blood glucose using a OneTouch® glucometer. Hemoglobin A1c (HbA1c) was measured at baseline, 12 weeks, and 24 weeks using the A1cNow® system. All measurements were performed using whole blood samples and conducted immediately after collection, without storage.
2.6. Blood Collection and Biochemical Assessments
Fasting venous blood samples (20 mL) were collected at baseline and 6-, 12-, and 24-week visits. Samples were centrifuged within one hour at 1,500 × g for 15 minutes at 4°C [24]. Plasma was separated, aliquoted, and stored at –80°C until analysis. Fasting plasma glucose was measured using Piccolo Xpress Chemistry Analyzer (ABAXIS, Union City, California), and insulin was measured using ELISA (R&D Systems, Minneapolis, Minnesota).
2.7. Calculating HOMA-IR
Insulin resistance was estimated using Homeostatic Model Assessment of Insulin Resistance (HOMA-IR), a commonly employed and validated tool in clinical studies. The HOMA-IR value was calculated using the formula [25]:
HOMA-IR = [Fasting blood glucose (mg/dL) × Fasting insulin (µU/mL)] ÷ 405
2.8. Assessment of Insulin Sensitivity Using QUICKI
Quantitative Insulin Sensitivity Check Index (QUICKI) was used to estimate insulin sensitivity based on fasting plasma glucose and insulin levels. This index is a validated surrogate measure that shows a strong correlation with the hyperinsulinemic-euglycemic clamp, the gold standard for assessing insulin sensitivity [25,26]. QUICKI was calculated using the following equation:
QUICKI = 1 ÷ [log (fasting insulin µU/mL) + log (fasting glucose mg/dL)]
2.9. Statistical Analyses
Baseline demographic characteristics were compared between treatment and control groups using independent t-tests for continuous variables (age, BMI, waist-to-hip ratio) and chi-square tests for categorical variables (sex, race, ethnicity). Variables that showed significant between-group differences (p < 0.05) and exhibited significant interactions with the outcome variable were included as covariates in subsequent models. To evaluate treatment effects over time, repeated measures analysis of the General Linear Model was conducted. When significant main effects or interactions were identified, post hoc multiple comparison tests were applied. All statistical analyses were conducted using SPSS (IBM SPSS Statistics for Windows, Version 29.0). A p-value of <0.05 was considered statistically significant for all analyses.
3. Results
A total of 23 participants completed the study (treatment: n = 11; control: n = 12). Baseline comparisons of key demographic and clinical characteristics showed no significant differences in age or waist-to-hip ratio between the groups; however, BMI differences approached significance (p = 0.09). Chi-square tests indicated significant differences in the distribution of sex, race, and ethnicity (p < 0.01 for all), suggesting baseline imbalance in these variables. Therefore, interactions between sex, race, ethnicity, and BMI were assessed for each outcome, and those with significant interactions were included as covariates in the analytical models. Table 2 presents the baseline demographic characteristics of the participants.
3.1. Changes in Fasting Blood Glucose and HbA1c
There were no significant interactions between fasting blood glucose or HbA1c and sex, race, ethnicity, or baseline BMI; thus, these covariates were excluded from the analytical models. At baseline, the mean±SE for fasting blood glucose was 113.3 ± 2.7 mg/dL in the treatment group and 116.5 ± 2.6 mg/dL in the control group, with no statistically significant difference between the groups. Over the study period, the mean±SE for fasting glucose numerically decreased to 107.0±5.1 mg/dL in the treatment group but increased to 125.3±4.8 mg/dL (p = 0.07) in the control group. At 24 weeks, the treatment group had lower fasting glucose than the control group (mean difference±SE: 18.3±7.0 mg/dL, p<0.02).
The mean±SE for HbA1c at baseline was slightly higher in the treatment group compared to the control group (5.7 ± 0.2% vs. 5.5 ± 0.2%), though this difference was not statistically significant. The mean HbA1c remained the same in the treatment group during the 24 weeks of follow-up, but increased to 5.9±0.1% in the control group (p=0.02)
3.2. HOMA-IR and QUICKI
The baseline mean±SE for HOMA-IR was lower in the treatment group compared to the control group (2.1 ±0.6 vs. 3.1 ± 0.6), but the difference was not statistically significant. Over the 24-week period, the mean HOMA-IR decreased slightly in the treatment group (from 2.1 to 2.0) but increased in the control group (from 3.1 to 3.6), resulting in a between-group difference at week 24 (p = 0.05).
The mean±SE QUICKI at baseline was slightly higher in the treatment group compared to the control group (0.35 vs. 0.34); however, the difference was not statistically significant. Race demonstrated a significant interaction with QUICKI and was therefore included as a covariate in the analysis. Throughout the study, the mean QUICKI remained almost stable in the treatment group, while it declined in the control group (from 0.34 to 0.32), resulting in a statistically significant difference between groups at week 24 (p < 0.02). Adjusted mean QUICKI changes over the study period for both groups are shown in Figure 1.
3.3. Body Composition, BMI, and Waist-To-Hip Ratio
The mean ± SE body fat percentage in the treatment group decreased from 30.5 ± 2.0 % to 29.1 ± 2.0 %, while in the control group it went from 31.5 ± 2.0 % to 30.6 ± 2.0 %. This reduction in the treatment group trended toward statistical significance by week 12 (p = 0.05), whereas no significant change occurred in the control group.
Race and sex showed significant interactions with fat-free mass and were included as covariates in the analysis. In the treatment group, fat-free mass declined from 71.4± 1.7% to 65.6±3.3% by week 6 (p < 0.05) but increased to 72.5±1.8% by week 24 (p<0.03). No significant changes were noted in the control group. The between-group difference at week 24 approached statistical significance (mean difference±SE = 5.43±0.06, p = 0.06). The mean±SE total body water increased from 50.9±1.5% to 51.8±1.5% in the treatment group and from 50.2±1.5% to 50.8±1.5% in the control group; however, these changes were not statistically significant.
In the treatment group, the mean±SE BMI decreased from 24.5±1.3 to 24.1±1.4 kg/m² by week 12 (p = 0.07), but returned to 24.5±1.4 kg/m² by week 24. In contrast, the control group showed a consistent numerical increase in BMI from 28.6±1.3 kg/m² at baseline to 29.0±1.4 kg/m² at week 24.
A significant interaction between baseline BMI and waist-to-hip ratio was observed and therefore included as a covariate in the analysis. The mean±SE waist-to-hip ratio was not significantly different between groups throughout the study. However, in the treatment group, it decreased from 0.86±0.04 to 0.82±0.03 (p < 0.03) by week 12. In contrast, the control group experienced a consistent and significant increase from 0.82±0.04 to 0.90±0.03 over the study period (p = 0.01), which may have clinical relevance. Changes in the adjusted mean waist-to-hip ratio are presented in Figure 2.
4. Discussion
Our findings support and expand emerging evidence on the metabolic benefits of daily fresh mango consumption in individuals with prediabetes. Participants who consumed one average mango daily for 24 weeks experienced lower fasting blood glucose levels compared to the control group (p< 0.02). Additionally, mean HbA₁c levels remained stable in the treatment group, while they increased significantly in the control group. These glycemic improvements were accompanied by lower insulin resistance, as measured by HOMA-IR (p = 0.05), and greater insulin sensitivity, as measured by QUICKI (p < 0.02). These results are in line with those of Pett et al., who reported improved insulin sensitivity and reduced HOMA-IR following a four-week mango intervention in overweight or obese adults with low-grade inflammation [27]. The longer duration of our study (24 weeks) suggests that the beneficial effects of mango on glycemic control may be both early onset and sustained over time.
In terms of body composition, participants in the treatment group maintained their BMI over 24 weeks, while those in the control group experienced a numerical increase. A crossover trial by Li et al. found that 12 weeks of daily mango intake improved blood glucose but had no significant effects on body composition [28]. Our study demonstrated not only improved glycemic measures but also favorable changes in body composition, including a reduction in body fat percentage (p = 0.05) and a significant increase in fat-free mass (p < 0.03) in the treatment group. Importantly, there were no significant changes in total body water, suggesting that the observed increase in muscle mass likely occurred independently of fluid retention. The longer intervention period in our study (24 weeks vs. 12 weeks) may explain the more pronounced effects compared to the Li et al. study. Another potential reason might be the differences between the populations of the studies, as it has been shown that individuals respond differently to foods, likely due to interindividual variability. A recent study using transcriptomic-based clustering suggested that mango’s impact on metabolic health may depend on individual gene expression patterns [29]. Our findings are also supported by preclinical data. A study using a high-fat diet mouse model showed that dietary supplementation with freeze-dried mango pulp significantly reduced total body fat and epididymal fat mass, with efficacy comparable to pharmaceutical agents like fenofibrate and rosiglitazone [30]. These results parallel our human data and support the potential of mango as a functional food for improving glucose metabolism and body composition.
The observed changes in body composition are clinically important, given the strong links between body composition and type 2 diabetes risk demonstrated in prior studies. Haines and colleagues (2022) examined young adults under 50 and found that lower skeletal muscle mass was independently associated with higher type 2 diabetes prevalence, even after adjusting for body fat distribution[31]. Similarly, another study reported that decreases in appendicular skeletal muscle mass index (pASMMI) and lean body mass index (pLBMI) over time correlated with new-onset diabetes in overweight and obese adults, indicating that preserving muscle mass helps prevent diabetes development [32]. Additionally, it has been shown that greater relative muscle mass was inversely associated with insulin resistance and risk of prediabetes across a large U.S. population sample, underscoring muscle mass as a modifiable protective factor against glycemic deterioration[33]. Moreover, it has been shown that those with a high waist-to-hip ratio had 1.56 times the odds (95% CI 1.18–2.07), those with high body fat percentage had 1.62 times the odds (95% CI 1.01–2.68), and those with larger visceral fat area had a 1% higher odds per cm² (OR 1.01; 95% CI 1.01–1.02) of developing type 2 diabetes [34]. These findings underscore the protective effect of higher muscle mass and the detrimental impact of excess fat in the development of type 2 diabetes.
A major strength of our study is its 24-week duration, which enabled us to evaluate both short- and longer-term effects of fresh mango consumption. However, there are limitations that need to be considered. The limited racial and ethnic diversity of our sample may reduce the generalizability of the findings. Although the distribution of sex, race, and ethnicity was different between groups at baseline, we adjusted for these variables by including them as covariates in all relevant models. While this approach helps account for baseline differences, the possibility of residual confounding remains, a common challenge in clinical trials, though its impact on our overall findings is likely minimal.
Future studies should aim to include more diverse populations and evaluate the mechanisms underlying the observed effects, such as the role of mango’s bioactive compounds in modulating insulin signaling and inflammation. Longer follow-up periods and comparisons with other fruits or dietary strategies may also help clarify mango’s unique benefits in metabolic health. Lastly, to examine the different effects of mango consumption on metabolic pathways based on changes in gene expression, as individuals respond differently to foods.
5. Conclusions
In conclusion, daily consumption of mango for 24 weeks improved both short and long-term blood glucose control, reduced insulin resistance, enhanced insulin sensitivity, and promoted favorable changes in body composition among individuals with prediabetes. These findings suggest that incorporating fresh mango into the diet may offer a practical, food-based strategy to support glycemic control and improve body composition in individuals at high risk for type 2 diabetes.
Author Contributions
Conceptualization, R.B. and B.H.A.; methodology, R.B., B.H.A., and R.C.H.; software, R.B.; validation, R.B., B.H.A.; formal analysis, R.B.; investigation, K.D., S.S., L.T.O.; resources, B.H.A., R.C.H.,; data curation, R.B.; writing—original draft preparation, R.B.; writing—review and editing, R.B., B.H.A., R.C.H., K.D., S.S., N.S.A, L.T.O.; visualization, R.B.; supervision, R.B, B.H.A, R.C.H; project administration, R.B, B.H.A, R.C.H; funding acquisition, R.B, B.H.A, R.C.H. All authors have read and agreed to the published version of the manuscript.” Authorship must be limited to those who have contributed substantially to the work reported.
Funding
The National Mango Board provided funding for this study.
Data Availability Statement
The datasets used and/or analyzed during the current study are available from the corresponding author upon reasonable request.
Acknowledgments
We would like to thank Lauren Ormsbee for her assistance with participant recruitment and communication.
Conflicts of Interest
The authors declare no conflicts of interest. The funders had no role in the design of the study, in the collection, analysis, or interpretation of data.
References
- CDC Prediabetes: Could It Be You? Infographic . Available online: https://www.cdc.gov/diabetes/communication-resources/prediabetes-statistics.html (accessed on 25 June 2025).
- Rowley, W.R.; Bezold, C.; Arikan, Y.; Byrne, E.; Krohe, S. Diabetes 2030: Insights from Yesterday, Today, and Future Trends. Popul. Health Manag. 2017, 20, 6–12. [Google Scholar] [CrossRef]
- Harris, M.I.; Eastman, R.C. Early Detection of Undiagnosed Diabetes Mellitus: A US Perspective. Diabetes Metab. Res. Rev. 2000, 16, 230–236. [Google Scholar] [CrossRef] [PubMed]
- Basiri, R.; Cheskin, L.J. Personalized Nutrition Therapy without Weight Loss Counseling Produces Weight Loss in Individuals with Prediabetes Who Are Overweight/Obese: A Randomized Controlled Trial. Nutrients 2024, 16, 2218. [Google Scholar] [CrossRef] [PubMed]
- Basiri, R.; Cheskin, L.J. Enhancing the Impact of Individualized Nutrition Therapy with Real-Time Continuous Glucose Monitoring Feedback in Overweight and Obese Individuals with Prediabetes. Nutrients 2024, 16, 4005. [Google Scholar] [CrossRef] [PubMed]
- Basiri, R.; Rajanala, Y. Effects of Individualized Nutrition Therapy and Continuous Glucose Monitoring on Dietary and Sleep Quality in Individuals with Prediabetes and Overweight or Obesity. Nutrients 2025, 17, 1507. [Google Scholar] [CrossRef]
- Reduction in the Incidence of Type 2 Diabetes with Lifestyle Intervention or Metformin. N. Engl. J. Med. 2002, 346, 393–403. [CrossRef]
- Basiri, R.; Spicer, M.T.; Ledermann, T.; Arjmandi, B.H. Effects of Nutrition Intervention on Blood Glucose, Body Composition, and Phase Angle in Obese and Overweight Patients with Diabetic Foot Ulcers. Nutrients 2022, 14, 3564. [Google Scholar] [CrossRef]
- Basiri, R.; Spicer, M.; Levenson, C.; Ledermann, T.; Akhavan, N.; Arjmandi, B. Improving Dietary Intake of Essential Nutrients Can Ameliorate Inflammation in Patients with Diabetic Foot Ulcers. Nutrients 2022, 14, 2393. [Google Scholar] [CrossRef]
- Basiri, R.; Seidu, B.; Cheskin, L.J. Key Nutrients for Optimal Blood Glucose Control and Mental Health in Individuals with Diabetes: A Review of the Evidence. Nutrients 2023, 15, 3929. [Google Scholar] [CrossRef]
- Basiri, R.; Spicer, M.; Munoz, J.; Arjmandi, B. Nutritional Intervention Improves the Dietary Intake of Essential Micronutrients in Patients with Diabetic Foot Ulcers. Curr. Dev. Nutr. 2020, 4, 8. [Google Scholar] [CrossRef]
- Basiri, R.; Rajanala, Y.; Kassem, M.; Cheskin, L.J.; Frankenfeld, C.L.; Farvid, M.S. Diabetes Control Status and Severity of Depression: Insights from NHANES 2005–2020. Biomedicines 2024, 12, 2276. [Google Scholar] [CrossRef] [PubMed]
- Adiels, M.; Olofsson, S.-O.; Taskinen, M.-R.; Borén, J. Overproduction of Very Low-Density Lipoproteins Is the Hallmark of the Dyslipidemia in the Metabolic Syndrome. Arterioscler. Thromb. Vasc. Biol. 2008, 28, 1225–1236. [Google Scholar] [CrossRef] [PubMed]
- Nachar, A.; Eid, H.M.; Vinqvist-Tymchuk, M.; Vuong, T.; Kalt, W.; Matar, C.; Haddad, P.S. Phenolic Compounds Isolated from Fermented Blueberry Juice Decrease Hepatocellular Glucose Output and Enhance Muscle Glucose Uptake in Cultured Murine and Human Cells. BMC Complement. Altern. Med. 2017, 17. [Google Scholar] [CrossRef] [PubMed]
- Maldonado-Celis, M.E.; Yahia, E.M.; Bedoya, R.; Landázuri, P.; Loango, N.; Aguillón, J.; Restrepo, B.; Guerrero Ospina, J.C. Chemical Composition of Mango (Mangifera Indica, L.) Fruit: Nutritional and Phytochemical Compounds. Front. Plant Sci. 2019, 10. [Google Scholar] [CrossRef]
- Lucas, E.A.; Li, W.; Peterson, S.K.; Brown, A.; Kuvibidila, S.; Perkins-Veazie, P.; Clarke, S.L.; Smith, B.J. Mango Modulates Body Fat and Plasma Glucose and Lipids in Mice Fed a High-Fat Diet. Br. J. Nutr. 2011, 106, 1495–1505. [Google Scholar] [CrossRef]
- Evans, S.F.; Meister, M.; Mahmood, M.; Eldoumi, H.; Peterson, S.; Perkins-Veazie, P.; Clarke, S.L.; Payton, M.; Smith, B.J.; Lucas, E.A. Mango Supplementation Improves Blood Glucose in Obese Individuals. Nutr. Metab. Insights 2014, 7, 77–84. [Google Scholar] [CrossRef]
- Pett, K.D.; Alex, P.G.; Weisfuss, C.; Sandhu, A.; Burton-Freeman, B.; Edirisinghe, I. Mango Consumption Is Associated with Increased Insulin Sensitivity in Participants with Overweight/Obesity and Chronic Low-Grade Inflammation. Nutrients 2025, 17, 490. [Google Scholar] [CrossRef]
- Cohen, J. A Power Primer. Psychol. Bull. 1992, 112, 155–159. [Google Scholar] [CrossRef]
- Oats and Honey Granola Bars | Oat Bars. Available online: https://www.naturevalley.com/products/oats-n-honey-crunchy-granola-bars (accessed on 25 July 2025).
- Food Search | USDA FoodData Central. Available online: https://fdc.nal.usda.gov/food-search?query=tommy%20atkins%20mango (accessed on 25 July 2025).
- García-Magaña, M. de L.; García, H.S.; Bello-Pérez, L.A.; Sáyago-Ayerdi, S.G.; de Oca, M.M.-M. Functional Properties and Dietary Fiber Characterization of Mango Processing By-Products (Mangifera Indica, L., Cv Ataulfo and Tommy Atkins). Plant Foods Hum. Nutr. Dordr. Neth. 2013, 68, 254–258. [Google Scholar] [CrossRef]
- World Health Organization Waist Circumference and Waist-Hip Ratio: Report of a WHO Expert Consultation, Geneva, 8-11 December 2008. 2011.
- Blood Plasma and Serum Preparation - US. Available online: https://www.thermofisher.com/us/en/home/references/protocols/cell-and-tissue-analysis/elisa-protocol/elisa-sample-preparation-protocols/blood-plasma-serum-preparation.html (accessed on 29 July 2025).
- Yokoyama, H.; Emoto, M.; Fujiwara, S.; Motoyama, K.; Morioka, T.; Komatsu, M.; Tahara, H.; Shoji, T.; Okuno, Y.; Nishizawa, Y. Quantitative Insulin Sensitivity Check Index and the Reciprocal Index of Homeostasis Model Assessment in Normal Range Weight and Moderately Obese Type 2 Diabetic Patients. Diabetes Care 2003, 26, 2426–2432. [Google Scholar] [CrossRef]
- Katz, A.; Nambi, S.S.; Mather, K.; Baron, A.D.; Follmann, D.A.; Sullivan, G.; Quon, M.J. Quantitative Insulin Sensitivity Check Index: A Simple, Accurate Method for Assessing Insulin Sensitivity in Humans. J. Clin. Endocrinol. Metab. 2000, 85, 2402–2410. [Google Scholar] [CrossRef]
- Pett, K.D.; Alex, P.G.; Weisfuss, C.; Sandhu, A.; Burton-Freeman, B.; Edirisinghe, I. Mango Consumption Is Associated with Increased Insulin Sensitivity in Participants with Overweight/Obesity and Chronic Low-Grade Inflammation. Nutrients 2025, 17, 490. [Google Scholar] [CrossRef] [PubMed]
- Rosas, M.; Pinneo, S.; O’Mealy, C.; Tsang, M.; Liu, C.; Kern, M.; Hooshmand, S.; Hong, M.Y. Effects of Fresh Mango Consumption on Cardiometabolic Risk Factors in Overweight and Obese Adults. Nutr. Metab. Cardiovasc. Dis. NMCD 2022, 32, 494–503. [Google Scholar] [CrossRef] [PubMed]
- Keathley, J.; de Toro-Martín, J.; Kearney, M.; Garneau, V.; Pilon, G.; Couture, P.; Marette, A.; Vohl, M.-C.; Couillard, C. Gene Expression Signatures and Cardiometabolic Outcomes Following 8-Week Mango Consumption in Individuals with Overweight/Obesity. Front. Nutr. 2022, 9. [Google Scholar] [CrossRef] [PubMed]
- Lucas, E.A.; Li, W.; Peterson, S.K.; Brown, A.; Kuvibidila, S.; Perkins-Veazie, P.; Clarke, S.L.; Smith, B.J. Mango Modulates Body Fat and Plasma Glucose and Lipids in Mice Fed a High-Fat Diet. Br. J. Nutr. 2011, 106, 1495–1505. [Google Scholar] [CrossRef] [PubMed]
- Haines, M.S.; Leong, A.; Porneala, B.C.; Meigs, J.B.; Miller, K.K. Association between Muscle Mass and Diabetes Prevalence Independent of Body Fat Distribution in Adults under 50 Years Old. Nutr. Diabetes 2022, 12, 29. [Google Scholar] [CrossRef]
- Kim, H.J.; Lee, H.-W.; Kang, M.-K.; Leem, G.H.; Kim, M.-H.; Song, T.-J. Association of Body Composition Changes with the Development of Diabetes Mellitus: A Nation-Wide Population Study. Diabetes Metab. J. 2024, 48, 1093–1104. [Google Scholar] [CrossRef]
- Srikanthan, P.; Karlamangla, A.S. Relative Muscle Mass Is Inversely Associated with Insulin Resistance and Prediabetes. Findings from The Third National Health and Nutrition Examination Survey. J. Clin. Endocrinol. Metab. 2011, 96, 2898–2903. [Google Scholar] [CrossRef]
- Chen, Y.; He, D.; Yang, T.; Zhou, H.; Xiang, S.; Shen, L.; Wen, J.; Chen, S.; Peng, S.; Gan, Y. Relationship between Body Composition Indicators and Risk of Type 2 Diabetes Mellitus in Chinese Adults. BMC Public Health 2020, 20, 452. [Google Scholar] [CrossRef]
Figure 1.
Changes in mean QUICKI over the 24-week study period. Participants visited the lab at baseline and weeks 6, 12, and 24. A statistically significant difference between groups was observed at week 24 (p <0.02).
Figure 1.
Changes in mean QUICKI over the 24-week study period. Participants visited the lab at baseline and weeks 6, 12, and 24. A statistically significant difference between groups was observed at week 24 (p <0.02).
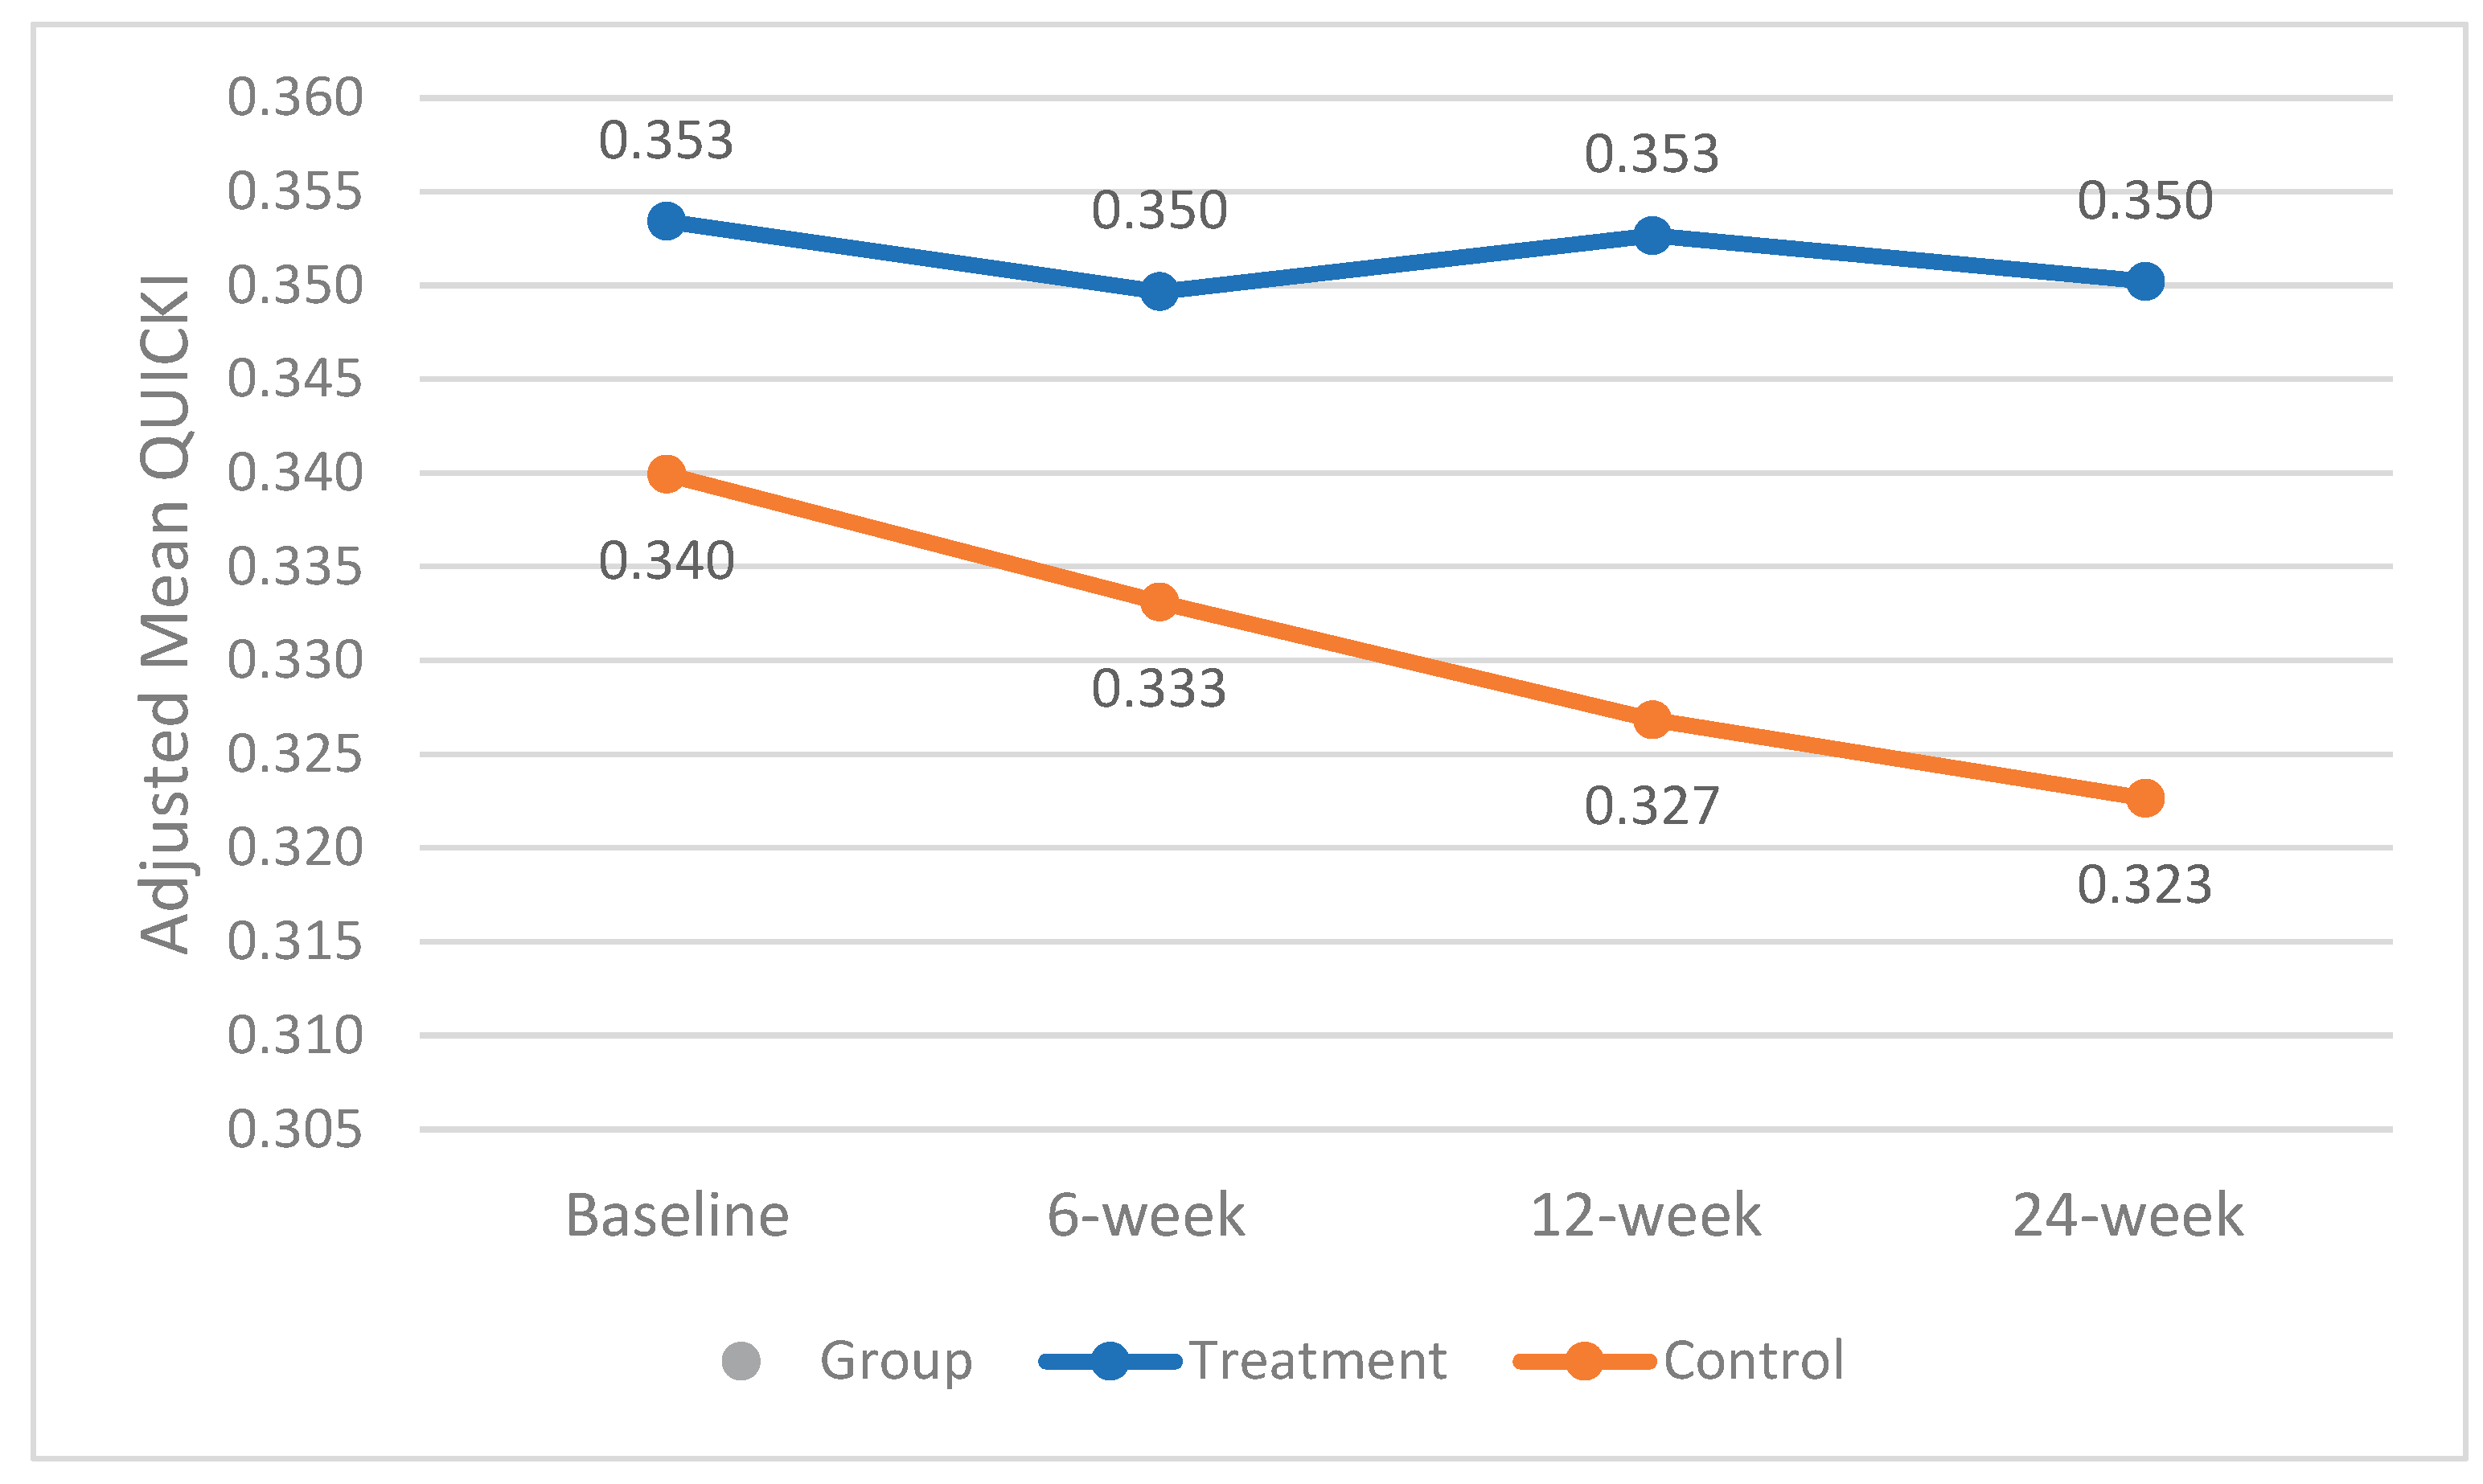
Figure 2.
Changes in mean waist-to-hip ratio over the 24-week study period. Participants visited the lab at baseline and weeks 6, 12, and 24. .
Figure 2.
Changes in mean waist-to-hip ratio over the 24-week study period. Participants visited the lab at baseline and weeks 6, 12, and 24. .
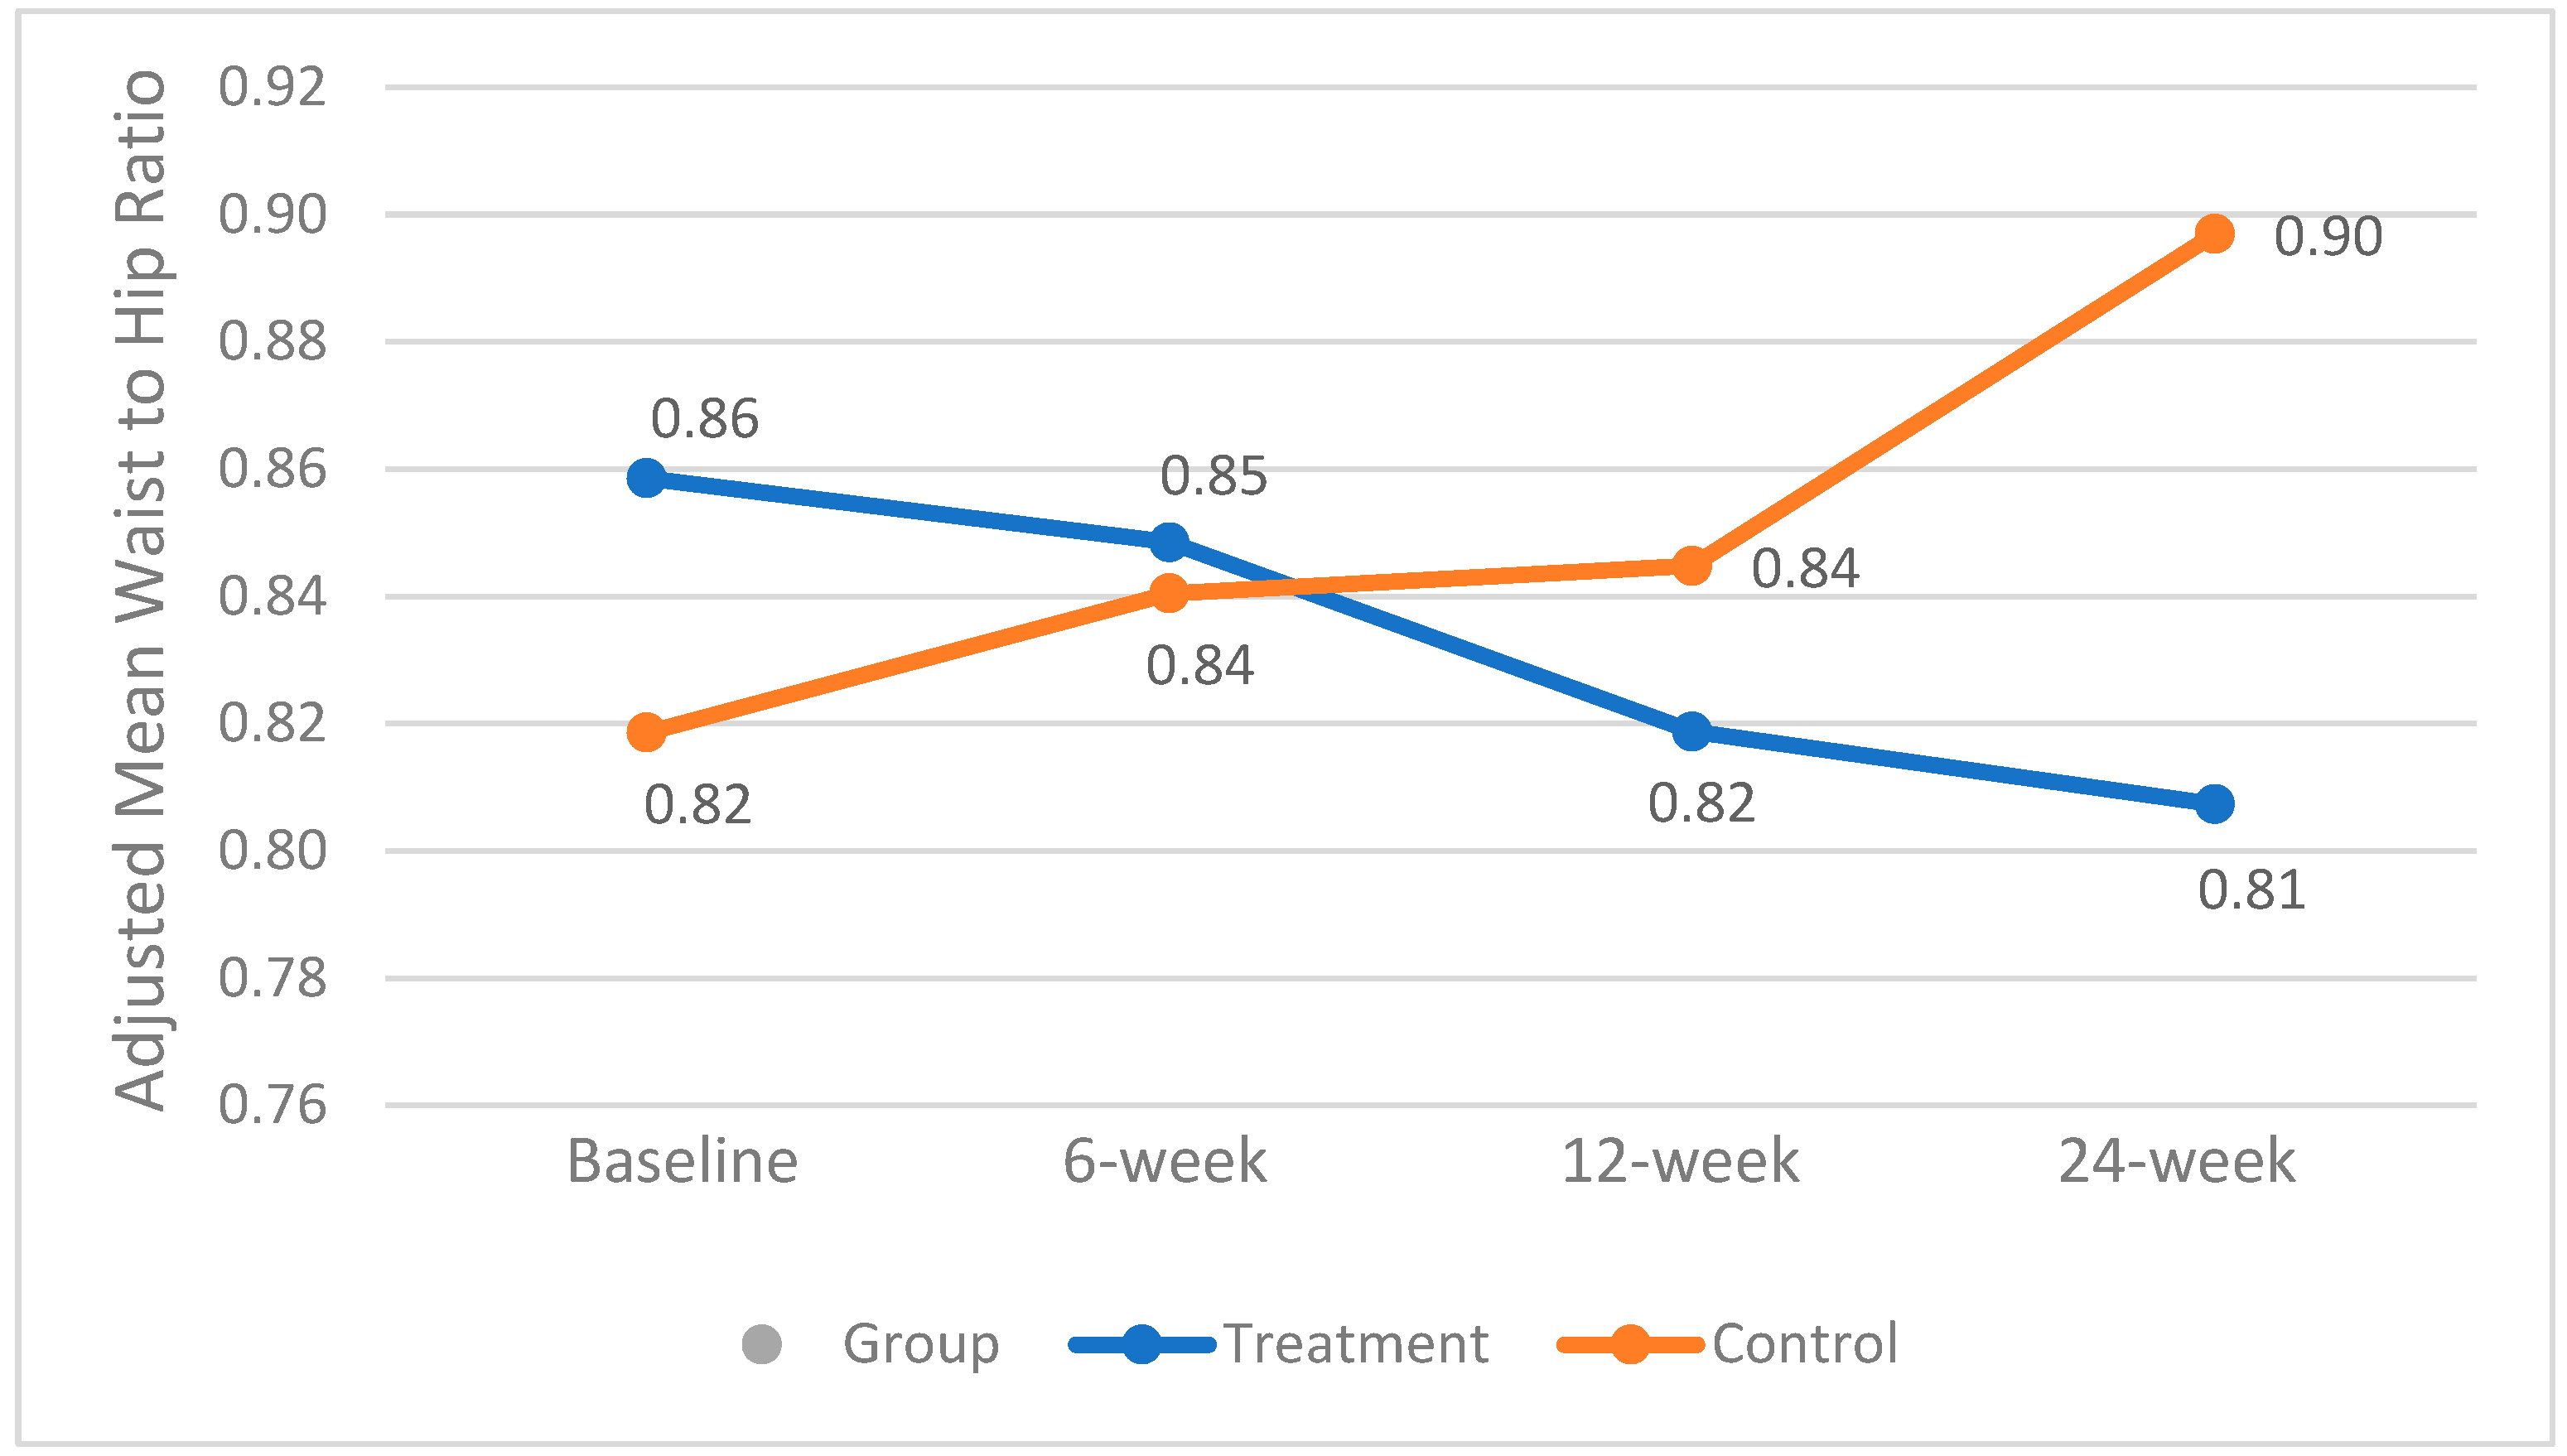

Table 1.
Nutritional Comparison of Fresh Mango and Calorie-Matched Granola Bar.
| Nutrient | Granola Bar (2bar, 22g) |
Tommy Atkins Mango (~300g edible) |
|---|---|---|
| Calories (kcal) | 190 | 195 |
| Total Fat (g) | 7 | 1.7 |
| Saturated Fat(g) | 1 | 0.0 |
| Sodium (mg) | 140 | <7.5 |
| Total Carbohydrate(g) | 29 | 45.9 |
| Dietary Fiber(g) | 2 | 5.4 |
| Total Sugars(g) | 111 | 32.12 |
| Protein(g) | 3 | 1.7 |
| Iron(mg) | 1 | <0.75 |
| Vitamin C(mg) | 0.0 | 30.6 |
1 Added sugar. 2Natural sugar.
Table 2.
Demographic characteristics of participants at baseline.
| Variable | Treatment (Mean±SD) | Control (Mean±SD) |
P-Value |
|---|---|---|---|
| Age(years) | 66.18 ± 3.25 | 65.17 ± 4.93 | 0.60 |
| Sex (Female/male) | 10/1 | 7/5 | <0.01 |
| BMI1 (kg/m2) | 24.46 ± 3.26 | 28.46 ± 5.04 | 0.09 |
| Waist-to-Hip Ratio | 0.85 ± 0.12 | 1.54 ± 2.47 | 0.40 |
| Fasting Blood Glucose (mg/dL) | 113.27±7.16 | 116.5±10.13 | 0.40 |
| Race (White/black) | 10/1 | 10/2 | <0.01 |
| Ethnicity (Hispanic/non-Hispanic) | 1/10 | 0/12 | <0.01 |
1 Body Mass Index.
Disclaimer/Publisher’s Note: The statements, opinions and data contained in all publications are solely those of the individual author(s) and contributor(s) and not of MDPI and/or the editor(s). MDPI and/or the editor(s) disclaim responsibility for any injury to people or property resulting from any ideas, methods, instructions or products referred to in the content. |
© 2025 by the authors. Licensee MDPI, Basel, Switzerland. This article is an open access article distributed under the terms and conditions of the Creative Commons Attribution (CC BY) license (http://creativecommons.org/licenses/by/4.0/).
Copyright: This open access article is published under a Creative Commons CC BY 4.0 license, which permit the free download, distribution, and reuse, provided that the author and preprint are cited in any reuse.


