Submitted:
08 August 2025
Posted:
08 August 2025
You are already at the latest version
Abstract
Background: The timely identification of mild cognitive impairment (MCI) in Parkinson’s disease (PD) is essential for early intervention and clinical management, yet it remains a challenge in practice. Methods: We conducted an analysis of 3,154 clinical visits from 896 participants in the Parkinson’s Progression Markers Initiative (PPMI) cohort. Participants were divided into two groups: cognitively normal (PD-NC, MoCA ≥ 26) and MCI (PD-MCI, 21 ≤ MoCA ≤ 25). To ensure no visit-level information leakage, subject-level stratified sampling was employed to split the data into training (70%) and hold-out test (30%) sets. From an initial set of twelve routinely assessed clinical features, seven were selected using LASSO logistic regression: Age, Sex, Education Years, Disease Duration, UPDRS-I, UPDRS-III, and Geriatric Depression Scale (GDS). Four machine learning models—logistic regression (LR), support vector machine (SVM), random forest (RF), and XGBoost—were trained using subject-level stratified 10-fold cross-validation with Bayesian optimization. Probabilistic outputs were dichotomized using three thresholding strategies: (i) default 0.5, (ii) F1-score maximization, and (iii) Youden index maximization. Results: On the independent test set, SVM achieved the highest overall performance with AUC-ROC of 0.7252 and AUC-PR of 0.5008. LR also performed competitively despite its simplicity. RF achieved the top performance in recall, reaching 0.8150. Feature importance analysis consistently highlighted Age, Education Years, and Disease Duration as the most informative predictors for distinguishing PD-MCI. Conclusion: This study developed and validated robust machine learning models for PD-MCI classification using only standard clinical assessments. The use of subject-level stratified design and Bayesian optimization enabled rigorous model evaluation and reduced overfitting risk. The results support the potential for data-driven, interpretable tools to enhance early cognitive impairment screening in PD care.
Keywords:
mild cognitive impairment
; Parkinson’s disease
; machine learning
; stratified sampling
; Bayesian optimization
; feature importance
1. Introduction
Parkinson’s disease (PD) is a common degenerative disease of the central nervous system, pathologically characterized by progressive loss of dopaminergic neurons in the substantia nigra and formation of Lewy bodies. With the intensification of global population aging trends, the prevalence of PD has been rising annually. According to statistics, the number of PD patients worldwide has exceeded 6 million and is projected to surpass 12 million by 2040, imposing substantial medical and economic burdens on patients, families, and society [1,2]. The clinical manifestations of PD are not limited to motor symptoms such as resting tremor, bradykinesia, muscle rigidity, and postural gait disorders, but also include a series of non-motor symptoms, including sleep disorders, olfactory dysfunction, autonomic dysfunction, psychiatric symptoms, and cognitive impairment [3,4].
Among the numerous non-motor symptoms, cognitive impairment has a particularly significant impact on the quality of life and disease prognosis of PD patients, representing one of the main causes of disability and dependence in PD patients [5,6]. The cognitive impairment spectrum associated with PD is broad, encompassing the entire continuum from subjective cognitive decline (SCD) and mild cognitive impairment (PD-MCI) to Parkinson’s disease dementia (PDD) [7]. PD-MCI, as the prodromal stage of PDD, has a prevalence of 20%-60% in the PD population [8,9,10,11], and almost all PD-MCI patients eventually progress to PDD [12]. The occurrence of PDD not only severely reduces patients’ quality of life and increases caregiver burden, but is also associated with higher mortality rates. Therefore, early and accurate identification of PD-MCI is of crucial clinical significance for developing individualized intervention strategies, potentially delaying disease progression, and improving patient outcomes.
Despite extensive research efforts to identify risk factors for cognitive impairment in Parkinson’s Disease (PD) across various domains such as clinical, biomarker, neuroimaging, and genetics [13,14,15], the development of practical diagnostic models still faces significant challenges [10,11,16,17]. One major limitation is the small cohort sizes used in many studies, which can undermine the statistical power and limit the generalizability of the findings. Additionally, many studies employ visit-level data splits, which can cause longitudinal information leakage. This occurs when multiple samples from the same subject are included in both training and testing datasets, leading to overly optimistic performance estimates that may not hold in real-world clinical settings [18,19]. Furthermore, there is often limited algorithmic diversity and sub-optimal hyper-parameter tuning in these studies, which restricts the exploration of potentially more effective machine learning models and configurations.
To address these limitations, this study presents a robust framework for the classification of PD-MCI using a large-scale, multi-visit clinical dataset. The primary contributions and innovations of this work are as follows: (1) Large-Scale Data Analysis: We leverage the comprehensive, publicly available Parkinson’s Progression Markers Initiative (PPMI) database, ensuring sufficient statistical power and enhancing the reliability of our findings. (2) Methodological Rigor: To prevent information leakage from multiple visits per patient, we implement a strict subject-level stratified sampling protocol for splitting data into training and testing sets, ensuring that all records from a single individual belong exclusively to one set. (3) Systematic Feature Selection: We employ LASSO logistic regression to systematically identify the most predictive clinical features from a wide array of candidates, promoting model parsimony and interpretability. (4) Comprehensive Model Comparison and Optimization: We construct, compare, and rigorously evaluate four distinct machine learning algorithms: Logistic Regression (LR), Support Vector Machine (SVM), Random Forest (RF), and XGBoost. We utilize a subject-level stratified cross-validation framework where Bayesian optimization is used for exhaustive hyperparameter tuning, ensuring that each model performs at its peak potential. (5) Advanced Evaluation and Interpretability: Model performance is assessed using a suite of metrics, including threshold optimization strategies tailored for imbalanced data. We conduct in-depth feature importance analysis for each model using multiple techniques (e.g., coefficients, SHapley Additive exPlanations (SHAP), permutation importance) to provide transparent and clinically relevant insights into the decision-making process of the models.
Through this structured approach, we aim to develop and validate a practical and accurate classification model that can serve as a reliable tool for clinicians in the early identification of PD-MCI.
The remainder of this paper is organized as follows. Section 2 presents our comprehensive methodology, including dataset description, data preprocessing strategies, feature selection using LASSO logistic regression, model construction, hyperparameter optimization, and evaluation metrics. Section 3 reports the experimental results, encompassing data characteristics, feature selection outcomes, model performance comparisons, and feature importance analysis. Section 4 discusses the clinical implications of our findings, compares our results with existing literature, addresses study limitations, and outlines future research directions. Finally, Section 5 summarizes the key contributions and conclusions of this study.
2. Materials and Methods
The overall experimental workflow is illustrated in Figure 1. The methodology was designed to ensure robust model development and validation, with a strong emphasis on preventing data leakage. Our approach encompasses the following key stages: (1) dataset preparation and quality control, (2) subject-level stratified data splitting and Z-score normalization, (3) LASSO-based feature selection, (4) model construction and hyperparameter optimization using Bayesian optimization, (5) comprehensive model evaluation with multiple threshold optimization strategies, and (6) feature importance analysis for model interpretability.
2.1. Dataset Description
The research data were sourced from the publicly available Parkinson’s Progression Markers Initiative (PPMI) database (www.ppmi-info.org). The PPMI study was approved by the institutional review board at each participating site, and all participants provided written informed consent. Our study included only data from PD patients, resulting in a dataset containing records from multiple visits.
From this dataset, we extracted twelve potential predictor variables covering patients’ demographic information, disease characteristics, and clinical assessment scores. These features, with their full names and abbreviations used hereafter, are: Age at visit (Age), Sex, Years of Education (EDUCYRS), Disease Duration, Hoehn and Yahr Stage (H&Y), Unified Parkinson’s Disease Rating Scale Part I (UPDRS-I), Part II (UPDRS-II), Part III (UPDRS-III), Part IV (UPDRS-IV), Epworth Sleepiness Scale (ESS), Rapid Eye Movement Sleep Behavior Disorder Screening Questionnaire (RBDSQ), and Geriatric Depression Scale (GDS). Disease Duration was calculated by subtracting the age of onset from the age at each visit. The patient identifier (PATNO) was used exclusively for subject-level data splitting.
The target variable for classification was determined based on the Montreal Cognitive Assessment (MoCA) score. Each visit (sample) was assigned to one of two classes. Class 0 (PD-NC) included patients with normal cognition, defined by a MoCA score ≥ 26. Class 1 (PD-MCI) comprised patients with mild cognitive impairment, defined by a MoCA score between 21 and 25 (inclusive). Samples with MoCA scores ≤ 20 were excluded to maintain a clear distinction between the PD-MCI and more severe cognitive impairment or dementia stages.
2.2. Data Splitting
The entire dataset, containing multiple samples per patient, was divided into a training set (70%) and a test set (30%). This split was performed using subject-level stratified sampling, implementing by a strict three-stage procedure. First, each patient was assigned a single label based on their visits. A patient was labeled as ’1’ if they had at least one PD-MCI visit, and ’0’ otherwise. The list of unique patients was then split, stratifying by this assigned label. Finally, all samples corresponding to the training patients were allocated to the training set, and all samples corresponding to the testing patients were allocated to the test set. This procedure guarantees that no patient’s data appears in both the training and test sets, preventing information leakage and ensuring the test set is a true hold-out set for final model evaluation. After data splitting, all subsequent computational procedures exclusively utilized information from the training set. The test set was reserved solely for final model evaluation.
2.3. Z-Score Normalization
Z-score normalization was performed using the mean and standard deviation calculated exclusively from the training data, and this transformation was subsequently applied to both the training and test sets. This approach ensures that no information from the test set influences the training process, thereby maintaining the integrity of the hold-out evaluation. Note that this normalization step was conducted only once after data splitting. Subsequent cross-validation procedures were conducted on the standardized training set, and it was not necessary to perform normalization repeatedly during the cross-validation process.
2.4. Feature Selection using LASSO Logistic Regression
To identify the most critical predictors of PD-MCI from the initial twelve clinical variables, we employed LASSO (Least Absolute Shrinkage and Selection Operator) logistic regression [20]. Unlike standard logistic regression, LASSO incorporates an L1 regularization term into the cost function, which penalizes the absolute magnitude of the model’s coefficients. The optimization objective is:
where is the predicted probability for sample i, is the true label, is the vector of coefficients, and is the regularization parameter. A key advantage of this method is its ability to shrink the coefficients of less important features to exactly zero, effectively performing automatic feature selection. This is particularly suitable for a binary classification task, as it results in a more parsimonious and interpretable model by retaining only the features with the strongest predictive power.
The optimal regularization parameter was determined through subject-level stratified 10-fold cross-validation conducted exclusively on the training set. Following the identification of the optimal value, the LASSO logistic regression model was retrained on the complete training dataset using this optimized regularization parameter. Features exhibiting non-zero coefficients in the final LASSO model were identified as the selected feature subset for subsequent analysis. This carefully curated feature subset was then employed across all downstream analytical procedures, including model construction, hyperparameter optimization, and performance evaluation.
2.5. Model Construction
Using the selected feature subset from LASSO feature selection, four machine learning models were constructed for PD-MCI classification. Four widely-used machine learning algorithms were selected for this study to provide a comprehensive comparative analysis: Logistic Regression (LR), Support Vector Machine (SVM), Random Forest (RF), and XGBoost.
Logistic regression served as the baseline linear model for binary classification, providing interpretable coefficients and establishing a foundational performance benchmark. The model employs the logistic function to map linear combinations of input features to probability estimates for PD-MCI classification [21]. Support Vector Machine was implemented with multiple kernel options to capture both linear and non-linear decision boundaries, offering flexibility in modeling complex feature relationships. The algorithm constructs optimal separating hyperplanes to distinguish between PD-MCI and PD-NC classes while maximizing the margin between classes [22].
Random Forest, as an ensemble method utilizing multiple decision trees, was employed to reduce overfitting and improve generalization through bootstrap aggregation. This algorithm constructs numerous decision trees using random subsets of features and training samples, with final predictions determined by majority voting across all trees [23]. XGBoost, a gradient boosting framework, was selected for its demonstrated effectiveness in handling imbalanced datasets and its optimization capabilities for classification tasks. The algorithm sequentially builds weak learners, with each subsequent tree focusing on correcting the errors made by previous iterations [24].
To address the inherent class imbalance in the dataset, where PD-NC samples substantially outnumber PD-MCI samples, tailored strategies were implemented for each algorithm to ensure optimal classification performance. For Logistic Regression, Support Vector Machine, and Random Forest, the class weight parameter was configured to "balanced", which automatically adjusts class weights inversely proportional to their respective frequencies in the training data, thereby providing equal importance to both minority and majority classes during model training. For XGBoost, the scale positive weight parameter, which represents the ratio of negative to positive samples, was treated as a hyperparameter to be optimized during the hyperparameter tuning process to achieve the most effective class balance handling strategy for this specific dataset and classification task.
2.6. Hyperparameter Optimization
Hyperparameter tuning for each model was conducted using Bayesian optimization [25] within a subject-level stratified 10-fold cross-validation scheme on the training set. This validation framework ensures that parameter tuning is robust and does not lead to overfitting on the training data, while maintaining the integrity of subject-level data separation established during the initial data splitting procedure.
Bayesian optimization was performed with 100 iterations for each model, guided by the AUC-PR score as the optimization objective. The selection of AUC-PR as the optimization metric is particularly appropriate for the imbalanced PD-MCI classification task, as it emphasizes performance on the minority class and provides a more informative assessment than traditional accuracy-based metrics. The hyperparameter search spaces for all machine learning algorithms employed in this study are presented in Table 1.
After identifying the optimal hyperparameter configurations through the Bayesian optimization process, each algorithm was retrained on the complete training dataset to produce the final diagnostic classification models. This final training phase utilized the entire training set with the selected features from LASSO logistic regression and the best hyperparameter combinations determined during the optimization procedure. The resulting models represent the culmination of the systematic feature selection and hyperparameter tuning procedures, providing the most robust and optimized configurations for each algorithm. These final models were subsequently employed for comprehensive evaluation on the independent test set to assess their real-world diagnostic performance and clinical utility for PD-MCI classification.
2.7. Model Performance Evaluation
To determine the final clinical utility of each algorithm, the models equipped with their optimized hyperparameter sets were deployed for a definitive evaluation on the independent test set. The primary goal was to assess their efficacy in discriminating between PD-MCI and PD-NC individuals. Performance was quantified using a comprehensive suite of metrics, each providing unique insights into different aspects of classification performance in the clinical context of PD-MCI diagnosis. The evaluation metrics employed in this study are detailed in Table 2, which presents the mathematical formulation and clinical interpretation of each measure.
Among these metrics, AUC-PR is particularly informative given the class imbalance inherent in the PD-MCI classification task, while Recall and Specificity are especially critical in the clinical context as they measure the model’s ability to correctly identify patients with cognitive impairment and those who are cognitively normal, respectively.
2.8. Threshold Optimization
In clinical machine learning applications, the selection of an appropriate decision threshold is crucial for translating continuous probability outputs into binary diagnostic classifications [26]. To comprehensively evaluate model performance across different clinical scenarios, we implemented three distinct thresholding strategies.
The first strategy employs the conventional default threshold of 0.5, serving as the standard baseline for binary classification. The second approach implements a threshold optimized to maximize the F1-score, which represents the harmonic mean of precision and recall. This strategy is particularly well-suited for imbalanced datasets and research settings where overall diagnostic accuracy across both classes is prioritized. The third strategy employs a threshold that maximizes Youden’s Index (Recall + Specificity - 1), representing standard practice in medical diagnostics where minimizing both false positives and false negatives is crucial for optimal patient care.
For each model and thresholding strategy, threshold values were determined within the subject-level stratified 10-fold cross-validation procedure on the training set to prevent overfitting. The median of the optimal thresholds obtained across all cross-validation folds was calculated and used as the final threshold for each strategy. These final thresholds were subsequently applied to the independent test set for performance evaluation. This systematic multi-threshold comparative approach enables comprehensive understanding of each model’s behavior across different clinical scenarios, allowing clinicians to select the most appropriate threshold configuration based on their specific diagnostic priorities and the relative importance of minimizing false positives versus false negatives in their clinical setting.
2.9. Feature Importance Analysis
To enhance model interpretability and identify the clinical variables that contribute most significantly to PD-MCI prediction, we conducted comprehensive feature importance analyses for each algorithm using multiple complementary methodological approaches. The optimal models obtained from the hyperparameter optimization process were utilized directly for feature importance evaluation, ensuring methodological consistency with the model configurations employed for performance assessment. Three distinct importance measures were systematically applied: coefficient weights, SHAP (SHapley Additive exPlanations) values [27], and permutation importance [28].
For Logistic Regression and linear Support Vector Machine, three importance measures were employed. Coefficient weights were calculated as the absolute values of the learned coefficients, representing the direct linear contribution of each feature to classification decisions. SHAP explainers (Linear Explainer for Logistic Regression and Kernel Explainer for SVM) were utilized to provide unified feature attribution values that satisfy efficiency and symmetry axioms. Permutation importance was computed by measuring the decrease in model performance when each feature’s values are randomly shuffled.
For Random Forest and XGBoost, both intrinsic and external importance measures were calculated. Random Forest employed impurity-based importance by measuring the total decrease in node impurity weighted by the probability of reaching each node across all trees. XGBoost utilized three built-in metrics: weight (frequency of feature usage in trees), gain (average gain across all splits using the feature), and cover (average coverage of the feature across all splits). Both tree-based models were analyzed using SHAP Tree Explainer to provide exact feature attribution values specifically designed for ensemble methods. Permutation importance was evaluated for both algorithms by assessing the impact of feature perturbation on model performance.
This multi-faceted approach enables comprehensive understanding of feature contributions across different algorithmic paradigms and provides robust insights into the clinical variables most predictive of cognitive impairment in Parkinson’s disease.
2.10. Software Implementation
All analyses were implemented in Python 3.12 using scikit-learn [29] for machine learning algorithms, XGBoost for gradient boosting [24], SHAP for interpretability analysis [27], and Optuna for Bayesian optimization [30]. The hyperparameter optimization employed Gaussian Process-based Bayesian optimization with expected improvement acquisition function to efficiently explore the hyperparameter space. Cross-validation procedures utilized stratified sampling to maintain class distribution across folds, ensuring robust model evaluation. All experiments were conducted on a computational platform with reproducible random seeds to ensure result consistency and facilitate replication.
3. Experimental Results
3.1. Demographic and Clinical Characteristics
After preprocessing and filtering based on MoCA scores, the final dataset comprised 3,154 valid records from 896 unique patients. Of these, 2,325 records were classified as PD-NC and 829 as PD-MCI. The demographic and clinical characteristics of the study population are presented in Table 3.
After applying False Discovery Rate (FDR) correction, significant between-group differences were observed for most variables. The PD-MCI group was significantly older, had a higher proportion of males, fewer years of education, and showed a shorter disease duration compared to the PD-NC group (all ). Clinically, the PD-MCI group exhibited more severe non-motor symptoms of daily living (UPDRS-I), motor symptoms of daily living (UPDRS-II), motor signs (UPDRS-III), and depressive symptoms (GDS), as well as higher rates of REM sleep behavior disorder symptoms (RBDSQ) (all ). These findings highlight a distinct clinical and demographic profile for patients with PD-MCI, providing a strong basis for machine learning-based classification.
After applying False Discovery Rate (FDR) correction, significant between-group differences were observed for all variables except ESS (). The PD-MCI group was significantly older, had a higher proportion of males, fewer years of education, and showed a shorter disease duration compared to the PD-NC group (all ). Clinically, the PD-MCI group exhibited significantly higher Hoehn and Yahr stage (H&Y), more severe non-motor symptoms of daily living (UPDRS-I), motor symptoms of daily living (UPDRS-II), motor signs (UPDRS-III), motor complications (UPDRS-IV), and depressive symptoms (GDS), as well as higher rates of REM sleep behavior disorder symptoms (RBDSQ) (all ). In contrast, daytime sleepiness scores (ESS) showed no significant difference between groups. These findings highlight a distinct clinical and demographic profile for patients with PD-MCI, providing a strong basis for machine learning-based classification.
3.2. Feature Correlation and Multicollinearity Assessment
To assess potential multicollinearity among predictor variables and understand the relationships between clinical features, we examined pairwise correlations using Pearson correlation coefficients for the complete dataset. The correlation matrix is presented in Figure 2, revealing the strength and direction of associations between all predictor variables used in the classification models.
The correlation analysis demonstrated generally low to moderate correlations among most clinical features, with the highest positive correlation being between UPDRS-I and UPDRS-II scores, and the lowest negative correlation of between sex and UPDRS-IV. Importantly, no feature pairs exceeded the high correlation threshold of , indicating minimal multicollinearity concerns for our machine learning models.
The strongest correlations were observed among UPDRS subscales, particularly between UPDRS-I (non-motor experiences of daily living) and UPDRS-II (motor experiences of daily living) (), and between UPDRS-II and UPDRS-III (motor examination) (). These moderate correlations reflect the expected clinical relationships within the unified rating scale framework while maintaining sufficient independence for predictive modeling. Disease duration showed meaningful positive correlations with motor severity measures, including H&Y stage (), UPDRS-II (), UPDRS-III (), and notably UPDRS-IV (motor complications) (), consistent with the progressive nature of Parkinson’s disease. Among non-motor features, UPDRS-I demonstrated moderate associations with sleep-related measures (ESS: ; RBDSQ: ) and mood assessment (GDS: ), reflecting the interconnected nature of non-motor symptoms in PD-MCI development.
The overall pattern of correlations supports the inclusion of all selected variables in subsequent machine learning analyses without substantial redundancy, while providing clinically interpretable relationships that align with our understanding of Parkinson’s disease pathophysiology.
3.3. Feature Selection Results
The LASSO logistic regression process, optimized via subject-level stratified 10-fold cross-validation on the training set to maximize the area under the precision-recall curve (AUC-PR), was used to identify the most salient predictors from the initial 12 features. Figure 3 illustrates both the performance curve derived from cross-validation and the coefficient paths obtained by retraining the model on the complete training set across a range of regularization parameters.
The cross-validation procedure identified an optimal regularization parameter of , which maximized the mean AUC-PR across all folds. At this optimal regularization strength, the LASSO algorithm selected a parsimonious subset of seven key features while shrinking the coefficients of the remaining five features (H&Y, UPDRS-II, UPDRS-IV, ESS, and RBDSQ) to zero, effectively excluding them from the final model.
When the final LASSO model was trained on the complete training set using , the selected features demonstrated varying contributions to PD-MCI classification. The selected features, ranked by the absolute magnitude of their coefficients, are visualized in Figure 4.
Age emerged as the most influential predictor with a positive coefficient of 0.5395, indicating that older patients have substantially higher odds of developing PD-MCI. Education years (EDUCYRS) showed the second-largest magnitude but with a negative coefficient of -0.4093, confirming its protective role against cognitive decline. Disease duration exhibited a negative coefficient of -0.2498, suggesting that longer disease duration may be associated with better cognitive preservation in this cohort. Among the clinical severity measures, depressive symptoms (GDS) demonstrated a positive coefficient of 0.1571, while non-motor experiences of daily living (UPDRS-I) and sex showed smaller positive contributions of 0.0983 and 0.0924, respectively. Motor examination scores (UPDRS-III) had the smallest coefficient of 0.0087, indicating minimal direct contribution to the classification decision. These seven features were used for the construction and comparison of all subsequent machine learning models.
3.4. Hyperparameter Optimization
To ensure optimal model performance prior to final testing, all machine learning algorithms underwent systematic hyperparameter optimization on the training set using subject-level stratified 10-fold cross-validation. Hyperparameters for each algorithm were optimized using Bayesian optimization with Optuna, where AUC-PR was used as the objective function to identify the optimal parameter configurations that maximize predictive performance while maintaining generalizability. The resulting optimal hyperparameters for each model are summarized in Table 4.
The hyperparameter optimization revealed distinct algorithmic preferences that reflect the underlying data characteristics and modeling challenges. For logistic regression, the selection of L2 penalty indicates that Ridge regularization was more effective than L1 (LASSO) regularization for this specific classification task, likely due to the relatively small feature set (7 features) selected by prior LASSO feature selection, where multicollinearity was already minimized. The very low regularization strength (C = ) suggests that substantial regularization was necessary to prevent overfitting, which is consistent with the limited sample size relative to the complexity of the PD-MCI classification problem.
The SVM model’s preference for a linear kernel over non-linear alternatives (RBF, polynomial, or sigmoid) indicates that the optimal decision boundary in the 7-dimensional feature space is approximately linear. This finding suggests that the relationship between clinical features and PD-MCI status can be effectively captured through linear combinations of the selected predictors, without requiring complex non-linear transformations. The extremely low C value () demonstrates a strong preference for a large margin classifier, prioritizing generalization over perfect training set classification.
For Random Forest, the optimization resulted in a moderate maximum depth of 6 and conservative splitting criteria with high minimum samples per split (18) and minimum samples per leaf (28) values. These conservative parameters reflect the algorithm’s adaptation to the limited sample size and suggest that simple decision rules are sufficient for effective PD-MCI classification. The max_features value () indicates that approximately 60% of the available features were optimal for each split, maintaining adequate feature diversity while preserving discriminative power.
The XGBoost optimization yielded particularly revealing insights with its selection of max_depth = 2, indicating that simple two-level decision trees were optimal for this dataset. This shallow tree depth suggests that the PD-MCI classification can be effectively achieved through relatively simple decision rules with minimal hierarchical feature interactions. This finding aligns with the linear separability suggested by the SVM results and implies that the selected clinical features provide straightforward, interpretable decision pathways for PD-MCI identification. The moderate learning rate () and high subsample ratio () further support a conservative boosting approach that emphasizes stability over aggressive fitting, while the substantial regularization parameters (reg_lambda = 8.896) indicate strong preference for generalization over training set performance.
3.5. Cross-Validated Performance on Training Data
Following hyperparameter optimization, each model was evaluated on the training set using subject-level stratified 10-fold cross-validation with the obtained optimal parameters to assess their intrinsic discriminative capacity. The evaluation initially computed threshold-independent metrics (AUC-ROC and AUC-PR) that assess the model’s fundamental ability to distinguish between PD-MCI and non-MCI cases across all possible decision thresholds. Subsequently, three different threshold optimization strategies were systematically applied to determine optimal decision boundaries: the default threshold (0.5), F1-score maximization, and Youden index maximization. These threshold optimization strategies specifically influence threshold-dependent metrics such as accuracy, precision, recall, and F1-score. The comprehensive cross-validation performance results using the optimized hyperparameters across all threshold strategies are presented in Table 5.
The comprehensive cross-validation analysis revealed distinct performance patterns across the four machine learning algorithms under three threshold optimization strategies. Regarding threshold-independent metrics, XGBoost demonstrated superior discriminative capability, achieving the highest AUC-ROC of 0.7076±0.0442 and AUC-PR of 0.4529±0.0807. Nevertheless, the performance differences among all algorithms were relatively modest, with AUC-ROC values ranging from 0.6946 to 0.7076 and AUC-PR values spanning 0.4408 to 0.4529, suggesting comparable inherent discriminative capacity across models for PD-MCI classification tasks.
The default threshold (0.5) strategy revealed substantial performance variations across algorithms. SVM achieved the highest accuracy (0.7507±0.0355) and specificity (0.9562±0.0212), but demonstrated markedly poor recall (0.1534±0.0840), resulting in the lowest F1-score (0.2300±0.1174) and Cohen’s kappa (0.1393±0.1042). This pattern indicates that the default threshold is excessively conservative for SVM in PD-MCI detection, leading to substantial underdiagnosis. In contrast, logistic regression with the default threshold achieved more balanced performance with the highest recall (0.6633±0.0835), F1-score (0.4820±0.0702), and Cohen’s kappa (0.2393±0.0806).
Both optimized threshold strategies demonstrated superior balance between sensitivity and specificity compared to the default threshold. The F1-score optimization strategy consistently improved recall across all models while maintaining reasonable precision. XGBoost achieved the best overall performance under F1-score optimization with the highest accuracy (0.6474±0.1051), balanced accuracy (0.6836±0.0475), precision (0.4201±0.1038), specificity (0.6058±0.1880), F1-score (0.5278±0.0630), and Cohen’s kappa (0.2937±0.1140). Logistic regression exhibited the highest recall (0.8145±0.0812) under this strategy.
The Youden index optimization provided a similar balanced performance profile to F1-score optimization. XGBoost again demonstrated the strongest performance across most metrics, achieving the highest accuracy (0.6528±0.0830), balanced accuracy (0.6859±0.0452), precision (0.4166±0.0966), specificity (0.6179±0.1368), F1-score (0.5276±0.0629), and Cohen’s kappa (0.2950±0.1051). Notably, logistic regression maintained the highest recall (0.7765±0.0881) under Youden index optimization.
The optimal thresholds derived from cross-validation varied substantially across algorithms and optimization criteria. SVM consistently required the lowest thresholds (F1-score: 0.2217±0.0467; Youden: 0.2441±0.0496), reflecting its tendency to produce conservative probability estimates. XGBoost required intermediate thresholds (F1-score: 0.3570±0.1099; Youden: 0.3643±0.0770), while logistic regression and Random Forest showed higher and more variable threshold requirements.
Based on these comprehensive cross-validation results, XGBoost emerged as the most promising algorithm across both optimized threshold strategies, consistently achieving the highest F1-scores and Cohen’s kappa values. The optimized threshold strategies (F1-score and Youden index) demonstrated clear superiority over the default threshold for PD-MCI classification, providing more clinically relevant sensitivity-specificity trade-offs. For subsequent test set evaluation, the median optimized thresholds from cross-validation were adopted to ensure robust and generalizable performance estimates.
3.6. Model Evaluation
The performance of the four machine learning models was evaluated on the independent test set using the median optimized thresholds derived from cross-validation. Figure 5 illustrates the corresponding ROC and PR curves for all models, providing visual representation of their discriminative performance. Table 6 presents a detailed comparison of model performance across different threshold strategies, providing both threshold-independent metrics (AUC-ROC and AUC-PR) and threshold-dependent metrics under various optimization criteria. The comprehensive evaluation of the four models revealed important insights into their discriminative abilities and the critical role of threshold optimization in imbalanced classification scenarios.
In terms of overall discriminative ability, the Support Vector Machine (SVM) demonstrated the superior performance, achieving the highest AUC-ROC of 0.7252 and AUC-PR of 0.5008. Logistic Regression (LR) followed closely with an AUC-ROC of 0.7241 and AUC-PR of 0.4923, indicating comparable and robust classification potential. These results suggest that linear models possess excellent discriminative power for PD-MCI classification in this dataset, likely due to their ability to capture the linear relationships between the selected clinical features and cognitive impairment status. The Random Forest (RF) and XGBoost models, while showing respectable performance, achieved lower AUC values (RF: AUC-ROC = 0.6882, AUC-PR = 0.4417; XGBoost: AUC-ROC = 0.6967, AUC-PR = 0.4375 respectively), suggesting that the additional complexity of ensemble methods may not provide substantial benefits for this particular feature set and dataset.
The default threshold of 0.5 again proved suboptimal, as exemplified by the SVM’s performance: while achieving high specificity (0.9613) and precision (0.6212), its recall was only 0.1614, resulting in an extremely low F1-score of 0.2563. Such performance characteristics would be unacceptable in clinical scenarios where high sensitivity is crucial for detecting cognitive impairment, as missing PD-MCI cases could delay appropriate interventions and patient care planning. This underscores the fundamental necessity of threshold optimization when dealing with imbalanced datasets to achieve an effective trade-off between sensitivity and specificity that aligns with clinical priorities.
The two threshold optimization strategies, i.e., maximizing the F1-score and maximizing the Youden Index, yielded substantially more balanced performance across all models. Under F1-score optimization, the LR model demonstrated superior performance across the majority of evaluation metrics, achieving the highest balanced accuracy (0.6667), F1-score (0.5344), and Cohen’s Kappa (0.2645). Similarly, under Youden Index optimization, the LR model again secured the best performance in most metrics, including the highest accuracy (0.6433), balanced accuracy (0.6751), precision (0.4251), specificity (0.6022), F1-score (0.5421), and Cohen’s Kappa (0.2846). The SVM model consistently achieved competitive performance under both optimization strategies, particularly showing strong results in F1-score optimization with an accuracy of 0.6300 and the highest precision of 0.4132. This consistent performance highlights the strength of both linear models, particularly the LR model, in achieving well-rounded and balanced overall performance for PD-MCI classification. The LR model’s interpretability, combined with its robust performance, makes it particularly suitable for clinical applications where understanding the contribution of individual features is important for clinical decision-making.
However, two notable exceptions emerged from the threshold optimization results that merit careful consideration. When the threshold was optimized to maximize the F1-score, the Random Forest model achieved the highest recall (0.8150), while under Youden Index optimization, the RF model secured the top performance in recall again, reaching 0.7795. These findings indicate that if the primary clinical objective is to identify the maximum number of PD-MCI cases (i.e., maximizing recall to minimize missed diagnoses), appropriately optimized Random Forest models might be more suitable choices than linear models. The RF model’s ability to achieve high recall values suggests that for clinical applications where the cost of false negatives is particularly high—such as screening scenarios where missing cognitive impairment could lead to delayed treatment—ensemble models with optimized thresholds could be preferred despite their lower overall discriminative ability.
These findings highlight the fundamental importance of aligning model selection and threshold optimization with specific clinical objectives. For applications prioritizing the minimization of false positives (high specificity) or seeking the best overall diagnostic accuracy, LR and SVM demonstrate superior performance. Conversely, for scenarios where maximizing the detection of PD-MCI patients is paramount, Random Forest models with appropriately optimized thresholds may provide better clinical utility despite potentially higher false positive rates.
3.7. Feature Importance Analysis
To gain deeper insights into the decision-making processes of our models and identify the most influential clinical factors for PD-MCI classification, we conducted a comprehensive feature importance analysis after training each of the four models (LR, SVM, RF, XGBoost) on the complete training dataset using the seven selected features and optimized hyperparameters. We employed multiple complementary analytical approaches to ensure robust and comprehensive assessment: model-specific importance measures (coefficients for linear models, impurity-based scores for RF, and Gain for XGBoost), SHAP values for understanding individual feature contributions, and the model-agnostic permutation importance method to corroborate our findings from multiple perspectives.
As illustrated in Figure 6, a remarkably uniform pattern emerges across all models and analytical methodologies. Three clinical variables consistently rank as the most salient predictors of cognitive status: Age, Education Years, and Disease Duration, which respectively reflect the natural progression of cognitive decline, cognitive reserve capacity, and cumulative pathological burden. Additionally, GDS frequently appears among the top four important features, underscoring the significant relationship between depressive symptoms and cognitive impairment in Parkinson’s disease.
The SHAP summary plots, presented in Figure 7, provide granular insights into both the magnitude and directionality of each feature’s contribution to model predictions. These visualizations reveal that higher values for Age and GDS (represented by red points) are consistently associated with positive SHAP values, indicating an increased probability of PD-MCI classification [31]. Conversely, higher EDUCYRS values are associated with negative SHAP values, demonstrating the protective effect of education against cognitive decline. This pattern aligns with established neurological literature suggesting that educational attainment may contribute to cognitive reserve, potentially delaying the onset or manifestation of cognitive impairment in neurodegenerative diseases [32,33].
4. Discussion
4.1. Principal Findings
In this study, we systematically developed and validated machine learning models for the classification of mild cognitive impairment in Parkinson’s disease using a large-scale clinical dataset from the PPMI. Our principal findings demonstrate that a parsimonious set of seven clinical features can effectively distinguish between PD patients with and without MCI. The linear models, Support Vector Machine (SVM) and Logistic Regression (LR), demonstrated superior overall discriminative ability with AUC-ROC scores of 0.7252 and 0.7241, respectively, accompanied by AUC-PR values of 0.5008 and 0.4923, respectively. The feature importance analysis revealed consistent patterns across all models and analytical methodologies, with age, education years, and disease duration emerging as the most salient predictors of cognitive status.
4.2. Comparison with Prior Work
Our findings align with and extend previous research in several important ways. The critical role of age, education years, and disease duration as key predictors confirms established risk factors identified in prior studies [10,11,32,34]. Specifically, age has been consistently identified as a primary risk factor for cognitive decline in PD, with older patients demonstrating significantly higher rates of cognitive impairment progression [12]. Similarly, educational attainment has been recognized as a protective factor, with higher education levels associated with delayed onset of cognitive symptoms, likely through enhanced cognitive reserve mechanisms [35]. Disease duration, while presenting complex relationships in longitudinal cohorts, has been established as a fundamental predictor of cognitive deterioration in multiple prospective studies [10,11].
However, our work distinguishes itself through two key advantages: the utilization of a large-scale dataset and rigorous methodological approaches. First, our study leverages the comprehensive PPMI database, which provides a substantially larger sample size compared to most previous investigations in this field, thereby enhancing the statistical power and generalizability of our findings. Second, we employed methodologically rigorous approaches, particularly the use of subject-level data splitting to ensure realistic performance estimates and avoid the inflated results that can arise from data leakage in longitudinal datasets [18,19]. Additionally, our comprehensive feature selection methodology, extensive hyperparameter optimization, and multifaceted model evaluation framework contribute to the methodological rigor of this investigation.
While previous studies incorporating multimodal data (e.g., neuroimaging or fluid biomarkers) have reported higher AUC values [13,14], our purely clinical models offer a highly practical and accessible alternative that can be readily implemented in diverse clinical settings. Recent systematic reviews have highlighted the growing importance of machine learning approaches in PD-MCI detection [16,17], and our study contributes to this body of evidence by demonstrating that readily available clinical data, when analyzed with appropriate methodological rigor and sufficient sample size, can achieve meaningful discriminative performance for screening purposes.
4.3. Clinical Implications
The clinical implications of our findings are multifaceted and have direct relevance for routine clinical practice. The performance achieved using only readily available clinical data provides a strong argument for the utility of these models as accessible, low-cost, and non-invasive first-line screening tools in clinical settings where advanced neuroimaging or biomarker testing may not be readily available.
The threshold optimization results reveal crucial clinical insights regarding the inherent trade-offs between different performance metrics in PD-MCI classification. When optimized to maximize the F1-score, the RF model achieved the highest recall of 0.8150, successfully identifying over 80% of all cognitive impairment cases. Similarly, under Youden Index optimization, the RF model maintained exceptional sensitivity with a recall of 0.7795, demonstrating consistent capability in capturing a substantial proportion of PD-MCI patients across different optimization strategies. These consistently high recall values carry profound clinical significance, particularly in the context of PD-MCI screening and early detection programs, where the primary clinical objective is typically to minimize missed diagnoses rather than to strictly control false positive rates. From a clinical perspective, such high sensitivity translates directly to enhanced screening effectiveness and improved patient care outcomes, ensuring that the vast majority of patients with cognitive impairment are successfully identified and can receive timely follow-up neuropsychological assessment and appropriate therapeutic intervention.
However, the clinical utility of high recall must be balanced against the increased false positive rate, which could lead to unnecessary anxiety for patients and additional healthcare resource utilization for confirmatory testing. The optimal choice between linear models (offering better overall discriminative ability) and ensemble models (providing higher recall) should therefore be guided by the specific clinical context, available resources, and the relative costs of false negatives versus false positives in the particular healthcare setting.
To facilitate clinical decision-making, Table 7 provides a practical framework for model selection based on specific clinical scenarios. For screening and early detection programs where the primary goal is to identify as many PD-MCI cases as possible (i.e., "better safe than sorry" approach), the Random Forest model with optimized thresholds is recommended due to its superior recall performance (0.8150 under F1-score optimization). This approach is particularly valuable in primary care settings, specialty movement disorder clinics conducting routine cognitive assessments, and research cohorts requiring comprehensive cognitive phenotyping. Conversely, for precision diagnostic assistance where balanced accuracy and overall discriminative ability are prioritized, the Logistic Regression or Support Vector Machine models are more suitable, offering superior AUC-ROC performance (0.7241 and 0.7252, respectively) and better balance across multiple evaluation metrics. This approach is more appropriate for confirmatory diagnostic processes, specialist referral decisions, and clinical contexts where false positives carry significant consequences for patient care or resource allocation. Additionally, for resource-limited settings where cost-effectiveness and model interpretability are paramount considerations, the Logistic Regression model represents the optimal choice, providing both transparent decision-making processes that clinicians can easily understand and implement, while maintaining sufficient predictive accuracy for practical screening applications without requiring sophisticated computational infrastructure.
The SHAP analysis further enhances model transparency by illustrating the specific impact of individual factors on predictions, which can increase clinical trust and aid in patient communication by clearly visualizing how higher age increases MCI risk while more years of education decreases it. This interpretability is particularly valuable for shared decision-making processes and for educating patients about modifiable and non-modifiable risk factors that influence their cognitive health trajectory.
4.4. Strengths and Limitations
This study possesses several notable strengths that enhance the reliability and clinical relevance of our findings. First, we employed a large-scale, high-quality dataset from the PPMI with standardized assessment protocols and rigorous quality control measures. Second, our methodological approach incorporated subject-level data splitting to prevent data leakage, comprehensive feature selection using multiple techniques, and extensive hyperparameter optimization to ensure robust model performance. Third, we conducted thorough feature importance analysis using multiple complementary approaches (model-specific measures, SHAP values, and permutation importance) to provide comprehensive insights into model decision-making processes. Fourth, our focus on readily available clinical features makes the models highly practical for real-world implementation in diverse clinical settings.
However, several limitations should be acknowledged. First, our analysis relied exclusively on clinical data, which, while readily accessible and cost-effective, may not capture the full complexity of cognitive impairment in Parkinson’s disease. Second, an unexpected finding emerged regarding disease duration, which appeared as a protective factor in our models—a result that contradicts the well-established clinical understanding that longer disease duration typically increases cognitive impairment risk. This counterintuitive finding likely reflects sample selection bias or survivorship bias inherent in the PPMI longitudinal cohort design, where patients with rapid cognitive decline may be more likely to develop MCI early and subsequently drop out of long-term studies, while patients maintaining cognitive function despite longer disease duration represent a selected population of "cognitive survivors." Third, our methodological approach employed a two-stage procedure where LASSO feature selection was performed first, followed by Bayesian optimization on the selected feature set, both based on subject-level stratified 10-fold cross-validation. While a more stringent approach would involve nesting LASSO within the Bayesian optimization process to further enhance expected generalization performance, such complexity would significantly reduce model interpretability and practical implementation feasibility. Our current pipeline already substantially mitigates information leakage and ensures model reliability through rigorous cross-validation procedures. Fourth, although the PPMI dataset represents a high-quality cohort, external validation on independent datasets from diverse populations is essential to confirm the generalizability of our models across different ethnic groups, healthcare systems, and geographic regions.
4.5. Future Work
Several important directions for future research emerge from this study. First, future investigations should focus on integrating multimodal data sources, including fluid biomarkers (such as cerebrospinal fluid -synuclein, tau, and neurofilament light chain), genetic markers (including APOE genotype and GBA mutations), and advanced neuroimaging features (such as structural MRI volumetrics, diffusion tensor imaging metrics, and functional connectivity patterns) to potentially improve predictive accuracy [13,14,36]. Second, future research should examine the underlying pathophysiological mechanisms linking clinical variables to cognitive decline in PD, potentially through neuroinflammatory markers, synaptic dysfunction indicators, or network connectivity analyses [15]. Third, to address the methodological limitations highlighted by our disease duration findings, future studies should employ analytical approaches specifically designed to handle time-dependent data and participant attrition, such as survival analysis methods or mixed-effects models for longitudinal data analysis [16,35]. Finally, the development of dynamic prediction models that can incorporate longitudinal changes in clinical features over time represents a particularly promising direction, potentially providing more accurate risk assessment as patients progress through different disease stages and enabling the prediction of cognitive decline trajectories rather than static classification [17].
5. Conclusion
This study successfully developed and validated machine learning models for the classification of mild cognitive impairment in Parkinson’s disease using a comprehensive clinical dataset from the PPMI. Our investigation demonstrates that a parsimonious set of seven readily available clinical features can achieve meaningful discriminative performance for PD-MCI classification, with linear models (SVM and LR) demonstrating superior overall performance with AUC-ROC of 0.7252 and AUC-PR of 0.5008. The consistent identification of age, education years, and disease duration as the most salient predictors across all models and analytical methodologies confirms established risk factors while providing robust evidence for their clinical utility in screening applications. Notably, the role of certain clinical indicators (such as disease duration) in our models reveals potential data selection biases inherent in longitudinal cohort studies, warranting further investigation.
The methodological rigor of our approach, including subject-level data splitting to prevent data leakage, comprehensive feature selection, and extensive hyperparameter optimization, ensures the reliability and generalizability of our findings. The high recall values achieved through threshold optimization (up to 0.8150 for Random Forest under F1-score optimization) demonstrate the potential clinical utility of these models as effective screening tools for early identification of cognitive impairment in PD patients. The integration of SHAP analysis enhances model interpretability and clinical trust by providing transparent insights into individual feature contributions to predictions.
While our purely clinical approach offers practical advantages in terms of accessibility and cost-effectiveness compared to multimodal approaches incorporating neuroimaging or biomarker data, future research should focus on integrating these complementary data sources to further enhance predictive accuracy. The development of dynamic prediction models incorporating longitudinal changes and the validation of these models in diverse clinical populations represent important next steps toward implementing these tools in routine clinical practice. Ultimately, this work provides a solid foundation for the development of clinical decision support systems that can facilitate early detection and intervention for cognitive impairment in Parkinson’s disease, potentially improving patient outcomes through timely therapeutic interventions and care planning.
Author Contributions
Conceptualization, J.W., H.Han, L.W. and L.Z.; methodology, J.W., Y.C., H.Han, L.W. and L.Z.; validation, Y.C., X.X., P.W. and H.Hu; writing—original draft preparation, J.W. and Y.C.; writing—review and editing, H.Han, L.W. and L.Z.; visualization, J.W. and X.X.; funding acquisition, J.W. and L.Z. All authors have read and agreed to the published version of the manuscript.
Funding
This work was supported in part by the National Natural Science Foundation of China under Grant 31900710 and Grant 31600862; and in part by the Nanhu Scholars Program for Young Scholars of Xinyang Normal University.
Data Availability Statement
The datasets analyzed in this study are available from the Parkinson’s Progression Markers Initiative (PPMI) database at https://www.ppmi-info.org. Access to PPMI data requires registration and approval through the PPMI Data Access Request process.
Conflicts of Interest
The authors declare no conflicts of interest.
References
- Feigin, V.L.; Nichols, E.; Alam, T.; Bannick, M.S.; Beghi, E.; Blake, N.; Culpepper, W.J.; Dorsey, E.R.; Elbaz, A.; Ellenbogen, R.G.; et al. Global, regional, and national burden of neurological disorders, 1990–2016: a systematic analysis for the Global Burden of Disease Study 2016. The Lancet Neurology 2019, 18, 459–480. [Google Scholar] [CrossRef]
- Dorsey, E.R.; Sherer, T.; Okun, M.S.; Bloem, B.R. The emerging evidence of the Parkinson pandemic. Journal of Parkinson’s disease 2018, 8, S3–S8. [Google Scholar] [CrossRef] [PubMed]
- Postuma, R.B.; Berg, D.; Stern, M.; Poewe, W.; Olanow, C.W.; Oertel, W. ; et al. MDS clinical diagnostic criteria for Parkinson’s disease. Movement disorders 2015, 30, 1591–1601. [Google Scholar] [CrossRef] [PubMed]
- Chaudhuri, K.R.; Healy, D.G.; Schapira, A.H. Non-motor symptoms of Parkinson’s disease: diagnosis and management. The Lancet Neurology 2006, 5, 235–245. [Google Scholar] [CrossRef]
- Goldman, J.G.; Vernaleo, B.A.; Camicioli, R.; Dahodwala, N.; Dobkin, R.D.; Ellis, T.; Galvin, J.E.; Marras, C.; Edwards, J.; Fields, J.; et al. Cognitive impairment in Parkinson’s disease: a report from a multidisciplinary symposium on unmet needs and future directions to maintain cognitive health. npj Parkinson’s Disease 2018, 4, 19. [Google Scholar] [CrossRef]
- Aarsland, D.; Batzu, L.; Halliday, G.M.; Geurtsen, G.J.; Ballard, C.; Ray Chaudhuri, K.; Weintraub, D. Parkinson disease-associated cognitive impairment. Nature reviews Disease primers 2021, 7, 47. [Google Scholar] [CrossRef]
- Goldman, J.G.; Holden, S.K.; Litvan, I.; McKeith, I.; Stebbins, G.T.; Taylor, J.P. Evolution of diagnostic criteria and assessments for Parkinson’s disease mild cognitive impairment. Movement Disorders 2018, 33, 503–510. [Google Scholar] [CrossRef]
- Aarsland, D.; Bronnick, K.; Williams-Gray, C.; Weintraub, D.; Marder, K.; Kulisevsky, J.; Burn, D.; Barone, P.; Pagonabarraga, J.; Allcock, L.; et al. Mild cognitive impairment in Parkinson disease: a multicenter pooled analysis. Neurology 2010, 75, 1062–1069. [Google Scholar] [CrossRef]
- Pedersen, K.F.; Larsen, J.P.; Tysnes, O.B.; Alves, G. Natural course of mild cognitive impairment in Parkinson disease: a 5-year population-based study. Neurology 2017, 88, 767–774. [Google Scholar] [CrossRef]
- Guo, Y.; Liu, F.T.; Hou, X.H.; Li, J.Q.; Cao, X.P.; Tan, L.; Wang, J.; Yu, J.T. Predictors of cognitive impairment in Parkinson’s disease: a systematic review and meta-analysis of prospective cohort studies. Journal of Neurology 2021, 268, 2713–2722. [Google Scholar] [CrossRef]
- Schrag, A.; Siddiqui, U.F.; Anastasiou, Z.; Weintraub, D.; Schott, J.M. Clinical variables and biomarkers in prediction of cognitive impairment in patients with newly diagnosed Parkinson’s disease: a cohort study. The Lancet Neurology 2017, 16, 66–75. [Google Scholar] [CrossRef] [PubMed]
- Hely, M.A.; Reid, W.G.; Adena, M.A.; Halliday, G.M.; Morris, J.G. The Sydney multicenter study of Parkinson’s disease: the inevitability of dementia at 20 years. Movement disorders 2008, 23, 837–844. [Google Scholar] [CrossRef]
- Hosseinzadeh, M.; Gorji, A.; Fathi Jouzdani, A.; Rezaeijo, S.M.; Rahmim, A.; Salmanpour, M.R. Prediction of Cognitive decline in Parkinson’s Disease using clinical and DAT SPECT Imaging features, and Hybrid Machine Learning systems. Diagnostics 2023, 13, 1691. [Google Scholar] [CrossRef]
- Zhu, Y.; Wang, F.; Ning, P.; Zhu, Y.; Zhang, L.; Li, K.; Liu, B.; Ren, H.; Xu, Z.; Pang, A.; et al. Multimodal neuroimaging-based prediction of Parkinson’s disease with mild cognitive impairment using machine learning technique. npj Parkinson’s Disease 2024, 10, 218. [Google Scholar] [CrossRef]
- Wang, H.; Liang, Z.; Yan, Z.; Liu, Y. Executive Dysfunction and Prefrontal Cortex Dysregulation in Early-Onset Parkinson’s Disease: An fNIRS Study. Journal of Integrative Neuroscience 2025, 24, 36989. [Google Scholar] [CrossRef]
- Altham, C.; Zhang, H.; Pereira, E. Machine learning for the detection and diagnosis of cognitive impairment in Parkinson’s Disease: A systematic review. Plos one 2024, 19, e0303644. [Google Scholar] [CrossRef] [PubMed]
- Wu, Y.; Cheng, Y.; Xiao, Y.; Shang, H.; Ou, R. The Role of Machine Learning in Cognitive Impairment in Parkinson Disease: Systematic Review and Meta-Analysis. Journal of Medical Internet Research 2025, 27, e59649. [Google Scholar] [CrossRef]
- Veetil, I.K.; Chowdary, D.E.; Chowdary, P.N.; Sowmya, V.; Gopalakrishnan, E. An analysis of data leakage and generalizability in MRI based classification of Parkinson’s Disease using explainable 2D Convolutional Neural Networks. Digital Signal Processing 2024, 147, 104407. [Google Scholar] [CrossRef]
- Yagis, E.; Atnafu, S.W.; García Seco de Herrera, A.; Marzi, C.; Scheda, R.; Giannelli, M.; Tessa, C.; Citi, L.; Diciotti, S. Effect of data leakage in brain MRI classification using 2D convolutional neural networks. Scientific reports 2021, 11, 22544. [Google Scholar] [CrossRef]
- Tibshirani, R. Regression shrinkage and selection via the lasso. Journal of the Royal Statistical Society Series B: Statistical Methodology 1996, 58, 267–288. [Google Scholar] [CrossRef]
- Hosmer Jr, D.W.; Lemeshow, S.; Sturdivant, R.X. Applied logistic regression. John Wiley & Sons: Hoboken, NJ, USA, 2013. [Google Scholar]
- Cortes, C.; Vapnik, V. Support-vector networks. Machine learning 1995, 20, 273–297. [Google Scholar] [CrossRef]
- Breiman, L. Random forests. Machine learning 2001, 45, 5–32. [Google Scholar] [CrossRef]
- Chen, T.; Guestrin, C. Xgboost: A scalable tree boosting system. In Proceedings of the Proceedings of the 22nd acm sigkdd international conference on knowledge discovery and data mining, 2016, pp.
- Snoek, J.; Larochelle, H.; Adams, R.P. Practical bayesian optimization of machine learning algorithms. Advances in neural information processing systems 2012, 25. [Google Scholar]
- Freeman, E.A.; Moisen, G.G. A comparison of the performance of threshold criteria for binary classification in terms of predicted prevalence and kappa. Ecological modelling 2008, 217, 48–58. [Google Scholar] [CrossRef]
- Mangalathu, S.; Hwang, S.H.; Jeon, J.S. Failure mode and effects analysis of RC members based on machine-learning-based SHapley Additive exPlanations (SHAP) approach. Engineering Structures 2020, 219, 110927. [Google Scholar] [CrossRef]
- Altmann, A.; Toloşi, L.; Sander, O.; Lengauer, T. Permutation importance: a corrected feature importance measure. Bioinformatics 2010, 26, 1340–1347. [Google Scholar] [CrossRef]
- Pedregosa, F.; Varoquaux, G.; Gramfort, A.; Michel, V.; Thirion, B.; Grisel, O.; Blondel, M.; Prettenhofer, P.; Weiss, R.; Dubourg, V.; et al. Scikit-learn: Machine learning in Python. the Journal of machine Learning research 2011, 12, 2825–2830. [Google Scholar]
- Akiba, T.; Sano, S.; Yanase, T.; Ohta, T.; Koyama, M. Optuna: A next-generation hyperparameter optimization framework. In Proceedings of the Proceedings of the 25th ACM SIGKDD international conference on knowledge discovery &.
- Hu, M.T.; Szewczyk-Królikowski, K.; Tomlinson, P.; Nithi, K.; Rolinski, M.; Murray, C.; Talbot, K.; Ebmeier, K.P.; Mackay, C.E.; Ben-Shlomo, Y. Predictors of cognitive impairment in an early stage Parkinson’s disease cohort. Movement Disorders 2014, 29, 351–359. [Google Scholar] [CrossRef]
- Nie, K.; Gao, Y.; Mei, M.; Guo, M.; Huang, Z.; Wang, L.; Zhao, J.; Zhang, Y.; Wang, L. The clinical characteristics and cognitive features of mild cognitive impairment in Parkinson’s disease and the analysis of relevant factors. Journal of Clinical Neuroscience 2019, 63, 142–148. [Google Scholar] [CrossRef] [PubMed]
- Galtier, I.; Nieto, A.; Lorenzo, J.N.; Barroso, J. Mild cognitive impairment in Parkinson’s disease: Diagnosis and progression to dementia. Journal of clinical and experimental neuropsychology 2016, 38, 40–50. [Google Scholar] [CrossRef]
- Sollinger, A.B.; Goldstein, F.C.; Lah, J.J.; Levey, A.I.; Factor, S.A. Mild cognitive impairment in Parkinson’s disease: subtypes and motor characteristics. Parkinsonism & related disorders 2010, 16, 177–180. [Google Scholar]
- Monastero, R.; Cicero, C.E.; Baschi, R.; Davì, M.; Luca, A.; Restivo, V.; Zangara, C.; Fierro, B.; Zappia, M.; Nicoletti, A. Mild cognitive impairment in Parkinson’s disease: the Parkinson’s disease cognitive study (PACOS). Journal of Neurology 2018, 265, 1050–1058. [Google Scholar] [CrossRef] [PubMed]
- Zhu, Y.; Yang, B.; Wang, F.; Liu, B.; Li, K.; Yin, K.; Yin, W.F.; Zhou, C.; Tian, S.; Ren, H.; et al. Association between plasma neurofilament light chain levels and cognitive function in patients with Parkinson’s disease. Journal of neuroimmunology 2021, 358, 577662. [Google Scholar] [CrossRef] [PubMed]
Figure 1.
Experimental Workflow. This flowchart outlines the key stages of the study, from data collection and preprocessing to model construction, hyperparameter optimization, performance evaluation, and interpretability analysis.
Figure 1.
Experimental Workflow. This flowchart outlines the key stages of the study, from data collection and preprocessing to model construction, hyperparameter optimization, performance evaluation, and interpretability analysis.
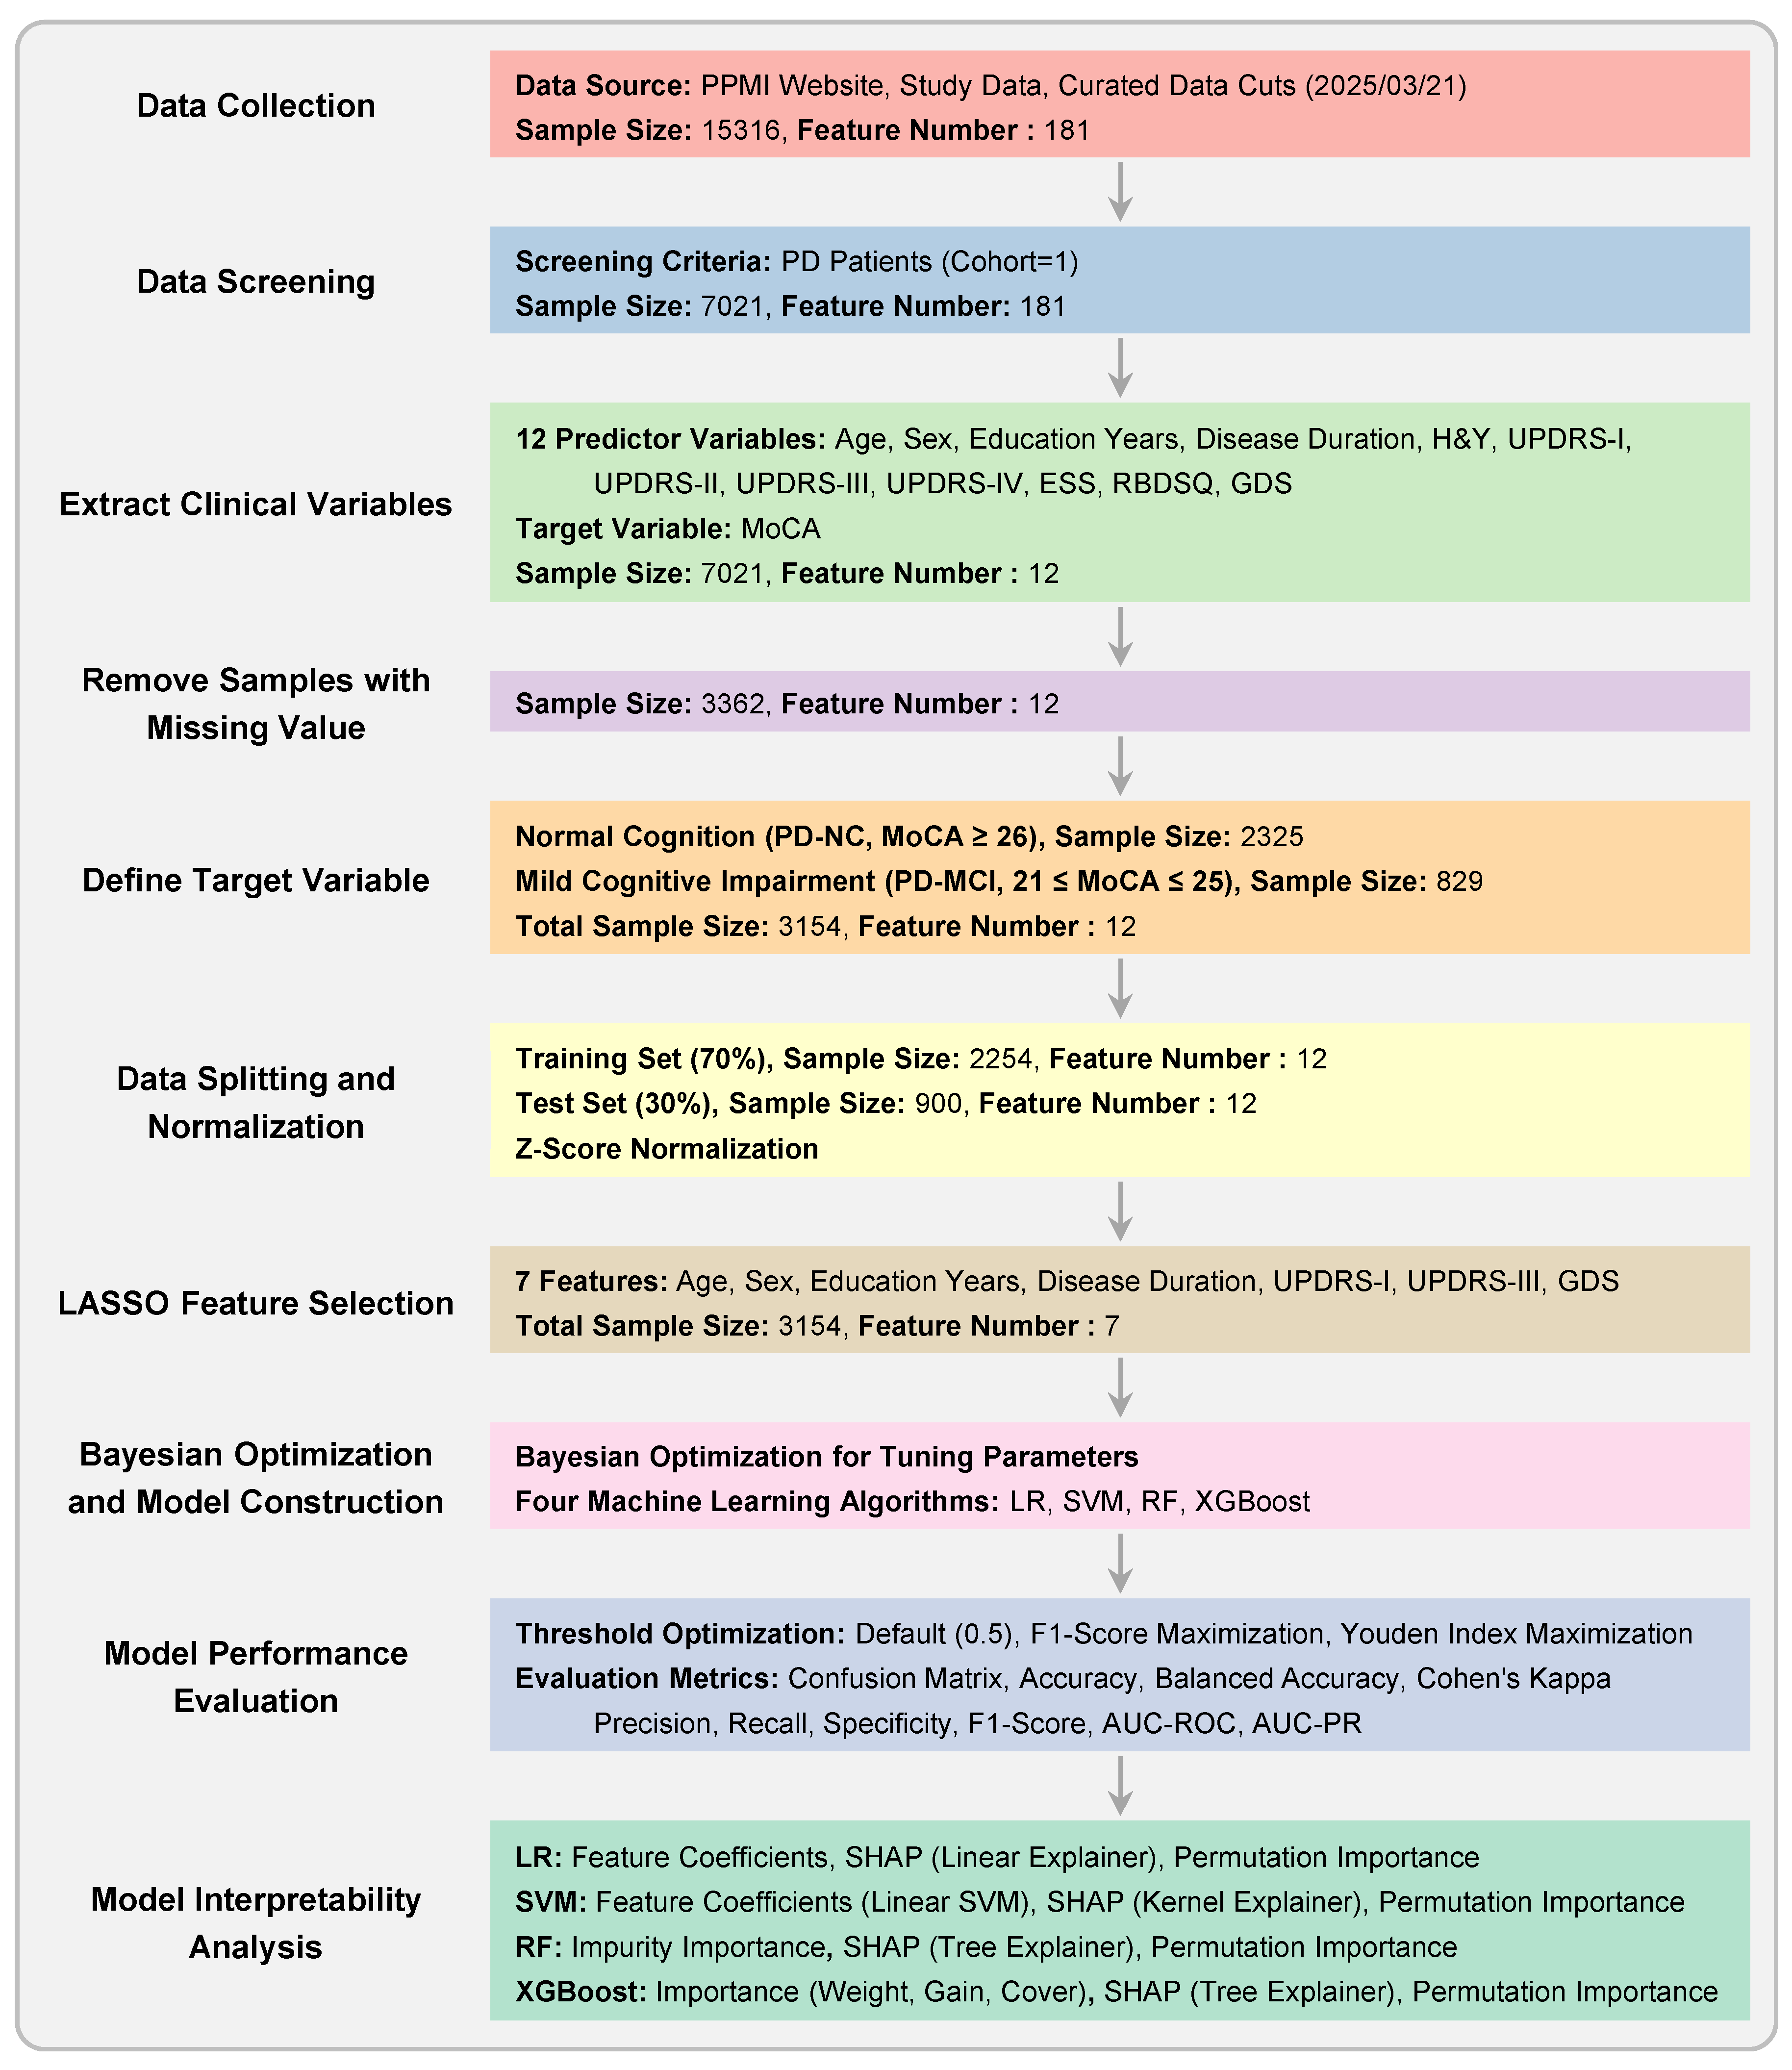
Figure 2.
Correlation Matrix of Clinical Features. The heatmap displays Pearson correlation coefficients between all predictor variables in the complete dataset. The color scale ranges from blue (negative correlations) to red (positive correlations). Only the lower triangular matrix is shown to avoid redundancy.
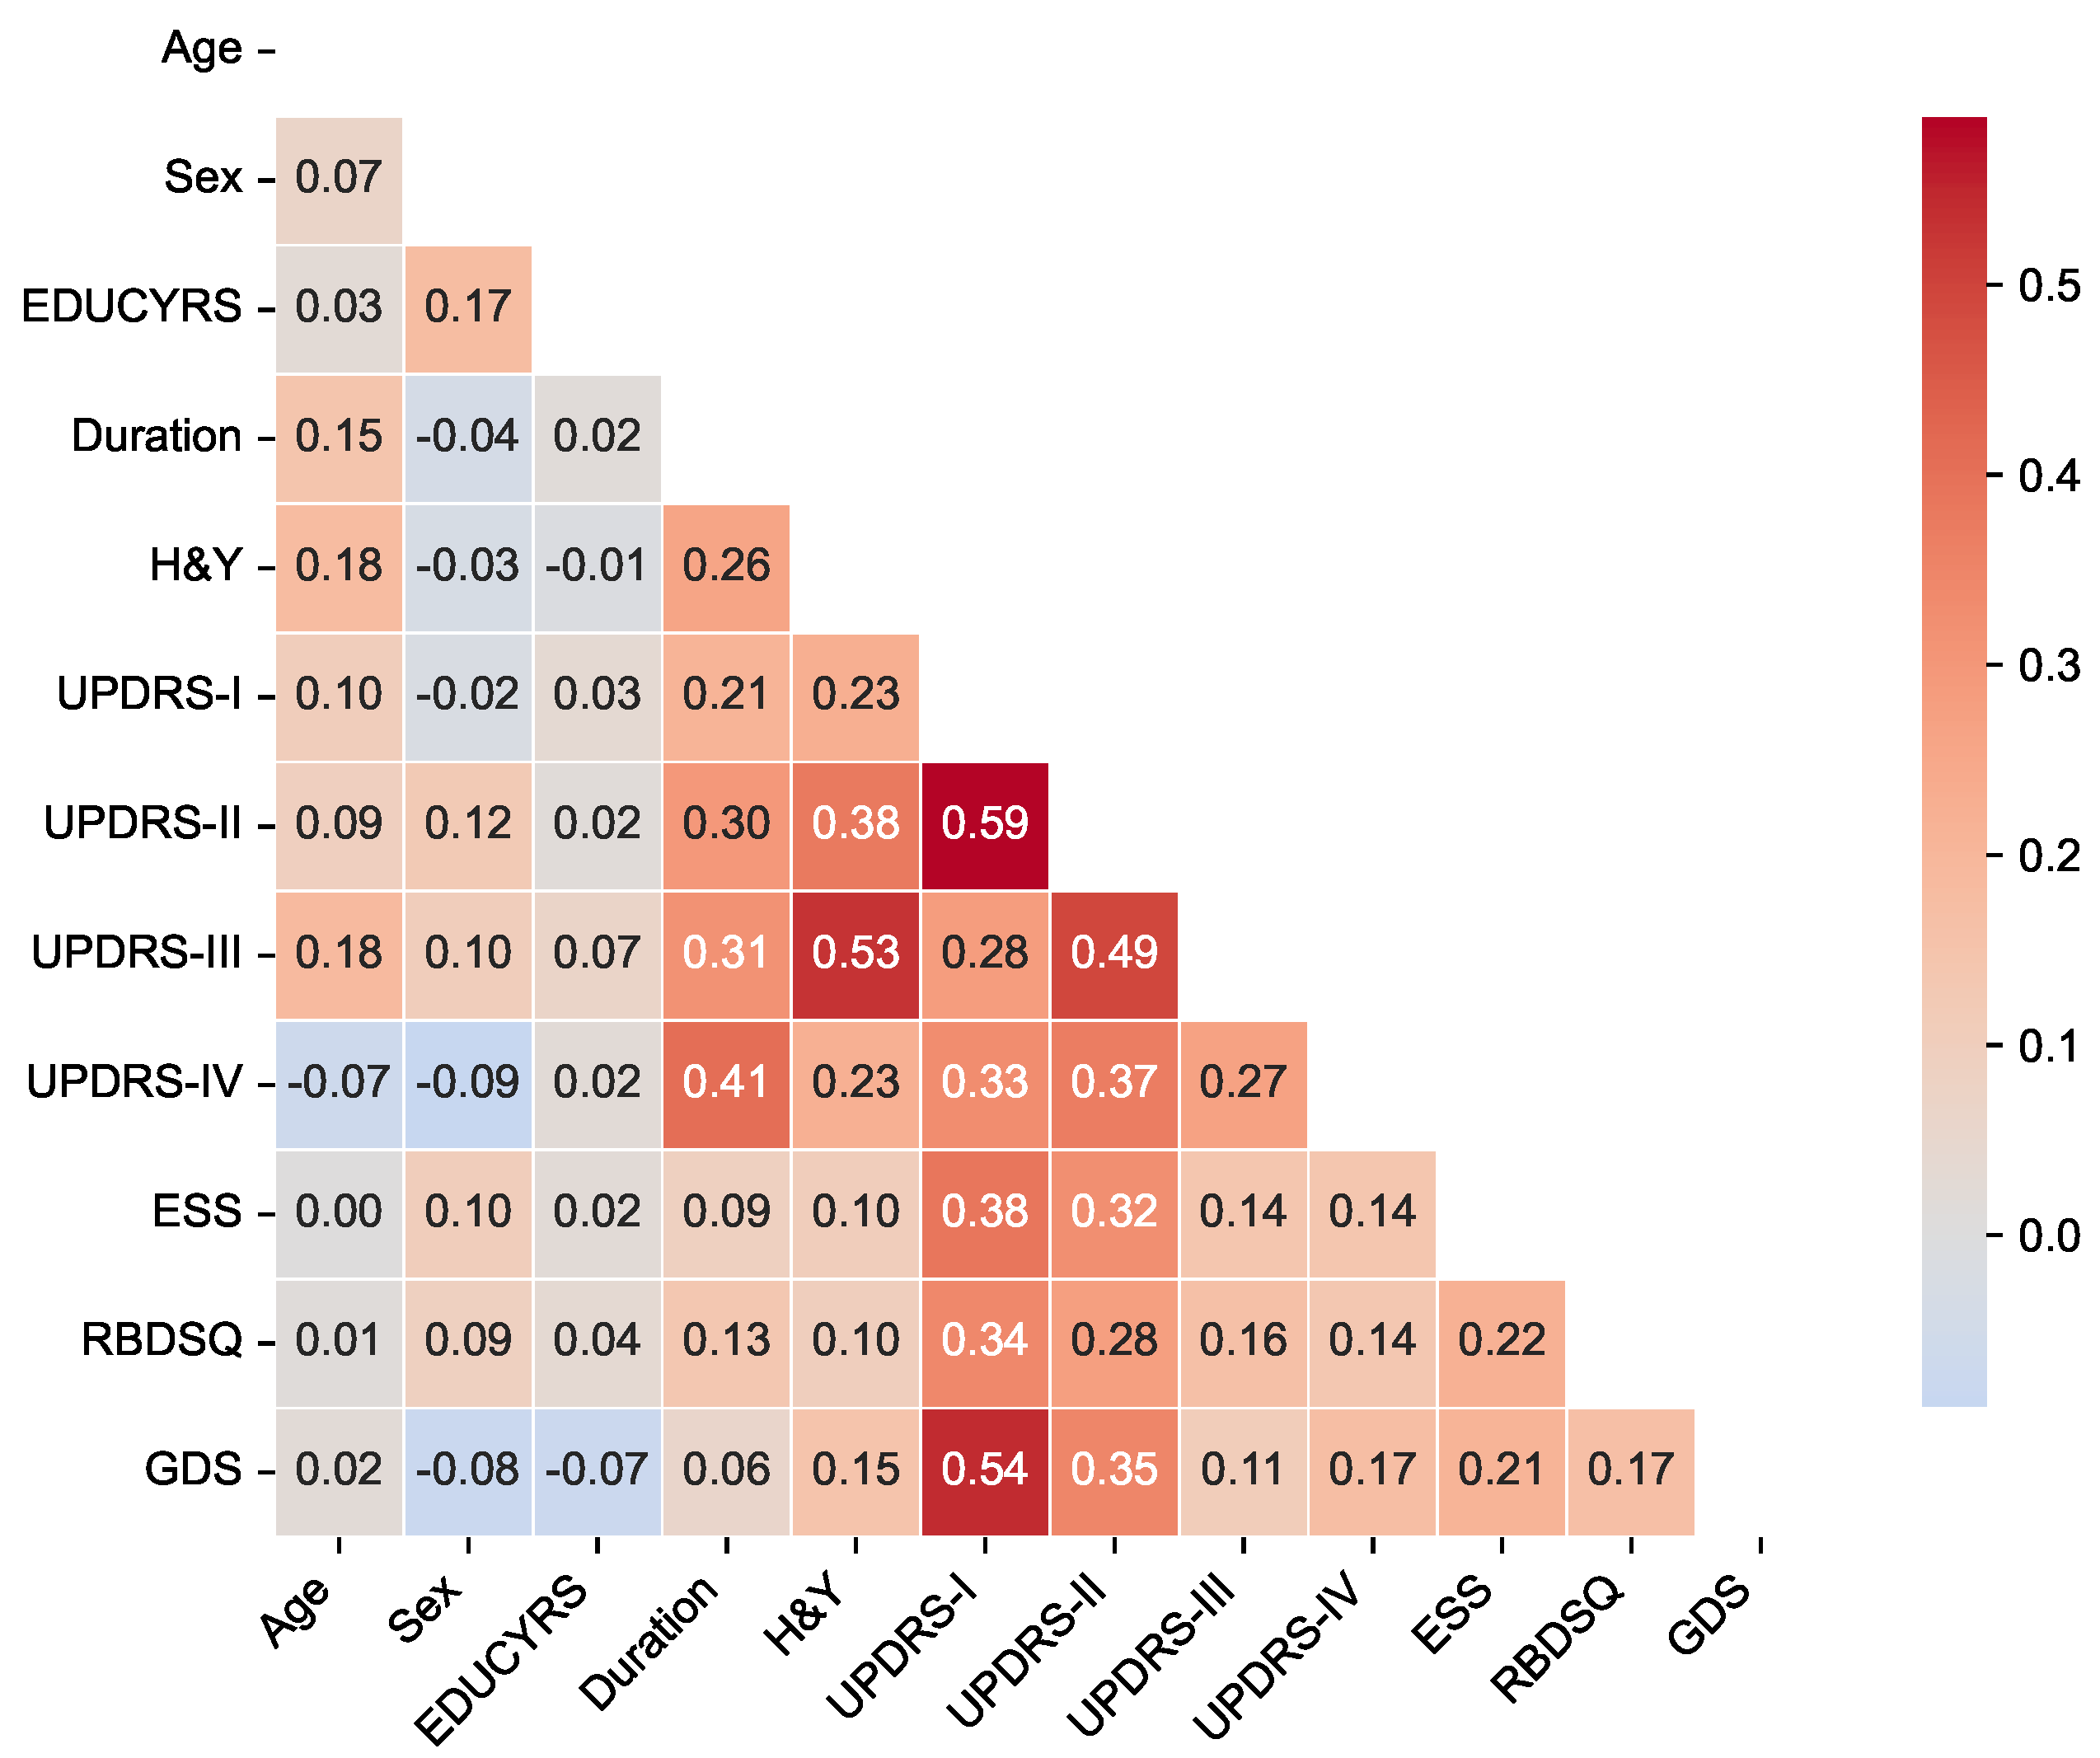
Figure 3.
LASSO Logistic Regression Feature Selection. (a) Mean AUC-PR (± standard deviation) from subject-level stratified 10-fold cross-validation across a range of values, with the optimal indicated. (b) Coefficient paths for each feature as a function of obtained by retraining on the complete training set. As increases, coefficients of less important features are progressively shrunk to zero. Only eleven features are shown as the coefficients of RBDSQ remained zero throughout the regularization path.
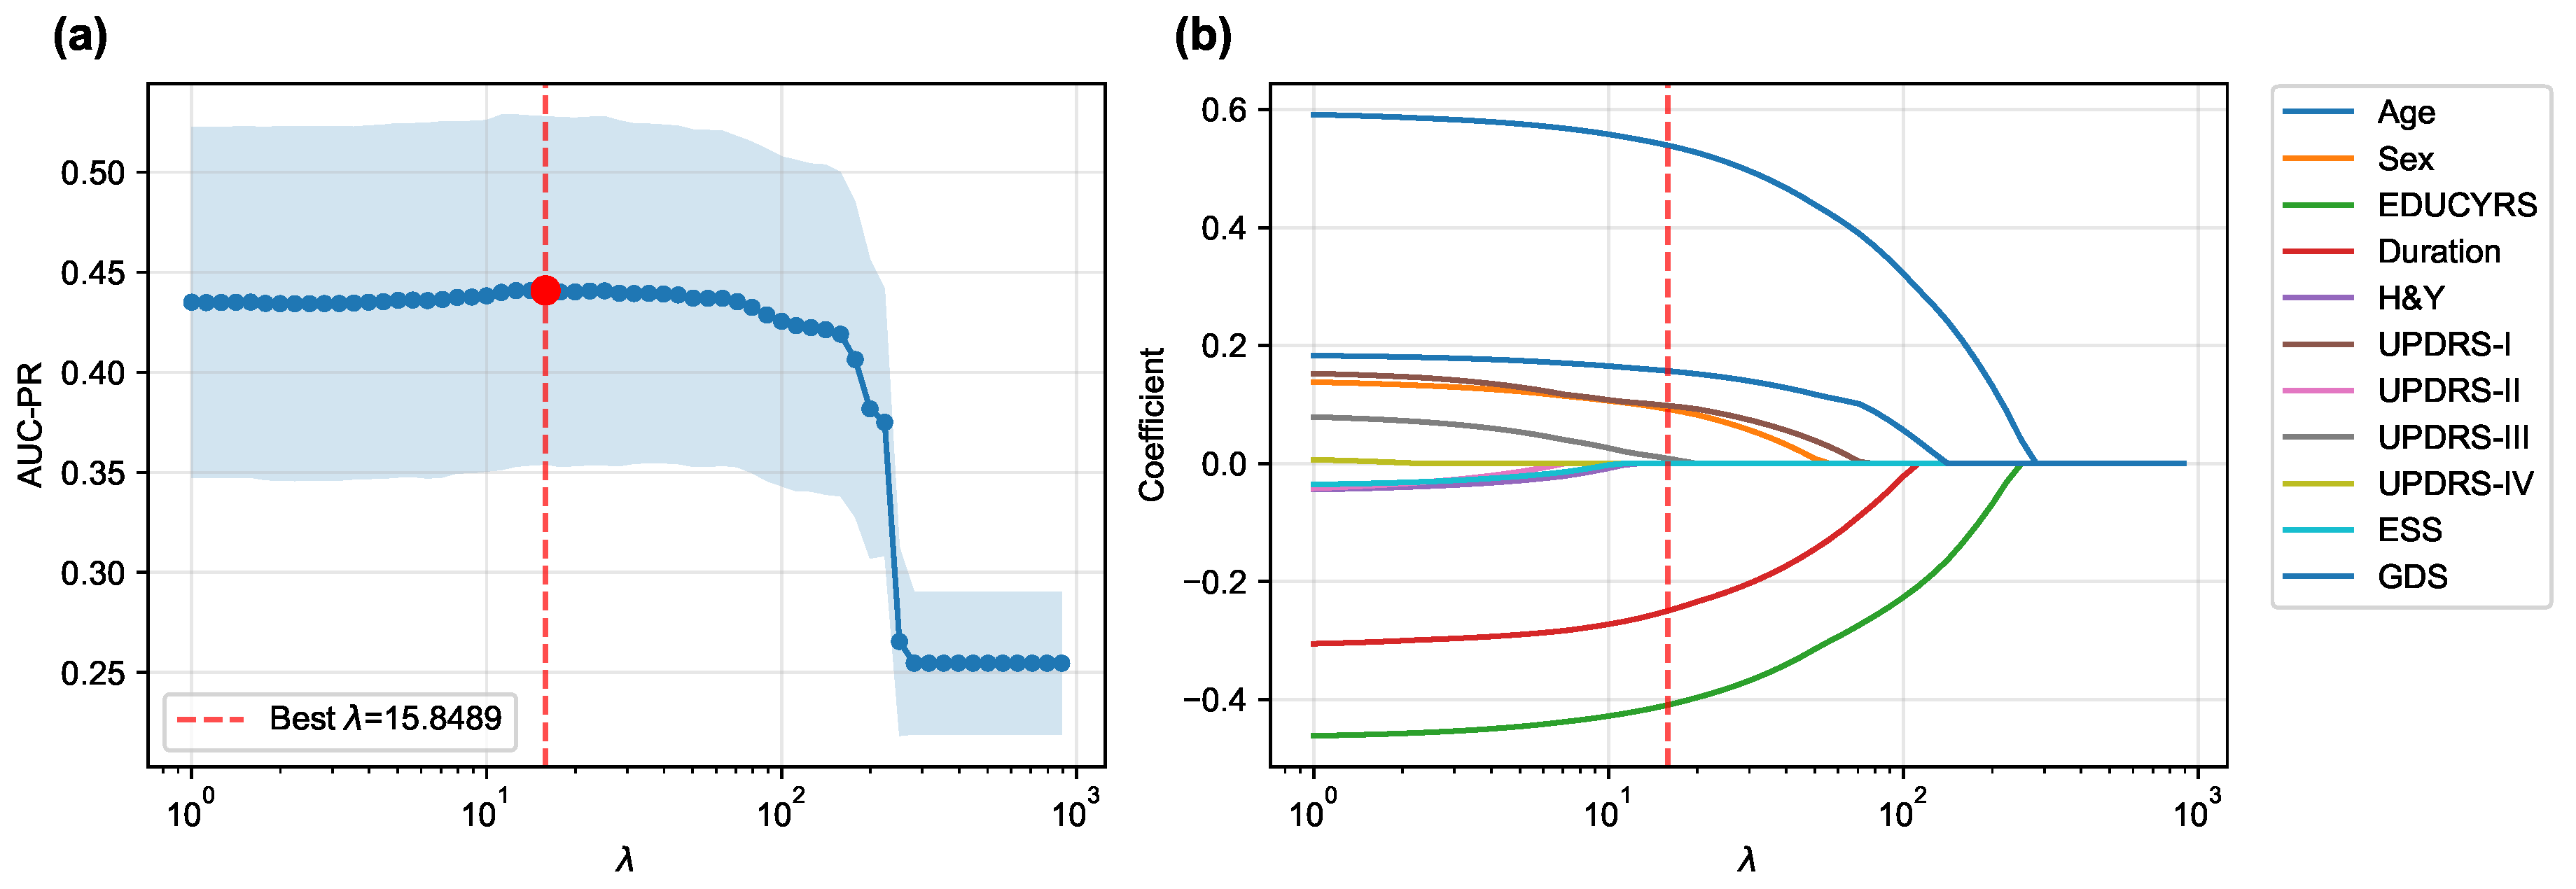
Figure 4.
LASSO Feature Weights for PD-MCI Classification. The horizontal bar chart displays the absolute weights of the 7 selected features from the LASSO model trained on the complete training set with the optimal value. Blue bars represent positive coefficients (features associated with increased PD-MCI likelihood, i.e., risk features), while red bars represent negative coefficients (protective features). Features are ordered by their absolute weight magnitude, with Age (0.5395) being the most influential predictor, followed by EDUCYRS (-0.4093) and Duration (-0.2498).
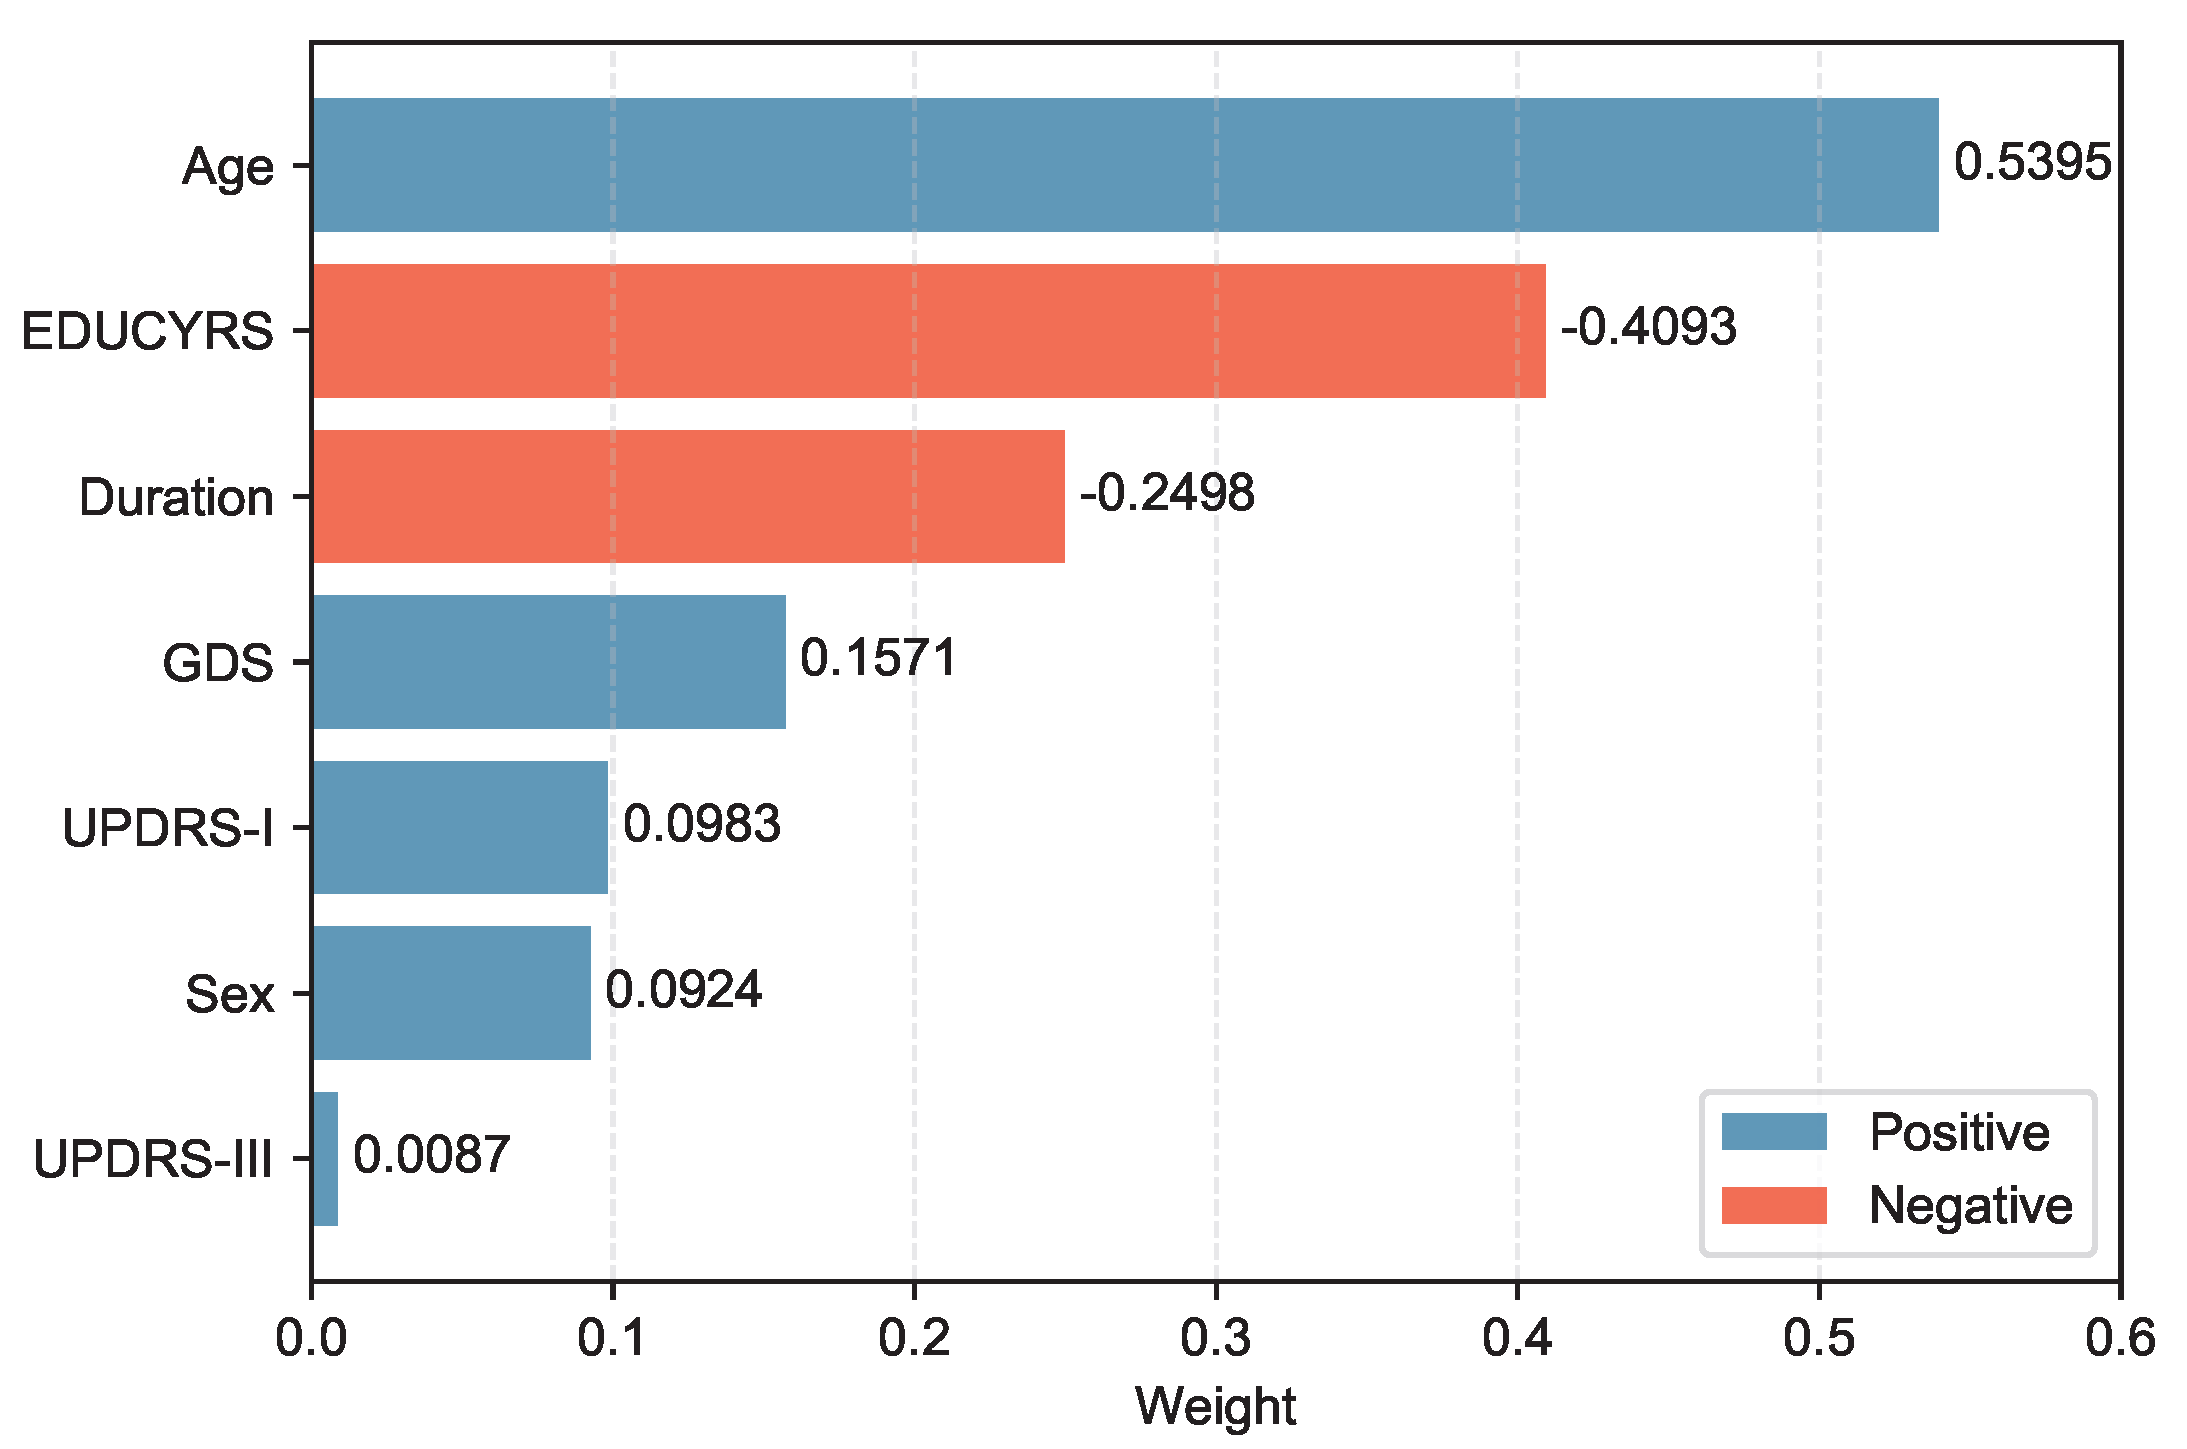
Figure 5.
ROC and PR curves for the different machine learning models on the test set. (a) ROC curves illustrate the trade-off between sensitivity and 1-specificity, reflecting each model’s discriminative ability to distinguish between positive and negative classes across all classification thresholds. (b) PR curves show the trade-off between precision and recall, which is particularly informative for imbalanced datasets as they focus on the performance of the positive class and are less influenced by the large number of true negatives.
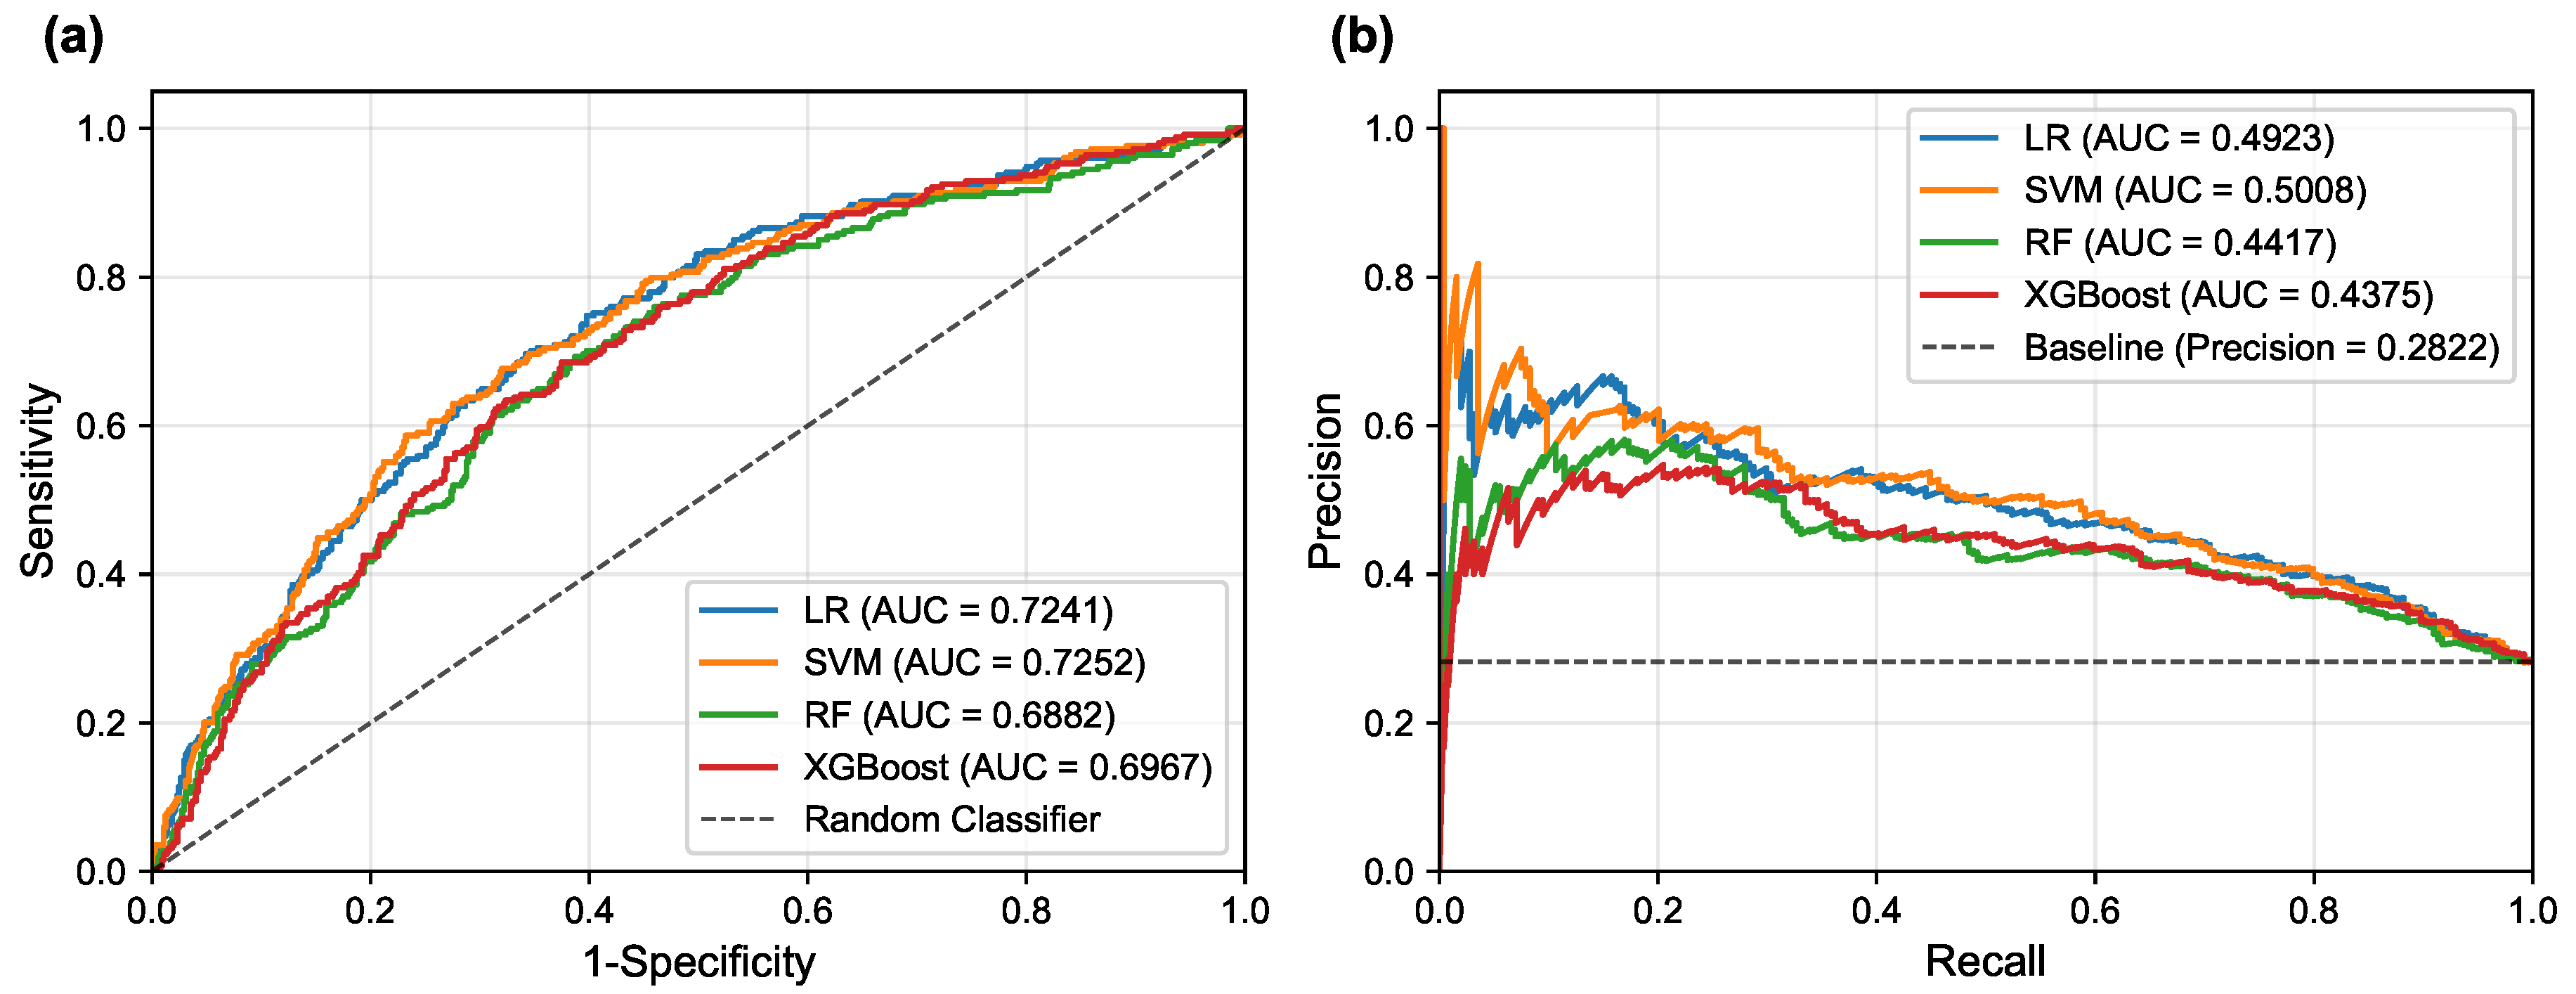
Figure 6.
Comparison of feature importance across four models (rows: LR, SVM, RF, XGBoost) using three different evaluation metrics (columns). The metrics are: model-specific importance (Coefficients for LR/SVM, Gini Impurity for RF, and Gain for XGBoost), mean absolute SHAP values, and permutation importance.
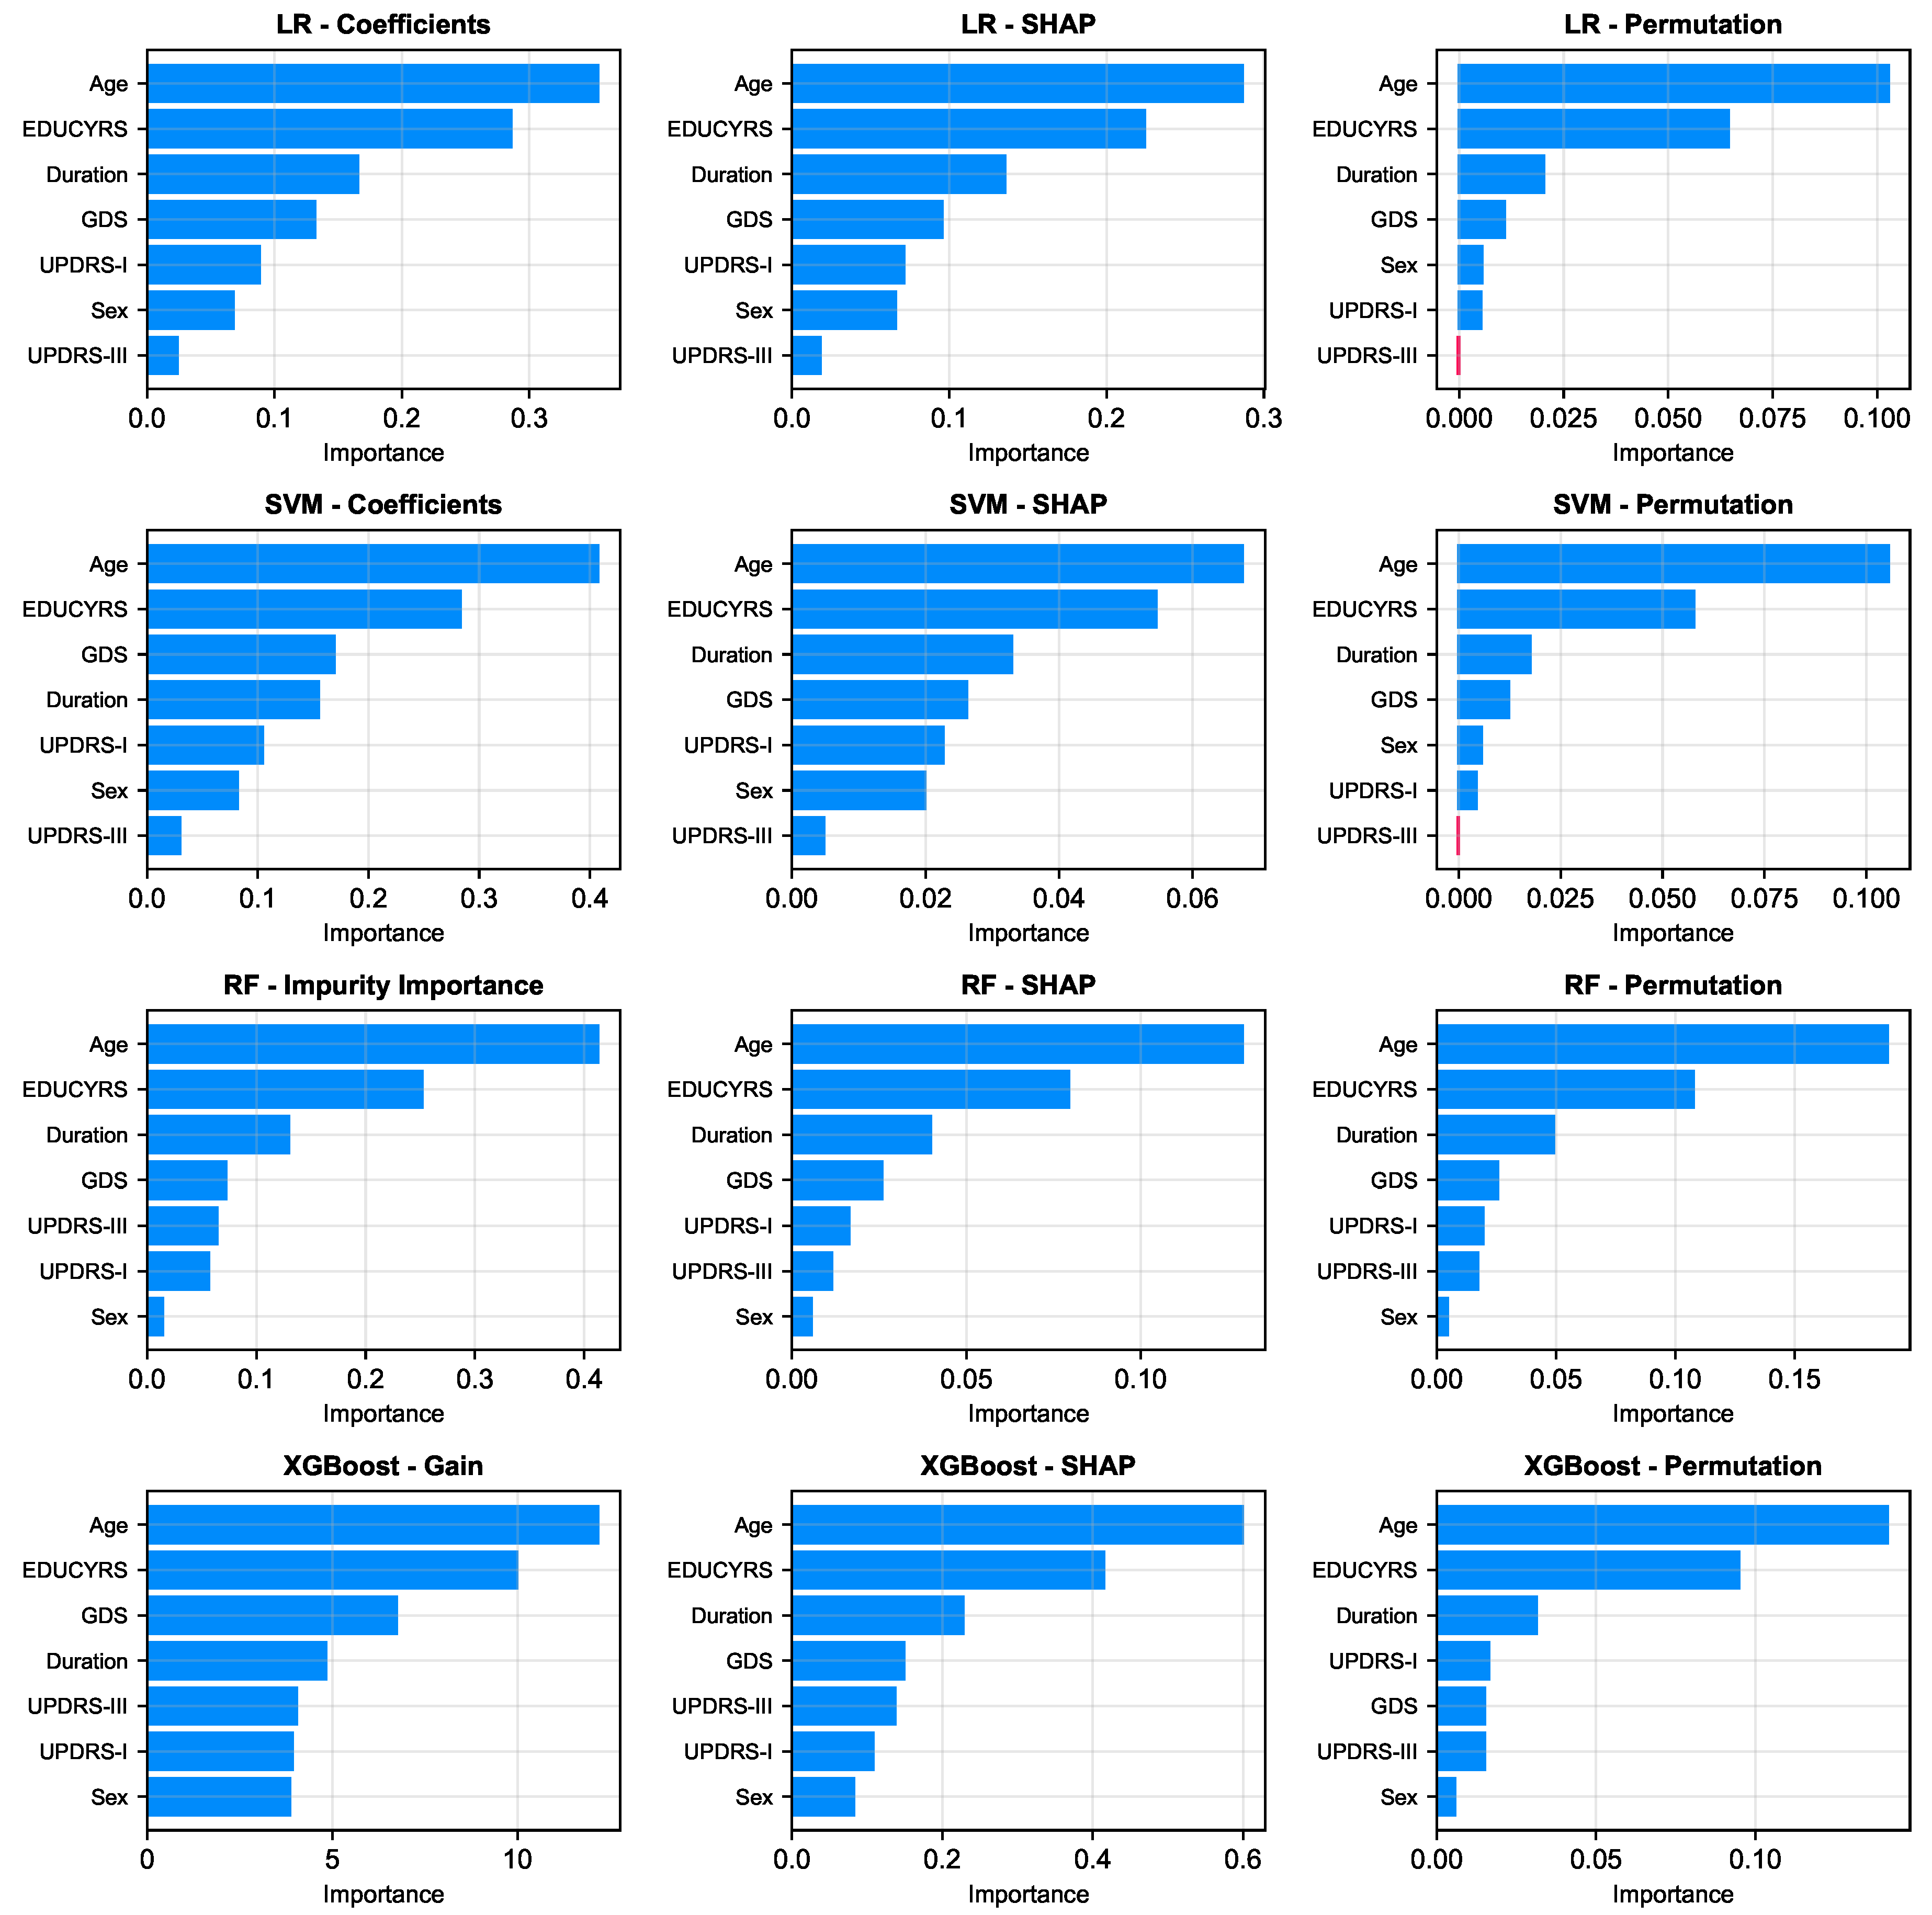
Figure 7.
SHAP summary plots for (a) Logistic Regression, (b) Support Vector Machine, (c) Random Forest, and (d) XGBoost models. Each point represents a single observation. The horizontal position indicates the feature’s impact on the model output (SHAP value), while the color denotes the feature’s magnitude (red for high, blue for low). Features are ranked vertically by their global importance, providing a detailed view of both the direction and consistency of their effects.
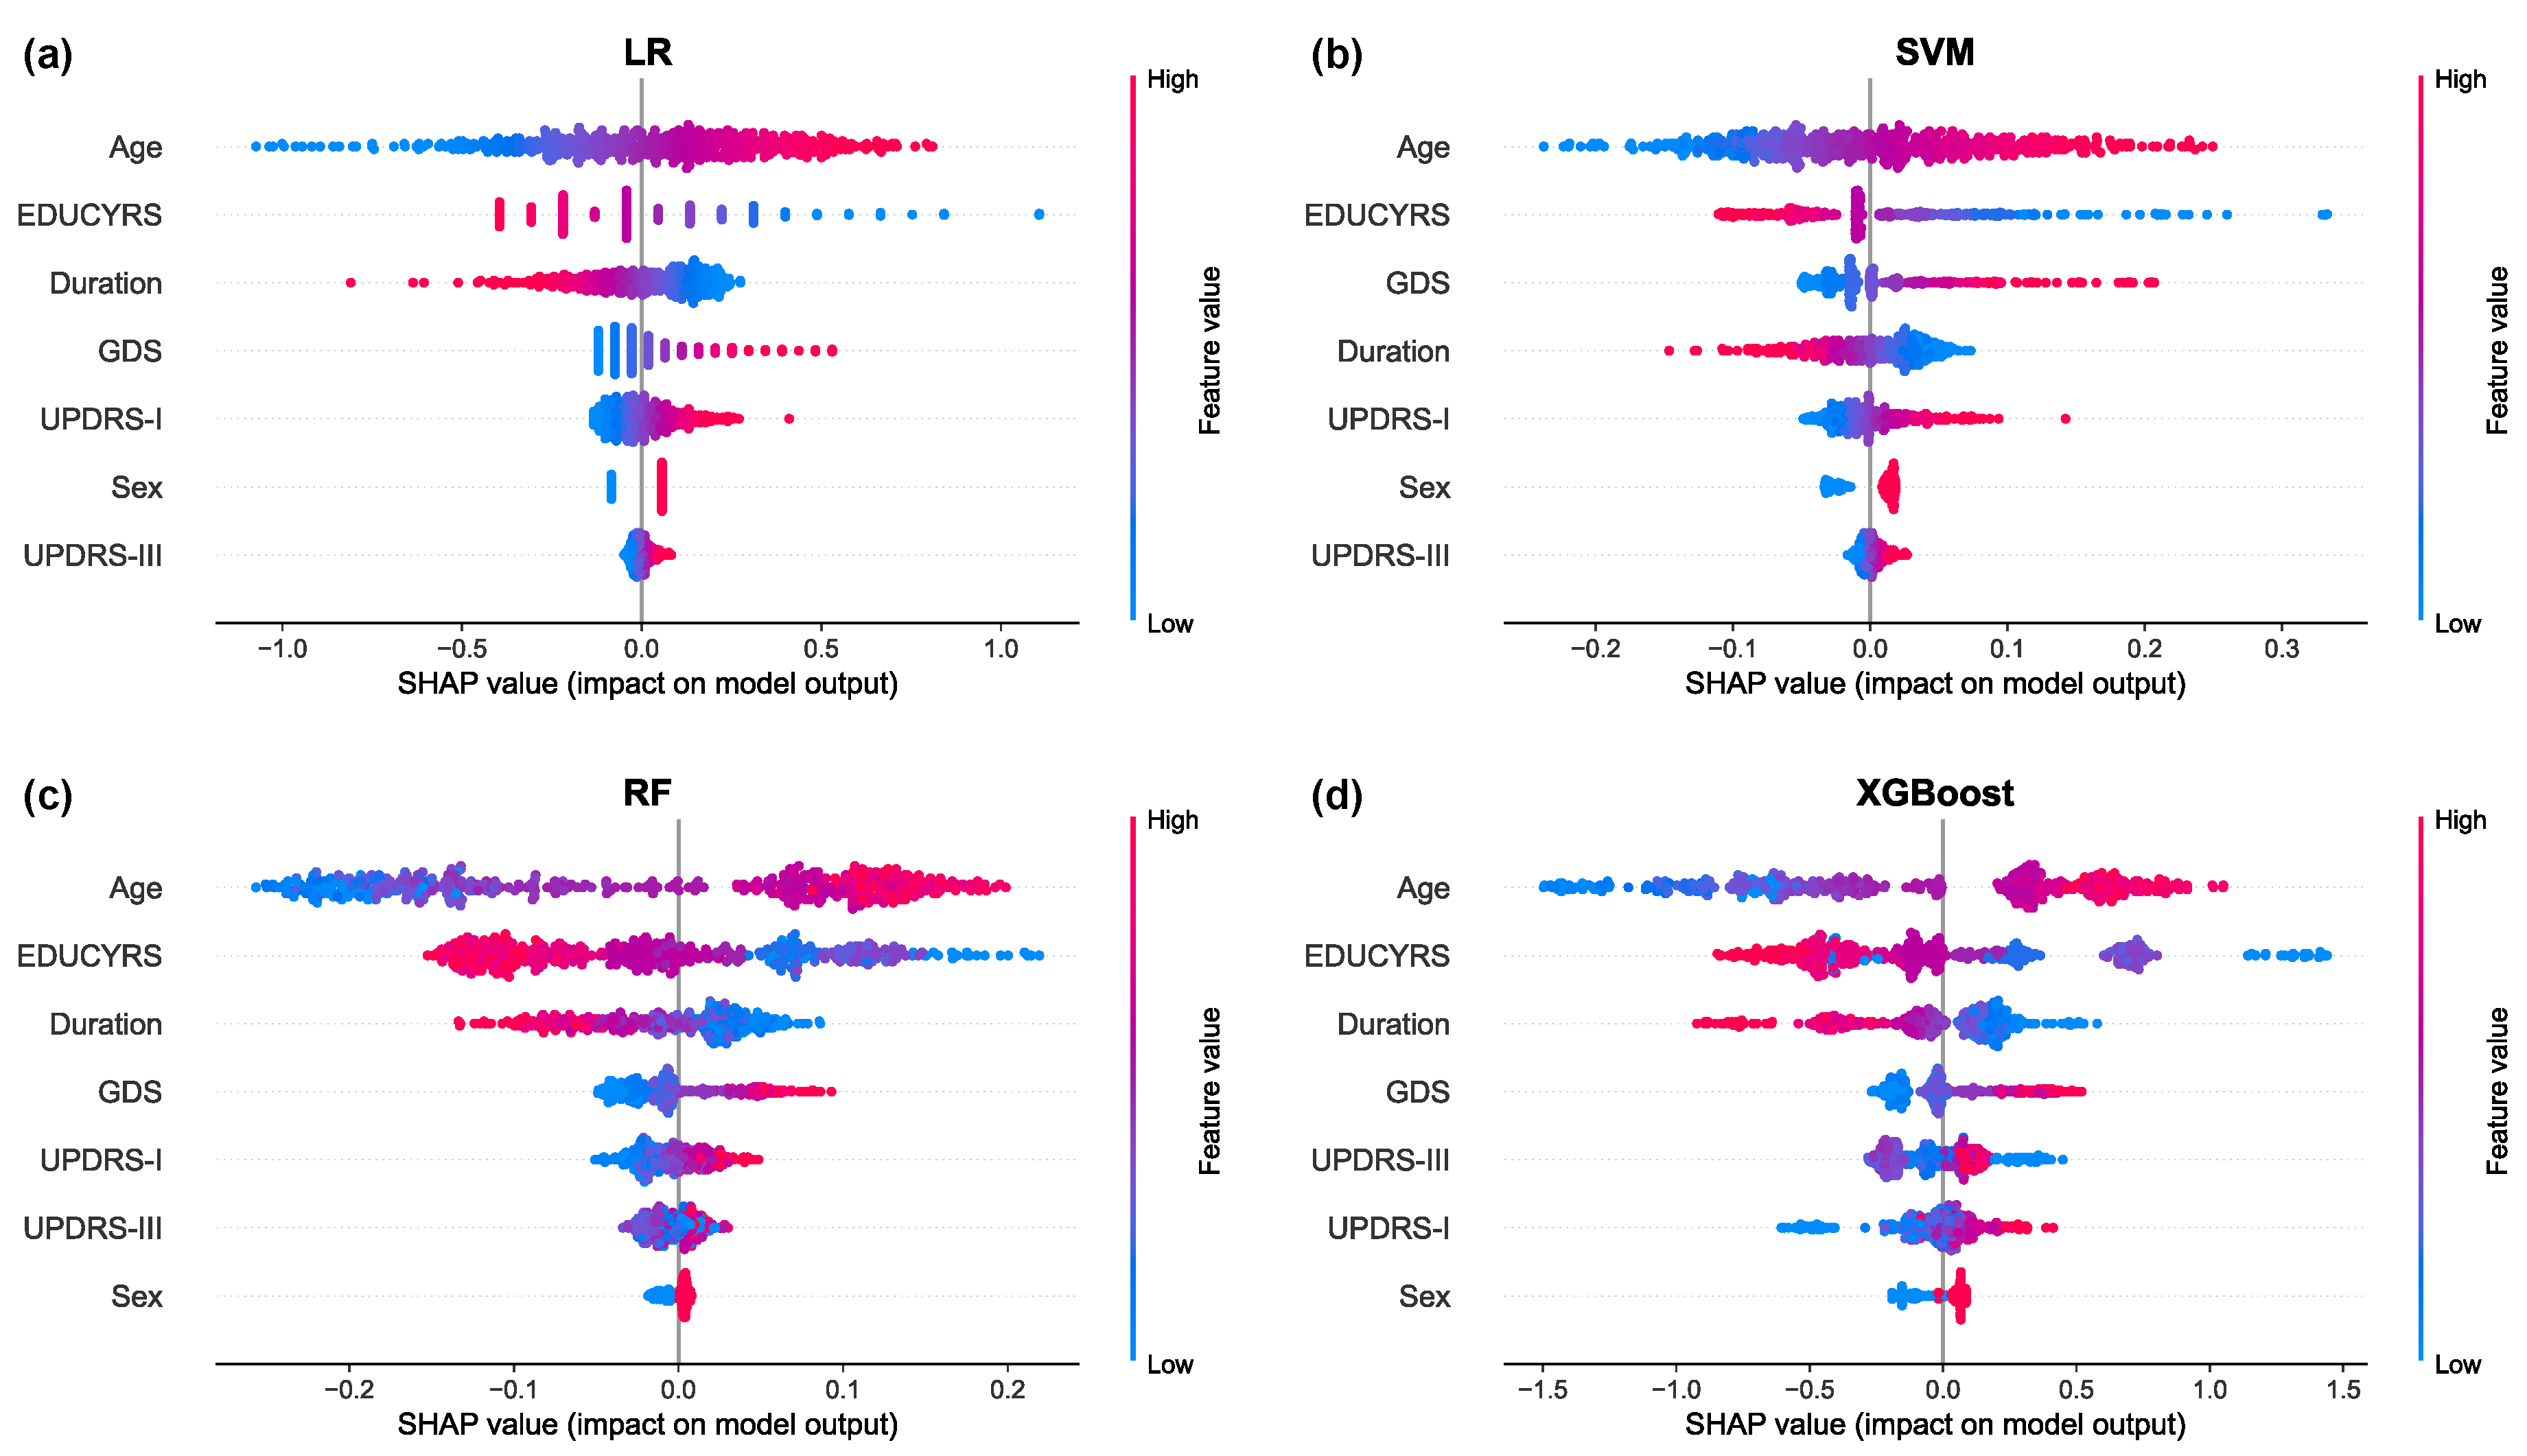

Table 1.
Hyperparameter Search Spaces for Bayesian Optimization
| Model | Hyperparameter | Search Space | Type |
|---|---|---|---|
| LR | penalty | [l1, l2, elasticnet, none] | Categorical |
| solver | [liblinear, lbfgs, newton-cg, sag, saga] | Categorical | |
| C | [, 1] | Log-uniform | |
| l1_ratio | [0, 1] | Uniform | |
| SVM | kernel | [linear, rbf, poly, sigmoid] | Categorical |
| C | [, 1] | Log-uniform | |
| gamma | [, 1] | Log-uniform | |
| degree | [2, 5] | Integer | |
| coef0 | [0, 10] | Uniform | |
| RF | n_estimators | [50, 500] | Integer |
| max_depth | [3, 20] or none | Integer | |
| min_samples_split | [2, 20] | Integer | |
| min_samples_leaf | [1, 30] | Integer | |
| max_features | [0.1, 1] | Uniform | |
| XGBoost | n_estimators | [50, 500] | Integer |
| learning_rate | [0.01, 0.3] | Log-uniform | |
| max_depth | [2, 6] | Integer | |
| subsample | [0.6, 1] | Uniform | |
| colsample_bytree | [0.6, 1] | Uniform | |
| reg_alpha | [, 1] | Log-uniform | |
| reg_lambda | [1, 10] | Log-uniform | |
| gamma | [0, 0.5] | Uniform | |
| min_child_weight | [1, 20] | Integer | |
| scale_pos_weight | [1, 5] | Uniform |
Note: Hyperparameter descriptions: LR: penalty (regularization type), solver (optimization algorithm), C (inverse regularization strength), l1_ratio (elasticnet mixing parameter). SVM: kernel (kernel function), C (regularization parameter), gamma (kernel coefficient), degree (polynomial degree), coef0 (independent term in kernel). RF: n_estimators (number of trees), max_depth (maximum tree depth), min_samples_split (minimum samples to split node), min_samples_leaf (minimum samples in leaf), max_features (fraction of features per split). XGBoost: n_estimators (number of boosting rounds), learning_rate (step size shrinkage), max_depth (maximum tree depth), subsample (fraction of samples per tree), colsample_bytree (fraction of features per tree), reg_alpha (L1 regularization), reg_lambda (L2 regularization), gamma (minimum loss reduction), min_child_weight (minimum sum of instance weight in child), scale_pos_weight (balancing of positive/negative weights). Valid parameter combinations: LR: l1 penalty requires solver ∈ {liblinear, saga}; l2 penalty allows solver ∈ {liblinear, lbfgs, newton-cg, sag, saga}; elasticnet penalty requires solver = saga; none penalty allows solver ∈ {lbfgs, newton-cg, sag, saga}; l1_ratio is only used when penalty = elasticnet. SVM: gamma and degree are only applicable for non-linear kernels (rbf, poly, sigmoid); coef0 is only used for poly and sigmoid kernels; degree is only used for poly kernel. RF: max_depth can be integer value [3, 20] or none (unlimited depth); all other parameters are always applicable. XGBoost: all parameters are compatible with each other; scale_pos_weight is particularly useful for imbalanced datasets.
Table 2.
Evaluation Metrics for PD-MCI Classification Performance
| Metric | Formula | Clinical Significance in PD-MCI Diagnosis |
|---|---|---|
| Accuracy | Overall proportion of correctly classified patients, providing general diagnostic performance assessment | |
| Balanced Accuracy | Accounts for class imbalance by averaging Recall and specificity, ensuring fair evaluation despite unequal PD-MCI and PD-NC sample sizes | |
| Precision | Proportion of patients classified as PD-MCI who truly have cognitive impairment, indicating diagnostic reliability and reducing false alarms | |
| Recall | Proportion of actual PD-MCI patients correctly identified, crucial for early detection and timely intervention | |
| Specificity | Proportion of cognitively normal patients correctly classified, important for avoiding unnecessary anxiety and overtreatment | |
| F1-Score | Harmonic mean balancing precision and recall, particularly valuable for imbalanced datasets in clinical screening | |
| Cohen’s Kappa | Agreement beyond chance, accounting for random classification probability, providing robust performance assessment | |
| AUC-ROC | Area under ROC curve | Overall discriminative ability across all threshold values, indicating model’s capacity to distinguish PD-MCI from PD-NC |
| AUC-PR | Area under PR curve | Performance measure emphasizing positive class prediction, particularly informative for imbalanced PD-MCI classification tasks |
Note: TP = True Positive, TN = True Negative, FP = False Positive, FN = False Negative; = observed agreement, = expected agreement by chance. Recall is also known as Sensitivity in clinical contexts.
Table 3.
Demographic and Clinical Characteristics of the Study Population.
| Variable | Range | Overall | PD-NC | PD-MCI | p Value |
|---|---|---|---|---|---|
| Sample Size | 3154 | 2325 | 829 | ||
| Age | [29.74, 89.93] | 65.06±9.56 | 63.82±9.44 | 68.53±9.01 | <0.001 |
| Sex (Male %) | {0, 1} | 1 (0.64) | 1 (0.62) | 1 (0.69) | 0.001 |
| EDUCYRS | [0, 20] | 15.77±3.10 | 16.07±2.92 | 14.94±3.42 | <0.001 |
| Duration | [0.15, 26.30] | 6.96±3.69 | 7.10±3.76 | 6.57±3.48 | 0.001 |
| H&Y | {0-5} | 2 (0.77) | 2 (0.78) | 2 (0.75) | 0.014 |
| UPDRS-I | [0, 35] | 8.84±5.61 | 8.50±5.46 | 9.78±5.92 | <0.001 |
| UPDRS-II | [0, 48] | 9.56±6.28 | 9.29±6.13 | 10.31±6.63 | <0.001 |
| UPDRS-III | [2, 96] | 30.03±13.75 | 29.54±13.51 | 31.41±14.33 | 0.001 |
| UPDRS-IV | [0, 19] | 2.38±3.16 | 2.48±3.21 | 2.12±3.01 | 0.004 |
| ESS | [0, 24] | 7.15±4.44 | 7.08±4.46 | 7.36±4.37 | 0.051 |
| RBDSQ | [0, 13] | 4.84±3.24 | 4.76±3.24 | 5.06±3.22 | 0.014 |
| GDS | [0, 15] | 2.79±2.87 | 2.57±2.75 | 3.40±3.12 | <0.001 |
Note: Continuous variables are presented as mean ± standard deviation; categorical variables as mode (proportion). The p values were calculated using Mann-Whitney U tests for continuous variables and Chi-square tests for categorical variables, with FDR correction applied.
Table 4.
Optimal Hyperparameters Obtained via Bayesian Optimization
| Algorithm | Hyperparameter | Value |
|---|---|---|
| LR | penalty | l2 |
| solver | newton-cg | |
| C | ||
| SVM | kernel | linear |
| C | ||
| RF | n_estimators | 374 |
| max_depth | 6 | |
| min_samples_split | 18 | |
| min_samples_leaf | 28 | |
| max_features | ||
| XGBoost | n_estimators | 280 |
| learning_rate | ||
| max_depth | 2 | |
| subsample | ||
| colsample_bytree | ||
| reg_alpha | ||
| reg_lambda | ||
| gamma | ||
| min_child_weight | 18 | |
| scale_pos_weight |
Table 5.
Cross-Validation Performance Comparison on Training Data Across Different Threshold Strategies.
Table 5.
Cross-Validation Performance Comparison on Training Data Across Different Threshold Strategies.
| Threshold | Metric | LR | SVM | RF | XGBoost |
|---|---|---|---|---|---|
| AUC-ROC | 0.6948±0.0441 | 0.6946±0.0453 | 0.6952±0.0427 | 0.7076±0.0442 | |
| AUC-PR | 0.4443±0.0843 | 0.4462±0.0850 | 0.4408±0.0833 | 0.4529±0.0807 | |
| Default (0.5) | Accuracy | 0.6406±0.0427 | 0.7507±0.0355 | 0.6252±0.0390 | 0.7098±0.0415 |
| Balanced Accuracy | 0.6487±0.0435 | 0.5548±0.0411 | 0.6219±0.0382 | 0.6142±0.0500 | |
| Precision | 0.3833±0.0740 | 0.5073±0.2208 | 0.3616±0.0619 | 0.4300±0.1048 | |
| Recall | 0.6633±0.0835 | 0.1534±0.0840 | 0.6145±0.0858 | 0.4174±0.0858 | |
| Specificity | 0.6340±0.0547 | 0.9562±0.0212 | 0.6293±0.0580 | 0.8110±0.0433 | |
| F1-score | 0.4820±0.0702 | 0.2300±0.1174 | 0.4520±0.0589 | 0.4192±0.0839 | |
| Cohen’s Kappa | 0.2393±0.0806 | 0.1393±0.1042 | 0.1969±0.0687 | 0.2280±0.1050 | |
| F1-Score | Optimal Threshold | 0.4636±0.0474 | 0.2217±0.0467 | 0.4372±0.1239 | 0.3570±0.1099 |
| Accuracy | 0.6015±0.0701 | 0.6008±0.0644 | 0.6203±0.1138 | 0.6474±0.1051 | |
| Balanced Accuracy | 0.6723±0.0366 | 0.6711±0.0366 | 0.6673±0.0294 | 0.6836±0.0475 | |
| Precision | 0.3781±0.0757 | 0.3762±0.0723 | 0.4028±0.0920 | 0.4201±0.1038 | |
| Recall | 0.8145±0.0812 | 0.8113±0.0850 | 0.7705±0.1860 | 0.7615±0.1187 | |
| Specificity | 0.5301±0.1184 | 0.5309±0.1089 | 0.5640±0.2152 | 0.6058±0.1880 | |
| F1-score | 0.5100±0.0615 | 0.5078±0.0592 | 0.5092±0.0520 | 0.5278±0.0630 | |
| Cohen’s Kappa | 0.2511±0.0819 | 0.2483±0.0764 | 0.2620±0.0879 | 0.2937±0.1140 | |
| Youden Index | Optimal Threshold | 0.4784±0.0253 | 0.2441±0.0496 | 0.4495±0.1044 | 0.3643±0.0770 |
| Accuracy | 0.6187±0.0620 | 0.6304±0.0614 | 0.6262±0.0887 | 0.6528±0.0830 | |
| Balanced Accuracy | 0.6732±0.0357 | 0.6721±0.0354 | 0.6692±0.0282 | 0.6859±0.0452 | |
| Precision | 0.3865±0.0785 | 0.3920±0.0707 | 0.4001±0.0952 | 0.4166±0.0966 | |
| Recall | 0.7765±0.0881 | 0.7512±0.1314 | 0.7540±0.1439 | 0.7539±0.0738 | |
| Specificity | 0.5700±0.0979 | 0.5930±0.1097 | 0.5844±0.1670 | 0.6179±0.1368 | |
| F1-score | 0.5080±0.0612 | 0.5052±0.0594 | 0.5067±0.0536 | 0.5276±0.0629 | |
| Cohen’s Kappa | 0.2595±0.0783 | 0.2625±0.0673 | 0.2628±0.0825 | 0.2950±0.1051 |
Table 6.
Comparison of Model Performance Metrics Across Different Decision Threshold Strategies.
| Threshold | Metric | LR | SVM | RF | XGBoost |
|---|---|---|---|---|---|
| AUC-ROC | 0.7241 | 0.7252 | 0.6882 | 0.6967 | |
| AUC-PR | 0.4923 | 0.5008 | 0.4417 | 0.4375 | |
| Default (0.5) | Accuracy | 0.6689 | 0.7356 | 0.6344 | 0.6889 |
| Balanced Accuracy | 0.6774 | 0.5614 | 0.6522 | 0.6256 | |
| Precision | 0.4447 | 0.6212 | 0.4122 | 0.4519 | |
| Recall | 0.6969 | 0.1614 | 0.6929 | 0.4803 | |
| Specificity | 0.6579 | 0.9613 | 0.6115 | 0.7709 | |
| F1-score | 0.5429 | 0.2563 | 0.5169 | 0.4656 | |
| Cohen’s Kappa | 0.3027 | 0.1583 | 0.2522 | 0.2465 | |
| F1-Score | Optimal Threshold | 0.4769 | 0.2452 | 0.4465 | 0.3942 |
| Accuracy | 0.6244 | 0.6300 | 0.5578 | 0.6222 | |
| Balanced Accuracy | 0.6667 | 0.6634 | 0.6358 | 0.6449 | |
| Precision | 0.4110 | 0.4132 | 0.3710 | 0.4023 | |
| Recall | 0.7638 | 0.7402 | 0.8150 | 0.6969 | |
| Specificity | 0.5697 | 0.5867 | 0.4567 | 0.5929 | |
| F1-score | 0.5344 | 0.5303 | 0.5099 | 0.5101 | |
| Cohen’s Kappa | 0.2645 | 0.2636 | 0.1993 | 0.2371 | |
| Youden Index | Optimal Threshold | 0.4840 | 0.2495 | 0.4629 | 0.3767 |
| Accuracy | 0.6433 | 0.6356 | 0.5722 | 0.6111 | |
| Balanced Accuracy | 0.6751 | 0.6649 | 0.6351 | 0.6431 | |
| Precision | 0.4251 | 0.4170 | 0.3757 | 0.3957 | |
| Recall | 0.7480 | 0.7323 | 0.7795 | 0.7165 | |
| Specificity | 0.6022 | 0.5975 | 0.4907 | 0.5696 | |
| F1-score | 0.5421 | 0.5314 | 0.5070 | 0.5098 | |
| Cohen’s Kappa | 0.2846 | 0.2683 | 0.2038 | 0.2297 |
Table 7.
Clinical Decision Framework for Model Selection in PD-MCI Classification
| Clinical Scenario | Primary Objective | Model |
|---|---|---|
| Screening & Early Detection | Maximize case identification | RF |
| Research & Cohort Studies | Comprehensive cognitive phenotyping | RF |
| Precision Diagnostic Assistance | Balanced accuracy & overall discrimination | LR or SVM |
| Resource-Limited Settings | Cost-effective, interpretable screening | LR |
Disclaimer/Publisher’s Note: The statements, opinions and data contained in all publications are solely those of the individual author(s) and contributor(s) and not of MDPI and/or the editor(s). MDPI and/or the editor(s) disclaim responsibility for any injury to people or property resulting from any ideas, methods, instructions or products referred to in the content. |
© 2025 by the authors. Licensee MDPI, Basel, Switzerland. This article is an open access article distributed under the terms and conditions of the Creative Commons Attribution (CC BY) license (http://creativecommons.org/licenses/by/4.0/).
Copyright: This open access article is published under a Creative Commons CC BY 4.0 license, which permit the free download, distribution, and reuse, provided that the author and preprint are cited in any reuse.


