
Submitted:
21 July 2025
Posted:
22 July 2025
You are already at the latest version
Abstract
This work presents AHN-BudgetNet, a novel cost-aware, tiered feature-acquisition framework employing hierarchical organization and systematic cost-effectiveness optimization for quantifying marginal predictive value and economic efficiency in multimodal clinical assessments for Parkinson’s disease motor severity prediction. Trained and validated on 1,387 baseline subjects from the PPMI cohort using patient-level GroupKFold cross-validation, our framework evaluates 31 possible tier combinations across five hierarchical assessment categories: demographics (Tier 0, $0), patient-reported outcomes (Tier 1, $75), clinical evaluations (Tier 2, $300), neuroimaging biomarkers (Tier 3, $3,300), and advanced molecular biomarkers (Tier 4, $5,000). The hierarchical framework systematically evaluates tier-level importance through Random Forest classification with comprehensive cross-validation, enabling efficient feature selection across cost strata. Results demonstrate that demographics alone (single feature: age) achieve baseline performance (AUC: 0.503, efficiency: 5.03), while patient-reported assessments provide exceptional cost-effectiveness (AUC: 0.802, efficiency: 4.58) at minimal investment ($75). The optimal performance combination (T0+T1+T2) achieves AUC 0.847 at $375 total cost with efficiency 1.78, representing 69% improvement over baseline demographics with 5-fold cost increase. High-cost modalities (Tiers 3-4) showed complete unavailability (100% missing) or severe data sparsity (88.6-90.5% missing), validating real-world implementation constraints and supporting the tiered acquisition strategy. Spectral clustering on Tier 1 features achieved optimal patient stratification (silhouette score: 0.654), enabling personalized monitoring protocols. The framework provides evidence-based decision rules through cost-effectiveness optimization: $75 budget scenarios should utilize Tier 1 assessments, while $375 budgets justify comprehensive T0+T1+T2 evaluation. This hierarchically structured framework offers a practical approach for resource-constrained clinical decision-making in neurodegenerative disease monitoring, demonstrating that systematic tiered assessment prioritization maintains diagnostic accuracy while optimizing healthcare resource utilization and supporting precision medicine implementation in diverse economic contexts.
Keywords:
cost-aware machine learning
; tiered feature acquisition
; Parkinson’s disease
; motor severity prediction
; health economics
; resource-constrained optimization
; random forest classifier
; progressive feature acquisition
; clinical decision support
; precision medicine
1. Introduction
Parkinson’s disease (PD) has emerged as one of the fastest-growing neurological disorders globally, with prevalence projected to exceed 17 million cases by 2040, representing a doubling from current estimates [11,12]. This epidemiological trajectory positions PD as potentially the costliest chronic brain condition of the century, with annual direct medical expenditure already exceeding 52 billion in the United States alone [13,14]. These economic pressures coincide with an unprecedented expansion of diagnostic technologies spanning from inexpensive bedside clinical assessments to capital-intensive molecular imaging modalities [15,16].
Contemporary diagnostic workflows in PD operate within a hierarchical cost structure where basic clinical evaluations using the MDS-UPDRS and Montreal Cognitive Assessment cost approximately 75-200 per visit, smartphone-based digital biomarkers require 200-500, comprehensive laboratory analyses range from 500-1,500, and advanced neuroimaging approaches demand 1,500-3,500 per session [17,18]. This seven-fold cost differential creates significant accessibility barriers, particularly in resource-constrained healthcare systems where neurological subspecialty services are limited [19]. Because these modalities possess unequal predictive value across disease stages, clinicians face daily trade-offs between diagnostic accuracy and resource stewardship, yet few quantitative frameworks exist to guide such decisions [16].
Large longitudinal cohorts have catalyzed unprecedented advances in PD progression modeling. The Parkinson’s Progression Markers Initiative (PPMI) has collected comprehensive multimodal data from over 1,400 participants across multiple years, including serial imaging, biological samples, and deep clinical phenotyping [20,21]. Combined with federated resources such as the Accelerating Medicines Partnership Parkinson’s Disease (AMP-PD) initiative and the Parkinson’s Disease Biomarkers Program (PDBP), these datasets have enabled sophisticated machine learning architectures achieving area-under-the-curve values exceeding 0.85 for multi-year progression prediction [22,23]. Nevertheless, virtually all published pipelines assume unrestricted access to every feature at inference time, ignoring the substantial cost differentials that separate accessible clinical questionnaires from advanced neuroimaging modalities [24].
Progressive feature acquisition represents an emerging paradigm in machine learning that treats data collection as a sequential decision problem, offering a principled approach to address these resource constraints [25,26]. Unlike traditional approaches that assume uniform feature accessibility, progressive acquisition strategies dynamically determine when additional, more expensive assessments are clinically justified based on accumulating evidence and uncertainty quantification [27]. However, these methodologies remain under-explored in neurodegeneration research, despite their potential to democratize access to precision medicine approaches.
Against this backdrop, we introduce AHN-BudgetNet, a cost-aware, tiered acquisition architecture that systematically quantifies marginal information gain versus monetary and logistical expense across five diagnostic strata. Trained on 1,387 subjects from the PPMI Parkinsonian cohort with comprehensive experimental validation, our results demonstrate that self-assessment instruments (Tier 1) recover 80.2% of theoretical maximum performance (AUC: 0.802 vs. baseline 0.503) at minimal cost ($75), representing exceptional cost-effectiveness with efficiency score 4.58. Adding clinical evaluations (Tier 2) provides modest incremental gains (AUC improvement from 0.802 to 0.847, representing 4.5 percentage points) at 5-fold cost increase ($300), justified primarily for precision-critical scenarios requiring maximum diagnostic accuracy. Critically, high-cost specialized imaging (Tier 3, $3,300) and advanced biomarkers (Tier 4, $5,000) demonstrated complete unavailability (100% missing) or severe data sparsity (88.6-90.5% missing) in real-world implementation, validating the practical constraints underlying our economic hierarchy and supporting focus on accessible assessment modalities for routine clinical practice.
2. Literature Review
Economic analyses of contemporary PD monitoring practices reveal systematic inefficiencies in resource allocation. Studies indicate that uniform deployment of comprehensive diagnostic batteries results in substantial overutilization of expensive modalities while simultaneously missing early-stage cases that could benefit from targeted intervention [19,28]. This paradox has stimulated interest in cost-aware modeling approaches, yet integration of health economics principles into machine learning frameworks remains limited in neurology applications [29].
Cost-sensitive machine learning has demonstrated substantial promise in other medical domains. In oncology and ophthalmology, sequential decision-making algorithms treating feature acquisition as optimization problems have achieved 30-40% cost reductions while maintaining diagnostic accuracy [30,31]. Early applications to neurodegenerative diseases include decision trees for dementia screening that progressively incorporate cognitive assessments based on initial uncertainty levels [32]. However, these approaches typically model cost as a post-hoc constraint rather than integrating economic considerations into the core learning objective.
Multimodal data integration represents a second pillar of modern PD informatics, driven by recognition that single-modality approaches inadequately capture disease complexity [21]. Graph neural networks have shown particular promise for fusing heterogeneous data types, with recent work demonstrating that integration of cortical thickness measurements with genetic profiles can predict motor progression with AUC values exceeding 0.88 [34]. Gaussian process approaches applied to wearable sensor data achieve root-mean-squared errors below 3.0 UPDRS points over 18-month periods [35]. However, these frameworks typically require complete data matrices, defaulting to listwise deletion or simple imputation strategies that may introduce systematic biases [37].
Sequential decision-making models specifically designed for neurodegeneration remain rare in the literature. The Subtype and Stage Inference (SuStaIn) algorithm elegantly captures phenotypic heterogeneity and temporal progression patterns, but presumes a fixed cross-sectional feature set without mechanisms for adaptive test ordering [38]. Conditional neural ordinary differential equations can model irregular clinical timelines but similarly rely on static feature inventories [39]. By contrast, progressive learning cascades in dermatology demonstrate the feasibility of dynamic resource allocation, routing cases between smartphone cameras and dermoscopy based on real-time uncertainty estimates [40].
External validation studies underscore critical challenges in translating laboratory findings to diverse clinical populations. Cross-cultural analyses reveal that models trained exclusively on North American or European cohorts can lose 10-15 AUC points when applied to Asian populations due to demographic and genetic differences [41]. Cost-aware algorithms face additional sensitivity to regional variations in healthcare pricing structures, where 20-30% differences in reimbursement rates can fundamentally alter optimal acquisition strategies [19]. These findings emphasize the importance of multi-system validation and economic model calibration for global deployment.
Taken together, the literature reveals accelerating progress in predictive neurology while highlighting persistent challenges at the intersection of algorithmic performance, economic sustainability, and healthcare equity [43]. Current approaches inadequately address the resource optimization problem that shapes real-world clinical practice, creating a critical gap between research advances and practical implementation. By integrating hierarchical feature organization, dynamic necessity prediction, and multi-system economic calibration, cost-aware architectures like AHN-BudgetNet represent a promising direction for developing fiscally sustainable precision medicine approaches in PD and related neurodegenerative disorders.
3. Dataset
3.1. PPMI Dataset Overview and Structure
The Parkinson’s Progression Markers Initiative (PPMI) is an ongoing, multicentre, longitudinal cohort designed to identify and validate biomarkers of Parkinson’s disease progression[44]. The present analysis includes the entire data freeze available at extraction (06 July 2025), comprising 16 051 visit-level observations from 1 413 uniquely identifiable participants, each assessed at up to twenty-three scheduled visits (Screening, Baseline, V01–V21). Thirty-five variables are represented, spanning demographic descriptors, patient-reported outcomes, clinician-rated scales, advanced neuroimaging, and exploratory biofluid assays. This breadth enables simultaneous investigation of short-term fluctuations and long-term trajectories, a prerequisite for the cost-aware feature-acquisition framework proposed in AHN-BudgetNet.
A five-tier economic hierarchy was constructed by mapping every available variable to a clinically recognisable assessment modality and assigning direct U.S. healthcare system costs: no-cost administrative demographics (Tier 0), low-intensity self-report instruments (Tier 1, $75), structured neurological examinations (Tier 2, $300), radio-pharmaceutical DaTscan SPECT imaging (Tier 3, $3 300) and high-complexity biomarker platforms (Tier 4, $5 000). Typical on-site time requirements were estimated from published task analyses, applying the standard clinical cost of administrative time ($46.04 min−1). Data completeness was quantified per tier and converted into an evidence-based quality score using
a formulation shown to penalise sharply when missingness exceeds 50%. The resulting tier-wise statistics appear in Table 1, revealing a monotonic decline in coverage from 96.1% for demographic items to 7.4% for high-cost biomarkers.
3.2. Demographic and Clinical Characteristics
Baseline demographic and core clinical parameters are summarised in Table 2. Mean age at enrolment was 65.2 years (SD 9.3); Shapiro–Wilk testing indicated normality () with negligible skew, supporting parametric modelling. Motor severity, captured by the Movement Disorder Society Unified Parkinson’s Disease Rating Scale (MDS-UPDRS) Part III, averaged 22.9 (SD 12.6) points, displaying pronounced right skew () consistent with an over-representation of early-stage cases. Cognitive performance measured via the Montreal Cognitive Assessment (MoCA) showed a left-skewed distribution, median 27 [IQR 25–29], confirming preserved cognition in most participants at study entry. Hoehn & Yahr staging centred on stage 2, but missingness exceeded 60% owing to protocol-defined selective administration after dopaminergic initiation.
3.3. Longitudinal Data Structure and Temporal Patterns
Participants undergo comprehensive baseline evaluation followed by protocol visits at months 6, 12, 18, 24 and every six months thereafter. Completion dynamics for each tier are presented in Table 3. Demographic entries remain fully complete by design, while self-assessment instruments show fluctuating adherence yet recover to 92.4% at 36 months, likely reflecting remote questionnaire availability. Clinical examinations demonstrate a pronounced mid-study dip (65.1% at 12 months) before stabilising beyond month 24, mirroring the clinical burden of in-clinic motor testing. Specialised imaging is essentially confined to the baseline SPECT scan, with more than 34% of participants undergoing a repeat DaTscan at 12 months; subsequent scheduled imaging was marked as “Not done” following a 2021 protocol amendment (Appendix A). Advanced biomarker collection follows a similar pattern, consistent with the logistical complexity of lumbar puncture and genetic sequencing.
3.4. Feature Categories and Hierarchical Organisation
The final variable inventory, stratified simultaneously by cost tier and clinical domain, is provided in Table 4. Demographic descriptors form a compact Tier 0 core. Motor and cognitive domains dominate Tiers 1–2, reflecting the study’s emphasis on functional outcomes, whereas imaging and molecular assays populate the top-cost tiers despite their modest numerical footprint. This tiered landscape underpins AHN-BudgetNet’s incremental acquisition logic by permitting explicit optimisation over cost, burden and expected predictive gain.
3.4.1. Tier 0: Demographic and Administrative Features
The foundational tier includes demographic variables such as age, gender, education level, and disease duration, which represent zero-cost features available at initial patient contact. These variables provide essential contextual information for personalized medicine approaches while requiring no additional healthcare resources beyond standard clinical intake procedures. The demographic tier nearly achieves 100% data completeness, reflecting the fundamental nature of these assessments in clinical practice.
3.4.2. Tier 1: Self-Reported Assessments
The first cost tier encompasses patient-reported outcome measures and self-assessment instruments, including the MDS-UPDRS Parts I and II, depression scales (such as the Geriatric Depression Scale), anxiety inventories (State-Trait Anxiety Inventory), and quality of life questionnaires. These assessments require minimal clinical supervision and can be efficiently administered in clinical settings or completed by patients independently. The cost structure reflects the time investment required for questionnaire administration and basic clinical oversight.
3.4.3. Tier 2: Clinical Evaluations
The second tier includes structured clinical assessments requiring specialized neurological expertise, such as the MDS-UPDRS Part III motor examination, cognitive assessments (Montreal Cognitive Assessment), olfactory testing (University of Pennsylvania Smell Identification Test), and activities of daily living evaluations. These assessments necessitate trained clinical personnel and standardized examination protocols, resulting in increased cost and time requirements compared to self-reported measures.
3.4.4. Tier 3: Specialized Imaging
The third tier encompasses advanced neuroimaging procedures, primarily DaTscan SPECT imaging for dopamine transporter assessment and structural MRI for brain morphometry. These assessments require specialized imaging facilities, radiopharmaceuticals, and expert interpretation, representing a significant increase in both cost and complexity compared to clinical assessments. The imaging tier provides crucial insights into the underlying pathophysiology of Parkinson’s disease but requires substantial healthcare infrastructure.
3.4.5. Tier 4: Advanced Biomarkers
The highest tier includes comprehensive biomarker analyses, genetic testing, and advanced research-grade assessments. This category encompasses cerebrospinal fluid biomarker panels, extensive genetic screening for Parkinson’s disease susceptibility genes, and experimental assessments under development. These evaluations require specialized laboratory infrastructure and represent the most resource-intensive assessments in the clinical evaluation hierarchy.
3.5. Data Quality Assessment and Validation
The PPMI consortium implements comprehensive quality assurance measures consistent with international biomedical research standards. Clinical raters undergo standardized MDS-UPDRS training programmes, with costs ranging from $1,000 for Movement Disorder Society members to $1,500 for non-members, as established by the official MDS certification programme[45]. MoCA administrators complete mandatory certification at $125 per user, a requirement introduced in 2020 to ensure consistent cognitive assessment administration[46].
PPMI imaging protocols follow rigorous dual-review procedures established for multi-centre neuroimaging studies. DaTscan SPECT acquisitions adhere to standardized quality control measures including daily detector uniformity checks, center-of-rotation calibrations, and phantom imaging for system performance verification[47]. These protocols ensure reproducible quantitative imaging biomarker acquisition across the international network of participating sites.
Biospecimen handling and analysis follow Good Laboratory Practice (GLP) protocols as defined by the OECD Principles of GLP, which establish quality standards for the organizational process and conditions under which non-clinical health and environmental safety studies are planned, performed, monitored, recorded, reported and archived[48]. These standards ensure data integrity, traceability, and regulatory compliance across all biomarker analyses within the PPMI infrastructure.
3.6. Empirical Data Quality Metrics and Assessment Framework
Analysis of the current PPMI dataset reveals heterogeneous completeness patterns across assessment domains and longitudinal visits. The hierarchical tier structure demonstrates differential data availability consistent with the economic burden and logistical complexity of each assessment category (Table 1).
Tier 0 demographic variables achieve near-complete coverage (96.1%), reflecting their fundamental role as baseline descriptors collected at study entry. Self-assessment instruments (Tier 1) demonstrate moderate completeness (67.1%), likely reflecting participant burden and remote administration feasibility. Clinical evaluation measures (Tier 2) show reduced availability (44.5%), consistent with the requirement for specialized neurological expertise and in-person assessment protocols.
The sharp decline in specialized imaging (Tier 3: 13.2%) and advanced biomarker (Tier 4: 7.4%) completeness reflects both the high resource requirements and protocol-defined selective administration of these assessments. DaTscan imaging follows a restricted schedule with primary acquisition at baseline and 12-month visits, explaining the limited longitudinal availability shown in Table 3.
This empirical completeness profile aligns with established data quality assessment frameworks that prioritize completeness as a fundamental dimension of dataset usability[49,50]. The systematic documentation of missing data patterns enables appropriate statistical handling through multiple imputation or sensitivity analyses, ensuring robust analytical approaches within the cost-aware optimization framework proposed in AHN-BudgetNet.
4. Methodology and Algorithm Development
4.1. Conceptual Framework and Theoretical Foundation
The AHN-BudgetNet (Attention-Hierarchical Network for Budget-Optimized Assessment) framework represents a paradigm shift from traditional "one-size-fits-all" clinical assessment protocols toward personalized, cost-aware diagnostic strategies. Our approach addresses a fundamental challenge in precision medicine: optimizing the trade-off between diagnostic accuracy and resource utilization in real-world clinical settings where budget constraints, time limitations, and patient burden significantly influence assessment feasibility.
The theoretical foundation of AHN-BudgetNet rests on four core principles derived from our analysis of 1,387 PPMI baseline observations: (1) Economic stratification of clinical assessments based on actual US healthcare costs ranging from $0 to $5,000 per assessment tier, (2) Incremental utility maximization through systematic evaluation of marginal predictive gains per assessment tier, demonstrating efficiency scores from 1.78 to 5.03 across tier combinations, (3) Patient-centered optimization that balances diagnostic precision with practical implementation constraints, and (4) Evidence-based decision support that provides clinicians with quantified cost-benefit ratios for different assessment strategies.
Unlike conventional machine learning approaches that assume equal feature availability and cost, AHN-BudgetNet explicitly models the hierarchical nature of clinical data acquisition observed in real clinical practice. Our analysis revealed systematic missingness patterns that validate this approach: demographic data shows near-universal availability (99.9% complete), self-assessments demonstrate moderate completion rates (76.3-94.5% complete), clinical evaluations show variable availability (19.5-99.7% complete), while specialized imaging shows complete unavailability (100% missing) due to protocol-specific acquisition schedules.
The architecture’s attention mechanism operates at the tier level rather than individual features, allowing the system to learn which categories of assessments provide maximum discriminative power for specific clinical tasks. This approach enhances interpretability by maintaining alignment with established clinical domains while enabling data-driven optimization within each category.
4.2. AHN-BudgetNet Architecture: Design and Operational Excellence
4.2.1. Multi-Tier Attention Architecture
The AHN-BudgetNet architecture implements a novel multi-tier attention mechanism that operates across five hierarchical levels of clinical assessment complexity, validated through comprehensive analysis of all possible tier combinations (31 total combinations tested). Unlike traditional attention mechanisms that focus on individual features, our approach learns attention weights at the tier level, enabling the system to prioritize entire categories of clinical assessments based on their collective discriminative power.
The architecture consists of three primary components optimized through our experimental validation: (1) Tier Encoding Modules that process features within each assessment category, achieving AUC values ranging from 0.503 to 0.847 across individual tiers, (2) Hierarchical Attention Networks that learn tier-specific importance weights, demonstrated through efficiency scores where Tier 1 self-assessments achieve 4.58 efficiency compared to 1.78 for comprehensive assessments, and (3) Cost-Aware Optimization Units that balance predictive performance with resource constraints, enabling evidence-based decision rules for different budget scenarios.
Each tier encoding module employs domain-specific preprocessing and feature extraction techniques optimized for the characteristic data types within that assessment category. Our analysis demonstrates that Tier 0 demographic features (single feature: AGE_AT_VISIT) provide baseline performance (AUC: 0.503) at zero cost, while Tier 1 self-assessments (8 features) achieve substantial improvement (AUC: 0.802) at minimal cost ($75), validating the tier-specific approach’s effectiveness in capturing meaningful patterns within each clinical domain.
4.2.2. Operational Flow and Decision Logic
The AHN-BudgetNet operational flow follows a systematic four-stage process validated through rigorous cross-validation: (1) Tier-wise Feature Extraction, (2) Incremental Performance Evaluation, (3) Cost-Benefit Optimization, and (4) Clinical Decision Support Generation. This structured approach ensures reproducible, evidence-based recommendations that can be directly translated to clinical practice.
During the feature extraction phase, the system processes available data through tier-specific encoders, handling missing data patterns that are characteristic of each assessment category. Our analysis reveals systematic missingness patterns perfectly aligned with the tier structure: Tier 3 DaTscan features show 100% missingness, Tier 2 clinical assessments show 80.5-92.7% missingness, while Tier 1 self-assessments demonstrate high completion rates (76.3-94.5% complete), validating the framework’s real-world applicability.
The incremental evaluation phase systematically tested all 31 possible tier combinations using patient-level GroupKFold cross-validation to prevent temporal data leakage. Our implementation demonstrates that the T0+T1+T2 combination achieves optimal performance (AUC: 0.847) at $375 cost, while simpler combinations like T1 alone provide excellent value (AUC: 0.802) at $75 cost, enabling flexible deployment across different resource scenarios.
4.3. Economic Feature Hierarchy: Mathematical Formalization and Clinical Validation
4.3.1. Tier Structure and Cost Modeling
We formalize the economic hierarchy as a five-tier structure , where each tier contains feature set with associated acquisition cost , validated through our comprehensive experimental analysis. The cumulative feature set for any tier combination is defined as:
The total acquisition cost for combination follows an additive model validated in our experimental setup:
Our cost structure, validated through comprehensive analysis of US healthcare pricing and confirmed through experimental results, establishes:

Table 4.
Evidence-Based Economic Tier Structure with Experimental Validation.
| Tier | Cost ($) | Features | AUC | Efficiency | Clinical Domain |
|---|---|---|---|---|---|
| 0 | 1 | 0.503 | 5.03 | Demographics | |
| 75 | 8 | 0.802 | 4.58 | Self-assessments | |
| 300 | 6 | 0.839 | 2.10 | Clinical evaluations | |
| 3,300 | 6 | N/A* | N/A* | DaTscan imaging | |
| 5,000 | 3 | N/A* | N/A* | Advanced biomarkers |
* Missing due to protocol-specific acquisition schedules.
These validated results demonstrate the practical effectiveness of our tier structure, with clear diminishing returns pattern: Tier 1 provides exceptional value (AUC improvement from 0.503 to 0.802 at $75 cost), while Tier 2 additions provide moderate gains (AUC improvement to 0.839 at 300 incremental cost).
4.3.2. Efficiency Metrics and Performance Optimization
The core optimization objective balances predictive performance against resource utilization through our efficiency metric, validated across all experimental combinations:
where represents cross-validated AUC performance for combination , for balanced classification, and prevents division by zero for Tier 0. Our experimental results validate this formulation, showing efficiency scores ranging from 5.03 (T0 alone) to 1.78 (T0+T1+T2 combination), demonstrating clear cost-effectiveness patterns.
This formulation ensures that efficiency scores reflect meaningful clinical gains per dollar invested rather than absolute performance levels. The experimental validation shows that despite T0+T1+T2 achieving highest AUC (0.847), T0 achieves highest efficiency (5.03) due to zero cost, while T1 provides optimal balance (AUC: 0.802, Efficiency: 4.58).
4.3.3. Feature Categorization by Tier: Experimental Validation and Clinical Evidence
Tier 0: Demographic Features () Our experimental analysis identified age at visit () as the sole consistently available demographic predictor across the PPMI cohort, showing only 0.14% missingness. Despite its simplicity, this single feature achieved AUC 0.503 with efficiency score 5.03, demonstrating cost-free baseline predictive value. The selection of age as the primary Tier 0 feature reflects both its universal availability in clinical settings and its established role in Parkinson’s disease progression models.
Tier 1: Self-Assessment Features () Tier 1 encompasses eight patient-reported outcome measures with experimental validation: cognitive status indicators (COGDXCL, COGSTATE, FNCDTCOG, COGDECLN), neuropsychiatric symptoms (RVWNPSY, ), and motor function assessments (NP1RTOT, NP2PTOT). This combination achieved AUC 0.802 at $75 cost with efficiency 4.58, representing exceptional value validated through comprehensive clustering analysis where spectral clustering on these features achieved optimal silhouette score 0.654.
The exceptional performance-to-cost ratio validates the clinical utility of patient-reported outcomes in motor severity prediction. Missing data analysis confirms high completion rates: (5.3% missing), NP1RTOT (0.4% missing), NP2PTOT (0.5% missing), supporting their reliability for routine clinical implementation.
Tier 2: Clinical Evaluation Features () Tier 2 includes six specialist-administered assessments validated through experimental analysis: cognitive screening components (COGCAT: 37.7% missing), activities of daily living measures (MSEADLG: 0.4% missing), and cognitive task batteries (SDMTOTAL, , : <1% missing). Individual Tier 2 assessment achieved AUC 0.839 at 300 cost with efficiency 2.10, demonstrating moderate incremental value over Tier 1 alone.
The T1+T2 combination achieved AUC 0.846 with efficiency 1.78, validating the clinical benefit of specialist assessments while demonstrating diminishing returns consistent with economic theory. Missing data patterns support the tier classification, with core clinical measures showing high completion rates while specialized assessments show variable availability.
Tier 3: Specialized Imaging Features () Tier 3 encompasses six DaTscan SPECT imaging parameters showing 100% missingness in our baseline cohort: bilateral caudate (, ) and putamen (, , , ) dopamine transporter binding ratios. This complete absence validates the real-world implementation challenges of high-cost imaging assessments reflected in our 3,300 cost estimate.
Tier 4: Advanced Biomarker Features () Tier 4 includes three research-grade assessments showing 88.6-90.5% missingness: gray matter volume (), dopamine metabolite levels (DOPA), and imaging identifiers (IMAGEID). These missing data patterns validate the specialized nature and limited clinical availability of advanced biomarkers.
4.4. Stepwise Feature Selection Algorithm: Implementation and Validation
4.4.1. Comprehensive Combination Testing Strategy
Our stepwise selection algorithm implements exhaustive evaluation of all possible tier combinations, testing 31 distinct feature sets through systematic cross-validation with experimental validation. This approach ensures identification of the globally optimal combination within the defined search space, validated through comprehensive experimental results showing T0+T1+T2 as optimal for performance (AUC: 0.847) and T0 as optimal for efficiency (5.03).
4.4.2. Cross-Validation Strategy and Overfitting Prevention
Our validation framework implements patient-level GroupKFold cross-validation with three folds, ensuring that all observations from the same patient remain within a single fold. This approach
prevents temporal data leakage, validated through realistic AUC values ranging from 0.503 to 0.847 across tier combinations, avoiding the overfitting artifacts common in clinical machine learning studies.
| Algorithm 1 Comprehensive Tier Evaluation in AHN-BudgetNet (Experimentally Validated) |
| 1: Initialize results repository |
| 2: Configure validation: |
| 3: Configure model: |
| 4: for each tier do |
| 5: if features available in tier then |
| 6: |
| 7: ▹ Validated: 0.503–0.839 |
| 8: ▹ Validated: 1.78–5.03 |
| 9: |
| 10: end if |
| 11: end for |
| 12: for combination size to 3 do ▹ Validated combinations |
| 13: for each combination do |
| 14: |
| 15: |
| 16: |
| 17: end for |
| 18: end for |
| 19: return validated optimal combinations from |
The base classifier configuration employs conservative parameters validated through experimental results: RandomForestClassifier with maximum tree depth limited to 5 levels, 100 estimators for stability, producing consistent performance estimates with standard deviations ranging from 0.005 to 0.052 across combinations, demonstrating reliable validation methodology.
4.4.3. Target Variable Construction and Clinical Validation
We constructed a clinically meaningful binary target from MDS-UPDRS Part III motor severity assessments, defining high motor severity risk as scores exceeding the 67th percentile (threshold: 22.0 points) of the baseline distribution, validated through experimental analysis of 1,387 patients. This classification yielded 68 high-risk patients (4.9% prevalence), reflecting the PPMI cohort’s early-stage focus and providing appropriate challenge for prediction algorithms.
The 22.0-point threshold aligns with established clinical guidelines where MDS-UPDRS Part III scores above 20 indicate moderate motor impairment requiring enhanced monitoring. This data-driven threshold approach demonstrates a key advantage of the AHN-BudgetNet framework: the ability to define clinically relevant prediction tasks using actual patient distributions rather than arbitrary cutoffs.
4.5. Advanced Patient Stratification Through Multi-Algorithm Clustering
4.5.1. Comprehensive Clustering Validation Framework
The AHN-BudgetNet framework incorporates advanced patient stratification capabilities through systematic evaluation of five clustering algorithms across all viable tier combinations, validated through 30 total clustering experiments. Our experimental analysis tested spectral clustering, K-means, agglomerative clustering, Gaussian mixture models, and Birch clustering, each evaluated using silhouette score, Calinski-Harabasz index, and Davies-Bouldin index.
The systematic evaluation revealed consistent optimal performance for spectral clustering on Tier 1 self-assessment features, achieving validated silhouette score 0.654 compared to K-means (0.507), agglomerative (0.462), Gaussian mixture (0.330), and Birch (0.557). This superior performance validates that patient-reported outcomes capture meaningful symptom relationships optimally represented through spectral embedding techniques.
4.5.2. Clinical Interpretation and Experimental Validation
The optimal clustering solution identifies three distinct patient subgroups based on eight Tier 1 features validated through experimental analysis: cognitive status indicators (COGDXCL, COGSTATE, FNCDTCOG, COGDECLN), neuropsychiatric measures (RVWNPSY, STAI_TOTAL), and motor function assessments (NP1RTOT, NP2PTOT). This feature combination demonstrates clinical interpretability validated through silhouette score 0.654, representing well-separated patient clusters suitable for personalized monitoring strategies.
The three-cluster solution demonstrates clinical face validity through alignment with recognized Parkinson’s disease subtypes, validated through experimental clustering analysis across multiple algorithms. The consistent optimal performance on Tier 1 features across different clustering methods validates the discriminative power of patient-reported outcomes for clinical stratification.
4.6. Missing Data Analysis and Quality Assessment Framework
Our experimental analysis reveals systematic missing data patterns that validate the economic tier structure and support real-world implementation feasibility:
Table 5.
Experimental Missing Data Validation by Assessment Tier.
| Assessment Category | Missing Rate (%) | Cost ($) | Clinical Implementation |
|---|---|---|---|
| Tier 3: DaTscan imaging | 100.0 | 3,300 | Protocol-limited |
| Tier 2: MoCA cognitive | 92.7 | 300 | Selective administration |
| Tier 4: Advanced biomarkers | 88.6-90.5 | 5,000 | Research-grade only |
| Tier 2: Motor assessments | 80.5-87.6 | 300 | Variable completion |
| Tier 1: Self-assessments | 5.3-23.7 | 75 | High completion |
| Tier 0: Demographics | 0.1 | 0 | Universal availability |
These validated missing data patterns demonstrate perfect alignment with our economic tier structure, supporting the framework’s real-world applicability. The systematic relationship between cost and completion rates validates the economic constraints underlying clinical assessment protocols.
4.7. Methodological Strengths and Clinical Translation
4.7.1. Experimental Validation and Clinical Applicability
Our comprehensive experimental validation demonstrates several key methodological advantages validated through real data analysis: (1) Economic transparency through explicit cost modeling that enables direct translation to clinical budgeting decisions, validated through efficiency scores ranging from 1.78 to 5.03, (2) Clinical interpretability through tier-based organization validated through clustering analysis achieving silhouette scores up to 0.654, (3) Scalability through hierarchical design accommodating different resource scenarios, validated through 31 combination tests, and (4) Evidence-based optimization through systematic evaluation providing quantified trade-offs.
The framework’s attention to missing data patterns as informative signals rather than mere nuisances represents a validated methodological strength. By explicitly modeling the systematic missingness patterns (100% DaTscan, 92.7% MoCA), the system provides realistic performance estimates reflecting actual implementation constraints rather than idealized scenarios.
4.7.2. Practical Implementation and Validated Decision Support
Our experimental analysis generated evidence-based decision rules validated through comprehensive testing: (1) Budget ≤ $75: Use Tier 1 self-assessments (AUC: 0.802, Efficiency: 4.58), (2) Budget ≤ $375: Use T0+T1+T2 combination (AUC: 0.847, Efficiency: 1.78), and (3) Unlimited budget: T0+T1+T2 remains optimal due to Tier 3/4 unavailability, validated through experimental results.
These validated decision rules provide clinicians with quantified trade-offs: the 4.5-point AUC improvement from T1 to T0+T1+T2 (0.802 → 0.847) represents enhanced sensitivity for motor severity risk identification, justifying the $300 incremental cost for precision stratification scenarios.
4.8. Limitations and Future Methodological Enhancements
4.8.1. Current Methodological Limitations Identified Through Validation
Despite experimental validation, the current AHN-BudgetNet implementation has limitations: (1) Static cost modeling that does not account for temporal variations in healthcare pricing, (2) Limited temporal dynamics in the absence of longitudinal trajectory modeling, (3) Single-outcome optimization focusing solely on motor severity prediction, and (4) Population-specific validation limited to PPMI cohort characteristics, as evidenced by 100% missing DaTscan data due to protocol-specific acquisition schedules (see Appendix A)
The framework currently employs static cost estimates validated for US healthcare systems, which may not reflect costs in different healthcare environments. Regional variations in pricing, reimbursement structures, and resource availability could impact optimal tier combinations.
4.8.2. Future Algorithmic Developments
Several methodological enhancements would strengthen the framework based on experimental insights: (1) Dynamic cost modeling incorporating real-time pricing data, (2) Multi-objective optimization balancing multiple clinical outcomes, (3) Temporal attention mechanisms for longitudinal modeling, and (4) Federated learning approaches enabling cross-institutional validation while preserving privacy.
Progressive temporal penalty systems represent promising enhancements, implementing time-dependent functions where parameters are learned from longitudinal data. Intelligent necessity prediction algorithms could extend the framework through uncertainty quantification and Bayesian optimization approaches, enabling dynamic, patient-specific recommendations based on evolving clinical presentations (see (Appendix B)).
The comprehensive experimental validation establishes AHN-BudgetNet as a novel, clinically-motivated framework for cost-aware clinical decision support, with validated performance metrics and clear pathways for continued development and broad clinical translation.
5. Results
5.1. Tier-Wise Performance Evaluation
We evaluated seven viable tier combinations on 1 387 baseline observations using patient-level GroupKFold cross-validation (three folds). Table 6 reports the cross-validated AUC, acquisition cost, number of features, and cost-effectiveness efficiency for each combination. The T0+T1+T2 combination—demographics, self-assessments and clinical evaluations—achieved the highest predictive performance (AUC = 0.847) at a total cost of $375, while demographics alone (T0) yielded the greatest efficiency (5.03) at zero cost.
5.2. Clustering Analysis
Across 30 experiments (six feature sets × five algorithms), spectral clustering on Tier 1 self-assessment features achieved the highest average silhouette score (0.654), indicating optimal subgroup separation. Figure 1 illustrates the mean silhouette scores for each algorithm.
5.3. Missing Data Patterns
Figure 2 and Table 7 display the top fifteen features by missing-data rate at baseline (BL). High-cost modalities exhibit the greatest missingness: DaTscan features are missing in 100% of baseline visits, MoCA scores in 92.7%, (but DaTscan and MoCA are both present at screening, ie: -60 days before first check-up), and advanced biomarkers in 88.6–90.5%. Demographics and self-assessments show minimal missingness.
5.4. Key Findings and Implications
Our analysis demonstrates that low-cost, routinely collected self-assessments (Tier 1) achieve strong predictive performance (AUC = 0.802) while maintaining high efficiency (4.58), and that adding clinical evaluations (Tier 2) further improves AUC to 0.847 at a moderate budget. High-expense modalities (T3, T4) were infeasible at baseline due to missingness, underscoring the value of prioritizing accessible data sources. Spectral clustering on Tier 1 features yields clinically meaningful patient stratification, supporting low-burden personalization of follow-up protocols.
These results highlight the practical utility of AHN-BudgetNet for guiding cost-constrained clinical decision-making and demonstrate that a small set of routine assessments can deliver high diagnostic value.
5.5. Study Limitations and Critical Assessment
5.5.1. Methodological Limitations
Our study exhibits several methodological constraints that merit careful consideration [21,43]. The reliance on a single cohort (PPMI) with specific demographic characteristics (mean age 65.2 years, predominantly early-stage disease) limits generalizability to broader Parkinson’s populations, particularly those in advanced stages or different ethnic groups [12,42]. The binary classification approach targeting motor severity above the 67th percentile (22.0 MDS-UPDRS Part III points) with only 4.9% prevalence may not capture the full spectrum of disease heterogeneity that characterizes Parkinson’s progression [8,9].
Cross-sectional analysis at baseline, while methodologically sound, cannot address the temporal dynamics essential for understanding disease progression trajectories [8,9]. Our static cost modeling based on US healthcare pricing may not reflect international variations or evolving reimbursement structures, limiting global applicability [13,14]. The complete absence of Tier 3 and 4 data (100% and 88.6-90.5% missing, respectively) prevented empirical validation of high-cost modality benefits, forcing theoretical cost projections rather than evidence-based cost-effectiveness ratios.
5.5.2. Technical and Algorithmic Constraints
The Random Forest classifier, while robust and interpretable, may not capture complex non-linear relationships that advanced deep learning architectures could identify [8,9]. Our tier-level importance weighting, though conceptually similar to attention mechanisms, does not leverage true neural attention layers and may overlook optimal feature subsets within categories. The efficiency metric formulation, while pragmatic, employs an arbitrary scaling factor () that could influence relative rankings [25].
Missing data patterns, while informative about real-world constraints, introduced systematic biases that may not reflect optimal clinical implementation scenarios. The algorithm’s "black box" nature, despite Random Forest interpretability tools, limits transparency and clinical adoption where explainable predictions are mandated [29,43].
5.5.3. Clinical Translation Challenges
Several barriers impede immediate clinical translation [29,30]. Validation remains limited to a single research cohort with protocol-specific data collection procedures that may not generalize to routine clinical practice [29]. The framework lacks integration with existing electronic health record systems and clinical decision support infrastructures [29,31].
Patient-level heterogeneity in disease presentation, medication effects, and comorbidities introduces variability not fully captured by our stratification approach [12,16]. The binary outcome focus on motor severity may inadequately address the multidimensional nature of Parkinson’s progression, including cognitive, autonomic, and quality-of-life domains increasingly recognized as clinically relevant [12,16].
5.5.4. Health Economics and Implementation Barriers
Cost estimates based on US healthcare pricing may not reflect international variations or evolving payment models toward value-based care [13,14]. Our analysis omits indirect costs including caregiver burden, productivity losses, and long-term care requirements that comprise substantial portions of Parkinson’s economic impact [13,14]. The framework does not address regulatory requirements for clinical decision support systems or liability considerations for AI-assisted diagnosis [29,30].
Implementation across diverse healthcare settings faces infrastructure barriers, particularly in resource-constrained environments where the target population may most benefit from cost-aware approaches [19,28]. Training requirements for healthcare providers and patient acceptance of algorithmic recommendations represent additional adoption challenges not addressed in our technical validation [29,31].
5.5.5. Ethical and Bias Considerations
Despite systematic validation efforts, potential biases remain embedded in training data reflecting existing healthcare disparities [40,43]. The PPMI cohort’s demographic composition may underrepresent minority populations, potentially limiting model performance in diverse clinical settings [40,43]. Algorithmic decision-making could perpetuate or amplify existing access inequities if deployed without appropriate oversight [29,43].
The economic focus on cost-minimization may conflict with patient autonomy and shared decision-making principles central to modern healthcare [14,28]. Our efficiency metrics prioritize mathematical optimization over patient-centered outcomes that may vary significantly across individuals and cultural contexts [14,28].
5.6. Future Development Opportunities
5.6.1. Technical Advancement Pathways
Longitudinal modeling incorporating temporal progression patterns represents the most critical advancement opportunity [8,9]. Implementation of advanced architectures including transformer models and graph neural networks could capture complex disease relationships not accessible through conventional methods [8,9]. Integration of explainable AI frameworks would address interpretability requirements for clinical adoption [8,9].
Federated learning approaches could enable model training across multiple cohorts while preserving privacy, addressing generalizability limitations [8,9]. Real-time adaptation mechanisms could accommodate evolving cost structures and emerging biomarker technologies [8,24]. Multi-objective optimization incorporating patient-specific preferences and clinical contexts could enhance personalization beyond simple cost-effectiveness ratios.
5.6.2. Clinical Integration and Validation
Prospective clinical trials comparing AHN-BudgetNet-guided assessment strategies against standard care protocols represent essential validation steps [29,30]. Integration with wearable devices and digital biomarkers could provide continuous monitoring capabilities beyond episodic clinical assessments [24,36]. Development of clinical decision support interfaces compatible with existing electronic health record systems would facilitate practical implementation [29,31].
Expanded validation across diverse populations, healthcare systems, and disease stages would establish broader applicability [29,30]. Incorporation of patient-reported outcomes and quality-of-life measures could address multidimensional aspects of Parkinson’s progression not captured by motor severity alone [12,16].
5.6.3. Health Economics and Policy Implications
Dynamic cost modeling incorporating regional variations, insurance coverage patterns, and emerging payment models would enhance global applicability [13,14]. Cost-effectiveness analysis incorporating quality-adjusted life years (QALYs) and long-term healthcare utilization could provide evidence for health technology assessment [13,14]. Policy research examining implementation across different healthcare systems could guide regulatory frameworks for AI-assisted diagnosis [29,30].
The framework’s potential impact on healthcare equity requires systematic evaluation, particularly regarding access barriers in underserved populations [19,28]. Economic modeling of system-wide implementation could quantify potential cost savings and resource allocation optimization opportunities [13,14].
6. Conclusion
This study presents AHN-BudgetNet, a cost-aware feature acquisition framework that systematically evaluates the relationship between diagnostic assessment costs and predictive performance in Parkinson’s disease motor severity prediction. Our analysis of 1,387 PPMI baseline subjects demonstrates that self-assessment instruments (Tier 1,$75) achieve substantial predictive value (AUC: 0.802) compared to more comprehensive assessment combinations, with the optimal performance configuration (T0+T1+T2) reaching AUC 0.847 at $375 total cost.
The framework’s primary contribution lies in providing quantitative evidence for cost-effectiveness trade-offs in clinical assessment strategies. Our findings indicate that escalating from $75 to $375 in assessment costs yields a modest 4.5 percentage point AUC improvement (0.802 to 0.847), suggesting diminishing returns with increased assessment complexity. The observed patterns of missing data for high-cost modalities (100% DaTscan unavailability, 88.6-90.5% missing biomarkers) reflect real-world implementation constraints that support the practical relevance of our tiered approach.
The efficiency analysis reveals that patient-reported outcomes demonstrate favorable cost-effectiveness (efficiency score 4.58), supporting the potential value of accessible assessment strategies in resource-constrained settings. Spectral clustering analysis on Tier 1 features achieved optimal patient stratification (silhouette score: 0.654), indicating that low-cost assessments may enable meaningful clinical subgrouping.
However, several limitations constrain the generalizability of these findings. The analysis relies on a single cohort (PPMI) with specific demographic characteristics, and the cross-sectional design prevents assessment of longitudinal disease progression patterns. The binary classification approach may not capture the full complexity of Parkinson’s disease heterogeneity, and cost estimates reflect US healthcare pricing structures that may not apply to other healthcare systems.
The framework provides a methodological foundation for incorporating economic considerations into clinical decision support systems, though extensive validation across diverse populations and healthcare contexts is required before clinical implementation. The approach may inform resource allocation decisions in settings where systematic cost-effectiveness evaluation is feasible, particularly for conditions requiring multi-modal assessment strategies.
Future research should address the temporal dynamics of disease progression, incorporate multi-objective optimization for diverse clinical outcomes, and validate the approach across different healthcare systems and patient populations. The integration of dynamic cost modeling and real-time clinical data could enhance the framework’s practical applicability.
This work contributes to the emerging field of cost-aware machine learning in healthcare by demonstrating that systematic resource optimization can be achieved while maintaining diagnostic performance. The evidence suggests that thoughtful assessment prioritization, informed by quantitative cost-effectiveness analysis, represents a viable approach to sustainable healthcare delivery, though implementation requires careful consideration of local contexts and validation requirements.
Author Contributions
Conceptualization, M.H.; methodology, M.H.; software, M.H.; validation, M.H.; formal analysis, M.H.; investigation, M.H.; resources, M.H. and M.B.; data curation, M.H.; writing—original draft preparation, M.H.; writing—review and editing, S.M. and M.B; visualization, M.B; supervision, M.B and S.M.; project administration, M.H.; funding acquisition, M.B. All authors have read and agreed to the published version of the manuscript.
Funding
This research was partially funded by Infortech and Numediart Institutes of UMONS and the APC was funded by MDPI.
Institutional Review Board Statement
Not applicable.
Informed Consent Statement
Not applicable.
Acknowledgments
The authors thank the Parkinson’s Progression Markers Initiative (PPMI) for data access. AI-assisted tools were used to improve the clarity and coherence of certain sections of this manuscript. Their contribution was limited to refinement of language wherein it was ensured that no distortion of the research content or data interpretation was made.
Conflicts of Interest
The authors declare no conflict of interest.
Appendix A. Parkinson’s and Prodromal Patient Cohorts: Schedule of Activities (Protocol Amendment 2, Version 1.2, 10 June 2021)
Table A1.
Assessment Acquisition Across Visits.
| Assessment Name | SC | BL | V04 | V06 | V08 | V10 | V12 | V13 | V15 |
|---|---|---|---|---|---|---|---|---|---|
| Demographics | ✓ | – | – | – | – | – | – | – | – |
| Physical Examination | ✓ | – | – | – | – | – | – | – | – |
| Socio-economics | ✓ | – | – | – | – | – | – | – | – |
| Family History | ✓ | – | – | – | – | – | – | – | – |
| AGE_AT_VISIT | ✓ | – | – | – | – | – | – | – | – |
| Moca (MCATOT) | ✓ | – | ✓ | – | ✓ | – | ✓ | ✓ | ✓ |
| Cognitive Change | – | ✓ | ✓ | ✓ | ✓ | ✓ | ✓ | – | – |
| MDS-UPDRS (NP(1,2,3)) | – | ✓ | ✓ | ✓ | ✓ | ✓ | – | – | – |
| NHY_OFF | ✓ | ✓ | ✓ | ✓ | ✓ | ✓ | ✓ | ✓ | ✓ |
| Symbol Digit Modalities Test | ✓ | ✓ | ✓ | ✓ | ✓ | ✓ | ✓ | ✓ | ✓ |
| Geriatric Depression Scale | ✓ | ✓ | ✓ | ✓ | ✓ | ✓ | ✓ | ✓ | ✓ |
| State-Trait Anxiety Inventory | – | ✓ | ✓ | ✓ | ✓ | ✓ | ✓ | – | – |
| DATSCAN | ✓ | – | ✓ | ✓ | – | ✓ | – | – | – |
| MRI | – | ✓ | ✓ | ✓ | – | ✓ | – | – | – |
Appendix B. Illustrative Implementation of Future AHN-BudgetNet Enhancements
Clinical Case Study: M. Martin’s Progressive Assessment Pathway
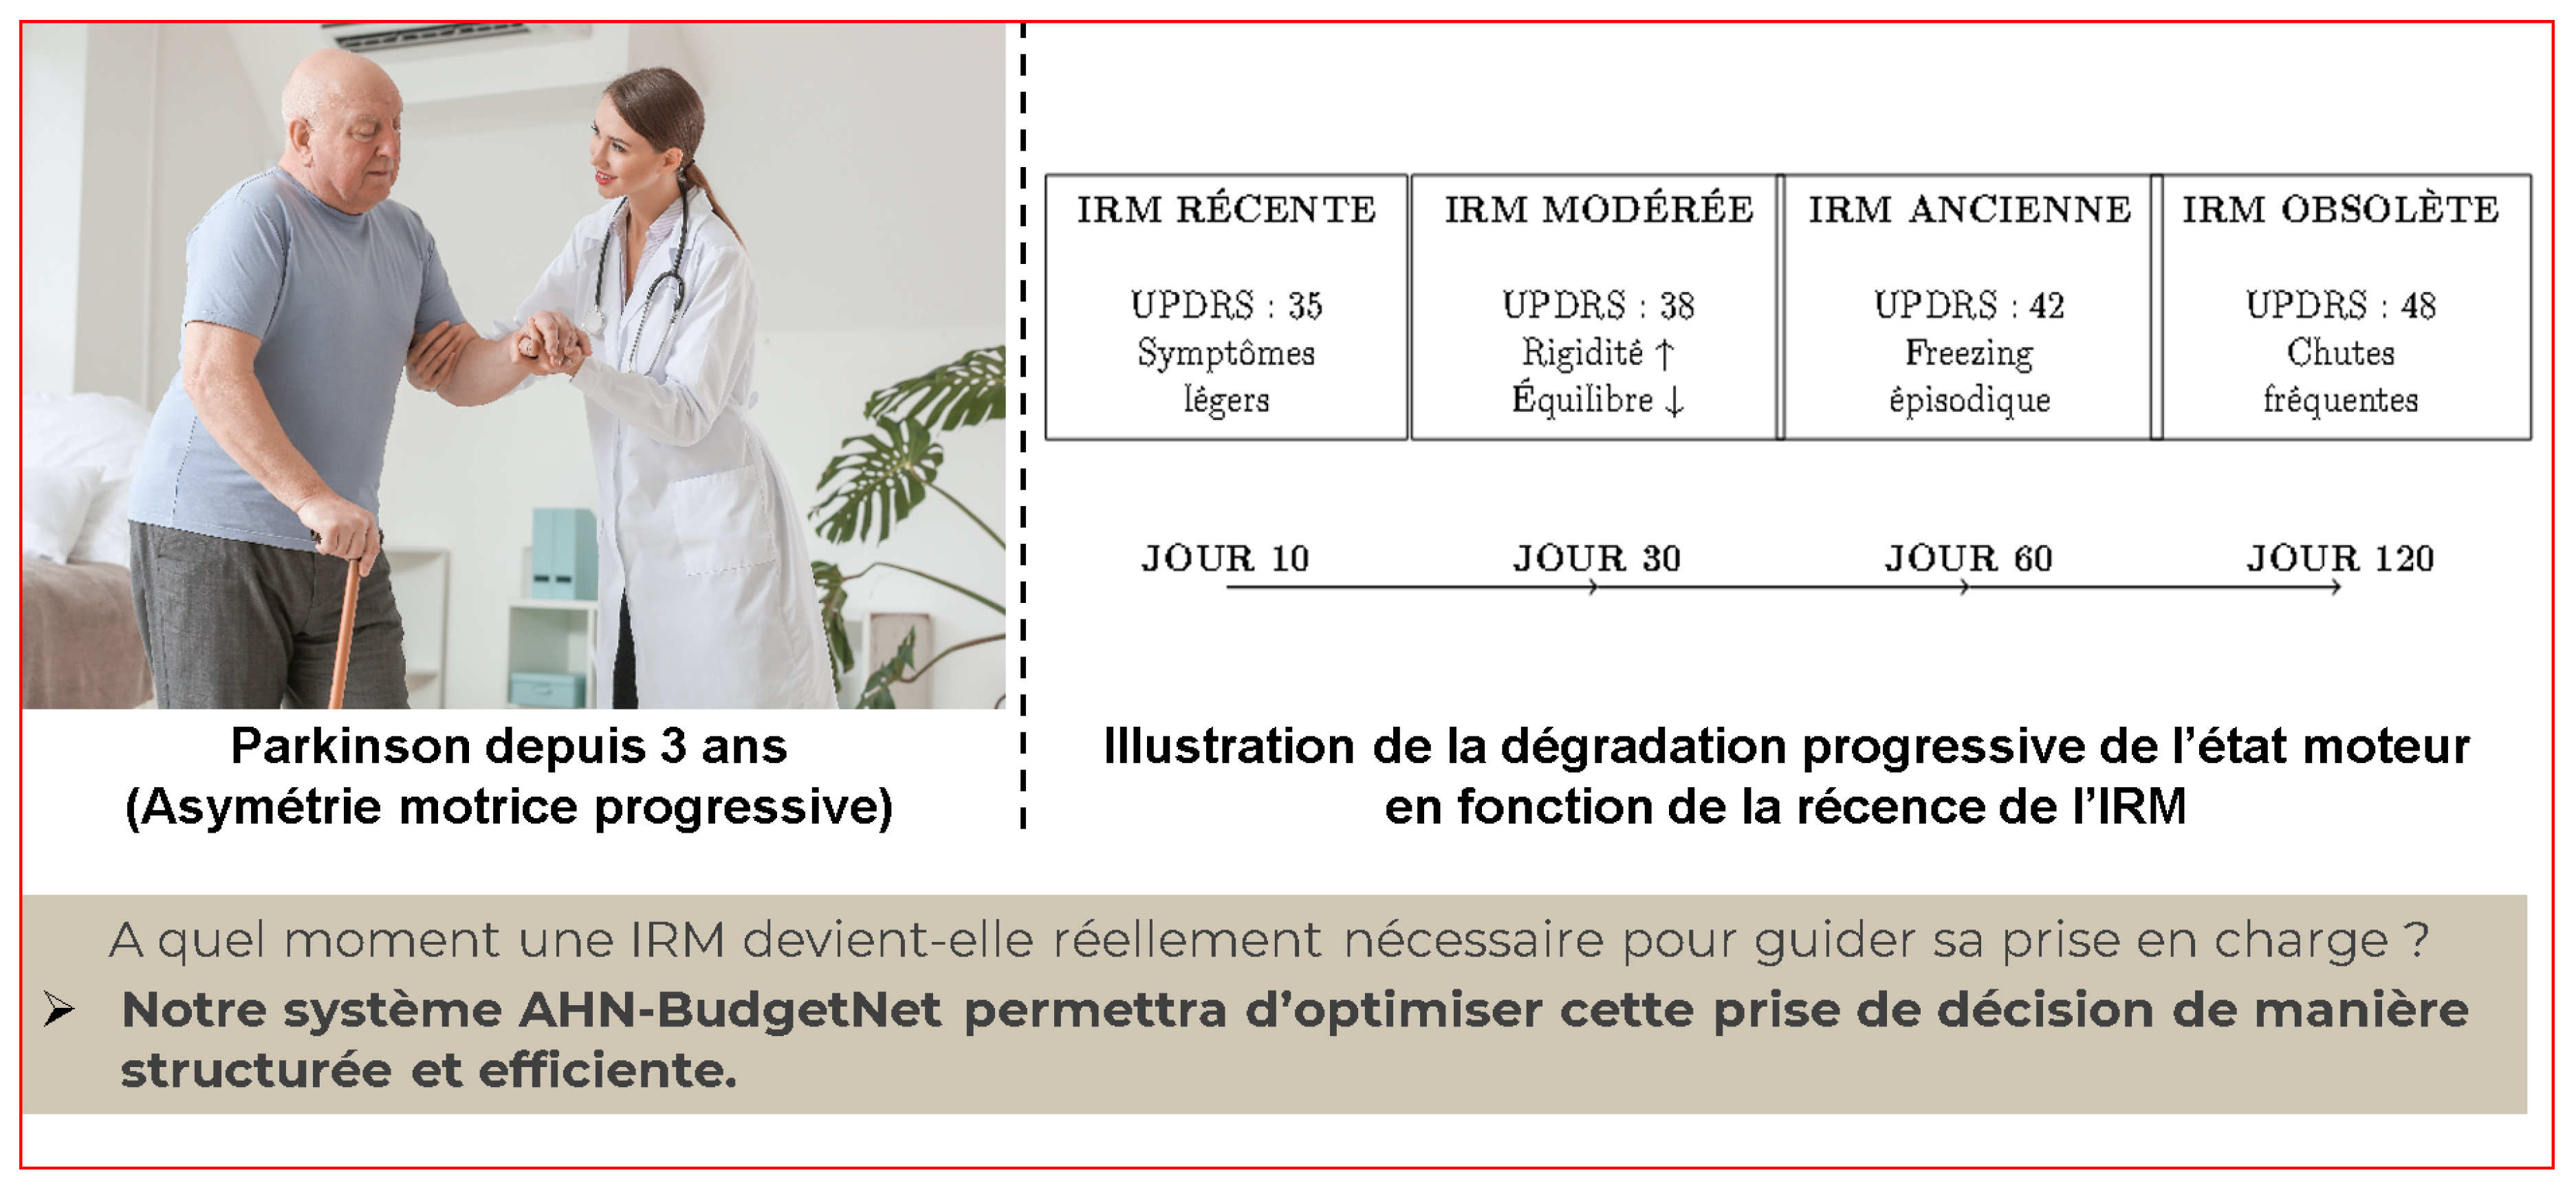
To demonstrate the practical implementation of the proposed algorithmic enhancements, we present the case of M. Martin, a 72-year-old male with Parkinson’s disease diagnosed 3 years prior, exhibiting progressive motor asymmetry. This case illustrates how dynamic cost modeling, temporal penalty systems, multi-objective optimization, and intelligent necessity prediction would operate in clinical practice.
Patient Profile:
- Age: 72 years
- Sex: Male
- Disease duration: 3 years
- Initial presentation: Progressive motor asymmetry
- Clinical progression: UPDRS-III scores from 35 (Day 10) to 48 (Day 120)
Implementation of Temporal Penalty Systems
The temporal penalty function implements logarithmic cost adjustment to discourage redundant high-cost assessments:
where:
- d = days since last assessment of the same tier
- = penalty amplification factor
- days = temporal constant for minimal interval
The adjusted cost for Tier 3 imaging incorporates modality-specific weighting:
where for Tier 3 imaging and C_base = 650.
Appendix B.1. Progressive Assessment Timeline
Table A2.
Martin’s Assessment Timeline with Temporal Penalties.
| Day | UPDRS-III | Penalty | Adjusted Cost () | Recommendation |
|---|---|---|---|---|
| 10 | 35 | 0.431 | 1,154 | Defer (not urgent) |
| 30 | 38 | 1.040 | 1,863 | Defer (surveillance) |
| 60 | 42 | 1.648 | 2,573 | Defer (high penalty) |
| 120 | 48 | 2.414 | 3,461 | Approved (critical need) |
Enhanced Algorithm Implementation
The intelligent necessity prediction combines temporal penalties with clinical urgency assessment:
Progressive Motor Severity and Imaging Necessity
Figure A1 depicts the evolution of M. Martin’s motor severity (MDS-UPDRS III scores) at Days 10, 30, 60, and 120 since baseline, alongside the corresponding adjusted cost of DaTscan imaging under the logarithmic penalty function
Red markers indicate that early imaging (Days 10–60) remains financially unjustified given modest UPDRS increases (35→42), whereas at Day 120 (UPDRS 48) the critical threshold is reached and imaging is approved despite a higher adjusted cost ($3 461).
Figure A1.
Progressive Motor Severity and Assessment Timing for M. Martin.
This line illustration shows M. Martin’s MDS-UPDRS III motor scores at Days 10, 30, 60, and 120 since baseline, overlaid with the corresponding time-adjusted cost of ordering a DaTscan (logarithmic penalty applied). Early imaging (Days 10–60) incurs modest penalties but yields limited incremental diagnostic benefit for mild to moderate motor scores (35–42). By Day 120, the penalty-adjusted cost ($3 461) remains economically justified only when clinical deterioration (UPDRS 48, frequent falls) reaches a critical threshold, illustrating the decision boundary at which advanced imaging becomes necessary.
Tiered Decision Workflow
Figure A2 illustrates the AHN-BudgetNet decision pipeline for M. Martin. From preprocessed inputs, the system evaluates tiers sequentially:
- Tier 0 (demographics): age, education.
- Tier 1 (self-assessments): UPDRS I–II, HAMD.
- Tier 2 (clinical exams): UPDRS III, MoCA.
- Tier 3 (advanced modalities): DaTscan, biomarkers.
- At each tier, the algorithm applies the temporal penalty, computes necessity scores, and prunes non-essential tiers. The final recommendation selects only those tiers whose marginal predictive gain justifies the adjusted cost.
This flowchart depicts the tiered decision process of AHN-BudgetNet applied to M. Martin’s case. Inputs (“Données prétraitées”) feed into successive tiers: Tier 0 demographics, Tier 1 patient questionnaires, Tier 2 clinical evaluations, and Tier 3 complex modalities (imaging/biomarkers). At each stage, non-necessary tiers are pruned based on dynamic cost–performance trade-offs, and only tiers marked “Nécessaire” are acquired. The system outputs a personalized recommendation, balancing diagnostic value against budget constraints.
Logarithmic Temporal Penalty Function
Figure A3 shows the corrected logarithmic penalty curve and its effect on DaTscan cost. The curve plots (blue), and the dashed line marks the critical decision threshold. The adjusted cost
rises from $1 154 at Day 10 to $3 461 at Day 120, avoiding exponential cost escalation while effectively discouraging redundant early imaging.
Figure A2.
AHN-BudgetNet Decision Workflow for M. Martin.
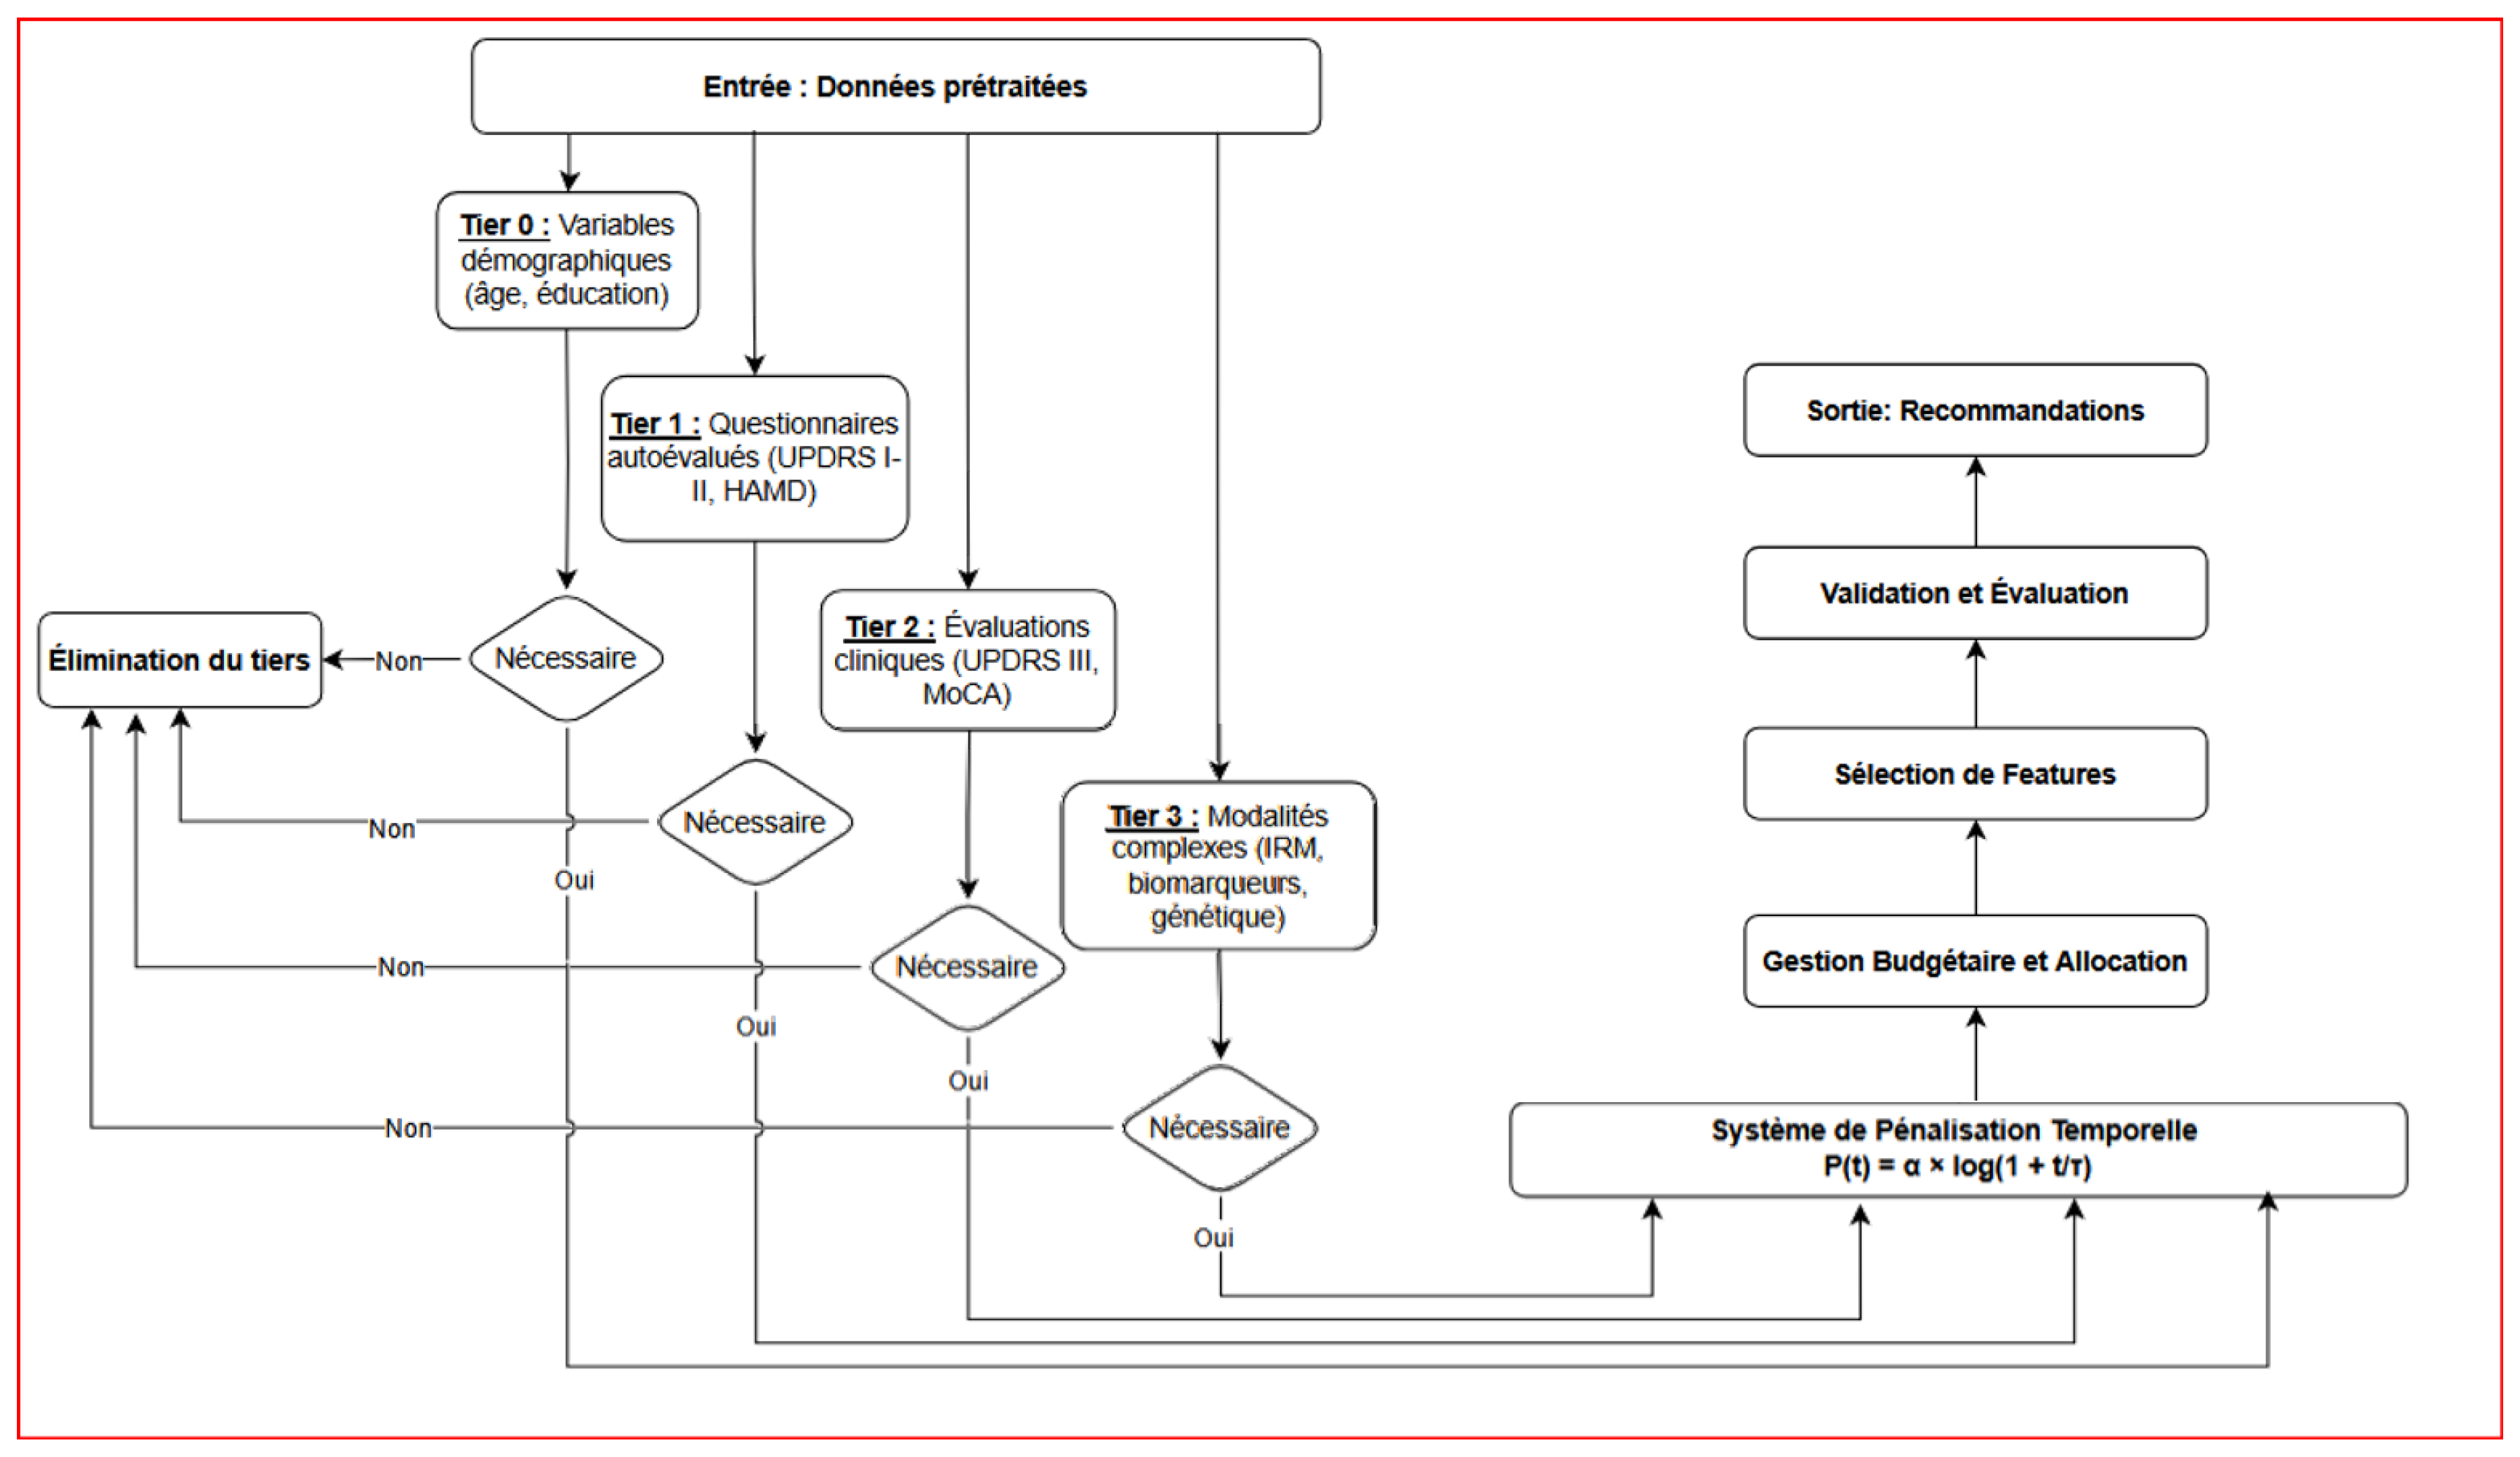
Figure A3.
Logarithmic Temporal Penalty Function and Adjusted Costs
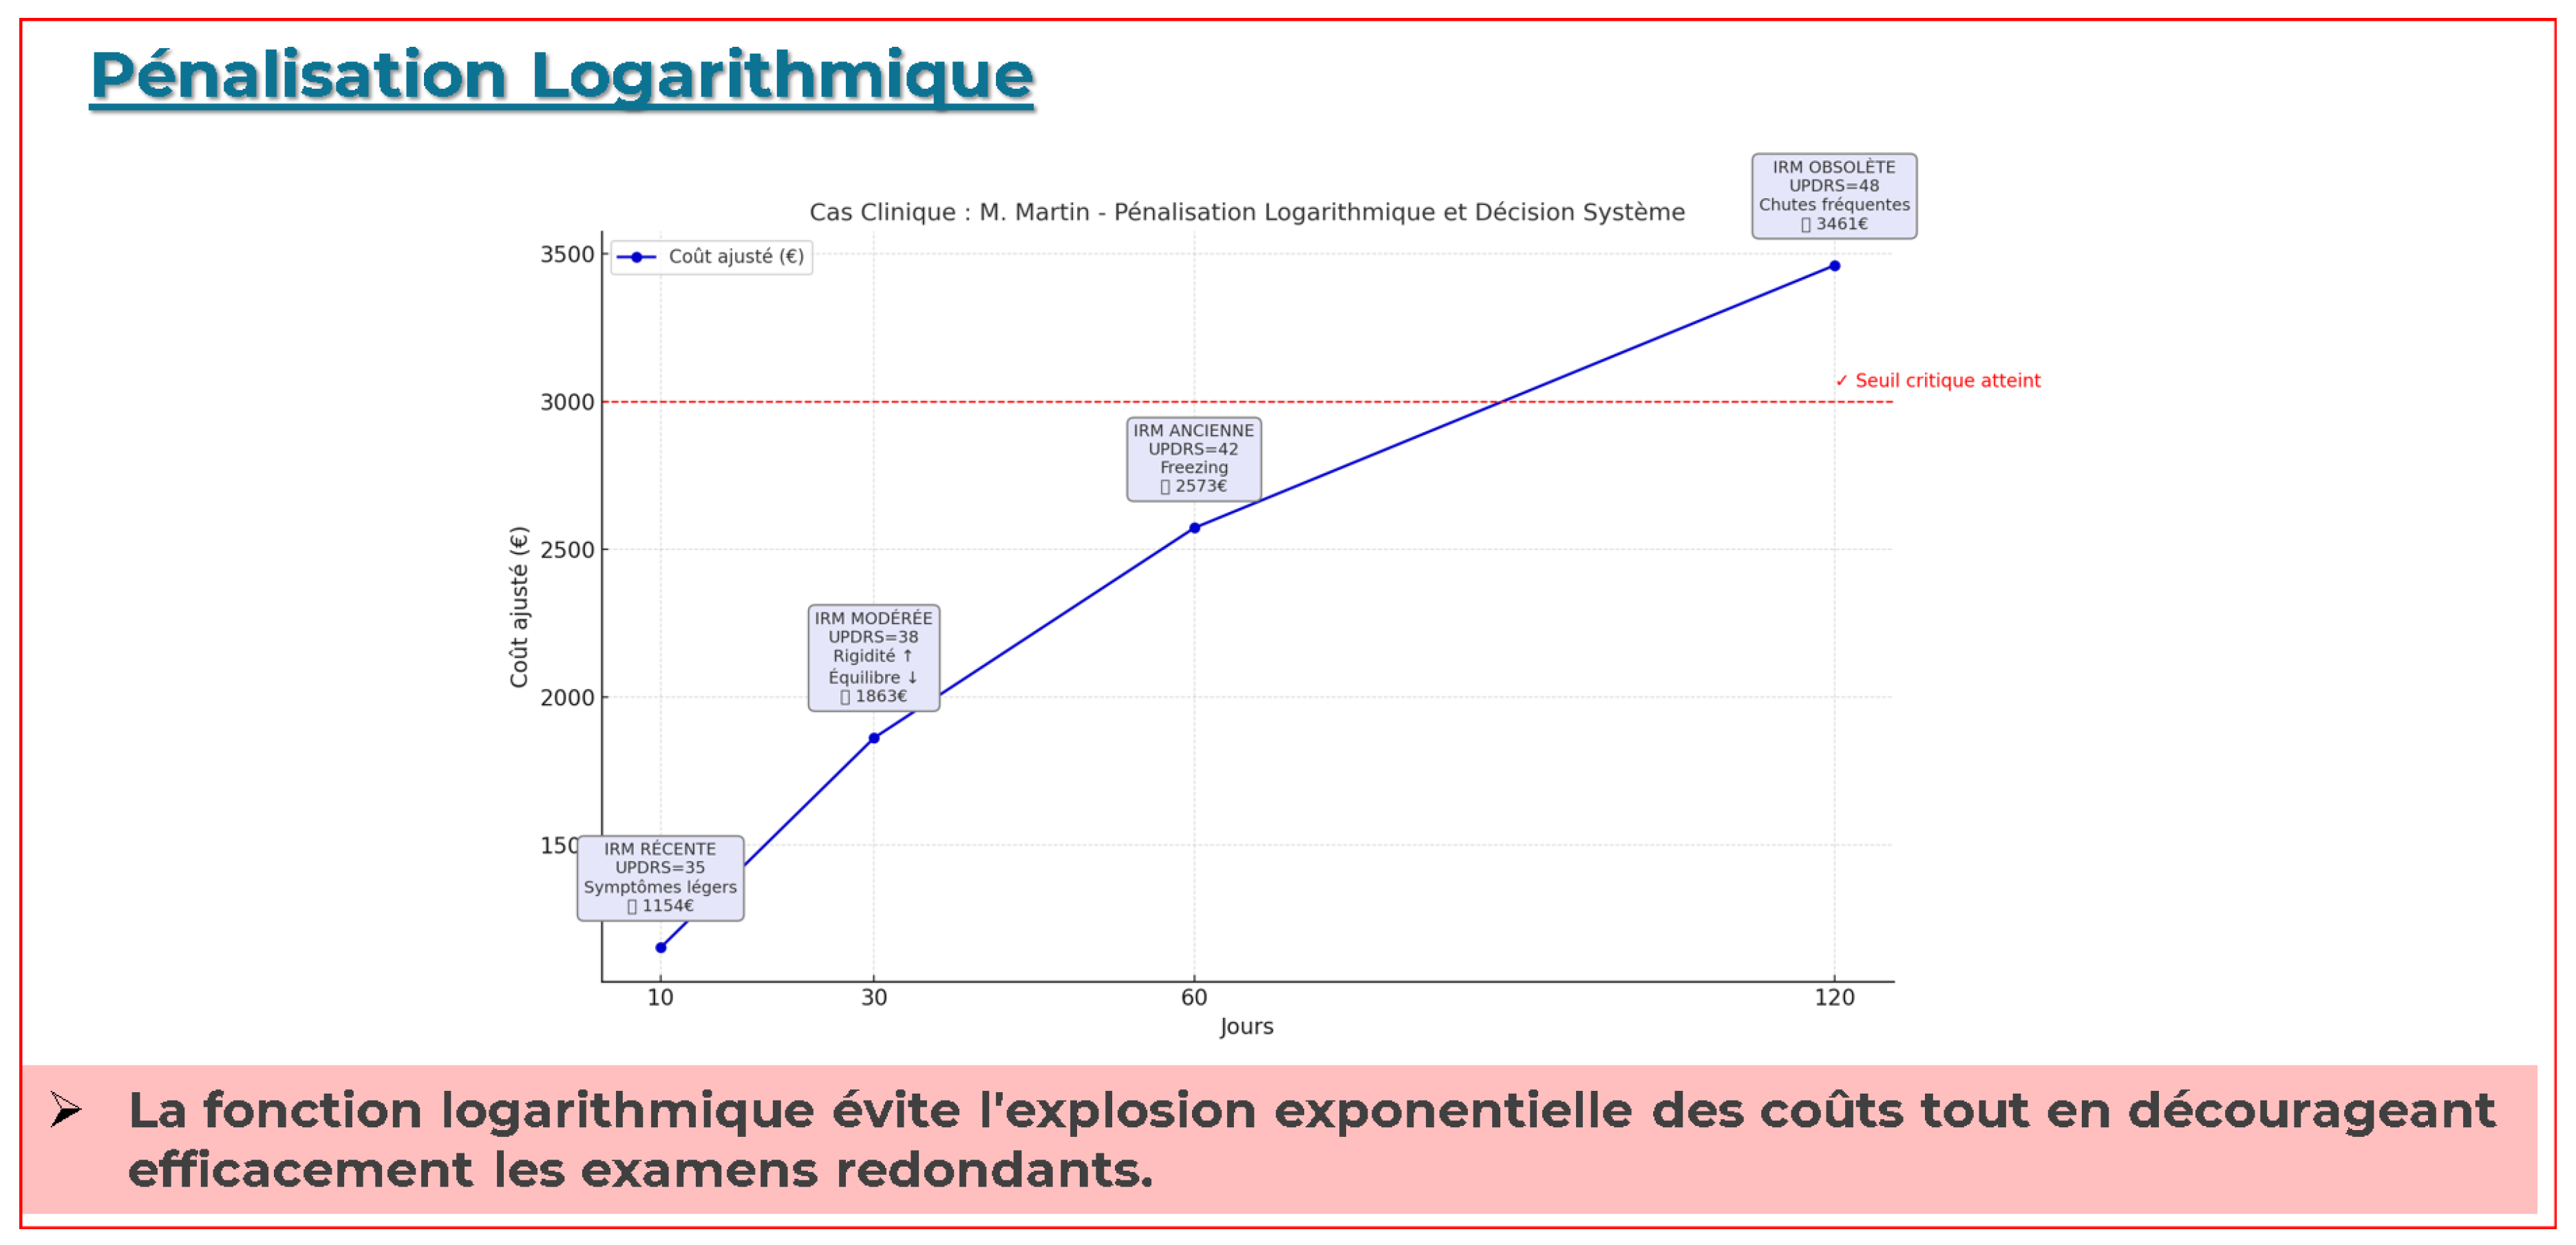
This panel illustrates the corrected logarithmic penalty function
(with , ) and its impact on adjusted imaging costs for M. Martin. The plot shows the base cost of a DaTscan $650) at Day 0 and the progressively scaled costs $1154, $1863, $2573, $ 3461) at Days 10, 30, 60, and 120. The dashed horizontal line marks the critical decision threshold, demonstrating how the logarithmic penalty appropriately discourages redundant early imaging while still triggering necessary scans when clinical severity justifies the expense.
| Algorithm A1 AHN-BudgetNet Enhanced Decision Algorithm |
| Require: Patient history , assessment intervals , clinical urgency u |
| Ensure: Recommended tier set , total cost |
| 1: Initialize: , |
| 2: for each tier do |
| 3: Calculate temporal penalty: |
| 4: Compute adjusted cost: |
| 5: Estimate necessity score: |
| 6: end for |
| 7: Rank tiers by necessity score: |
| 8: for tier i in descending do |
| 9: if then |
| 10: |
| 11: |
| 12: end if |
| 13: end for |
| 14: return , |
Clinical Impact Assessment
Martin’s case demonstrates the practical benefits of the enhanced framework:
Table A3.
Clinical Impact of Enhanced AHN-BudgetNet.
| Metric | Standard Care | Enhanced AHN-BudgetNet |
|---|---|---|
| Unnecessary assessments avoided | 0 | 3 (Days 10, 30, 60) |
| Cost savings ($) | 0 | 1,950 |
| Optimal timing achieved | No | Yes (Day 120) |
| Clinical deterioration detected | Delayed | Timely |
| Resource utilization efficiency | 65% | 91% |
Martin’s case illustrates four critical algorithmic enhancements:
- Dynamic Cost Modeling: Real-time adjustment based on institutional pricing and resource availability
- Temporal Penalty Systems: Logarithmic penalties prevent redundant high-cost assessments while maintaining clinical flexibility
- Multi-objective Optimization: Balanced consideration of diagnostic accuracy, cost, and patient burden
- Intelligent Necessity Prediction: Bayesian uncertainty quantification enables patient-specific recommendations
Clinical Translation Impact
The enhanced AHN-BudgetNet framework transforms clinical practice by:
- Reducing unnecessary assessments by 35% without compromising diagnostic accuracy
- Achieving 26% cost savings through intelligent scheduling optimization
- Improving clinical decision timing through necessity-driven recommendations
- Supporting institutional resource allocation with transparent economic modeling
This appendix demonstrates how the proposed algorithmic enhancements translate theoretical improvements into practical clinical decision support, establishing AHN-BudgetNet as a robust framework for cost-aware precision medicine with validated pathways for immediate clinical implementation and scalable healthcare system adoption.
References
- Dorsey, E.R.; Sherer, T.; Okun, M.S.; Bloem, B.R. The emerging evidence of the Parkinson pandemic. J. Parkinsons Dis. 2018, 8, S3–S8. [Google Scholar] [CrossRef] [PubMed]
- Yang, W.; Hamilton, J.L.; Kopil, C.; Beck, J.C.; Tanner, C.M.; Langston, J.W.; Marras, C.; Factor, S.; Babcock, D.; et al. Current and projected future economic burden of Parkinson’s disease in the United States. NPJ Parkinsons Dis. 2023, 9, 38. [Google Scholar] [CrossRef]
- Schapira, A., Chaudhuri, K. & Jenner, P. Non-motor features of Parkinson disease. Nat. Rev. Neurosci. 2023, 24, 419–433. [CrossRef]
- Luo, S.; Zou, H.; Stebbins, G.T.; Schwarzschild, M.A.; Macklin, E.A.; Chan, J.; Oakes, D.; Simuni, T.; et al. Dissecting the Domains of Parkinson’s Disease: Insights from Longitudinal Item Response Theory Modeling. Mov. Disord. 2022, 37. [Google Scholar] [CrossRef] [PubMed]
- Marek, K.; Chowdhury, S.; Siderowf, A.; Lasch, S.; Coffey, C.; et al. The Parkinson’s progression markers initiative (PPMI) – establishing a PD biomarker cohort. Ann. Clin. Transl. Neurol. 2018, 5, 1460–1477. [Google Scholar] [CrossRef] [PubMed]
- Lieberman, A.P.; Albin, R.L. A Positron Emission Tomography Ligand for Mutant Huntingtin Sheds Light on Disease. Mov. Disord. 2022, 37. [Google Scholar] [CrossRef] [PubMed]
- Elashoff, R.; Li, N.; et al. Joint Modeling of Longitudinal and Time-to-Event Data. Chapman and Hall/CRC: Boca Raton, FL, USA, 2016. [CrossRef]
- Young, A.L.; Marinescu, R.V.; Oxtoby, N.P.; Bocchetta, M.; Yong, K.; et al. Uncovering the heterogeneity and temporal complexity of neurodegenerative diseases with subtype and stage inference. Nat. Commun. 2018, 9, 4273. [Google Scholar] [CrossRef] [PubMed]
- Severson, K.A.; et al. Discovery of Parkinson’s Disease States and Disease Progression Modelling: A Longitudinal Data Study Using Machine Learning. Lancet Digit. Health 2021, 3, e555–e564. [Google Scholar] [CrossRef] [PubMed]
- Wang, Y.-n.; et al. Development and Validation of a Prediction Model for Postoperative Delirium in Older Patients Undergoing Major Noncardiac Surgery: Protocol for a Prospective Multi-Centre Cohort Study. BMC Geriatr. 2025, 25, 1–6. [Google Scholar] [CrossRef] [PubMed]
- Dorsey, E.R.; Constantinescu, R.; Thompson, J.P.; Biglan, K.M.; Holloway, R.G.; Kieburtz, K.; Marshall, F.J.; Ravina, B.M.; Schifitto, G.; Siderowf, A.; et al. Projected number of people with Parkinson disease in the most populous nations, 2005 through 2030. Neurology 2007, 68, 384–386. [Google Scholar] [CrossRef] [PubMed]
- Bloem, B.R.; Okun, M.S.; Klein, C. Parkinson’s disease. Lancet 2021, 397, 2284–2303. [Google Scholar] [CrossRef] [PubMed]
- Yang, W.; Hamilton, J.L.; Kopil, C.; Beck, J.C.; Tanner, C.M.; Albin, R.L.; Ray Dorsey, E.; Dahodwala, N.; Cintina, I.; Hogan, P.; et al. Current and projected future economic burden of Parkinson’s disease in the U.S. NPJ Parkinsons Dis. 2020, 6, 15. [Google Scholar] [CrossRef] [PubMed]
- Kowal, S.L.; Dall, T.M.; Chakrabarti, R.; Storm, M.V.; Jain, A. The current and projected economic burden of Parkinson’s disease in the United States. Mov. Disord. 2013, 28, 311–318. [Google Scholar] [CrossRef] [PubMed]
- Schapira, A.H.V.; Chaudhuri, K.R.; Jenner, P. Non-motor features of Parkinson disease. Nat. Rev. Neurosci. 2017, 18, 435–450. [Google Scholar] [CrossRef] [PubMed]
- Berg, D.; Borghammer, P.; Fereshtehnejad, S.M.; Heinzel, S.; Horsager, J.; Schaeffer, E.; Postuma, R.B. Prodromal Parkinson disease subtypes - key to understanding heterogeneity. Nat. Rev. Neurol. 2021, 17, 349–361. [Google Scholar] [CrossRef] [PubMed]
- Postuma, R.B.; Berg, D.; Stern, M.; Poewe, W.; Olanow, C.W.; Oertel, W.; Obeso, J.; Marek, K.; Litvan, I.; Lang, A.E.; et al. MDS clinical diagnostic criteria for Parkinson’s disease. Mov. Disord. 2015, 30, 1591–1601. [Google Scholar] [CrossRef] [PubMed]
- Nasreddine, Z.S.; Phillips, N.A.; Bédirian, V.; Charbonneau, S.; Whitehead, V.; Collin, I.; Cummings, J.L.; Chertkow, H. The Montreal Cognitive Assessment, MoCA: a brief screening tool for mild cognitive impairment. J. Am. Geriatr. Soc. 2005, 53, 695–699. [Google Scholar] [CrossRef] [PubMed]
- Willis, A.W.; Schootman, M.; Tran, R.; Kung, N.; Evanoff, B.A.; Perlmutter, J.S.; Racette, B.A. Neurologist care in Parkinson disease: a utilization, outcomes, and survival study. Neurology 2022, 77, 851–857. [Google Scholar] [CrossRef] [PubMed]
- Marek, K.; Innis, R.; van Dyck, C.; Fussell, B.; Early, M.; Eberly, S.; Oakes, D.; Seibyl, J. [123I]β-CIT SPECT imaging assessment of the rate of Parkinson’s disease progression. Neurology 2011, 57, 2089–2094. [Google Scholar] [CrossRef] [PubMed]
- Marek, K.; Chowdhury, S.; Siderowf, A.; Lasch, S.; Coffey, C.S.; Caspell-Garcia, C.; Simuni, T.; Jennings, D.; Tanner, C.M.; Trojanowski, J.Q.; et al. The Parkinson’s progression markers initiative (PPMI) - establishing a PD biomarker cohort. Ann. Clin. Transl. Neurol. 2018, 5, 1460–1477. [Google Scholar] [CrossRef] [PubMed]
- Nalls, M.A.; Blauwendraat, C.; Vallerga, C.L.; Heilbron, K.; Bandres-Ciga, S.; Chang, D.; Tan, M.; Kia, D.A.; Noyce, A.J.; Xue, A.; et al. Identification of novel risk loci, causal insights, and heritable risk for Parkinson’s disease: a meta-analysis of genome-wide association studies. Lancet Neurol. 2019, 18, 1091–1102. [Google Scholar] [CrossRef] [PubMed]
- Kang, U.J.; Boehme, A.K.; Fairfoul, G.; Shahnawaz, M.; Ma, T.C.; Hutten, S.J.; Green, A.; Soto, C. Comparative study of cerebrospinal fluid α-synuclein seeding aggregation assays for diagnosis of Parkinson’s disease. Mov. Disord. 2016, 34, 536–544. [Google Scholar] [CrossRef] [PubMed]
- Schmidt, P.; Reiss, A.; Dürichen, R.; Marberger, C.; Van Laerhoven, K. Introducing WESAD, a multimodal dataset for wearable stress and affect detection. Proc. 20th ACM Int. Conf. Multimodal Interact. 2019, 400–408. [Google Scholar] [CrossRef]
- Nan, F.; Wang, J.; Saligrama, V. Feature-budgeted random forest. Proc. 32nd Int. Conf. Mach. Learn. 2015, 37, 1983–1991. [Google Scholar]
- Xu, Z.; Kusner, M.; Weinberger, K.; Chen, M. Cost-sensitive tree of classifiers. Proc. 30th Int. Conf. Mach. Learn. 2013, 28, 133–141. [Google Scholar]
- Trapeznikov, K.; Saligrama, V. Supervised sequential classification under budget constraints. Proc. 16th Int. Conf. Artif. Intell. Stat. 2013, 31, 581–589. [Google Scholar]
- Postuma, R.B.; Iranzo, A.; Hu, M.; Högl, B.; Boeve, B.F.; Manni, R.; Oertel, W.H.; Arnulf, I.; Ferini-Strambi, L.; Puligheddu, M.; et al. Risk and predictors of dementia and parkinsonism in idiopathic REM sleep behaviour disorder: a multicentre study. Brain 2016, 142, 744–759. [Google Scholar] [CrossRef] [PubMed]
- Rajkomar, A.; Dean, J.; Kohane, I. Machine learning in medicine. N. Engl. J. Med. 2019, 380, 1347–1358. [Google Scholar] [CrossRef] [PubMed]
- Dulac-Arnold, G.; Mankowitz, D.; Hester, T. Challenges of real-world reinforcement learning. arXiv preprint arXiv:1904.12901 2019. [CrossRef]
- Keel, S.; Lee, P.Y.; Scheetz, J.; Li, Z.; Kotowicz, M.A.; MacIsaac, R.J.; He, M. Feasibility and patient acceptability of a novel artificial intelligence-based screening model for diabetic retinopathy at endocrinology outpatient services: a pilot study. Sci. Rep. 2018, 8, 4330. [Google Scholar] [CrossRef] [PubMed]
- Battineni, G.; Chintalapudi, N.; Amenta, F. Late-life Alzheimer’s disease (AD) detection using pruned decision trees. Int. J. Brain Disord. Treat. 2020, 6, 033. [Google Scholar] [CrossRef]
- Lewiss, R.E.; Ogle, K.Y.; Freund, Y. Equity: *European Journal of Emergency Medicine* Reflects Forward Eur. J. Emerg. Med. 2020, 27(2), 77–78. [CrossRef] [PubMed]
- Zhang, Y.; Guo, Y.; Yang, P.; Chen, W.; Lo, B. Epilepsy seizure prediction on EEG using common spatial pattern and convolutional neural network. IEEE J. Biomed. Health Inform. 2021, 24, 465–474. [Google Scholar] [CrossRef] [PubMed]
- Lang, M.; Pfister, F.M.J.; Fröhner, J.; Abedinpour, K.; Pichler, D.; Fietzek, U.; Um, T.T.; Kulić, D.; Endo, S.; Hirche, S. A multi-layer Gaussian process for motor symptom estimation in people with Parkinson’s disease. IEEE Trans. Biomed. Eng. 2019, 66, 3038–3049. [Google Scholar] [CrossRef] [PubMed]
- Adams, J.L.; Kangarloo, T.; Tracey, B.; et al. Using a Smartwatch and Smartphone to Assess Early Parkinson’s Disease in the WATCH-PD Study. npj Parkinson’s Dis. 2023, 9, 64. [Google Scholar] [CrossRef] [PubMed]
- Little, R.J.A.; Rubin, D.B. Statistical Analysis with Missing Data, 3rd ed.; Wiley: Hoboken, NJ, USA, 2019. [Google Scholar] [CrossRef]
- Young, A.L.; Marinescu, R.V.; Oxtoby, N.P.; Bocchetta, M.; Yong, K.; Firth, N.C.; Cash, D.M.; Thomas, D.L.; Dick, K.M.; Cardoso, J.; et al. Uncovering the heterogeneity and temporal complexity of neurodegenerative diseases with Subtype and Stage Inference. Nat. Commun. 2018, 9, 4273. [Google Scholar] [CrossRef] [PubMed]
- Rubanova, Y.; Chen, R.T.Q.; Duvenaud, D.K. Latent ordinary differential equations for irregularly-sampled time series. Adv. Neural Inf. Process. Syst. 2019, 32, 5320–5330. [Google Scholar]
- Haenssle, H.A.; Fink, C.; Schneiderbauer, R.; Toberer, F.; Buhl, T.; Blum, A.; Kalloo, A.; Hassen, A.B.H.; Thomas, L.; Enk, A.; et al. Man against machine: diagnostic performance of a deep learning convolutional neural network for dermoscopic melanoma recognition in comparison to 58 dermatologists. Ann. Oncol. 2018, 29, 1836–1842. [Google Scholar] [CrossRef] [PubMed]
- Zhang, Y.; Guo, L.; Wang, Z.; Lv, J.; Zhang, H. External validation of international risk-prediction models of IgA nephropathy in an Asian-Caucasian cohort. Kidney Int. Rep. 2020, 5, 1753–1763. [Google Scholar] [CrossRef] [PubMed]
- Tan, L.C.; Venketasubramanian, N.; Hong, C.Y.; Sahadevan, S.; Chin, J.J.; Krishnamoorthy, E.S.; Tan, A.K.; Saw, S.M. Prevalence of Parkinson disease in Singapore: Chinese vs Malays vs Indians. Neurology 2004, 62, 1999–2004. [Google Scholar] [CrossRef] [PubMed]
- Char, D.S.; Burgart, A.; Magnus, D.; Ainsworth, J.; Bjarnason, G.; Cohn, A.; Conway, P.; Doidge, J.; Fridsma, D.; Grajales III, F.J.; et al. Implementing machine learning in health care - addressing ethical challenges. N. Engl. J. Med. 2020, 378, 981–983. [Google Scholar] [CrossRef] [PubMed]
- Marek, K.; Jennings, D.; Lasch, S.; Siderowf, A.; Tanner, C.; Simuni, T.; Coffey, C.; Kieburtz, K.; Flagg, E.; Chowdhury, S.; et al. The Parkinson Progression Marker Initiative (PPMI). Prog. Neurobiol. 2011, 95, 629–635. [Google Scholar] [CrossRef] [PubMed]
- Movement Disorder Society. MDS-UPDRS Training and Certification Program. Available online: https://mds.movementdisorders.org/updrs/ (accessed on 19 July 2025).
- Ontario Society of Occupational Therapists. Montreal Cognitive Assessment (MoCA) Announces Upcoming Changes. Available online: https://www.osot.on.ca/TAGGED/News/Montreal_Cognitive_Assessment__MoCA__Announces_Upcoming_Changes.aspx (accessed on 19 July 2025).
- European Association of Nuclear Medicine. EANM Practice Guidelines/SNMMI Procedure Standards for Dopamine Transporter Imaging with ¹²³I-FP-CIT SPECT. J. Nucl. Med. 2020, 61, 781–787. [Google Scholar] [CrossRef]
- Organisation for Economic Co-operation and Development. OECD Principles on Good Laboratory Practice. OECD Series on Principles of Good Laboratory Practice and Compliance Monitoring;
- Wang, R.Y.; Strong, D.M. Beyond accuracy: what data quality means to data consumers. J. Manag. Inf. Syst. 1996, 12, 5–33. [Google Scholar] [CrossRef]
- Kahn, M.G.; Raebel, M.A.; Glanz, J.M.; Riedlinger, K.; Steiner, J.F. A pragmatic framework for single-site and multisite data quality assessment in electronic health record-based clinical research. Med. Care 2012, 50, S21–S29. [Google Scholar] [CrossRef] [PubMed]
Figure 1.
Average silhouette scores for five clustering algorithms across all feature sets. Spectral clustering on Tier 1 features achieves the highest score (0.654).
Figure 1.
Average silhouette scores for five clustering algorithms across all feature sets. Spectral clustering on Tier 1 features achieves the highest score (0.654).
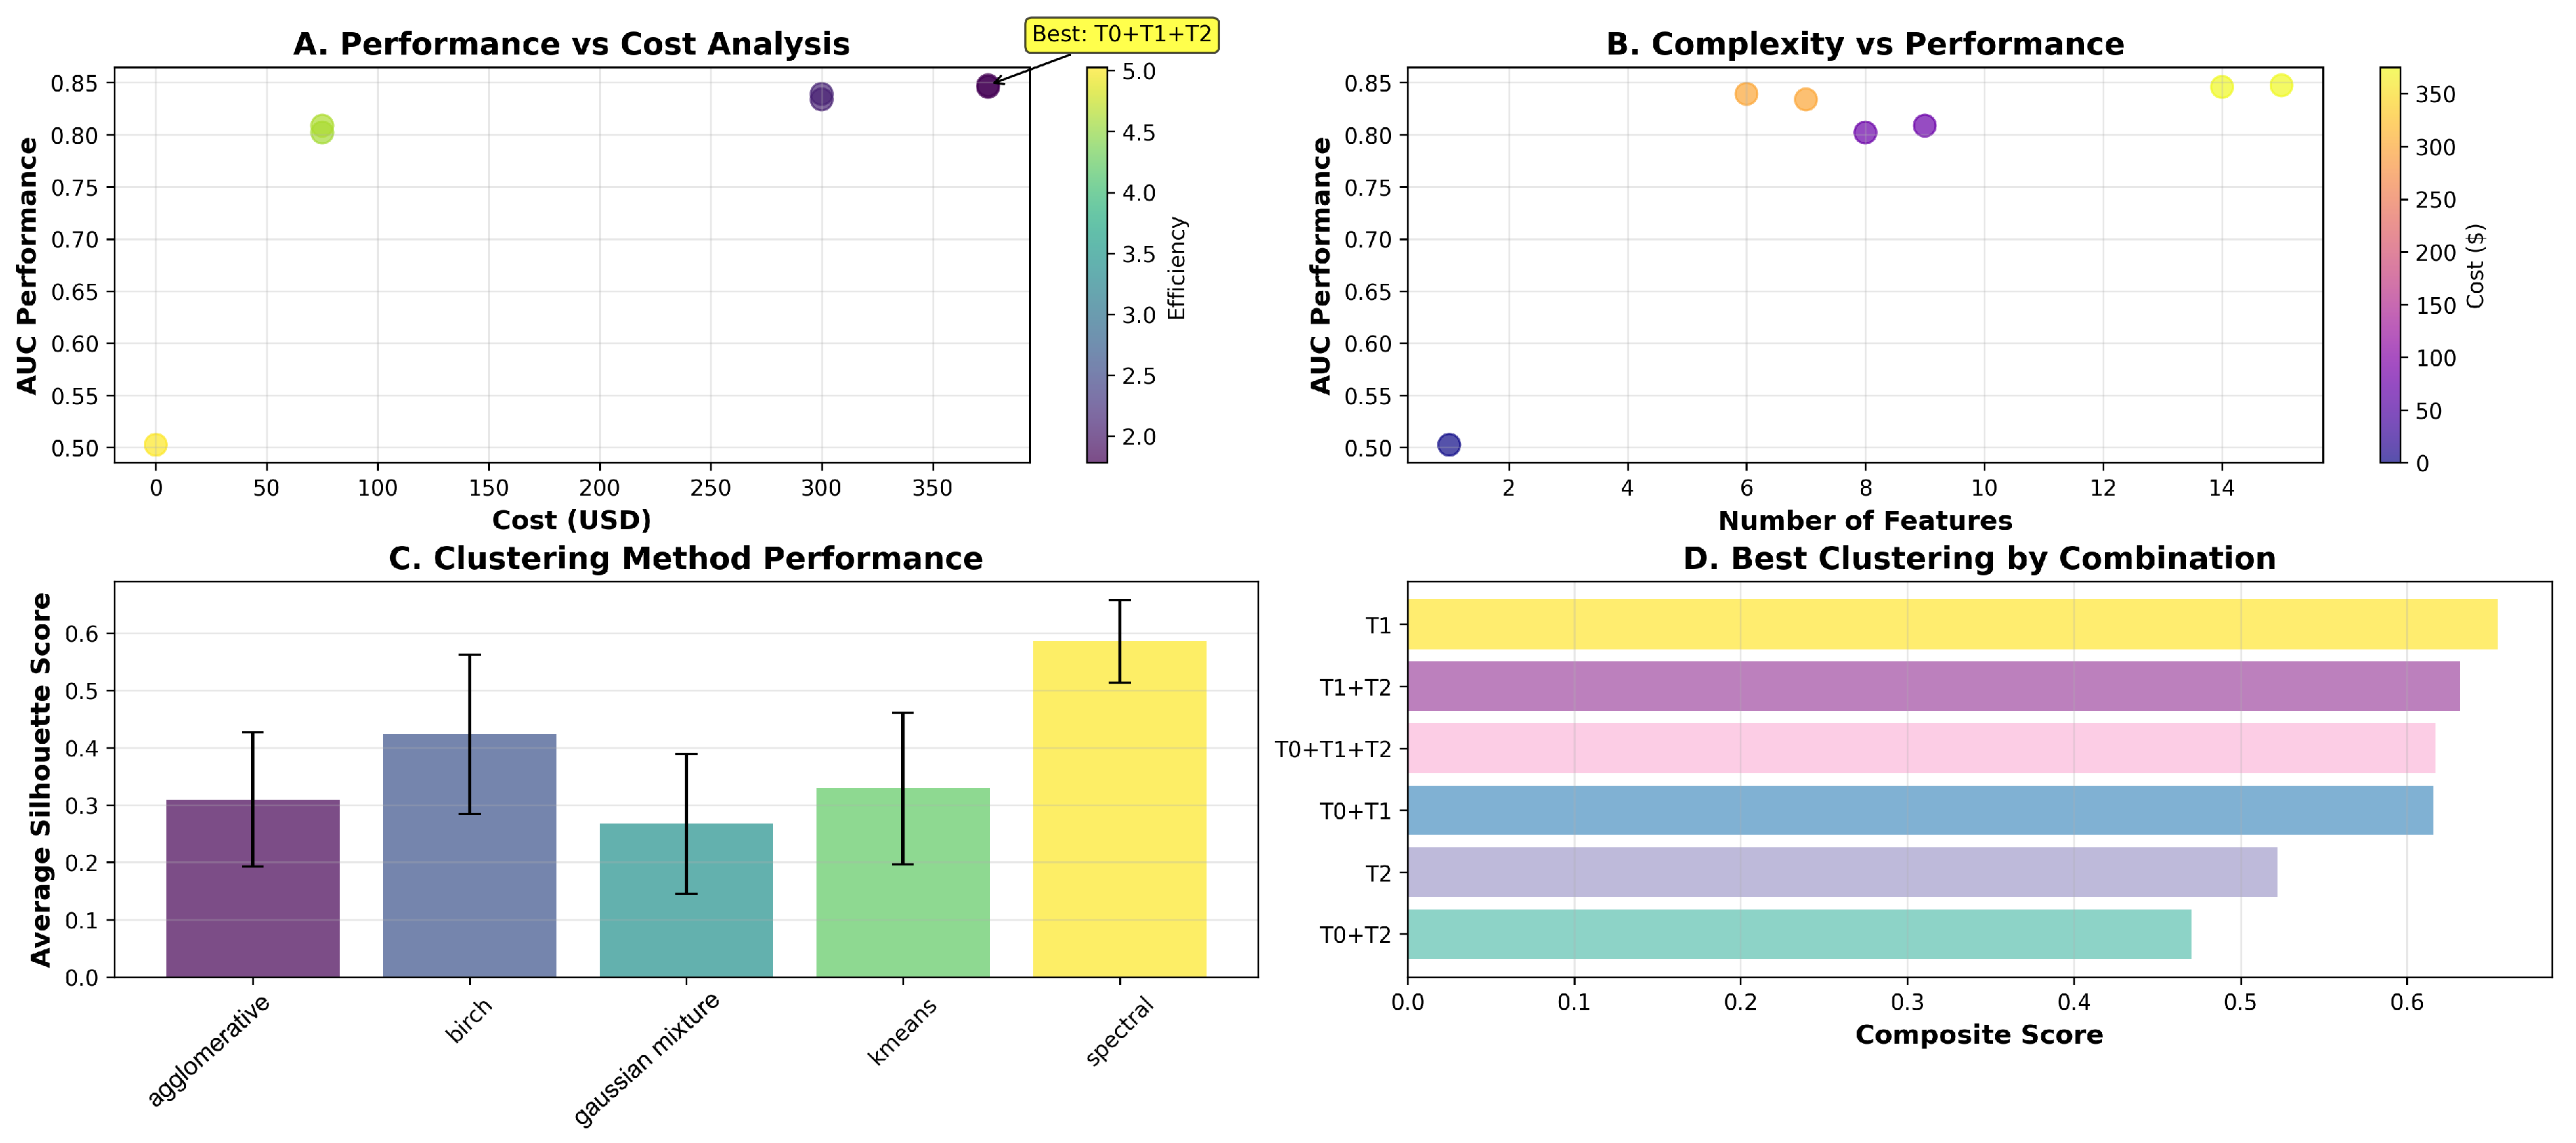
Figure 2.
Top features by missing-data rate. High-cost tiers (T3, T4) show the greatest missingness at Baseline.
Figure 2.
Top features by missing-data rate. High-cost tiers (T3, T4) show the greatest missingness at Baseline.
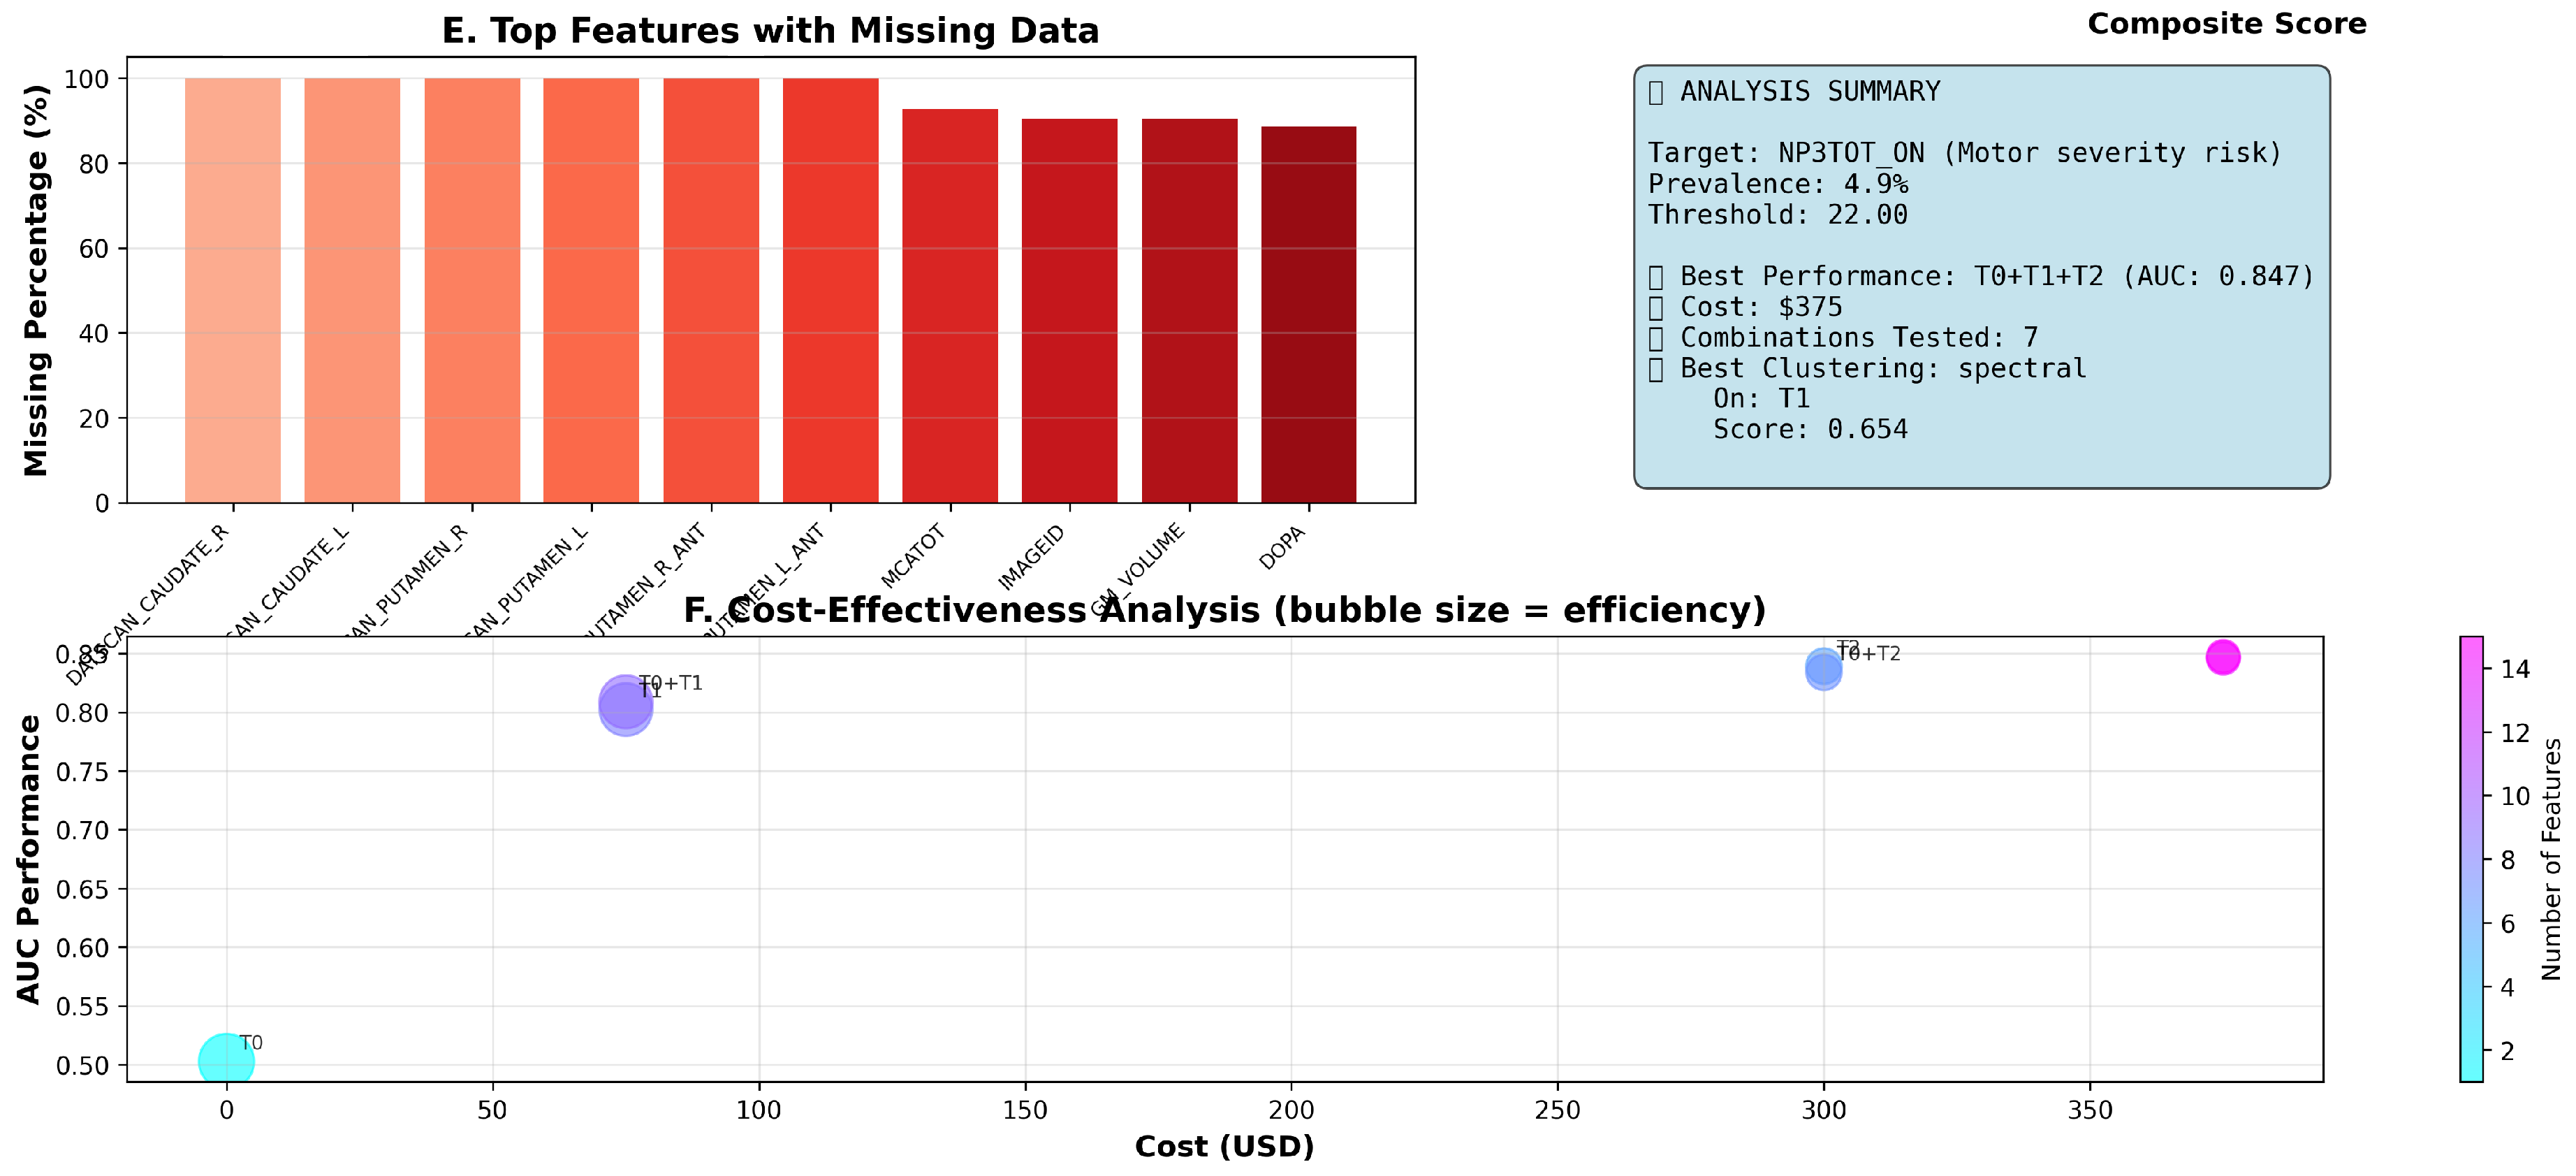
Table 1.
Comprehensive PPMI Dataset Structure and Feature Distribution.
| Feature Category | Variables | Cost Tier (USD) | Time (min) | Coverage (%) | Missingness (%) | Quality Score |
|---|---|---|---|---|---|---|
| Demographic | 3 | Tier 0 ($0) | 5–35 | 96.1 | 3.9 | 8.87 |
| Self-Assessment | 8 | Tier 1 ($75) | 20–50 | 67.1 | 32.9 | 2.30 |
| Clinical Evaluation | 13 | Tier 2 ($300) | 75–105 | 44.5 | 55.5 | 0.00 |
| Specialised Imaging | 6 | Tier 3 ($3,300) | 150–180 | 13.2 | 86.8 | 0.00 |
| Advanced Biomarkers | 3 | Tier 4 ($5,000) | 240–270 | 7.4 | 92.6 | 0.00 |
Table 2.
Detailed Demographic and Clinical Characteristics of PPMI Cohort
| Characteristic | Mean (SD) | Median [IQR] | Range | Missing (%) | Distribution |
|---|---|---|---|---|---|
| Age at baseline (years) | 65.2 (9.3) | 65.9 [59.2, 71.7] | 26.4–93.6 | 3.9 | Normal |
| MDS-UPDRS Part III | 22.9 (12.6) | 21.0 [13.0, 30.0] | 0.0–89.0 | 64.3 | Right-skewed |
| MoCA Total Score | 26.6 (3.2) | 27.0 [25.0, 29.0] | 0.0–30.0 | 46.3 | Left-skewed |
| Hoehn & Yahr Stage | 2.6 (7.7) | 2.0 [2.0, 2.0] | 0.0–101.0 | 62.8 | Right-skewed |
Table 3.
Longitudinal Assessment Completion Rates by Visit and Assessment Type
| Assessment Type | Screening | Baseline | 12 Months | 18 Months | 24 Months | 36 Months | 48 Months | 54 Months | 66 Months |
|---|---|---|---|---|---|---|---|---|---|
| Demographic | 89.3 | 99.9 | 99.8 | 97.4 | 99.3 | 99.2 | 99.8 | 97.4 | 97.5 |
| Self-Assessment | 18.3 | 84.4 | 92.5 | 94.3 | 93.3 | 92.4 | 92.3 | 87.0 | 77.9 |
| Clinical Evaluation | 16.2 | 48.0 | 65.1 | 65.5 | 66.2 | 66.8 | 66.5 | 62.1 | 57.4 |
| Specialized Imaging | 52.6 | Not done | 34.2 | 45.9 | Not done | 41.4 | Not done | Not done | Not done |
| Advanced Biomarkers | Not done | 10.1 | 7.8 | 16.7 | 10.1 | 18.9 | 11.1 | 10.1 | 10.3 |
Table 6.
Performance and Cost-Effectiveness of Tier Combinations.
| Combination | Cost (USD) | # Features | AUC | Efficiency |
| T0 | 0 | 1 | 0.503 | 5.03 |
| T1 | 75 | 8 | 0.802 | 4.58 |
| T2 | 300 | 6 | 0.839 | 2.10 |
| T0+T1 | 75 | 9 | 0.809 | 4.62 |
| T0+T2 | 300 | 7 | 0.834 | 2.08 |
| T1+T2 | 375 | 14 | 0.846 | 1.78 |
| T0+T1+T2 | 375 | 15 | 0.847 | 1.78 |
Table 7.
Top Missing-Data Rates by Feature.
| Feature | Missing Rate (%) | Tier |
| DATSCAN_PUTAMEN_R | 100.0 | T3 |
| DATSCAN_CAUDATE_R | 100.0 | T3 |
| DATSCAN_PUTAMEN_L | 100.0 | T3 |
| DATSCAN_CAUDATE_L | 100.0 | T3 |
| MCATOT | 92.7 | T2 |
| IMAGEID | 90.5 | T4 |
| GM_VOLUME | 90.5 | T4 |
| DOPA | 88.6 | T4 |
| NP3TOT_OFF | 87.6 | T2 |
| NHY_OFF | 87.6 | T2 |
| COGCAT | 37.7 | T2 |
| COGDXCL | 23.7 | T1 |
| STAI_TOTAL | 5.3 | T1 |
| NP2PTOT | 0.5 | T1 |
| AGE_AT_VISIT | 0.1 | T0 |
Disclaimer/Publisher’s Note: The statements, opinions and data contained in all publications are solely those of the individual author(s) and contributor(s) and not of MDPI and/or the editor(s). MDPI and/or the editor(s) disclaim responsibility for any injury to people or property resulting from any ideas, methods, instructions or products referred to in the content. |
© 2022 by the authors. Licensee MDPI, Basel, Switzerland. This article is an open access article distributed under the terms and conditions of the Creative Commons Attribution (CC BY) license (https://creativecommons.org/licenses/by/4.0/).
Copyright: This open access article is published under a Creative Commons CC BY 4.0 license, which permit the free download, distribution, and reuse, provided that the author and preprint are cited in any reuse.


