Submitted:
29 July 2025
Posted:
08 August 2025
You are already at the latest version
Abstract
In this study, the mechanical and fracture behavior of AISI 304 austenitic stainless steel sheets was investigated using a crystal plasticity finite element method (CPFEM). Two types of microstructures were analyzed: a random configuration with equiaxed grains and a textured configuration with elongated grains, resulting from severe cold rolling. Polycrystalline geometries were generated using a Voronoi tessellation algorithm in MATLAB and implemented in ABAQUS. The hardening parameters for each microstructure were identified through calibration by matching experimental and simulated uniaxial stress–strain curves. Results revealed that the aspect ratios of the grains (length and width relative to thickness) significantly affect the macroscopic fracture strain. Increasing the grain length-to-thickness ratio l/dl/dl/d led to a reduction in fracture strain, while increasing the grain width-to-thickness ratio w/dw/dw/d enhanced strain uniformity and delayed fracture. Comparisons between the two microstructures showed that the textured configuration consistently exhibited lower ductility due to higher dislocation density and limited slip system activation. Grain-level fracture analysis demonstrated that increasing the number of grains reduced the standard deviation of local fracture strain and improved deformation uniformity. Additionally, textured microstructures exhibited earlier formation of shear bands at lower strain levels, indicating a lower forming limit. These findings provide valuable insights into the relationship between grain morphology, crystallographic texture, and formability in metal sheets. The results can be applied to optimize microstructural design for improved ductility in high-strain-rate forming processes.
Keywords:
AISI 304 stainless steel
; crystal plasticity
; textured microstructure
; calibration
; fracture strain
; Voronoi
; ABAQUS
1. Introduction
Perforated metal sheets and plates (i.e. those containing holes or cut-outs) are widely used in engineering applications for weight reduction, filtration, and structural aesthetics. The introduction of holes, however, creates stress concentrators that can markedly reduce the load-bearing capacity and ductility of a component. For example, previous studies have noted that a steel sheet’s sensitivity to a central hole under tensile loading is much greater than under bending loads [1]. In other words, an open hole can drastically lower the elongation to failure in tension, whereas its effect under flexural loading is comparatively smaller due to stress redistribution. The shape and arrangement of perforations also play a role in mechanical response – elliptical holes in a staggered array have been shown to achieve higher strength and energy absorption compared to other geometries like triangular or square holes [2]. Furthermore, increasing the hole size (or the fraction of void area) tends to drive the deformation mode toward plane-strain conditions at the net section, which promotes earlier localized necking [2].
These prior works on perforated sheets have typically employed conventional finite element analysis with continuum plasticity models to evaluate the influence of geometric factors (hole size, layout, etc.) on structural performance. While such continuum analyses capture the gross mechanical response, they often treat the metal as homogeneous and isotropic. In reality, the microstructure of the metal – including its grain size, crystallographic texture, and slip system behavior – can significantly affect deformation, especially in the presence of stress concentrators or non-uniform stress fields [3].
Austenitic stainless steels like AISI 304 have a face-centered cubic (FCC) crystal structure and can develop strong crystallographic texture (preferred grain orientations) due to thermomechanical processing (e.g., rolling) [4]. A textured microstructure leads to anisotropic yield and flow behavior, which can influence how and where localization (such as shear bands or necking) occurs under stress [4]. Moreover, the grain size and shape can create a size effect: when the structural dimensions (for example, ligament width between holes) are not orders of magnitude larger than the grain size, the distribution of grain orientations can cause deviations from the expected continuum behavior [5]. Indeed, recent microforming studies on 304 stainless steel foils have demonstrated that grain orientation distribution and grain size have measurable impacts on yield locus shape and plastic strain distribution [5].
This underscores the need for crystal plasticity modeling in order to predict deformation in cases where microstructural length scales are non-negligible. Crystal plasticity finite element methods (CPFEM) provide a physics-based tool to incorporate crystallographic slip and grain-level heterogeneity into FE simulations [6]. In a CPFEM model, each grain in the polycrystalline aggregate can be assigned its own orientation and crystal constitutive law, allowing the simulation to capture intergranular strain localization (e.g., the formation of shear bands along crystallographic planes) [6].
Pioneering work by Huang (1991) integrated single-crystal plasticity theory into an ABAQUS user material subroutine (UMAT), laying the groundwork for many subsequent CPFEM studies [7]. With advances in computational power, such models have evolved to tackle large aggregates and even component-scale simulations. For instance, Roters et al. (2019) developed the DAMASK framework, enabling crystal plasticity simulations from the single-crystal level up to entire engineering components [8].
The UMAT approach remains widely used for implementing crystal plasticity in commercial FE codes like ABAQUS. It offers flexibility to incorporate complex, rate-dependent constitutive laws, and even novel data-driven formulations – for example, recent research has embedded trained neural network models of crystal plasticity into an ABAQUS UMAT to serve as a data-driven constitutive law preserving microstructural details [9].
This ability to customize material behavior via UMAT is crucial for capturing effects that traditional isotropic plasticity models (which homogenize the microstructure) might miss. In light of the above, the present work aims to bridge the gap between structural-scale deformation behavior (as affected by features like holes or notches) and micro-scale phenomena (governed by the crystal plasticity of grains) for 304 stainless steel sheets.
2. Materials and Experimental Procedure
2.1. Material Description
To investigate the mechanical behavior of austenitic stainless steel under the influence of evolved crystallographic texture, cold-rolled AISI 304 stainless steel sheets with a thickness of 2.0 mm were selected. The thin sheet thickness ensured that only a limited number of grains were present along the through-thickness direction. The sheet had undergone severe cold working, resulting in a significant evolution of crystallographic texture in its microstructure. This microstructural transformation was expected to strongly influence the mechanical properties of the material.
The goal was to analyze a textured material structure using crystal plasticity simulations to evaluate how the evolved texture affects the formability of the sheet. Accordingly, uniaxial tensile tests were conducted to examine grain elongation and to characterize the microstructural morphology induced by rolling. Specimens were prepared in three orientations relative to the rolling direction: longitudinal (RD), transverse (TD), and 45° to RD (RD-45), and then subjected to uniaxial tension.
2.2. Tensile Test Sample Preparation
Tensile test specimens were machined in subsize dimensions following ASTM E8 standard, as illustrated in Figure 1. All specimens were extracted from 2.0 mm thick AISI 304 stainless steel sheets. To ensure quasi-static conditions during the test, a constant crosshead speed of 0.5 mm/s was applied. A total of nine specimens (three for each direction: RD, TD, and RD-45) were tested. The primary aim was to evaluate the effect of anisotropy on the tensile response of the sheet. The specimens were mounted in the tensile testing machine as shown in Figure 2. Representative engineering stress–strain curves obtained from the uniaxial tensile tests in the three directions are depicted in Figure 3.
The results show that the sheet exhibits high ultimate tensile strength in all directions, along with limited ductility. This behavior is attributed to the high dislocation density caused by the severe cold working process. The accumulation of dislocations, which act as obstacles to further deformation, requires higher applied stresses for continued plastic flow. The dislocation saturation gives rise to a pseudo single-crystal-like behavior in the material. The fracture surfaces revealed failure angles near 45°, consistent with shear-dominated failure mechanisms in single-crystal-like structures.
2.3. Metallography of the Textured Microstructure
To study the grain shape and texture evolution, metallographic specimens were prepared from the cold-rolled sheet in both the rolling direction and the transverse direction. The samples were mounted using a hot-mounting process and then etched to reveal the grain boundaries. Grain boundaries, being more reactive, are etched more readily than other microstructural features.
The etching solution was selected based on ASTM E407-2015, which recommends appropriate chemical compositions for micro-etching stainless steels. For AISI 304, the recommended reagent is Glyceregia—a solution containing glycerol, hydrochloric acid, nitric acid, and acetic acid. Following sample preparation, the microstructure was observed under an optical microscope in accordance with ASTM E883-11. Due to the high degree of rolling reduction to a final thickness of 2.0 mm, the microstructure exhibits significantly elongated austenitic grains, as visible in Figure 4. Accurate grain size measurement using standard methods was not feasible because the grains no longer retained equiaxed shapes. Therefore, the deformed grains were modeled as ellipses, characterized by their major and minor axes.
To quantify grain morphology, five grains were randomly selected, and the lengths of their major and minor axes were measured. The average dimensions were calculated, yielding an elliptical grain shape with a major axis of approximately 104 µm and a minor axis of 69 µm. These dimensions were later used to define grain geometry in the crystal plasticity finite element simulations.
3. Numerical Simulation
Crystal Plasticity Model
The numerical model was based on crystallographic slip occurring on the twelve slip systems of :FCC crystals. A rate-sensitive flow rule was employed for slip kinetics [12]
where ατ is the resolved shear stress, is the critical resolved shear stress (CRSS), and is the strain-rate sensitivity exponent. The initial shear rate was set as , and Isotropic hardening was implemented using the following relation [13]
4. Polycrystalline Structure Generation and Texture Assignment
4.1. Polycrystal Modeling
A polycrystalline microstructure was generated using a Voronoi algorithm implemented in MATLAB. The spatial domain and mesh (nodes and elements) were extracted, and the 3D volume was divided into cubic subregions. For the random microstructure, equal spacing was applied in all directions. However, for the textured model, larger intervals were used along the rolling direction (RD) to simulate elongated grains. Each grain was formed by grouping elements assigned to the nearest randomly generated seed point.
4.2. Texture Application
To assign crystallographic orientations, each grain was given a rotation matrix based on specific texture components and their volume fractions. The global reference frame was defined by RD, TD, and ND, while the local crystal axes were set as [100], [010], and [001] (Figure 6). Due to heavy cold rolling (down to 0.2 mm thickness), the dominant texture was assumed to be the Brass component ({011}<211>), corresponding to Euler angles φ1 = 90°, Φ = 45°, φ2 = 45°[10].
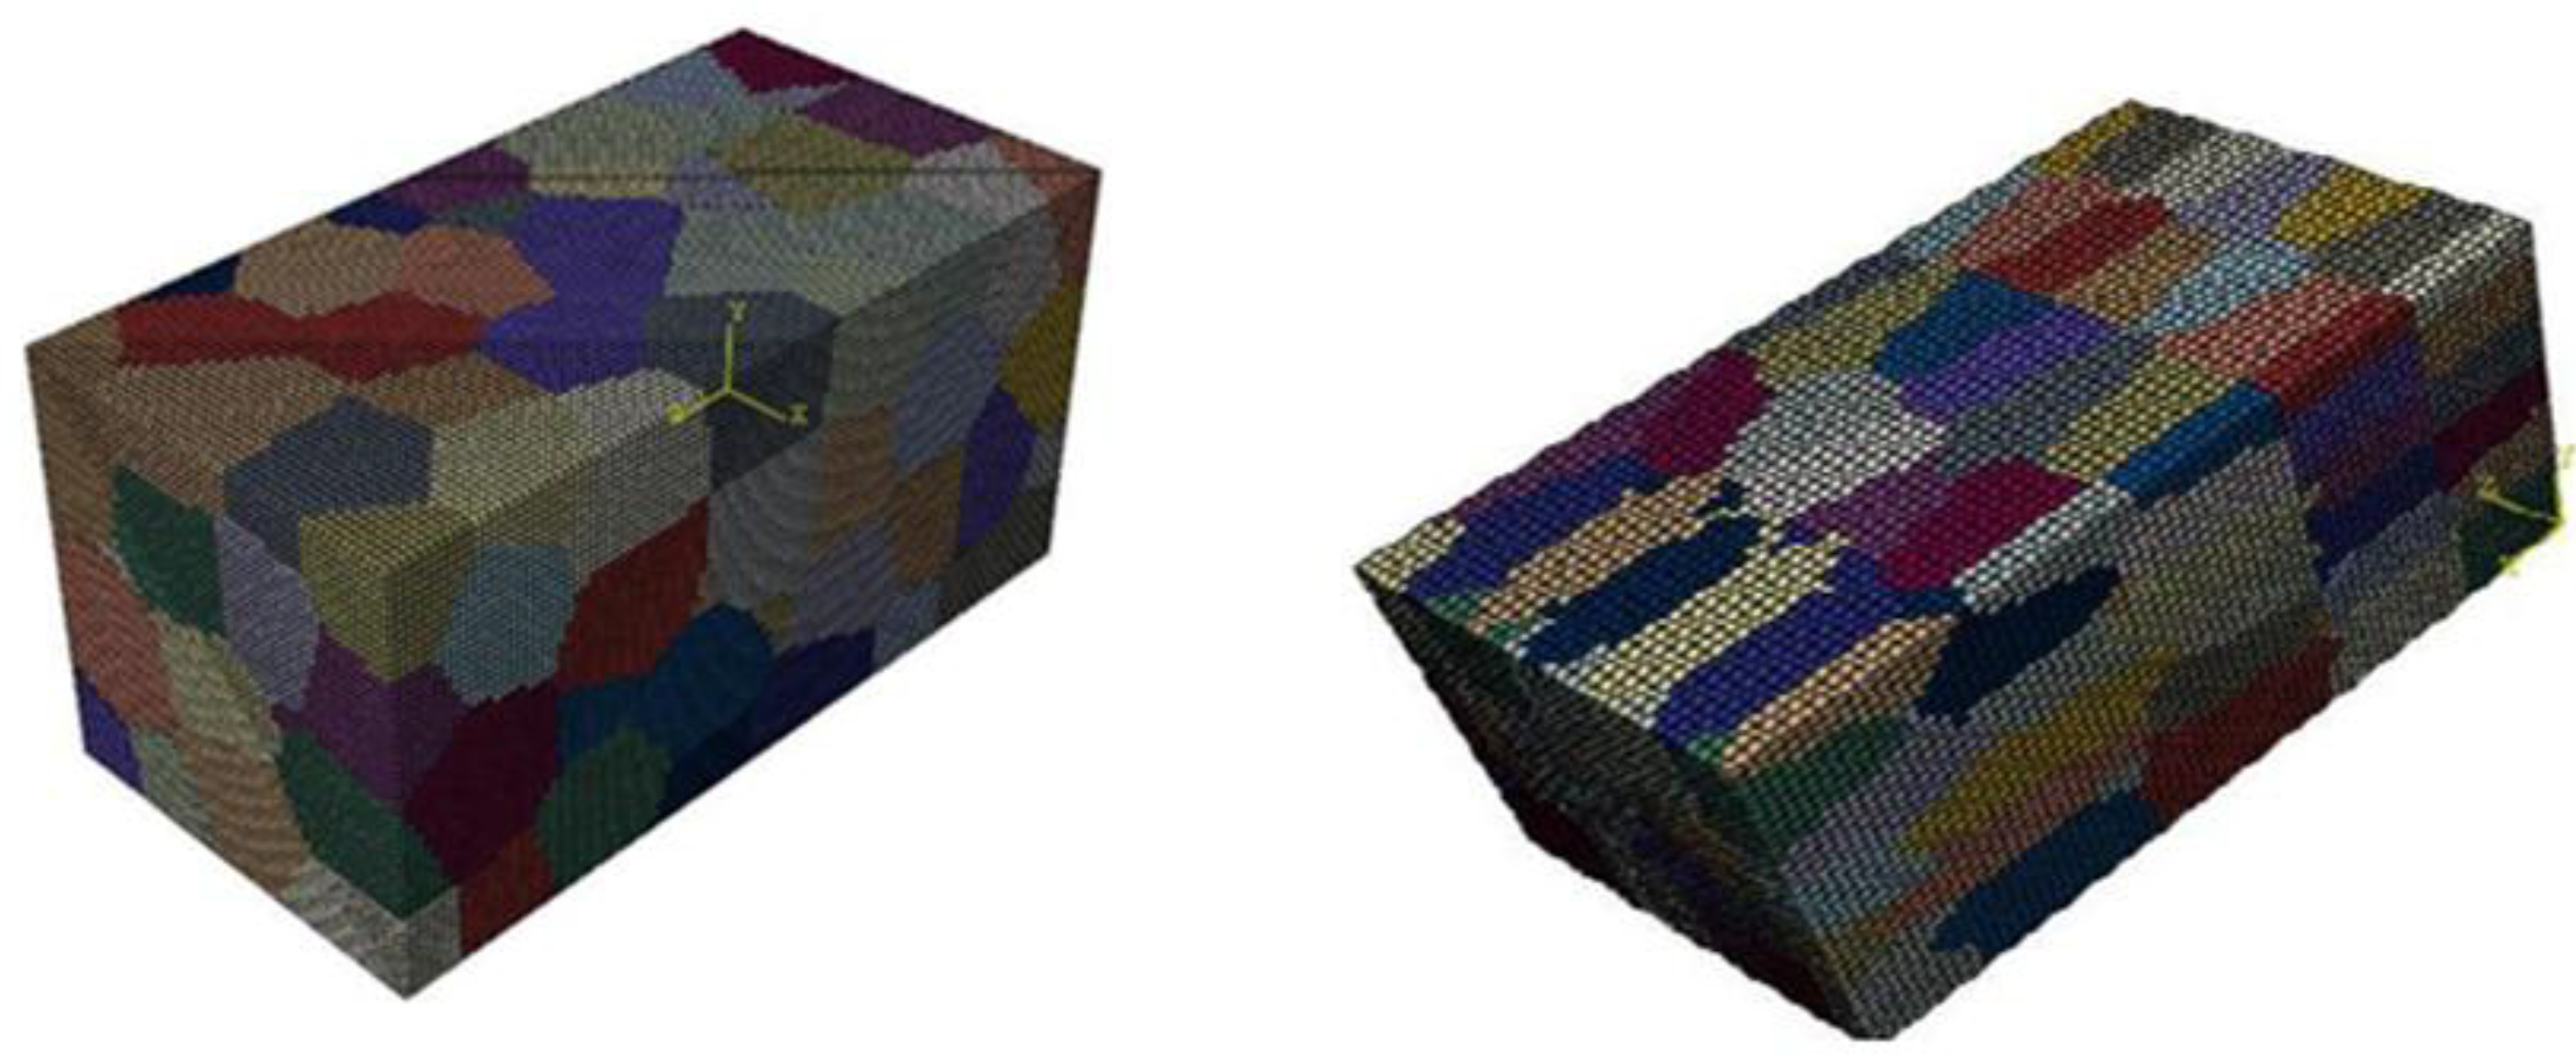
Figure 5.
(a) Random microstructure with equiaxed grains; (b) Textured microstructure with elongated grains.
Figure 5.
(a) Random microstructure with equiaxed grains; (b) Textured microstructure with elongated grains.
5. Calibration of Hardening Parameters
Accurate prediction of material behavior under high strain-rate forming processes requires proper determination of hardening parameters, which are significantly influenced by the material’s microstructure and crystallographic orientation. In particular, materials with random grain orientations exhibit different hardening behavior compared to textured ones.
Ideally, simple shear tests are performed to determine the hardening response of each active slip system based on shear stress–strain curves [11]. However, due to the high cost and lack of necessary equipment, this approach is often substituted with a calibration method.
The hardening model used includes three key parameters:
- : initial critical resolved shear stress
- : initial hardening modulus
- : saturation shear stress
To identify these parameters, an iterative trial-and-error calibration was performed. Experimental engineering stress–strain curves were compared to those obtained from simulations using ABAQUS. A MATLAB code was used to generate .inp files for uniaxial tensile simulations with different parameter sets. After each run, the simulated curve was extracted and compared to the experimental one. This process was repeated until a good match was achieved.
6. Results and Discussion
6.1. Uniaxial Tension of Sheets with Random Microstructure
To investigate the effect of grain geometry and aspect ratio on fracture behavior, several simulations were performed on polycrystalline sheets with random, equiaxed microstructures. The aspect ratios of the sheet models were varied as shown in Figure 8, with the goal of evaluating how these parameters influence the macroscopic fracture strain.
Figure 9 presents the trend of final macroscopic fracture strain as a function of aspect ratios. As the grain aspect ratio l/dl/dl/d increases (for constant w/dw/dw/d), the fracture strain decreases. This is attributed to the increased number of grains along the loading direction, which statistically raises the chance of early plastic slip activation in some grains, leading to earlier global failure. Conversely, for a fixed l/dl/dl/d, increasing w/dw/dw/d results in higher macroscopic fracture strain. With more grains in the thickness direction, heterogeneous orientations result in a more complex activation of slip systems, thus increasing resistance to through-thickness deformation and improving ductility.
Figure 10 illustrates the scatter of microscopic fracture strain values across grains, normalized against the macroscopic fracture strain. As the number of grains increases, the standard deviation of grain-level fracture strain decreases, indicating more uniform deformation. For example:
- With 12 grains (w/d=1.5,l/d=3w/d = 1.5, l/d = 3w/d=1.5,l/d=3), ~60% of grains failed earlier than the macroscopic strain.
- With 36 grains (w/d=3,l/d=4w/d = 3, l/d = 4w/d=3,l/d=4), this ratio dropped to ~45%.
- For 150 grains (w/d=5,l/d=6w/d = 5, l/d = 6w/d=5,l/d=6), only ~25% showed early slip activation.
This suggests that increasing the number of grains enhances strain uniformity and delays localized failure.
6.2. Uniaxial Tension of Textured Microstructure
A similar analysis was conducted on sheets with elongated grains representing a rolled, textured microstructure. As shown in Figure 11, the influence of aspect ratios on the macroscopic fracture strain was again evaluated.
Figure 12 confirms the same trends as in the random case:
- Increasing w/dw/dw/d (at constant l/dl/dl/d) raises fracture strain.
- Increasing l/dl/dl/d (at constant w/dw/dw/d) lowers fracture strain.
However, a key finding is the comparison between random and textured microstructures under the same aspect ratio. Figure 13 shows that the textured microstructure consistently results in lower fracture strains. This is attributed to high dislocation density and subgrain boundaries induced by heavy rolling, which reduce ductility and make slip harder. The behavior resembles that of a pseudo single crystal—higher strength, lower strain to failure.
Grain-level fracture strain results for the textured microstructure are presented in Figure 14. Again, higher grain count leads to reduced variance and more uniform deformation:
- With 16 grains (w/d=1.5,l/d=3w/d = 1.5, l/d = 3w/d=1.5,l/d=3), ~56% of grains failed earlier than the macroscopic level.
- With 48 grains (w/d=3,l/d=4w/d = 3, l/d = 4w/d=3,l/d=4), ~45%.
- With 180 grains (w/d=5,l/d=6w/d = 5, l/d = 6w/d=5,l/d=6), only ~27%.
This confirms that an increased number of grains suppresses strain localization, improving formability.
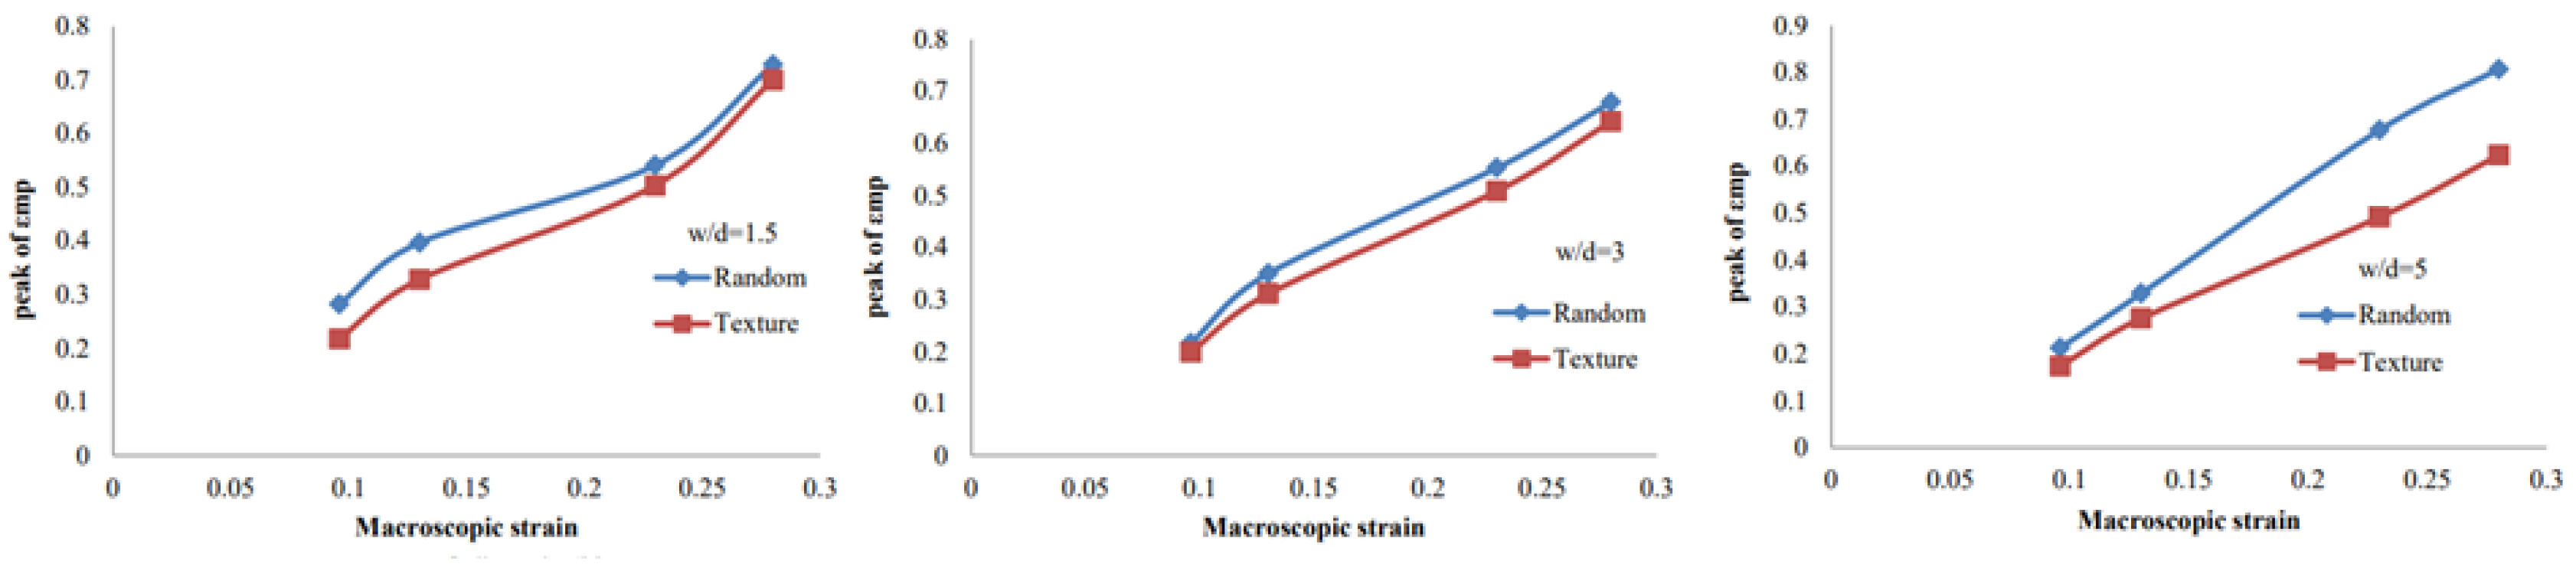
6.3. Effect of Microstructure on Shear Band Formation
To evaluate the role of microstructure in shear band formation, the peak principal strain was tracked at various macroscopic strain levels for both microstructures and several w/dw/dw/d values. As shown in Figure 15, the random microstructure consistently exhibits higher peak strain values, indicating more localized deformation.
This suggests that texture-induced hardening (from cold rolling) lowers formability by promoting earlier shear band formation and reducing the forming limit.
7. Conclusion
In this study, the deformation and fracture behavior of AISI 304 stainless steel sheets with different microstructures—random (equiaxed grains) and textured (elongated grains)—was investigated using crystal plasticity finite element simulations. The polycrystalline models were generated based on experimental grain morphology and calibrated against uniaxial tensile test data to ensure fidelity.
The results reveal a clear dependency of macroscopic fracture strain on both the microstructural configuration and the aspect ratios w/dw/dw/d and l/dl/dl/d. For both microstructures:
- Increasing the grain length-to-thickness ratio l/dl/dl/d reduced the final macroscopic fracture strain.
- Increasing the grain width-to-thickness ratio w/dw/dw/d enhanced formability and delayed fracture onset.
However, sheets with textured microstructure consistently exhibited lower ductility compared to their randomly oriented counterparts. This behavior is attributed to the higher dislocation density and internal substructure generated during cold rolling, which hindered plastic slip activation and localized the deformation.
Grain-level analysis further confirmed that microstructural refinement (i.e., increased grain count) leads to more uniform deformation and reduced strain localization, thereby improving the sheet’s forming behavior. Conversely, models with fewer grains showed greater variability in grain-level fracture strain, indicating a higher probability of early, localized failure.
Additionally, peak strain tracking demonstrated that the formation of shear bands occurred earlier in textured microstructures, indicating a reduced forming limit. This highlights the detrimental effect of rolling-induced texture on formability.
In summary, the interplay between grain morphology, crystallographic orientation, and aspect ratio plays a critical role in governing the mechanical response and fracture characteristics of stainless steel sheets. These insights can aid in designing microstructures optimized for higher ductility and formability in sheet metal forming applications.
References
- ResearchGate Study. (2022). Numerical Investigation on Perforated Sheet Metals Under Tension Loading. https://www.researchgate.net/publication/359448739.
- De Gruyter Study. (2022). Numerical Investigation on Perforated Sheet Metals Under Tension Loading. Chemical Engineering Communications, 209(10), 1422–1435. https://www.degruyter.com/document/doi/10.1515/chem-2022-0142. [CrossRef]
- Roters, F., Eisenlohr, P., Bieler, T. R., & Raabe, D. (2010). Crystal Plasticity Finite Element Methods. Wiley-VCH.
- Jia, N., Eisenlohr, P., Roters, F., Raabe, D., & Zhao, X. (2012). Orientation Dependence of Shear Banding in FCC Single Crystals. Acta Materialia, 60(8), 3415–3434.
- Ma, Q., Marin, E. B., & Horstemeyer, M. F. (2010). Introduction to Crystal Plasticity Finite Element Method (CPFEM). Mississippi State University. PDF.
- Roters, F., et al. (2019). DAMASK – The Düsseldorf Advanced Material Simulation Kit.... Computational Materials Science, 158, 420–478.
- Huang, Y. (1991). A User-Material Subroutine Incorporating Single Crystal Plasticity in Finite Element Analysis. Mechanics Report 178, Harvard University.
- DAMASK website. Multiphysics Crystal Plasticity Framework. https://damask.mpie.de.
- He, Y., Heider, Y., & Markert, B. (2024). Embedding an ANN-Based Crystal Plasticity Model into FE via ABAQUS UMAT. arXiv preprint arXiv:2410.08214. https://arxiv.org/abs/2410.08214.
- Raabe, D. (1995). Investigation of the orientation dependence of plastic deformation and work hardening in f.c.c. and b.c.c. metals by crystal plasticity finite element analysis. Acta Metallurgica et Materialia, 43(2), 1025–1037. [CrossRef]
- Uenishi, A., Isogai, E., Sugiura, N., & Hiwatashi, S. (2013). Crystal plasticity analysis of work hardening behavior at large strains and its relationship with crystal orientation. Nippon Steel Technical Report, (102), 55–65. https://www.nipponsteel.com/en/tech/report/nsc/pdf/102_11_Uenishi.pdf.
- Asaro, R. J. (1983). Micromechanics of crystals and polycrystals. Advances in Applied Mechanics, 23, 1–115. [CrossRef]
- Kalidindi, S. R., Bronkhorst, C. A., & Anand, L. (1992). Crystallographic texture evolution in bulk deformation processing of FCC metals. Journal of the Mechanics and Physics of Solids, 40(3), 537–569. [CrossRef]
Figure 1.
Geometry of subsize tensile specimens according to ASTM E8.
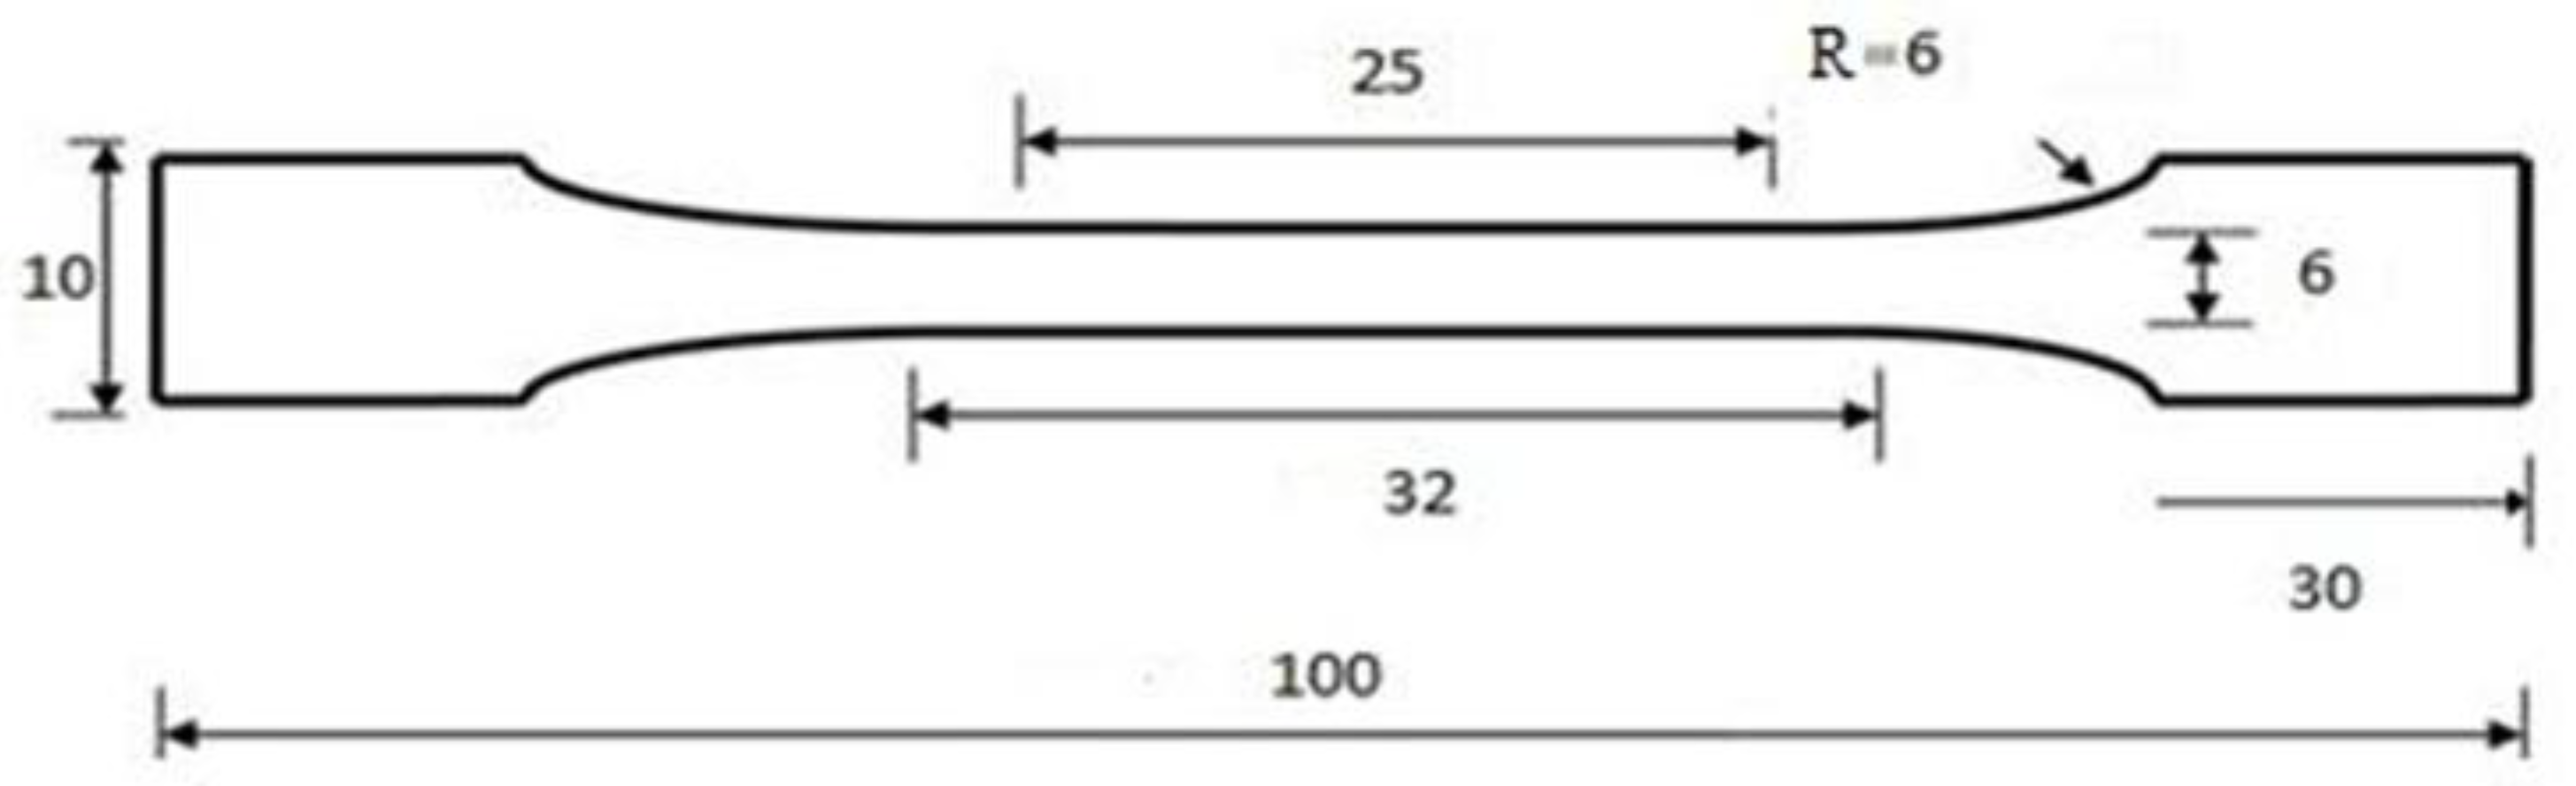
Figure 2.
Mounting of tensile specimen in the testing machine.
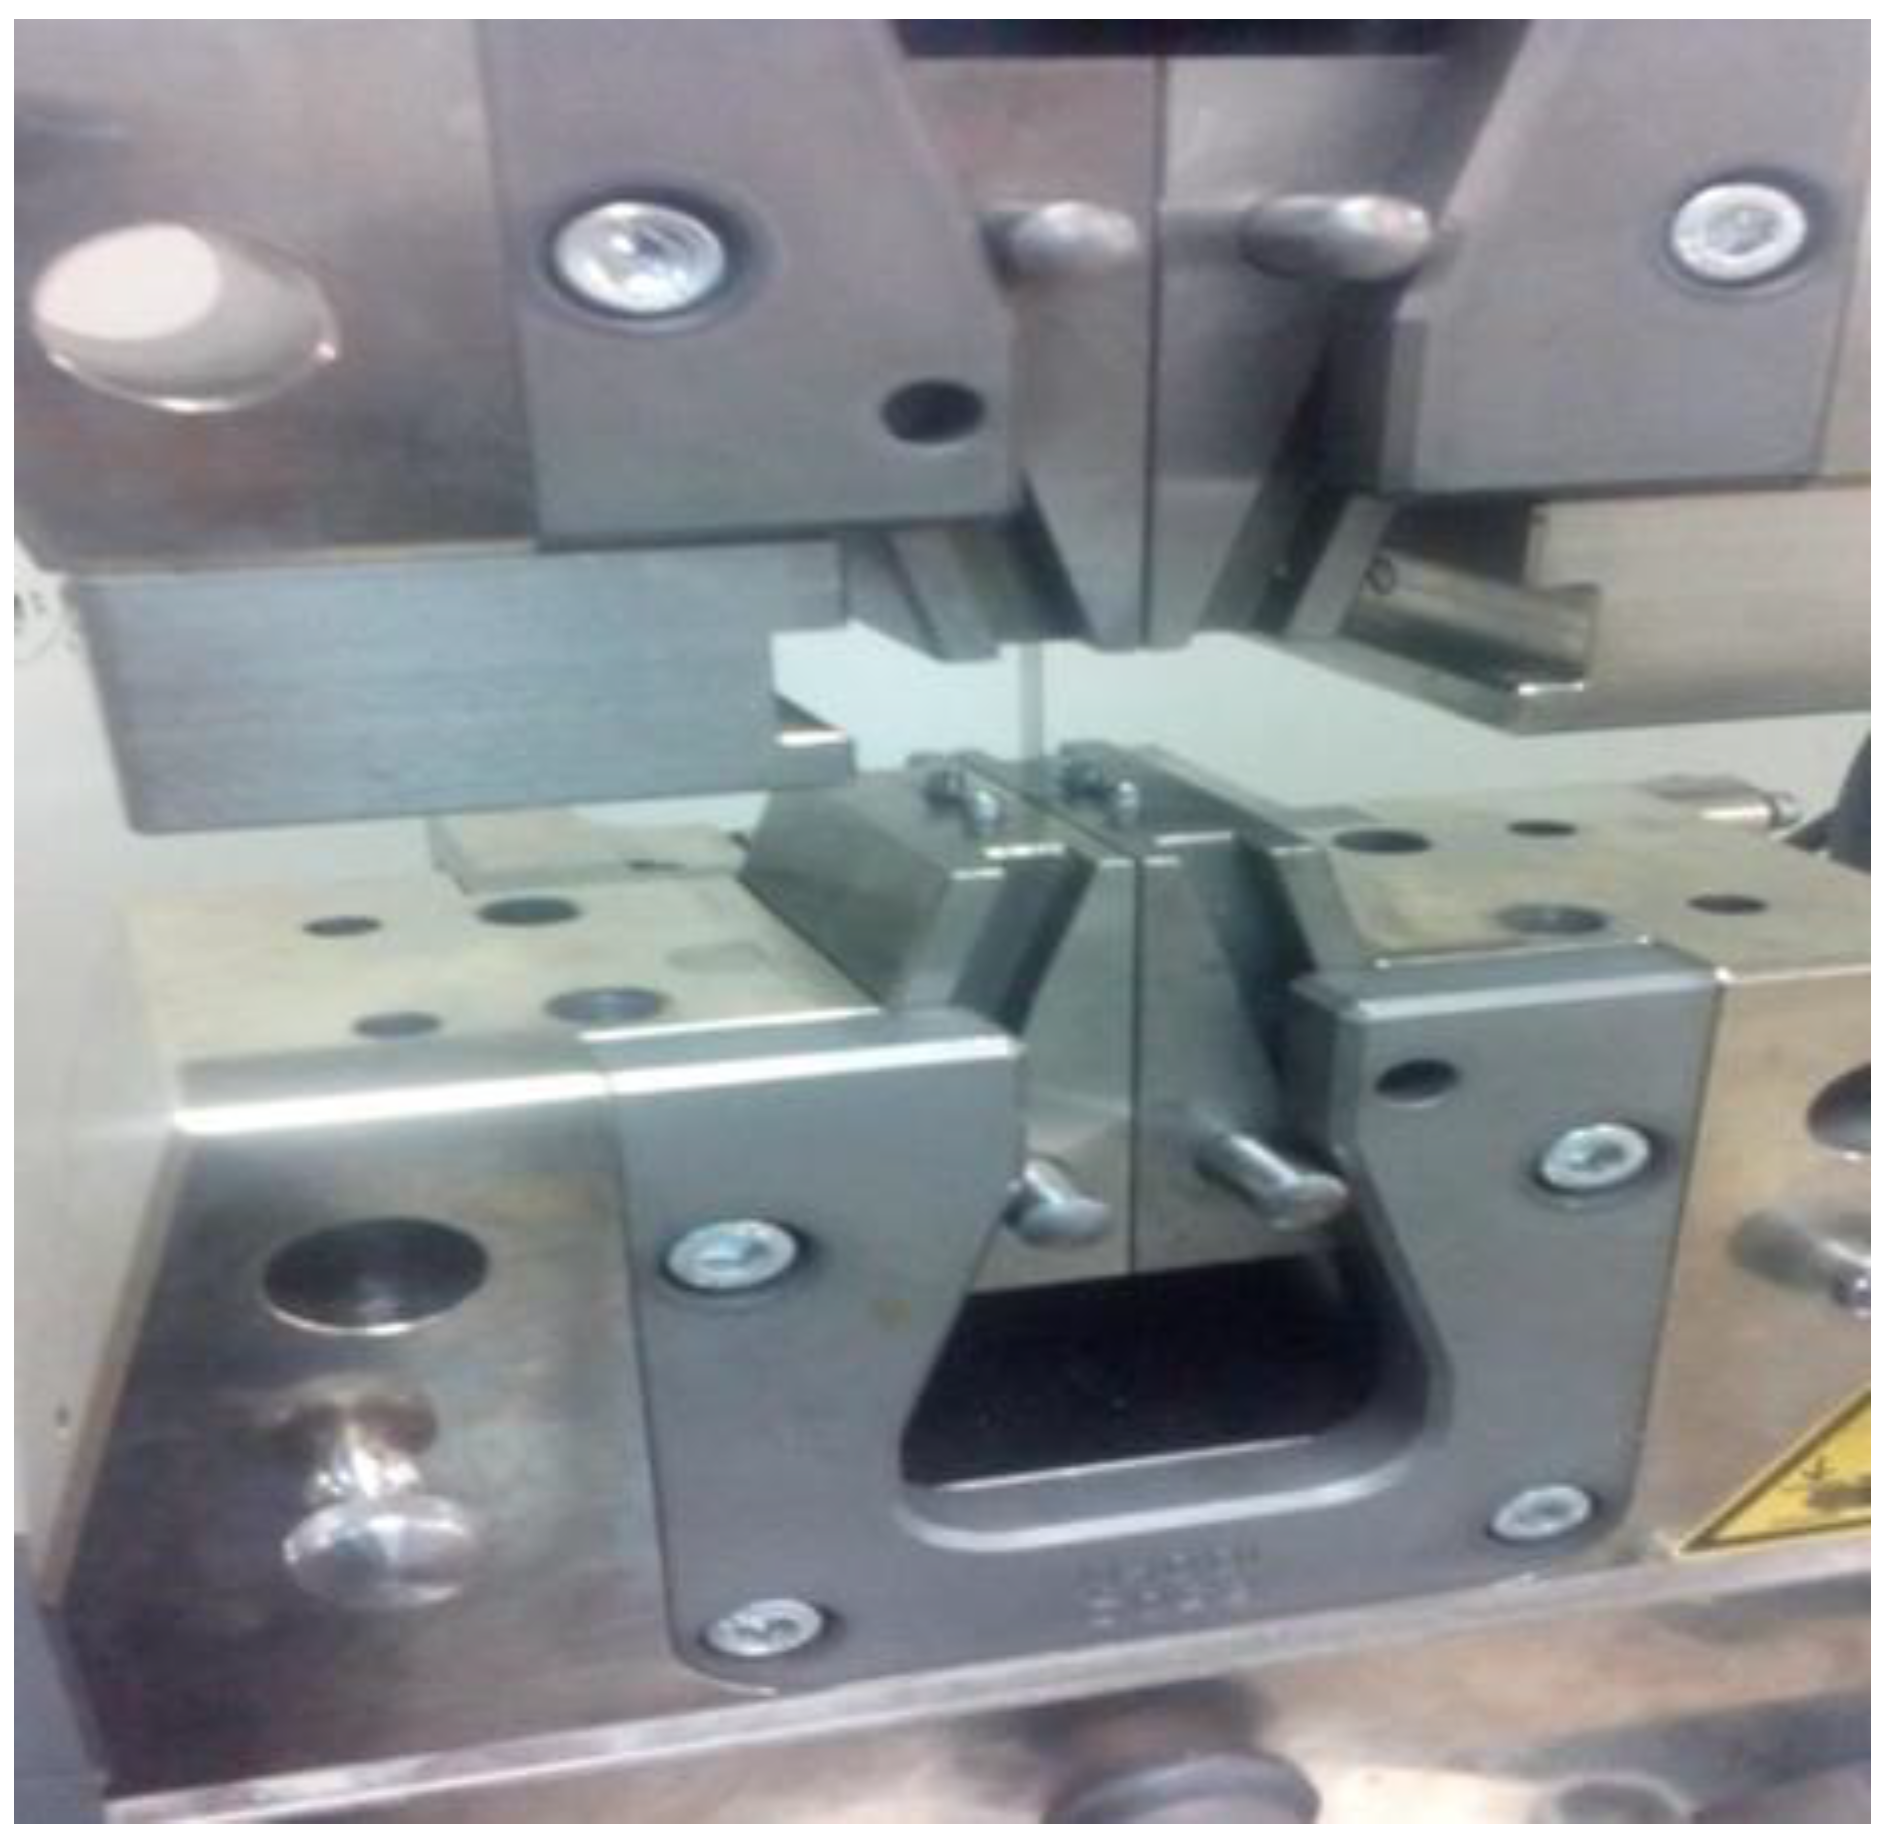
Figure 3.
Engineering stress–strain curves for (a) RD, (b) RD-45, and (c) TD specimens.

Figure 4.
Optical micrographs of the cold-rolled AISI 304 sheet showing elongated austenitic.

Figure 6.
Crystal orientation relative to the sample coordinate system.
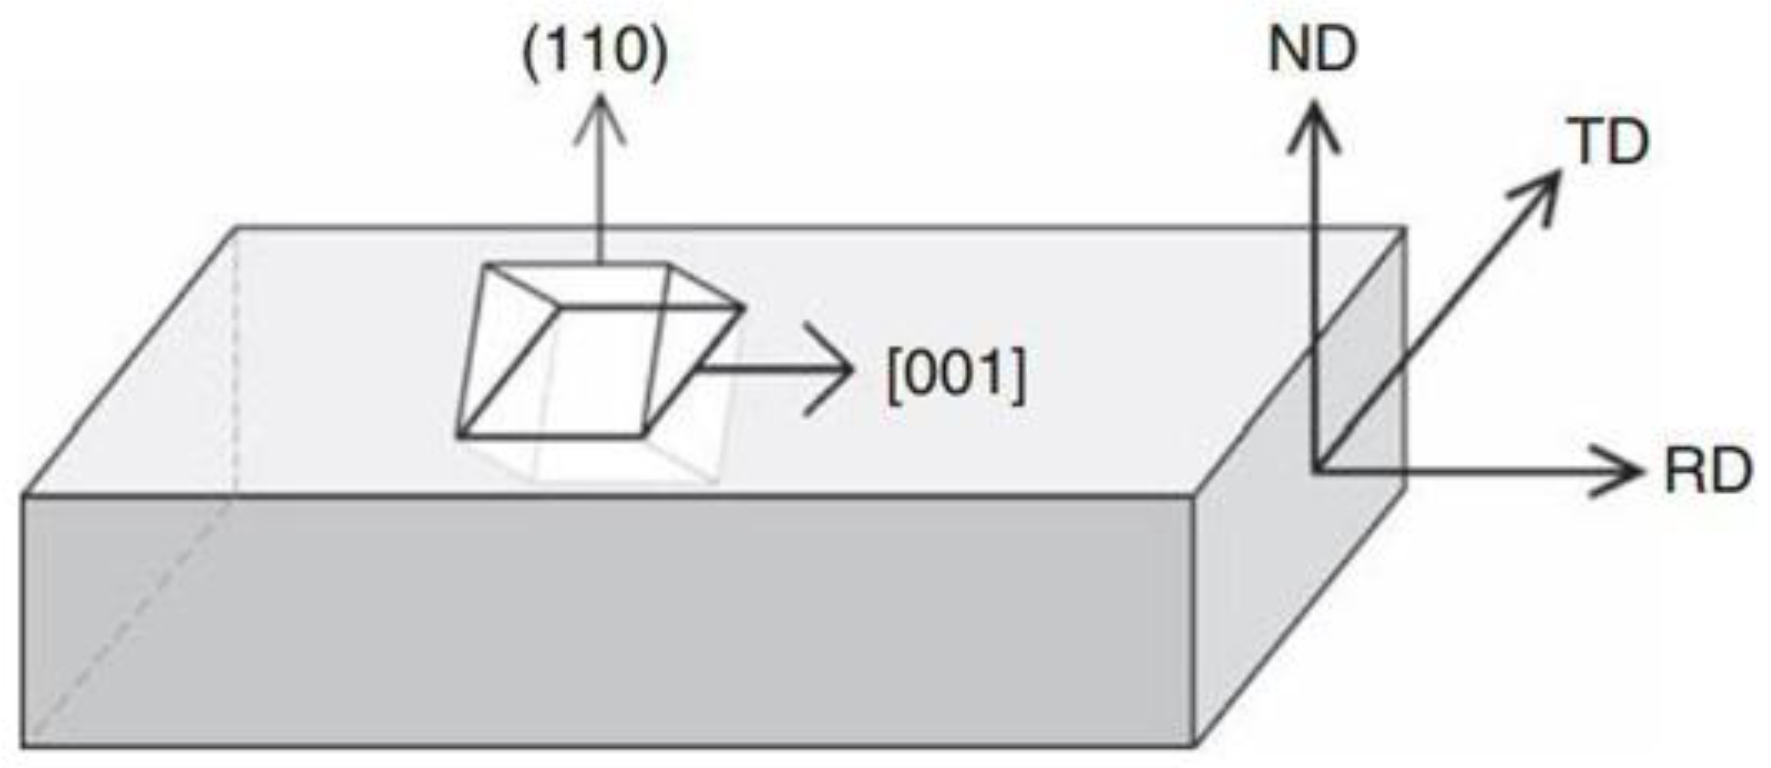
Figure 7.
(a) Calibration of simulated and experimental stress–strain curves for the random (equiaxed) microstructure; (b) Calibration for elongated grain structure.
Figure 7.
(a) Calibration of simulated and experimental stress–strain curves for the random (equiaxed) microstructure; (b) Calibration for elongated grain structure.
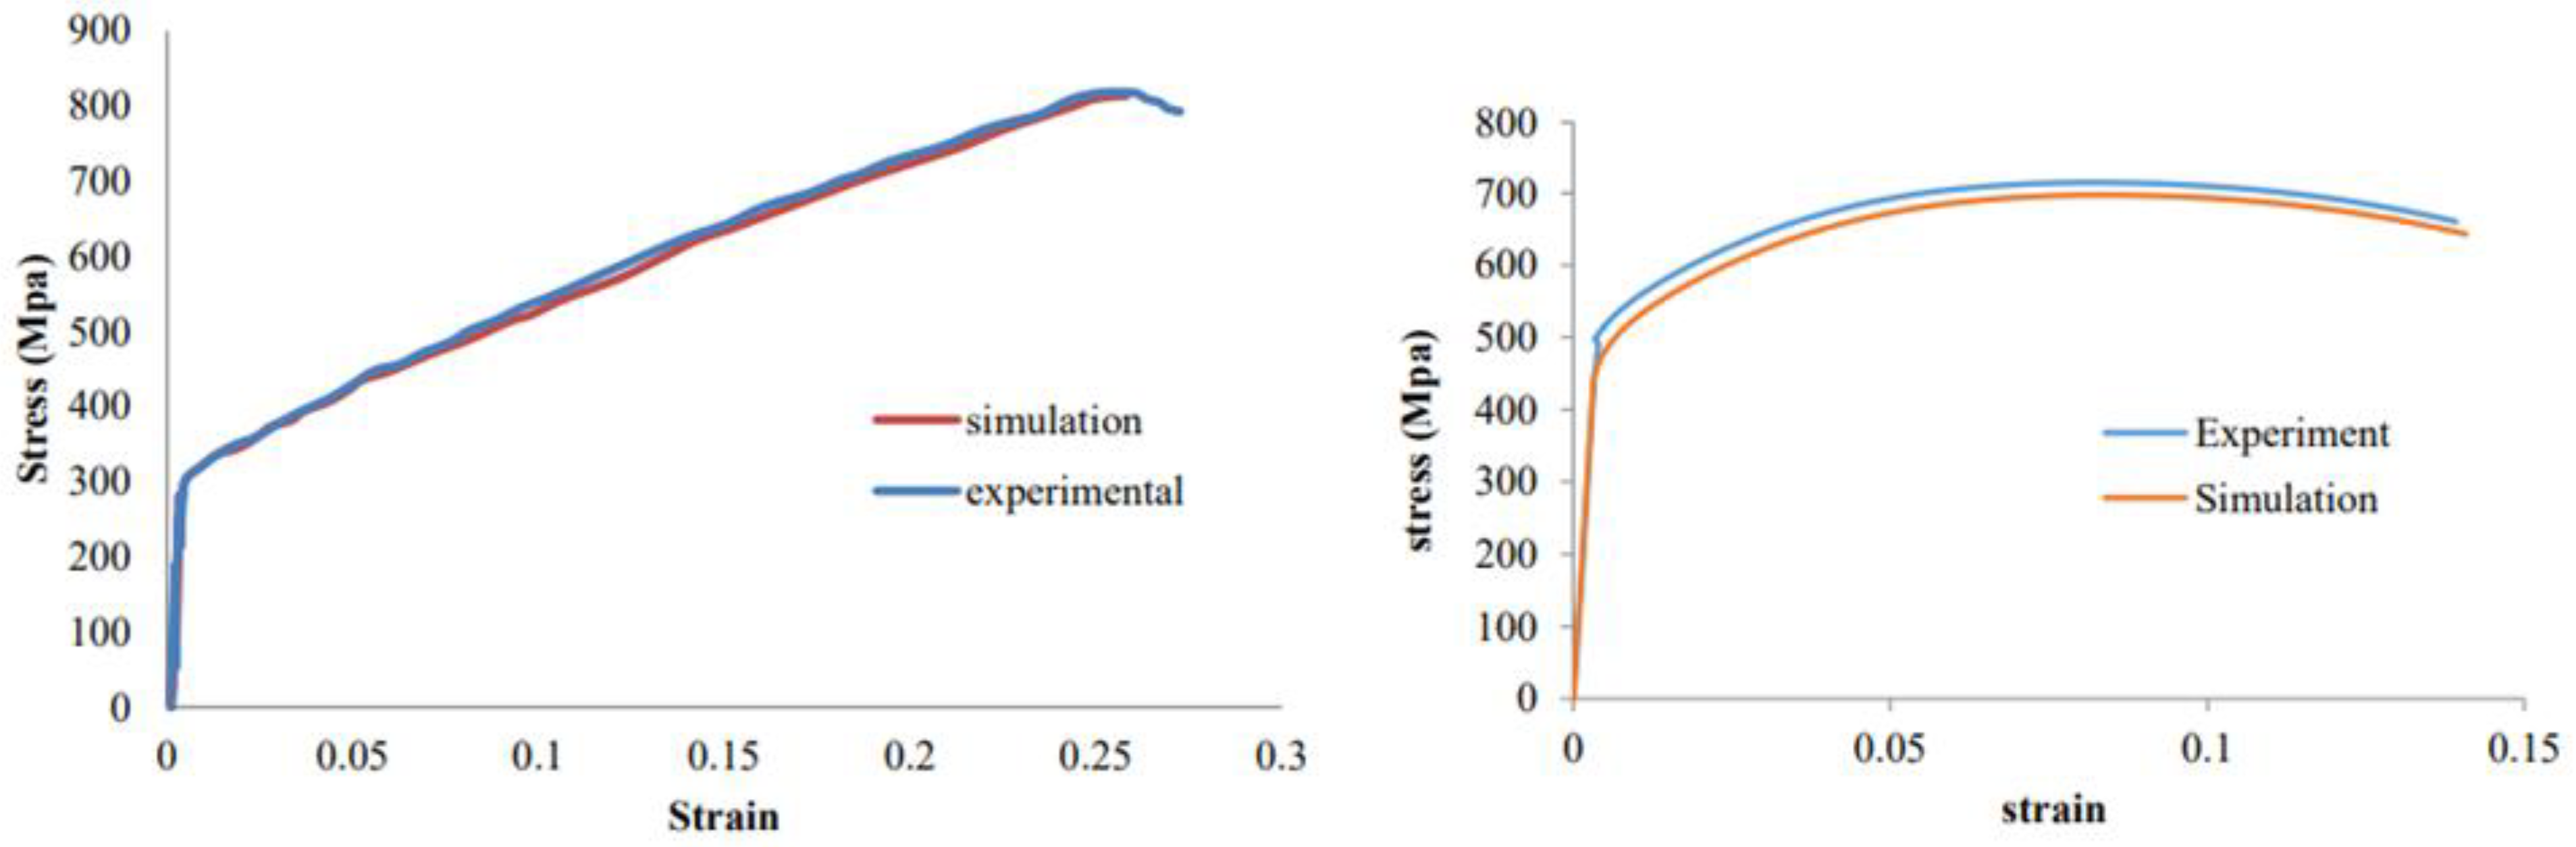
Figure 8.
Dimensions and aspect ratios of polycrystalline samples with equiaxed grains (random microstructure).
Figure 8.
Dimensions and aspect ratios of polycrystalline samples with equiaxed grains (random microstructure).
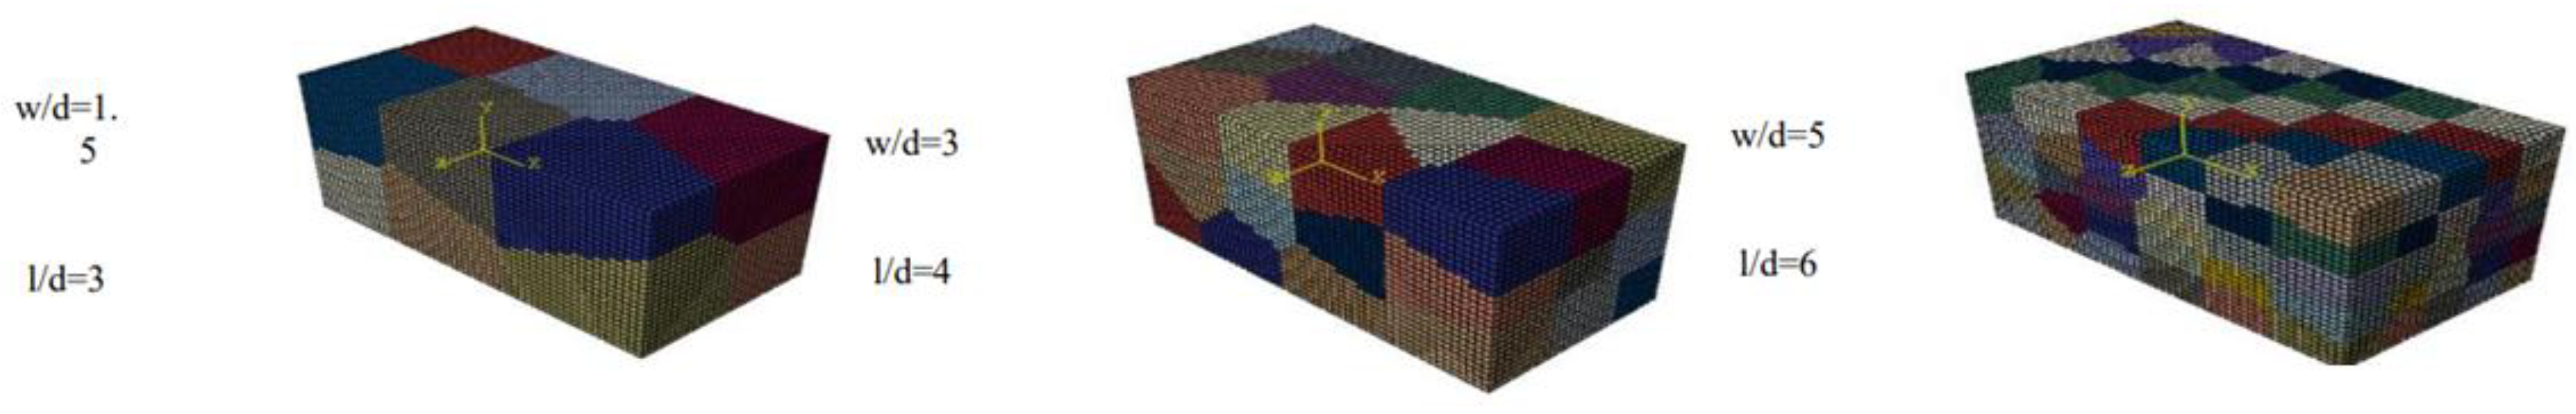
Figure 9.
Variation of final macroscopic fracture strain with aspect ratio for random microstructure.
Figure 9.
Variation of final macroscopic fracture strain with aspect ratio for random microstructure.
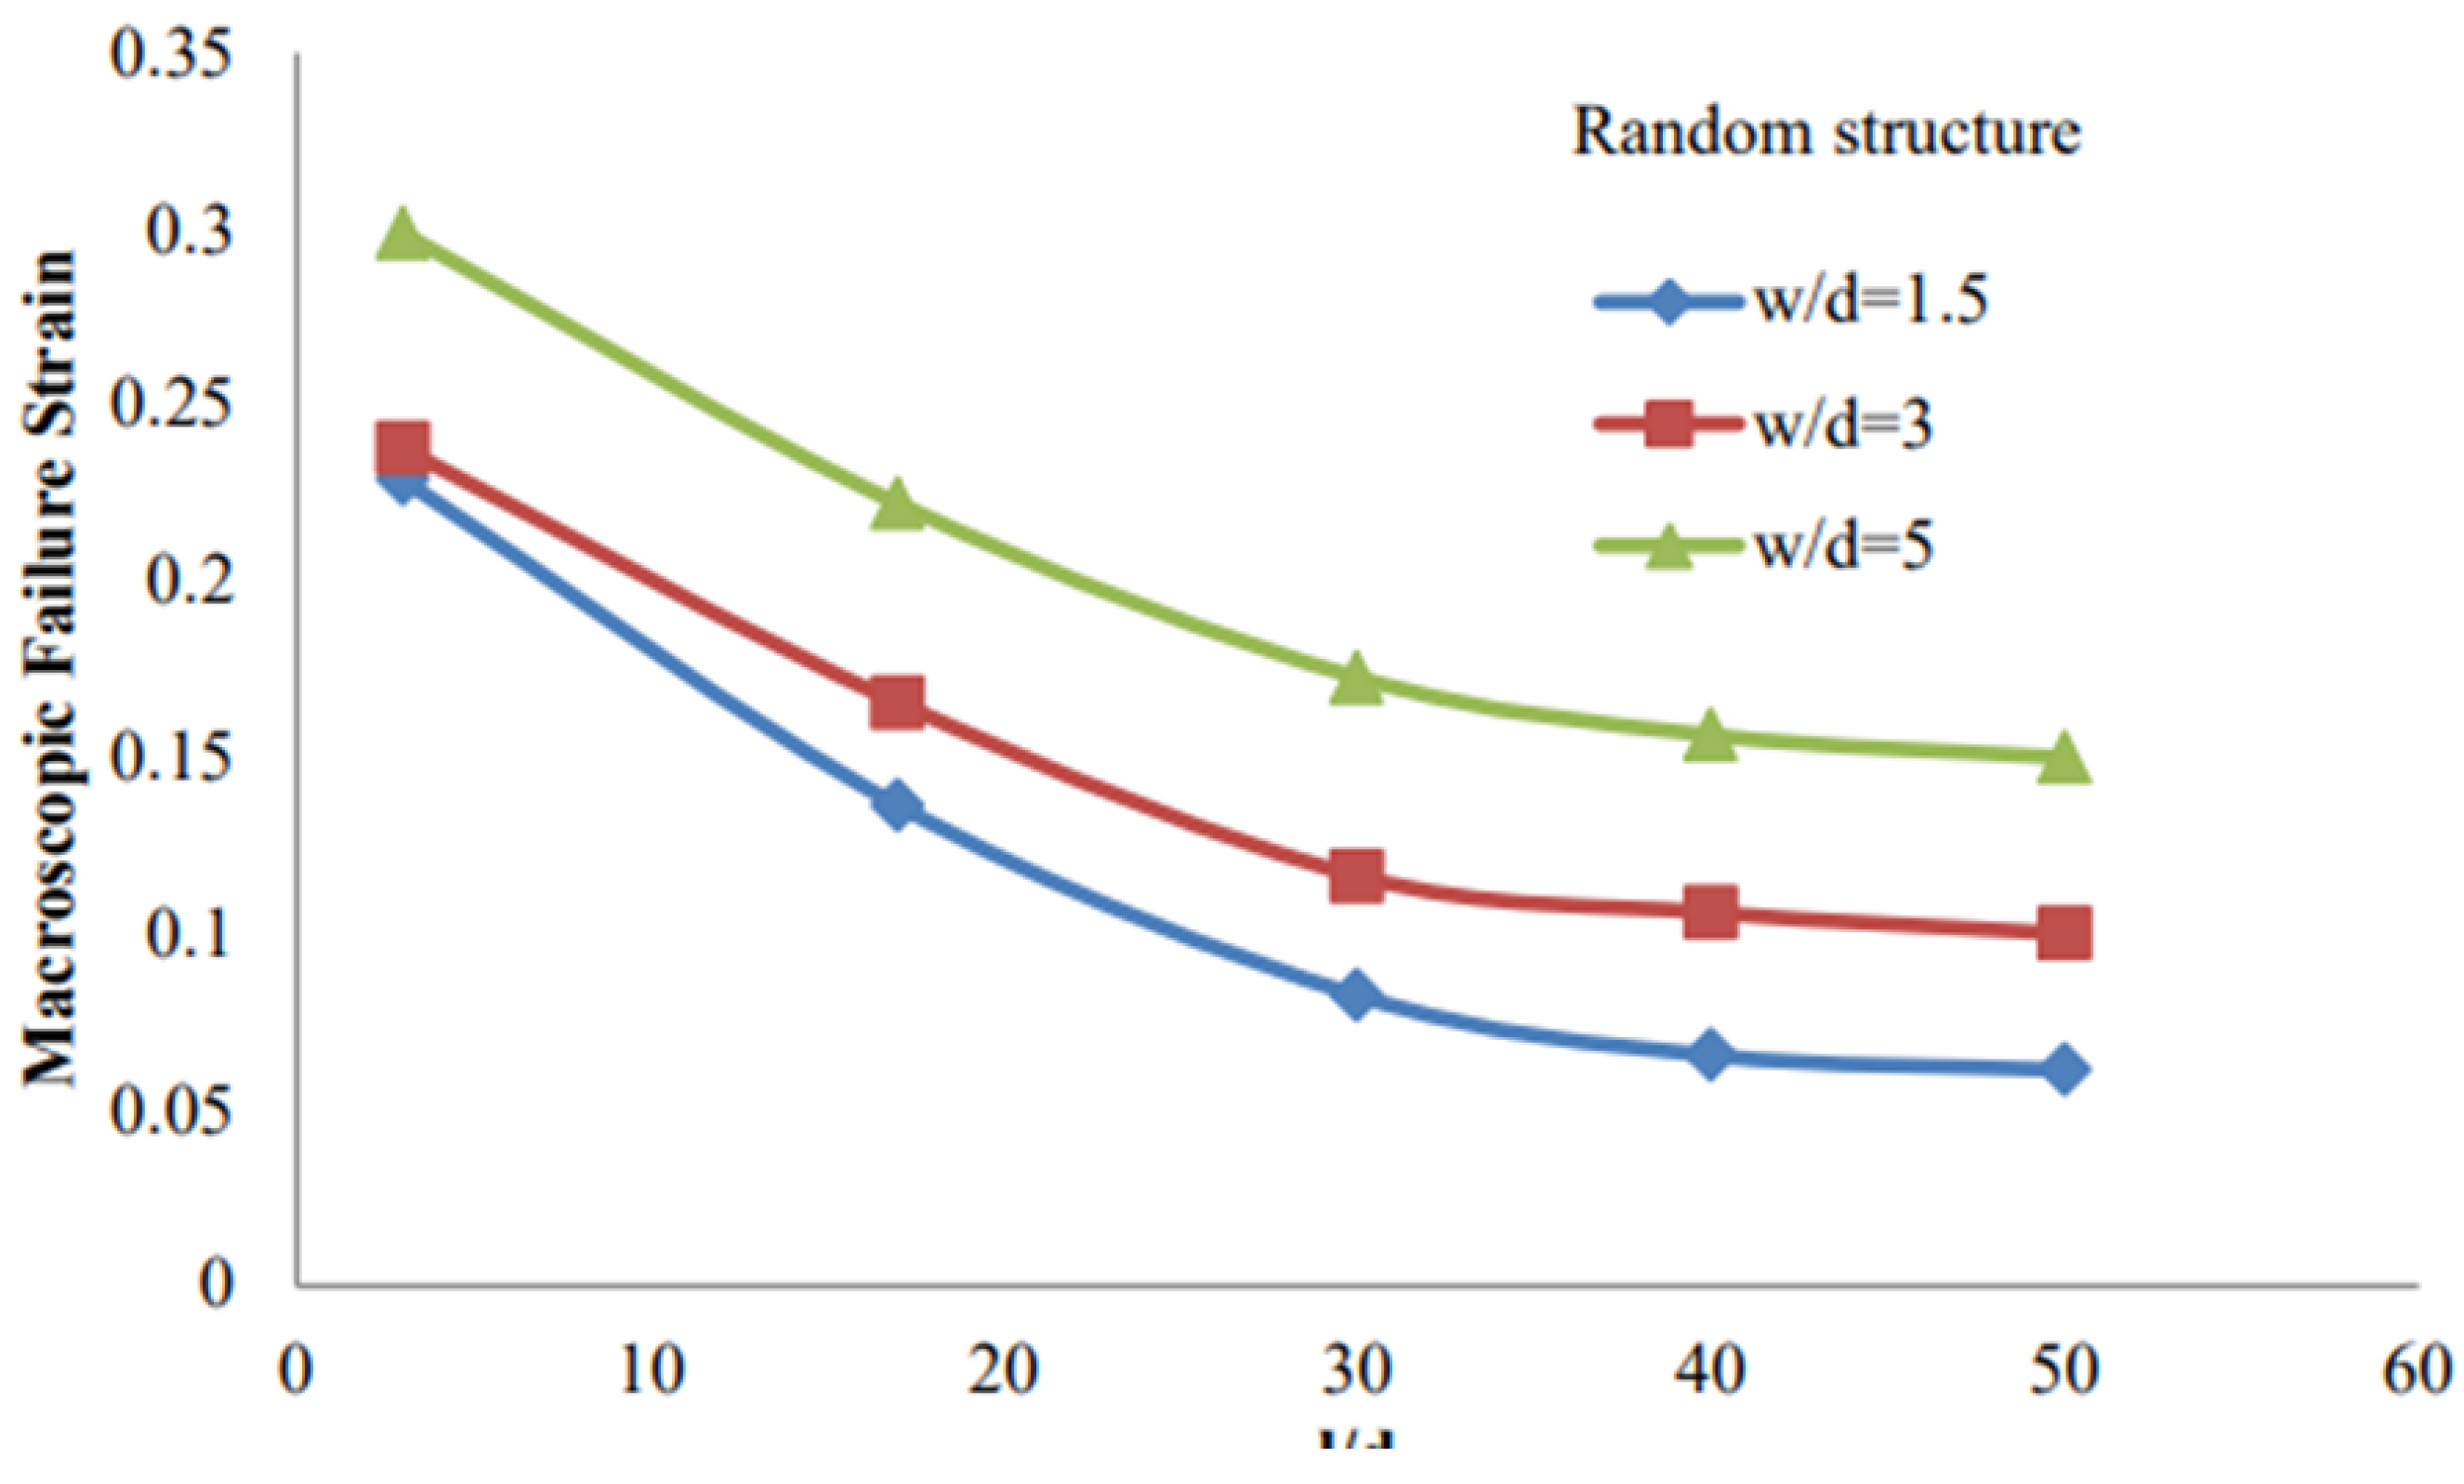
Figure 10.
Grain-level fracture strain distribution relative to the macroscopic fracture strain in random microstructure.
Figure 10.
Grain-level fracture strain distribution relative to the macroscopic fracture strain in random microstructure.
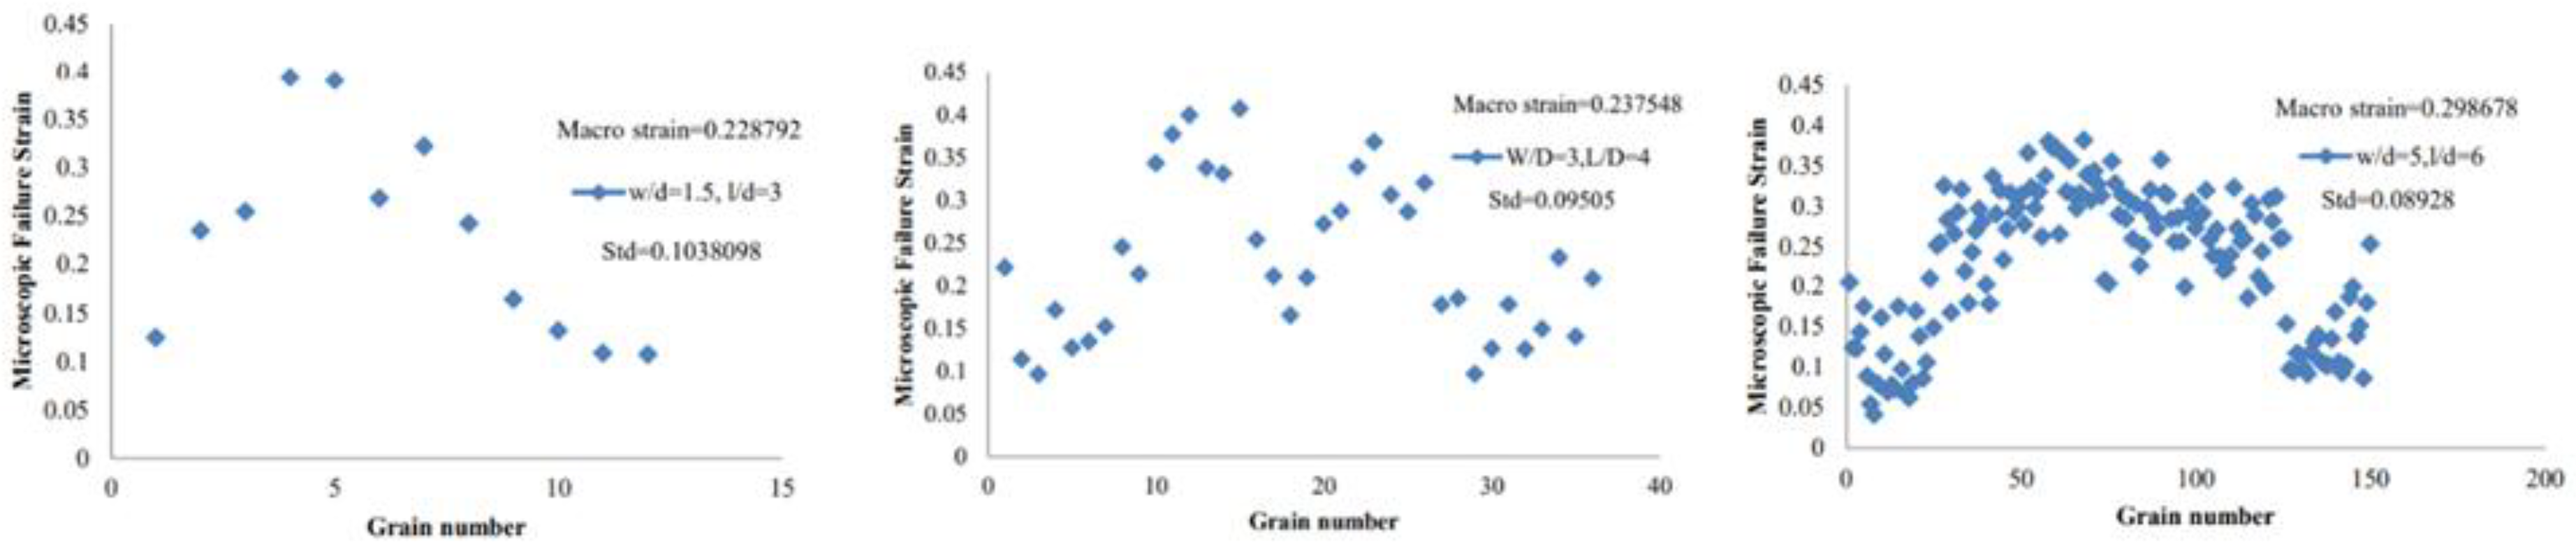
Figure 11.
Examples of polycrystalline models with textured microstructure (elongated grains).
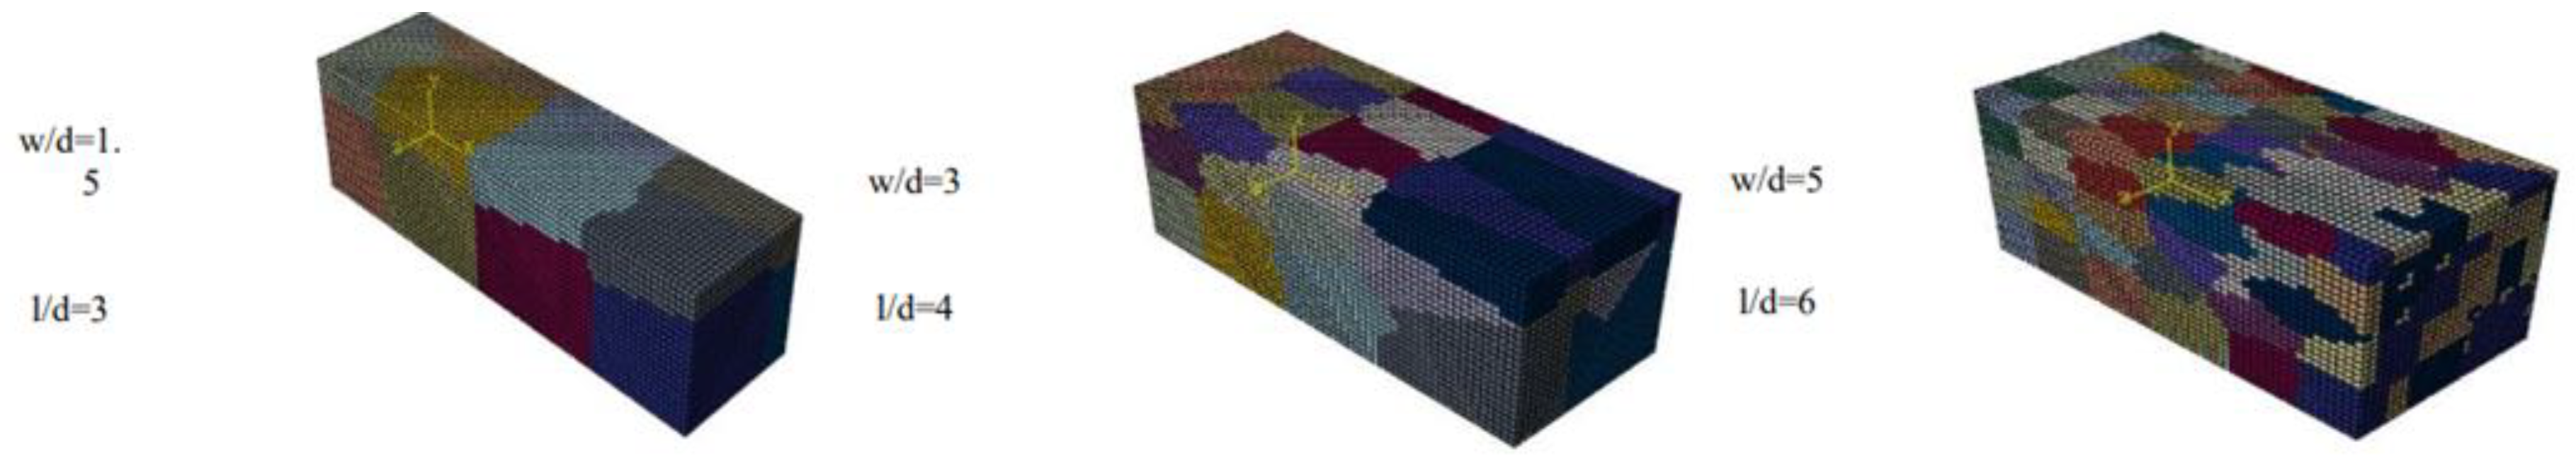
Figure 12.
Variation of final macroscopic fracture strain with aspect ratio (w/d and l/d) for textured microstructure.
Figure 12.
Variation of final macroscopic fracture strain with aspect ratio (w/d and l/d) for textured microstructure.
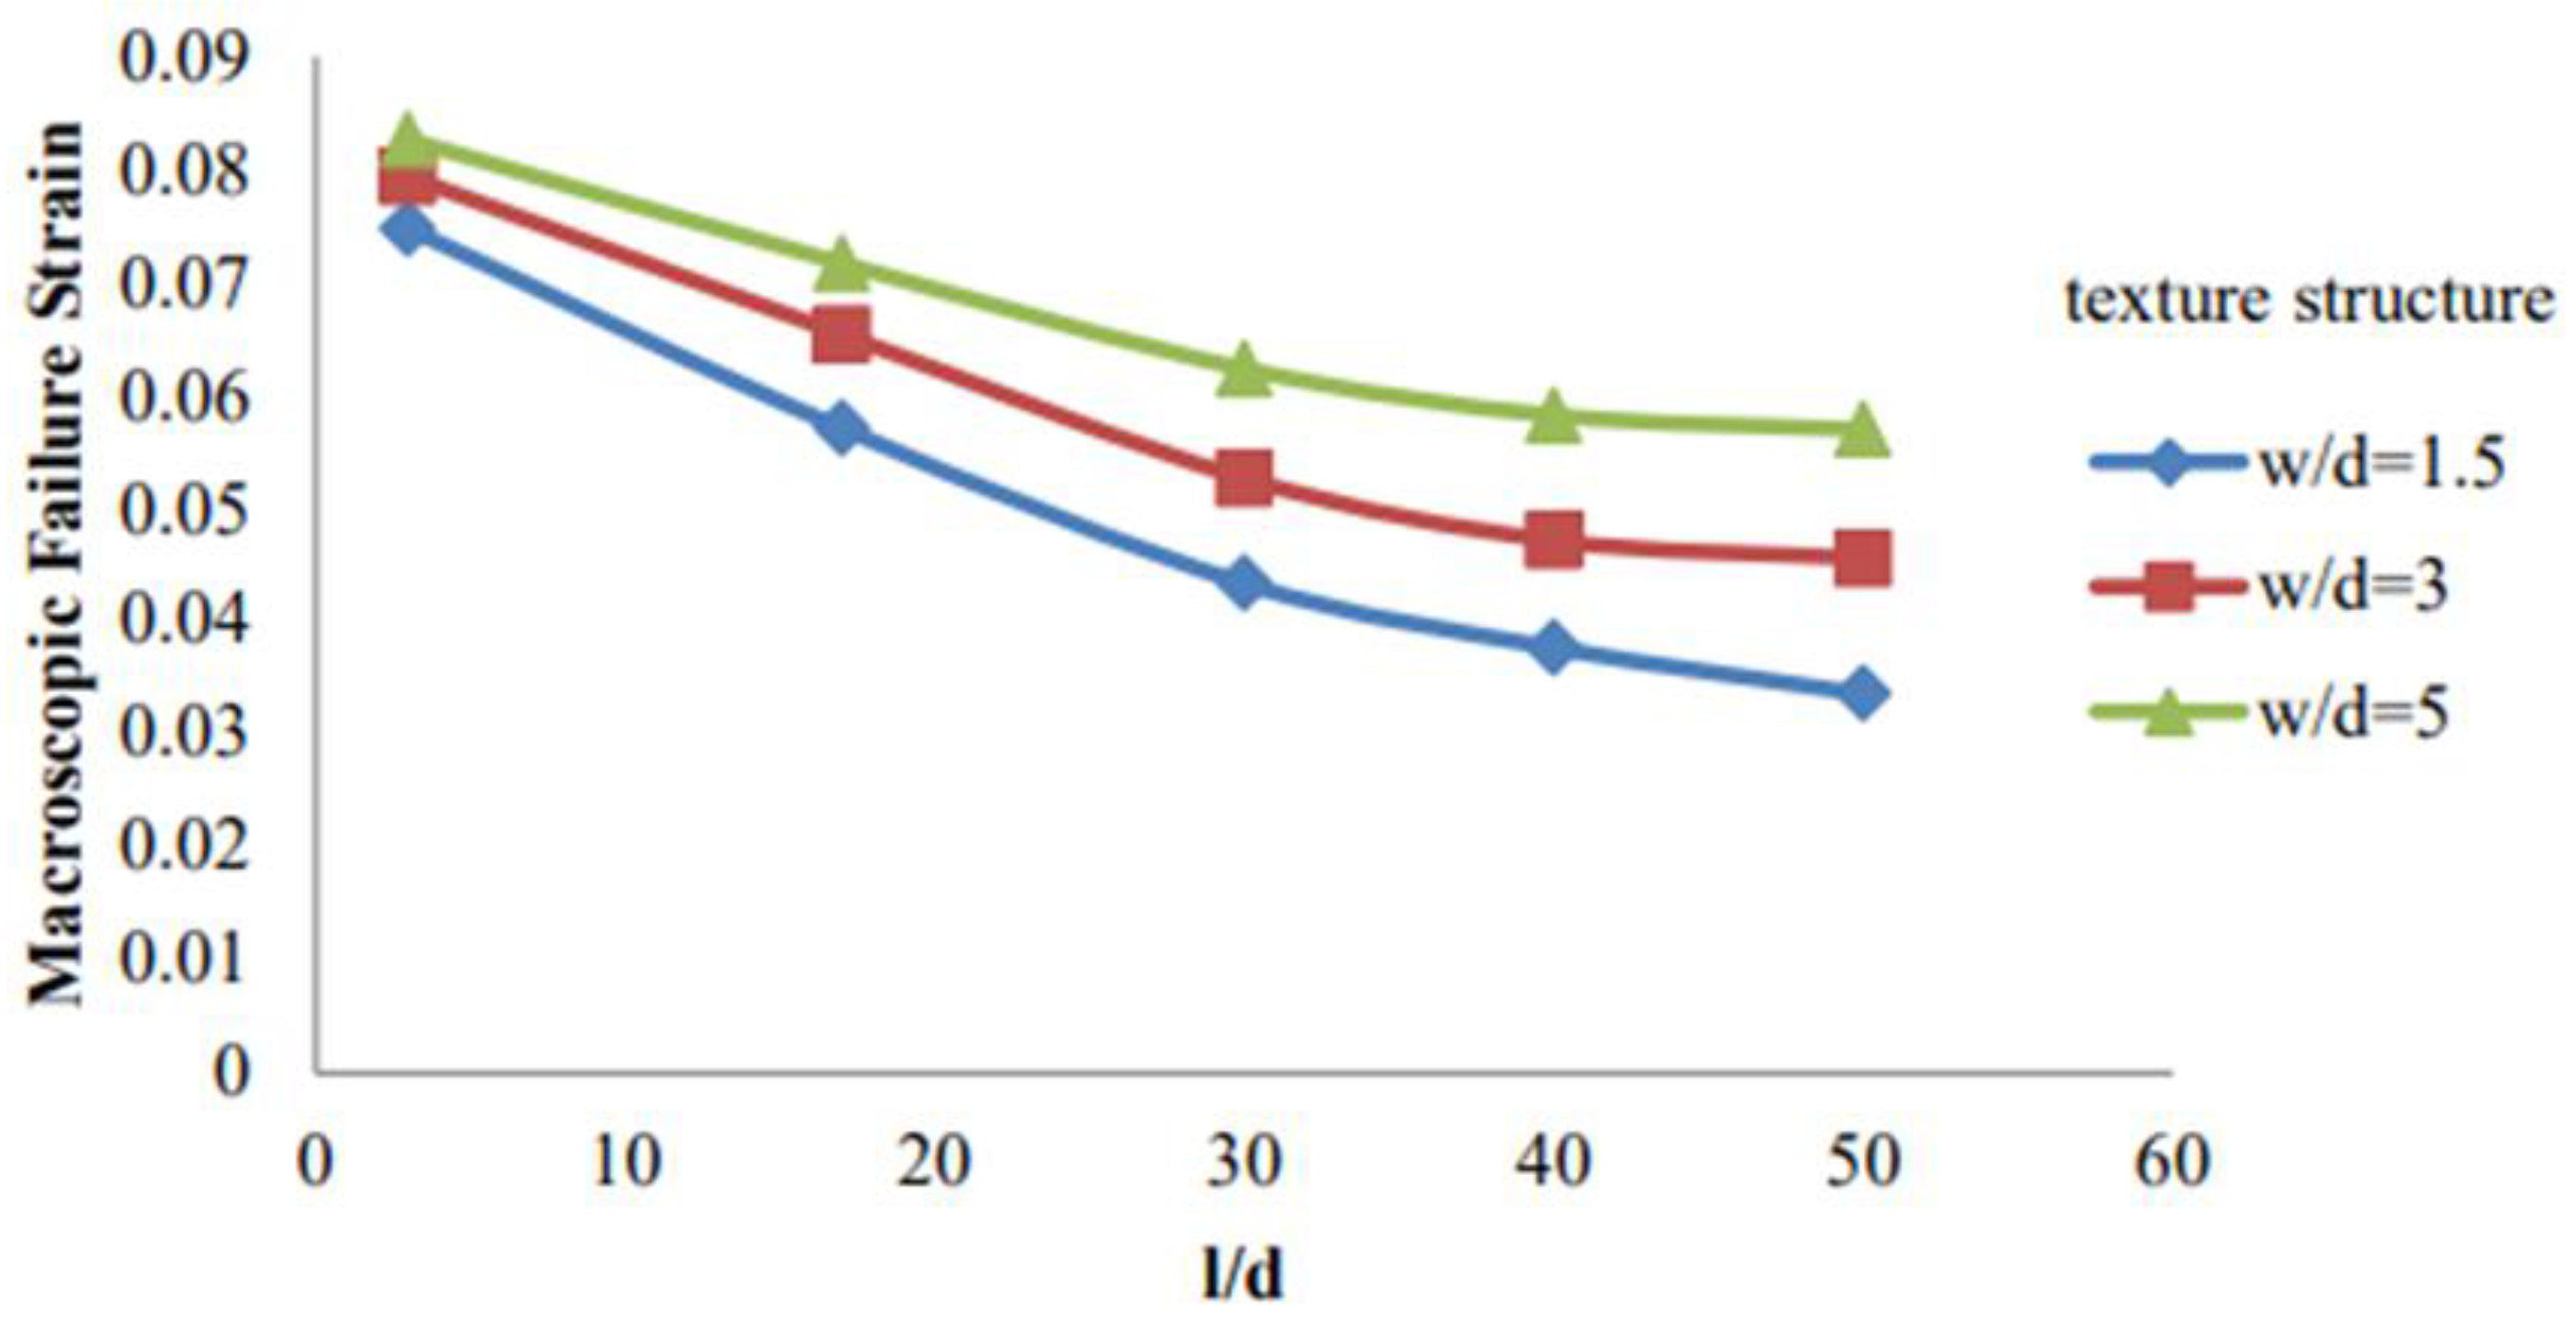
Figure 13.
Comparison of final macroscopic fracture strain for random vs. textured microstructures at constant aspect ratio.
Figure 13.
Comparison of final macroscopic fracture strain for random vs. textured microstructures at constant aspect ratio.
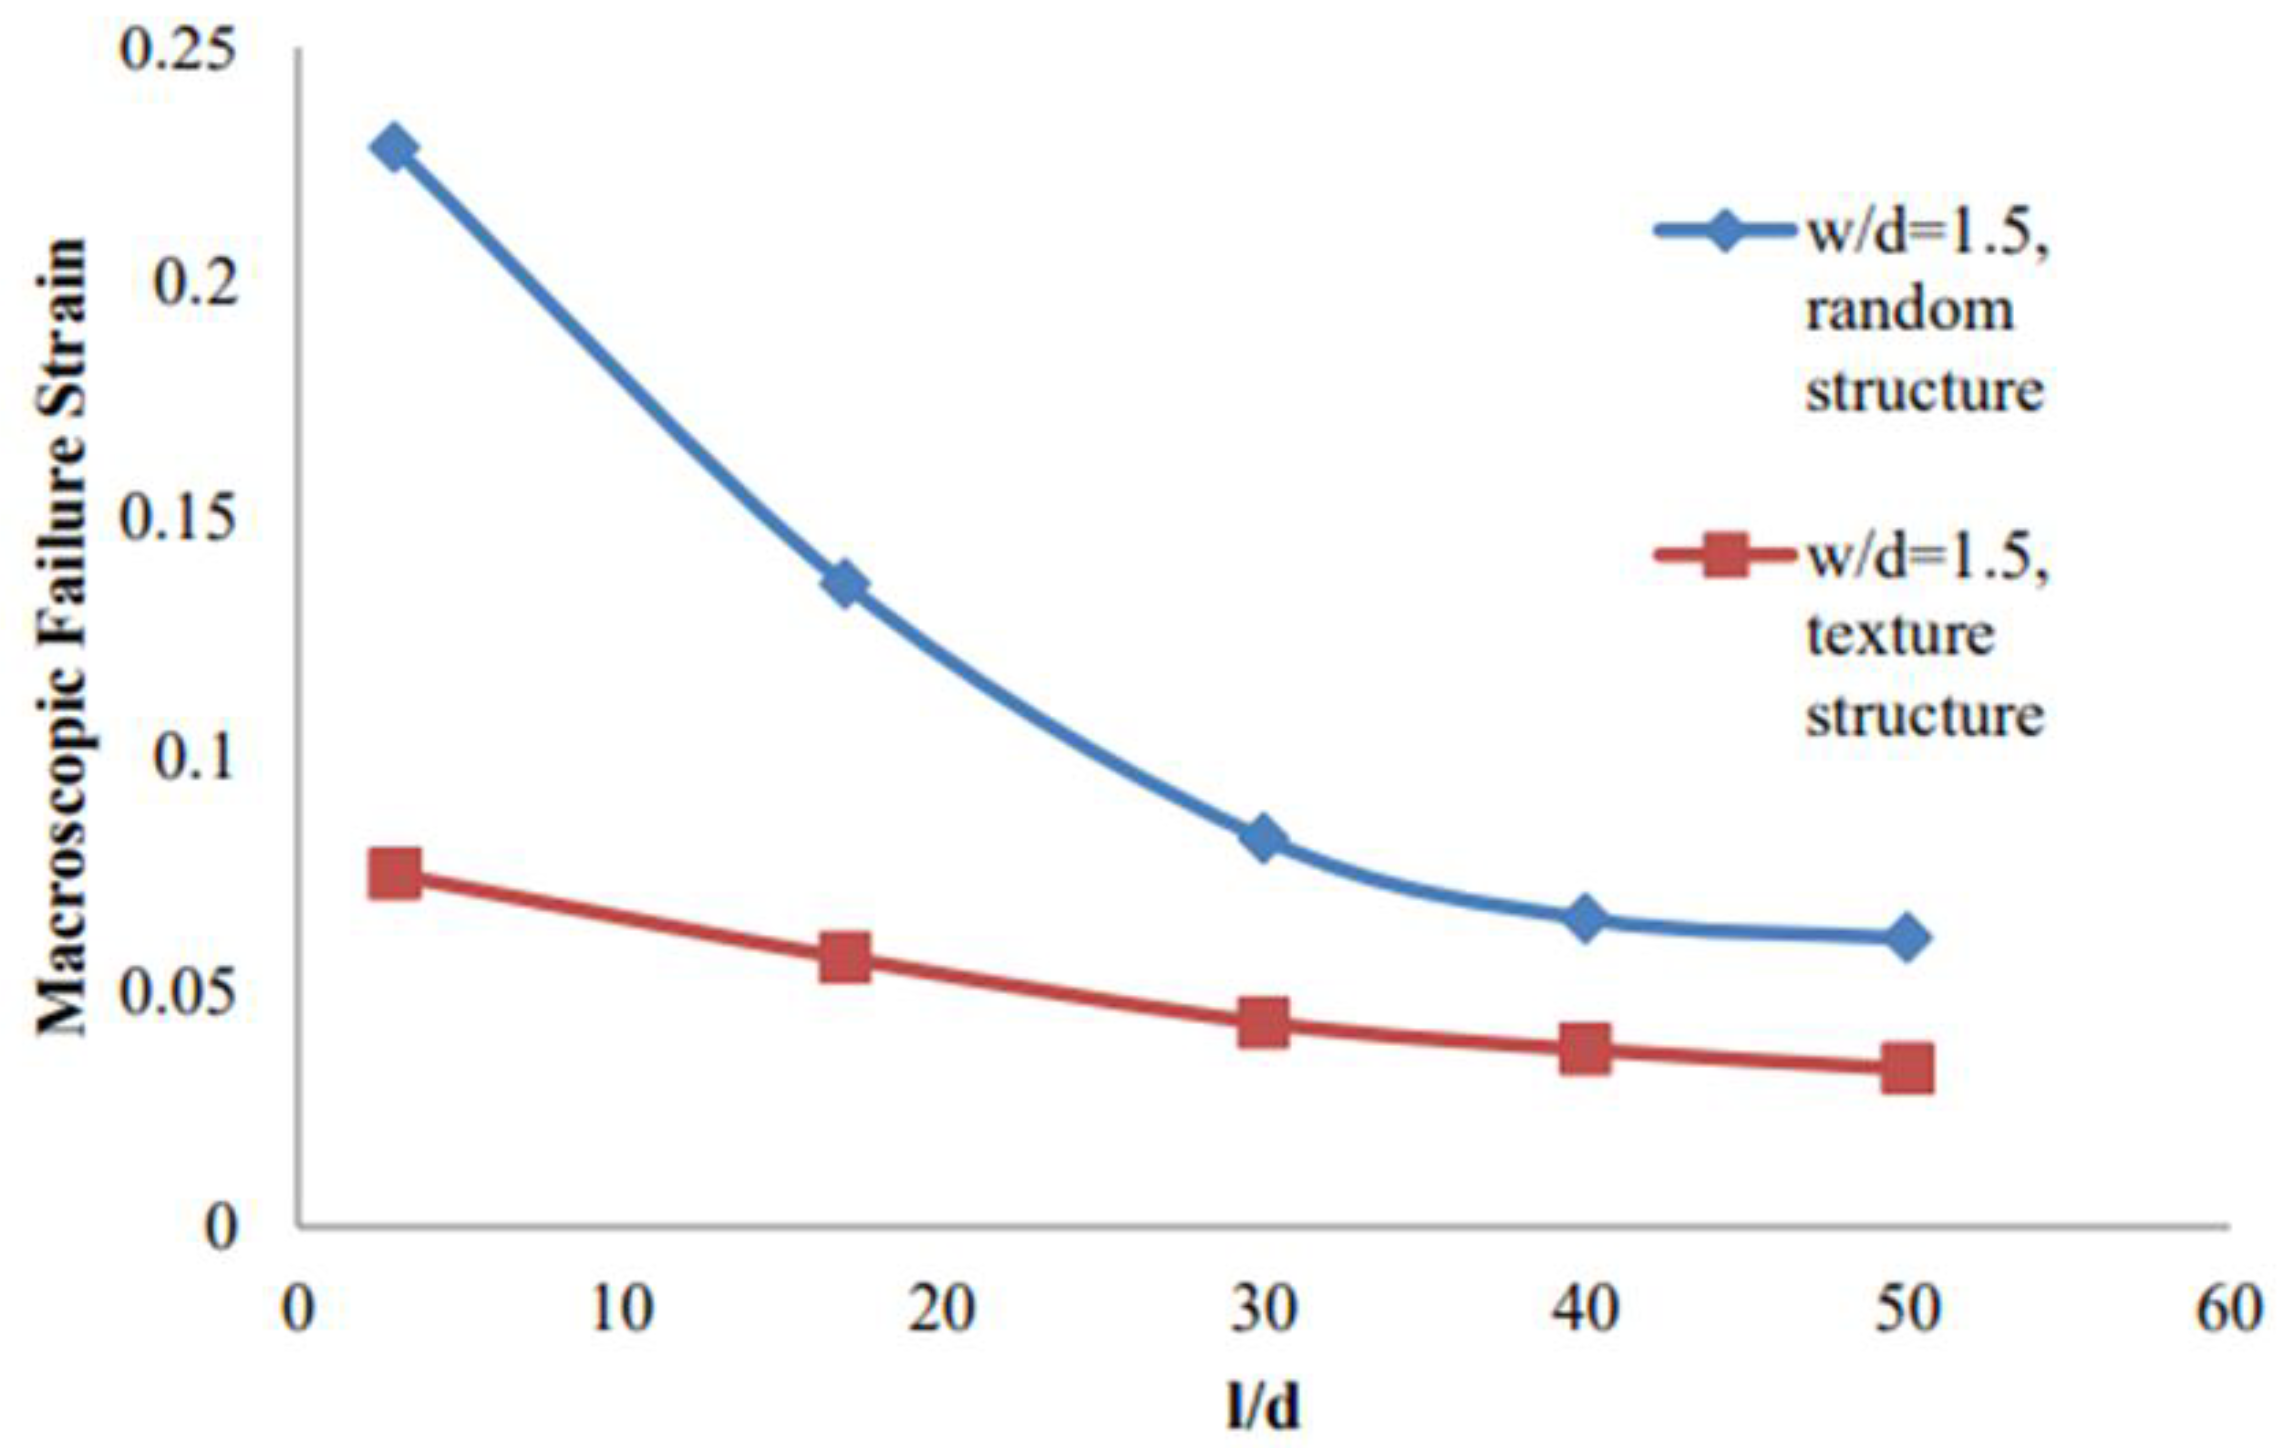
Figure 14.
Grain-level fracture strain distribution in textured microstructures with elongated grains.
Figure 14.
Grain-level fracture strain distribution in textured microstructures with elongated grains.
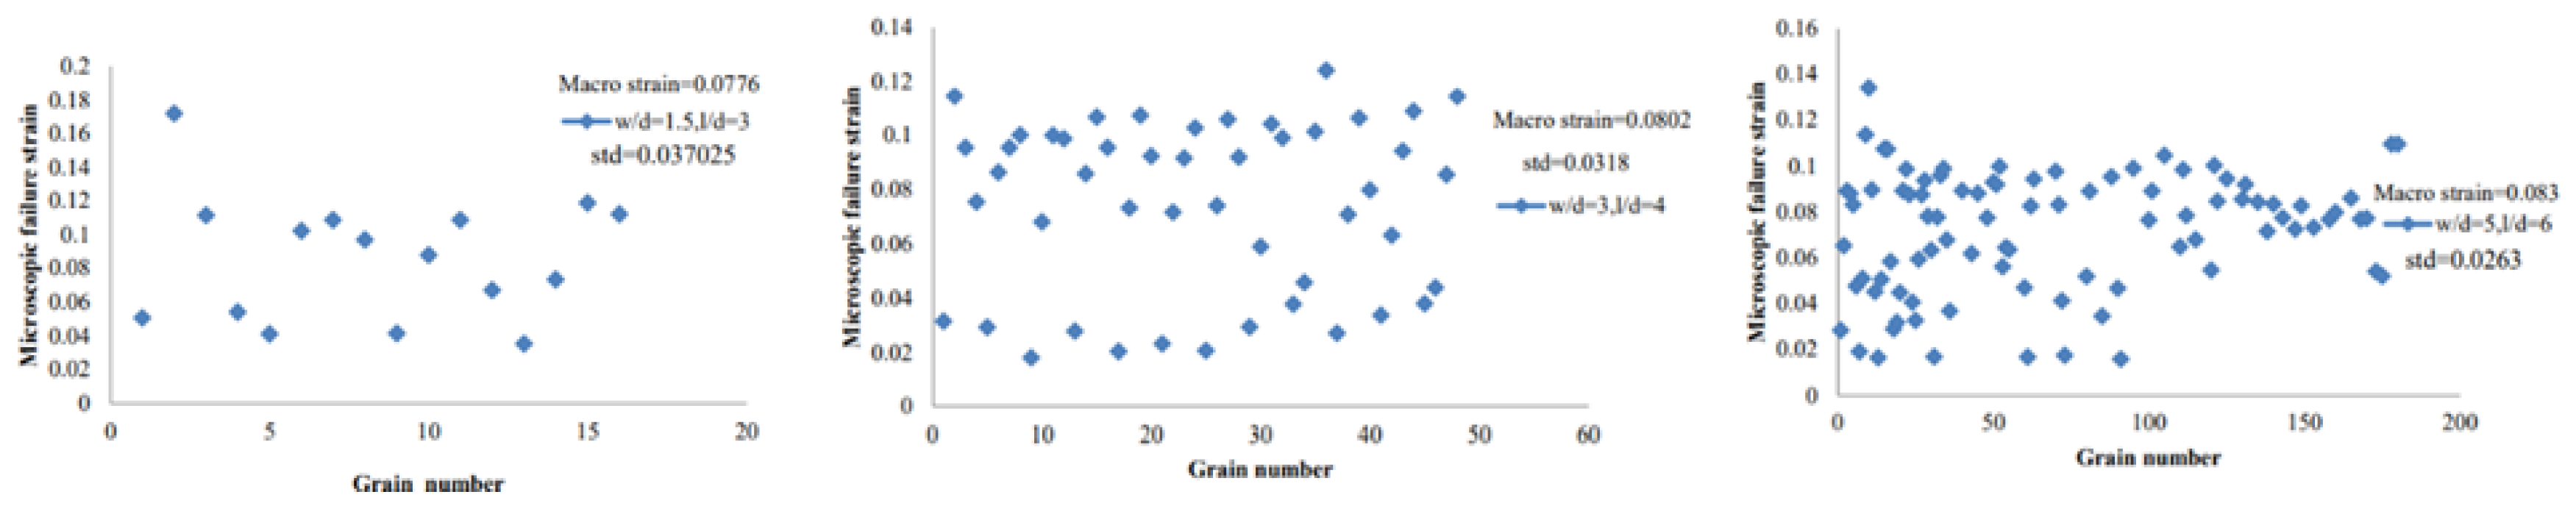
Figure 15.
Peak principal strain evolution for random and textured microstructures under varying macroscopic strain levels.
Figure 15.
Peak principal strain evolution for random and textured microstructures under varying macroscopic strain levels.
Disclaimer/Publisher’s Note: The statements, opinions and data contained in all publications are solely those of the individual author(s) and contributor(s) and not of MDPI and/or the editor(s). MDPI and/or the editor(s) disclaim responsibility for any injury to people or property resulting from any ideas, methods, instructions or products referred to in the content. |
© 2025 by the authors. Licensee MDPI, Basel, Switzerland. This article is an open access article distributed under the terms and conditions of the Creative Commons Attribution (CC BY) license (http://creativecommons.org/licenses/by/4.0/).
Copyright: This open access article is published under a Creative Commons CC BY 4.0 license, which permit the free download, distribution, and reuse, provided that the author and preprint are cited in any reuse.


