
Submitted:
06 August 2025
Posted:
07 August 2025
You are already at the latest version
Abstract
The oxidization of sulfur dioxide (SO2) occurs in the gas and liquid-phase and this oxidation contributes to particulate matter and acid precipitation. The production of sulfate particles is significant because of their impacts on climate, precipitation acidification, and human health. In this paper the focus is on the oxidation of SO2 and on the possibility of unknown heterogeneous reactions that may occur on sulfate aerosol surfaces. These results are based on aa reanalysis of a foundational set of SO2 laboratory oxidation measurements. The experiments involved two sets of photochemical studies of nitrous acid (HONO), nitrogen oxides (NOx = NO + NO2), SO2, carbon monoxide (CO) and water vapor (H2O) mixtures made in molecular nitrogen (N2) with trace of molecular oxygen or in synthetic air. The reanalysis strongly suggests that there are uncharacterized processes for the oxidation of SO2 that are nearly three times faster than the known gas-phase reactions. The uncharacterized processes may involve sulfate aerosol surface reactions in the presence of nitrogen oxides. If these processes can be included in current atmospheric chemistry models, greater conversion rates of SO2 to sulfate aerosol will be calculated and this may reduce modelling bias.
Keywords:
particulate matter
; sulfur dioxide
; sulfate particles
; aerosol
; gas-oxidation
; heterogeneous processes
1. Introduction
The oxidation of sulfur dioxide (SO2) produces products that are significant sources of atmospheric particulate matter and acid precipitation (acid rain) [1,2,3,4]. The products, small droplets of liquid sulfuric acid (H2SO4), bisulfate (HSO4-) and sulfate (SO4=) have consequences for health, agriculture, climate, etc. SO2 is emitted from many natural and anthropogenic sources [4,5]. The greatest source of sulfur emissions into the atmosphere comes from biological processes in the Earth’s oceans and this means that these sources are stronger in the southern hemisphere. Dimethyl sulfide (DMS, CH3SCH3) constitutes a significant fraction of the sulfurous emissions from the oceans [5,6,7,8,9,10]. Hydrogen sulfide (H2S) is another biogenically emitted compound. H2S and DMS are converted to SO2 by a complicated chemical reaction mechanism [11].
Natural sources of SO2 include volcanoes [5] and its photochemical production from biogenic emissions such as hydrogen sulfide (H2S) and dimethyl sulfide (CH3SCH3) Biomass burning, i.e. wildfires, is an underappreciated source of sulfurous compound emissions [12]. The wildfire sources of sulfur compound emissions is increasing because of the increasing number and intensity of wildfires [13]. The major anthropogenic sources include the production of metals from sulfur containing ores (smelting) and the combustion of fossil fuels [14]. Coal is an example of a fossil fuel with sources that have large differences in sulfur content [15].
Sulfur dioxide is oxidized in the atmosphere to produce sulfate particles, i.e., H2SO4, HSO4- or sulfate SO4=, that are chemical components of particulate matter or aerosols [3]. This oxidation of sulfur dioxide to produce particulate matter is very important because of their effects on climate, precipitation patterns, amounts and acidification, and their health effects [4]. The chemistry may have possible applications to exoplanetary atmospheres too [16].
Sulfur containing particles have very significant effects on climate because they strongly scatter solar radiation which effects the Earth’s radiation budget [4]. In fact, the emission of sulfate containing particles has been suggested as a method of cooling the Earth’s atmosphere to counteract global warming [17].
Sulfate containing particles, along with other forms of particulate matter, contribute to the secondary aerosol effect [4]. Fine aerosol particles provide nucleation sites for the formation of cloud water droplets. If there is an increase in the concentration of fine aerosol particles, then there will be more, but smaller droplets formed for a given level of water vapor in the atmosphere. Depending upon conditions the secondary aerosol effect can affect the amount and geographical distribution of precipitation.
Sulfate compounds are acidic in liquid water, and they contribute strongly to the acidification of precipitation along with nitrates (NO3-) and organic acids such as formic (HCOOH) and acetic acid (CH3COOH) [18]. For this reason and direct health effects, emissions of SO2 have regulated in the United States by the Clean Air Act Amendments since 1970 [19]. Acid precipitation was recognized as a major problem in Europe, Canada and the United States [20,21] during the late 1970s and 1980s. One of the major driving political and scientific questions for public policy regarding acid precipitation was to determine if the production of sulfate was limited by the available sulfur dioxide (SO2) or by the available oxidant; this uncertainty was known as the oxidant limitation question. This was a major issue of several international programs including the American National Acid Precipitation Program (NAPAP) and the U.S. Department of Energy’s Processing of Emissions by Clouds Program (PRECP) [22,23,24,25,26].
Figure 1 shows the difference between a situation where the oxidation of SO2 is limited by the available oxidant or not [27]. If there is a limited amount of oxidant relative to the amount of SO2, left plot, then moderate reductions in SO2 will not result in less sulfate produced; this condition was known as oxidant limited. The right panel shows that if there is more oxidant available then SO2 then reductions in SO2 will result in reductions in the amount of sulfate produced. Finding the chemical mechanisms for the oxidation of SO2 is important for determining the emission reduction policies needed to reduce acid precipitation.
The oxidation of SO2 may be important on local, urban scales as well as regional and global. In general, the particulate matter produced through atmospheric chemical reactions are fine particles with an aerodynamic dynamiter of 2.5 µm and these particles are known as PM2.5. Larger particles with an aerodynamic dynamiter of 10 µm are known as PM10 [19]. As an example, the city of El Paso Texas in the Paso Del Norte Border Region of the United States and Mexico has had problems with high concentrations of PM2.5 and PM10 [28,29]. High emissions of SO2, NOx and volatile organic compounds and wind-swept mineral dust have occurred in El Paso which contributes to particulate pollution. Emissions of nitrogen oxides are significant because the region contains the American – Mexican border. Truck and auto traffic are queued near the border until they are cleared to pass the border into the United States.
1.1. SO2 Oxidation Mechanisms
Many atmospheric chemical reactions produce products that condense to form particulate matter, PM2.5 or PM10. In general, SO2 is oxidized in either gas or aqueous phases or it may be deposited directly to the ground. In this paper we present evidence that there many be chemical reactions that may involve nitrogen oxides and/or heterogeneous processed involving sulfate aerosols.
1.1.1. The Gas-Phase Oxidation of Sulfur Dioxide
There are two gas-phase mechanisms known mechanisms for the gas-phase oxidation of sulfur dioxide. The hydroxyl radical (HO•) is the oxidant [30]. As shown by the reactions given below the HO• reacts with SO2 to produce the adduct HOSO2•, note that M is any molecule of air that stabilizes the formation of the adduct by absorbing excess collision energy.
HO• + SO2 (+ M) → HOSO2• (+ M)
HOSO2• + O2 → HO2• + SO3
SO3 + H2O → H2SO4 (+ liquid aerosol)
The HOSO2• adduct reacts with molecular oxygen to produce the hydroperoxyl radical (HO2•) and sulfur trioxide (SO3) [30]. SO3 reacts with water vapor to produce sulfuric acid. In a nitrogen oxide polluted atmosphere, HO2• reacts with NO to reproduce HO• as shown below.
HO2• + NO → HO• + NO2
The hydroxyl radical produced by Reaction 4 can react with SO2 making this mechanism a chain mechanism. When the concentration of nitric oxide (NO) is low, HO2• reacts with another HO2• or with organic peroxy radicals to produce hydrogen peroxide (H2O2) or an organic peroxide.
Another gas-phase process for the oxidation of SO2 reaction with Criegee intermediates [31,32]. Criegee intermediates are produced by reactions of ozone (O3) with alkenes. An example of the mechanism for the production of Criegee intermediates from ethene (CH2CH2) and its oxidation of SO2 is given below, Reactions 5–6.
O3 + CH2CH2 → CH2OOOCH2
CH2OOOCH2 → CH2OO + CH2O
CH2OO + SO2 → SO3 + CH2O
The average total rates of the HO• radical and the Criegee intermediate mechanisms are a few percent per hour for a range of realistic conditions with a maximum rate of 6.13 % hr-1 [33].
In cloud water or water coated aerosols the H2O2 may react with SO2 to produce sulfate [1,4,34] and in the gas-phase SO2 does not affect the concentration of the HO•. Either way there is little or no oxidant limitation to sulfate production from SO2 in the lower troposphere.
However, there is reason to suspect that could be additional oxidation processes. Relative to observations, air quality models underestimate sulfate production across the Eastern U.S and the models underestimate the effect of temperature on its production [35,36]. These newer modeling studies for United States, Alaska and Beijing, China indicate that estimates of particulate sulfur may be improved by the addition of additional heterogeneous chemical reactions [36]. In this paper we present an analysis of experimental data that suggests a process for the oxidation of SO2 that is not included in models.
2. Materials and Methods
The experiments that are reanalyzed here were made with the objective to measure the rate coefficient of the HO• radical with SO2 (HO+SO2) reaction) relative to the rate coefficient of the HO• radical with carbon monoxide (HO+CO) reaction [30,37]. The reaction of HO• with SO2 (Reaction 1) is given above and the reaction of with HO• with CO is given below.
HO• + CO (+ O2) → HO2• + CO2
The original analysis determined that HO• radical concentrations were not affected by SO2 concentrations, and this observation led to the proposal of the mechanism given by Reactions 1 through 4 [30]. This study was cited as a landmark in sulfur oxide chemistry [38]. The proposed mechanism was verified by several independent studies [39,40].
Mixtures of SO2, carbon monoxide (CO), nitrous acid (HONO), nitric oxide (NO) and nitrogen dioxide (NO2) were photolyzed in molecular nitrogen (N2) or synthetic air as a background gas, Table 1 [37]. The initial reactive nitrogen is the total molecular concentration of NO, NO2 and HONO, Table 1 gives the initial conditions for the experiments made in N2; note that there was a small trace of molecular (O2) introduced during the filling of the chamber. Table 2 gives the initial conditions for the experiments made in synthetic air. Photolysis of nitrous acid produced HO• radicals.
HONO + hν → HO• + NO
The photolysis experiments were made using a long-path glass chamber that was 6m long and the concentration changes were measured with a Fourier Transform Spectrometer [30,37]. The concentrations of CO were sufficiently high so that they did not appreciably change during the experiments so the relative extent of the HO•+CO reaction was taken as the total CO2 produced during each experiment. The rates of the HO•+SO2 and HO•+CO reactions are given below where kSO2 and kCO are rate coefficients for these reactions.
Equations 9 and 10 may be rearranged to derive the ratio, kHO+SO2/kHO+CO. To derive Equation 11 for the experiments, note that the HO• concentrations cancel out, that the concentrations of SO2 and CO may be averaged over the photolysis period ([SO2]AVG, [CO]AVG) and that the change in CO is equal to the amount of CO2 produced (Δ[CO2]. The change in the SO2 concentration is given by Δ[SO2].
The gas-phase rate coefficients for the Reactions 1 and 8 are well known now. These were used to calculate the literature kHO+SO2/kHO+CO ratio. The rate coefficients for the reaction of HO• with SO2 is pressure and temperature dependent [41]. This reaction involves two small molecules forming a reactive intermediate that requires its collision energy to be dissipated through collisions with a third bodies. The rate coefficient n units of cm6molecule-1s-1 is calculated through the following equations.
where: 2.90×10⁻³¹, n = 4.1, 1.70×10⁻¹² and m = -0.2; and [M] is the concentration of the total background gas in molecules cm-3 [41].
The rate coefficient for the reaction of HO• with CO in units of cm6molecule-1s-1 is given is given by equation 15 [42,43]:
These were used to calculate literature ratio of the coefficients given in the Results section of this work.
3. Results
Table 3 shows experimental results for the photolysis experiments.
Table 3 shows the experimental kHO+SO2/kHO+CO ratios calculated using Equation 11 from the initial concentrations. The observed changes in SO2 and CO2 concentrations The ratios ranges from 9.1 to 14.9 for the experiments made with background N2. The ratio ranges from 0.8 to 16.7 for the experiments made with background synthetic air.
Table 4 shows calculated kHO+SO2/kHO+CO ratios from the literature rate coefficients. The expected values of the ratios are between 4 and 4.5. The experimental values of the kHO+SO2/kHO+CO ratios are between 1.80 and 3.75 times greater than the literature calculated values.
Plots were made to examine the possibility that there was an effect of reactive nitrogen on the kHO+SO2/kHO+CO ratios. Figure 2 shows plots of the experimental kHO+SO2/kHO+CO ratios as functions of the initial reactive nitrogen oxides (HONO+NO+NO2. Table 5 shows the average reactive nitrogen in the three sets of experiments, the average kHO+SO2/kHO+CO ratio and the shared variance between them.
4. Discussion
This new analysis of photolysis experiments made with relatively high concentrations of HONO, NO, NO2, SO2 and CO showed that there may be an uncharacterized oxidation process for SO2. The literature value of the kHO+SO2/kHO+CO ratio for the experimental conditions is near 4 to 4.5 while the measured ratio is around three times greater for the N2 only, synthetic air background gas experiments and both sets of experiments considered together.
The experimental ratio for the experiments with N2 only as the background gas has a shard variance of 0.65 with the initial total reactive nitrogen concentration. However, the shard variance between the experimental ratio and the initial total reactive nitrogen concentration is much lower for the synthetic air case. Although there is much uncertainty, this could be due to an oxygen effect that is not taken into account in this analysis.
If there is a new oxidation process for SO2 that is three times greater than the known hydroxyl radical reaction that occurs in NOx polluted atmospheres then conversion rates in the range of 10 to 20% hr-1 may occur in urban regions such as El Paso, Texas with sources of SO2 and NOx (using reference 33 as the baseline).
Sulfuric acid has been produced on a commercial scale from the direct reaction of SO2 and NOx and H2O. These were mixed at very high concentrations in large chambers, made from lead, where reactions produced H2SO4. [44] Based on our experiments we show that similar reactions may occur at lower concentrations. These reactions are probably heterogeneous and appear to be faster than the gas-phase reactions. The reactions may be important for converting SO2 to sulfate on urban scales and therefore contribute to local PM2.5 formation. Improved representation of these processes may improve the agreement between measurements and air quality modeling results [35,36] for the United States, China and elsewhere. New research involving laboratory studies and field measurements are needed to better characterize the oxidation of SO2.because it is possible that heterogeneous reactions occurred on sulfate particles as soon as they were formed ans/or other reactive nitrogen catalyzed processes occure. Therefore, better measurements of formation and properties of the sulfate particles and their surface reactions are needed.
Author Contributions
Conceptualization, W.S. and R.F.; methodology, W.S.; validation, W.S., and R.F..; formal analysis, W.S.; investigation, W.S.; resources, W.S. and R.F.; data curation, W.S.; writing—original draft preparation, W.S.; writing—review and editing, R.F.; visualization, W.S.; supervision, W.R. and R.F.; project administration, R.F.; funding acquisition, R.F. All authors have read and agreed to the published version of the manuscript.
Funding
This research was funded by the NOAA Center for Atmospheric Science—Meteorology (NCASM II), which is funded by the U.S. Department of Commerce, National Oceanic and Atmospheric Administration, Educational Partnership Program under Agreement No. NA22SEC4810015.
Data Availability Statement
Original data is available in: Stockwell, William. "The chemistry of nitrogen oxides/sulphur oxides/hydrogen oxides systems." Doctoral dissertation, Ohio State University, 1981. http://rave.ohiolink.edu/etdc/view?acc_num=osu1487171566434414.
Conflicts of Interest
The authors declare no conflicts of interest.
References
- Middleton, P.M.; Klang, C.S.; Mohnen, V.A. The relative importance of various urban sulfate aerosol production mechanisms – A Theoretical comparison. In Heterogeneous Atmospheric Chemistry; Schryer, D.R.; American Geophysical Union; Washington D.C., United States, 1982, pp. 221–230.
- Walcek, C.J.; Taylor, G.R. A Theoretical Method for Computing Vertical Distributions of Acidity and Sulfate Production within Cumulus Clouds. J. Atmos. Sci. 1986, 43, 339–55. [Google Scholar] [CrossRef]
- Seinfeld, J.H.; Pandis, S.N. Atmospheric Chemistry and Physics: From Air Pollution to Climate Change 3rd. 2016, John Wiley & Sons, New York.
- Kolb, C.F.; Worsnop, D.R. Chemistry and Composition of Atmospheric Aerosol Particles. Annu. Rev. Phys. Chem. 2012, 63, 471–491. [Google Scholar] [CrossRef] [PubMed]
- Warneck, P. Chapter 10. Sulphur compounds in the atmosphere. In Chemistry of the Natural Atmosphere, 2ed; Academic Press, San Diego, California, United States, 2000, pp. 587–655.
- Brasseur, G.P.; Orlando, J.J.; Tyndall, G.S. Atmospheric Chemistry and Global Change, Oxford University Press, United Kingdom, 1999.
- Rotstayn, L.D.; Lohmann, U. Simulation of the Tropospheric Sulfur Cycle in a Global Model with a Physically Based Cloud Scheme. J. Geophys. Res. 2002, 107, 4592. [Google Scholar] [CrossRef]
- Gondwe, M.; Krol, M.; Gieskes, W.; Klaassen, W.; de Baar, H. The Contribution of Ocean-Leaving DMS to the Global Atmospheric Burdens of DMS, MSA, SO2, and NSS SO4=. Global Biogeochem. Cycles 2003, 17, 1056. [Google Scholar] [CrossRef]
- Gondwe, M.; Krol, M.; Gieskes, W.; Klaassen, W; de Baar, H. Correction to ‘‘The Contribution of Ocean-Leaving DMS to the Global Atmospheric Burdens of DMS, MSA, SO2, and NSS SO4=”. Global Biogeochem. Cycles 2003, 17. [Google Scholar] [CrossRef]
- Lana, A.; Bell, T.G.; Simó, R.; Vallina, S.M.; Ballabrera-Poy, J.; Kettle, A.J.; Dachs, J.; Bopp, L.; Saltzman, E.S.; Stefels, J.; Johnson, J.E.; Liss, P.S. An Updated Climatology of Surface Dimethlysulfide Concentrations and Emission Fluxes in the Global Ocean. Global Biogeochem, Cycles 2011, 25, GB 1004. [Google Scholar] [CrossRef]
- Goss, M.B.; Kroll, J.H. Chamber Studies of OH + Dimethyl Sulfoxide and Dimethyl Disulfide: Insights into the Dimethyl Sulfide Oxidation Mechanism. Atmos. Chem. Phys. 2024, 24, 1299–1314. [Google Scholar] [CrossRef]
- Rickly, P.S.; Guo, H.; Campuzano-Jost, P.; Jimenez, J.L.; Wolfe, G.M.; Bennett, R.; Bourgeois, I.; Crounse, J.D.; Dibb, J.E.; DiGangi, J.P.; et al. Emission factors and evolution of SO2 measured from biomass burning in wildfires and agricultural fires. Atmos. Chem. Phys. 2022, 22, 15603–15620. [Google Scholar] [CrossRef]
- 13 Pausas, J.G.; Keeley, J.E. Wildfires and Global Change. Frontiers in Ecology and the Environment 2021, 19, 387–395. [Google Scholar] [CrossRef]
- Smith, S.J.; van Aardenne, J.; Klimont, Z.; Andres, R.J.; Volke, A.; Delgado Arias, S. Anthropogenic Sulfur Dioxide Emissions: 1850–2005. Atmos. Chem. Phys. 2011, 11, 1101–1116. [Google Scholar] [CrossRef]
- Calkins, W.H. The Chemical Forms of Sulfur in Coal: A Review. Fuel 1994, 73, 475–484. [Google Scholar] [CrossRef]
- Hu, R.; Seager, S.; Bains, W. Photochemistry in Terrestrial Exoplanet Atmospheres. II. H2S and SO2 Photochemistry in Anoxic Atmospheres. The Astrophysical Journal. 2013, 769, 1–14. [Google Scholar] [CrossRef]
- Visioni, D.; Pitari, G.; Aquila, V. Sulfate Geoengineering: A Review of the Factors Controlling the Needed Injection of Sulfur Dioxide. Atmos. Chem. Phys. 2017, 17, 3879–3889. [Google Scholar] [CrossRef]
- Tilgner, A.; Schaefer, T.; Alexander, B.; Barth, M.; Collett, J.L., Jr.; Fahey, K.M.; Nenes, A.; Pye, H.O.T.; Herrmann, H.; McNeill, V.F. Acidity and the Multiphase Chemistry of Atmospheric Aqueous Particles and Clouds. Atmos. Chem. Phys. 2021, 21, 13483–536. [Google Scholar] [CrossRef] [PubMed]
- Jacobson, M.Z. Atmospheric Pollution, History, Science and Regulation. Cambridge University Press, Cambridge, United Kingdom, 2002.
- Bolin, B.; Persson, C. Regional Dispersion and Deposition of Atmospheric Pollutants with Particular Application to Sulfur Pollution over Western Europe. Tellus 1975, 27, 281–310. [Google Scholar] [CrossRef]
- Cowling, E.B. Acid Precipitation in Historical Perspective. Environ. Sci. Technol. 1982, 16, 110A–123A. [Google Scholar] [CrossRef]
- Acid Deposition: State of Science and Technology, Volume 1 – Emissions, Atmospheric Processes and Deposition; National Acid Assessment Program; Superintendent of Documents; Washington D.C. United States, 1990.
- Acid Deposition: State of Science and Technology, Volume 2 – Aquatic Processes and Effects; National Acid Assessment Program; Superintendent of Documents; Washington D.C. United States, 1990.
- Acid Deposition: State of Science and Technology, Volume 3 – Terrestrial, Materials, Health and Visibility Effects; National Acid Assessment Program; Superintendent of Documents; Washington D.C. United States. 1990.
- Acid Deposition: State of Science and Technology, Volume 4 – Control Technologies, Future Emissions and Effects Valuation; National Acid Assessment Program; Superintendent of Documents; Washington D.C. United States, 1990.
- Tanner, R.L.; Tichler, J.; Brown, R.; Davis, W.; Johnson, S.; Patrinos, A.A.; Sisterson, D.; Slinn, W.G. PRECP: the Department of Energy's Program on the Nonlinearity of Acid Precipitation Processes (No. BNL-38776). Brookhaven National Lab., Upton, NY (USA); Pacific Northwest Lab., Richland, WA (USA); Argonne National Lab., IL (USA) 1986.
- Rhode, H.; Crutzen, R.; Vanderpol, A. Formation of Sulfuric and Nitric Acid in the Atmosphere During Long-Range Transport. TelIus, 1981, 33, 132–141. [Google Scholar]
- Chen, L.-W.A.; Tropp, R.; Li, W.-W.; Zhu, D.; Chow, J.C.; Watson, J.C.; Zielinska, B. Aerosol and Air Toxics Exposure in El Paso, Texas: A Pilot Study. Aerosol and Air Quality Research 2012, 12, 169–179. [Google Scholar] [CrossRef]
- Karle, N.N.; Mahmud, S.; Sakai, R.K.; Fitzgerald, R.M.; Morris, V.R.; Stockwell, W.R. Investigation of the Successive Ozone Episodes in the El Paso–Juarez Region in the Summer of 2017. Atmosphere 2020, 11, 532. [Google Scholar] [CrossRef]
- Stockwell, W.R.; Calvert, J.G. The Mechanism of the HO-SO2 Reaction. Atmos. Environ. 1983, 17, 2231–2235. [Google Scholar] [CrossRef]
- Sarwar, G.; Fahey, F.; Kwok, R.; Gilliam, R.; Xue, J.; Jianzhen, Y.; Carter, W.P.L. Potential impacts of two SO2 oxidation pathways on regional sulfate concentrations: aqueous-phase oxidation by NO2 and gas-phase oxidation by Stabilized Criegee Intermediates. Atmos. Environ. 2013, 68, 186–197. [Google Scholar] [CrossRef]
- Sarwar, G.; Simon, H.; Fahey, K.; Mathur, R.; Goliff, W.S.; Stockwell, W.R. Impact of Sulfur Dioxide Oxidation by Stabilized Criegee Intermediate on Sulfate, Atmos. Environ. 2014, 85, 204–214. [Google Scholar]
- Calvert, J.G.; Stockwell, W.R. Acid Generation in the Troposphere by Gas Phase Chemistry. Envir. Sci. Technol. 1983, 17, 428A–443A. [Google Scholar] [CrossRef]
- Graedel, T.E.; Weschler, C.J. Chemistry Within Aqueous Atmospheric Aerosols and Raindrops. Rev. Geophys. and Space Phys. 1981, 19, 505–539. [Google Scholar] [CrossRef]
- Vannucci, P.F.; Foley, K.; Murphy, B.N.; Hogrefe, C.; Cohen, R.C.; Pye, H.O.T. Temperature-Dependent Composition of Summertime PM2.5 in Observations and Model Predictions across the Eastern U.S. ACS Earth Space Chem. 2024, 8, 381–392. [Google Scholar] [CrossRef] [PubMed]
- Farrell, S.L.; Pye, H.O.T.; Gilliam, R.; Pouliot, G.; Huff, D.; Sarwar, G.; Vizuete, W.; Briggs, N.; Duan, F.; Ma, T.; Zhang, S.; Fahey, K. Predicted Impacts of Heterogeneous Chemical Pathways on Particulate Sulfur over Fairbanks (Alaska), the Northern Hemisphere and the Contiguous United States, Atmos. Chem. Phys. 2025, 25, 3287–3312. [Google Scholar] [CrossRef]
- Stockwell, W.R. The Chemistry of Nitrogen Oxides/Sulphur Oxides/Hydrogen Oxides Systems. Ph.D. Thesis, The Ohio State University, Columbus, OH, USA, 1981. http://rave.ohiolink.edu/etdc/view?acc_num=osu1487171566434414. [Google Scholar]
- Crutzen, P.J. My Life with O3, NOx and Other YZOxs, Nobel Lecture. 8 December 1995. Available online: https://www.nobelprize.org/prizes/chemistry/1995/crutzen/lecture/ (accessed on 4 August 2025).
- Gleason, J.F.; Sinha, A.; Howard, C.J. Kinetics of the Gas-Phase Reaction HOSO2 + O2 → HO2 + SO3. J. Phys. Chem. 1987, 91, 719–724. [Google Scholar] [CrossRef]
- Egsgaard, H.; Carlson, L.; Florencio, H.; Drewello, T.; Schwarz, H. Experimental Evidence for the Gaseous HSO3 Radical. The Key Intermediate in the Oxidation of SO2 in the Atmosphere. Chem. Phys. Lett. 1988, 148, 537–540. [Google Scholar] [CrossRef]
- Burkholder, J.B.; Sander, S.P.; Abbatt, J.; Barker, J.R.; Cappa, C.; Crounse, J.D.; Dibble, T.S.; Huie, R.E.; Kolb, C.E.; Kurylo, M.J.; Orkin, V.L.; Percival, C.J.; Wilmouth, D.M.; Wine, P.H. Chemical Kinetics and Photochemical Data for Use in Atmospheric Studies, Evaluation No. 19," JPL Publication 19-5, Jet Propulsion Laboratory, Pasadena, 2019 http://jpldataeval.jpl.nasa.gov.
- Atkinson, R.; Baulch, D.L.; Cox, R.A.; Crowley, J.N.; Hampson, R.F.; Hynes, R.G.; Jenkin, M.E.; Rossi, M.J.; Troe, J. Evaluated Kinetic and Photochemical Data for Atmospheric Chemistry: Volume I – Gas Phase Reactions of Ox, HOx, NOx and SOx Species. Atmos. Chem. Phys. 2004, 4, 1461–1738. [Google Scholar] [CrossRef]
- Calvert, J.G.; Orlando, J.J.; Stockwell, W.R.; Wallington, T.J. The Mechanisms of Reactions Influencing Atmospheric Ozone, Oxford University Press: Oxford, United Kingdom, 2015; pp. 412–424.
- Schroeder, W.H.; Urone, P. (1978). Isolation and Identification of Nitrosonium Hydrogen Sulfate (NOHSO4) as a Photochemical Reaction Product in Air Containing Sulfur Dioxide and Nitrogen Dioxide. Envir. Sci. Technol. 1978, 12, 545–550. [Google Scholar] [CrossRef]
Figure 1.
The plot to the right shows an oxidant limited condition. In that case reductions or increases in SO2 concentrations do not affect the formation of sulfate. The plot to the right shows the case where there is sufficient oxidant to convert SO2 to sulfate and decreases in SO2 concentrations lead to decreases in sulfate production.
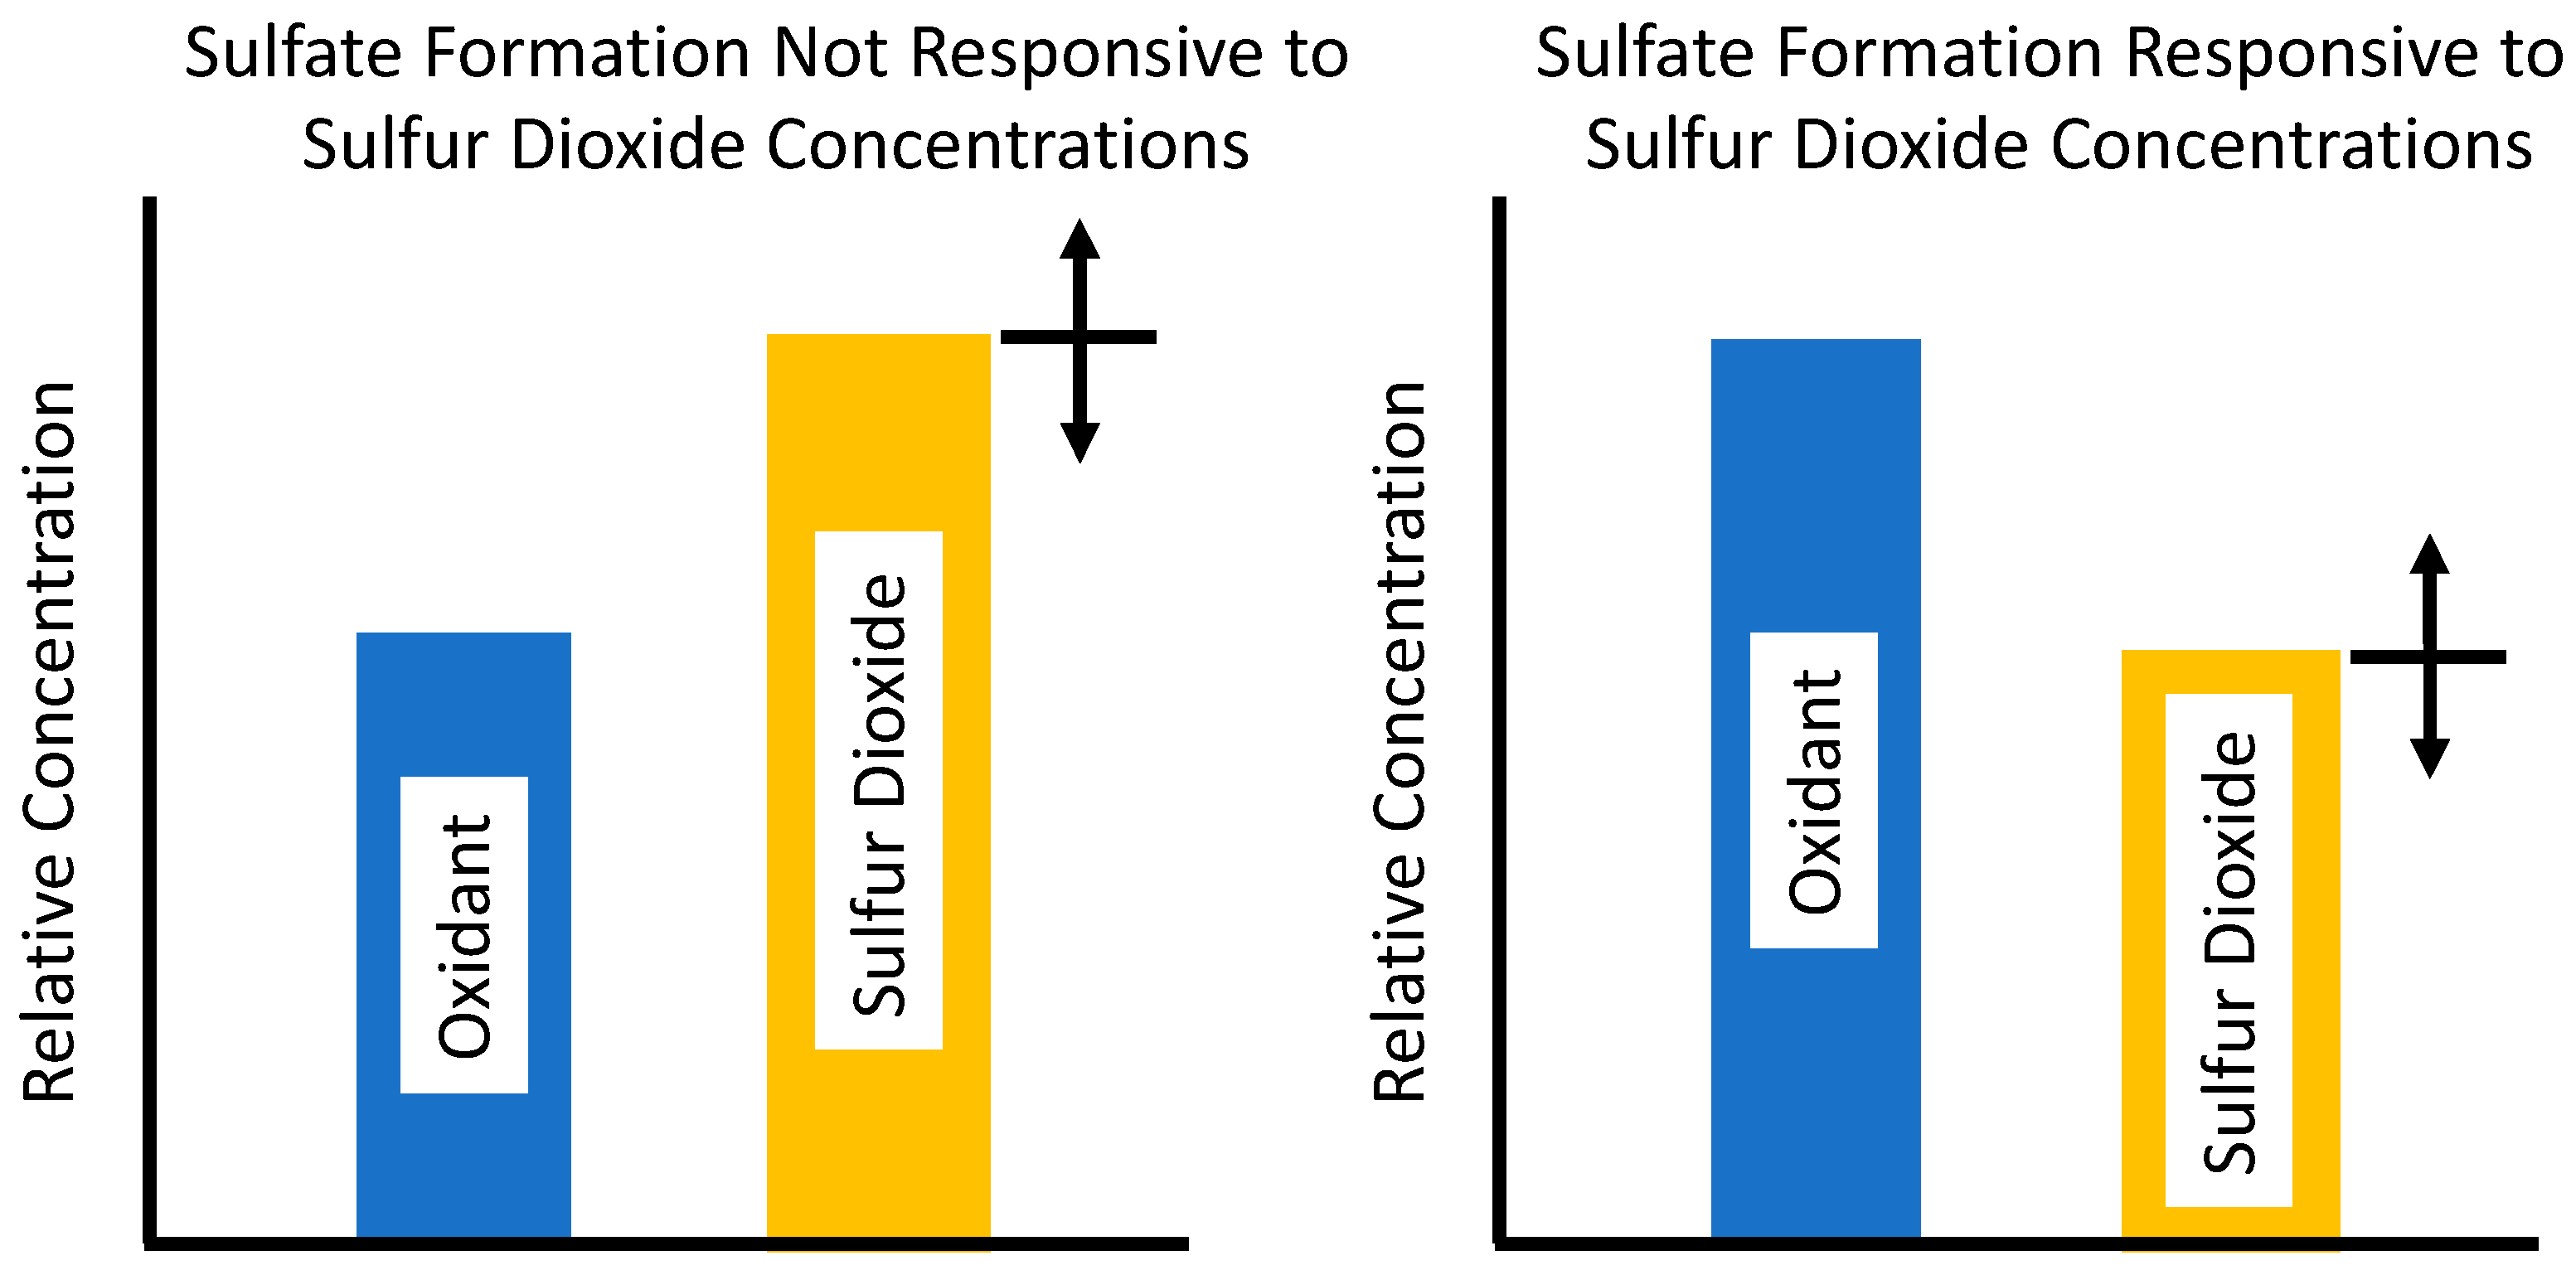
Figure 2.
Figure shows the relationship between the experimental kHO+SO2/kHO+CO ratios and the initial reactive nitrogen used in the experiments. The initial reactive nitrogen is the total initial sum of the HONO, NO and NO2 concentrations. The plot at the top left is for the experiments made with N2 as the background gas. The plot at the top right is for the experiments made with synthetic air as the background gas. The plot at the lower center shows all experiments plotted together. The line in each plot is the regression line.
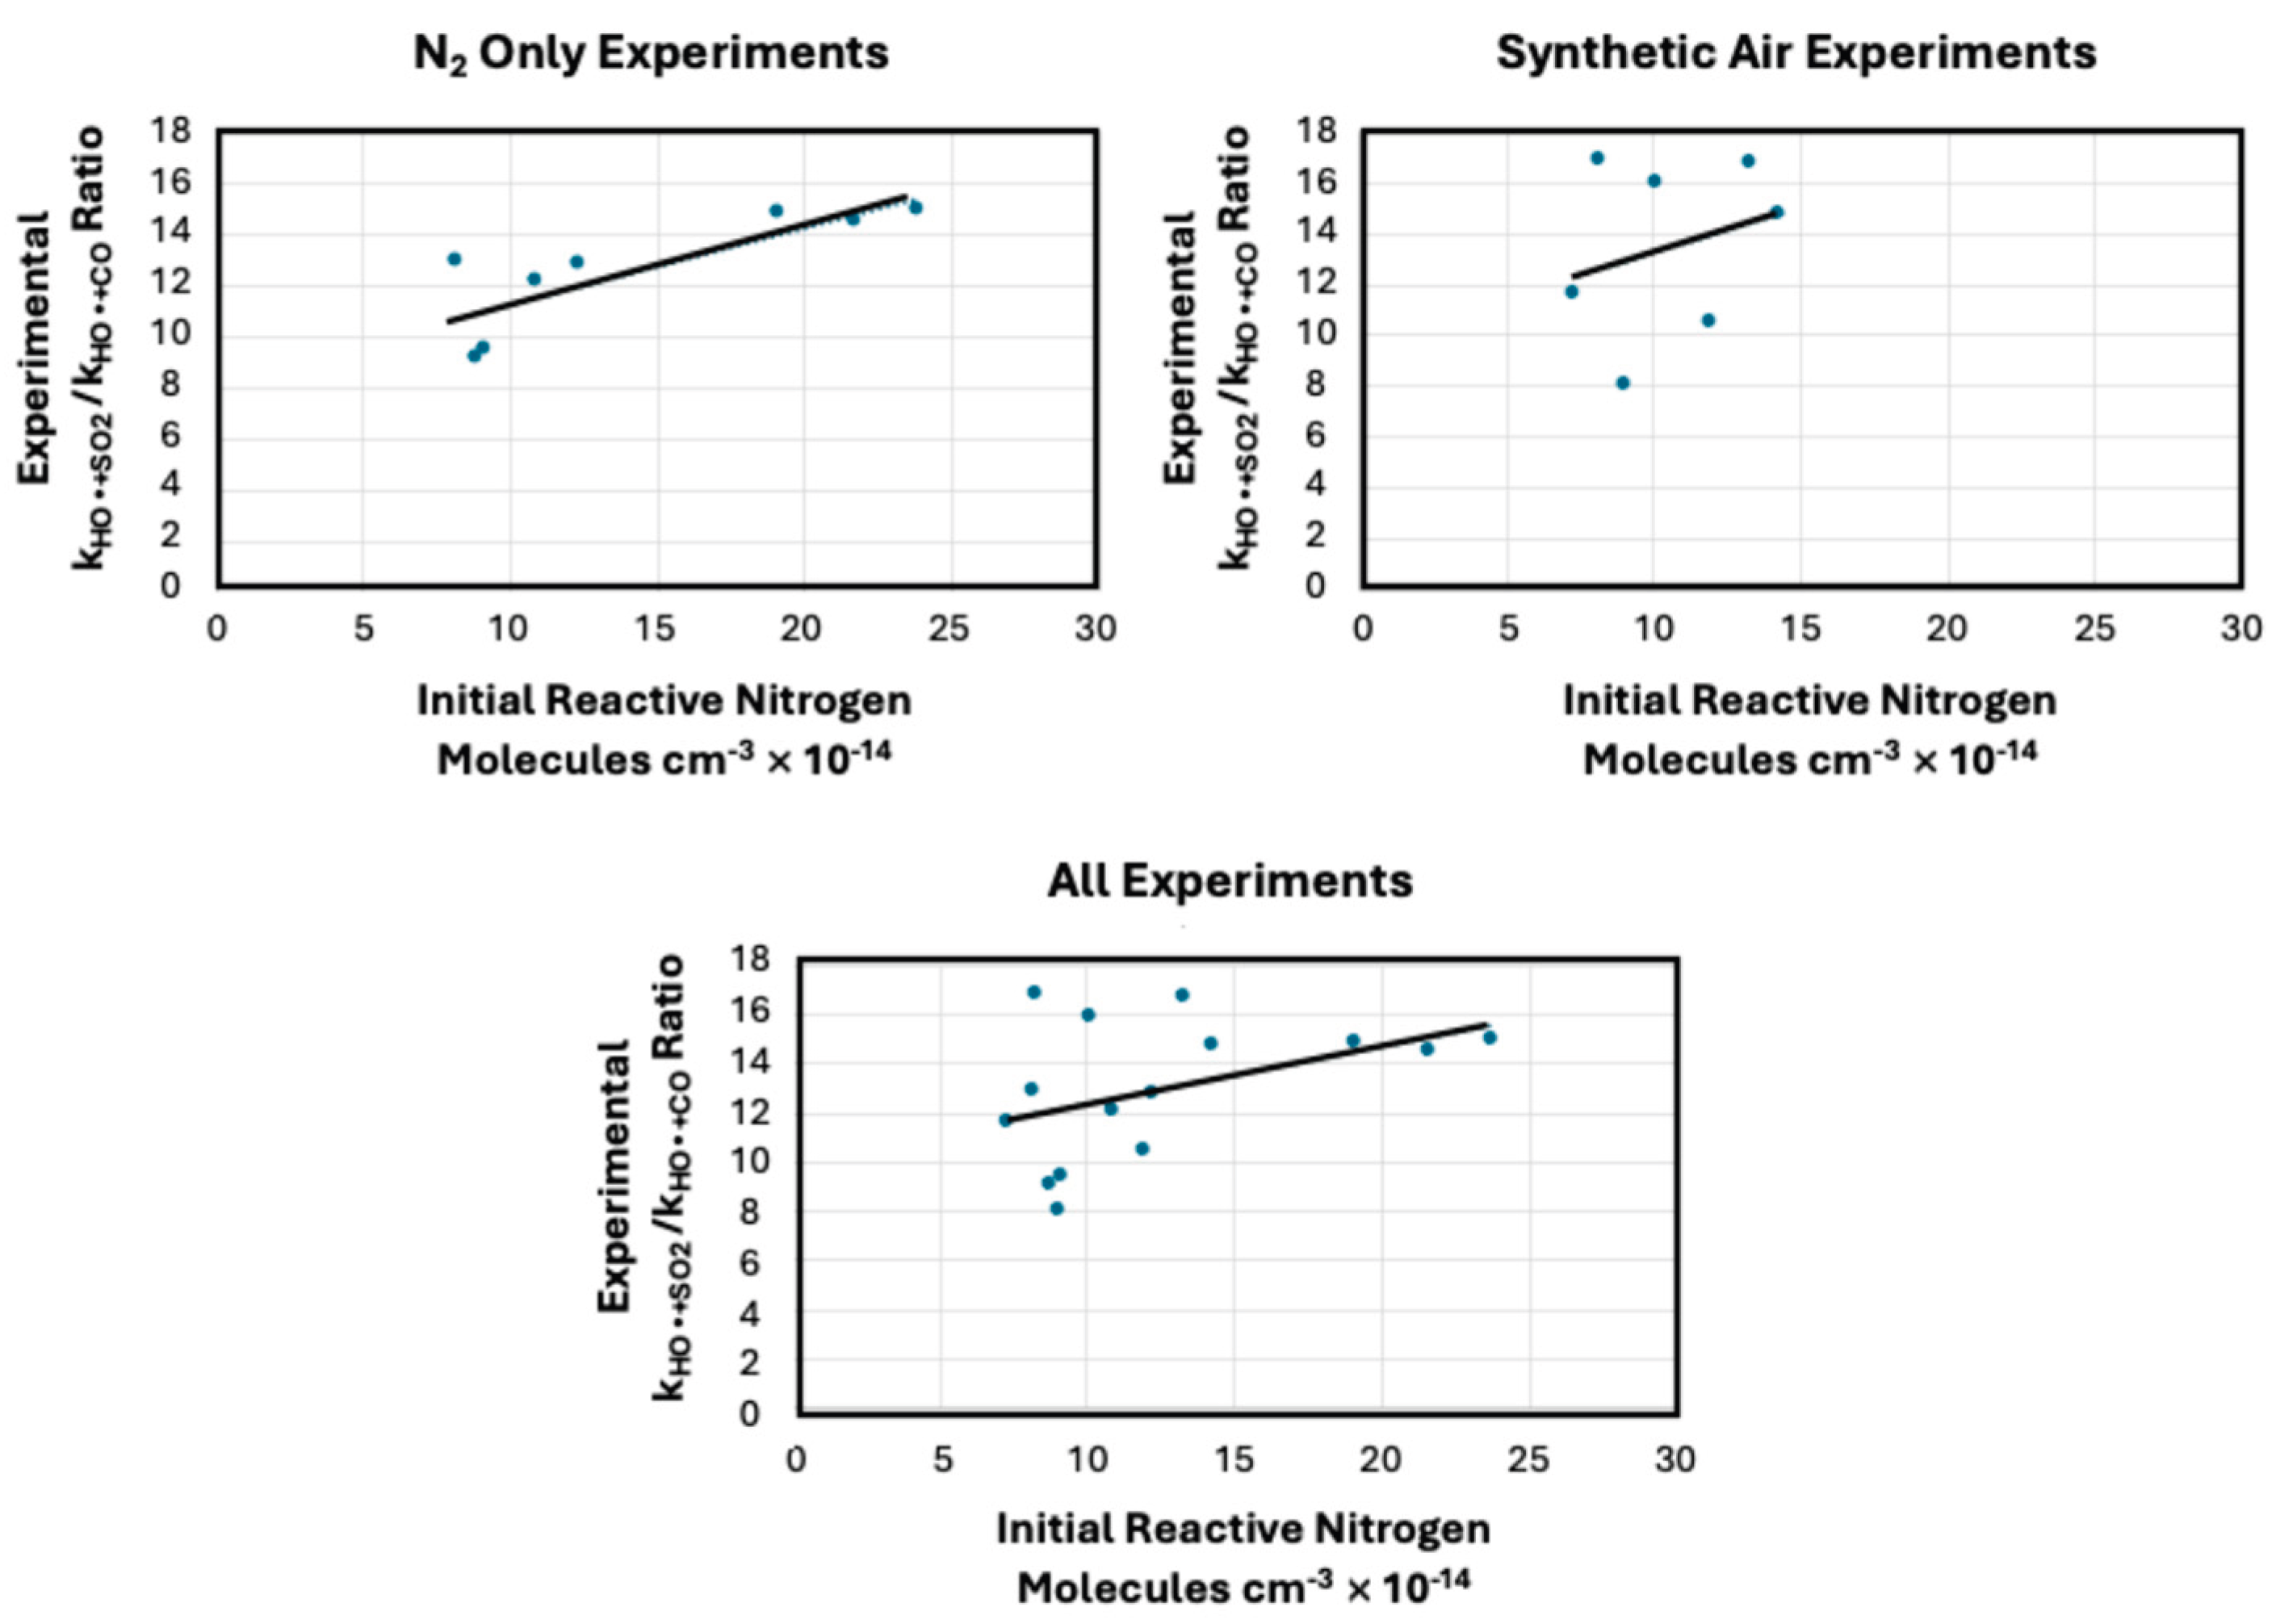

Table 1.
Initial conditions for sulfur dioxide oxidation experiments that were made using molecular nitrogen as the background gas. All experiments contained a trace of molecular oxygen with a pressure assumed to be 4.64±0.06×10⁻⁵ atm [37]. The initial reactive nitrogen is the total initial sum of the HONO, NO and NO2 concentrations.
| Experiment Number |
N2 (atm) |
Initial Reactive Nitrogen (Molec cm-3 ×10-15) |
Initial CO (Molec cm-3 ×10-16) |
Initial SO2 (Molec cm-3 ×10-15) |
|---|---|---|---|---|
| 1 | 0.921 | 0.817 | 2.31 | 2.96 |
| 2 | 0.954 | 0.882 | 3.43 | 3.88 |
| 3 | 0.925 | 0.917 | 2.31 | 2.23 |
| 4 | 0.924 | 1.09 | 1.60 | 2.07 |
| 5 | 0.922 | 1.23 | 1.62 | 1.69 |
| 6 | 0.925 | 2.17 | 1.10 | 1.70 |
| 7 | 0.933 | 2.38 | 1.03 | 1.28 |
| 8 | 0.921 | 1.91 | 1.07 | 2.01 |
Table 2.
Initial conditions for sulfur dioxide oxidation experiments that were made using synthetic air as the background gas [37].
Table 2.
Initial conditions for sulfur dioxide oxidation experiments that were made using synthetic air as the background gas [37].
| Experiment Number |
N2 (atm) |
O2 (atm) |
Initial Reactive Nitrogen (Molec cm-3 ×10-15) |
Initial CO (Molec cm-3 ×10-16) |
Initial SO2 (Molec cm-3 ×10-15) |
|---|---|---|---|---|---|
| O1 | 0.761 | 0.176 | 0.739 | 2.29 | 3.20 |
| O2 | 0.748 | 0.171 | 1.43 | 2.32 | 2.26 |
| O3 | 0.749 | 0.172 | 1.34 | 1.86 | 3.42 |
| O4 | 0.746 | 0.175 | 0.828 | 1.83 | 2.31 |
| O5 | 0.752 | 0.169 | 0.908 | 1.38 | 3.14 |
| O6 | 0.742 | 0.176 | 1.02 | 1.39 | 2.36 |
| O7 | 0.750 | 0.171 | 1.20 | 0.935 | 3.56 |
Table 3.
Experimental Results for sulfur dioxide oxidation [37].
Table 3.
Experimental Results for sulfur dioxide oxidation [37].
| Experiment Number |
Reaction Time (min) |
Δ Reactive Nitrogen (Molec cm-3 ×10-14) |
ΔCO2 (Molec cm-3 ×10-14) |
ΔSO2 (Molec cm-3 ×10-14) |
Experimental |
|---|---|---|---|---|---|
| 1 | 29.12 | 0.088 | 1.60 | 2.53 | 12.9 |
| 2 | 25.37 | 0.52 | 1.01 | 1.03 | 9.1 |
| 3 | 16.98 | 0.060 | 1.58 | 1.38 | 9.4 |
| 4 | 25.57 | -0.004 | 1.07 | 1.61 | 12.1 |
| 5 | 25.72 | 1.20 | 0.979 | 1.26 | 12.8 |
| 6 | 25.78 | 3.90 | 0.816 | 1.72 | 14.5 |
| 7 | 25.82 | 2.57 | 1.00 | 1.72 | 14.9 |
| 8 | 28.47 | 19.10 | 0.383 | 1.03 | 14.8 |
| O1 | 28.20 | 0.100 | 1.50 | 2.34 | 11.6 |
| O2 | 28.87 | 0.917 | 1.27 | 1.75 | 14.7 |
| O3 | 28.37 | -0.024 | 0.832 | 2.45 | 16.7 |
| O4 | 28.62 | -0.062 | 1.28 | 2.57 | 16.8 |
| O5 | 28.87 | -0.609 | 0.916 | 1.64 | 8.0 |
| O6 | 28.32 | 0.382 | 0.962 | 2.45 | 15.9 |
| O7 | 37.20 | 0.803 | 0.763 | 2.92 | 10.5 |
Table 4.
Comparison of experimental kHO+SO2/kHO+CO ratio with literature values. The values of kHO+SO2 and kHO+CO were calculated for a temperature of 300K and the N2 pressures given in Table 1 and Table 2.
| Experiment Number |
kHO+SO2 (cm3 Molec-1 ×10¹³) |
kHO+CO (cm3 Molec-1 ×10¹³) |
Literature |
Experimental/Literature |
|---|---|---|---|---|
| 1 | 9.22 | 2.21 | 4.17 | 3.10 |
| 2 | 9.33 | 2.24 | 4.17 | 2.18 |
| 3 | 9.23 | 2.22 | 4.17 | 2.26 |
| 4 | 9.23 | 2.21 | 4.17 | 2.90 |
| 5 | 9.22 | 2.21 | 4.17 | 3.07 |
| 6 | 9.23 | 2.22 | 4.17 | 3.48 |
| 7 | 9.26 | 2.22 | 4.17 | 3.58 |
| 8 | 9.22 | 2.21 | 4.17 | 3.55 |
| O1 | 9.27 | 2.08 | 4.46 | 2.60 |
| O2 | 9.21 | 2.07 | 4.46 | 3.30 |
| O3 | 9.22 | 2.07 | 4.46 | 3.75 |
| O4 | 9.22 | 2.07 | 4.46 | 3.76 |
| O5 | 9.22 | 2.07 | 4.45 | 1.80 |
| O6 | 9.21 | 2.06 | 4.47 | 3.56 |
| O7 | 9.22 | 2.07 | 4.46 | 2.36 |
Table 5.
Comparison of average experimental kHO+SO2/kHO+CO ratio to the average reactive nitrogen concentrations and the shared variance between them as determined from the plotes shown in Figure 2.
Table 5.
Comparison of average experimental kHO+SO2/kHO+CO ratio to the average reactive nitrogen concentrations and the shared variance between them as determined from the plotes shown in Figure 2.
| Experimental Series |
Average Reactive Nitrogen Conc. (Molec cm-3×10-14) |
Average kHO+SO2/kHO+CO Ratio |
Shared Variance (R2) |
|---|---|---|---|
| N2 Only | 14.2 | 12.6 | 0.65 |
| Synthetic Air | 10.7 | 13.5 | 0.076 |
| All | 12.6 | 13.0 | 0.18 |
Disclaimer/Publisher’s Note: The statements, opinions and data contained in all publications are solely those of the individual author(s) and contributor(s) and not of MDPI and/or the editor(s). MDPI and/or the editor(s) disclaim responsibility for any injury to people or property resulting from any ideas, methods, instructions or products referred to in the content. |
© 2025 by the authors. Licensee MDPI, Basel, Switzerland. This article is an open access article distributed under the terms and conditions of the Creative Commons Attribution (CC BY) license (http://creativecommons.org/licenses/by/4.0/).
Copyright: This open access article is published under a Creative Commons CC BY 4.0 license, which permit the free download, distribution, and reuse, provided that the author and preprint are cited in any reuse.


