
Submitted:
05 August 2025
Posted:
07 August 2025
You are already at the latest version
Abstract
Background/Objectives: This study aimed to compare the effects of two bleaching techniques—light-activated (Zoom) and laser-activated—on the surface roughness of nanohybrid and microhybrid composites, using atomic force microscopy (AFM) for topographic evaluation. Methods: Sixty composite resin discs were fabricated, with 30 nanohybrid and 30 microhybrid samples. Each type was divided into three subgroups: control, Zoom bleaching, and laser bleaching (n = 10 per group). Zoom bleaching employed 40% hydrogen peroxide activated by Philips Zoom light, while laser bleaching used a diode laser (940 nm) with QuickLase gel. Surface roughness parameters (Sa, Sq, Sz) were measured using AFM, and statistical analysis was performed. Results: Both bleaching protocols increased surface roughness compared to controls. Microhybrid composites showed higher roughness after Zoom (103.12 ± 19.25 nm) and laser bleaching (106.16 ± 25.21 nm), while nanohybrid composites had lower values after Zoom (57.77 ± 13.88 nm) and laser (78.13 ± 23.29 nm). Significant differences were found between composite types post-bleaching (p < 0.001 for Zoom; p = 0.019 for laser). However, differences between bleaching methods within the same composite were not significant. Conclusions: Both Zoom and laser bleaching negatively affect composite surfaces, with laser showing a greater impact. Nanohybrid composites demonstrated superior resistance to surface alteration, suggesting better clinical durability. These results highlight the importance of material selection when bleaching patients with existing composite restorations.
Keywords:
dental restoration
; microhybrid composite
; nanohybrid composite
; surface roughness
; zoom bleaching
; laser bleaching
; AFM
1. Introduction
Composite resins rank among the most utilized materials in restorative dentistry. Technological and material advancements are occurring swiftly, and currently, composite materials with varying properties and particle sizes are commonly utilized in filling applications. The integration of the aesthetic characteristics of composite materials with microfilled composites and enhanced mechanical properties has resulted in the creation of nanohybrid composites.
Resin composites comprise three essential components: an inorganic filler, an organic polymeric matrix, and a silane coupling agent, which constitute their fundamental structure. The composition and microstructure of resin composites have been demonstrated to influence their mechanical properties and aesthetic qualities [1].
Several studies have reported no significant differences between the clinical performances of the two types of composites (nanohybrid and microhybrid).
Finishing and polishing are essential for maintaining the aesthetics of composite resins. Inadequate finishing and polishing can result in surface roughness of composites, adversely affecting adhesion and promoting bacterial plaque retention, thereby elevating the risk of periodontal disease and dental caries [2,3].
Achieving a smooth surface reducing the risk of fracture, preventing color changes in the composite and improving the patient’s comfort at the same time[3,4,5,6].
Current evidence is inadequate to establish the superiority of nanofilled or submicron-filled composites in terms of surface smoothness and gloss, as indicated by a systematic review of in vitro studies comparing the surface characteristics of composites with nano- or submicron-sized fillers to conventional composites.
Tooth-bleaching products also interact with the surfaces of dental restorations, influencing their mechanical, aesthetic, and physical properties [7,8,9,10].
Hydrogen peroxide is the predominant agent utilized for dental bleaching, with concentrations varying according to the technique recommended by the dentist. In in-office bleaching procedures, hydrogen peroxide concentrations generally range from 35% to 40% [11].
The surface quality of a sample can be assessed by measuring roughness, which indicates the existence of fissures, streaks, or marks resulting from a specific bleaching process. The characteristics of these traces can be delineated using the following parameters: Sa (Arithmetic Mean Height - average surface roughness), Sq (Root Mean Square Height - more responsive to extreme values), and Sz (Maximum Height - total range including peaks and valleys).
This study aimed to assess the impact of a professional bleaching agent on the surface morphology of two distinct composite materials: a microhybrid (Herculite XRV Ultra) and a nanohybrid (HerculiteXRV Ultra).
This study is important as it will contribute to the literature regarding the mechanical alterations experienced by composite materials when exposed to tooth-bleaching agents and will furnish clinicians with evidence-based guidelines. This may result in enhanced clinical outcomes and an increased success rate for teeth bleaching procedures.
The choice of these materials is especially important because:
Microhybrid composites have established themselves as the gold standard in restorative dentistry, owing to their optimal mechanical properties and polishability, thus serving as a reliable benchmark for comparison.
Nanohybrid composites signify the forthcoming evolution of restorative materials, providing enhanced aesthetics and wear resistance through their nano-filler technology.
This research will enhance the existing knowledge in material science within dentistry, aiding clinical decisions that improve aesthetic results and restoration longevity.
2. Materials and Methods
Two restorative materials with the same A2 shade were utilized in this investigation [Table 1]: a nanohybrid composite resin material (Kerr Italia S.r.l.) and a microhybrid composite resin material (Kerr Italia S.r.l.).
The bleaching agents used were:
• Zoom Whitening + Zoom Gel (Philips Zoom, USA) a light-activated bleaching system using 40% hydrogen peroxide gel.
• QuickLase Diode Laser + QuickLase Gel (QuickLase, UK) a diode laser-activated bleaching system (940 nm) with hydrogen peroxide gel. For the study, the following materials, as presented in Table 1, were selected.
After completing the composite disc preparation, the discs were categorized into two groups according to the type of resin composite restorations and bleaching protocol [Figure 1].
Group N: 30 CRD for nanohybrid composite material, group M: 30 CRD for microhybrid composite material. Each group was then subdivided according to the bleaching protocol into three subgroups (10 CRD each):
• N1 and M1 (Control subgroups): No bleaching was applied.
• N2 and M2 (Zoom subgroups): Bleached using Philips Zoom light with Zoom bleaching material (light activation technique).
• N3 and M3 (Laser subgroups): Bleached using QuickLase diode laser (940 nm) with QuickLase bleaching material (laser activation technique).
2.1. Preparation of Samples
A total of 60 composite resin discs (CRDs) will be constructed from a Teflon mold and divided into two main groups (n = 30/group) based on the types of composite resin restorations. The dimension of CRD will be 10 mm × 4 mm. A glass slab was overlayed with a microscopic glass slide[12].
Following the placement of the resin composite material in the mold, the CRDs then light-cured from the top utilizing LED (Elipar S10, 3M ESPE, Germany) for 40 s (20 s from above and another from below the specimen) with intimate contact with glass slap for closer distance for curing. A radiometer was used to gauge the LED bulb's power before polymerization. Digital calipers were used to measure the thickness of each sample. After the composite resin discs were prepared, each group was arranged and placed inside a custom-made metallic mold. Polishing was performed on all samples using a standardized polishing protocol, as shown in[Figure 2]. Every sample was polished for 10 s at a slower speed with moderate pressure using fine and superfine paper discs fixed in a contra-angle handpiece (Sof-Lex™ Contouring and Polishing Discs Kit, 3M Company, St. Paul MN, USA). The specimens will then be placed in a basket and alternated between 5°C and 55°C water baths with a dwell time of 20 seconds and a rest time of 20 seconds[5].
2.2. Bleaching Technique
- For the light-activated bleaching group, after the application of hydrogen peroxide gel of about 2–3 mm thickness onto each specimen, they will be cured with a zoom whitening light source for 15 min. The specimens were then cleaned with tissue paper without washing before the same step was repeated twice with 1-minute rest intervals in between. The gel was removed using high-speed suction, washed away, and then dried (according to the manufacturer's instructions).
- For the laser-activated bleaching group, after the application of hydrogen peroxide gel of about 2–3 mm thickness onto each specimen, the agent activated with a diode laser with 2 cycles, 30 s for each cycle, the whitening gel remains on CRDs surface for at 8 minutes following the second laser cycle (according to manufactures instruction).
After bleaching, all composite resin discs (CRDs) were rinsed thoroughly with distilled water to remove residual bleaching agents and then dried using oil-free air.
The surface quality of a sample is quantified by measuring roughness, which shows the fissures, streaks or traces resulting from a particular process of working orfinishing/polishing. The profile of these traces can be described using the following parameters: Sa (Arithmetic Mean Height - average surface roughness (nm)), Sq (Root Mean Square Height - more sensitive to extreme values (nm)), and Sz (Maximum Height - total range (peak + valley) (nm)).
This study is significant because it will add to the literature on the mechanical changes undergone by composite materials under the action of tooth-bleaching substances and will provide clinicians with evidence-based recommendations. Ultimately, this can lead to improved clinical outcomes and a higher success rate for teeth bleaching treatment.
2.3. Measuring of the Surface Roughness
Atomic Force Microscopy (AFM)
General Principle: The Atomic Force Microscope is a kind of scanning probe microscope in which a topographical image of the sample surface can be achieved based on the interactions between a tip and a sample surface. The atomic force microscope was invented by Gerd Binning et al. in 1986 at IBM Zurich based on the STM (Scanning Tunneling Microscope) already presented in 1981. While the latter depends on the conductive samples, the AFM allows also the use of non-conductive samples. In 1987, the inventors were awarded the Nobel Prize in Physics for the achievements. A typical AFM consists of a cantilever with a small tip (probe) at the free end, a laser, a 4-quadrant photodiode and a scanner. The surface characteristics can be explored with very accurate resolution in a range of 100 μm to less than 1 μm.
2.4. Statistical Analysis
Statistical analysis was performed using SPSS® version 25. The normality of distributions was assessed using the Shapiro- Wilk test. Differences between two independent variables were assessed using the Student-T test for independent samples. A p value <0.05 was considered as statistically significant
3. Results
The present study evaluated the surface roughness parameters (Sa, Sq, and Sz) of microhybrid and nanohybrid composites subjected to different bleaching protocols. The values were recorded and statistically analyzed. The results are summarized in the [Table 2].
As illustrated in [Figure 3], the Atomic Force Microscopy (AFM) pseudo-color and 3D surface view images demonstrate the surface topography and roughness of composite samples across all experimental groups. These images reveal distinct surface alterations that occurred following the different bleaching procedures, highlighting the impact of each treatment modality on the composite materials’ surface characteristics.
• (a) Nano Control: The untreated nanohybrid composite surface appears relatively smooth with minimal surface irregularities. The uniformity and compactness of the topography indicate a stable and intact surface before any bleaching intervention.
• (b) Nano + Zoom: The surface shows increased roughness and irregular texture, with more prominent elevations and depressions compared to the control. This suggests that light-activated bleaching with Zoom gel induced topographical changes and disrupted the resin matrix structure.
• (c) Nano + Laser: The most irregular surface among the nanohybrid group is observed here. The laser bleaching treatment resulted in sharp peaks and deep valleys, indicating extensive surface degradation and higher roughness values.
• (d) Micro Control: The unbleached microhybrid composite presents a smoother surface, yet slightly more textured than the Nano control. The micro-scale filler particles are more apparent, but surface continuity is still maintained.
• (e) Micro + Zoom: Moderate surface changes are evident. The microhybrid composite subjected to Zoom bleaching shows increased roughness with more exposed filler-matrix boundaries, reflecting the oxidative stress caused by light activation.
• (f) Micro + Laser: This group demonstrates the highest surface irregularities and roughness among all tested samples. The surface is markedly disrupted, with significant elevation differences and loss of homogeneity, indicating that diode laser bleaching caused severe deterioration of the microhybrid resin structure.
These images confirm that laser bleaching induces the most aggressive surface damage, especially in microhybrid composites, followed by Zoom bleaching, while control samples preserve smoother topography. This qualitative AFM analysis supports the quantitative roughness data (Sa, Sq, Sz) obtained in the study.
3.1. Micro vs Nano Surface Roughness After Bleaching

Table 3.
Statistical comparison of surface roughness (Sa) values between nanohybrid and microhybrid composites subjected to Zoom and Laser bleaching.
Table 3.
Statistical comparison of surface roughness (Sa) values between nanohybrid and microhybrid composites subjected to Zoom and Laser bleaching.
| Groups | N | Mean | Std. Deviation | Test value | p -value | |
|---|---|---|---|---|---|---|
| Zoom | Nano | 10 | 57.7720 | 13.87759 | 6.042 | 0.0001** |
| Micro | 10 | 103.1150 | 19.25045 | |||
| Laser | Nano | 10 | 78.1270 | 23.29051 | 2.583 | 0.019* |
| Micro | 10 | 106.1600 | 25.21317 | |||
3.2. Zoom-Bleached Microhybrid vs. Zoom-Bleached Nanohybrid
A highly significant difference was found between Zoom-bleached microhybrid and Zoom-bleached nanohybrid, as the p -value (0.0001) less than (0.05)
3.3. Laser-Bleached Microhybrid vs. Laser-Bleached Nanohybrid
A significant difference was found between Laser-bleached microhybrid & Laser-bleached nanohybrid , as the p -value (0.019) less than (0.05).
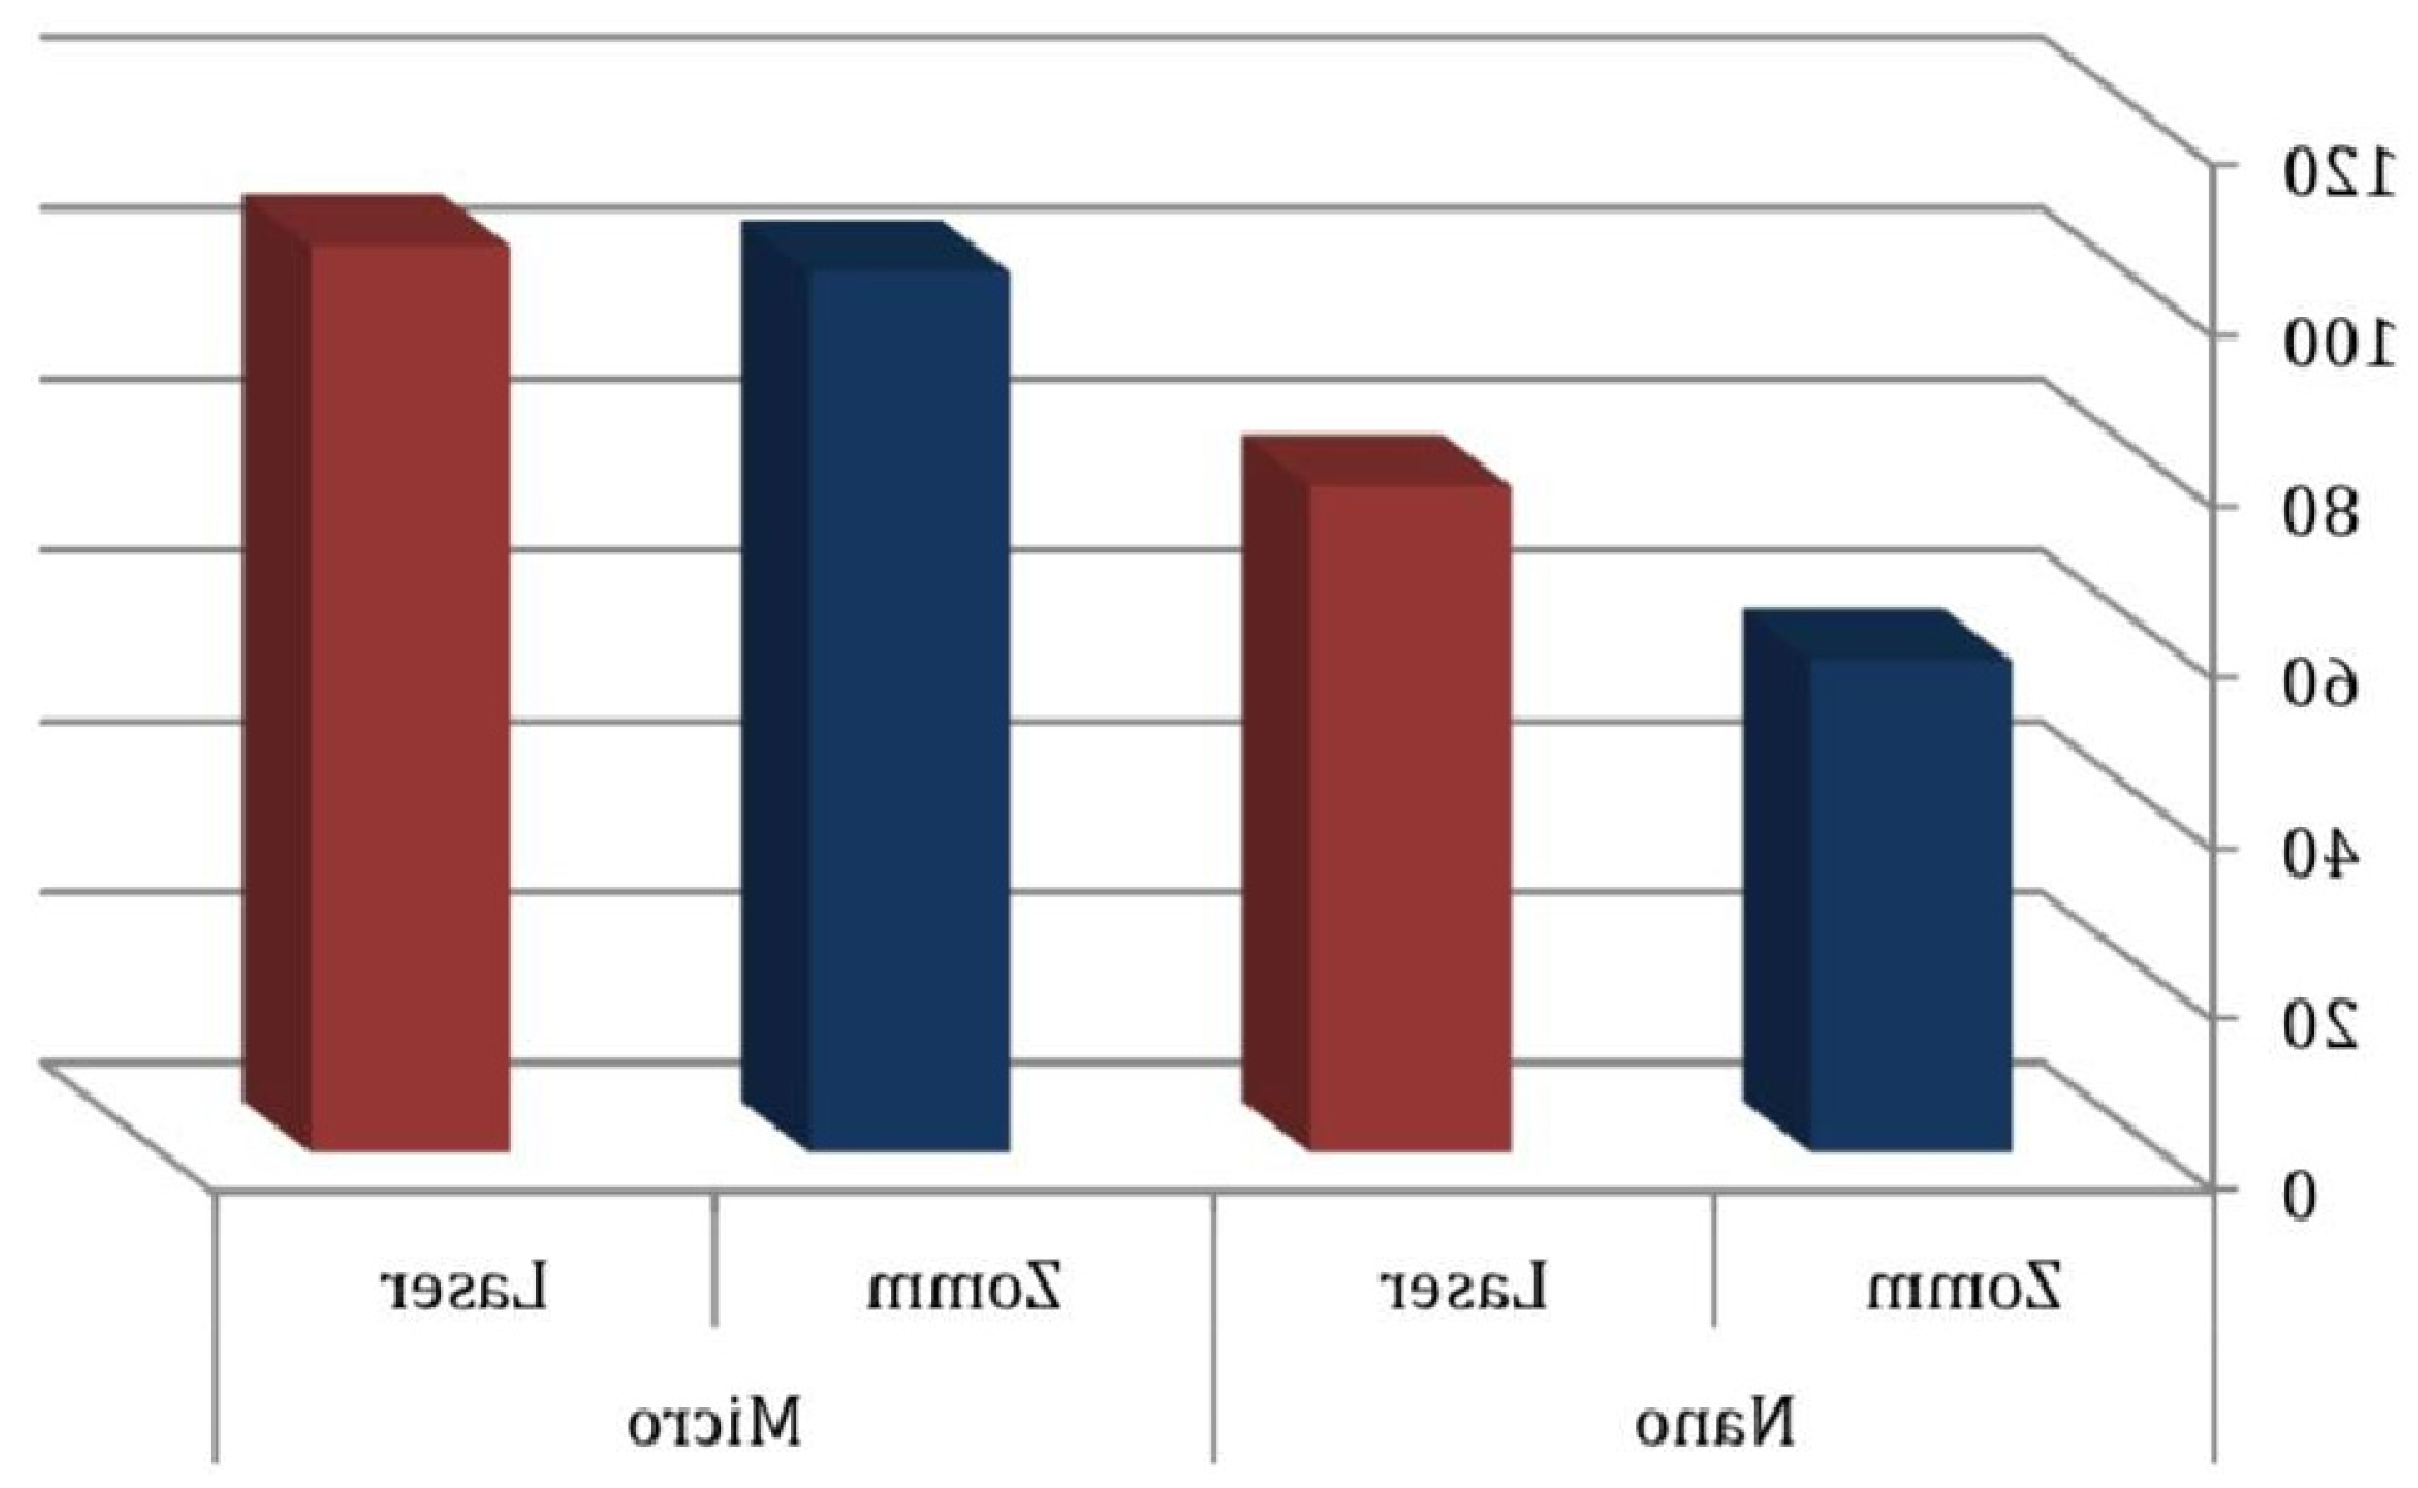
Figure 4.
Bar chart comparing surface roughness (Sa) among Zoom-bleached and Laser-bleached composites (Nano and Micro hybrid).
Figure 4.
Bar chart comparing surface roughness (Sa) among Zoom-bleached and Laser-bleached composites (Nano and Micro hybrid).

3.4. Zoom vs Laser: Within-Group Roughness Comparison
Table 4.
Statistical comparison of surface roughness (Sa) values between Zoom and Laser bleaching techniques within nanohybrid and microhybrid composite groups.
Table 4.
Statistical comparison of surface roughness (Sa) values between Zoom and Laser bleaching techniques within nanohybrid and microhybrid composite groups.
| Groups | N | Mean | Std. Deviation | Test value | p -value | |
|---|---|---|---|---|---|---|
| Nano | Zomm | 10 | 57.7720 | 13.87759 | 2.374 |
0.032* |
| Laser | 10 | 78.1270 | 23.29051 | |||
| Micro | Zomm | 10 | 103.1150 | 19.25045 | 0.304 |
0.765 |
| Laser | 10 | 106.1600 | 25.21317 | |||
Zoom-Bleached Nanohybrid vs. Laser-Bleached Nanohybrid
A significant difference was found between Zoom-bleached nanohybrid &. Laser-bleached nanohybrid, as the p -value (0.032) less than (0.05).
Zoom-Bleached Microhybrid vs. Laser-Bleached Microhybrid
No significant difference was found between Zoom-bleached microhybrid and Laser-bleached microhybrid as the p -value (0.765) more than (0.05).
Figure 5.
Bar chart comparing surface roughness (Sa) between Zoom-bleached and Laser-bleached nanohybrid and microhybrid composites.
Figure 5.
Bar chart comparing surface roughness (Sa) between Zoom-bleached and Laser-bleached nanohybrid and microhybrid composites.
4. Discussion
The present study aimed to evaluate the effects of bleaching procedures on the surface roughness of two types of composite resin materials—nanohybrid and microhybrid—using Atomic Force Microscopy (AFM) to quantify topographic changes after exposure to Zoom (light-activated) and Laser (diode laser) bleaching.
Surface roughness (Sa) is a critical factor in determining the aesthetic quality, longevity, and clinical performance of dental restorative materials. Increased surface roughness may lead to plaque retention, discoloration, wear, and degradation over time. In this study, both bleaching modalities were found to increase surface roughness compared to control groups, but with varying intensities depending on the composite type.
Laser bleaching had a more pronounced effect on surface roughness compared to Zoom bleaching in both nanohybrid and microhybrid groups. The highest mean Sa value was observed in the Micro Laser group (113.74 nm), followed by Micro Zoom (103.12 nm), indicating that microhybrid composites were more susceptible to surface damage, especially when treated with high-energy sources like lasers. In contrast, the Nano Zoom and Nano Laser groups exhibited lower Sa values (57.77 nm and 81.15 nm, respectively), suggesting better resistance of nanohybrid composites to surface This is consistent with studies showing a more pronounced laser effect on microhybrid composites[13].
These findings were supported by AFM images, which clearly depicted smoother surfaces in the control samples and increasingly irregular surfaces following bleaching, especially with laser exposure. The surface of microhybrid composites demonstrated deeper grooves and more pronounced roughness features compared to nanohybrid composites.
Statistical analysis further confirmed the impact of bleaching on surface integrity. The comparison between Zoom-bleached microhybrid and nanohybrid composites showed a highly significant difference (p < 0.001), while laser bleaching showed a significant difference (p = 0.019). However, when comparing bleaching methods within the same composite type, the results were not statistically significant (p > 0.05), indicating that both Zoom and Laser treatments had a similar impact within each material type.
These results align with previous research suggesting that filler particle size and matrix composition influence the material’s response to bleaching. Nanohybrid composites, with their smaller and more uniformly distributed fillers, seem to better withstand oxidative stress and thermal effects of bleaching agents compared to the coarser microhybrid composites[14].
However, some studies may report different findings regarding the comparative effects of bleaching techniques[15,16].
The differential response between composite types can be attributed to their distinct compositional characteristics. Microhybrid composites contain larger filler particles (0.6-1 μm) dispersed in a Bis-GMA/TEGDMA matrix. During bleaching, the oxidative action of hydrogen peroxide preferentially attacks the resin matrix, while thermal effects from laser activation may create stress at the filler-matrix interface due to differential expansion coefficients. The larger particle size in microhybrids creates more substantial interfacial areas that are vulnerable to these degrading processes.
In contrast, nanohybrid composites benefit from their unique filler system, combining 20-50 nm silica nanoparticles with submicron barium glass fillers (0.6 μm). The nanoparticles fill voids between larger fillers, creating a more densely packed structure. This compact arrangement provides multiple advantages:
(1) reduced permeability to bleaching agents
(2) greater thermal stability due to improved stress distribution,
and (3) enhanced silane coupling efficiency that maintains filler-matrix bonding integrity during chemical challenges.
Clinically, this suggests that while both bleaching methods can be used safely, special care should be taken when bleaching teeth with older or microhybrid restorations, as they may be more prone to surface degradation. Surface protection techniques or post-bleaching polishing might be necessary to preserve restoration integrity.
While providing valuable insights, this in vitro study has certain limitations. The static testing environment doesn’t account for potential synergistic effects of oral conditions like thermal cycling, mechanical loading, or enzymatic activity. Additionally, newer composite formulations with advanced filler technologies were not evaluated.
5. Conclusions
The present study demonstrated that both Zoom and Laser bleaching procedures adversely affect the roughness of composite resin materials, with Laser bleaching producing a more significant increase in surface irregularities compared to Zoom bleaching. Microhybrid composites were found to be more susceptible to surface roughness changes than nanohybrid composites, likely due to differences in filler particle size and matrix composition. The Atomic Force Microscopy (AFM) analysis confirmed these observations, revealing more pronounced surface topography alterations in microhybrid specimens, particularly following laser exposure.
These findings underscore the importance of carefully selecting bleaching protocols, especially when treating teeth with existing restorations. Nanohybrid composites may offer greater resistance to bleaching-induced surface changes, thereby enhancing the longevity and aesthetic stability of restorations. Further research is warranted to investigate the long-term clinical implications of various bleaching techniques on different restorative materials under simulated intraoral conditions.
Author Contributions
Conceptualization, K.F. and B.A.; methodology, K.F. and B.A; software, K.F.; validation, K.F.; formal analysis, K.F; investigation, K.F; resources, K.F.; data curation, K.F.; writing—original draft preparation, K.F.; writing—review and editing, K.F.; visualization, K.F; supervision, B.A.; project administration, B.A.; funding acquisition, K.F.. All authors have read and agreed to the published version of the manuscript.
Funding
This research received no external funding.
Institutional Review Board Statement
Not applicable.
Informed Consent Statement
Not applicable.
Data Availability Statement
Data are reported in the manuscript.
Conflicts of Interest
The authors declare no conflicts of interest
Abbreviations
The following abbreviations are used in this manuscript:
| AFM | Atomic Force Microscopy |
| CRD | Composite Resin Disc |
| Sa | Arithmetic Mean Height |
| Sq | Root Mean Square Height |
| Sz | Maximum Height |
| LED | Light Emitting Diode |
| nm | Nanometer |
| µm | Micrometer |
| Bis-GMA | Bisphenol A-Glycidyl Methacrylate |
| TEGDMA | Triethylene Glycol Dimethacrylate |
| USA | United States of America |
References
- kenneth, j. anusavice, chiayi shen, philips’ science of dentaol materials, 12th edition, elsevier, st. louis, mo, usa, 2022.
- N. Aydın, F. Topçu, S. Karaoğlanoğlu, E. Oktay, U. Erdemir, Effect of finishing and polishing systems on the surface roughness and color change of composite resins, J Clin Exp Dent (2021) e446–e454. [CrossRef]
- R.D. Yadav, D. Raisingani, D. Jindal, R. Mathur, A Comparative Analysis of Different Finishing and Polishing Devices on Nanofilled, Microfilled, and Hybrid Composite: A Scanning Electron Microscopy and Profilometric Study, Int J Clin Pediatr Dent 9 (2016) 201–208. [CrossRef]
- R. Jaramillo-Cartagena, E.J. López-Galeano, F. Latorre-Correa, A.A. Agudelo-Suárez, Effect of Polishing Systems on the Surface Roughness of Nano-Hybrid and Nano-Filling Composite Resins: A Systematic Review, Dentistry Journal 9 (2021) 95. [CrossRef]
- A. Pallarés-Serrano, A. Pallarés-Serrano, S. Pallarés-Serrano, A. Pallarés-Sabater, Study of the Intra-Coronal Pressure Generated by Internal Bleaching Agents and Its Influence on Temporary Restoration, Applied Sciences 12 (2022) 2799. [CrossRef]
- T. Savic-Stankovic, B. Karadzic, M. Latkovic, V. Miletic, Clinical efficiency of a sodium perborate - hydrogen peroxide mixture for intracoronal non-vital teeth bleaching, Srp Arh Celok Lek 148 (2020) 24–30. [CrossRef]
- E.D. Acuña, S.O. Parreiras, M.W. Favoreto, G.P. Cruz, A. Gomes, C.P.F. Borges, A.D. Loguercio, A. Reis, In-office bleaching with a commercial 40% hydrogen peroxide gel modified to have different pHs: Color change, surface morphology, and penetration of hydrogen peroxide into the pulp chamber, J Esthet Restor Dent 34 (2022) 322–327. [CrossRef]
- J. Rodríguez-Martínez, M. Valiente, M. Sánchez-Martín, Tooth whitening: From the established treatments to novel approaches to prevent side effects, J Esthet Restor Dent 31 (2019) 431–440. [CrossRef]
- F.P. Silva, A.L.R. Vilela, M.M.G. Almeida, A.R.F. Oliveira, L.H.A. Raposo, M.S. Menezes, Surface Topography, Gloss and Flexural Strength of Pressable Ceramic After Finishing-Polishing Protocols, Braz. Dent. J. 30 (2019) 164–170. [CrossRef]
- B.K. Amin, Effects of Er,Cr: YSGG Laser Application in De-Bonding of Different Ceramic Veneer Materials (In Vitro Study), Coatings 13 (2023) 1352. [CrossRef]
- M. Boruga, G. Tapalaga, M.M. Luca, B.A. Bumbu, Hydrogen Peroxide-Free Color Correctors for Tooth Whitening in Adolescents and Young Adults: A Systematic Review of In Vitro and Clinical Evidence, Dentistry Journal 13 (2025) 346. [CrossRef]
- M. Bahari, M.E. Ebrahimi Chaharom, M. Daneshpooy, S. Gholizadeh, H. Pashayi, Effect of bleaching protocols on surface roughness and biofilm formation on silorane-based composite resin, Dent Res J (Isfahan) 16 (2019) 264–270.
- Ż.A. Mierzejewska, K. Łukaszuk, B. Rusztyn, K. Maliszewski, The Influence of Bleaching Intensity and Laser Activation on the Durability of Selected Aesthetic Composites—An In Vitro Study, JFB 16 (2025) 193. [CrossRef]
- N. S Nashtum, A. H Al-Khafaji, The effect of in office bleaching on surface roughness and micro-hardness of newly developed composite materials (In vitro study), Journal of Bagdad College of Dentistry (2014). https://jcodental.uobaghdad.edu.iq/index.php/jcod/article/view/445 (accessed June 18, 2025).
- M. Jaber Ayash, Z. H. Abdul Ameer, The Effect of Dental Bleaching on Surface Roughness and Microhardness of three Different Filler Types of Composites (An in vitro Study), Mustansiriya Dental Journal (2022). https://mds.iq/articles/the-effect-of-dental-bleaching-on-surface-roughness-and-microhardness-of-three-different-filler-types-of-composites/ (accessed June 18, 2025).
- A.D. Popescu, M.J. Tuculina, O.A. Diaconu, L.M. Gheorghiță, C. Nicolicescu, C.N. Cumpătă, C. Petcu, J. Abdul-Razzak, A.M. Rîcă, R. Voinea-Georgescu, Effects of Dental Bleaching Agents on the Surface Roughness of Dental Restoration Materials, Medicina 59 (2023) 1067. [CrossRef]
Figure 1.
Distribution of composite resin discs.
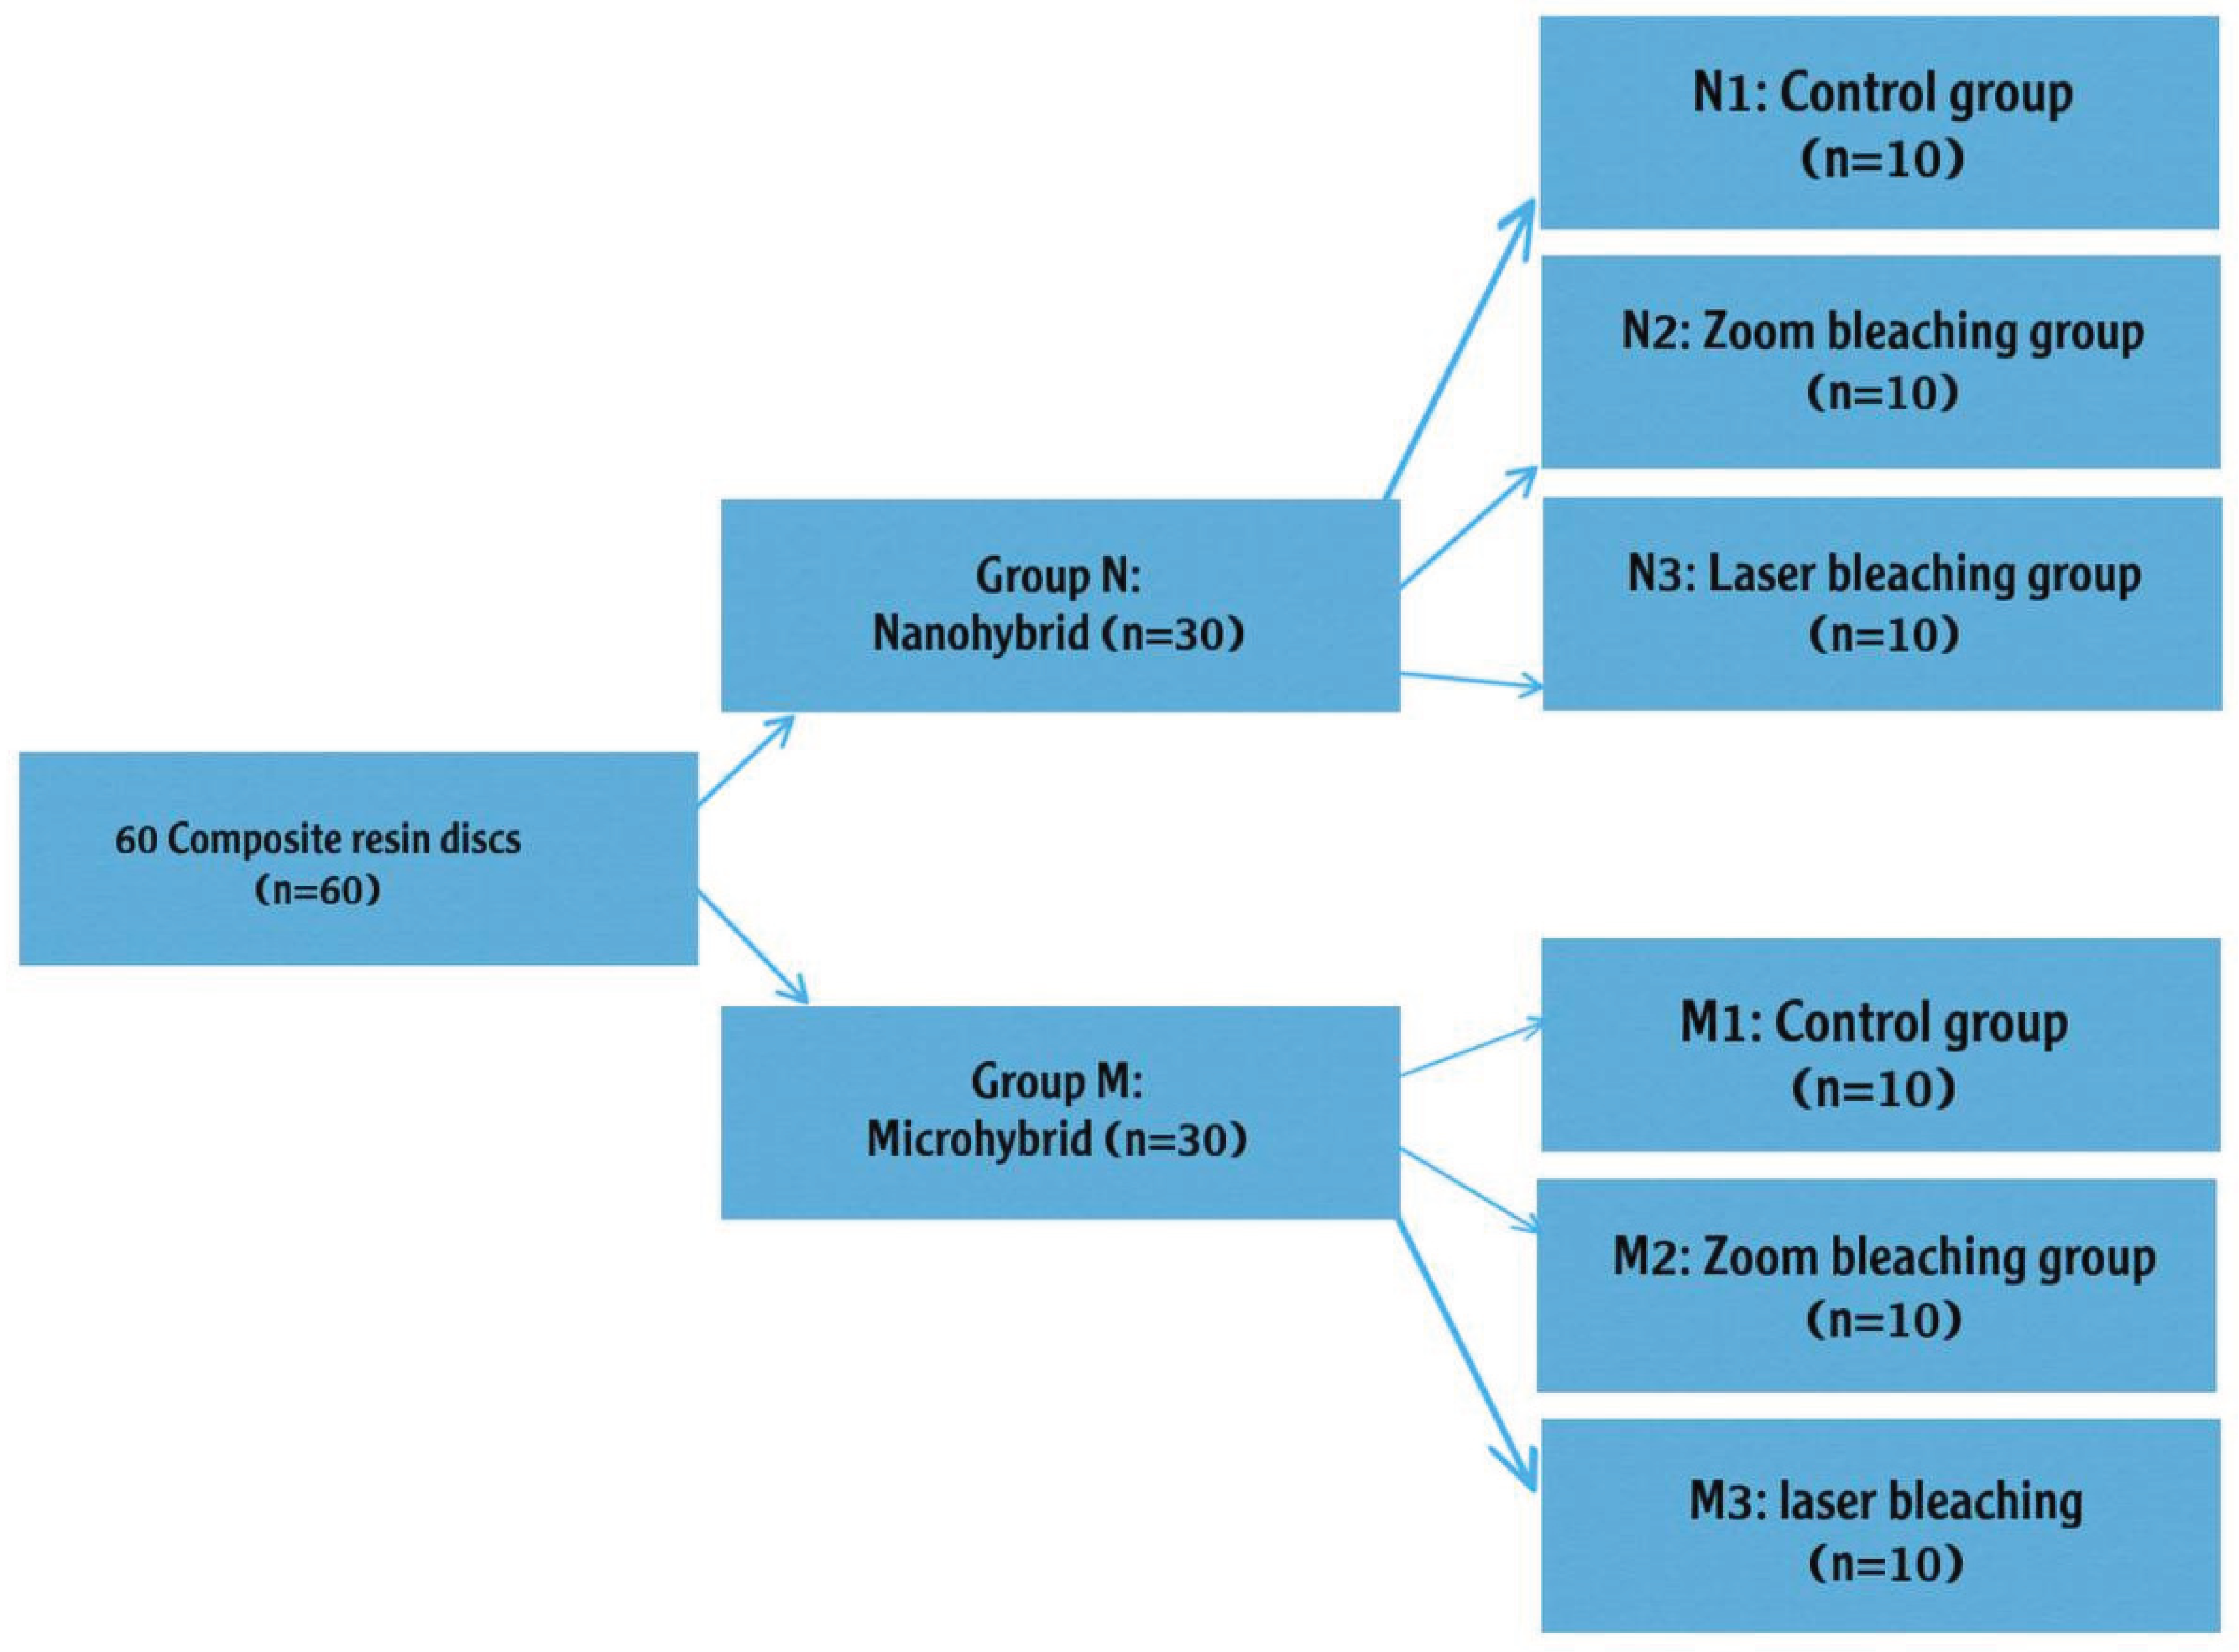
Figure 2.
Standardized arrangement of composite resin samples within a metallic mold after preparation and before surface polishing.
Figure 2.
Standardized arrangement of composite resin samples within a metallic mold after preparation and before surface polishing.
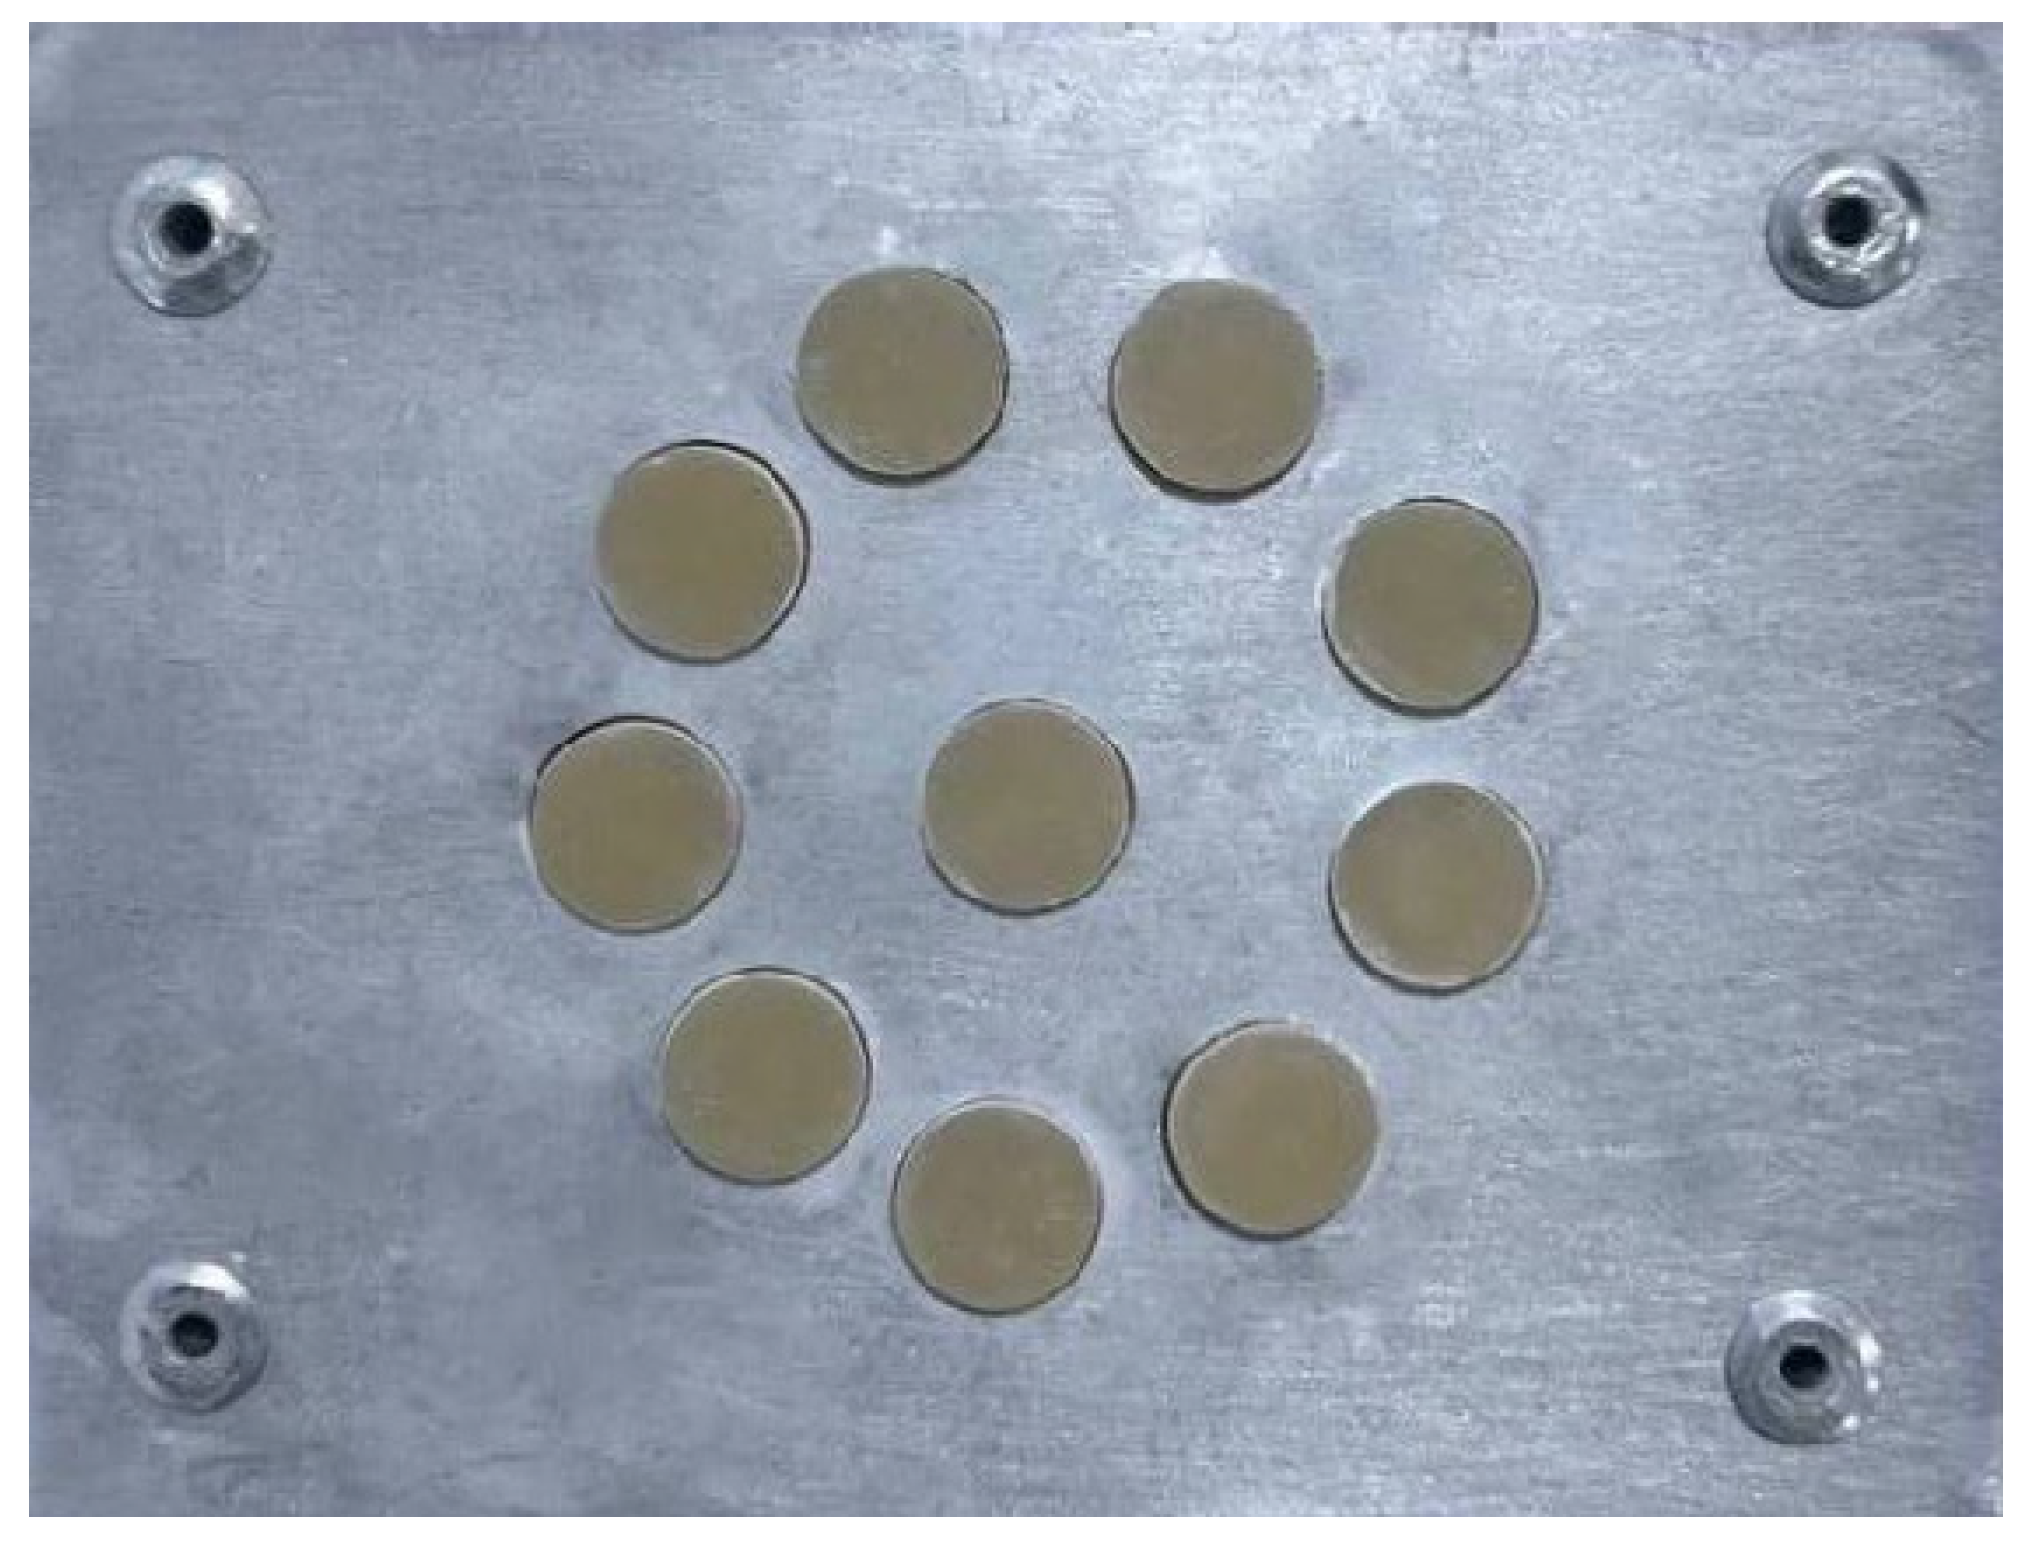
Figure 3.
Atomic Force Microscopy (AFM) pseudo-color and 3D surface view images.
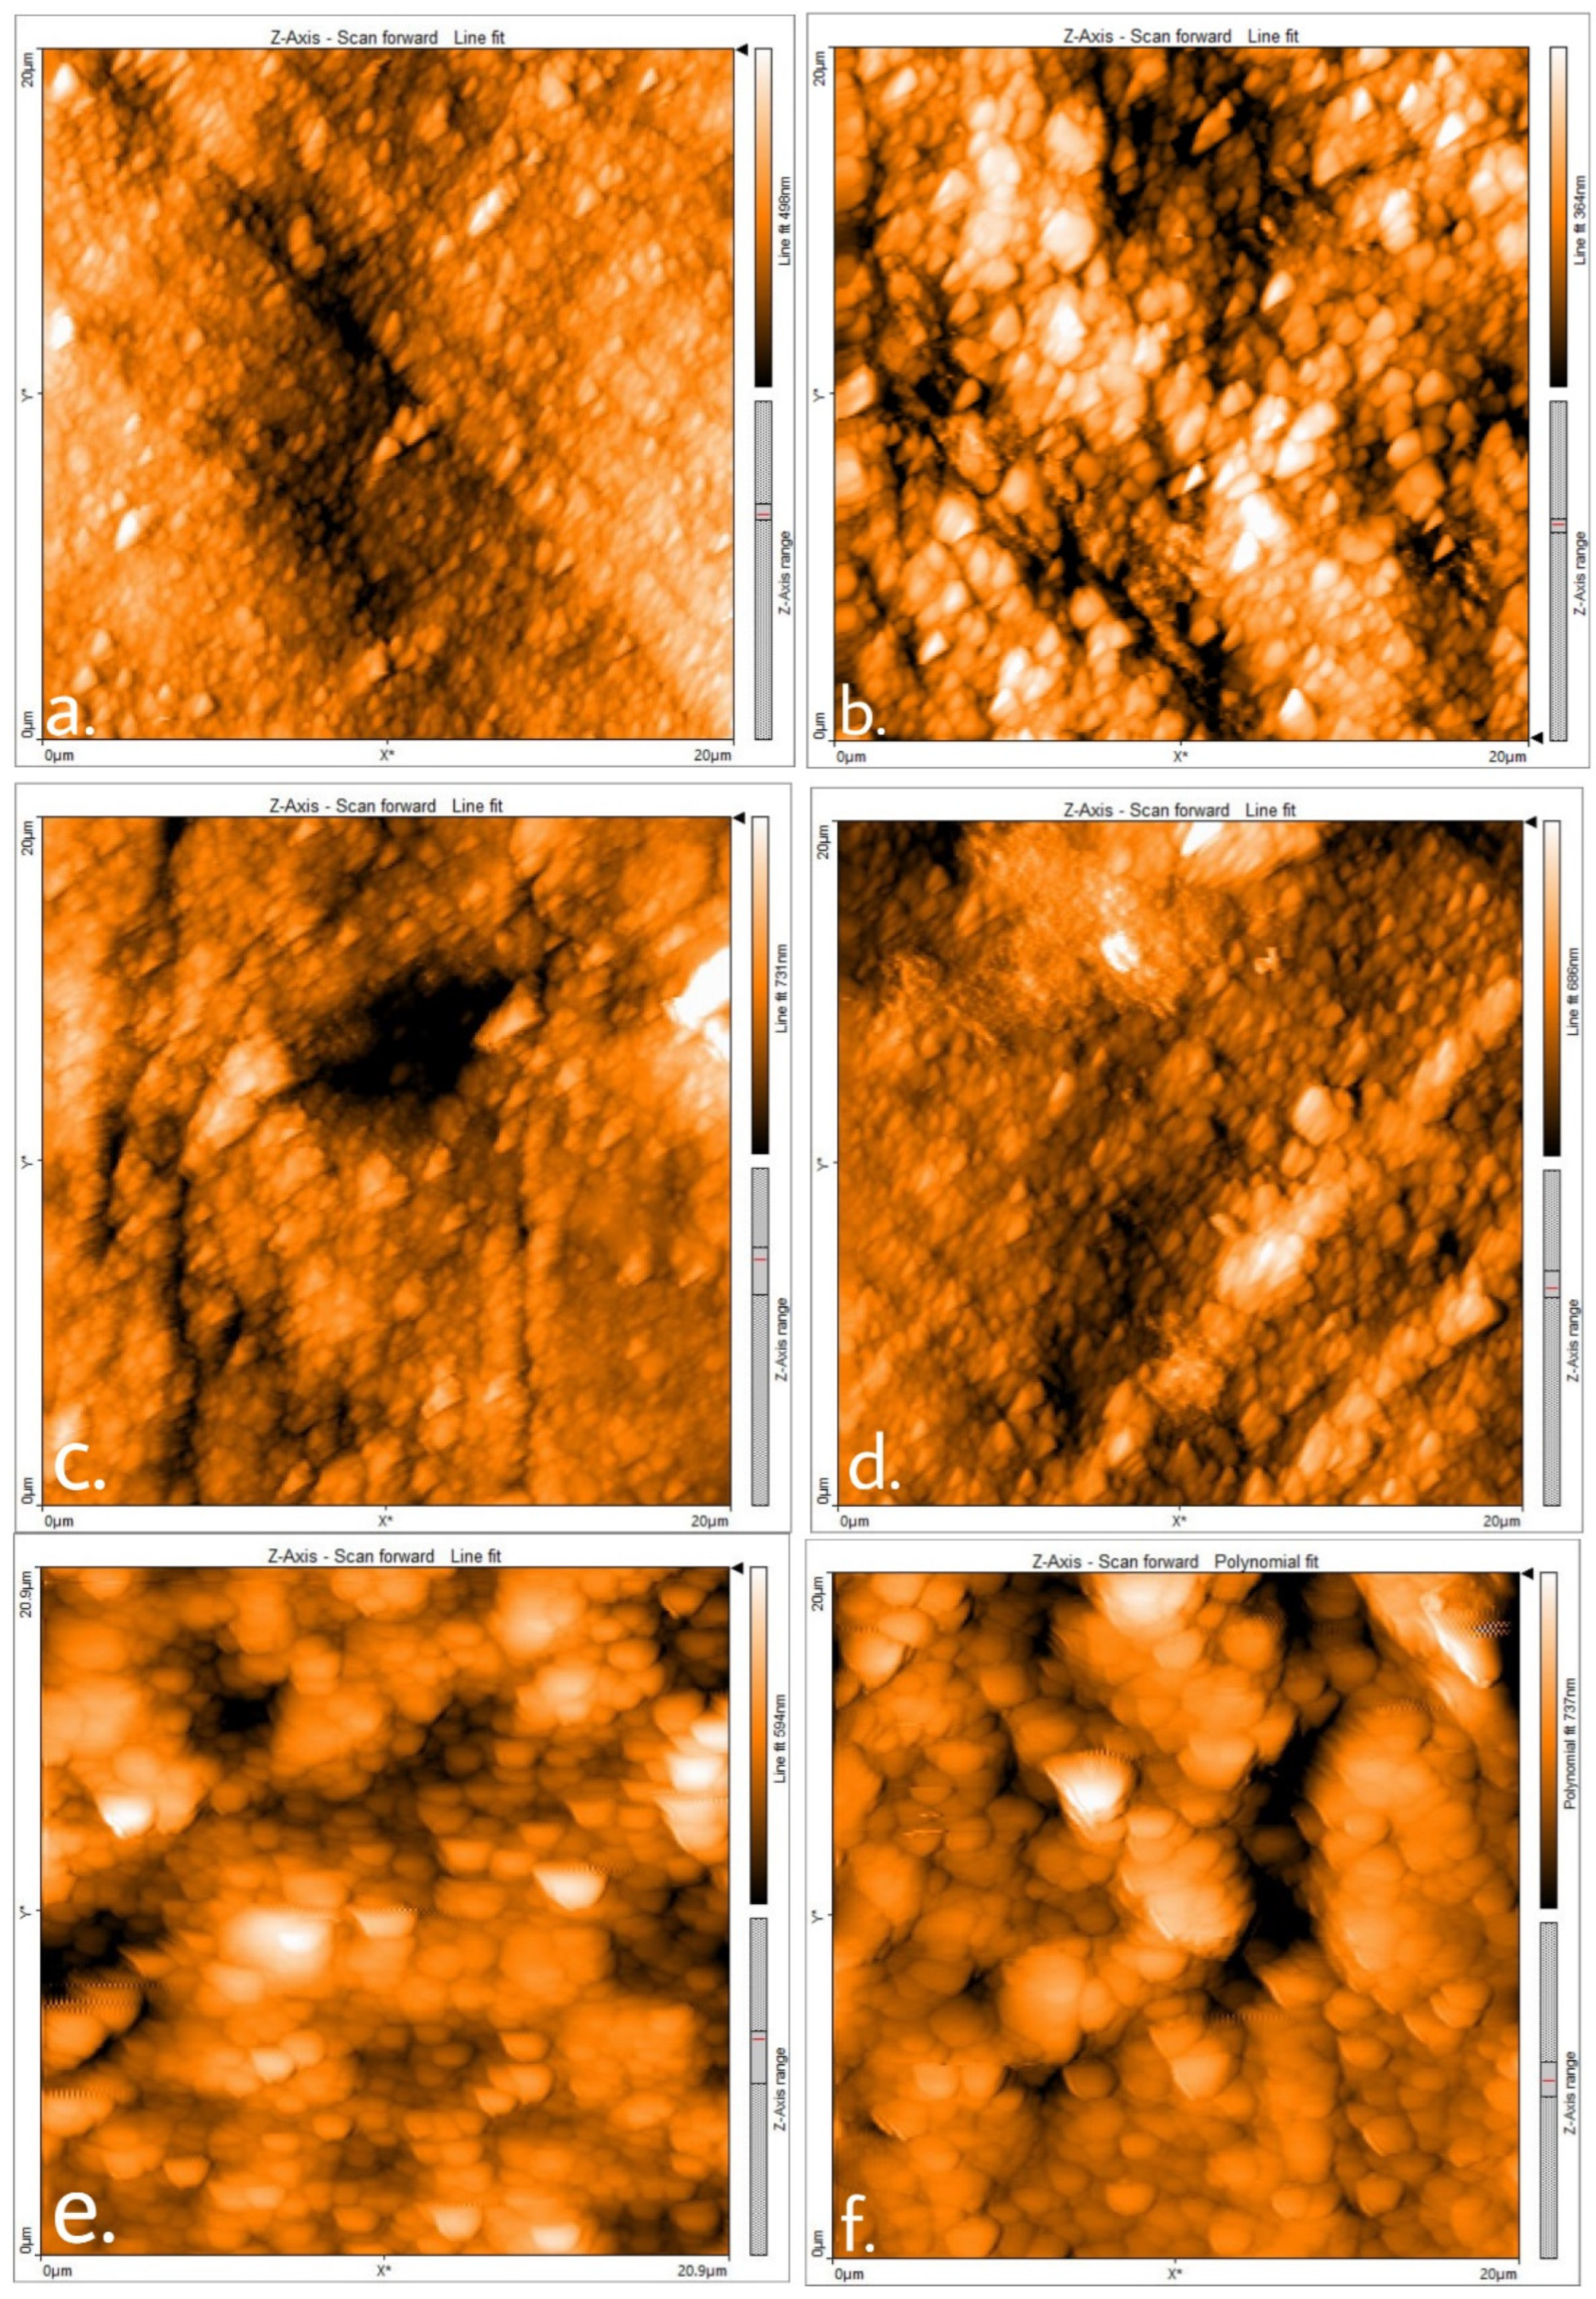
Table 1.
Materials used in the study.
| Material Type | Name | Manufacturer | Composition / Specifications |
|---|---|---|---|
| Composite Resin (Microhybrid) | Herculite XRV Ultra (Microhybrid) | Kerr Italia S.r.l. | Bis-GMA, TEGDMA, Barium glass and silicon dioxide fillers, Additives, stabilizers, catalysts |
| Composite Resin (Nanohybrid) | Herculite XRV Ultra (Nanohybrid) | Kerr Italia S.r.l. | Bis-GMA, TEGDMA, Prepolymerized filler, Silica nanofiller (20–50 nm nanoparticles), Barium submicron fillers (0.6 µm), Titanium Dioxide (TiO₂), pigments |
| Bleaching Agent (Light-activated) | Zoom Gel | Philips Zoom (USA) | Hydrogen peroxide 40% concentration |
| Bleaching Agent (Laser-activated) | QuickLase Gel | QuickLase (UK) | Hydrogen peroxide gel |
Table 2.
Summary of Surface Roughness Parameters. This table presents the mean, standard deviation (SD), and standard error (SE) for Sa, Sq, and Sz values across all experimental groups.
Table 2.
Summary of Surface Roughness Parameters. This table presents the mean, standard deviation (SD), and standard error (SE) for Sa, Sq, and Sz values across all experimental groups.
| Group | Sa Mean | Sa SD | Sa SE | Sq Mean | Sq SD | Sq SE | Sz Mean | Sz SD | Sz SE |
|---|---|---|---|---|---|---|---|---|---|
| Nano Control | 42.18 | 6.62 | 2.09 | 56.29 | 7.6 | 2.4 | 510.03 | 130.59 | 41.29 |
| Nano Zoom | 57.77 | 13.88 | 4.39 | 71.5 | 11.45 | 3.62 | 656.49 | 143.74 | 45.43 |
| Nano Laser | 81.15 | 22.06 | 6.98 | 108.62 | 30.88 | 9.77 | 1049.2 | 424.48 | 134.18 |
| Micro Control | 59.43 | 9.33 | 2.95 | 78.75 | 13.41 | 4.24 | 752.77 | 121.97 | 38.57 |
| Micro Zoom | 103.12 | 19.25 | 6.09 | 131.71 | 28.13 | 8.89 | 1048.41 | 211.62 | 66.91 |
| Micro Laser | 113.74 | 36.16 | 11.43 | 147.37 | 44.95 | 14.21 | 1232.56 | 281.77 | 89.09 |
Disclaimer/Publisher’s Note: The statements, opinions and data contained in all publications are solely those of the individual author(s) and contributor(s) and not of MDPI and/or the editor(s). MDPI and/or the editor(s) disclaim responsibility for any injury to people or property resulting from any ideas, methods, instructions or products referred to in the content. |
© 2025 by the authors. Licensee MDPI, Basel, Switzerland. This article is an open access article distributed under the terms and conditions of the Creative Commons Attribution (CC BY) license (http://creativecommons.org/licenses/by/4.0/).
Copyright: This open access article is published under a Creative Commons CC BY 4.0 license, which permit the free download, distribution, and reuse, provided that the author and preprint are cited in any reuse.


