
Submitted:
15 August 2025
Posted:
19 August 2025
You are already at the latest version
Abstract
Advancements in Computer Aided Design/Computer Aided Manufacturing (CAD/CAM), promoted the development of novel dental materials for several types of definitive restorations. The aim of this study was to evaluate the surface characteristics of resin-based CAD/CAM restorative materials, fabricated using both subtractive and additive manufacturing techniques. The materials tested included Filtek Z550 (FZ), Vita Enamic (VE), Shofu HC (SH), and VarseoSmile TriniQ (TQ). For each material, 24 specimens were prepared; half were manually polished following manufacturer’s recommendations, while the other half underwent standardized metallographic polishing. Surface roughness, wettability, and molecular composition were assessed. Statistical analysis was performed using IBM SPSS 29.0 at a 95% confidence level (α = 0.05). Statis-tically significant differences in surface properties were observed between direct and indirect restoratives following manual polishing, with SH performing favorably in terms of surface roughness. The polishing method significantly influenced surface characteristics within each material, except for certain roughness parameters in SH. Both surface roughness and wettability were dependent on the material and the polishing technique, highlighting the need for improved material-specific polishing protocols.material-specific polishing protocols.
Keywords:
CAD-CAM
; surface properties
; wettability
; FTIR
; composite resins
; biomaterials
1. Introduction
The continued application of CAD/CAM technology in restorative dentistry has facilitated the development of advanced materials for a variety of indirect restorations, such as inlays, onlays, overlays, endocrowns, and full-coverage crowns. These restorations can be fabricated using two distinct manufacturing techniques: subtractive manufacturing (SM), using milling units to remove excess material from a solid block or disc, and additive manufacturing (AM), resulting in the layer-by-layer fabrication of restorations [1].
Based on their composition, CAD/CAM restorative materials for definitive restorations can be broadly categorized into ceramic and resin-based materials [2], with the latter further divided into polymer-infiltrated ceramic network (PICN) materials and resin-based materials enriched with dispersed fillers [3,4,5,6].
Resin-based materials are increasingly used in clinical applications due to their numerous advantages, including enhanced machinability—enabling faster and easier fabrication with reduced chipping—ease of intraoral repair, and mechanical properties that are adequately suited for clinical use [7,8]. Moreover, their physical characteristics, such as their modulus of elasticity, which closely resembles that of natural tooth structures, enhance their clinical performance [9,10]. Finally, the occlusal and proximal adjustments are easily accomplished [11]. Although milled restorations provide multiple clinical benefits, they are also linked to greater material wastage, thereby raising concerns about sustainability in dental practice. They generally require high production and hardware investment costs, and cutting tool wear is inevitable, affecting the quality of the final restoration [12].Lastly, the fabrication of complex geometries poses challenges [12,13,14]. To address these limitations, additive manufacturing via three-dimensional (3D) printing has been introduced in the field of dental science. 3D-printed dental resin-based restorations are primarily fabricated using vat polymerization techniques, including stereolithography (SLA), digital light processing (DLP), and liquid crystal display (LCD) printing [13,15]. Currently, a limited number of 3D-printed restorative materials suitable for permanent restorations are available on the market. Although additive manufacturing has been proven to offer satisfactory aesthetics, adequate marginal and internal fit, time-efficient manufacturing, and cost-effective restorations [16,17,18,19], the increased concentration of organic compounds—necessary to preserve their liquid consistency required for printing [20,21]— can result in a compromise of their clinical performance in restorative dentistry [22]. Several studies focused on the surface characteristics of subtractive-manufactured restorative materials, particularly to biofilm formation, with their divergent results highlighting the need for further investigation [23]. However, the surface properties of additive-manufactured restorative materials remain the least investigated characteristics, indicating a significant gap in the current literature.
In addition to restorative materials, dental manufacturers have developed specially designed polishing systems in an attempt to achieve a high-gloss appearance on the final restoration. An important consideration is the extent to which both material type and polishing procedures influence surface characteristics—such as roughness and wettability—as these properties are inextricably linked to plaque accumulation and secondary caries [24,25,26,27]. Furthermore, surface roughness is associated with wear resistance, color stability, aesthetics, and the overall longevity of the restoration [28,29].
In response to the aforementioned limitations in current research, this in vitro study aimed to evaluate the surface characteristics of novel CAD/CAM materials after polishing with manufacturer-recommended protocols and to compare these surfaces with those achieved through optimal metallographic polishing. The comparison sought to determine the extent to which clinical polishing protocols approximate the optimal polishing capacity of each material. Therefore, two null hypotheses were formed:
H₀ 1: There are no statistically significant differences in the surface properties among the tested materials when subjected to either the clinically recommended or the optimized metallographic polishing procedures.
H₀ 2: There are no statistically significant differences in surface characteristics between the clinically recommended polishing procedures and the corresponding optimized metallographic procedures for each material.
2. Materials and Methods
Four different restorative materials with varying compositions were included in the study. All included materials are indicated for single, extensive, definitive restorations. Details on material composition are presented in Table 1.
Sample Size Calculation
A sample size calculation was performed using the G*Power 3.1 software program (G*Power, Heinrich-Heine Universität Düsseldorf, Germany). The analysis was conducted with an alpha level of 0.05, a statistical power of 0.90 (90%), and a medium effect size for each tested parameter (material, polishing procedure, and their interaction), as determined by a pilot study. The smallest medium effect size was observed for the parameter Sds (f = 0.34), which was used as the basis for the calculation. Therefore, the total sample size was calculated at 93 taking into account the evaluation of 4 materials and 2 polishing procedures (a total of 8 groups). This corresponds to 24 samples per material group and 12 samples per polishing procedure within each material group.
Specimen Preparation
A total of ninety-six (96) specimens with standardized dimensions of 10 mm (width) x 12 mm (length) x 2 mm (height) were fabricated for each material. The direct composite resin specimens were fabricated by incrementally placing the material into transparent thermoplastic molds, which were created from a 3D-printed model with specified dimensions. These molds were pressed between glass plates covered with a Mylar strip and then light-cured for 20 seconds using a LED curing unit. (Elipar Deep Cure – L LED curing light, with an intensity of 1.47 mW/cm2, 3M ESPE, St. Paul, MN, USA). Specimens of the milled CAD/CAM materials (SH and VE) were fabricated using a 0.3 mm thick diamond wheel embedded in a low-speed precision cutting machine under constant water cooling. For the 3D-printed material, a model with the specified dimensions was designed using SolidWorks software (Dassault Systèmes, Vélizy-Villacoublay, France) and exported as an STL file. The file was imported into a nesting software program (AsigaComposer 2.0, Alexandria, NSW, Australia) and positioned horizontally on the build platform, without supports. The layer thickness was set to 50 μm, and a DLP 3D printer was selected to fabricate the specimens (ASIGA MAX 405, Alexandria, NSW, Australia). Following the manufacturer’s recommendations, cleaning and post-curing protocols were employed [33]. The dimensions of all specimens were verified using a digital caliper (± 0.01 mm).
Polishing Procedures
All specimens of each material (n = 24/material) were initially ground on a polishing unit (DapV, Struers, Copenhagen, Denmark) using silicon carbide (SiC) abrasive papers up to 1200 grit size to create a uniform baseline surface. Subsequently, half of the specimens from each material group (n=12/material) were polished according to each manufacturer’s specified polishing protocol recommended for each restorative material. More precisely, the direct composite FK, was manually polished using a four-stage aluminum oxide disc system, without polishing paste [30]. The milled composite SH was polished with a four-step silicon carbide and aluminum oxide disc polishing system, followed by the application of two polishing pastes [31]. The milled hybrid-ceramic material VE underwent manual polishing using a two-step polishing system, followed by the application of a diamond polishing paste [32]. Lastly, the 3D-printed composite was polished using pumice stone and a universal polishing paste [33]. For each specimen, a new polishing disc, lens, or goat hair bristle was used to ensure consistency and prevent cross-contamination. The remaining specimens (n = 12/material) were subjected to standardized optimal metallographic grinding up to 4000 grit, followed by high-performance polishing using polishing cloths and diamond suspensions and lubricants. Following polishing, specimens were ultrasonically cleaned in distilled water at 37 °C for 10 minutes. Details of the polishing procedures performed are presented in Table 2.
Surface Roughness Evaluation
Surface roughness was analyzed using an optical interferometric profiler (Wyko NT 1100, Veeco, Tucson, AZ, USA). Measurements were performed under the following conditions: a 20× Mirau lens, a 2× field of view, an analysis area of 148 × 113 μm² (41.6 × effective magnification), vertical scanning mode, 2% modulation, and tilt correction. For each specimen, three measurements were taken from the top surface, and the mean value was recorded as the representative result. 3D-profilometric images were acquired and the 3D- surface roughness parameters evaluated were: The amplitude parameters Sa (arithmetic mean of the absolute values of the surface height deviations measured from the best fitting plane) and Sz (average difference between the 5 highest peaks and 5 lowest valleys – ten point height over the complete 3D surface); the spatial parameter Sds (summit density, the number of summits per unit area making up the surface); the hybrid parameter Sdr (developed interfacial area ratio, the percentage of additional surface area contributed by the texture as compared to an ideal plane the size of the measurement region), and the functional parameters Sc (core void volume, the volume the surface would support from 10%-80% of the bearing ratio) and Sv (surface void volume, the volume the surface would support from 80% to 100% of the bearing ratio) [34]. To support surface characterization, representative images of each material were obtained at 50× magnification using a reflection-mode optical microscope (DM4000B, Leica Microsystems, Wetzlar, Germany).
Surface Wettability Assessment
Surface wettability was assessed by measuring the water contact angles via the sessile drop method [43]. A 2.0 μL droplet of ultrapure water was dispensed onto the specimen surface using a precision micro-pipette. The contact angle (θ) formed was measured 10 seconds after deposition by an optical goniometer (Ossila L2004A1, Leiden, Netherlands). The droplet profile was captured, and the left, right, and mean contact angles for each measurement were calculated. All measurements were performed under controlled environmental conditions (23 °C, 50% RH). For each specimen, three measurements were taken at distinct locations to ensure measurement accuracy and repeatability; the average value was then used for further analysis.
Attenuated Total Reflectance – Fourier Transformed Infrared Spectroscopy (ATR – FTIR) analysis
One unpolished specimen of each material and one polished sample of each material, either manually or metallographically, were subjected to ATR–FTIR analysis to obtain qualitative information on the chemical changes induced in the material surfaces after polishing. A single-reflection ATR accessory (Golden Gate, Specac, Orpington, Kent, UK) with a diamond crystal (2 × 2mm) and ZnSe lenses were attached to an FTIR spectrometer equipped with a deuterated l-alanine doped triglycine sulphate detector (Spectrum GX, Perkin-Elmer Corp, Buckinghamshire, Bacon, UK). Surfaces were pressed against the refractive crystal by a sapphire anvil to achieve firm contact with the diamond crystal, and spectra were recorded under the following conditions: a spectral range of 4000−650 cm−1, a resolution of 4 cm−1, and 20 scans coadded. The depth of analysis was estimated at 1.66 μm at 1000 cm−1.
Statistical Analysis
The assumption of normality was evaluated using the Shapiro-Wilk test, and the homogeneity of variances was assessed using Levene’s test. Based on the results of these preliminary tests, one-way ANOVA and Welch’s robust test of equality of means were performed separately for each polishing procedure to compare the means among all four independent material groups. Post hoc pairwise comparisons were performed using the Bonferroni correction when equal variances were assumed, and the Games–Howell correction when variances were unequal, to identify statistically significant differences between groups. A multiple linear regression analysis was conducted to determine which roughness parameters significantly affected wettability. An independent samples t-test was performed to assess differences in surface characteristics between metallographically polished and manually polished specimens within the same material group (Student’s t-test when equal variances were assumed and Welch’s t-test when violation of the equality of variances occurred). A generalized linear model (GLM) was applied to the surface characteristics. Each surface parameter was analyzed separately as a dependent variable. The model included main effects of material and polishing procedures, as well as their interaction, treated as fixed factors. Since the data followed a normal distribution but violated the assumption of homogeneity of variances, a normal distribution with an identity link function was used. Statistical significance was set at a=0.05. Statistical analysis was performed using IBM SPSS Statistics software version 29.0 (IBM Corp, Armonk, New York, USA).
The study design is described in detail in Figure 1.
3. Results
3.1. Surface Roughness Evaluation
Representative 3D profilometric images and optical microscope images (50× magnification, reflection mode) of the materials following the respective polishing procedures are presented in Figure 2 and Figure 3, respectively. Based on the 3D profilometric images, metallographic polishing yielded more uniform surface topographies for most materials, as indicated by a lower amplitude range. In the optical microscope images, the metallographically polished specimens exhibited more homogeneous, smooth, and scratch-free surfaces compared to those subjected to manual polishing. The latter displayed strong evidence of polishing tracks and surface defects, associated with the polishing methodology used for the majority of the materials.
Table 3 presents the detailed results for all evaluated surface roughness parameters.
Among the manually polished materials, statistically significant differences in surface roughness parameters were observed. The ranking of the statistically significant differences was as follows: FK > VE, TQ > SH for Sa, Sz, Sdr and Sv; SH, VE, TQ > FK for Sds, and FK > VE, TQ > SH for Sc. Overall, the CAD/CAM materials outperformed the conventional composite resin, with SH exhibiting the most favorable surface roughness characteristics across all parameters, except for Sds.
All evaluated surface roughness parameters showed statistically significant differences among the metallographically polished materials. Specifically, for the amplitude parameter Sa, FK, SH and TQ exhibited significantly higher mean values than VE, whereas TQ showed no significant difference from FK but differed significantly from SH. Regarding the amplitude parameter Sz, FK and VE demonstrated significantly greater values compared to SH. The mean Sz values of TQ were not significantly different from either FK or VE or from SH. The ranking of the statistically significant differences concerning Sdr was as follows: FK > SH, while VE and TQ showed no significant differences from either group. For Sds, the ranking was SH, TQ, HC > FK, suggesting that all CAD/CAM materials exhibited significantly higher mean Sds values compared to the control group. The statistically significant rankings for Sc are: FK > TQ > VE and SH > VE, while SH showed no significant differences from both FK and TQ. Lastly, SH demonstrated the highest mean Sv values compared to both direct and indirect restorative materials (SH > VE, FK, TQ). Among all materials, VE achieved the lowest values for Sa, Sdr, Sc, and Sv, indicating superior surface smoothness and reduced functional roughness. However, it exhibited relatively high values in Sz and Sds, reflecting a greater peak-to-valley height and spatial density.
Comparisons between manually and metallographically polished specimens were performed and statistically significant differences between the polishing procedures within each material group were revealed. Specifically, VE, TQ and FK exhibited significantly higher mean values for Sa, Sz, Sdr, Sc and Sv surface parameters following manual polishing compared to optimal metallographic grinding. In contrast, SH did not exhibit significant differences between the two polishing methods concerning these parameters. Regarding Sds, insignificant differences were displayed for FK and VE, whereas SH and TQ exhibited significantly higher values following metallographic polishing.
Figure 4 illustrates the differences in surface roughness parameters between manual and metallographic polishing within each material.
3.2. Surface Wettability
Representative wettability images of the tested surfaces are illustrated in Figure 5. The ranking of statistically significant differences after manual polishing was VE > TQ > SH > FK, whereas after metallographic polishing, the order changed to TQ > FK > SH > VE. All mean values within each material between the two polishing conditions differed significantly, with manually polished specimens exhibiting greater contact angle measurements. CAD/CAM materials demonstrated significantly higher contact angles compared to the conventional composite resin following manual polishing. All in all, both polishing procedures presented contact angles below 90°, indicating a hydrophilic surface character for all the tested materials. Detailed water contact angle results are shown in Table 4.
Figure 6 illustrates the differences in contact angle measurements between manual and metallographic polishing within each material.
3.3. Interaction Between Surface Roughness Parameters and Surface Wettability
A multiple linear regression analysis was conducted to evaluate the influence of surface texture parameters on contact angle measurements for both manually and laboratory polished materials. The model significantly predicts wettability (F(6, 89) = 13.799, p<0.001), confirming that at least one of the examined surface roughness parameters contributes to explaining the variations in contact angle values. The model demonstrates a moderate effect size, accounting for 48.2% of the variance in wettability (R² = 0.482, p < 0.001). Among the tested surface parameters, only Sdr was a statistically significant predictor (B= –9.99, p < 0.001), indicating that increased Sdr is associated with decreased contact angles and thereby greater hydrophilicity. More precisely, for every unit increase in Sdr the contact angle is decreased by almost 10⁰. However, due to intercorrelations among the roughness parameters, this estimate should be interpreted with caution.
3.4. Development of a Generalized Linear Model (GLM) to Assess the Effect of Material Type and Polishing Procedure on the Measured Surface Characteristics
The fundamental principle of the model is that material type significantly influences all surface characteristics. Additionally, the polishing procedure had a significant impact on surface characteristics, and the effect of polishing on these characteristics depended on the material used.
Based on the generalized linear model which used the manually polished FK as the reference, all three CAD/CAM materials (SH, VE and TQ) showed a significant decrease in Sa, Sz, Sdr, Sc and Sv surface roughness parameters relative to the reference group (p < 0.001). Metallographic polishing resulted in a significant decrease on the mean values of those parameters and the effect of polishing on these parameters depended on the material type (p < 0.001). The reduction effect of the metallographic polishing was mitigated depending on the material type with a greater moderation presented for the SH material (p < 0.001). Regarding the Sds parameter, SH, VE and TQ showed a significant increase in Sds compared to the control group (p < 0.001). The increase of Sds after metallographic polishing was not statistically significant compared to manual polishing (p > 0.05). The effect of polishing on Sds depended on the material type for SH (p < 0.05) and TQ (p < 0.01), but not for VE (p > 0.05). Lastly, regarding water contact angles all CAD/CAM materials (SH, VE and TQ) exhibited a significant increase in contact angles relative to the reference group (p < 0.001). Metallographic polishing resulted in a significant decrease in contact angles (p < 0.001), and the effect of polishing on water contact angles depended on the material type (p < 0.001). A detailed Table with the results of the GLM is provided as Table S1 in the supplementary material section.
3.5. ATR-FTIR Analysis
ATR-FTIR spectra of all investigated materials before manual and metallographic polishing—intact composite resin slabs, milled CAD/CAM blocks, and 3D-printed specimens—along with the corresponding characteristic peak assignments, are illustrated in Figure 7. The spectra of VE and SH are free of aromatic compounds and are based on aliphatic urethane monomers, as observed by the resolved N–H peaks. VE demonstrated the lowest relative intensity of the organic phase peaks. In contrast, TQ and FK exhibited characteristic peaks attributed to aromatic vibrations.
Expanded spectra in the 2000-650 cm-1 range for the reference, unpolished specimens as well as for both manually and metallographically polished materials within each material group are depicted in Figure 8. A slight reduction in the relative intensity of the organic phase peaks—mainly the C=O peak at 1725 cm-1—compared to the greater Si-O peak of the inorganic phase at approximately 1100 cm-1 was observed in SH and VE specimens after polishing. A similar pattern was observed in FK, with metallographic polishing resulting in a significant reduction in the relative intensity of the organic C=O peak. In contrast, polishing of TQ resulted in an increase of the C=O peak at 1725 cm-1 compared to the complex peak of the inorganic phase at approximately 1100 cm-1, which demonstrated two well-defined shoulders at higher frequency.
4. Discussion
This in vitro study revealed statistically significant differences in surface roughness and surface wettability among all tested restorative materials, both across different materials and between the two polishing procedures. The results highlight the critical role of material type, polishing procedure, and their interaction on the surface characteristics. Therefore, the two null hypotheses should be rejected.
The inclusion of a conventional composite resin as the control group corresponds to a logical and clinically relevant choice, which aligns with previous in vitro studies assessing the surface characteristics of novel resin-based CAD/CAM materials [35,36,37,38]. To the best of our knowledge, this in vitro study is among the first to directly compare the surfaces of CAD/CAM restorative materials, both manually and metallographically polished, intended for definitive restorations. Most studies exclusively concentrated on either manual [8,37,39,40,41,42,43,44,45,46,47,48,49,50,51,52,53,54,55,56] or metallographic polishing techniques [35,36,57,58,59,60,61,62,63,64,65]. This innovative methodological approach allows for the evaluation of the effectiveness of clinical polishing procedures in achieving optimal surface outcomes [66].
The surface texture of restorative materials plays a critical role in clinically relevant characteristics, including color stability, surface gloss, and degradation of the final restoration [67]. Additionally, the significant impact of both surface roughness and surface wettability on plaque accumulation—and, consequently, on periodontal inflammation and secondary caries—has been well-documented [24,25,26,27]. Evaluating multiple 3D surface parameters, rather than relying solely on the amplitude parameters Ra and Sa may provide a more comprehensive understanding on the characterization of the material’s unique surface topography [68,69,70]. Specifically, in the context of clinical dentistry, the Sdr, Sds, Sc, and Sv parameters may be related to a material’s potential for surface friction, gloss, fluid, and bacterial retention [34]. The significant effect of additional surface parameters is further emphasized by the fact that although Ra values above 0.2 μm, are generally associated with increased bacterial attachment [10,49,71,72], exceptions to this trend have been reported [37,48,52,53].
All CAD/CAM restorative materials outperformed the direct composite resin in terms of surface roughness following manual polishing. Their industrial manufacturing process may partially explain this result; the polymerization of indirect restorative materials is carried out under high-heat and high-pressure techniques, or, in the case of additive manufacturing via vat polymerization. These methods result in more homogeneously polymerized structures with fewer irregularities [73,74,75,76]. Consequently, these more uniform surfaces may be associated with reduced discoloration, less plaque accumulation, and higher wear resistance, contributing to clinically desirable outcomes [24,25,26,27,67]. Contrarily, the incremental placement and intraoral light curing of direct resin composites may result in porosities and increased levels of unreacted monomers, compromising their clinical performance [77].
Shofu HC exhibited the most favorable surface roughness characteristics following manual polishing. This may be partially explained by its filler content, reported at 61% by weight and 72% by volume [31,78], and the hardness of its filler particles—silica powder and zirconium silicate—both of which are rated 7 to 7.5 on the Mohs hardness scale [79]. The coordinated abrasion of the relatively soft fillers and the surrounding organic matrix may result in a more homogenous and smooth surface with fewer defects. Notably, no significant differences were observed between manual and metallographic polishing for SH across most roughness parameters, suggesting that the manufacturer's recommended polishing protocol is effective in achieving a clinically sufficient surface finish. This is clinically significant, as it indicates predictable and reproducible outcomes without the need for extensive chairside adjustment.
VarseoSmile TriniQ, the 3D-printed material, showed acceptable roughness values, particularly after metallographic polishing. Although limited data concerning its composition is available [80,81], the current results suggest that it can achieve a surface quality comparable to that of milled CAD/CAM materials, highlighting its potential as a restorative material for definitive restorations. However, its increased organic content and distinct filler heterogeneity, validated by the presence of aromatic compounds and a complex peak of the inorganic phase at approximately 1100 cm-1, may affect its long-term performance. Therefore, further research is needed to verify its long-term durability and clinical performance.
Vita Enamic features a three-dimensional ceramic scaffold that allows for the interaction of filler particles. This bridging phenomenon along with the irregularly shaped ceramic fillers with sizes up to 10μm have been scientifically documented [38,82]. Its inorganic filler content displays distinct hardness values, with aluminum oxide particles rated at 9 and silicon dioxide at 7 on the Mohs scale [79]. Additionally, VE exhibited the lowest relative intensity of organic phase peaks in the ATR-FTIR spectra. These microstructural characteristics can explain the substantial disparity between Sa and Sz values of VE observed after metallographic grinding. This finding suggests that although Vita Enamic can generally produce a very smooth surface, as indicated by low Sa values, intermittently distributed surface irregularities—possibly due to isolated scratches on the hard fillers or greater abrasion of the diffused organic content—may persist. Under clinical conditions, such localized imperfections could contribute to plaque retention or surface degradation over time, despite a generally smooth surface profile. Finally, the significantly increased Sa, Sz, Sdr, Sc, and Sv roughness parameters of Vita Enamic compared to Shofu HC after manual polishing may be attributed to its inherent microstructural characteristics and the interaction with the specific polishers used.
It is therefore understood that in addition to the material’s unique composition, the surface roughness of restorative materials is significantly influenced by the applied polishing systems [27,40,53,56,66,83,84,85,86]. The abrasive particles should exhibit hardness equal to or greater than that of the inorganic filler content of the resin-based materials [87]. Along with hardness, the size of the abrasive grains and the polisher’s design and shape are key factors that modify the material’s surface microstructure [66,83,85,88]. Uniform polishing presents challenges for the dental practitioner due to disparities in the hardness of the organic matrix and the inorganic fillers, which compromise the homogeneous abrasion of both phases [56,89]. The duration and applied pressure during polishing are additional influential factors affecting surface roughness [43,90]. This is further supported by our observation that manual polishing resulted in high standard deviations across all investigated surface parameters. Comparing polishing protocols within each material, all groups—except SH—demonstrated significant reductions in roughness following metallographic grinding. This suggests that the manufacturer-recommended polishing system for the milled, resin-based CAD/CAM material Shofu HC is efficient in achieving an initially optimal surface quality in clinical settings. For the remaining material groups, greater efforts should be made to develop clinically relevant polishing systems that effectively optimize surface texture.
Although direct comparisons to previously published data should be interpreted with caution, since different material combinations, polishing procedures and surface roughness parameters were taken into account, multiple studies support the outcomes observed in this in vitro study. Specifically, the increased roughness values of the hybrid ceramic material VE compared to milled CAD/CAM materials with dispersed fillers have been confirmed by several other studies [37,38,40,45]. However, divergent results are evident in the current literature. One study demonstrated inferior surface characteristics of Vita Enamic, even compared to two direct composite resins [37]. At the same time, another found no statistically significant differences between milled CAD/CAM materials and a conventional composite resin [36]. Both observations contrast with the findings of our study. Additionally, one study exhibited no differences in surface roughness when comparing several milled CAD/CAM restorative materials [48]. One study reported lower surface roughness for 3D-printed restoratives compared to hybrid ceramics [45], whereas another found no significant differences between milled and 3D-printed CAD/CAM materials [44]. Studies evaluating solely 3D-printed materials reported Ra values above the threshold of 0.2 μm [61,65]. A recent study reported baseline Ra values for VarseoSmile TriniQ up to 0.07μm aligning with the findings of this study [46]. In this study, VarseoSmile TriniQ showed comparable surface quality to SH and VE following optimal metallographic polishing, supporting its potential as a viable option for definitive restorations. Such discrepancies can be further interpreted through methodological factors, including specimen preparation techniques (e.g., milled versus low-speed precision cutting) and the surface measurement devices used (e.g., linear, contact versus 3D non-contact interferometric profilers, or atomic force microscopy). Additional factors contributing to discrepancies include the polishing procedures applied (e.g., chairside polishing versus glazing, or metallographic grinding), the storage media (e.g., dry storage versus storage in distilled water), and 3D-printing parameters such as layer thickness and model orientation.
While some concordance with prior data exists, the present study offers more detailed insights by employing a multi-parametric surface roughness analysis, which directly combines clinically relevant and laboratory polishing protocols. These elements reinforce the applicability of our findings to real-world restorative dentistry.
According to the literature, besides surface roughness, other factors such as surface topography, surface wettability, surface charge, surface chemical composition, and surface free energy demonstrate a decisive role in microbial cell attachment on dental materials [91,92,93,94]. It is well-documented that bacteria tend to adhere more readily to surfaces that are slightly hydrophobic or hydrophilic [93].
Manual polishing resulted in higher contact angles compared to metallographic grinding for all materials, indicating increased surface irregularities that may trap air and reduce wettability—consistent with the Cassie-Baxter wetting model [95]. In contrast, surfaces polished under laboratory conditions likely follow the Wenzel regime, promoting better water spreading and reduced contact angles [96]. This phenomenon is within expectations, as it is related to the reduced micro-irregularities and the alteration of surface chemistry that occur following fine grinding.
Given that all manually polished surfaces exhibit contact angles below 90⁰, they can be characterized as moderately hydrophilic. In that context, the potential for bacterial attachment increases to varying degrees, depending on the material’s intrinsic characteristics [97]. Statistically significant differences in surface wettability among manually polished CAD/CAM materials suggest variations in both surface chemistry and their surface microstructure induced by the manufacturer’s recommended polishing protocols. Interestingly, this study revealed a significant inverse correlation between Sdr and contact angles, confirming that smoother and less complex surfaces enhance wettability. Under clinically relevant conditions, moderate hydrophilicity can promote the adsorption of salivary proteins, thereby facilitating microbial attachment. Concurrently, improving surface smoothness may not only enhance aesthetics, but also reduce plaque accumulation, thereby confining the risk of secondary caries.
There is limited evidence regarding water contact angles for resin-based CAD/CAM restorative materials in the current literature. In alignment with the findings of this study, a recent investigation reported water contact angles of approximately 80 ° for all investigated CAD/CAM restoratives—whether subtractively or additively manufactured—after manual polishing using abrasive aluminum oxide-coated discs [53]. Wang et al in 2025, analyzing contact angles on different 3D-printed restorative materials, reported a broader range of water contact angles from 69.1° to 129.5°, attributing the variability to differences in their material composition [65].
Regarding any in vitro study, several limitations should be acknowledged. Firstly, despite efforts to standardize the manual polishing procedure—using a single operator and new consumables per specimen—variations in force and motion have posed challenges. This reflects the real-time clinical conditions, but could have been controlled using a fixed polishing apparatus. Secondarily, although specimen fabrication was intended to replicate clinical workflows, the use of a low-speed precision cutting machine instead of milling units may have influenced surface topography. Additionally, surface roughness was evaluated immediately after polishing, but not after clinically relevant laboratory conditions, such as thermal cycling and wear simulation. In that manner, long-term changes in surface properties remained unexplored. Furthermore, a SEM-EDS analysis could have provided more robust characterization of the microstructure and filler distribution, particularly for the less-documented 3D-printed material. Finally, the complex conditions of the oral environment were not simulated. Physiological in vivo conditions could have altered surface energetics and bacterial interactions. Despite these limitations, the study design permits meaningful conclusions about the polishability and clinical performance of CAD/CAM restorative materials.
5. Conclusions
Within the limitations of this in vitro study, the following clinically relevant conclusions can be drawn: Subtractive and additive manufactured restorative materials demonstrated significantly lower surface roughness compared to the conventional composite resin following manual polishing. Moreover, the type of material, polishing protocol, and their interaction significantly influence both surface texture and wettability.
Shofu HC exhibited the most consistent and favorable surface characteristics, even after manual polishing, indicating high polishability and clinical reliability. However, manufacturer-recommended polishing procedures for the rest of the materials may not fully replicate the surface quality achieved by optimal metallographic grinding, suggesting the need for developing advanced, and material-specific polishing kits. In addition, all tested materials demonstrated moderate hydrophilicity, with surface roughness playing a key role in plaque accumulation. The 3D-printed materials show promising surface characteristics and may be suitable for definitive restorations. Finally, in vivo studies are essential to validate the in vitro findings under real-time clinical conditions.
Supplementary Materials
The following supporting information can be downloaded at: https://www.mdpi.com/article/doi/s1

Table S1.
Generalized Linear Model analysis for dependent variables Sa, Sz, Sdr, Sds, Sc, Sv and contact angles.
Table S1.
Generalized Linear Model analysis for dependent variables Sa, Sz, Sdr, Sds, Sc, Sv and contact angles.
| Dependent parameter | Predictors | B estimate | Wald χ2 | df | p - value | Interpretation |
|---|---|---|---|---|---|---|
| Sa | Intercept (manually polished FZ) | 163.45 | 2280.35 | 1 | p < 0.001 | SH, VE and TQ show a significant decrease in Sa relative to the reference group Metallographic polishing resulted in a significant decrease in Sa compared to manual polishing The effect of polishing on Sa depended on the material type The reduction effect from metallographic polishing was mitigated depending on the material type, with a greater moderation presented for SH |
|
χ² = 234.37 , df = 7, p < 0.001 material (main effect): Wald χ² = 276.22, p < 0.001 polishing procedure (main effect): Wald χ² = 494.00, p < 0.001 material and polishing procedure (interaction): Wald χ² = 236.71, p < 0.001 | ||||||
| SH | – 102.82 | 451.17 | 1 | p < 0.001 | ||
| VE | –74.73 | 238.36 | 1 | p < 0.001 | ||
| TQ | –59.96 | 153.42 | 1 | p < 0.001 | ||
| metallographic polishing | –106.26 | 481.85 | 1 | p < 0.001 | ||
| metallographically polished SH | +105.31 | 236.67 | 1 | p < 0.001 | ||
| metallographically polished VE | +52.91 | 59.75 | 1 | p < 0.001 | ||
| metallographically polished TQ | +51.62 | 56.86 | 1 | p < 0.001 | ||
| Sz | Intercept (manually polished FZ) | 1896.26 | 1125.72 | 1 | p < 0.001 | SH, VE and TQ show a significant decrease in Sz relative to the reference group Metallographic polishing resulted in a significant decrease in Sz compared to manual polishing The effect of polishing on Sz depended on the material type The reduction effect from metallographic polishing was mitigated depending on the material type, with a greater moderation presented for SH |
|
χ² = 154.35 , df = 7, p < 0.001 material (main effect): Wald χ² = 158.17, p < 0.001 polishing procedure (main effect): Wald χ² = 120.20, p < 0.001 material and polishing procedure (interaction): Wald χ² = 104.84, p < 0.001 | ||||||
| SH | -1241.25 | 241.17 | 1 | p < 0.001 | ||
| VE | -616.14 | 59.42 | 1 | p < 0.001 | ||
| TQ | -852.75 | 113.83 | 1 | p < 0.001 | ||
| metallographic polishing | -1101.21 | 189.82 | 1 | p < 0.001 | ||
| metallographically polished SH | +1114.82 | 97.27 | 1 | p < 0.001 | ||
| metallographically polished VE | +725.65 | 41.21 | 1 | p < 0.001 | ||
| metallographically polished TQ | +811.77 | 51.56 | 1 | p < 0.001 | ||
| Sdr | Intercept (manually polished FZ) | 5.79 | 1504.22 | 1 | p < 0.001 | SH, VE and TQ show a significant decrease in Sdr relative to the reference group Metallographic polishing resulted in a significant decrease in Sdr compared to manual polishing The effect of polishing on Sdr depended on the material type The reduction effect from metallographic polishing was mitigated depending on the material type, with a greater moderation presented for SH |
|
χ² = 233.65 , df = 7, p < 0.001 material (main effect): Wald χ² = 419.05, p < 0.001 polishing procedure (main effect): Wald χ² = 262.81, p < 0.001 material and polishing procedure (interaction): Wald χ² = 316.84, p < 0.001 | ||||||
| SH | -5.37 | 648.09 | 1 | p < 0.001 | ||
| VE | -3.98 | 356.63 | 1 | p < 0.001 | ||
| TQ | -4.10 | 378.30 | 1 | p < 0.001 | ||
| metallographic polishing | -4.87 | 533.62 | 1 | p < 0.001 | ||
| metallographically polished SH | +4.93 | 272.44 | 1 | p < 0.001 | ||
| metallographically polished VE | +3.79 | 161.55 | 1 | p < 0.001 | ||
| metallographically polished TQ | +3.94 | 174.10 | 1 | p < 0.001 | ||
| Sds | Intercept (manually polished FZ) | 18568.53 | 600.47 | 1 | p < 0.001 | SH, VE and TQ show a significant increase in Sds relative to the reference group No statistically significant increase in Sds for metallographic polishing compared to manual polishing The effect of polishing on Sds depended on the material type for SH and TQ, but not for VE |
|
χ² = 71.61 , df = 7, p < 0.001 material (main effect): Wald χ² = 79.13, p < 0.001 polishing procedure (main effect): Wald χ² = 15.72, p < 0.001 material and polishing procedure (interaction): Wald χ² = 11.56, p < 0.01 | ||||||
| SH | +4779.69 | 19.90 | 1 | p < 0.001 | ||
| VE | +3952.56 | 13.60 | 1 | p < 0.01 | ||
| TQ | +2757.03 | 6.62 | 1 | p < 0.001 | ||
| metallographic polishing | +229.06 | 0.05 | 1 | p > 0.05 | ||
| metallographically polished SH | +3463.54 | 5.22 | 1 | p < 0.05 | ||
| metallographically polished VE | +164.46 | 0.01 | 1 | p > 0.05 | ||
| metallographically polished TQ | +3952.42 | 6.80 | 1 | p < 0.01 | ||
| Sc | Intercept (manually polished FZ) | 251.83 | 1739.39 | 1 | p < 0.001 | SH, VE and TQ show a significant decrease in Sc relative to the reference group Metallographic polishing resulted in a significant decrease in Sc compared to manual polishing The effect of polishing on Sc depended on the material type The reduction effect from metallographic polishing was mitigated depending on the material type, with a greater moderation presented for SH |
|
χ² = 217.42 , df = 7, p < 0.001 material (main effect): Wald χ² = 299.50, p < 0.001 polishing procedure (main effect): Wald χ² = 354.91, p < 0.001 material and polishing procedure (interaction): Wald χ² = 173.98, p < 0.01 | ||||||
| SH | -165.17 | 374.10 | 1 | p < 0.001 | ||
| VE | -141.00 | 272.63 | 1 | p < 0.001 | ||
| TQ | -107.25 | 157.74 | 1 | p < 0.001 | ||
| metallographic polishing | -164.92 | 372.67 | 1 | p < 0.001 | ||
| metallographically polished SH | +158.42 | 172.07 | 1 | p < 0.001 | ||
| metallographically polished VE | +93.50 | 59.94 | 1 | p < 0.001 | ||
| metallographically polished TQ | +86.00 | 50.71 | 1 | p < 0.001 | ||
| Sv | Intercept (manually polished FZ) | 22.92 | 1104.36 | 1 | p < 0.001 | SH, VE and TQ show a significant decrease in Sv relative to the reference group Metallographic polishing resulted in a significant decrease in Sv compared to manual polishing The effect of polishing on Sv depended on the material type The reduction effect from metallographic polishing was mitigated depending on the material type, with a greater moderation presented for SH |
|
χ² = 163.74 , df = 7, p < 0.001 material (main effect): Wald χ² = 62.47, p < 0.001 polishing procedure (main effect): Wald χ² = 247.34, p < 0.001 material and polishing procedure (interaction): Wald χ² = 122.68, p < 0.01 | ||||||
| SH | -12.92 | 175.42 | 1 | p < 0.001 | ||
| VE | -5.08 | 27.17 | 1 | p < 0.001 | ||
| TQ | -5.75 | 34.76 | 1 | p < 0.001 | ||
| metallographic polishing | -14.08 | 208.54 | 1 | p < 0.001 | ||
| metallographically polished SH | +14.97 | 117.76 | 1 | p < 0.001 | ||
| metallographically polished VE | +5.11 | 13.72 | 1 | p < 0.001 | ||
| metallographically polished TQ | +5.58 | 16.39 | 1 | p < 0.001 | ||
| Water contact angles | Intercept (manually polished FZ) | 69.51 | 21428.78 | 1 | p < 0.001 | SH, VE and TQ show a significant increase in contact angles relative to the reference group Metallographic polishing resulted in a significant decrease in contact angles compared to manual polishing The effect of polishing on contact angles depended on the material type |
|
χ² = 401.25 , df = 7, p < 0.001 material (main effect): Wald χ² = 635.56, p < 0.001 polishing procedure (main effect): Wald χ² = 4648.74, p < 0.001 material and polishing procedure (interaction): Wald χ² = 892.91, p < 0.01 | ||||||
| SH | +6.24 | 86.42 | 1 | p < 0.001 | ||
| VE | +16.82 | 627.00 | 1 | p < 0.001 | ||
| TQ | +9.57 | 203.06 | 1 | p < 0.001 | ||
| metallographic polishing | -16.86 | 630.05 | 1 | p < 0.001 | ||
| metallographically polished SH | -5.88 | 38.35 | 1 | p < 0.001 | ||
| metallographically polished VE | -22.31 | 551.67 | 1 | p < 0.001 | ||
| metallographically polished TQ | +4.04 | 18.08 | 1 | p < 0.001 |
Author Contributions
Conceptualization, K.T. and E.P.; methodology, K.T. and M.D.; software, K.T. and M.D.; validation, M.D., C.R. and E.P.; formal analysis, K.T.; investigation, K.T.; resources, K.T. and E.P.; data curation, K.T. and C.R.; writing—original draft preparation, K.T.; writing—review and editing, M.D., C.R. and E.P; visualization, K.T.; supervision, E.P.; project administration, C.R. and E.P.; funding acquisition, K.T. and E.P. All authors have read and agreed to the published version of the manuscript.
Funding
This research was partially funded by the Hellenic Academy of Clinical Dentistry, the Hellenic Dental Association, and the Dental Association of Attica.
Institutional Review Board Statement
Not applicable
Informed Consent Statement
Not applicable.
Data Availability Statement
The raw data supporting the conclusions of this article will be made available by the authors on request.
Acknowledgments
The authors would like to acknowledge the invaluable support provided by the Department of Biomaterials, School of Dentistry, National and Kapodistrian University of Athens. Special thanks are extended to Professor George Eliades for providing access to the necessary equipment for the completion of this in vitro study. The authors also express their gratitude to Mr. Petros Tsakiridis for his valuable technical support and continuous assistance throughout the research process.
Conflicts of Interest
The authors declare no conflicts of interest.
Abbreviations
The following abbreviations are used in this manuscript:
| CAD/CAM | Computer Aided Design/Computer Aided Manufacturing |
| FK | Filtek Z550 |
| VE | Vita Enamic |
| SH | Shofu HC |
| TQ | VarseoSmile TriniQ |
| SM | Subtractive manufacturing |
| AM | Additive manufacturing |
| PICN | Polymer Infiltrated Ceramic Network |
| 3D | Three-dimensional |
| SLA | Stereolithography |
| DLP | digital light processing |
| LCD | liquid crystal display |
| BisGMA | Bisphenol glycidyl dimethacrylate |
| BisEMA | Bishenol ethylene glycol diether dimethacrylate |
| TEGDMA | Triethyleneglycol dimethacrylate |
| PEGDMA | Polyethylene glycol dimethacrylate |
| UDMA | Urethane dimethacrylate |
| SiC | Silicon Carbide |
| RH | Relative humidity |
| ATR-FTIR | Attenuated Total Reflectance – Fourier Transformed Infrared Spectroscopy |
| GLM | Generalized linear model |
| SD | Standard Deviation |
| SEM-EDS | Scanning Electron Microscopy- Energy dispersive spectroscopy |
| Micro-CT | Micro-computed Tomography |
References
- Bhargav, A.; Sanjairaj, V.; Rosa, W.; Feng, LW.; Fuh Yh, J. Applications of additive manufacturing in dentistry: A review. J Biomed Mater Res B Appl Biomater. 2018, 106, 2058–2064. [Google Scholar] [CrossRef]
- Sulaiman, T.A. Materials in digital dentistry-A review. J Esthet Restor Dent. 2020, 32, 171–181. [Google Scholar] [CrossRef]
- Tiu, J.; Belli, R.; Lohbauer, U. Contemporary CAD/CAM Materials in Dentistry. Curr. Oral Health Rep. 2019, 6, 250–256. [Google Scholar] [CrossRef]
- Lambert, H.; Durand, J.C.; Jacquot, B.; Fages, M. Dental biomaterials for chairside CAD/CAM: State of the art. J. Adv. Prosthodont. 2017, 9, 486–495. [Google Scholar] [CrossRef]
- Mainjot, A.K.; Dupont, N.M.; Oudkerk, J.C.; Dewael, T.Y.; Sadoun, M.J. From Artisanal to CAD-CAM Blocks: State of the Art of Indirect Composites. J. Dent. Res. 2016, 95, 487–495. [Google Scholar] [CrossRef]
- Rexhepi, I.; Santilli, M.; D’Addazio, G.; Tafuri, G.; Manciocchi, E.; Caputi, S.; Sinjari, B. Clinical Applications and Mechanical Properties of CAD-CAM Materials in Restorative and Prosthetic Dentistry: A Systematic Review. J. Funct. Biomater. 2023, 14, 431. [Google Scholar] [CrossRef] [PubMed]
- Ruse, N.D.; Sadoun, M.J. Resin-composite blocks for dental CAD/CAM applications. J. Dent. Res. 2014, 93, 1232–1234. [Google Scholar] [CrossRef] [PubMed]
- Papathanasiou, I.; Kamposiora, P.; Dimitriadis, K.; Papavasiliou, G.; Zinelis, S. In vitro evaluation of CAD/CAM composite materials. J. Dent. 2023, 136, 104623. [Google Scholar] [CrossRef]
- Palacios, T.; Tarancón, S.; Pastor, J.Y. On the Mechanical Properties of Hybrid Dental Materials for CAD/CAM Restorations. Polymers 2022, 14, 3252. [Google Scholar] [CrossRef] [PubMed]
- Hamerschmitt, R.M.; Tomazinho, P.H.; Camporês, K.L.; Gonzaga, C.C.; da Cunha, L.F.; Correr, G.M. Surface topography and bacterial adhesion of CAD/CAM resin based materials after application of different surface finishing techniques. Braz. J. Oral Sci. 2018, 17, e18135. [Google Scholar] [CrossRef]
- Dirxen, C.; Blunck, U.; Preissner, S. Clinical performance of a new biomimetic double network material. Open Dent. J. 2013, 7, 118–122. [Google Scholar] [CrossRef]
- Ceylan, G.; Emir, F.; Doğdu, C.; Demirel, M.; Özcan, M. Effect of repeated millings on the surface integrity of diamond burs and roughness of different CAD/CAM materials. Clin Oral Investig. 2022, 26, 5325–5337. [Google Scholar] [CrossRef]
- Mandurino, M.; Cortili, S.; Coccoluto, L.; Greco, K.; Cantatore, G.; Gherlone, E.F.; Vichi, A.; Paolone, G. Mechanical Properties of 3D Printed vs. Subtractively Manufactured Composite Resins for Permanent Restorations: A Systematic Review. Materials 2025, 18, 985. [Google Scholar] [CrossRef]
- Kessler, A.; Hickel, R.; Reymus, M. 3D Printing in Dentistry-State of the Art. Oper. Dent. 2020, 45, 30–40. [Google Scholar] [CrossRef] [PubMed]
- Caussin, E.; Moussally, C.; Le Goff, S.; Fasham, T.; Troizier-Cheyne, M.; Tapie, L.; Dursun, E.; Attal, J.-P.; François, P. Vat Photopolymerization 3D Printing in Dentistry: A Comprehensive Review of Actual Popular Technologies. Materials 2024, 17, 950. [Google Scholar] [CrossRef] [PubMed]
- Della Bona, A.; Cantelli, V.; Britto, V.T.; Collares, K.F.; Stansbury, J.W. 3D printing restorative materials using a stereolithographic technique: a systematic review. Dent Mater. 2021, 37, 336–350. [Google Scholar] [CrossRef]
- Lee, W.S.; Lee, D.H.; Lee, K.B. Evaluation of internal ft of interim crown fabricated with CAD/CAM milling and 3D printing system. J Adv Prosthodont. 2017, 9, 265–70. [Google Scholar] [CrossRef] [PubMed]
- Aktaş, N.; Bal, C.; İnal, C.B.; Kaynak Öztürk, E.; Bankoğlu Güngör, M. Evaluation of the Fit of Additively and Subtractively Produced Resin-Based Crowns for Primary Teeth Using a Triple-Scan Protocol. Appl. Sci. 2025, 15, 178. [Google Scholar] [CrossRef]
- Raposo, L.H.; Borella, P.S.; Ferraz, D.C.; Pereira, L.M.; Prudente, M.S.; Santos-Filho, P.C. Influence of computer-aided design/computer-aided manufacturing diamond bur wear on marginal misfit of two lithium disilicate ceramic systems. Oper Dent. 2020, 45, 416–425. [Google Scholar] [CrossRef]
- Temizci, T.; Bozoğulları, H.N. Effect of thermocycling on the mechanical properties of permanent composite-based CAD-CAM restorative materials produced by additive and subtractive manufacturing techniques. BMC Oral Health. 2024, 24, 334. [Google Scholar] [CrossRef]
- Tian, Y.; Chen, C.; Xu, X.; Wang, J.; Hou, X.; Li, K.; Lu, X.; Shi, H.; Lee, E.S.; Jiang, H.B. A Review of 3D Printing in Dentistry: Technologies, Affecting Factors, and Applications. Scanning. 2021, 2021, 9950131. [Google Scholar] [CrossRef]
- Balestra, D.; Lowther, M.; Goracci, C.; Mandurino, M.; Cortili, S.; Paolone, G.; Louca, C.; Vichi, A. 3D Printed Materials for Permanent Restorations in Indirect Restorative and Prosthetic Dentistry: A Critical Review of the Literature. Materials 2024, 17, 1380. [Google Scholar] [CrossRef]
- Tzimas, K.; Rahiotis, C.; Pappa, E. Biofilm Formation on Hybrid, Resin-Based CAD/CAM Materials for Indirect Restorations: A Comprehensive Review. Materials 2024, 17, 1474. [Google Scholar] [CrossRef] [PubMed]
- Song, F.; Koo, H.; Ren, D. Effects of material properties on bacterial adhesion and biofilm formation. J Dent Res. 2015, 94, 1027–1034. [Google Scholar] [CrossRef] [PubMed]
- Engel, A.S.; Kranz, H.T.; Schneider, M.; Tietze, J.P.; Piwowarcyk, A.; Kuzius, T.; Arnold, W.; Naumova, E.A. Biofilm formation on different dental restorative materials in the oral cavity. BMC Oral Health 2020, 20, 162. [Google Scholar] [CrossRef]
- Cazzaniga, G.; Ottobelli, M.; Ionescu, A.; Garcia-Godoy, F.; Brambilla, E. Surface properties of resin-based composite materials and biofilm formation: A review of the current literature. Am. J. Dent. 2015, 28, 311–320. [Google Scholar] [PubMed]
- Dutra, D.; Pereira, G.; Kantorski, K.Z.; Valandro, L.F.; Zanatta, F.B. Does Finishing and Polishing of Restorative Materials Affect Bacterial Adhesion and Biofilm Formation? A Systematic Review. Oper. Dent. 2018, 43, 37–52. [Google Scholar] [CrossRef]
- Lu, H.; Roeder, L.B.; Lei, L.; Powers, J.M. Effect of Surface Roughness on Stain Resistance of Dental Resin Composites. J. Esthet. Restor. Dent. 2005, 17, 102–108. [Google Scholar] [CrossRef]
- Hajdu, A.I.; Dumitrescu, R.; Balean, O.; Lalescu, D.V.; Buzatu, B.L.R.; Bolchis, V.; Floare, L.; Utu, D.; Jumanca, D.; Galuscan, A. Enhancing Esthetics in Direct Dental Resin Composite: Investigating Surface Roughness and Color Stability. J. Funct. Biomater. 2024, 15, 208. [Google Scholar] [CrossRef]
- 3M Filtek Z550 Nano Hybrid Universal Restorative Part 1. File Name: 34-8727-0746-7-A_Filtek Z550 Nano Hybrid Univesal Restorative_Part 1_CEE.pdf. Available online: https://eifu.solventum.com/ (accessed on 27 July 2025).
- SHOFU Block & Disk HC: Instructions for Use. Available online: https://www.shofu.com/wp-content/uploads/SHOFU-Block-HC-IFU-US.pdf (accessed on 2 March 2024).
- Vita Enamic®. Technical and Scientific Documentation. Available online: https://www.vita-zahnfabrik.com/en/VITA-ENAMIC-24970.html (accessed on 3 March 2024).
- VarseoSmile TriniQ Instruction for Use. Available online: https://www.bego.com/media-library/downloadcenter/ (accessed on 27 July 2025).
- Cohen, D.K. Glossary of Surface Texture Parameters; Michigan Metrology LLC.: Livonra, MI, USA, 2023. [Google Scholar]
- Bataweel, O.O.; Roulet, J.F.; Rocha, M.G.; Zoidis, P.; Pereira, P.; Delgado, A.J. Effect of Simulated Tooth Brushing on Surface Roughness, Gloss, and Color Stability of Milled and Printed Permanent Restorative Materials. J Esthet Restor Dent. 2025, 37, 1773–1783. [Google Scholar] [CrossRef]
- Ionescu, A.C.; Hahnel, S.; König, A.; Brambilla, E. Resin composite blocks for dental CAD/CAM applications reduce biofilm formation in vitro. Dent. Mater. 2020, 36, 603–616. [Google Scholar] [CrossRef]
- Contreras-Guerrero, P.; Ortiz-Magdaleno, M.; Urcuyo-Alvarado, M.S.; Cepeda-Bravo, J.A.; Leyva-Del Rio, D.; Pérez-López, J.E.; Romo-Ramírez, G.F.; Sánchez-Vargas, L.O. Effect of dental restorative materials surface roughness on the in vitro biofilm formation of Streptococcus mutans biofilm. Am. J. Dent. 2020, 33, 59–63. [Google Scholar] [PubMed]
- Prause, E.; Hey, J.; Beuer, F.; Yassine, J.; Hesse, B.; Weitkamp, T.; Gerber, J.; Schmidt, F. Microstructural investigation of hybrid CAD/CAM restorative dental materials by micro-CT and SEM. Dent Mater. 2024, 40, 930–940. [Google Scholar] [CrossRef]
- Albani, R.; Habib, S.R.; AlQahtani, A.; AlHelal, A.A.; Alrabiah, M.; Anwar, S. The Surface Roughness of Contemporary Indirect CAD/CAM Restorative Materials That Are Glazed and Chair-Side-Finished/Polished. Materials 2024, 17, 997. [Google Scholar] [CrossRef]
- Alhassan, M.; Maawadh, A.; Labban, N.; Alnafaiy, S.M.; Alotaibi, H.N.; BinMahfooz, A.M. Effect of Different Surface Treatments on the Surface Roughness and Gloss of Resin-Modified CAD/CAM Ceramics. Appl. Sci. 2022, 12, 11972. [Google Scholar] [CrossRef]
- Fasbinder, D.J.; Neiva, G.F. Surface Evaluation of Polishing Techniques for New Resilient CAD/CAM Restorative Materials. J Esthet Restor Dent. 2016, 28, 56–66. [Google Scholar] [CrossRef] [PubMed]
- Matzinger, M.; Hahnel, S.; Preis, V.; Rosentritt, M. Polishing effects and wear performance of chairside CAD/CAM materials. Clin Oral Investig. 2019, 23, 725–737. [Google Scholar] [CrossRef] [PubMed]
- Yu, P.; Luo, H.; Yap, A.U.; Tian, F.C.; Wang, X.Y. Effects of polishing press-on force on surface roughness and gloss of CAD-CAM composites. J Oral Sci. 2023, 65, 131–135. [Google Scholar] [CrossRef]
- Çakmak, G.; Donmez, M.B.; de Paula, M.S.; Akay, C.; Fonseca, M.; Kahveci, Ç.; Abou-Ayash, S.; Yilmaz, B. Surface roughness, optical properties, and microhardness of additively and subtractively manufactured CAD-CAM materials after brushing and coffee thermal cycling. J Prosthodont. 2025, 34, 68–77. [Google Scholar] [CrossRef]
- Bozoğulları, H.N.; Temizci, T. Evaluation of the Color Stability, Stainability, and Surface Roughness of Permanent Composite-Based Milled and 3D Printed CAD/CAM Restorative Materials after Thermocycling. Appl. Sci. 2023, 13, 11895. [Google Scholar] [CrossRef]
- Rojas-Rueda, S.; Alsahafi, T.A.; Hammamy, M.; Surathu, N.; Surathu, N.; Lawson, N.C.; Sulaiman, T.A. Roughness and Gloss of 3D-Printed Crowns Following Polishing or Varnish Application. Materials 2025, 18, 3308. [Google Scholar] [CrossRef]
- Aldosari, L.I.; Alshadidi, A.A.; Porwal, A.; Al Ahmari, N.M.; Al Moaleem, M.M.; Suhluli, A.M.; Shariff, M.; Shami, A.O. Surface roughness and color measurements of glazed or polished hybrid, feldspathic, and zirconia CAD/CAM restorative materials after hot and cold coffee immersion. BMC Oral Health. 2021, 21, 422. [Google Scholar] [CrossRef]
- Hassan, S.A.; Beleidy, M.; El-Din, Y.A. Biocompatibility and Surface Roughness of Different Sustainable Dental Composite Blocks: Comprehensive In Vitro Study. ACS Omega 2022, 7, 34258–34267. [Google Scholar] [CrossRef]
- Mokhtar, M.M.; Farahat, D.S.; Eldars, W.; Osman, M.F. Physico-mechanical properties and bacterial adhesion of resin composite CAD/CAM blocks: An in-vitro study. J. Clin. Exp. Dent. 2022, 14, 413–419. [Google Scholar] [CrossRef]
- Morsy, N.; El Kateb, M.; Ghoneim, M.M.; Holiel, A.A. Surface roughness, wear, and abrasiveness of printed and milled occlusal veneers after thermomechanical aging. J Prosthet Dent. 2024, 132, 984. [Google Scholar] [CrossRef]
- Özarslan, M.M.; Büyükkaplan, U.Ş.; Barutcigil, Ç.; Arslan, M.; Türker, N.; Barutcigil, K. Effects of different surface finishing procedures on the change in surface roughness and color of a polymer infiltrated ceramic network material. J Adv Prosthodont. 2016, 8, 16–20. [Google Scholar] [CrossRef]
- Özarslan, M.; Bilgili Can, D.; Avcioglu, N.H.; Çalışkan, S. Effect of different polishing techniques on surface properties and bacterial adhesion on resin-ceramic CAD/CAM materials. Clin. Oral Investig. 2022, 26, 5289–5299. [Google Scholar] [CrossRef]
- Ozer, N.E.; Sahin, Z.; Yikici, C.; Duyan, S.; Kilicarslan, M.A. Bacterial adhesion to composite resins produced by additive and subtractive manufacturing. Odontology 2024, 112, 460–471. [Google Scholar] [CrossRef] [PubMed]
- Siddanna, G.D.; Valcanaia, A.J.; Fierro, P.H.; Neiva, G.F.; Fasbinder, D.J. Surface Evaluation of Resilient CAD/CAM ceramics after Contouring and Polishing. J Esthet Restor Dent. 2021, 33, 750–763. [Google Scholar] [CrossRef] [PubMed]
- Yılmaz, K.; Özdemir, E.; Gönüldaş, F. Effects of immersion in various beverages, polishing and bleaching systems on surface roughness and microhardness of CAD/CAM restorative materials. BMC Oral Health. 2024, 24, 1458. [Google Scholar] [CrossRef] [PubMed]
- Kara, D.; Tekçe, N.; Fidan, S.; Demirci, M.; Tuncer, S.; Balcı, S. The efects of various polishing procedures on surface topography of CAD/CAM resin restoratives. J. Prosthodont. 2021, 30, 481–489. [Google Scholar] [CrossRef]
- Alghamdi, W.S.; Labban, N.; Maawadh, A.; Alsayed, H.D.; Alshehri, H.; Alrahlah, A.; Alnafaiy, S.M. Influence of Acidic Environment on the Hardness, Surface Roughness and Wear Ability of CAD/CAM Resin-Matrix Ceramics. Materials 2022, 15, 6146. [Google Scholar] [CrossRef]
- Okamura, K.; Koizumi, H.; Kodaira, A.; Nogawa, H.; Yoneyama, T. Surface properties and gloss of CAD/CAM composites after toothbrush abrasion testing. J Oral Sci. 2019, 61, 358–363. [Google Scholar] [CrossRef]
- Di Fiore, A.; Stellini, E.; Alageel, O.; Alhotan, A. Comparison of mechanical and surface properties of two 3D printed composite resins for definitive restoration. J Prosthet Dent. 2024, 132, 839. [Google Scholar] [CrossRef] [PubMed]
- Fuchs, F.; Schmidtke, J.; Hahnel, S.; Koenig, A. The influence of different storage media on Vickers hardness and surface roughness of CAD/CAM resin composites. J Mater Sci Mater Med. 2023, 34, 13. [Google Scholar] [CrossRef] [PubMed]
- Grymak, A.; Aarts, J.M.; Cameron, A.B.; Choi, J.J.E. Evaluation of wear resistance and surface properties of additively manufactured restorative dental materials. J Dent. 2024, 147, 105120. [Google Scholar] [CrossRef] [PubMed]
- Koizumi, H.; Saiki, O.; Nogawa, H.; Hiraba, H.; Okazaki, T.; Matsumura, H. Surface roughness and gloss of current CAD/CAM resin composites before and after toothbrush abrasion. Dent Mater J. 2015, 34, 881–887. [Google Scholar] [CrossRef]
- Lee, J.H.; Kim, S.H.; Yoon, H.I.; Yeo, I.L.; Han, J.S. Colour stability and surface properties of high-translucency restorative materials for digital dentistry after simulated oral rinsing. Eur J Oral Sci. 2020, 128, 170–180. [Google Scholar] [CrossRef]
- Egilmez, F.; Ergun, G.; Cekic-Nagas, I.; Vallittu, P.K.; Lassila, L.V.J. Comparative color and surface parameters of current esthetic restorative CAD/CAM materials. J Adv Prosthodont. 2018, 10, 32–42. [Google Scholar] [CrossRef]
- Wang, S.; Dai, J.; Xu, S.; Li, P.; Fouda, A.M.; Yilmaz, B.; Alhotan, A. Surface characteristics, cytotoxicity, and microbial adhesion of 3D-printed hybrid resin-ceramic materials for definitive restoration. J Dent. 2025, 152, 105436. [Google Scholar] [CrossRef]
- Ereifej, N.S.; Oweis, Y.G.; Eliades, G. The Effect of Polishing Technique on 3-D Surface Roughness and Gloss of Dental Restorative Resin Composites. Oper. Dent. 2013, 38, 1–12. [Google Scholar] [CrossRef]
- Pallis, D.; Pachiou, A.; Dimitriadi, M.; Sykaras, N.; Kourtis, S. A Comparative In Vitro Study of Materials for Provisional Restorations Manufactured With Additive (3Dprinting), Subtractive (Milling), and Conventional Techniques. J Esthet Restor Dent. 2025, 37, 2011–2020. [Google Scholar] [CrossRef]
- Pawlus, P.; Reizer, R.; Wieczorowski, M. Functional Importance of Surface Texture Parameters. Materials 2021, 14, 5326. [Google Scholar] [CrossRef] [PubMed]
- Crawford, R.J.; Webb, H.K.; Truong, V.K.; Hasan, J.; Ivanova, E.P. Surface topographical factors influencing bacterial attachment. Adv Colloid Interface Sci. 2012, 179-182, 142–149. [Google Scholar] [CrossRef]
- Stout, K.J.; Blunt, L. Three-dimensional surface topography, 2nd ed.; Penton Press: London, England, 2000; pp. 143–172. [Google Scholar]
- Kim, K.H.; Loch, C.; Waddell, J.N.; Tompkins, G.; Schwass, D. Surface Characteristics and Biofilm Development on Selected Dental Ceramic Materials. Int. J. Dent. 2017, 2017, 7627945. [Google Scholar] [CrossRef] [PubMed]
- Bollen, C.M.; Lambrechts, P.; Quirynen, M. Comparison of Surface Roughness of Oral Hard Materials to the Threshold Surface Roughness for Bacterial Plaque Retention: A Review of the Literature. Dent. Mater. 1997, 13, 258–269. [Google Scholar] [CrossRef]
- Putzeys, E.; Vercruyssen, C.; Duca, R.C.; Saha, P.S.; Godderis, L.; Vanoirbeek, J.; Peumans, M.; Van Meerbeek, B.; Van Landuyt, K.L. Monomer release from direct and indirect adhesive restorations: A comparative in vitro study. Dent Mater. 2020, 36, 1275–1281. [Google Scholar] [CrossRef]
- Shaukat, U.; Rossegger, E.; Schlögl, S. A Review of Multi-Material 3D Printing of Functional Materials via Vat Photopolymerization. Polymers 2022, 14, 2449. [Google Scholar] [CrossRef]
- Rashid, A.A.; Ahmed, W.; Khalid, M.Y.; Koç, M. Vat photopolymerization of polymers and polymer composites: Processes and applications. Addit Manuf. 2021, 47, 102279. [Google Scholar] [CrossRef]
- Nguyen, J.F.; Migonney, V.; Ruse, N.D.; Sadoun, M. Resin composite blocks via high-pressure high-temperature polymerization. Dent Mater. 2012, 28, 529–534. [Google Scholar] [CrossRef] [PubMed]
- Zhou, X.; Huang, X.; Li, M.; Peng, X.; Wang, S.; Zhou, X.; Cheng, L. Development and status of resin composite as dental restorative materials. J Appl Polym Sci. 2019, 136, 48180. [Google Scholar] [CrossRef]
- Koenig, A.; Schmidtke, J.; Schmohl, L.; Schneider-Feyrer, S.; Rosentritt, M.; Hoelzig, H.; Kloess, G.; Vejjasilpa, K.; Schulz-Siegmund, M.; Fuchs, F.; et al. Characterisation of the Filler Fraction in CAD/CAM Resin-Based Composites. Materials 2021, 14, 1986. [Google Scholar] [CrossRef]
- Mohs Hardness. Available online: https://gnpgraystar.com/wp-content/uploads/2020/05/MohsHardness-1.pdf (accessed on 27 July 2025).
- VarseoSmile TriniQ Safety Data Sheet. Available online: https://usa.bego.com/wp-content/uploads/2024/02/VarseoSmile-TriniQ_793559_USA_US_V-1_2_0_SDB.pdf (accessed on 27 July 2025).
- VarseoSmile TriniQ Compendium. Available online: https://www.bego.com/fileadmin/user_downloads/Mediathek/3D-Druck/Scientific-Studies/VarseoSmileTriniQ/EN/de_81028_0000_br_en.pdf (accessed on 27 July 2025).
- Grzebieluch, W.; Kowalewski, P.; Grygier, D.; Rutkowska-Gorczyca, M.; Kozakiewicz, M.; Jurczyszyn, K. Printable and Machinable Dental Restorative Composites for CAD/CAM Application—Comparison of Mechanical Properties, Fractographic, Texture and Fractal Dimension Analysis. Materials 2021, 14, 4919. [Google Scholar] [CrossRef]
- Aydın, N.; Topçu, F.T.; Karaoğlanoğlu, S.; Oktay, E.A.; Erdemir, U. Effect of finishing and polishing systems on the surface roughness and color change of composite resins. J Clin Exp Dent. 2021, 13, 446–454. [Google Scholar] [CrossRef] [PubMed]
- Elmarsafy, S.M.; Abdelwahab, S.A.; Hussein, F. Influence of polishing systems on surface roughness of four resin composites subjected to thermocycling aging. Dent Res J (Isfahan). 2023, 20, 35. [Google Scholar] [CrossRef] [PubMed]
- de Oliveira, A.G.; Rocha, R.S.; Spinola, M.D.S.; Batista, G.R.; Bresciani, E.; Caneppele, T.M.F. Surface smoothness of resin composites after polishing-A systematic review and network meta-analysis of in vitro studies. Eur J Oral Sci. 2023, 131, e12921. [Google Scholar] [CrossRef]
- St-Pierre, L.; Martel, C.; Crépeau, H.; Vargas, M.A. Influence of polishing systems on surface roughness of composite resins: polishability of composite resins. Oper Dent. 2019, 44, 122–132. [Google Scholar] [CrossRef]
- Jefferies, S.R. The art and science of abrasive finishing and polishing in restorative dentistry. Dent Clin North Am. 1998, 42, 613–627. [Google Scholar] [CrossRef]
- Khan, A.; Hodson, N.; Altaie, A. Polishing systems for modern aesthetic dental materials: a narrative review. Br Dent J. 2024, 237, 607–613. [Google Scholar] [CrossRef]
- Flury, S.; Diebold, E.; Peutzfeldt, A.; Lussi, A. Effect of artificial toothbrushing and water storage on the surface roughness and micromechanical properties of tooth-colored CAD-CAM materials. J Prosthet Dent. 2017, 117, 767–774. [Google Scholar] [CrossRef] [PubMed]
- Heintze, S.D.; Forjanic, M.; Rousson, V. Surface roughness and gloss of dental materials as a function of force and polishing time in vitro. Dent Mater. 2006, 22, 146–65. [Google Scholar] [CrossRef]
- Sterzenbach, T.; Helbig, R.; Hannig, C.; Hannig, M. Bioadhesion in the oral cavity and approaches for biofilm management by surface modifications. Clin Oral Investig. 2020, 24, 4237–4260. [Google Scholar] [CrossRef] [PubMed]
- Rupp, F.; Gittens, R.A.; Scheideler, L.; Marmur, A.; Boyan, B.D.; Schwarz, Z.; Geis-Gerstorfer, J. A review on the wettability of dental implant surfaces I: Theoretical and experimental aspects. Acta Biomater. 2014, 10, 2894–2906. [Google Scholar] [CrossRef] [PubMed]
- Sang, T.; Ye, Z.; Fischer, N.G.; Skoe, E.P.; Echeverría, C.; Wu, J.; Aparicio, C. Physical-chemical interactions between dental materials surface, salivary pellicle and Streptococcus gordonii. Colloids Surf B Biointerfaces. 2020, 190, 110938. [Google Scholar] [CrossRef]
- Eliades, G.; Eliades, T.; Vavuranakis, M. General aspects of biomaterial surface alterations following exposure to biologic fluids. In Dental Materials In Vivo: Aging and Related Phenomena, 1st ed.; Eliades, G., Eliades, T., Brantley, W.A., Walts, D.C., Eds.; Quintessence Publishing Co.: Chicago, IL, USA, 2003. [Google Scholar]
- Cassie, A.B.D.; Baxter, S. Wettability of porous surfaces. Trans Faraday Soc. 1944, 40, 546–551. [Google Scholar] [CrossRef]
- Wenzel, R.N. Resistance of solid surfaces to wetting by water. Ind Eng Chem. 1936, 28, 988–994. [Google Scholar] [CrossRef]
- Zheng, S.; Bawazir, M.; Dhall, A.; Kim, H.E.; He, L.; Heo, J.; Hwang, G. Implication of Surface Properties, Bacterial Motility, and Hydrodynamic Conditions on Bacterial Surface Sensing and Their Initial Adhesion. Front Bioeng Biotechnol. 2021, 9, 643722. [Google Scholar] [CrossRef]
Figure 1.
The study design flowchart.
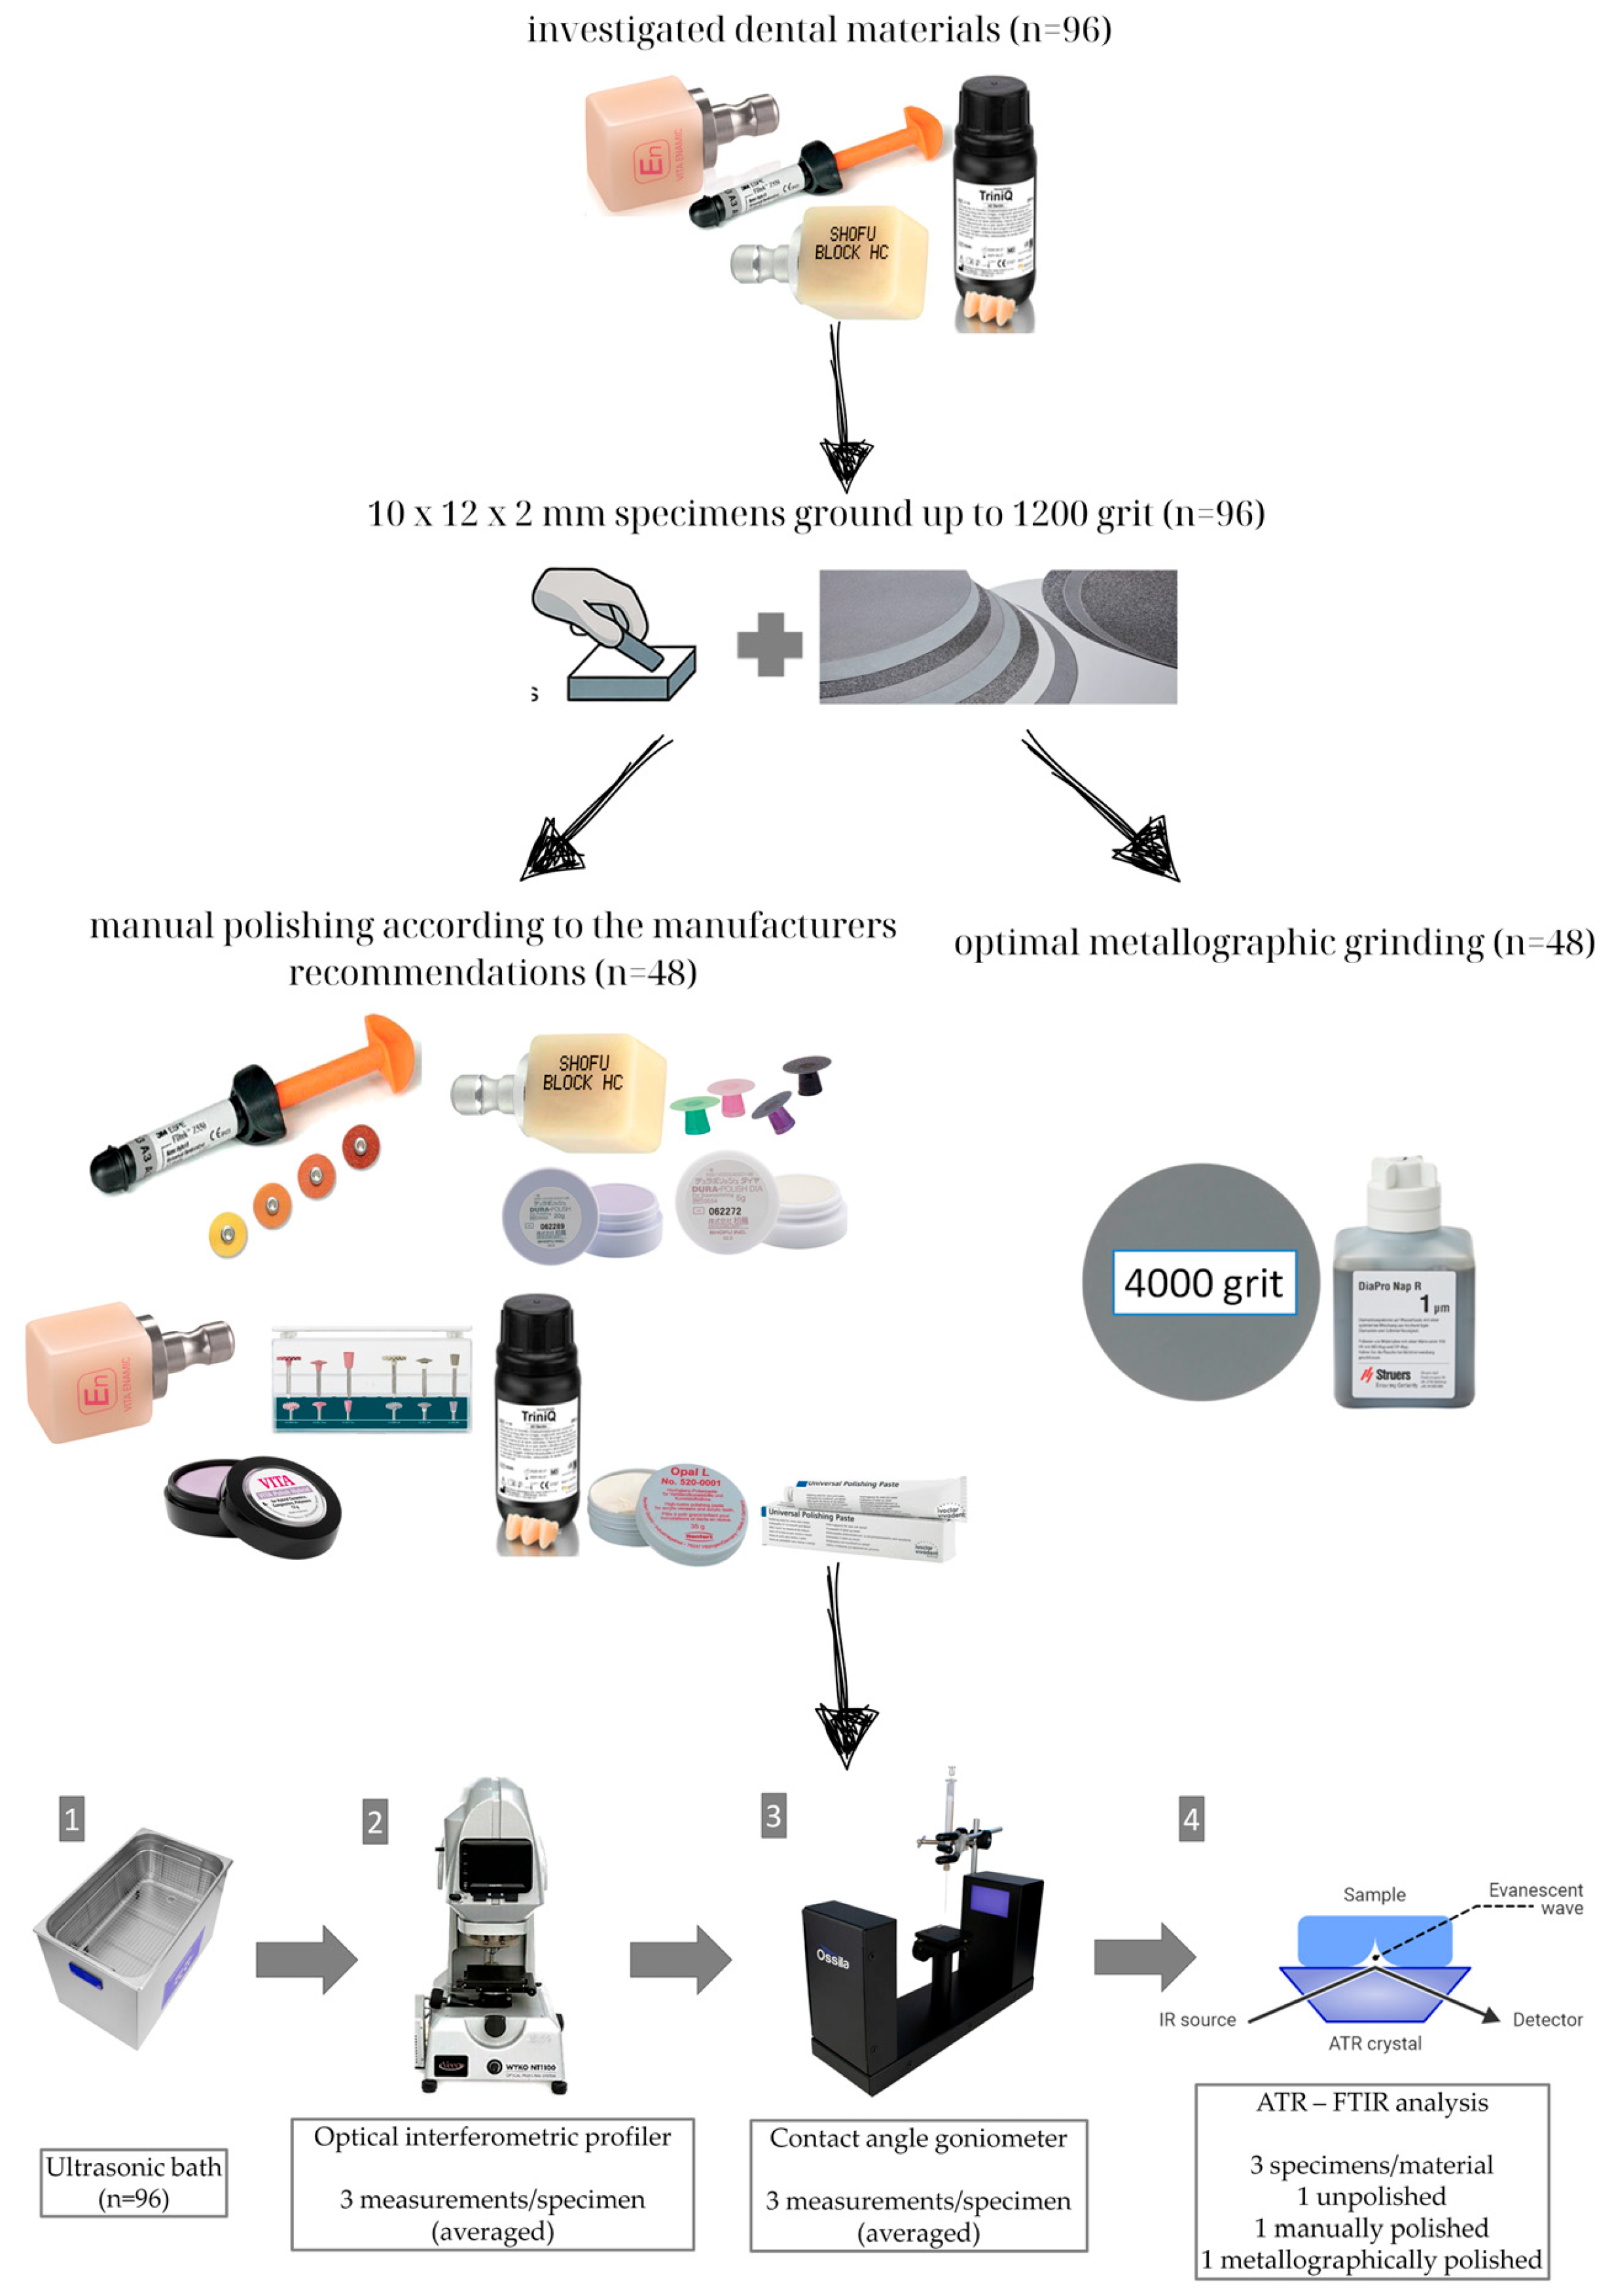
Figure 2.
Representative 3D optical profilometric images of each material, comparing surface topographies obtained after manual and metallographic polishing (148.5×113 μm scan size, amplitude range for manual polishing: SH: 1.58 μm, VE: 2.97 μm, TQ: 1.34 μm, FK: 3.23 μm, amplitude range for metallographic polishing: SH: 1.32 μm, VE: 1.28 μm, TQ: 1.42 μm, FK: 1.26 μm).
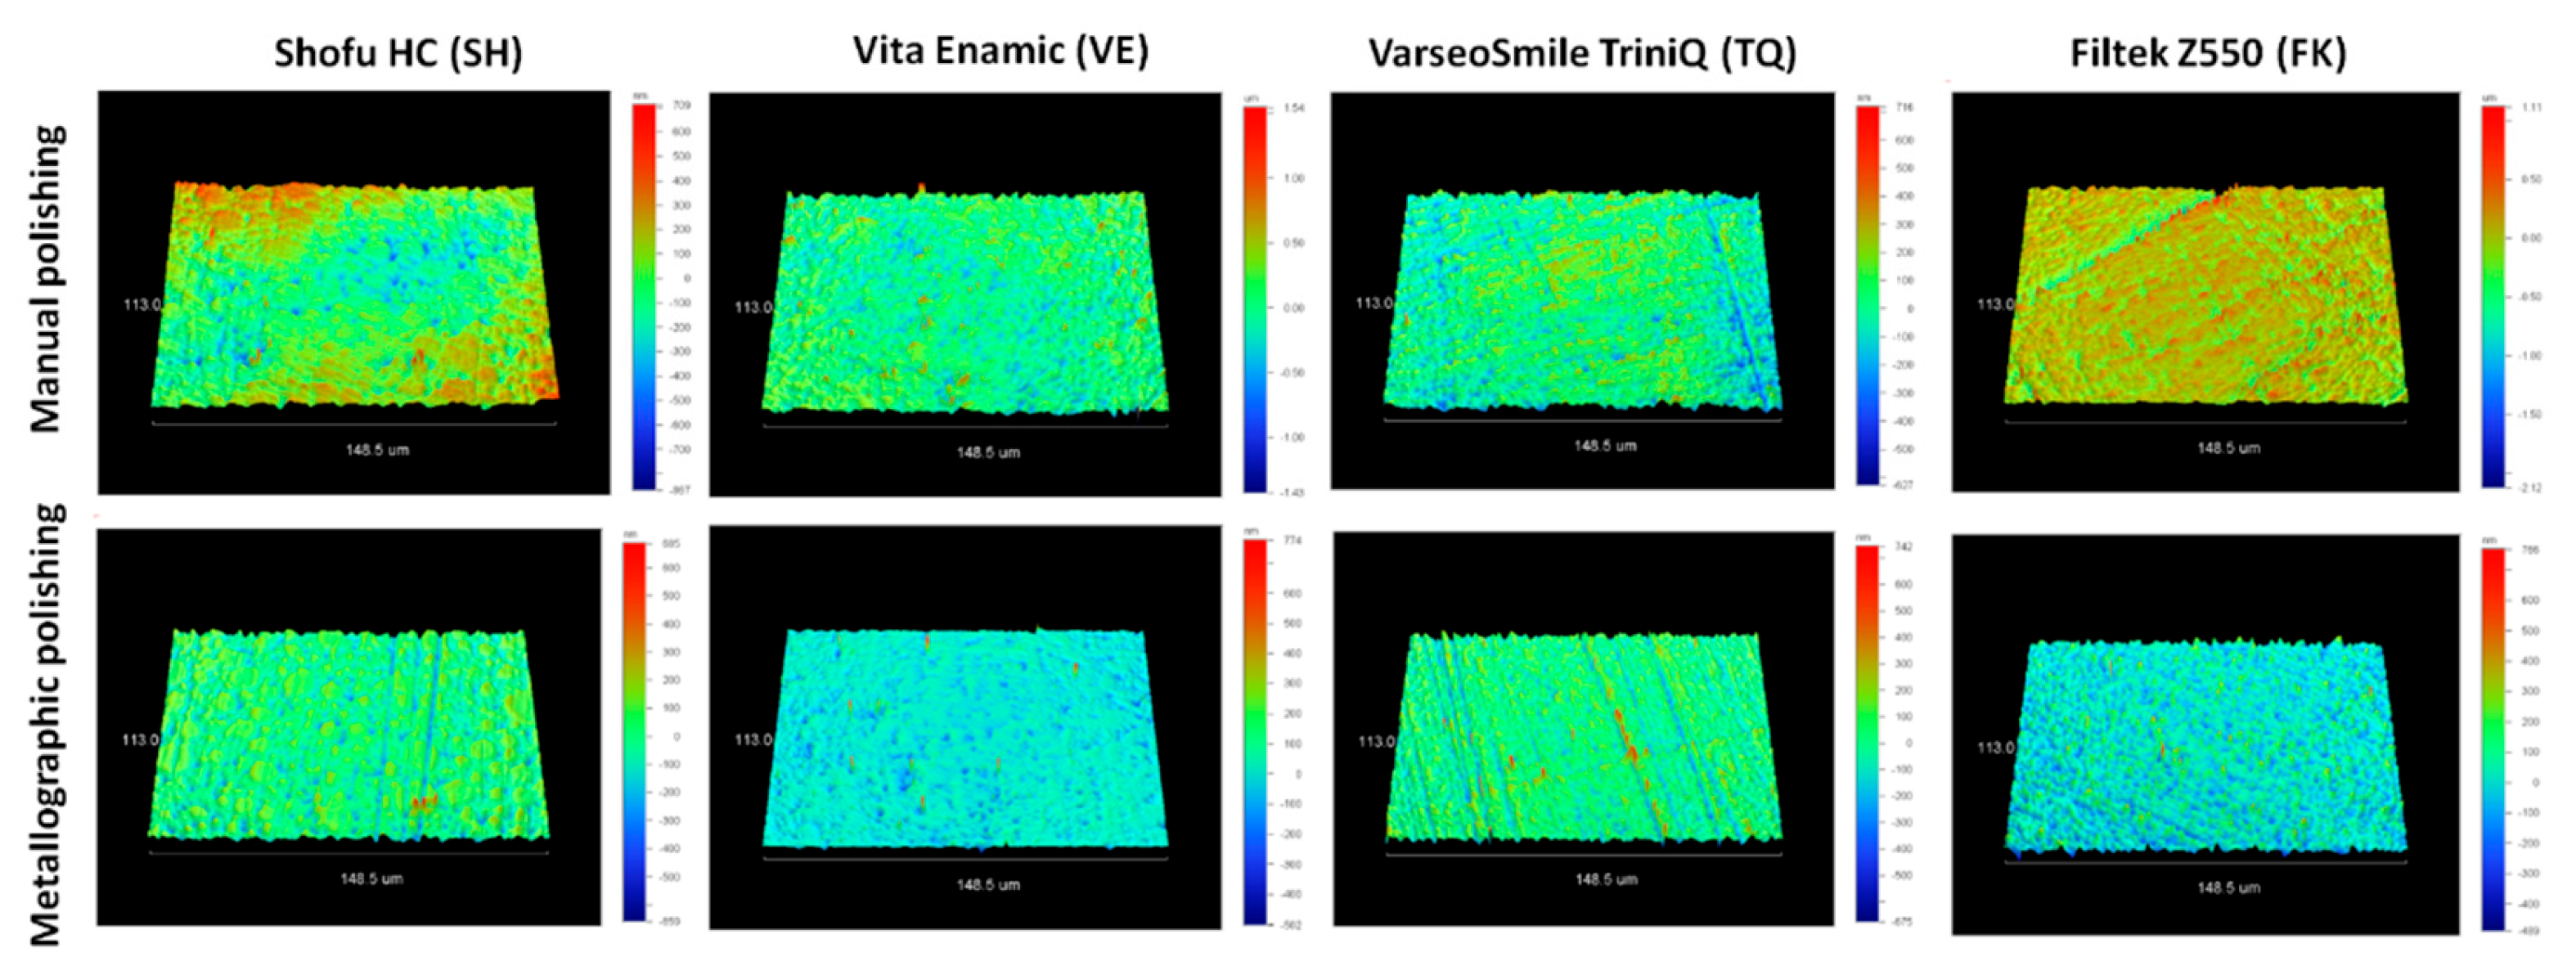
Figure 3.
Representative optical microscope images of manually and metallographically polished specimens for each material group (50X magnification, bar: 200 μm).
Figure 3.
Representative optical microscope images of manually and metallographically polished specimens for each material group (50X magnification, bar: 200 μm).
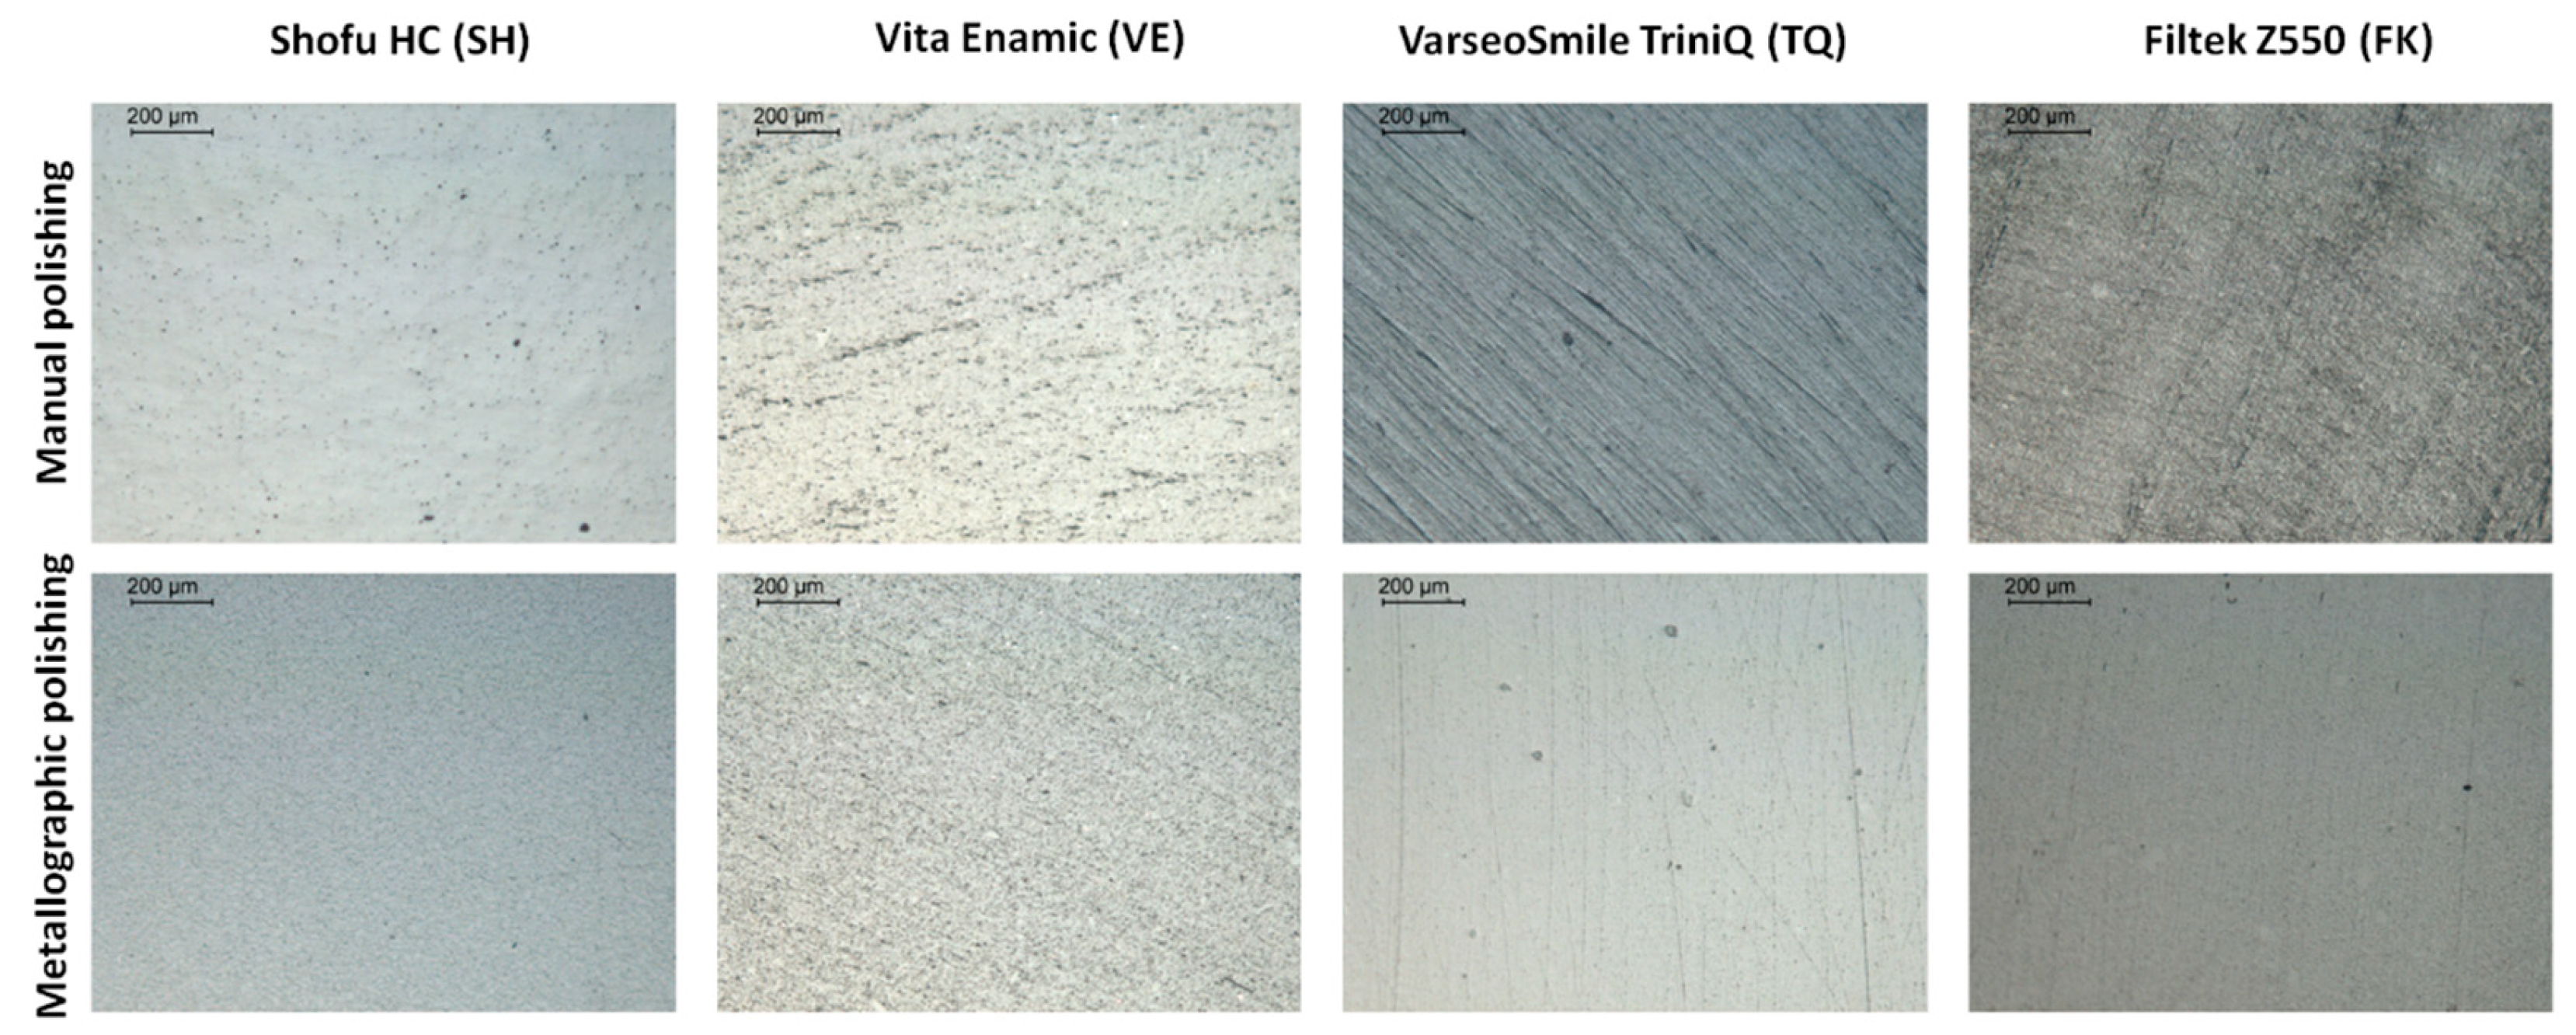
Figure 4.
Comparison of surface characteristics between polishing procedures within each material group, ncluding mean values, 95% confidence intervals, and the corresponding p-values for all comparisons.
Figure 4.
Comparison of surface characteristics between polishing procedures within each material group, ncluding mean values, 95% confidence intervals, and the corresponding p-values for all comparisons.
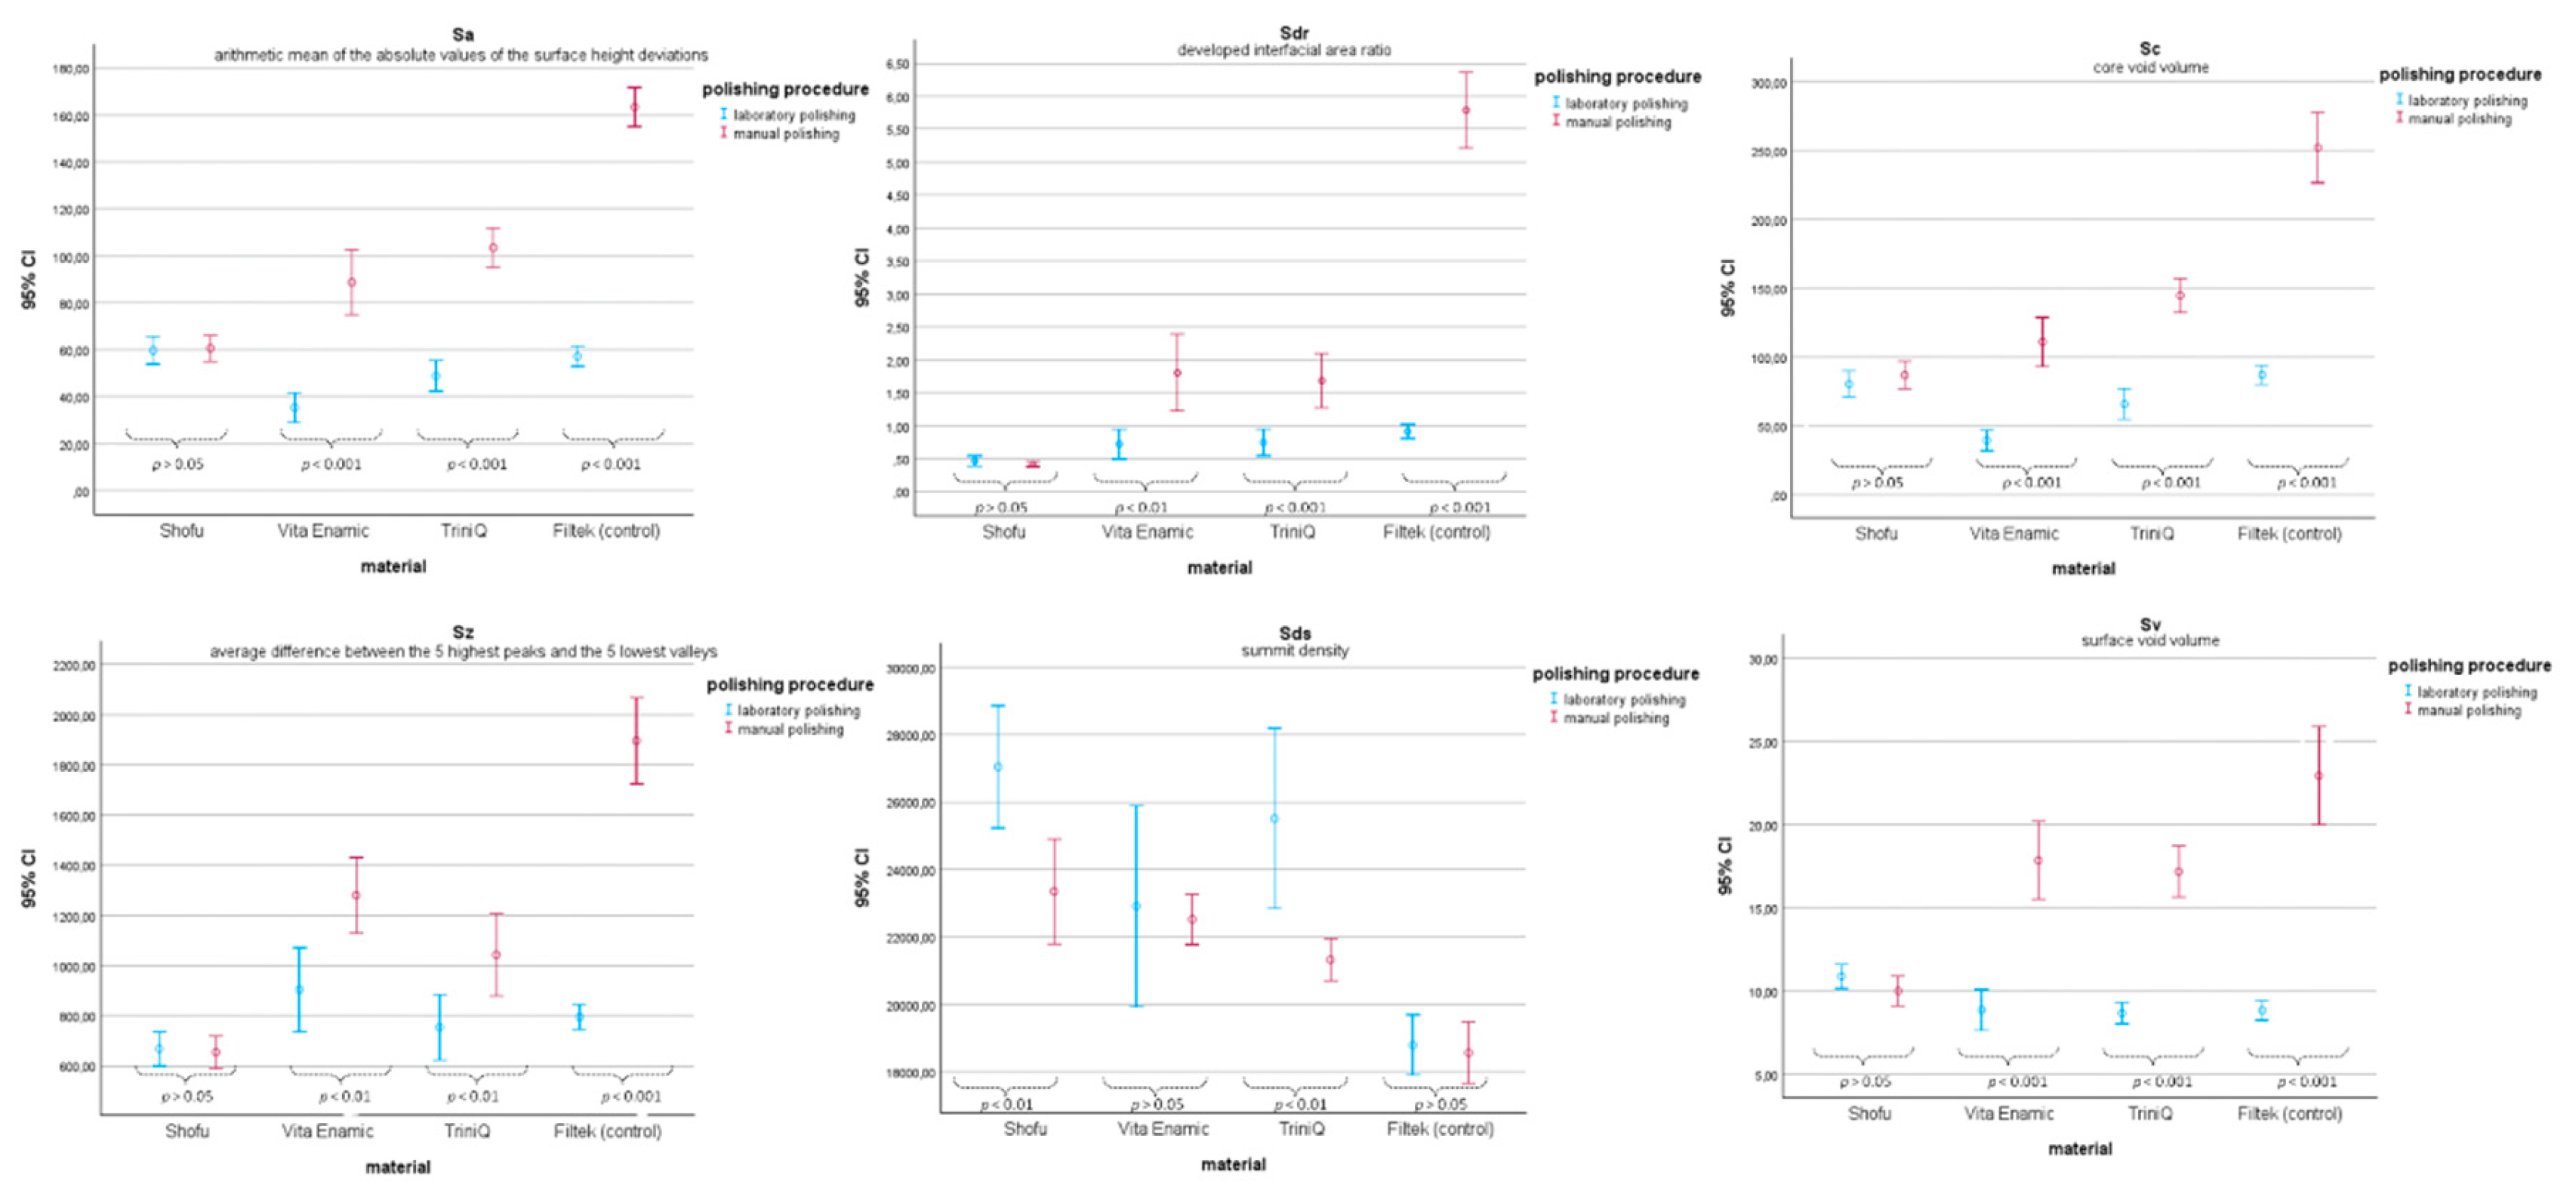
Figure 5.
Representative wettability images of manually and metallographically polished specimens for each material group.
Figure 5.
Representative wettability images of manually and metallographically polished specimens for each material group.
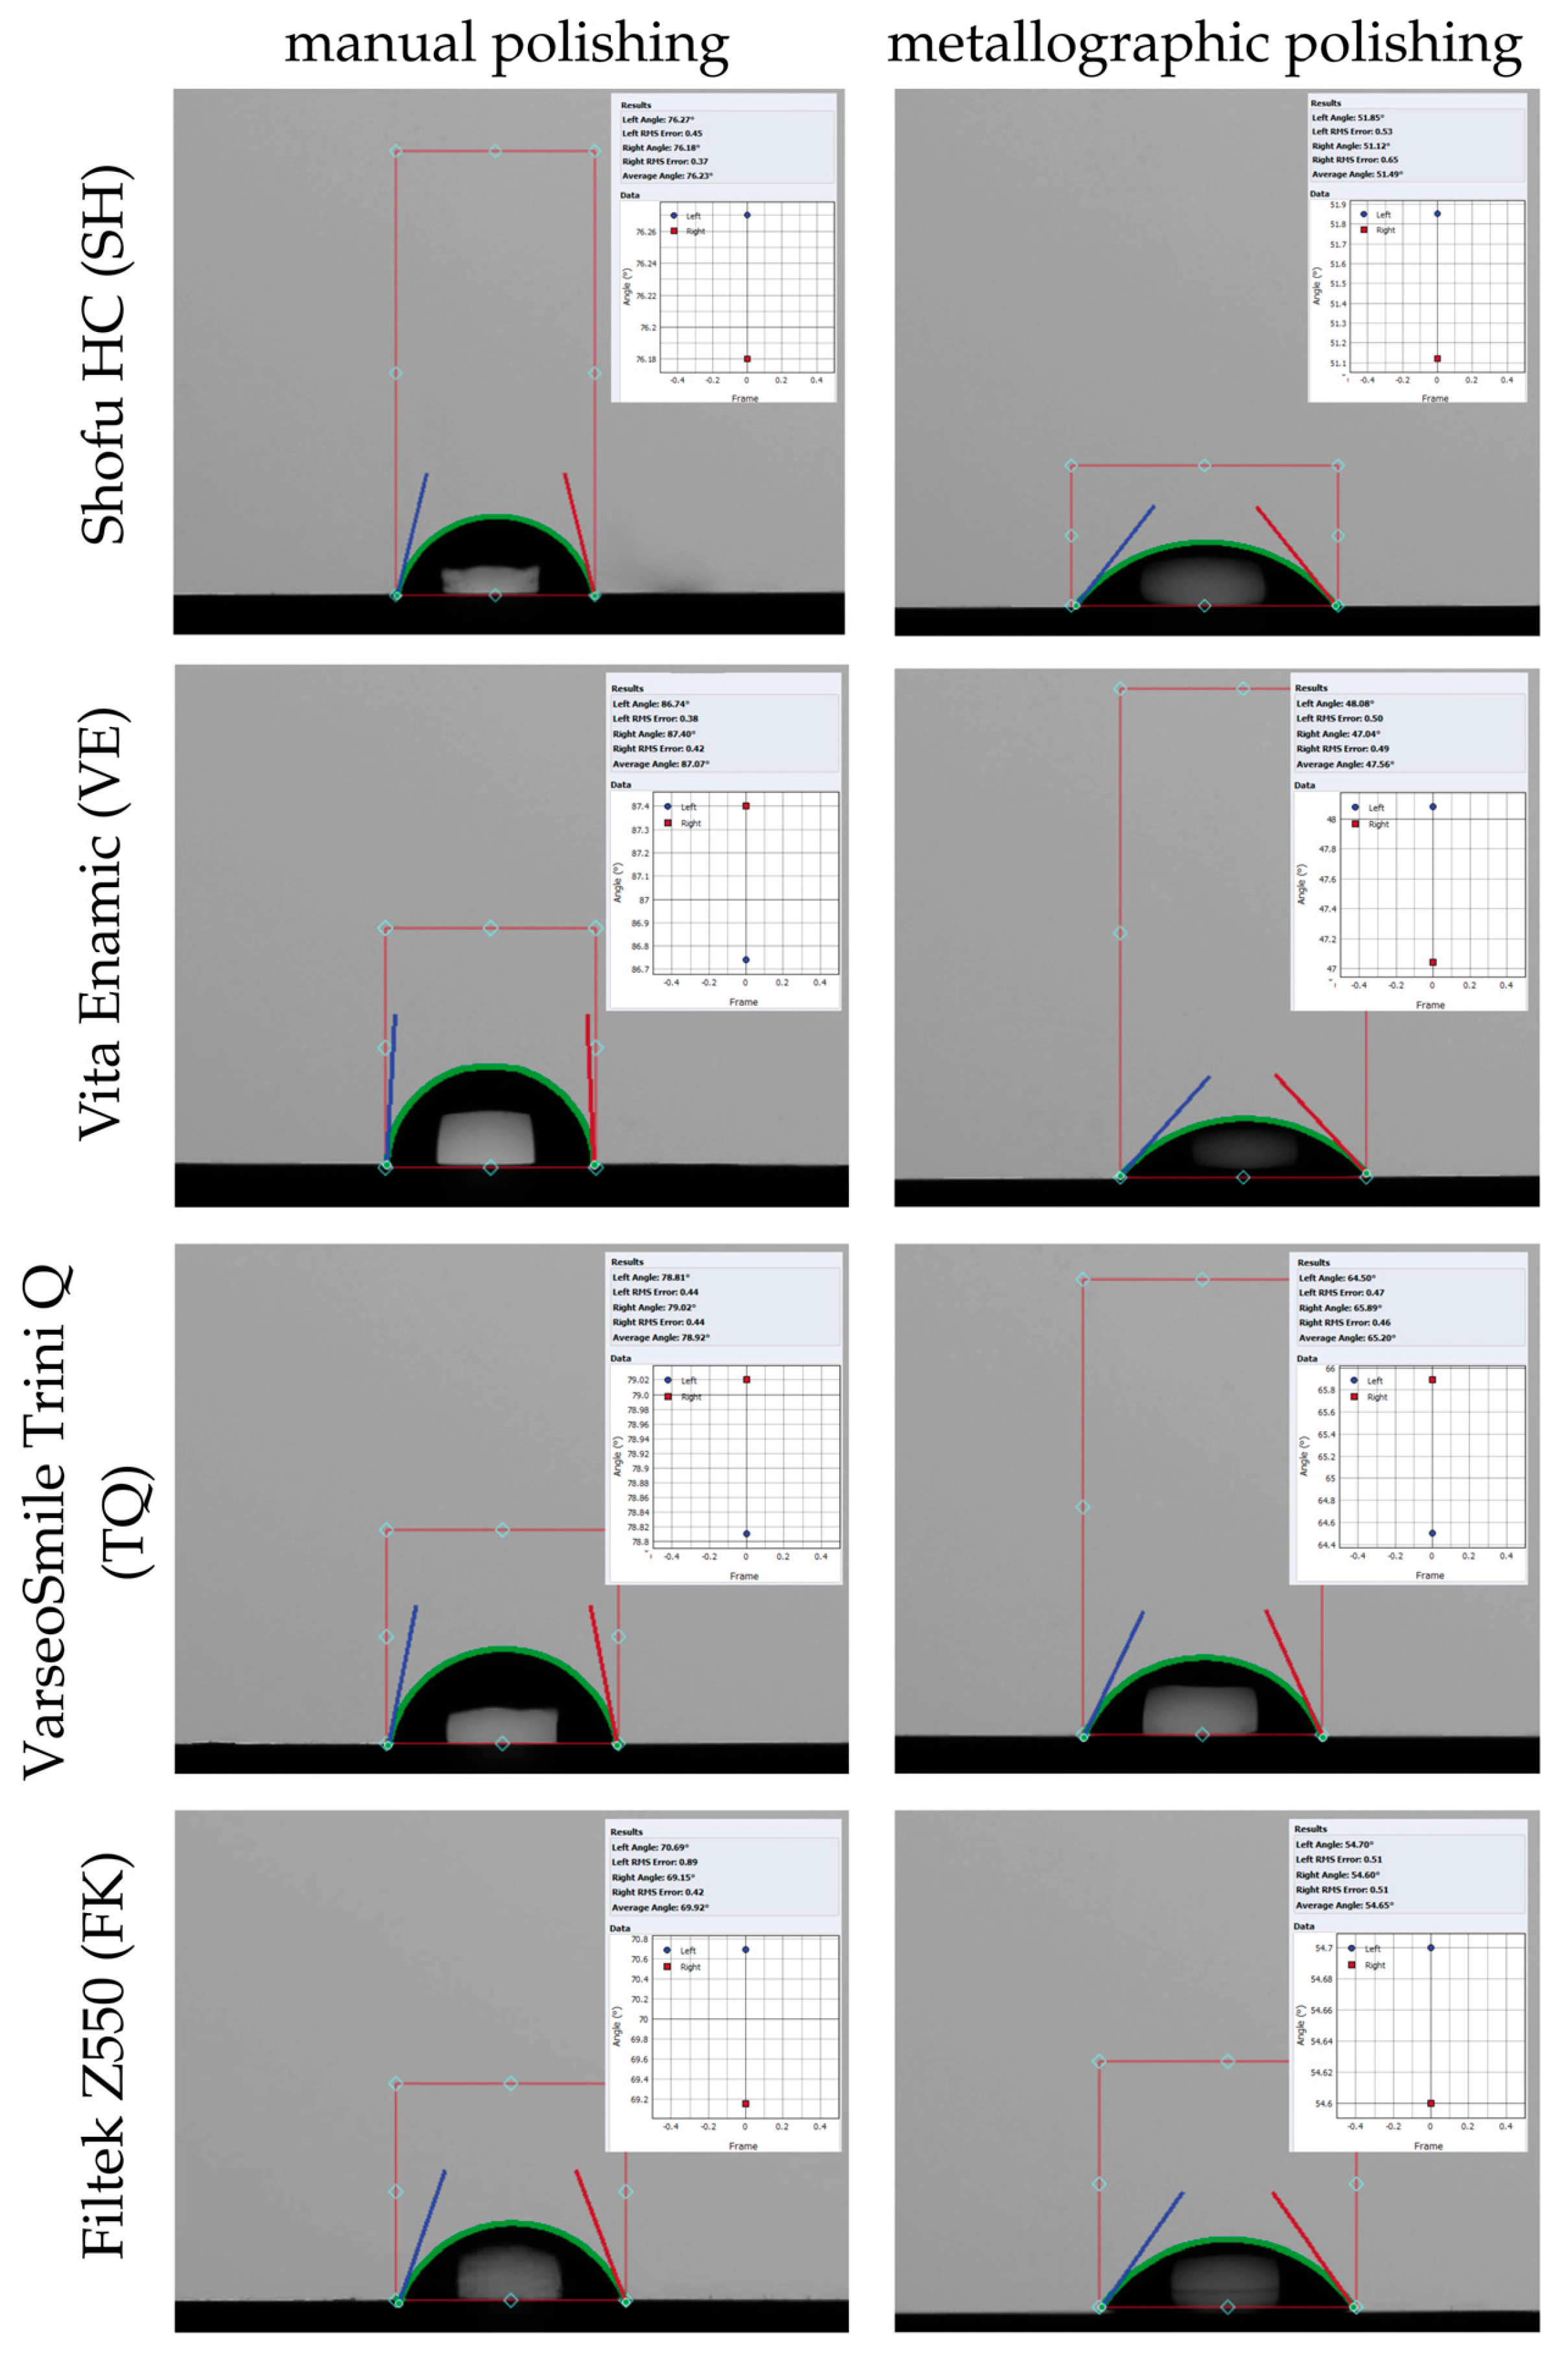
Figure 6.
Comparison of surface characteristics between polishing procedures within each material group, including mean values, 95% confidence intervals, and the corresponding p-values for all comparisons.
Figure 6.
Comparison of surface characteristics between polishing procedures within each material group, including mean values, 95% confidence intervals, and the corresponding p-values for all comparisons.
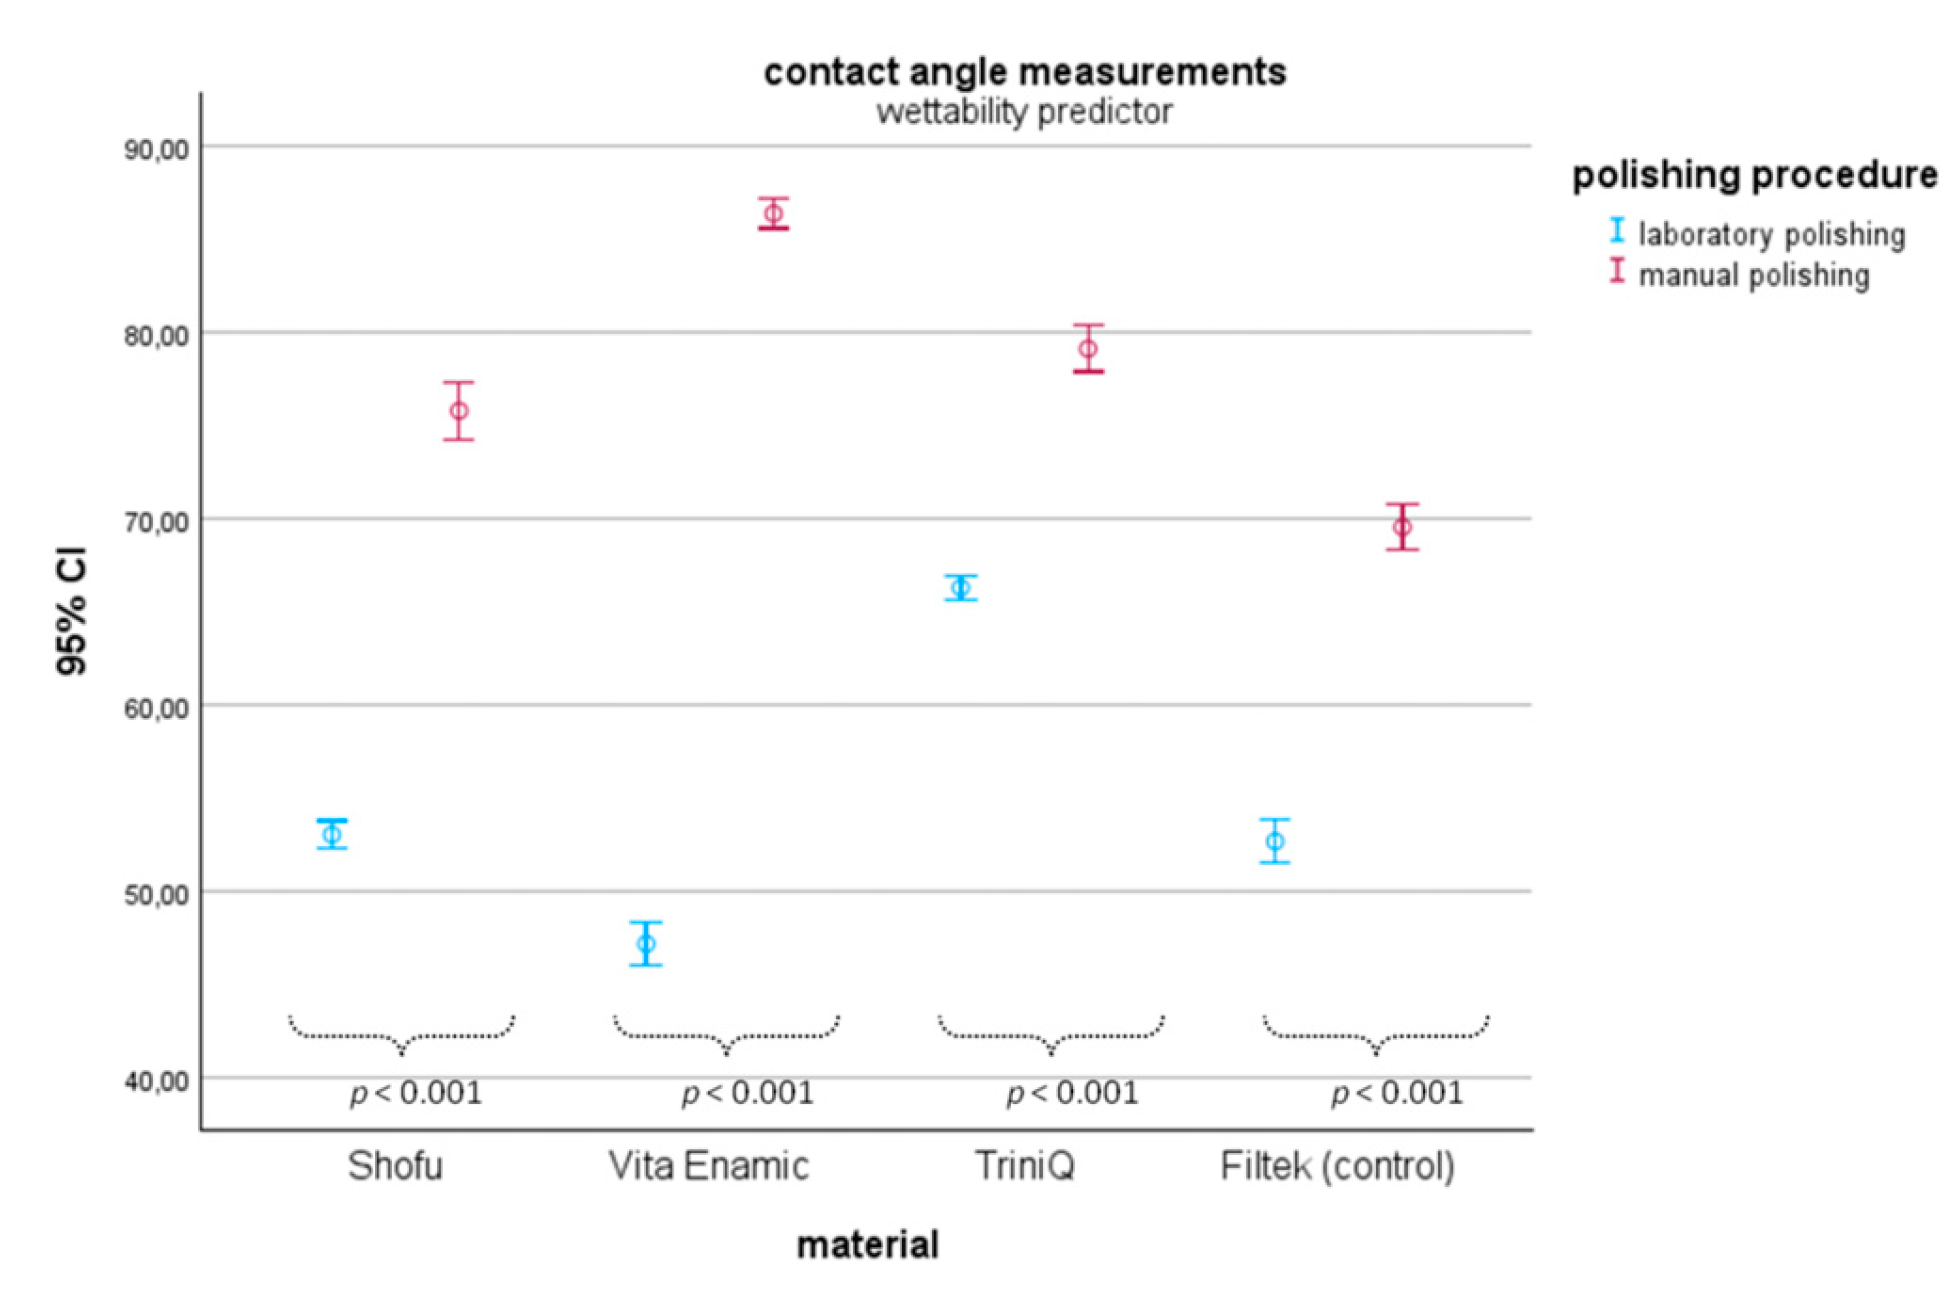
Figure 7.
Absorbance ATR-FTIR spectra of reference materials with the peak annotations.
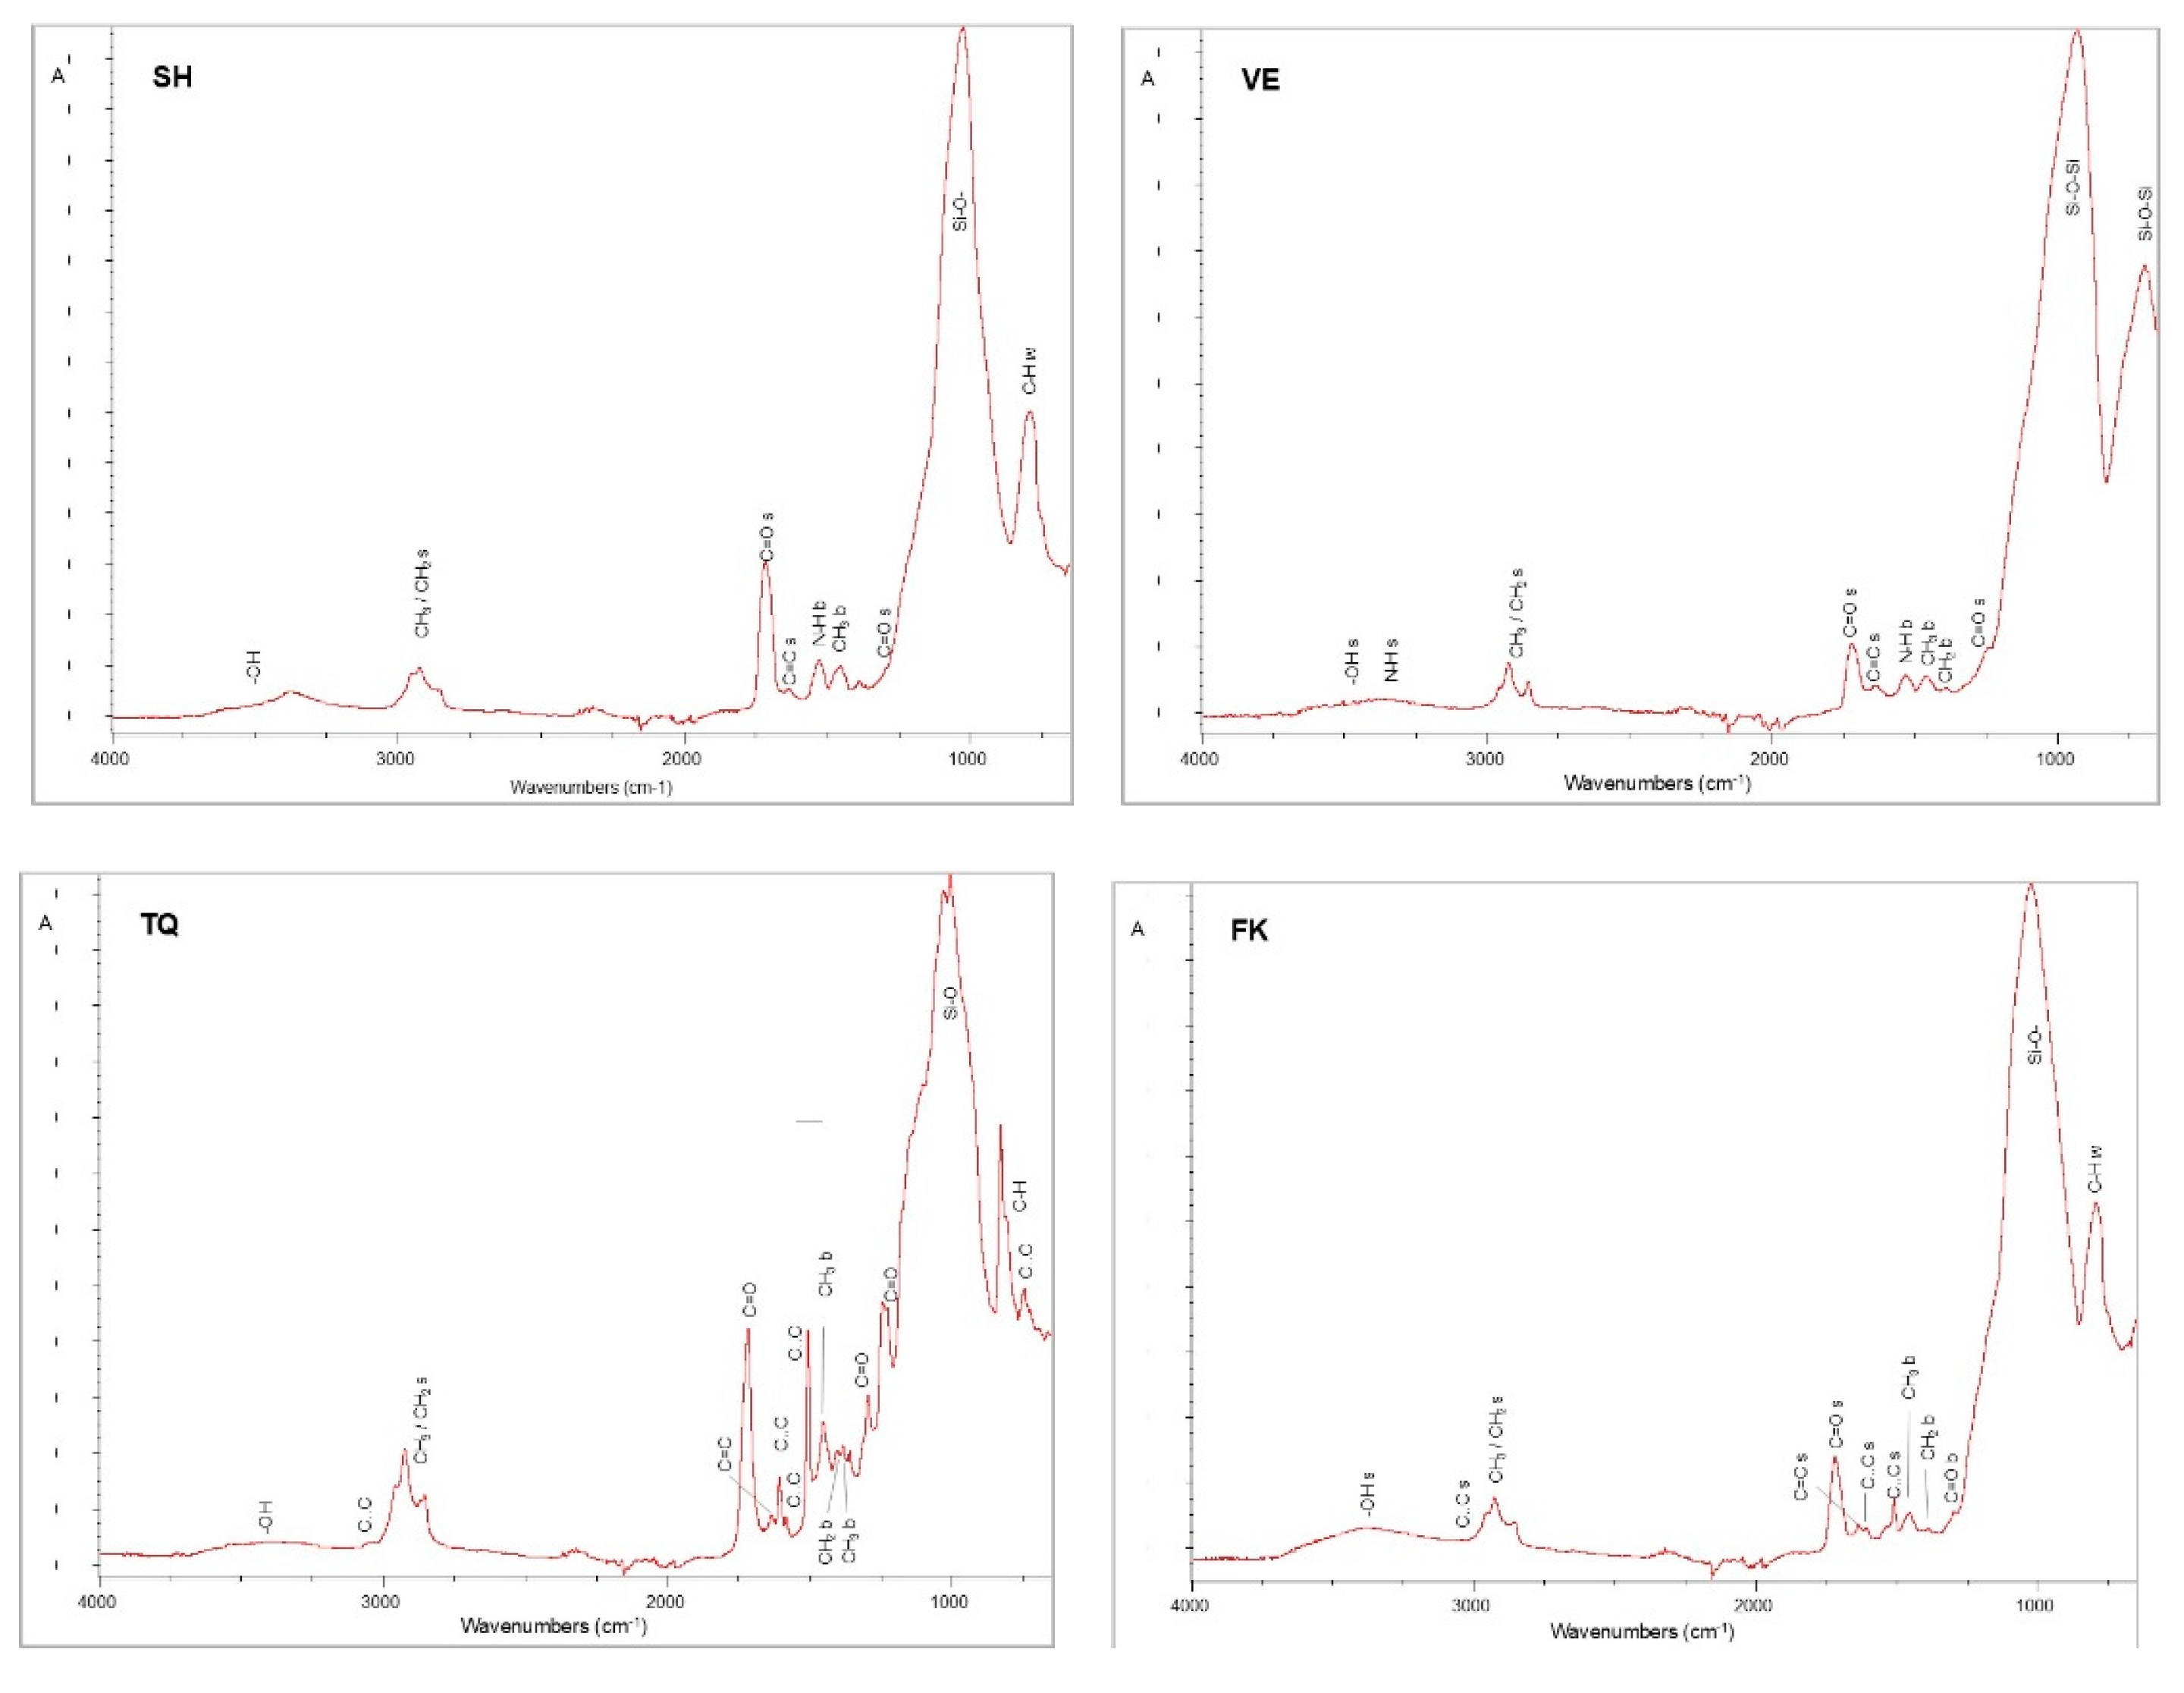
Figure 8.
Expanded absorbance ATR-FTIR spectra of reference (RF), manually polished (MP) and metallographically polished (UP) materials demonstrating changes in the relative intensity of the ester peak (1725 cm-1) compared to the major complex peak around 1100 cm-1 mainly assigned to inorganic compounds.
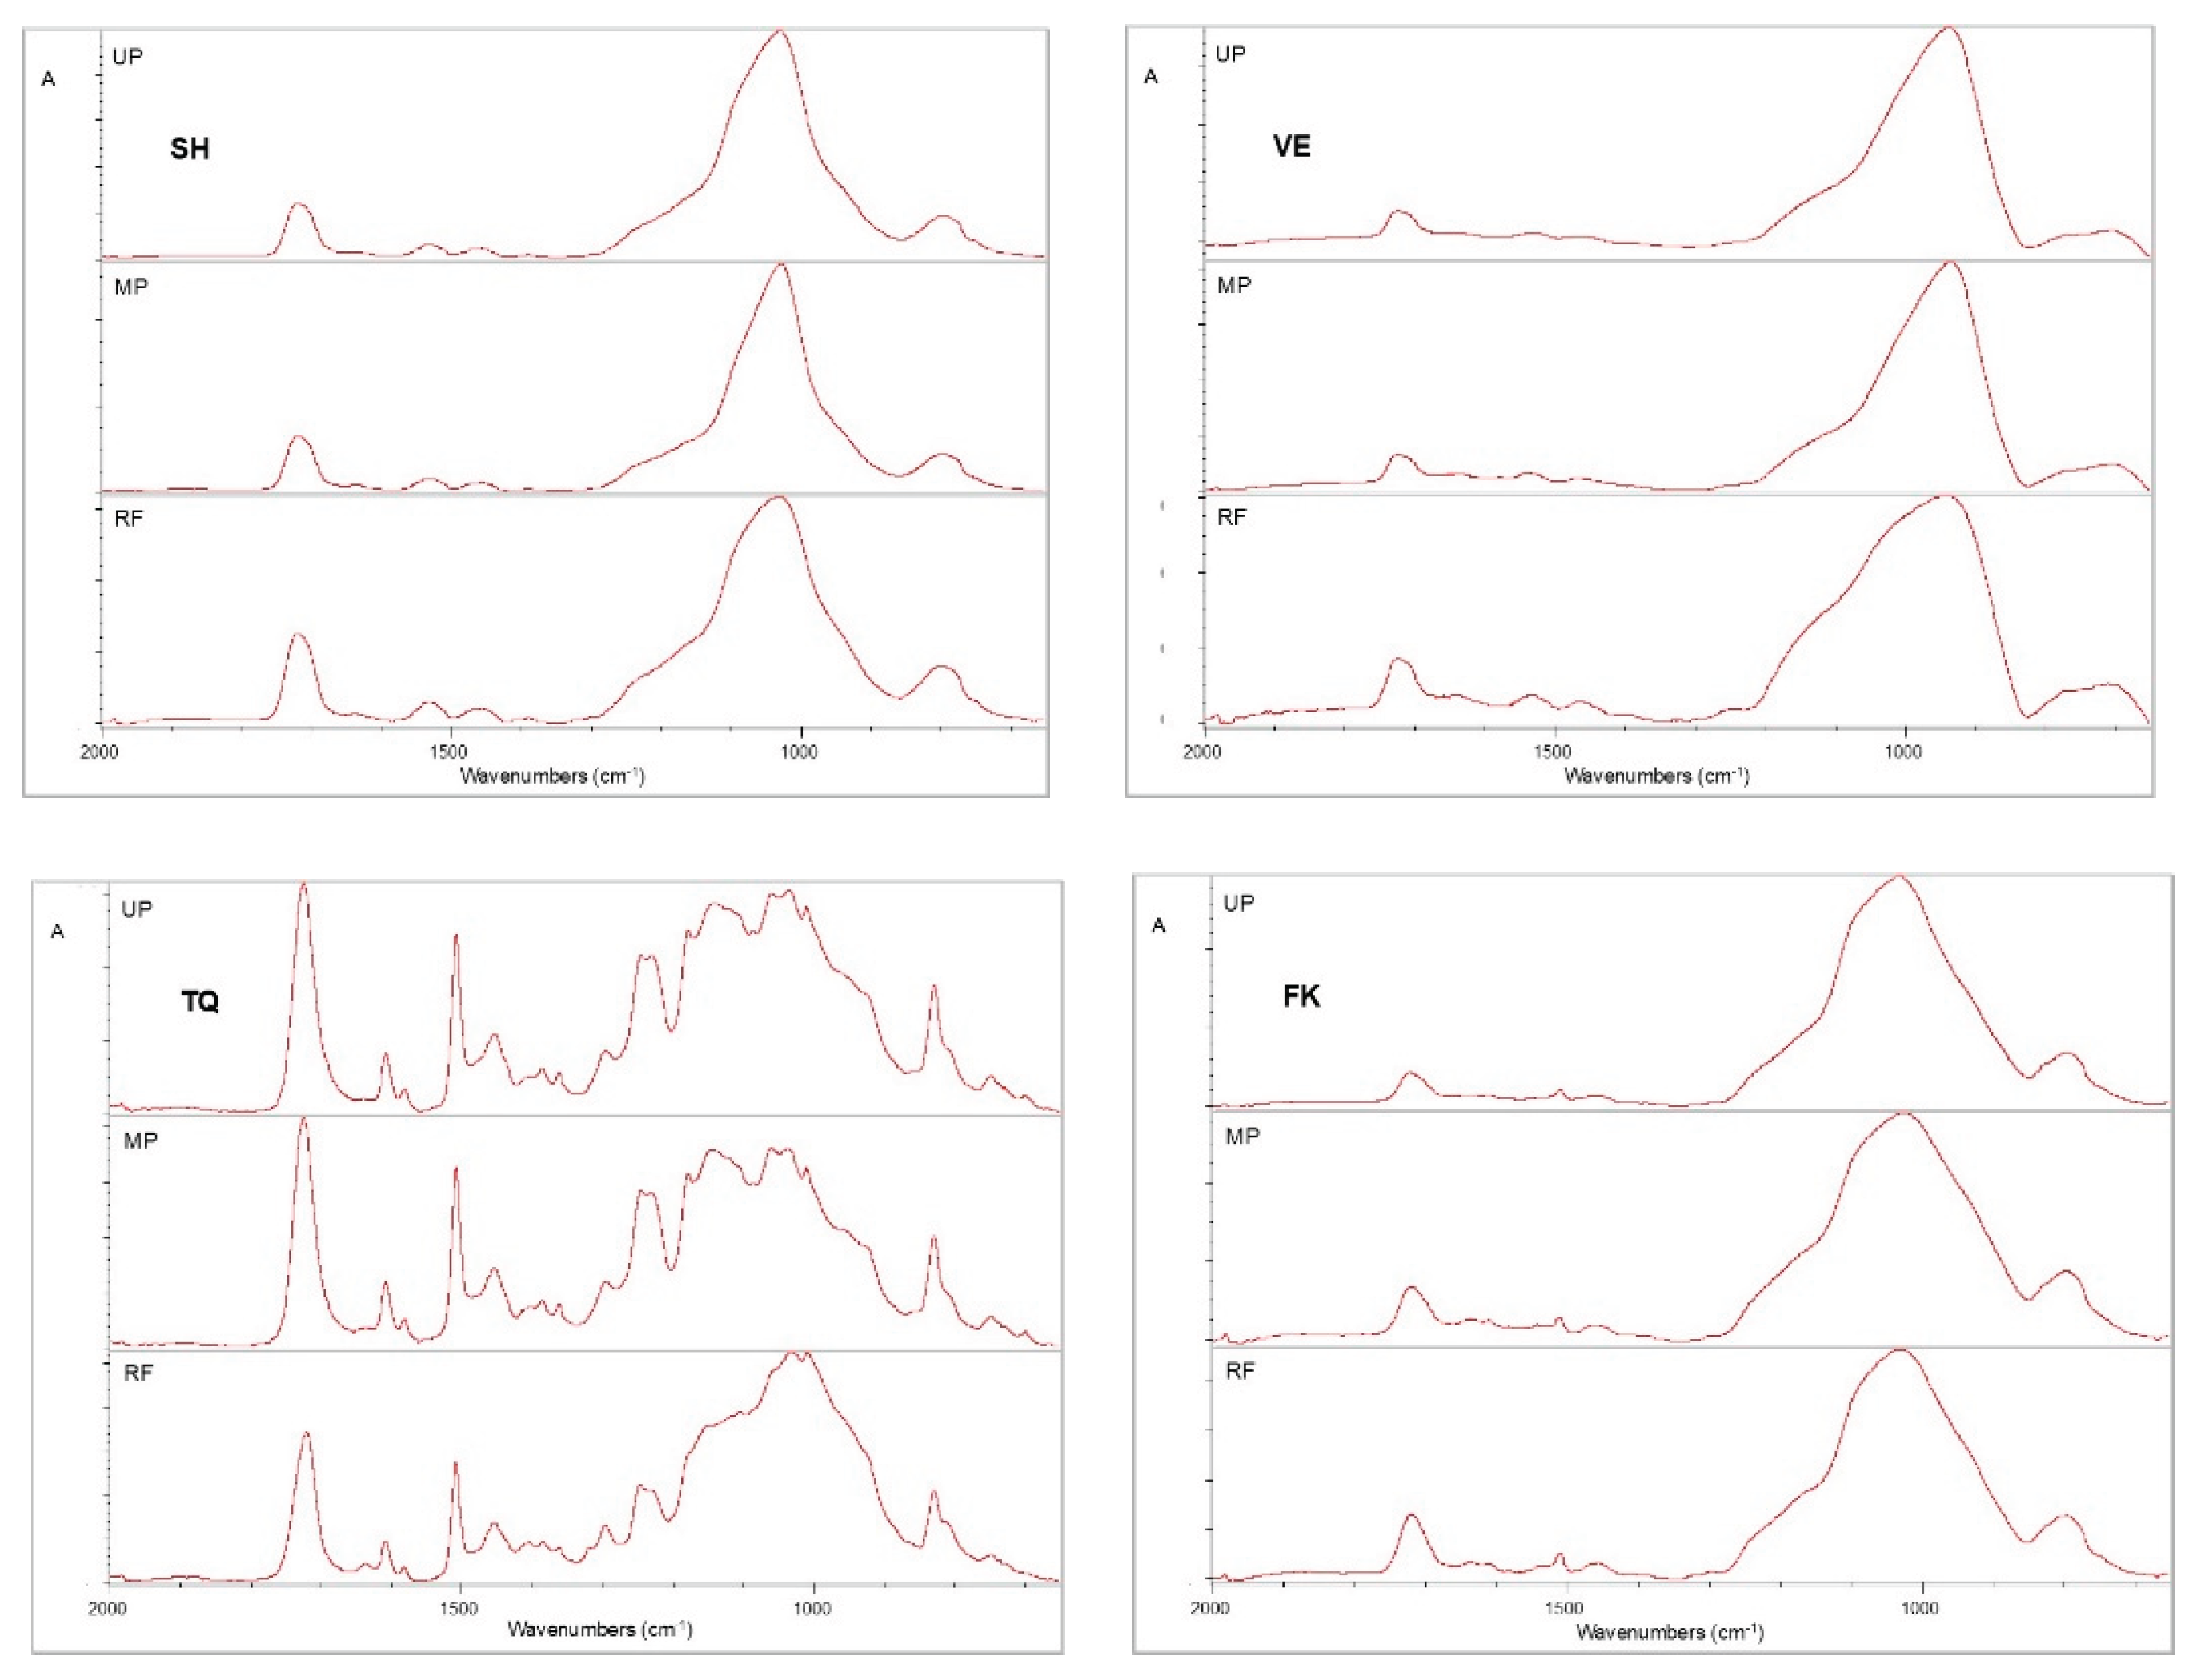
Table 1.
Materials used in the study.
| Material | Abbreviation | Shade | Composition | Manufacturer | |
|---|---|---|---|---|---|
| Filtek Z550 Direct composite restorative LOT: 11225283 [30] |
FK | A2 | Organic matrix: Bis-GMA, Bis-EMA, TEGDMA, PEGDMA, UDMA Inorganic fillers: 82 wt% inorganic fillers (non-agglomerated/ non-aggregated 20nm surface-modified silica particles, surface-modified zirconia/silica 0.1-10μm) |
3M ESPE, St. Paul, MN, USA |
|
| Shofu HC block CAD/CAM milled, resin-composite LOT: 111501 [31] |
SH | A2 HT |
Organic matrix: UDMA, TEGDMA Inorganic fillers: 61 wt% inorganic fillers (silica, zirconium silicate, and microfumed silica) |
Shofu Inc., Kyoto, Japan | |
| Vita Enamic CAD/CAM milled, hybrid ceramic LOT: 94630 [32] |
VE | 2M2 HT |
Organic matrix: UDMA, TEGDMA Inorganic fillers: 86 wt% inorganic phase (primarily silicon dioxide and aluminum oxide and secondarily sodium, potassium, calcium oxide, boron trioxide and zirconia) |
VITA Zahnfabrik, Bad Säckingen, Germany |
|
| VarseoSmile TriniQ CAD/CAM 3D-printed esin-composite LOT: 601372 [33] |
TQ | A2 Dentin |
Organic matrix: Esterification products of 4,4′-isopropylidenediphenol, ethoxylated, and 2-methylprop-2-enoic acid: 55–80 wt%, benzeneacetic acid, alpha-oxo-, methyl ester < 5 wt%, diphenyl(2,4,6-trimethylbenzoyl) phosphine oxide < 2.5 wt% Inorganic fillers: ceramic fillers |
Bego, Bremen, Germany |
*According to the manufacturers’ information. BisGMA: Bisphenol glycidyl dimethacrylate, BisEMA: Bishenol ethylene glycol diether dimethacrylate TEGDMA: Triethyleneglycol dimethacrylate, PEGDMA: Polyethylene glycol dimethacrylate, UDMA: Urethane dimethacrylate.
Table 2.
Materials used for the polishing procedures.
| Polishing Systems | Composition | Manufacturer |
|---|---|---|
| Sof-Lex Finishing and Polishing System | Aluminum oxide abrasive particles (coarse, medium, fine, superfine) | 3M ESPE, St. Paul, MN, USA |
| Super Snap | Aluminum oxide and silicon carbide particles serving as abrasive grains. | Shofu Inc, Kyoto, Japan |
| DuraPolish | 73% by weight aluminum oxide | Shofu Inc, Kyoto, Japan |
| DuraPolish DIA | 67% diamond powder with ultrafine particle sizes smaller than 1μm | Shofu Inc, Kyoto, Japan |
| VitaEnamic Polishing Set Clinical (two-step polishing system) | Silicon carbide abrasive particles for pre-polishing and diamond particles as abrasive grains for high-gloss polishing | VITA Zahnfabrik, Bad Säckingen, Germany |
| VitaPolish Hybrid | Diamond polishing paste Mixture of fatty acids, paraffin and inorganic abrasive substances |
VITA Zahnfabrik, Bad Säckingen, Germany |
| Opal L | High-luster polishing paste | Renfert GmbH, Hilzingen, Germany |
| Universal Polishing Paste | Water, aluminium oxide abrasives, solvent (hydrocarbons C10-C13), ammonium oleate, cocamide diethanolamine, ammonium hydroxide, pigments | Ivoclar Vivadent, Schaan, Lichtenstein |
| Silicon Carbide papers (800-, 1200-, 2400, 4000-grit) | Adhesive bonded silicon carbide grains | Struers, Copenhagen, Denmark |
| MD-NAP | Synthetic, short nap/diamond or oxide polishing , ≤ 1μm grain size | Struers, Copenhagen, Denmark |
| DiaPro Nap R | Water-based, optimized with polycrystalline diamond solution / 1μm grain size | Struers, Copenhagen, Denmark |
Table 3.
Mean values and standard deviations (Mean (SD)) of surface roughness parameters, along with post hoc comparisons among material groups and polishing procedures.
Table 3.
Mean values and standard deviations (Mean (SD)) of surface roughness parameters, along with post hoc comparisons among material groups and polishing procedures.
| MATERIAL GROUP | Sa (nm) | Sz (nm) | Sdr (%) | Sds (1/mm2) | Sc (nm3 /nm2) | Sv (nm3 /nm2) |
|---|---|---|---|---|---|---|
| MANUALLY POLISHED | ||||||
| FK | 163.45 (13.12) a, A | 1896.26 (270.60) a, A |
5.78 (0.89) a, A |
18568.52 (1437.13) a, A |
251.83 (40.11) a, A |
22.92 (4.64) a, A |
| SH | 60.63 (8.73) b, A |
655.01 (103.37) b, A |
0.42 (0.06) b, A |
23348.49 (2443.29) b, A |
86.67 (15.72) b, A |
10.00 (1.41) b, A |
| VE | 88.72 (21.78) c, A |
1280.12 (236.63) c, A |
1.80 (0.92) c, A |
22521.08 (1182.05) b, A |
110.83 (28.25) b, A |
17.83 (3.66) c, A |
| TQ | 103.49 (13.11) c, A |
1043.51 (256.39) c, A |
1.68 (0.64) c, A |
21325.56 (980.33) b, A |
144.58 (19.16) c, A |
17.17 (2.44) c, A |
| METALLOGRAPHICALLY POLISHED | ||||||
| FK | 57.19 (6.67) a, c, B |
795.05 (78.18) a, B |
0.91 (0.17) a, B |
18797.58 (1406.55) a, A |
86.91 (10.86) a, B |
8.83 (0.94) a, B |
| SH | 59.69 (9.24) a, A |
668.62 (107.13) b, A |
0.46 (0.11) b, A |
27041.08 (2844.27) b, B |
80.17 (15.02) a, c, A |
10.80 (1.14) b, A |
| VE | 35.37 (9.82) b, B |
904.57 (262.69) a, B |
0.72 (0.36) a, b, B |
22914.60 (4691.69) b, A |
39.41 (11.97) b, B |
8.86 (1.93) a, B |
| TQ | 48.86 (10.30) c, B |
754.08 (205.63) a, b, B |
0.74 (0.32) a, b, B |
25507.03 (4202.46) b, B |
65.66 (17.61) c, B |
8.67 (0.98) a, B |
*Identical lowercase letters indicate mean values with no statistically significant differences among materials for each surface property within the same polishing condition, whereas identical uppercase letters indicate no significant differences between the two polishing conditions within the same material (p > 0.05).
Table 4.
Mean values and standard deviations (Mean (SD)) of contact angles, along with post hoc comparisons among material groups, after both manual and optimal metallographic polishing.
Table 4.
Mean values and standard deviations (Mean (SD)) of contact angles, along with post hoc comparisons among material groups, after both manual and optimal metallographic polishing.
| MATERIAL GROUP | Contact angle (o) Manually polished |
Contact angle (o) Metallographically polished |
|---|---|---|
| FK | 69.51 (1.87) a, A | 52.65 (1.80) a, B |
| SH | 75.75 (2.39) b, A | 53.02 (1.19) a, B |
| VE | 86.32 (1.23) c, A | 47.16 (1.80) b, B |
| TQ | 79.08 (1.96) d, A | 66.26 (1.06) c, B |
* Identical lowercase letters indicate mean values with no statistically significant differences in surface wettability among materials within the same polishing condition, while identical uppercase letters indicate no significant differences within the same material between the two polishing conditions (p > 0.05).
Disclaimer/Publisher’s Note: The statements, opinions and data contained in all publications are solely those of the individual author(s) and contributor(s) and not of MDPI and/or the editor(s). MDPI and/or the editor(s) disclaim responsibility for any injury to people or property resulting from any ideas, methods, instructions or products referred to in the content. |
© 2025 by the authors. Licensee MDPI, Basel, Switzerland. This article is an open access article distributed under the terms and conditions of the Creative Commons Attribution (CC BY) license (http://creativecommons.org/licenses/by/4.0/).
Copyright: This open access article is published under a Creative Commons CC BY 4.0 license, which permit the free download, distribution, and reuse, provided that the author and preprint are cited in any reuse.


