
Submitted:
06 August 2025
Posted:
07 August 2025
You are already at the latest version
Abstract
Compassion fatigue is a widely recognised phenomenon in human care settings, but it has been little explored in the veterinary field, despite sharing many of the same determinants. This study aimed to: (1) identify distinct emotional risk profiles in veterinarians based on their levels of compassion fatigue and satisfaction; (2) estimate the relative prevalence of compassion fatigue in each of these profiles; and (3) analyse the predictive value of sociodemographic variables (gender, age, cohabitation) on belonging to these profiles. A cross-sectional study was conducted with 135 practising veterinarians. An abbreviated version of the ProQOL scale, adapted to the animal context, was used. Its two-dimensional structure (compassion fatigue and satisfaction) was validated using confirmatory factor analysis. Hierarchical cluster and k-means analyses were performed on the factor scores, which identified four emotional profiles: (1) intense emotional involvement, (2) emotional detachment, (3) functional distancing, and (4) high emotional risk. The latter grouped 23% of the sample, while 50.4% presented significant levels of emotional exhaustion. Finally, an ordinal regression was applied, which showed that being over 44 years of age (OR = 2.11) and living with a partner (OR = 1.94) increase perceived emotional risk, with no significant effects of gender. The findings highlight the need to develop training strategies aimed at strengthening emotional regulation and communication skills with guardians or animal owners, as well as promoting more sustainable, ethical and emotionally healthy professional practice.
Keywords:
compassion fatigue
; veterinarians
; emotional profiles
; cluster analysis
; emotional regulation
; communication with animal guardians and owners
1. Introduction
Although the recognition of compassion fatigue (CF) has advanced in human care contexts, its presence in veterinary clinical practice remains a poorly explored phenomenon. This research poses three key questions to contribute to this gap: Is it possible to identify different profiles of emotional distress in veterinary professionals based on their levels of compassion fatigue and satisfaction? What is the relative prevalence of compassion fatigue in each of these profiles? What sociodemographic variables, such as gender, age or cohabitation, are significantly associated with belonging to these profiles? These questions are asked because we need to understand CF as a complex and diverse thing, which means we need to not only measure how common it is, but also figure out how it shows up and what factors are linked to it. This comprehensive approach helps us move towards more personalised and effective prevention, based on risk segmentation and tailoring interventions to the specific needs of vets.
1.1. Background
Compassion fatigue (CF) is a progressive state of emotional, physical and spiritual exhaustion that affects people who care for others, whether in professional or family contexts. It is related to prolonged exposure to the suffering and in ity of others and is intensified by persistent feelings of helplessness and frustration (Lynch & Lobo, 2012; Stamm, 2010).
This state does not arise suddenly but develops from specific conditions that constitute its essential attributes, around which there is reasonable consensus in the specialised literature. Firstly, CF requires sustained empathic engagement: the caregiver becomes emotionally involved in the other person’s experience, developing an affective connection that, although it constitutes the foundation of help, also becomes a potential source of attrition when maintained over time (Baqeas et al., 2021; Coetzee & Klopper, 2010; Ghafarzadegan et al., 2025).
Added to this is a frequent feeling of helplessness and frustration, especially when the available resources—technical, emotional or institutional—are insufficient to alleviate the suffering observed. Caregivers may come to feel that, despite their efforts, the other person’s distress persists or worsens, which undermines their perception of effectiveness and sense of purpose. A significant example of this experience is provided by the study by Upasen and Saengpanya (2021), which focused on family carers of people with schizophrenia. It documents how these carers express a recurring feeling of demoralisation, loss of motivation and hopelessness, especially in the face of recurring psychotic symptoms or the absence of clinical improvement. The authors point out that many of them feel unable to care for their family members adequately, which leads to anxiety and guilt, as a prelude to a pattern of cumulative emotional exhaustion that converges with the core symptoms of CF: burnout (BO) and secondary traumatic stress (STS) (Stamm, 2010).
Although the desire to help remains, there is a progressive loss of compassion: the professional or caregiver begins to disconnect emotionally as a form of self-protection, which can translate into avoidance, depersonalisation or affective indifference (Polachek and Wallace, 2018; Sinclair et al., 2017).
This condition is more likely to occur when work and emotional demands are not balanced by effective coping strategies or opportunities for rest and recovery, for which social and institutional support is essential (Smart et al., 2014).
Overall, CF emerges as the result of a cumulative process in which individual, relational and contextual factors combine to progressively undermine the caregiver’s ability to maintain healthy empathy.
1.2. Extension of the Study of Compassion Fatigue to the Veterinary Field
The application of this conceptual framework to veterinary work and animal care in general is still limited compared to its development in other care fields. However, both the evidence accumulated in recent years on the emotional distress of veterinarians and the specificity of the bond they develop with the animals they care for and with their owners or carers motivate this (Chan & Wong, 2023; Gordon et al., 2021; Rhodes et al., 2022; Tomasi et al., 2019).
A substantial part of emotional distress in veterinary practice has been associated with prolonged exposure to stressors characteristic of the clinical environment, many of which coincide with well-established histories of compassion fatigue (Kramper et al., 2023). These include euthanasia and providing appropriate support to both the animal and the owner (Cameron et al., 2025; Deponti et al., 2023), dealing with animals that are suffering or have been abused or abandoned (Musetti et al., 2020; Scotney et al., 2015; Williams et al., 2022), and managing clients in situations of loss or conflict (Vonk et al., 2022). Added to this is the ethical tension arising from the effort to balance animal welfare with the economic or emotional limitations of owners, which can lead to clinically undesirable decisions, such as postponing tests, applying treatments that are less effective than alternatives, or prolonging the animal’s suffering (Hill et al., 2020; Kogan & Rishniw, 2023; Kogan et al., 2020). This complexity is exacerbated by a professional culture that tends to repress emotional expression and by poor training in dealing with emotionally complex situations, which contributes to the isolation of professionals and limits their coping capacity (Matte et al., 2019; Morales Foster & Maples, 2025).
In summary, extending the study of compassion fatigue (CF) to veterinary clinical practice is not only justifiable but essential to highlight a phenomenon that is often ignored in animal care professions. Recognising the suffering that those who care for non-human beings may experience means legitimising their need for emotional and structural protection. This involves adopting strategies aimed at strengthening personal resources—such as emotional intelligence, effective communication, and self-compassion— (Holden et al., 2019; Ryan, 2022), along with organisational initiatives that foster emotionally safe environments and mutual support among colleagues (Marshman et al., 2021; Sosnicki & Reynolds, 2024).
However, moving towards a professional culture that is sensitive to the emotional impact of clinical work requires, first and foremost, an understanding of the magnitude of the problem. To this end, it is essential not only to estimate the prevalence of CF in the veterinary community, but also to identify those profiles with the highest vulnerability, which require specific prevention and support strategies.
1.3. Prevalence of Compassion Fatigue in Veterinarians
While recognising the risk of compassion fatigue (CF) in veterinarians is a first step towards addressing it, knowing its prevalence is essential to understanding the scale of the phenomenon. This knowledge not only enables us to assess its potential impact on the occupational health of the group, but also provides an empirical basis for prioritising resources and designing interventions proportionate to its frequency and severity.
Despite the relevance of the topic, the number of studies that have explicitly addressed the prevalence of CF in the veterinary field remains limited. Some recent studies have attempted to estimate it explicitly, although not exclusively, while others have addressed the issue in an exploratory or tangential manner, within the framework of broader research on the professional quality of life and mental health of people who work in direct contact with animals.
Among the studies that have explicitly addressed the prevalence of CF in veterinarians, three studies stand out that have used validated instruments, specifically the Professional Quality of Life (ProQOL) scale. In Canada, Best et al. (2020) and Perret et al. (2020) applied Stamm’s (2005) cut-off points, finding high prevalences of secondary traumatic stress (69.8% and 65.4%, respectively), and in the case of Perret, also burnout (41.7%) and compassion satisfaction (31.6%). Both studies, with large samples and homogeneous criteria, provide consistent data on the mental health of veterinarians in the Canadian context. In the US, Schlanser et al. (2021) explored this phenomenon in military veterinarians, obtaining responses on burnout and secondary stress that allow for an estimated prevalence of CF of 5.55%. This lower percentage, compared to that reported in the studies cited above, is possibly attributable to specific working conditions, such as specialised training or institutional cohesion.. Finally, the study by Pavan et al. (2020), although also aimed at estimating the prevalence of CF, used an ad hoc questionnaire within the framework of an organisational intervention. Its results—81.6% with symptoms compatible with CF and/or burnout (BO)—underline the practical usefulness of integrating the assessment of emotional distress into institutional strategies for improving well-being at work.
Beyond studies specifically focused on CF, most existing research addresses this phenomenon tangentially, as part of broader analyses of mental health or professional quality of life among those who work with animals. In Ireland, Hill et al. (2020) reported 86.8% secondary traumatic stress (STS) among veterinarians and technicians, although without distinguishing between the two groups. Dow et al. (2019), meanwhile, explored the relationship between working with bereaved clients and CF, observing moderate levels on the Compassion Fatigue Short Scale (CFSS), without applying cut-off points. In Australia, Rohlf et al. (2022) found 23.5% STS and 24.4% burnout (BO), percentages lower than those in the United States but relevant at the occupational level. In Hong Kong, Chan and Wong (2023b) reported low levels of BO (3.6%) and a total absence of STS, which contrasts with the results of the studies cited above. The authors themselves attribute these results to structural and cultural factors in the local veterinary context, such as commercial pressure, deteriorating client relationships, training deficits in emotional coping, and more inhibitory cultural styles, which could limit the observable expression of distress.
Finally, Young et al. (2024) found no elevated levels of compassion fatigue (CF) in a sample of research staff in the United States and Canada. However, they identified a significant association between low levels of compassion satisfaction (CS) and reduced intention to remain in the job, suggesting that CF may indirectly affect work commitment, even when not manifested intensely or explicitly.
In summary, the international studies reviewed show high variability in CF prevalence rates, influenced by methodological, contextual and professional differences. Despite this heterogeneity, consistent patterns are identified: the highest levels of emotional exhaustion are found in environments where contact with animal suffering is most intense and where there are deficiencies in psycho-emotional training or organisational support. These findings underscore the need to design preventive strategies tailored to the particularities of each work context, integrating both the assessment of staff emotional well-being and the improvement of their working conditions.
In the Spanish context, to our knowledge, only two studies have empirically explored the professional quality of life of veterinarians, including relevant data—although not always explicit—on the prevalence of CF. The study by Macià et al. (2022), based on a large sample of 602 practising veterinarians, used the ProQOL scale and obtained the following results: 4.3% of participants had high STS scores and 2% had high BO scores. Similarly, 20% scored high on CS, while 6.3% scored low, which can be interpreted as an additional risk indicator. Multivariate analysis showed that mental well-being levels, perceived emotional support and salary level were significantly associated with the ProQOL dimensions. In addition, high rates of psychotherapy and anxiolytic use were observed, higher than those of the general population, as well as a notable proportion of medium or high risk in alcohol consumption. These data reinforce the need to consider the mental health of the veterinary community as a priority in prevention policies.
For their part, the study by Goñi-Balentziaga and Azkona (2024), with a smaller sample (80 workers in biomedical research facilities with animals), also used the ProQOL, but did not apply cut-off points to obtain a classification by levels of its dimensions. Even so, the results allow certain risk profiles to be identified. High STS was concentrated among those who worked with farm animals as part of experimental models, while BO was low in almost half of the sample. Mental well-being was positively associated with CS and negatively with BO and STS. In addition, the type of animal worked with seemed to modulate the empathic experience: for example, professionals who cared for primates or small carnivores reported higher levels of emotional understanding and human-animal interaction. The prevalence of psychological treatment (16.3%) and psychotropic medication use (18.8%) was higher than the national average, and those undergoing treatment had poorer mental health and greater emotional exhaustion.
Both studies agree that mental well-being and available psychosocial resources (such as emotional support, coping training and alignment between personal values and professional goals) act as key modulating factors or h . Although only one of them—that of Macià et al. (2022)—provides data broken down according to the ProQOL cut-off points, both contribute to highlighting the emotional burden inherent in working with animals, underscoring the need for a comprehensive preventive approach.
Compared to studies conducted in other countries, these offer more modest results in terms of the prevalence of CF. This disparity could be attributed, at least in part, to differences in the care context, the availability of psychosocial resources or institutional support systems. Despite this, all the studies considered agree that a significant proportion of the group show indicators of psychological distress that require attention. This convergence highlights the need to promote prevention policies tailored to each environment, without losing sight of the structural and cultural factors that can modulate the expression of CF.
1.4. Sociodemographic Variables and Their Potential for Identifying Risk Profiles in Compassion Fatigue
Based on this premise, the present study aims not only to estimate the prevalence of compassion fatigue (CF) in practising veterinarians, but also to examine whether certain sociodemographic characteristics—such as gender, age, and cohabitation— act as significant predictors of perceived emotional risk.
With regard to gender, several studies suggest that female veterinarians tend to report higher levels of burnout (BO) and secondary traumatic stress (STS), although these associations are usually limited to the descriptive level and do not always reach statistical significance in predictive models (Best et al., 2020; Wolf et al., 2024; Young et al., 2024). Other studies have found no significant relationships between gender and CF (Perret et al., 2020; Rohlf et al., 2022; Schlanser et al., 2021). However, it has been suggested that gender differences in emotional expression, caregiving roles, or empathy could explain the greater affective burden perceived by women in professional practice (Dow et al., 2019).
About age, it should be noted that the results of most of the studies reviewed show that this is a consistent predictor, with younger professionals having higher levels of BO and STS, as well as lower satisfaction (Best et al., 2020; Dow et al., 2019; Pavan et al., 2020; Perret et al., 2020). This inverse relationship could be attributed to less experience in dealing with animal suffering or to a possible self-selection effect, resulting from those who cannot adequately tolerate the emotional burden leaving the sector. Some studies have observed a weak positive association between older age and lower CF (Andrukonis et al., 2020), while others report no statistically significant links (Rohlf et al., 2022; Macià et al., 2022).
Regarding cohabitation, the few studies that address this issue suggest that this situation could have a protective effect against general psychological distress (Reif-Stice et al., 2023), although not necessarily against CF (Dow et al., 2019; Goñi-Balentziaga & Azkona, 2024).
Based on the above, we could say that the predictive value of these variables is relative and could depend on their interaction with other personal and contextual variables, which seem to offer a greater explanatory capacity for the emotional distress of veterinarians (Rohlf et al., 2022; Young et al., 2024). However, this does not mean that they should be dismissed, but rather that the focus should be placed on analysing their role within more comprehensive approaches.
To move in this direction, it is necessary to adopt analytical strategies that capture the complexity of these professionals’ emotional experiences. Exploring different risk configurations based on combined scores for compassion fatigue and compassion satisfaction could be a good start, as it is not uncommon to experience both at the same time (Figley, 2002; Mathieu, 2012; Wolf et al., 2024).
Despite its clinical relevance, there is little evidence for this perspective in the veterinary field, although it does exist in other healthcare contexts (Kim et al., 2019; Zerach and Shaley, 2015). Beyond the study by Rohlf et al. (2022), which emphasises the potential of cluster analysis to segment the professional population. Considering levels of exhaustion and satisfaction together would allow us to identify different personal trajectories—some of them paradoxical or contradictory—that conventional models tend to obscure. Techniques such as cluster analysis, latent class models, and semantic networks offer valuable tools for defining more accurate profiles and, consequently, designing prevention and support interventions that are better adapted to the reality experienced by veterinarians.
1.5. Objectives
Based on the background information presented above, this study has three main objectives. First, to identify risk profiles for compassion fatigue using cluster analysis techniques applied to factor scores on the fatigue and compassion satisfaction dimensions of the ProQOL scale. Second, to estimate the relative prevalence of compassion fatigue based on the profiles identified. Thirdly, to analyse the predictive value of sociodemographic variables—gender, age and cohabitation—on belonging to different risk profiles, using an ordinal regression model.
From a theoretical perspective, achieving these objectives will consolidate the conceptualisation of compassion fatigue as a phenomenon applicable to the veterinary field by providing empirical evidence on its structure, prevalence and correlates. Likewise, the two-factor factorial analysis that groups burnout and secondary trauma into a common dimension of distress could support an adaptation of the ProQOL model to the specific context of clinical work with animals.
On a practical level, the identification of risk profiles will help to highlight an emotional problem that is often overlooked in the veterinary profession and will provide useful data for the design of organisational interventions aimed at emotional care. In addition, it will allow for a more efficient allocation of preventive resources, prioritising the most vulnerable subgroups and adapting strategies to their specific needs.
Overall, this study aims to be a first step towards building a professional culture that is more aware of the emotional self-care of those who care for others. Recognising this psychological strain will not only promote the well-being of professionals, but also a more ethical, compassionate and sustainable veterinary practice.
2. Materials and Methods
2.1. Study Design
A cross-sectional analytical study was conducted to identify different profiles of emotional distress in practising veterinarians. Based on these profiles, the relative prevalence of compassion fatigue in the sample was estimated, as well as the degree of satisfaction derived from professional practice. Finally, the sociodemographic factors associated with greater emotional risk were analysed with the aim of contributing to the detection of particularly vulnerable groups. The design incorporated various multivariate techniques that allowed for a comprehensive and integrated approach to the phenomenon under study.
2.2. Participants and Inclusion Criteria
The reference population consisted of veterinarians registered in Spain in 2024, estimated at 35,350, according to data from the National Institute of Statistics (INE, 2025). The final sample consisted of 135 people who met the following inclusion criteria: (a) being actively employed at the time of the research; (b) working in a veterinary clinic or service, maintaining direct contact with animals and their owners; and (c) not currently undergoing psychological or psychiatric treatment or having done so in the previous twelve months. Those who did not meet any of these criteria were excluded from the study.
2.3. Sample Size and Statistical Accuracy
The minimum sample size required to estimate a mean with an acceptable margin of error was calculated using the total number of registered veterinarians in Spain in 2024 (N = 35,350) as the reference population. Considering a standard deviation of 8 points on the ProQOL subscales —estimated value in previous studies with the Spanish veterinary population (Macía et al., 2022)—, a confidence level of 95% (Z = 1.96) and a margin of error of± 2 points, the formula for finite populations was applied, obtaining a minimum sample size of 61 participants.
In addition to this initial calculation, the requirements associated with the statistical analyses planned in the study were considered: confirmatory factor analysis (CFA), cluster analysis using K-means and ordinal regression with three dichotomous predictors. For this purpose, G*Power software (Faul et al., 2009) was used to estimate the minimum sample size required for each procedure.
First, the sample size required to perform an CFA with a two-factor structure and 11 items was estimated using the chi-square goodness-of-fit test, assuming 43 degrees of freedom, a moderate effect size (w = 0.30), α = .05, and a statistical power of 90%. Under these parameters, a minimum sample size of 129 participants was obtained.
Secondly, for cluster analysis using K-means, the methodological recommendations advising at least 20 to 30 subjects per expected group were followed (Dolnicar, 2002). Given that the model identified four clusters, the recommended minimum size would be approximately 120 participants. This estimate was corroborated by a priori power analysis for a one-way ANOVA with four groups, a moderate effect size (f = 0.40), α = .05, and power = .90, which yielded a minimum sample size of 116 participants.
Third, the size needed to perform an ordinal regression with three dichotomous predictors was estimated indirectly using the logistic regression option in G*Power. Assuming a moderate effect size (OR = 2.0), α = .05, power = .90, and low collinearity between predictors (R² = .10), a minimum sample size of 123 participants was obtained.
Overall, and considering the most conservative approach, it is concluded that the minimum sample size recommended to ensure adequate statistical power and reliability of the results is at least 129 participants. This figure allows the analytical objectives of the study to be addressed with confidence and supports the validity of the conclusions drawn.
Additionally, the sampling error associated with the prevalence rates of burnout (2%) and secondary traumatic stress (4.3%) found by Macía et al. (2022) in the Spanish veterinary population was estimated. For a sample of 135 subjects and a confidence level of 95%, the margins of error were 2.36% (± ) and 3.42% (± ), respectively. These values indicate an adequate level of statistical accuracy for making preliminary estimates about the distribution of these phenomena in the target population, as well as for exploring their association with sociodemographic variables. The distributions of these variables in the sample are presented in the following table.

Table 1.
Demographic characteristics of the sample.
| Variable | Categories | Frequency | Percentage |
| Gender | Male | 89 | 65.9 |
| Female | 45 | 33.3 | |
| Prefer not to answer | 1 | 0.8 | |
| Age | 25–34 | 40 | 29.6 |
| 35–44 | 43 | 31.9 | |
| 45–54 | 35 | 25.9 | |
| Over 54 | 17 | 12.6 | |
| Marital status | Married/in a relationship | 86 | 63.7 |
| Single | 41 | 30.4 | |
| Divorced | 8 | 5.9 |
It should be noted, based on INE data (2025), that the distribution by sex in the sample (65.9% women) is close to the proportion recorded at the national level in the veterinary profession (69.4%), without this being considered a significant overrepresentation in terms of the sample.
With regard to the age variable, professionals aged ≤ 44 years are overrepresented (61.5%) compared to the national distribution of registered veterinarians (45.4%). This deviation could be attributed to the greater reliance on digital channels for disseminating the questionnaire or to a potential age-related participation bias
Concerning cohabitation, 63.7% of participants were in this situation, a proportion very close to that observed in the general Spanish population (61.2%), according to Study No. 3501 of the CIS (2025). Therefore, no significant deviations that compromise the representativeness of this variable were observed.
2.4. Sampling Procedure and Data Collection
A non-probabilistic, intentional and convenience sampling procedure was used. Participants were recruited by sending an invitation letter to various veterinary clinics and services distributed across different autonomous communities. This letter explained the objectives of the study and requested the collaboration of the entities in disseminating the link to the survey among their staff.
The questionnaire was available in electronic format via Google Forms during March and April 2024. Participation was voluntary, anonymous and unpaid. Prior to the start of the survey, informed consent was requested through an explicit statement informing participants of the objectives of the study, the confidential nature of the data, and the impossibility of withdrawing their responses once submitted, given the anonymous nature of the form. In addition to the institutional channel, the survey was disseminated through professional social networks, official veterinary associations, and sectoral organisations, with the aim of achieving greater geographical and functional diversity among participating professionals.
2.5. Instruments
The survey used in the study consisted of the following sections:
Socio-demographic variables: Information was collected on gender, age and marital status/cohabitation with a partner.
Professional Quality of Life Scale (ProQOL): The ProQOL 5 version (Stamm, 2010) was used, which is publicly available in Spanish at the following web address: https://proqol.org/proqol-measurede. This scale consists of 30 items scored on a six-point Likert scale (0 = never; 5 = always). It assesses two main dimensions: compassion satisfaction (CS) and compassion fatigue (CF), the latter being subdivided into burnout (BO) and secondary traumatic stress (STS).
The wording of some items was specifically adapted to the field of animal care. Specifically, the term “people” was replaced by “animals” in items 2, 4, 6, 8 and 20; the word “people” was replaced by “animals” in items 3, 12 and 23; and the term “someone” was replaced by “animal” in item 14. Likewise, in item 9, the word “animals” was added to transform the noun pronoun “those” into an explicit demonstrative determiner. The structural validity of these adaptations was empirically verified through a confirmatory factor analysis (CFA), the results of which supported that the modifications did not alter the factorial configuration of the instrument. Subsequently, a new CFA was performed on an abbreviated version of 11 items selected based on their factor loading and semantic redundancy. This two-dimensional model —composed of the CF and CS dimensions—showed acceptable psychometric indicators of fit and internal consistency, allowing it to be used as the basis for subsequent analyses.
Open comment: The survey closed with an open question designed to gather impressions, feelings or concerns related to the professional experience of the respondents. The responses obtained were analysed using content analysis, semantic networks and sentiment analysis techniques. This complementary qualitative analysis made it possible to identify thematic categories of emotional distress, explore their co-occurrence and estimate associations with sociodemographic variables and CF levels, with the aim of enriching the understanding of the phenomenon from the direct narrative of the participants.
2.6. Data Analysis
To address the objectives set, a sequential analytical strategy was designed, integrating both quantitative and qualitative techniques to characterise emotional risk profiles among veterinarians and to explore their underlying determinants.
2.6.1. Quantitative Analysis
All analyses of this type were performed using SPSS (v. 29.01.0), R (lavaan, cluster, ordinal, car, MASS, qreg packages) and JASP (for AFC) software, with a significance level set at p < .05.
First, an examination of missing values was performed. Cases with more than 10% omissions in the core items of ProQOL were excluded, retaining those with complete data in the main variables. The pattern of missing data was evaluated using Little’s MCAR test, with no evidence of systematic bias. Given the low volume and random nature of the omissions, no imputation techniques were applied.
The structural validity of the ProQOL scale was assessed using confirmatory factor analysis (CFA), which did not show an adequate fit for the original structure. Based on exploratory factor analysis (EFA) and a second CFA, a two-dimensional solution was identified—Compassion Fatigue (CF) and Compassion Satisfaction (CS)—which allowed standardised factor scores to be calculated for subsequent analyses.
Based on these scores, hierarchical and non-hierarchical (K-means) cluster analyses were performed to identify distinct emotional profiles. The robustness of the segmentation was assessed using stability indices (Jaccard), discriminant analysis, silhouette indices, and contrasts using GLM models.
The prevalence of CF was estimated based on the profiles obtained, differentiating between high-risk configurations—characterised by high CF and low CS—and moderate distress profiles with high levels of satisfaction, allowing for the adjustment of clinical interpretation and the refinement of preventive recommendations.
Finally, an ordinal regression model (cumulative logit) was applied to examine the predictive value of sociodemographic variables (gender, dichotomised age, cohabitation) on belonging to the identified emotional profiles.
2.6.2. Qualitative Analyses
To complement the quantitative analyses, the participants’ open comments (n = 31) were examined using inductive categorical content analysis. After segmenting the responses into minimal units of meaning, they were coded into thematic categories through a double process of independent coding and consensus resolution. The agreed categories were treated as dichotomous variables (presence/absence) per participant.
Thematic coincidence indices between pairs of categories were calculated using the Jaccard coefficient, which allowed a semantic network of discomforts to be represented graphically using the ForceAtlas2 algorithm (Gephi) and networkx (Python).
A sentiment analysis was also performed using automated lexicographic techniques (syuzhet package, R), using the NRC dictionary adapted to Spanish. Emotions were classified according to Plutchik’s model (1980), differentiating between negative emotions (anger, fear, sadness, disgust) and positive emotions (joy, confidence, anticipation, surprise), as well as general dimensions of affective valence.
Finally, ordinal and binary logistic regression models were estimated to explore the relationship between the number or type of verbalised discomforts, sociodemographic variables and emotional risk profiles. The total number of negative categories mentioned was used as the ordinal dependent variable, interpreted as an indicator of the accumulation of discomforts.
3. Results
3.1. Factor Analysis of the ProQOL Scale
After confirming, through confirmatory factor analysis (CFA), that the original three-factor structure of the ProQOL (Stamm, 2010) did not fit the data from this sample of veterinarians, exploratory factor analysis (EFA) was performed. This analysis revealed a two-dimensional empirical solution, one associated with compassion fatigue (CF) and the other linked to compassion satisfaction (CS).
Based on this exploratory solution, an CFA was carried out specifying a structure of two correlated factors, out of a total of 11 items: six corresponding to the CF factor (items 7-11, item 14 and item 19) and five to the CS factor (items 16, 18, 20, 27 and 30). The model presented an acceptable overall fit: χ²(43) = 122.214, p < .001; CFI = .888; TLI = .857; RMSEA = .117 [90% CI: .093–.141]; SRMR = .080. Although the RMSEA exceeds the conventional threshold of .08, the remaining indicators support sufficient model adequacy, considering the small number of items per factor and the sample size (N = 135).
The standardised factor loadings are presented in Table 2. The items of the CF factor showed saturations ranging from .559 to .873, while those of the CS factor ranged from .450 to .873. All items achieved values above the recommended minimum threshold of .45, which supports their factor validity. In addition, a significant negative covariance was observed between the two factors (r = –.285, p = .012), suggesting that they represent moderately opposite but related dimensions of the emotional impact of veterinary work: one focused on emotional exhaustion and the other on professional gratification.
Table 2.
Content and standardised factor loadings.
| Factors | Items (Original Scale Number) | Title 4 |
| Compassion fatigue | I lose sleep because of the traumatic experiences of the animals I have helped (8). | .873 |
| I believe that I have been negatively affected by the traumatic experiences of the animals I have helped (9). | .873 | |
| Because of my profession, I feel like I am at my limit in several areas (11). | .727 | |
| I feel as if I am the one experiencing the trauma of an animal I have helped (14). | .715 | |
| Because of my job, I feel exhausted (19). | .594 | |
| I find it difficult to separate my personal life from my professional life (7). | .559 | |
| Satisfaction through compassion | My work makes me feel satisfied (18). | .873 |
| I am happy that I chose to do this job (30). | .818 | |
| I am satisfied with how I am able to keep up to date with veterinary care techniques and procedures (16). | .692 | |
| I have positive thoughts about the animals I have helped and how I have been able to help them (20). | .658 | |
| I consider myself to be a good professional (27). | .450 |
In order to evaluate the psychometric quality of the two dimensions extracted, internal reliability and construct validity indicators were analysed. Internal reliability was estimated using Cronbach’s alpha and total omega coefficients. Likewise, the average extracted variance (AVE) and composite reliability were calculated to assess convergent validity, as well as Fornell and Larcker’s (1981) criterion to examine discriminant validity.
Both subscales showed high internal consistency. Cronbach’s alpha was .87 for CF and .83 for CS, while the total omega coefficients reached values of .92 and .87, respectively. In addition, the hierarchical omega was .74 for CF and .73 for CS, which would indicate, in principle, that a substantial proportion of the variance in the scores could be attributed to an underlying general factor.
Consequently, a general two-factor model was evaluated, in which all items loaded simultaneously on a general factor (representative of the emotional impact of veterinary work) and on their respective specific factors (fatigue and satisfaction with compassion). The fit and reliability coefficients obtained were lower than those of the two-correlated factors model. Therefore, the shared variance between items is attributed to a greater extent to specific factors (CF and CS), thus ruling out the existence of a general factor dominating the structure.
In terms of convergent validity, the AVE values were adequate in both cases (AVE = .54 for CF and .53 for CS), exceeding the recommended minimum threshold of .50. Discriminant validity was also supported, as the square root of the AVE for both factors (.737 for CF and .725 for CS) was higher than the correlation between the factors (r = –.285), thus meeting the criterion of Fornell and Larcker (1981).
3.2. Cluster Analysis
3.2.1. Identification of Clusters
For exploratory purposes, a hierarchical cluster analysis was applied to the factor scores for fatigue and compassion satisfaction, using the average linkage method and rescaled Euclidean distance. The dendrogram obtained suggested a solution of four clusters, based on the distance between mergers and the internal h l stability of the groupings. Although this is not presented here for reasons of brevity, the hierarchical structure served as a starting point for refining the segmentation using k-means analysis.
As a measure of the fidelity of the dendrogram, the cophenetic coefficient was calculated, which reached a value of 0.662. This result indicates a moderate fit between the actual distances in the dataset and its hierarchical representation, lower than would be expected in highly structured solutions (i.e., > 0.85). In light of this result, it was deemed appropriate to employ alternative clustering methods, such as k-means analysis, which offer a classification more closely aligned with the latent characteristics of the dataset and facilitate subsequent comparisons with external variables or clinical indicators (Sokal & Rohlf, 1962; Everitt et al., 2011)
K-means cluster analysis identified four distinct profiles based on factor scores for fatigue and compassion satisfaction. Figure 1 graphically represents the typified averages of each cluster in the two dimensions evaluated, facilitating the visualisation of their distinct emotional profiles.
Cluster 1 (n = 37; 27.4%) was characterised by above-average scores in both satisfaction and compassion fatigue, suggesting a profile of intense emotional involvement. This group could represent professionals who are highly committed to their work and experience strong gratification in their care work, but at the cost of significant emotional exhaustion. This is an ambivalent pattern, in which a positive work experience coexists with high exposure to the emotional cost of care.
Cluster 2 (n = 36; 26.7%) showed low scores on both dimensions, consistent with a profile of emotional detachment. Cluster 3 (n = 31; 23%) showed low compassion fatigue and moderate compassion satisfaction. This profile reflects a group of professionals who show no obvious signs of emotional exhaustion, but whose satisfaction derived from caregiving does not reach high levels. In other words, they are not burnt out, but neither are they highly gratified. This could be due to a certain functional detachment or a more instrumental than vocational form of professional involvement.
Finally, Cluster 4 (n = 31; 23%) combined high fatigue with low satisfaction, which constitutes a High Emotional Risk profile. The differences between clusters were statistically significant for both dimensions (p < .001), although it should be remembered that the F tests are merely descriptive in this context.
Figure 2 shows the assignment of individuals to each of the four clusters, represented according to their factor scores. The delimitation of the areas allows us to observe the distribution and relative overlap between groups.
Cluster analysis of the factor scores for compassion fatigue revealed that 23% of participants (Cluster 4) had a high level of fatigue, indicative of a high emotional risk profile. If the group with moderately high scores (Cluster 1) is also included, the combined prevalence rises to 50.4%, suggesting that approximately half of the sample shows significant signs of emotional strain associated with professional performance.
3.2.2. Validation and Robustness of the Cluster Solution
To examine the stability of the classification obtained, the resampling procedure with replacement (cluster boot) was applied to the K-means analysis, calculating the Jaccard index for each cluster. The results showed acceptable stability in Cluster 1 (J = 0.69), but lower levels in the remaining clusters: Cluster 2 (J = 0.51), Cluster 3 (J = 0.34) and Cluster 4 (J = 0.52). These values indicate that, although the four-cluster solution captures distinct profiles, some have a more unstable configuration, possibly affected by overlaps or small sizes.
In addition, the discriminatory capacity of the variables used in the classification was evaluated. Analysis of variance (ANOVA) indicated statistically significant differences between the four clusters in both fatigue and compassion satisfaction. In the case of fatigue, F(3, 131) = 97.01, p < .001, with an explained variance of 69%. For compassion satisfaction, F(3, 131) = 84.89, p < .001, with 66% of the variance explained. These results support the internal validity of the cluster model, showing that the selected variables contribute significantly to distinguishing between the identified profiles.
The graphical representation of the average profiles (standardised means of each variable per cluster) showed patterns consistent with the theoretical interpretation presented above. Cluster 1 groups highly committed but emotionally exhausted professionals; Cluster 2 shows generalised emotional detachment; Cluster 3 approaches functional distancing with low fatigue and moderate satisfaction; and Cluster 4 reflects a pattern of high emotional risk, with low gratification and high exhaustion (cf. Figure 3).
To assess the quality of the four-cluster solution obtained through K-means analysis, the silhouette index was calculated for each case, as well as the mean value for the entire structure. The mean value obtained was 0.51, indicating a reasonably well-defined cluster configuration, although not excellent (Kaufman & Rousseeuw, 1990). This result suggests that, on average, individuals are closer to members of their own cluster than to those of other clusters, which supports the internal coherence of the grouping.
The graphical analysis (cf. Figure 4) showed that the four clusters were similar in size (between 31 and 36 individuals) and that their average silhouette indices ranged from 0.49 (cluster 1) to 0.53 (cluster 4). None of the groups had clearly negative values or values close to zero, indicating that no clearly incorrect assignments were detected. Cluster 4 showed the highest degree of internal cohesion (average index = 0.53), while cluster 1 had the lowest relative cohesion (0.49), although still within an acceptable range.
Overall, these results suggest that the four-group solution presents an interpretable structure that is suitable for segmenting the emotional profiles of veterinarians. This segmentation provides a solid basis for further analysis of differences and relationships with other variables.
3.2.3. Discriminant Analysis
A linear discriminant analysis was performed to determine whether the standardised scores for fatigue (ZCF) and compassion satisfaction (ZCS) could reliably discriminate between the four emotional profiles previously identified through cluster analysis. The dependent variable was membership of one of the four emotional risk groups: very low, low-moderate, moderate-high and very high. Equal prior probabilities were assumed across groups, and the within-group covariance matrix was used.
The test of homogeneity of the covariance matrices (Box’s M) was not significant (F = 1.065; p = .311), which supports the validity of the linear model under the assumption of equal covariances between groups. The analysis generated three discriminant functions, of which only the first reached statistical significance (Wilks’ Λ = 0.250; χ²(6) = 165.51; p < .001), explaining 89.3% of the total variance. The second and third functions were not significant (p = .454 and p = .963, respectively).
The first discriminant function, with a canonical correlation of 0.798, showed a strong separating power between the groups, being mainly determined by compassion fatigue (structural coefficient = 0.948), while compassion satisfaction contributed secondarily and inversely (structural coefficient = –0.284). This pattern suggests that high levels of fatigue and low levels of compassion satisfaction characterise the profiles with the highest emotional risk.
The analysis of the centroids showed a clear progression throughout the first function: the very low-risk group had the most negative value (–2.531), followed by the low-moderate (–0.793), the moderate-high (1.144) and, finally, the very high-risk group (2.180). This distribution indicates that the function effectively discriminates in the direction of increasing emotional risk.
The correct classification rate reached 88.1% in the original sample and remained high after applying cross-validation using the leave-one-out procedure (87.4%). In both cases, the classification was particularly accurate in the extreme groups: the very low-risk group was correctly classified in 96.3% of cases, and the very high-risk group in 93.5%. The intermediate groups also showed satisfactory classification rates (group 2: 79.4%; group 3: 83.3%).
These results show that the combination of ZCF and ZCS effectively discriminates between different levels of emotional risk. Compassion fatigue, in particular, emerges as the most powerful predictor in the discriminant structure, while compassion satisfaction provides a complementary nuance. The high classification rate empirically validates the previously identified cluster structure and suggests that these two dimensions can be used for diagnostic or screening purposes in professional populations at risk of emotional burnout.
3.2.4. GLM of Differences Between Clusters
A general linear multivariate analysis (GLM) was conducted to examine whether there were significant differences in compassion fatigue (CF) levels based on the emotional profiles identified by cluster analysis, controlling for the effect of sociodemographic variables: gender, dichotomous age, and cohabitation. The compassion fatigue score was introduced as a continuous dependent variable, derived from confirmatory factor analysis, and therefore conceptually appropriate for the use of GLM models.
The results of the model indicated a significant main effect of the cluster factor on compassion fatigue, even after controlling for covariates (F(3,127) = 125.24, p < .001, partial η² = .747), implying a very high effect size. The sociodemographic covariates did not reach individual statistical significance, although cohabitation showed a marginal trend (p = .064, partial η² = .027), suggesting a possible weak moderating influence on fatigue levels.
The Levene test was significant for the CF variable (F(3,130) = 2.690, p = .049), indicating some heterogeneity of variances. However, given the relatively balanced sample size per group, the interpretation based on post hoc comparisons with Sidak correction was maintained.
The estimated marginal means (adjusted for age, sex, and partner) revealed clear differences between profiles, as shown in Table 3 and graphically represented in Figure 5, allowing for a more accurate observation of the magnitude of the differences while controlling for covariates.
All pairwise comparisons between clusters were statistically significant (p<.001), with large differences between cluster 4 and the rest. The following table shows the adjusted mean differences in CF between clusters.
Table 4.
Adjusted mean differences between clusters in compassion fatigue1.
| Comparison | Difference in Means | 95% CI |
| Cluster 1 vs 2 | 0.645 | (0.316 – 0.974) |
| Cluster 1 vs 3 | 1.387 | (1.048 – 1.726) |
| Cluster 1 vs 4 | –1.137 | (–1,478 – –0.796) |
| Cluster 2 vs 3 | 0 | (0.395 – 1.089) |
| Cluster 2 vs 4 | –1.782 | (–2.134 – –1.429) |
| Cluster 3 vs 4 | –2.524 | (–2,886 – –2,162) |
1 All comparisons were significant (p<.001).
Overall, the results confirm that differences in compassion fatigue between the identified emotional profiles cannot be attributed to age, gender or marital status. These differences remain robust even when controlling for individual variability in these covariates, reinforcing the validity of emotional typology as a differentiating criterion in fatigue risk.
3.3. Prevalence Estimation According to Risk Profiles
Based on the four-cluster solution obtained through K-means analysis, the relative prevalence of compassion fatigue (CF) was estimated in the sample analysed. Cluster 4, characterised by high levels of fatigue and very low compassion satisfaction, was interpreted as a high emotional risk profile. This group represented 23% of the sample, allowing us to establish a first empirical estimate of the prevalence of CF in this professional group.
However, if a more inclusive perspective is adopted, also considering Cluster 1—professionals with moderately high fatigue but accompanied by high levels of satisfaction—the proportion of participants with a potentially relevant emotional burden rises to 50.4%. This figure suggests that half of the veterinarians evaluated experience, to a greater or lesser extent, signs compatible with emotional exhaustion derived from healthcare work.
This estimation strategy is methodologically consistent with the general approach of the study, in that it is based on empirically identified latent profiles rather than arbitrary cut-off points. Furthermore, it allows us to distinguish between cases of high fatigue with low emotional reward (clinically more vulnerable profile) and those in which the distress is partially offset by high job satisfaction (ambivalent but functional profile).
Overall, the estimated prevalence provides a solid empirical basis for quantifying the magnitude of the phenomenon in this group and reinforces the relevance of using cluster analysis as a tool for the early detection of at-risk profiles.
3.4. Predictive Value of Sociodemographic Variables: Ordinal Regression Model
In order to examine the extent to which the sociodemographic variables recorded predict perceived emotional risk, an ordinal regression analysis was carried out. The dependent variable was membership of one of the four profiles previously identified and ranked hierarchically according to perceived emotional severity. This order simultaneously considered the factor score for compassion fatigue (CF) and the level of compassion satisfaction (CS), establishing the following gradation: (1) functional detachment, (2) emotional disengagement, (3) intense emotional involvement, and (4) high emotional risk.
The PLUM (Polytomous Universal Model) procedure was applied with a cumulative logit link function, assuming the proportional odds assumption was met. The predictor variables were gender (0 = male, 1 = female), dichotomised age (0 = ≤ 44 years, 1 = > 44 years) and cohabitation (0 = no, 1 = yes). The reference category was the profile with the lowest emotional severity (functional distancing).
Initially, a complete model was estimated that included all first-, second- and third-order interactions between the predictor variables. However, this model was not significant (χ² = 32.038; gl = 21; p = .058), so a more parsimonious model focusing on the main effects was chosen.
The final model showed an adequate fit (χ² = 15.963; gl = 3; p = .001), with moderate explanatory power according to the pseudo-R² coefficients: Cox and Snell = .113, Nagelkerke = .125, and McFadden = .047. Likewise, the parallel lines test was not significant (χ² = 9.707; gl = 6; p = .137), confirming the validity of the odds proportionality assumption and justifying the use of the ordinal model.
In terms of individual effects, gender did not reach statistical significance (B = 0.169; p = .518; OR = 1.184), suggesting that there is no clear difference between men and women in the risk of belonging to more severe emotional profiles. On the contrary, age and cohabitation were significantly associated with this risk. Specifically, participants over 44 years of age were more than twice as likely to belong to profiles of greater emotional severity (B = 0.744; p = .011; OR = 2.105), as were those who lived with their partner (B = 0.662; p = .023; OR = 1.938). The model coefficients, together with their 95% confidence intervals, are presented in Table 5.
3.5. Qualitative Analysis of Open Comments
The open comments provided by participants at the end of the questionnaire (n = 31) generated a total of 54 units of analysis, as several of them expressed more than one form of distress. Through an inductive categorical analysis of multiple responses, these units were classified into six main thematic categories.
The most frequent category was lack of professional recognition, mentioned in 31.5% of responses, representing 54.8% of participants. This was followed by conflicts with owners (27.8% responses; 48.4% of cases) and work overload (20.4% and 35.5%, respectively). Humiliating treatment was identified in 11.1% of responses (19.4%), while vocational dissatisfaction appeared in 7.4% of units (12.9%). Finally, there was an isolated mention of suicidal ideation (1.9%; 3.2%), a category which, although rare, is of particular clinical seriousness and relevance to occupational mental health.
Given that this is a multiple-response analysis, the cumulative percentages exceed 100% (174.2%), indicating that a significant proportion of participants reported distress in more than one category. This pattern of concurrence allows for a more nuanced and rich understanding of the experiences of professional distress in the group analysed.
To explore the relationships between these categories, a semantic network of co-occurrences was constructed using the Jaccard similarity coefficient as a measure of thematic proximity. Figure 6 shows this network, in which each node represents a category of discomfort, and each edge indicates the strength of overlap between two categories, according to the value of the Jaccard coefficient. The higher this value, the more frequently both categories are mentioned together by participants.
The numerical values next to each node do not indicate its absolute frequency, but rather its weighted degree, i.e., the sum of the similarity coefficients with the other categories in the network. This measure makes it possible to identify which categories play a more central or articulating role in the discourse of discomfort. In this sense, lack of recognition stands out as the most central node (weighted degree = 0.992), followed by conflicts with owners (0.852), work overload (0.787) and humiliating treatment (0.597). These four categories form a dense relational core that predominantly structures the narratives of discontent.
In contrast, vocational satisfaction, with a weighted score of 0.106, appears in a peripheral position, weakly connected to the rest of the network, suggesting that positive or resilient content is rarely expressed in conjunction with explicit forms of distress. The category of suicidal ideation, although not shown in the figure due to its low connectivity, did not occur in conjunction with any other label, reinforcing its isolated nature and suggesting a specific vulnerability profile.
Sentiment analysis, carried out using the NRC Emotion Lexicon adapted to Spanish, confirmed the predominance of negative emotions in the collected discourses. The most frequent were anger, sadness and disgust, followed by fear. In contrast, positive emotions such as joy, confidence or anticipation were rarely mentioned. This affective pattern reinforces the interpretation of the comments as expressions of accumulated distress, professional discontent and emotional exhaustion.
From an explanatory perspective, the relationship between sociodemographic variables and the degree of verbalised distress was explored. The ordinal regression model showed that age was a significant predictor of the number of categories of distress expressed (χ² = 8.235; p = .004), with a higher accumulation in professionals aged 44 years or younger (B = 2.485; 95% CI = 0.788–4.181). Living with a partner had a marginally significant effect (χ² = 3.844; p = .050), with a negative association (B = –1.585; 95% CI = –3.169 to –0.001), suggesting that those who do not live with a partner tend to verbalise a greater number of discomforts. Gender was not found to be a significant predictor (χ² = 0.472; p = .492).
Regarding the binary logistic regression model to predict the high compassion fatigue group, the variable lack of recognition emerged as a marginal predictor (B = –22.472; p = .998; OR ≈ 0), although this estimate lacks numerical stability and should be interpreted with caution. The model showed a modest fit (Nagelkerke’s R² = 0.166) and a correct classification rate of 67.7%.
Finally, multinomial logistic regression revealed that the set of distress categories allows for significant discrimination between the different emotional profiles identified through cluster analysis (χ²[18] = 43.57; p < .001; Nagelkerke’s R² = 0.820). However, technical problems associated with perfect separation, singularities in the Hessian matrix, and low frequencies in certain combinations prevented an accurate estimation of individual effects. These results should be understood as preliminary evidence of the relevance of verbalised distress in profile differentiation, but not as conclusive evidence of the specific weight of each category.
4. Discussion
4.1. Confirmation of the Structural Validity of the ProQOL in the Veterinary Population
Although psychometric validation was not the main objective of the study, it was essential to confirm the structural adequacy of the ProQOL for the sample analysed, given its influence on the interpretative quality of subsequent analyses. The findings obtained allow us to affirm that the original three-dimensional structure proposed by Stamm (2010), consisting of compassion satisfaction (CS), burnout (BO) and secondary traumatic stress (STS), does not fit the emotional experience of the Spanish veterinarians included in this study. This result is in line with previous research that questions the discriminant validity between BO and STS in healthcare contexts (Coetzee & Klopper, 2010; Boyle, 2015), especially when working conditions tend to generate cumulative emotional exhaustion rather than acute traumatic experiences.
The two-dimensional solution found, which integrates the BO and STS items into a single compassion fatigue (CF) factor and maintains CS as an independent factor, has been empirically supported in this sample through CFA. This configuration, consistent with recent studies that have replicated similar structures in healthcare and care professionals (Rohlf et al., 2022; Baqeas et al., 2021), suggests that CF can be conceptualised as a unified emotional experience of affective exhaustion, rather than as the coexistence of two distinct constructs.
Furthermore, the negative correlation between CF and CS reinforces the idea that both dimensions represent opposite but not mutually exclusive poles of the emotional impact of veterinary work (Figley, 2002; Mathieu, 2012; Wolf et al. 2024).
From a contextual perspective, the two-dimensional solution offers a more parsimonious and coherent representation of the phenomenon in the veterinary field, where suffering is not only human but also animal, and where the triangular relationships between the professional, the animal and its guardian generate specific emotional dynamics. As we explained in the introduction, the pressure to balance the animal’s well-being with the emotional and economic expectations of the owners increases the emotional burden on the veterinarian, favouring the emergence of CF in its broadest sense (Hill et al., 2020; Kogan & Rishniew, 2023; Kogan et al., 2020).
In short, the structure of two correlated factors provides an appropriate framework for understanding the emotional impact of veterinary work and justifying, on empirical and conceptual grounds, its use as a tool for identifying different risk profiles. Although these results do not constitute an exhaustive validation of ProQOL in this population, they do offer solid evidence of structural validity and support its applicability in studies on quality of life at work in veterinary care contexts.
4.2. Emotional Profiles in Veterinarians: A Typological Approach
The identification of emotional profiles through cluster analysis is one of the main contributions of this study, as it offers an empirical perspective that allows us to move beyond traditional approaches based on continuous scores or arbitrary cut-off points. The four-cluster solution, derived from factor scores on fatigue and compassion satisfaction, shows the existence of different configurations of distress and gratification in professional practice, the interpretation of which is relevant for both theory and preventive practice.
Although there are no direct precedents for this type of typology in the veterinary field, previous studies have demonstrated the usefulness of cluster analysis for identifying patterns of emotional distress in other healthcare groups (Zerach & Shalev, 2015; Kim et al., 2019). In line with this, the present study extends the empirical evidence to the context of animal care, offering a conceptually interpretable segmentation.
From a theoretical perspective, the profiles identified allow us to capture not only the intensity but also the quality of emotional involvement. Two of them (high emotional risk and affective disengagement) represent clearly dysfunctional configurations: the first due to the coexistence of high fatigue and low satisfaction, and the second due to affective flattening that could mask processes of demotivation or depersonalisation. Alongside these, two functional or compensated profiles were identified: one characterised by high levels of emotional involvement, with incipient signs of burnout, but balanced by strong professional gratification; and another of functional detachment, in which low fatigue was observed alongside moderate satisfaction.
The results of the discriminant analysis and the GLM model reinforce the applied usefulness of the proposed typological classification. The former, by highlighting the differential weight of compassion fatigue in predicting emotional risk, and the latter, by confirming the value of profiles as a more effective segmentation criterion than traditional sociodemographic predictors. Both findings are in line with recent research advocating for personalised and integrative approaches in the assessment and prevention of care distress, as well as in the mitigation of its consequences (Perret et al., 2020; Schlanser et al., 2021).
Overall, the empirical classification derived from cluster analysis is a valuable tool for detecting professionals in situations of emotional vulnerability, as it provides a more refined and contextualised basis for designing interventions. This typology allows preventive and support strategies to be tailored to the specific characteristics of each profile, favouring more effective and sustainable interventions over time.
4.3. Empirical Estimation of the Prevalence of Compassion Fatigue
In relation to the above, the identification of latent profiles allows us to provide an empirical estimate of the prevalence of CF in Spanish clinical veterinarians. Specifically, 23% of participants were classified within the high emotional risk cluster, characterised by high levels of fatigue and low satisfaction. This figure coincides with the high prevalence of STS obtained by Rohlf et al. (2022) in Australian professionals and is close to the rates identified by Schlanser et al. (2021) in veterinary staff engaged in animal research in the United States.
If we include the intense emotional involvement cluster (27.4%), which also presents high levels of fatigue, although coexisting with high job satisfaction, the total proportion of professionals with significant signs of emotional exhaustion rises to 50.4%. Even so, this figure is below that reported by Best et al. (2020) in Canada (69.8% with high levels of STS) and that reported by Pavan et al. (2020) in the US (81.6% with symptoms of BO, CF or both), although in the latter case an unvalidated instrument was used. A possible explanation for this discrepancy could lie in the greater availability of psychosocial resources, less vertical supervision styles or differences in the bond established with users, factors that could be modulating distress in the Spanish context.
In contrast, the data from the present study differ even more from those collected in regions such as Hong Kong, where Chan and Wong (2023) did not detect cases of high STS and only 3.6% presented high levels of OB. As the authors themselves argue, these differences could reflect more inhibitory coping styles, as well as specific structural conditions in the professional environment, such as commercial pressure or poor training in emotional skills.
Finally, the figures obtained far exceed those of Macià et al. (2022) in Spain, who, applying standardised cut-off points, estimated 4.3% high STS and 2% BO. This difference reinforces the greater sensitivity of the typological approach used in the present study, based on latent configurations of emotional distress.
In summary, the results obtained place the prevalence of compassion fatigue among Spanish clinical veterinarians at a midpoint between the high values observed in American and Australian studies and the significantly lower figures documented in Eastern contexts or in previous national research. This variability underscores the need to consider both the structural conditions of professional practice and the methodological approaches employed when interpreting prevalence estimates of this phenomenon..
4.4. Predictive Value of Sociodemographic Variables in Perceived Emotional Risk
One of the objectives of this study was to explore the predictive value of certain sociodemographic variables—gender, age, and cohabitation—in relation to perceived emotional risk, operationalised through typological profiles identified by cluster analysis. To this end, a cumulative logit ordinal regression model was used, which showed a statistically significant fit and respected the proportional odds assumption.
Contrary to previous descriptive studies, gender did not prove to be a significant predictor. Although some studies have reported a higher prevalence of BO and STS in female veterinarians (Best et al., 2020; Wolf et al., 2024; Young et al., 2024), these differences tend to disappear when multivariate controls are introduced (Perret et al., 2020; Rohlf et al., 2022; Schlanser et al., 2021). This suggests that the greater emotional burden attributed to women may be mediated by contextual or psychological factors—such as coping styles or the role of caregivers—rather than by sex itself.
In contrast, both being over 44 years of age and living with a partner were associated with a higher probability of belonging to higher emotional risk profiles. This finding contrasts with studies that point to greater vulnerability among young professionals (Best et al., 2020; Dow et al., 2019) and with the more widespread view of the protective effect of spousal support (Dow et al., 2019; Goñi-Balentziaga & Azkona, 2024).
At first glance, the qualitative data collected seem to contradict the predictive model, as it was the younger professionals and those living with a partner who most frequently verbalised feelings of distress, such as vocational frustration, overload or lack of recognition. However, this discrepancy can be interpreted from a convergent rather than an exclusive logic. On the one hand, the qualitative analysis is based on a self-selected subsample, which is more likely to express discomfort. On the other hand, quantitative models integrate combined configurations of fatigue and satisfaction, where verbalisation and risk profile do not necessarily coincide.
In fact, it is possible that younger people express more reactive and visible discomfort, while older people accumulate more sustained and less explicit fatigue. Similarly, cohabitation can act as a protective resource or as a factor amplifying conflict, depending on the context of work-life balance (Tomasi et al., 2019; Reif-Stice et al., 2023).
These findings caution against a univocal interpretation of sociodemographic variables and reinforce the usefulness of mixed approaches to capture narrative styles and latent patterns of risk (cf. Andrukonis et al., 2020; Rohlf et al., 2022; Goñi-Balentziaga & Azkona, 2024). Overall, the study highlights the need for a comprehensive and interdisciplinary approach that allows for the design of preventive interventions tailored to both emotional profiles and career trajectories, thus contributing to more sustainable and emotionally healthy professional practice.
4.5. Theoretical and Practical Contributions of the Study
This study contributes to the conceptual and applied consolidation of the CF construct in the veterinary field. At the theoretical level, the empirical confirmation of a two-dimensional structure of the ProQOL, composed of CF and CS, supports the need to move beyond general one-dimensional or two-factor models. Our results show that the shared variance between items is better explained by specific factors than by a general construct, in line with studies that have questioned the validity of the three-dimensional model in specific clinical contexts (Baqeas et al., 2021; Rohlf et al., 2022).
From an applied perspective, segmentation into four distinct emotional profiles—functional distancing, affective detachment, intense emotional involvement, and high emotional risk—allows us to move towards a more ecological and contextualised classification. Unlike cut-off point-based approaches, this typological strategy captures ambivalent configurations between burnout and gratification, which is particularly relevant in veterinary clinical practice, where the empathetic bond with animals and their guardians or owners coexists with high levels of emotional exposure.
In addition to identifying distinct emotional profiles, the study provides a better understanding of how certain sociodemographic variables are associated with emotional risk. Quantitative analyses show that older people and those who live with their partner are more likely to belong to clusters with higher emotional severity. In contrast, qualitative analyses of open comments reveal that it is younger professionals without partners who most frequently verbalise discomfort related to overload, conflicts with owners and lack of recognition.
Far from being a contradiction, this difference can be interpreted as reflecting two ways of expressing discomfort: one more explicit and verbalised, characteristic of younger people, and the other more structural or cumulative, less expressed but more present in the emotional profiles of those at greater risk. This interpretation is consistent with cumulative burden models (Cox et al., 2005), according to which certain personal factors, such as age or cohabitation, can become elements of vulnerability when they interact with demanding work contexts and limited protective resources.
From this perspective, the findings justify the need to design preventive strategies tailored to the different emotional profiles identified. In addition, the sources of distress highlighted in the comments—such as lack of professional recognition, tensions with animal owners, and work overload—should be considered priority targets in psychosocial interventions aimed at the veterinary clinical setting. Integrating these dimensions allows for a more comprehensive understanding of emotional risk, incorporating both subjective experience and latent configurations of professional distress.
4.6. Study Limitations and Methodological Considerations
Despite the robustness of the analyses, the study has certain limitations that should be considered when interpreting the results. First, the cross-sectional nature of the design prevents the establishment of causal relationships between the variables studied, limiting the possibility of identifying temporal trajectories between exposure, fatigue and satisfaction. Secondly, although the sample is diverse in terms of age, gender and living situation, its size (N = 135) may have limited the statistical power in some analyses, especially in ordinal regression, as reflected in the size of the pseudo-R² obtained. In the qualitative analysis, the number of participants who responded to the open-ended question was limited (n = 31), which restricts the diversity of the discourse analysed. Furthermore, the brevity of some responses makes it difficult to code the nuances of experience in greater detail. Although they do not directly converge with the quantitative findings, the patterns extracted from the qualitative comments provide added interpretative value by highlighting forms of discomfort that enrich our understanding of the latent emotional profiles.
Another relevant limitation concerns the sampling procedure, which was based on self-selection via an online questionnaire. Although this strategy is appropriate for accessing a geographically dispersed population, it may have introduced participation biases by attracting people who are particularly sensitive or affected by the issue.
Finally, it should be mentioned that, although the ProQOL items were adapted to the context of animal care, these adaptations, although empirically justified by factor analyses, were not subjected to a systematic validation process by expert judges, which could compromise the content validity of the instrument. Even so, the patterns detected show internal consistency which, in some cases, converge with the quantitative findings and, in others, provide divergent nuances that enrich our understanding of the phenomenon.
5. Conclusions
Despite the limitations noted, this study makes a significant contribution to understanding the emotional impact of veterinary clinical work by validating a two-dimensional structure of the ProQOL adapted to this context and proposing an empirical segmentation of professionals based on their emotional profiles. Through the typological approach employed, the limitations of models based on fixed cut-off points have been overcome, providing a richer and more contextualised view of the phenomenon of compassion fatigue.
The results obtained show that more than half of the sample presents clinical indicators of emotional exhaustion, either in the form of high risk or intense involvement coexisting with gratification. Likewise, it has been demonstrated that sociodemographic variables such as age and cohabitation with a partner may be associated with greater vulnerability, challenging some traditional conceptions about protective factors in the workplace.
From an applied perspective, these findings can guide the design of preventive interventions tailored to the emotional profiles identified, as well as promote organisational policies that are sensitive to the life trajectories and relational contexts of professionals. In addition, the study lays the foundations for future longitudinal research to analyse the evolution of these profiles over time and integrate psychological and organisational variables that modulate emotional risk.
Overall, the study reaffirms the need to address the well-being of veterinary staff from a comprehensive approach that considers both the suffering observed and the sources of professional gratification, without dissociating the emotional from the structural or the personal from the relational.
Finally, the qualitative analysis of the comments has identified areas for intervention that complement the structural data, highlighting the importance of professional recognition, relationships with animal guardians and the perception of overload. These elements, which are difficult to capture using closed scales, provide added value for the design of programmes that are more sensitive to the subjective experiences of professionals.
Author Contributions
Conceptualization, J.M.L.R. and D.C.S.; methodology, J.M.L.R..; software, J.M.L.R; validation, J.M.L.R, J.M.L.P. and F.J.C.S..; formal analysis, J.M.L.P. and J.M.L.R..; investigation, F.J.C.S..; resources, D.C.S. and J.M.L.R.; data curation, J.M.L.P.; writing—original draft preparation, J.M.R.; writing—review and editing, D.C.S.; visualization, D.C.S.; supervision, D.C.S.; project administration, D.C.S.; funding acquisition, D.C.S. and J.M.L.P. All authors have read and agreed to the published version of the manuscript.
Funding
This research received no external funding.
Institutional Review Board Statement
The study was conducted in accordance with the Declaration of Helsinki and approved by the Institutional Review Board of ASOCIACIÓN CIENTÍFICA DE EXPERTOS EN SEGURIDAD Y SALUD LABORAL DE ANDALUCIA -ACCESLA (protocol code 2023/0001501 date of approval 05/12/2023).
Informed Consent Statement
Informed consent was obtained from all subjects involved in the study.
Data Availability Statement
The data from this research project will be available at idus: Research Repository of the University of Seville (https://idus.us.es).
Conflicts of Interest
The authors declare no conflicts of interest.
Abbreviations
The following abbreviations are used in this manuscript:
| CF | Compassion fatigue |
| CS | Compassion satisfaction |
| BO | Burnout |
| STS | Secondary traumatic stress |
| CFA | Confirmatory factor analysis |
| EFA | Exploratory factor analysis |
| ProQOL | Professional quality of life scale |
| AVE | Average Variance Extracted |
References
- Andrukonis, A. , Hall, N. J., & Protopopova, A. The Impact of Caring and Killing on Physiological and Psychometric Measures of Stress in Animal Shelter Employees: A Pilot Study. Int J Environ Res Public Health 2020, 17. [Google Scholar] [CrossRef]
- Baqeas, M. H. , Davis, J., & Copnell, B. Compassion fatigue and compassion satisfaction among palliative care health providers: a scoping review. BMC Palliative Care 2021, 20, 88. [Google Scholar] [CrossRef]
- Best, C. O. , Perret, J. L., Hewson, J., Khosa, D. K., & Jones-Bitton, A. A survey of veterinarian mental health and resilience in Ontario, Canada. Canadian Veterinary Journal 2020, 60, 166–172. [Google Scholar]
- Boyle, D. A. Compassion fatigue: The cost of caring. Nursing 2015, 45, 48–51. [Google Scholar] [CrossRef]
- Cameron, A. , Geldard, M., Mair, T., England, G. C. W., Burford, J., Freeman, S.,…Wilson, E. Experiences of End-of-Life Decision-Making in Equine Veterinary and Charity Teams. Animals 2025, 15, 678. [Google Scholar] [CrossRef] [PubMed]
- Centro de Investigaciones Sociológicas (CIS). (2025). Estudio nº 3501. Relaciones sexuales y de pareja. Avance de resultados, /: CIS. https.
- Chan, C. K. Y. , & Wong, P. Predictors of Suicide Risk and Mental Health Outcomes Among Hong Kong Veterinarians: A Cross-Sectional Study. Behavioral Sciences 2023, 13, 770. [Google Scholar] [CrossRef]
- Coetzee, S. K. , & Klopper, H. C. Compassion fatigue within nursing practice: A concept analysis. Nursing and Health Sciences 2010, 12, 235–243. [Google Scholar] [CrossRef]
- Deponti, P. S. , Jaguezeski, A. M., Pulgatti, D. H. V., Soares, J. C. M., & Cecim, M. Veterinarian’s Perceptions of Animal Euthanasia and the Relation to Their Own Mental Health. Ciência Rural 2023, 53. [Google Scholar] [CrossRef]
- Dolnicar, S. , Grün, B., Leisch, F., & Schmidt, K. Required Sample Sizes for Data- Driven Market Segmentation Analyses in Tourism. Journal of Travel Research 2014, 53, 296–306. [Google Scholar] [CrossRef]
- Dow, M. Q. , Chur-Hansen, A., Hamood, W., & Edwards, S. Impact of dealing with bereaved clients on the psychological wellbeing of veterinarians. Australian Veterinary Journal 2019, 97, 382–389. [Google Scholar] [CrossRef]
- Everitt, B. S. , Landau, S., Leese, M., & Stahl, D. (2011). In Cluster analysis (5th ed.).; Wiley.
- Faul, F. , Erdfelder, E., Buchner, A., & Lang, A.-G. Statistical power analyses using G*Power 3.1: Tests for correlation and regression analyses. Behavior Research Methods 2009, 41, 1149–1160. [Google Scholar] [CrossRef] [PubMed]
- Figley, C. R. Compassion fatigue: Psychotherapists’ chronic lack of self-care. Journal of Clinical Psychology 2002, 58, 1433–1441. [Google Scholar] [CrossRef] [PubMed]
- Fornell, C. , & Larcker, D. F. Evaluating structural equation models with unobservable variables and measurement error. Journal of Marketing Research 1981, 18, 39–50. [Google Scholar]
- Ghafarzadegan, R. , Vanaki, Z., Mohammadi, E., & Kazemnejad, A. (2025). Compassion Fatigue in Palliative Care Nurses: Nursing Care With a Hardened Heart (preppint in Research Sqare). [CrossRef]
- Goñi-Balentziaga, O. , & Azkona, G. Perceived Professional Quality of Life and Mental Well-Being Among Animal Facility Personnel in Spain. Laboratory Animals 2024, 58, 73–81. [Google Scholar] [CrossRef]
- Gordon, S. , Gardner, D., Weston, J. F., Bolwell, C. F., Benschop, J., & Parkinson, T. Using the Critical Incident Technique to Determine Veterinary Professional Competencies Important for Enhancing the Veterinarian-client Interaction. Veterinary Record 2021, 190. [Google Scholar] [CrossRef]
- Hill, E. M. , LaLonde, C. M., & Reese, L. A. Compassion Fatigue in Animal Care Workers. Traumatology an International Journal 2020, 26, 96–108. [Google Scholar] [CrossRef]
- Holden, C. L. , Jackson, D. L., Morse, D. T., & Monaghan, C. L. Understanding Non-Technical Competencies: Compassion and Communication Among Fourth-Year Veterinarians-in-Training. Journal of Veterinary Medical Education 2019, 46, 506–517. [Google Scholar] [CrossRef]
- Instituto Nacional de Estadística. (2025, 22 de mayo). Número de profesionales sanitarios colegiados no jubilados: Veterinarios por comunidad autónoma, situación laboral y sexo (2024) [Tabla de datos extraída manualmente]. INE. https://www.ine.es/jaxi/Tabla.htm?
- Kaufman, L. , & Rousseeuw, P. J. (1990). Finding groups in data: An introduction to cluster analysis. Wiley.
- Kim, H. , Kim, K., & Lee, S. Y. Clustering burnout profiles and their relationship with work-related factors and psychological distress among nurses: A latent profile analysis. Journal of Advanced Nursing 2019, 75, 3210–3220. [Google Scholar] [CrossRef]
- Kogan, L. R. , & Rishniw, M. Veterinarians and moral distress. Javma-Journal of the American Veterinary Medical Association 2023, 261. [Google Scholar] [CrossRef]
- Kogan, L. R. , Wallace, J. E., Schoenfeld-Tacher, R., Hellyer, P. W., & Richards, M. Veterinary Technicians and Occupational Burnout. Frontiers in Veterinary Science 2020, 7, 328. [Google Scholar] [CrossRef] [PubMed]
- Kramper, S. , Crosby, E. S., Waitz-Kudla, S. N., Weathers, F. W., & Witte, T. K. Highly Stressful Events and Posttraumatic Stress Disorder Symptoms Among Veterinary Professionals: Prevalence and Associations With Mental Health and Job-Related Outcomes. Psychological Trauma Theory Research Practice and Policy 2023, 15 (Suppl. 2), S275–S285. [Google Scholar] [CrossRef] [PubMed]
- Lynch, S. H. , & Lobo, M. L. Compassion fatigue in family caregivers: A Wilsonian concept analysis. Journal of Advanced Nursing 2012, 68, 2125–2134. [Google Scholar] [CrossRef] [PubMed]
- Macía, P. , Goñi-Balentziaga, O., Vegas, Ó., & Azkona, G. Professional Quality of Life Among Spanish Veterinarians. Veterinary Record Open 2022, 9. [Google Scholar] [CrossRef]
- Marshman, C. , Hansen, A., & Munro, I. Compassion Fatigue in Mental Health Nurses: A Systematic Review. Journal of Psychiatric and Mental Health Nursing 2021, 29, 529–543. [Google Scholar] [CrossRef]
- Mathieu, F. (2012). The Compassion Fatigue Workbook: Creative Tools for Transforming Compassion Fatigue and Vicarious Traumatization (1.ª ed.). New York, NY: Routledge. [CrossRef]
- Matte, A. R. , Khosa, D. K., Coe, J. B., & Meehan, M. Impacts of the Process and Decision-making Around Companion Animal Euthanasia on Veterinary Wellbeing. Veterinary Record 2019, 185, 480–480. [Google Scholar] [CrossRef]
- Morales Foster, S. , & Maples, E. H. Occupational Stress in Veterinary Support Staff. Journal of Veterinary Medical Education 2014, 41, 102–110. [Google Scholar] [CrossRef]
- Musetti, A. , Schianchi, A., Caricati, L., Manari, T., & Schimmenti, A. Exposure to animal suffering, adult attachment styles, and professional quality of life in a sample of Italian veterinarians. Plos One 2020, 15, e0237991. [Google Scholar] [CrossRef]
- Pavan, A. D. , O’Quin, J., Roberts, M. E., & Freed, C. L. Using a Staff Survey to Customize Burnout and Compassion Fatigue Mitigation Recommendations in a Lab Animal Facility. Journal of the American Association for Laboratory Animal Science 2020, 59, 139–147. [Google Scholar] [CrossRef]
- Perret, J. L. , Best, C. O., Coe, J. B., Greer, A. L., Khosa, D. K., & Jones-Bitton, A. Prevalence of mental health outcomes among Canadian veterinarians. Javma-Journal of the American Veterinary Medical Association 2020, 256, 365–375. [Google Scholar]
- Plutchik, R. (1980). In Emotion: A psychoevolutionary synthesis; Harper & Row: New York.
- Polachek, A. J. , & Wallace, J. E. The paradox of compassionate work: a mixed-methods study of satisfying and fatiguing experiences of animal health care providers. Anxiety Stress and Coping 2018, 31, 228–243. [Google Scholar] [CrossRef] [PubMed]
- Reif-Stice, C. , Smith-Frigerio, S., Lawson, C. A., & Venette, S. Discerning the Effect of the Relationship Between Disclosure and Responsiveness on Depression, Anxiety, and Compassion Fatigue Among Veterinarians. Journal of the American Veterinary Medical Association 2023, 261, 551–558. [Google Scholar] [CrossRef]
- Rhodes, R. L. , Noguchi, K., & Agler, L. M. L. Female Veterinarians’ Experiences With Human Clients: The Link to Burnout and Depression. International Journal of Workplace Health Management 2022, 15, 572–589. [Google Scholar] [CrossRef]
- Rohlf, V. , Scotney, R., Monaghan, H., & Bennett, P. C. Predictors of Professional Quality of Life in Veterinary Professionals. Journal of Veterinary Medical Education 2022, 49, 372–381. [Google Scholar] [CrossRef]
- Ryan, L. Mental Health in the Veterinary Industry Changing Our Mindset and Taking Care Of Ourselves. Veterinary Nursing Journal 2022, 37, 5–7. [Google Scholar] [CrossRef]
- Schlanser, T. V. , Rabinowitz, P., & Thompson-Iritani, S. Compassion Fatigue and Satisfaction in US Army Laboratory Animal Medicine Personnel. Journal of the American Association for Laboratory Animal Science 2021, 60, 422–430. [Google Scholar] [CrossRef]
- Scotney, R. L. , McLaughlin, D., & Keates, H. L. A systematic review of the effects of euthanasia and occupational stress in personnel working with animals in animal shelters, veterinary clinics, and biomedical research facilities. Javma-Journal of the American Veterinary Medical Association 2015, 247, 1121–1130. [Google Scholar] [CrossRef]
- Sinclair, S. , Raffin-Bouchal, S., Venturato, L., Mijovic-Kondejewski, J., & Smith-MacDonald, L. Compassion fatigue: A meta-narrative review of the healthcare literature. International Journal of Nursing Studies 2017, 69, 9–24. [Google Scholar] [CrossRef] [PubMed]
- Smart, D. , English, A., James, J., Wilson, M., Daratha, K. B., Childers, B., & Magera, C. Compassion Fatigue and Satisfaction: A Cross-sectional Survey Among US Healthcare Workers. Nursing and Health Sciences 2014, 16, 3–10. [Google Scholar] [CrossRef] [PubMed]
- Sokal, R. R. , & Rohlf, F. J. The Comparison of Dendrograms by Objective Methods. Taxon 1962, 11, 33–40. [Google Scholar] [CrossRef]
- Sosnicki, J. L. , & Reynolds, P. S. Compassion Fatigue Rounds (CFR): A Proactive Brief Intervention to Introduce Mental Health Awareness in a Veterinary Clerkship. Journal of Veterinary Medical Education 2024. [Google Scholar] [CrossRef]
- Stamm, B. H. (2005). The ProQOL Manual. The Professional Quality of Life Scale: Compassion Satisfaction, Burnout & Compassion Fatigue/Secondary Trauma Scales. Sidran Press.
- Stamm, B. H. (2010). The Concise ProQOL Manual. In: Pocatello, ID: ProQOL.org.
- Tomasi, S. , Fechter-Leggett, E., Edwards, N., Reddish, A. D., Crosby, A. E., & Nett, R. J. Suicide Among Veterinarians in the United States From 1979 Through 2015. Journal of the American Veterinary Medical Association 2019, 254, 104–112. [Google Scholar] [CrossRef]
- Upasen, R. , & Saengpanya, W. Compassion Fatigue Among Family Caregivers of Schizophrenic Patients. Journal of Population and Social Studies 2021, 30, 1–17. [Google Scholar] [CrossRef]
- Vonk, J. , Bouma, E., & Dijkstra, A. A Time to Say Goodbye: Empathy and Emotion Regulation Predict Timing of End-of-Life Decisions by Pet Owners. Human-Animal Interaction Bulletin 2022. [Google Scholar] [CrossRef]
- Williams, J. M. , Wauthier, L. M., & Knoll, M. Veterinarians’ Experiences of Treating Cases of Animal Abuse: An Online Questionnaire Study. Veterinary Record 2022, 191. [Google Scholar] [CrossRef]
- Wolf, P. J. , Gillespie, M., & Segrin, C. Measures of Well-Being in U.S. Animal Shelter Staff During 2023. Journal of Shelter Medicine and Community Animal Health 2024, 3. [Google Scholar] [CrossRef]
- Young, L. , Ferrara, F., Kelly, L., Martin, T. L., Thompson-Iritani, S., & LaFollette, M. R. Professional Quality of Life in Animal Research Personnel Is Linked to Retention &Amp; Job Satisfaction: A Mixed-Methods Cross-Sectional Survey on Compassion Fatigue in the USA. Plos One 2024, 19, e0298744. [Google Scholar] [CrossRef]
- Zerach, G. , & Shalev, T. The role of predictors in secondary traumatization among health professionals working with Holocaust survivors. Psychological Trauma: Theory, Research, Practice, and Policy 2015, 7, 340–347. [Google Scholar] [CrossRef]
Figure 1.
Distribution of clusters according to their typified means of fatigue and compassion satisfaction.
Figure 1.
Distribution of clusters according to their typified means of fatigue and compassion satisfaction.

Figure 2.
Individual assignment of cases to the resulting clusters, with spatial delimitation based on factor scores.
Figure 2.
Individual assignment of cases to the resulting clusters, with spatial delimitation based on factor scores.
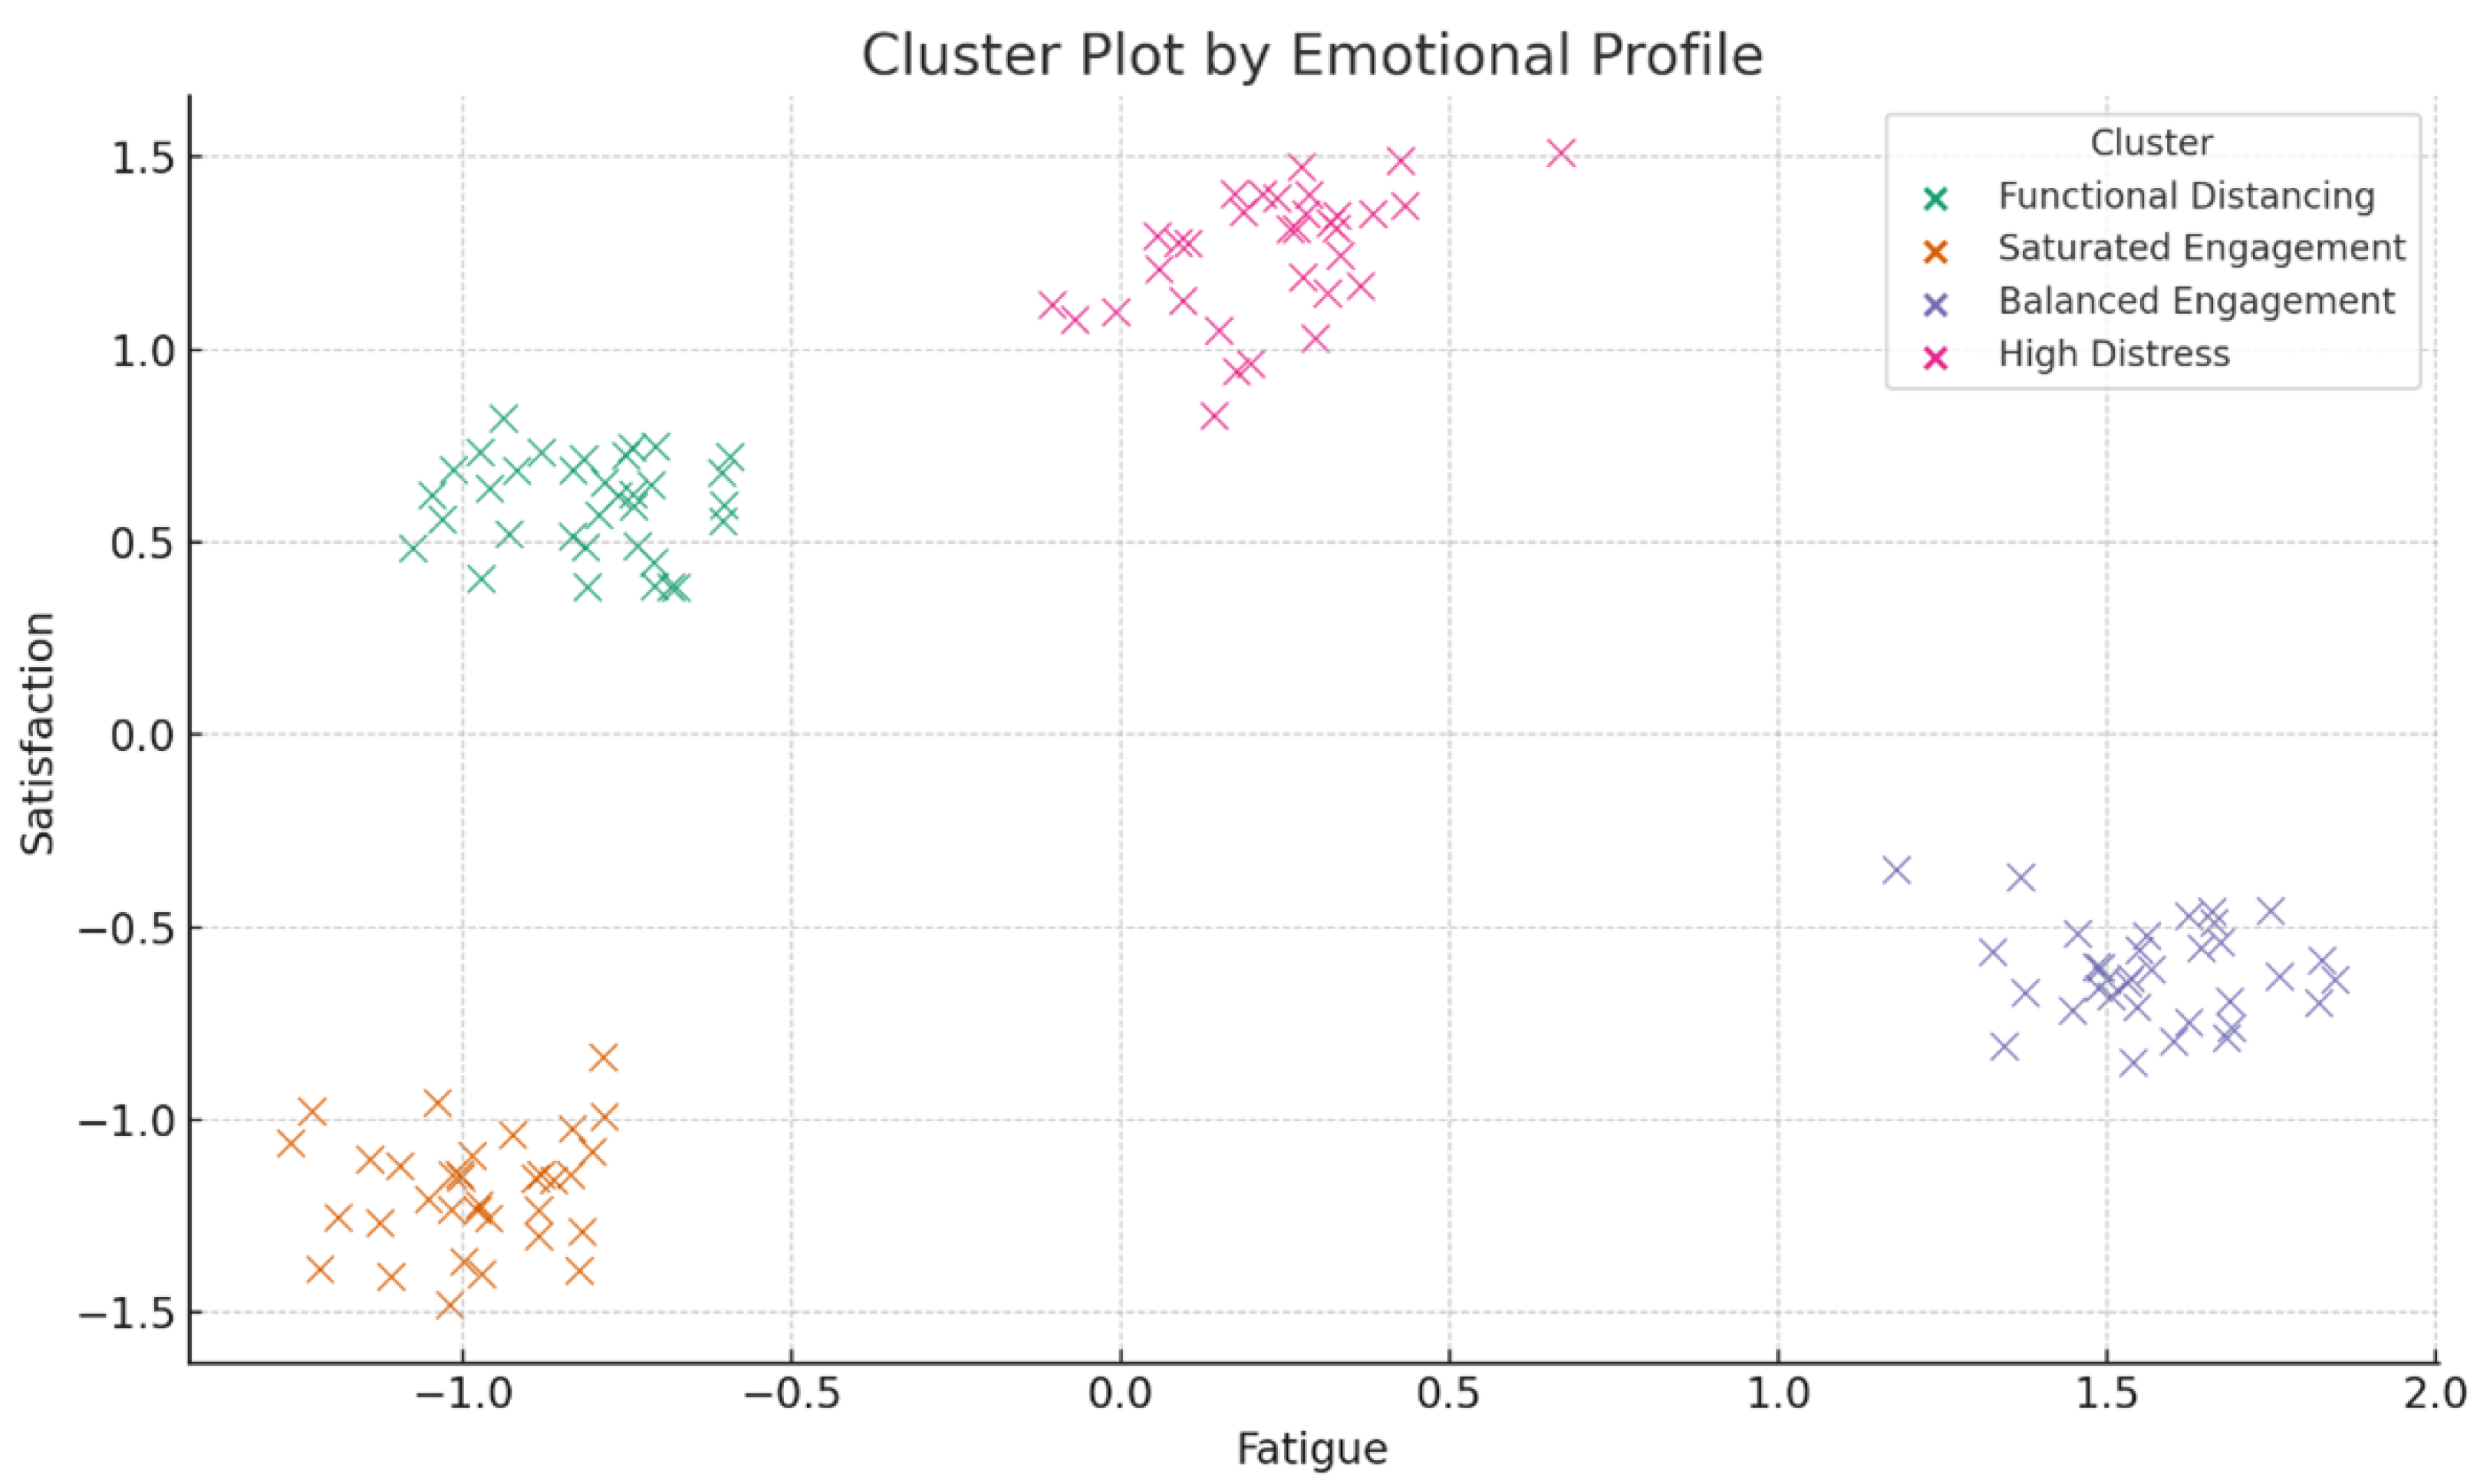
Figure 3.
Standardised average profile in the dimensions of fatigue and compassion satisfaction by cluster (K-means).
Figure 3.
Standardised average profile in the dimensions of fatigue and compassion satisfaction by cluster (K-means).
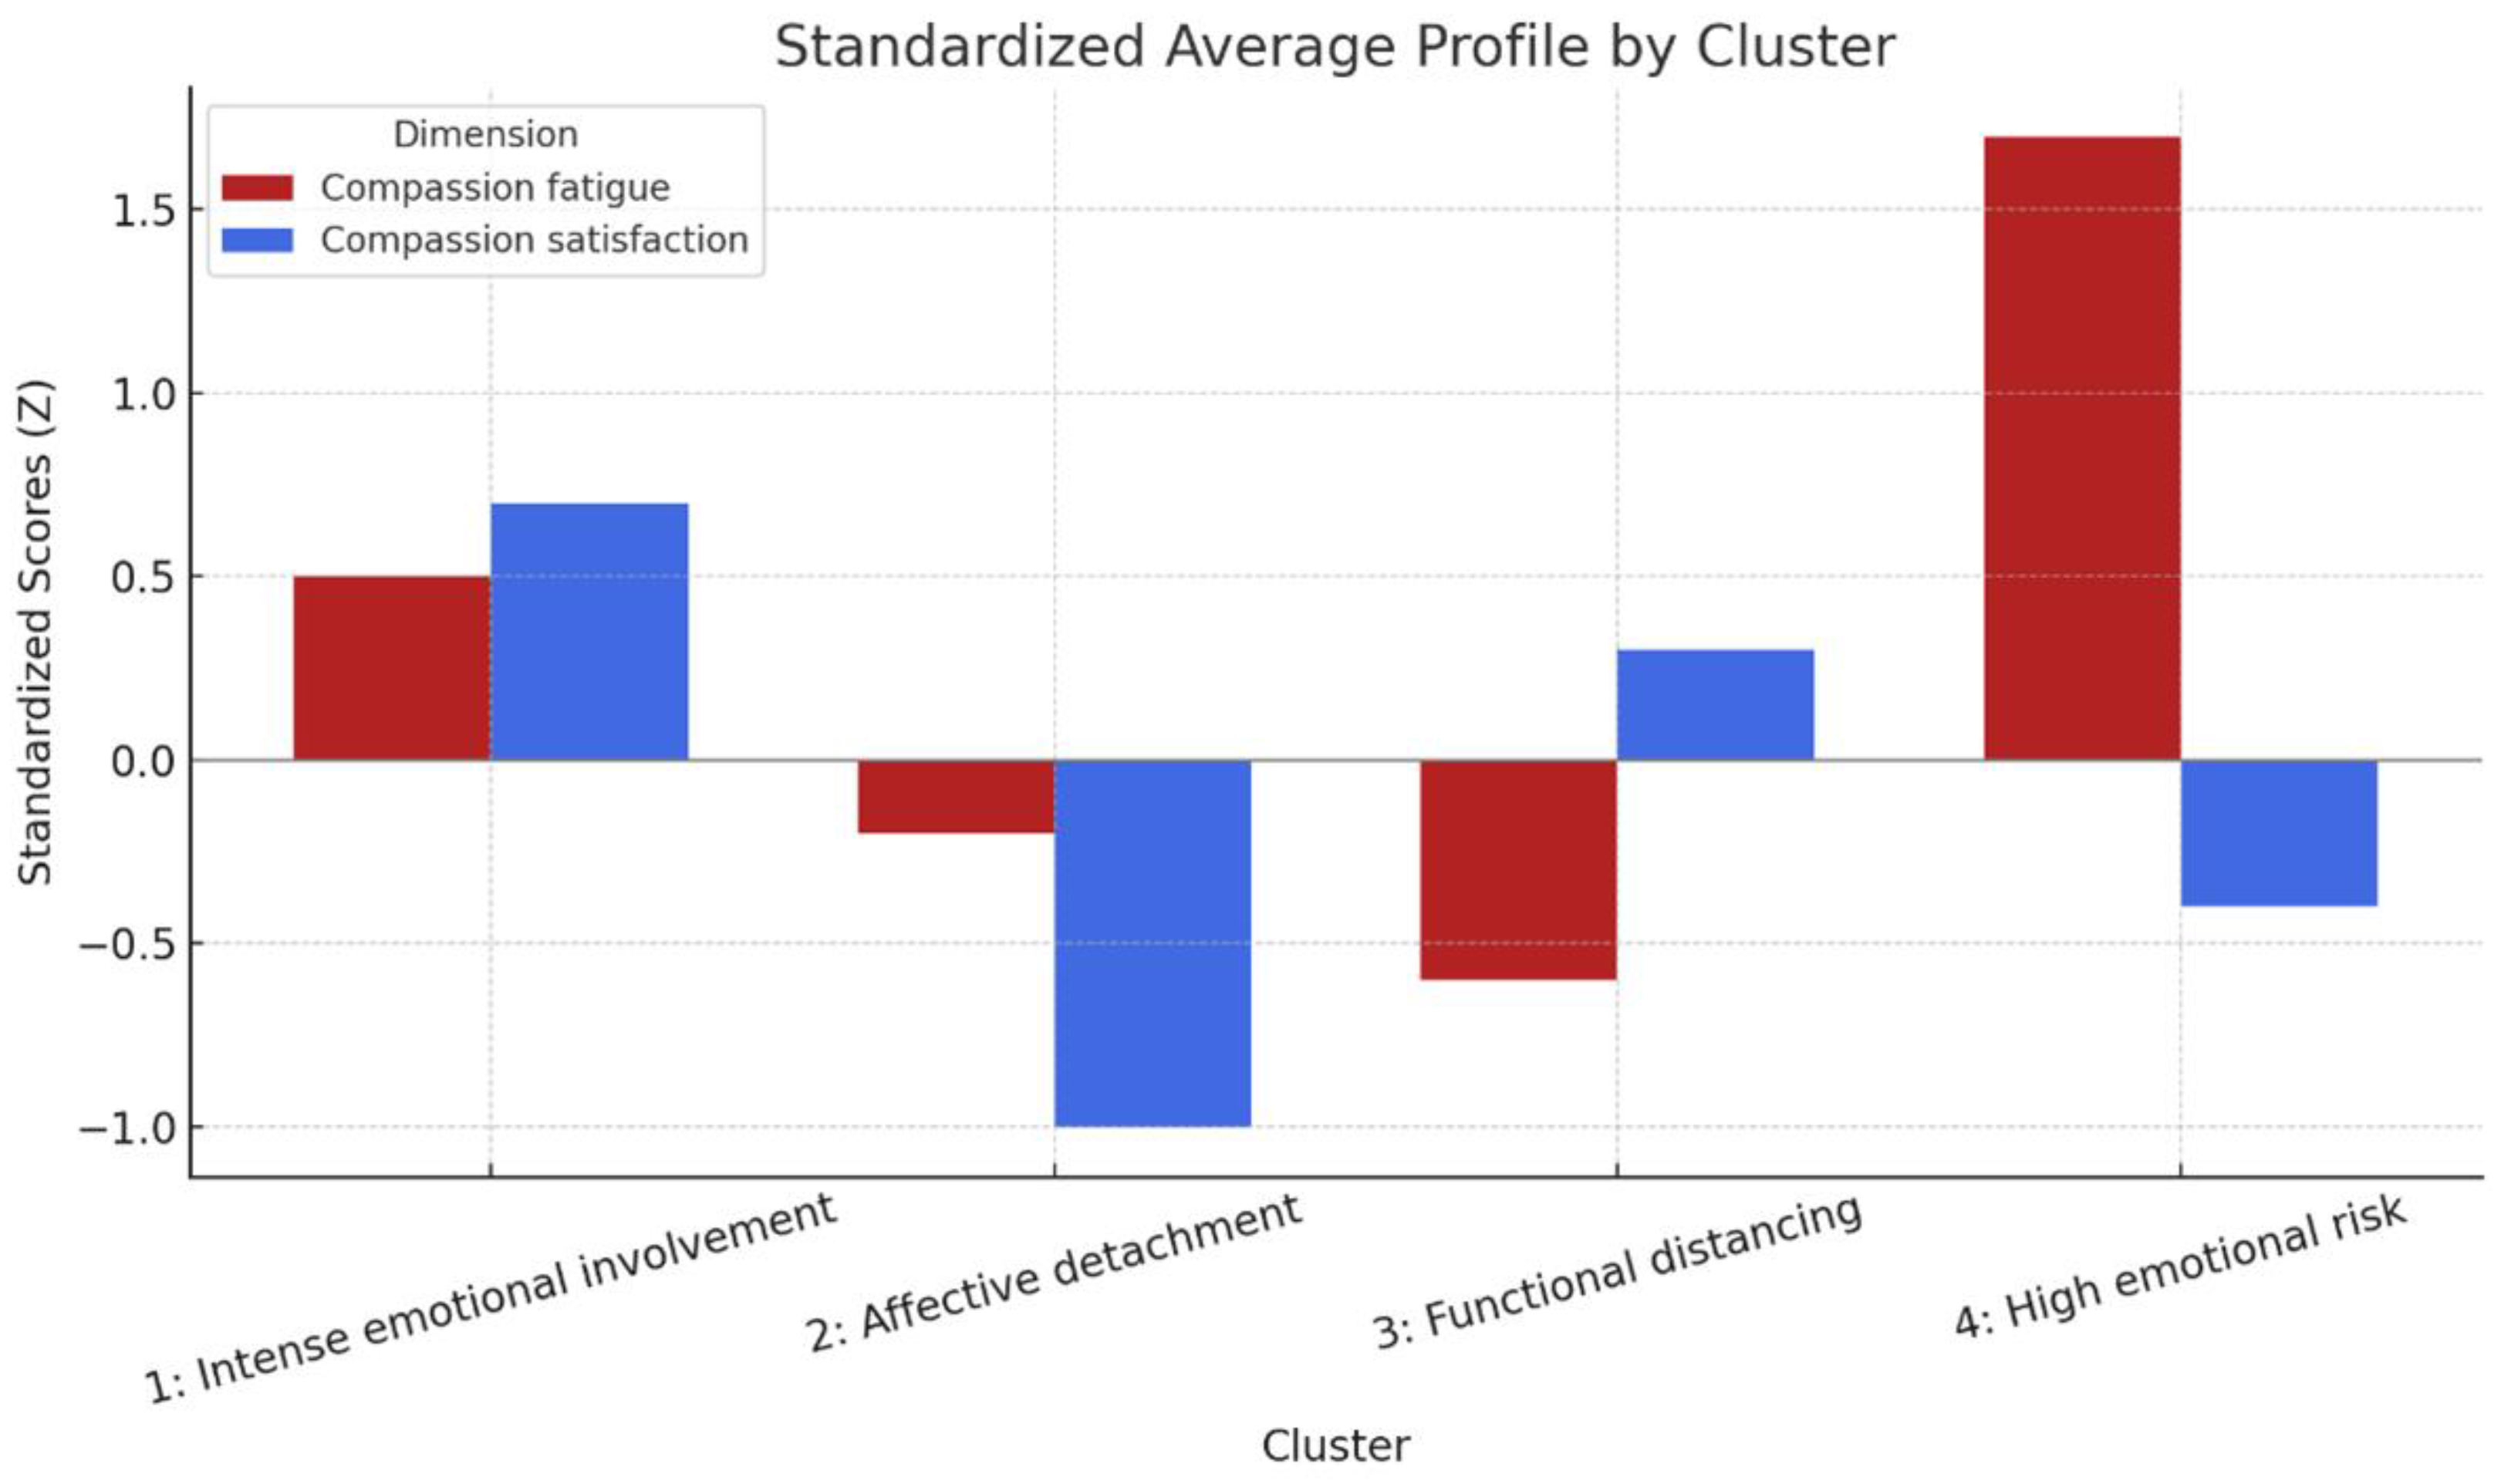
Figure 4.
Graphical representation of silhouette indices by cluster in the K-means solution. The values reflect the degree of internal cohesion of each group. A higher silhouette index indicates greater similarity between individuals in the same cluster and less overlap with other groups.
Figure 4.
Graphical representation of silhouette indices by cluster in the K-means solution. The values reflect the degree of internal cohesion of each group. A higher silhouette index indicates greater similarity between individuals in the same cluster and less overlap with other groups.
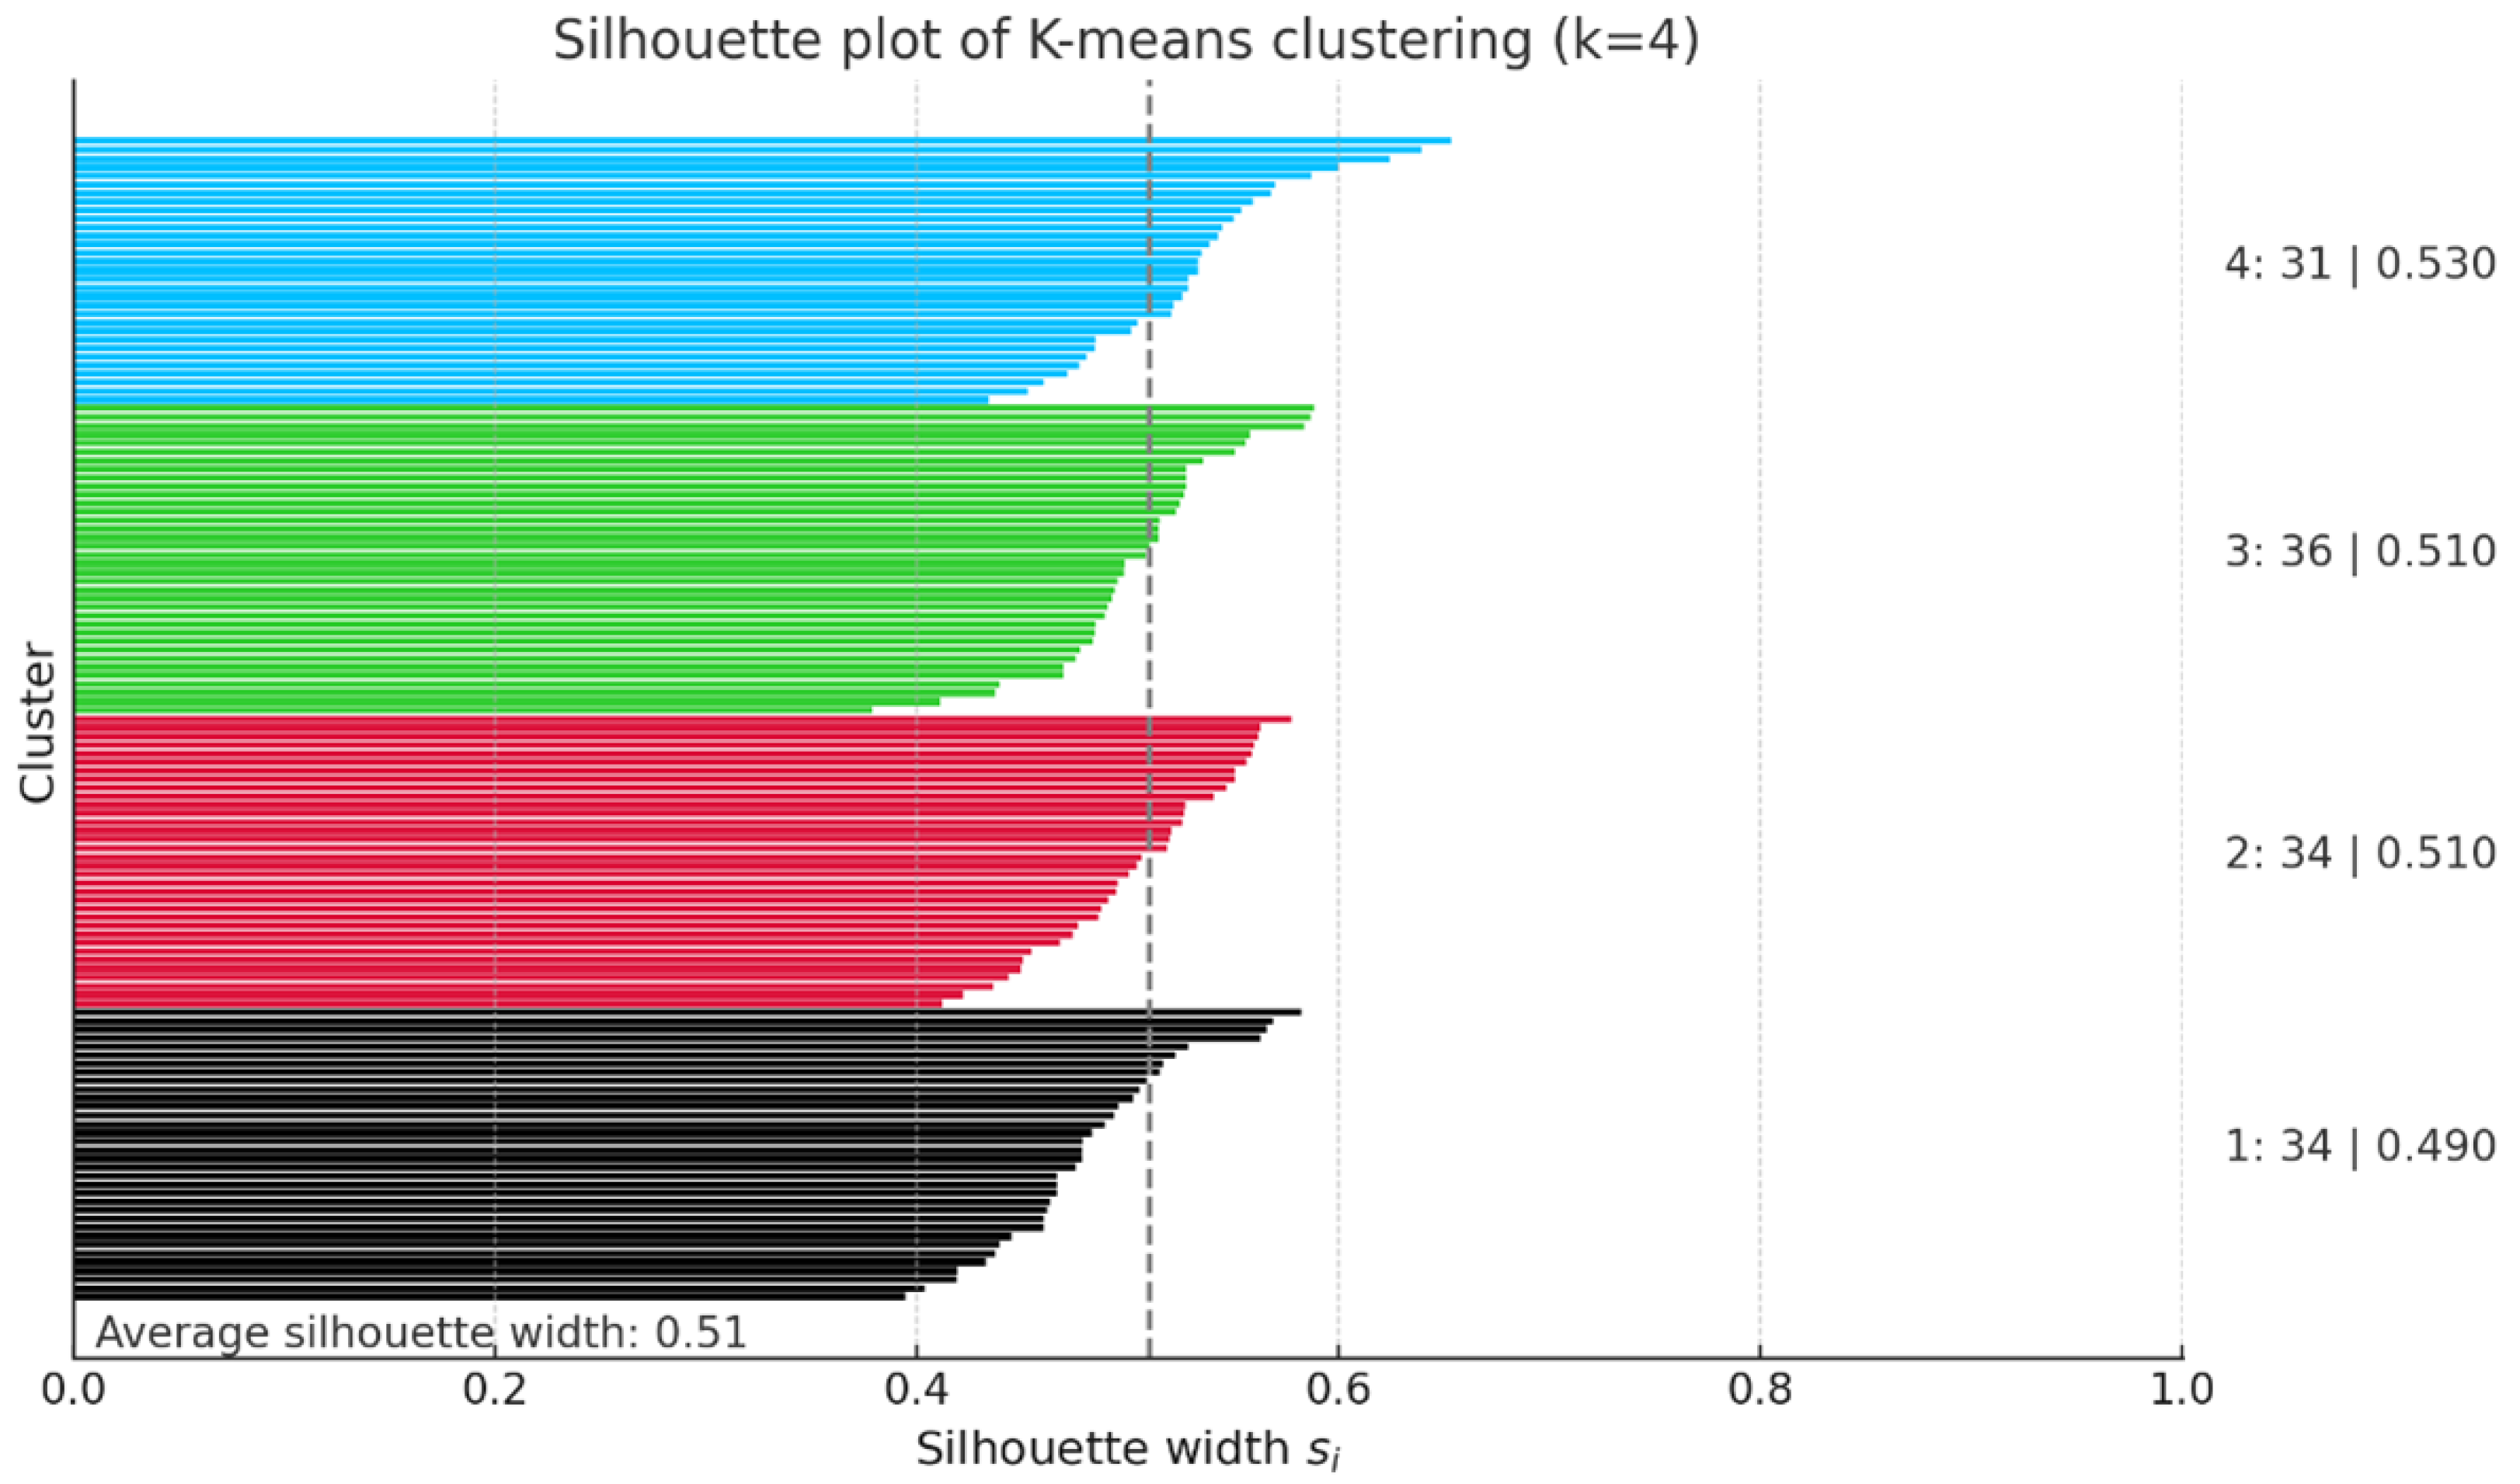
Figure 5.
Adjusted means of compassion fatigue by cluster. (95% CI).
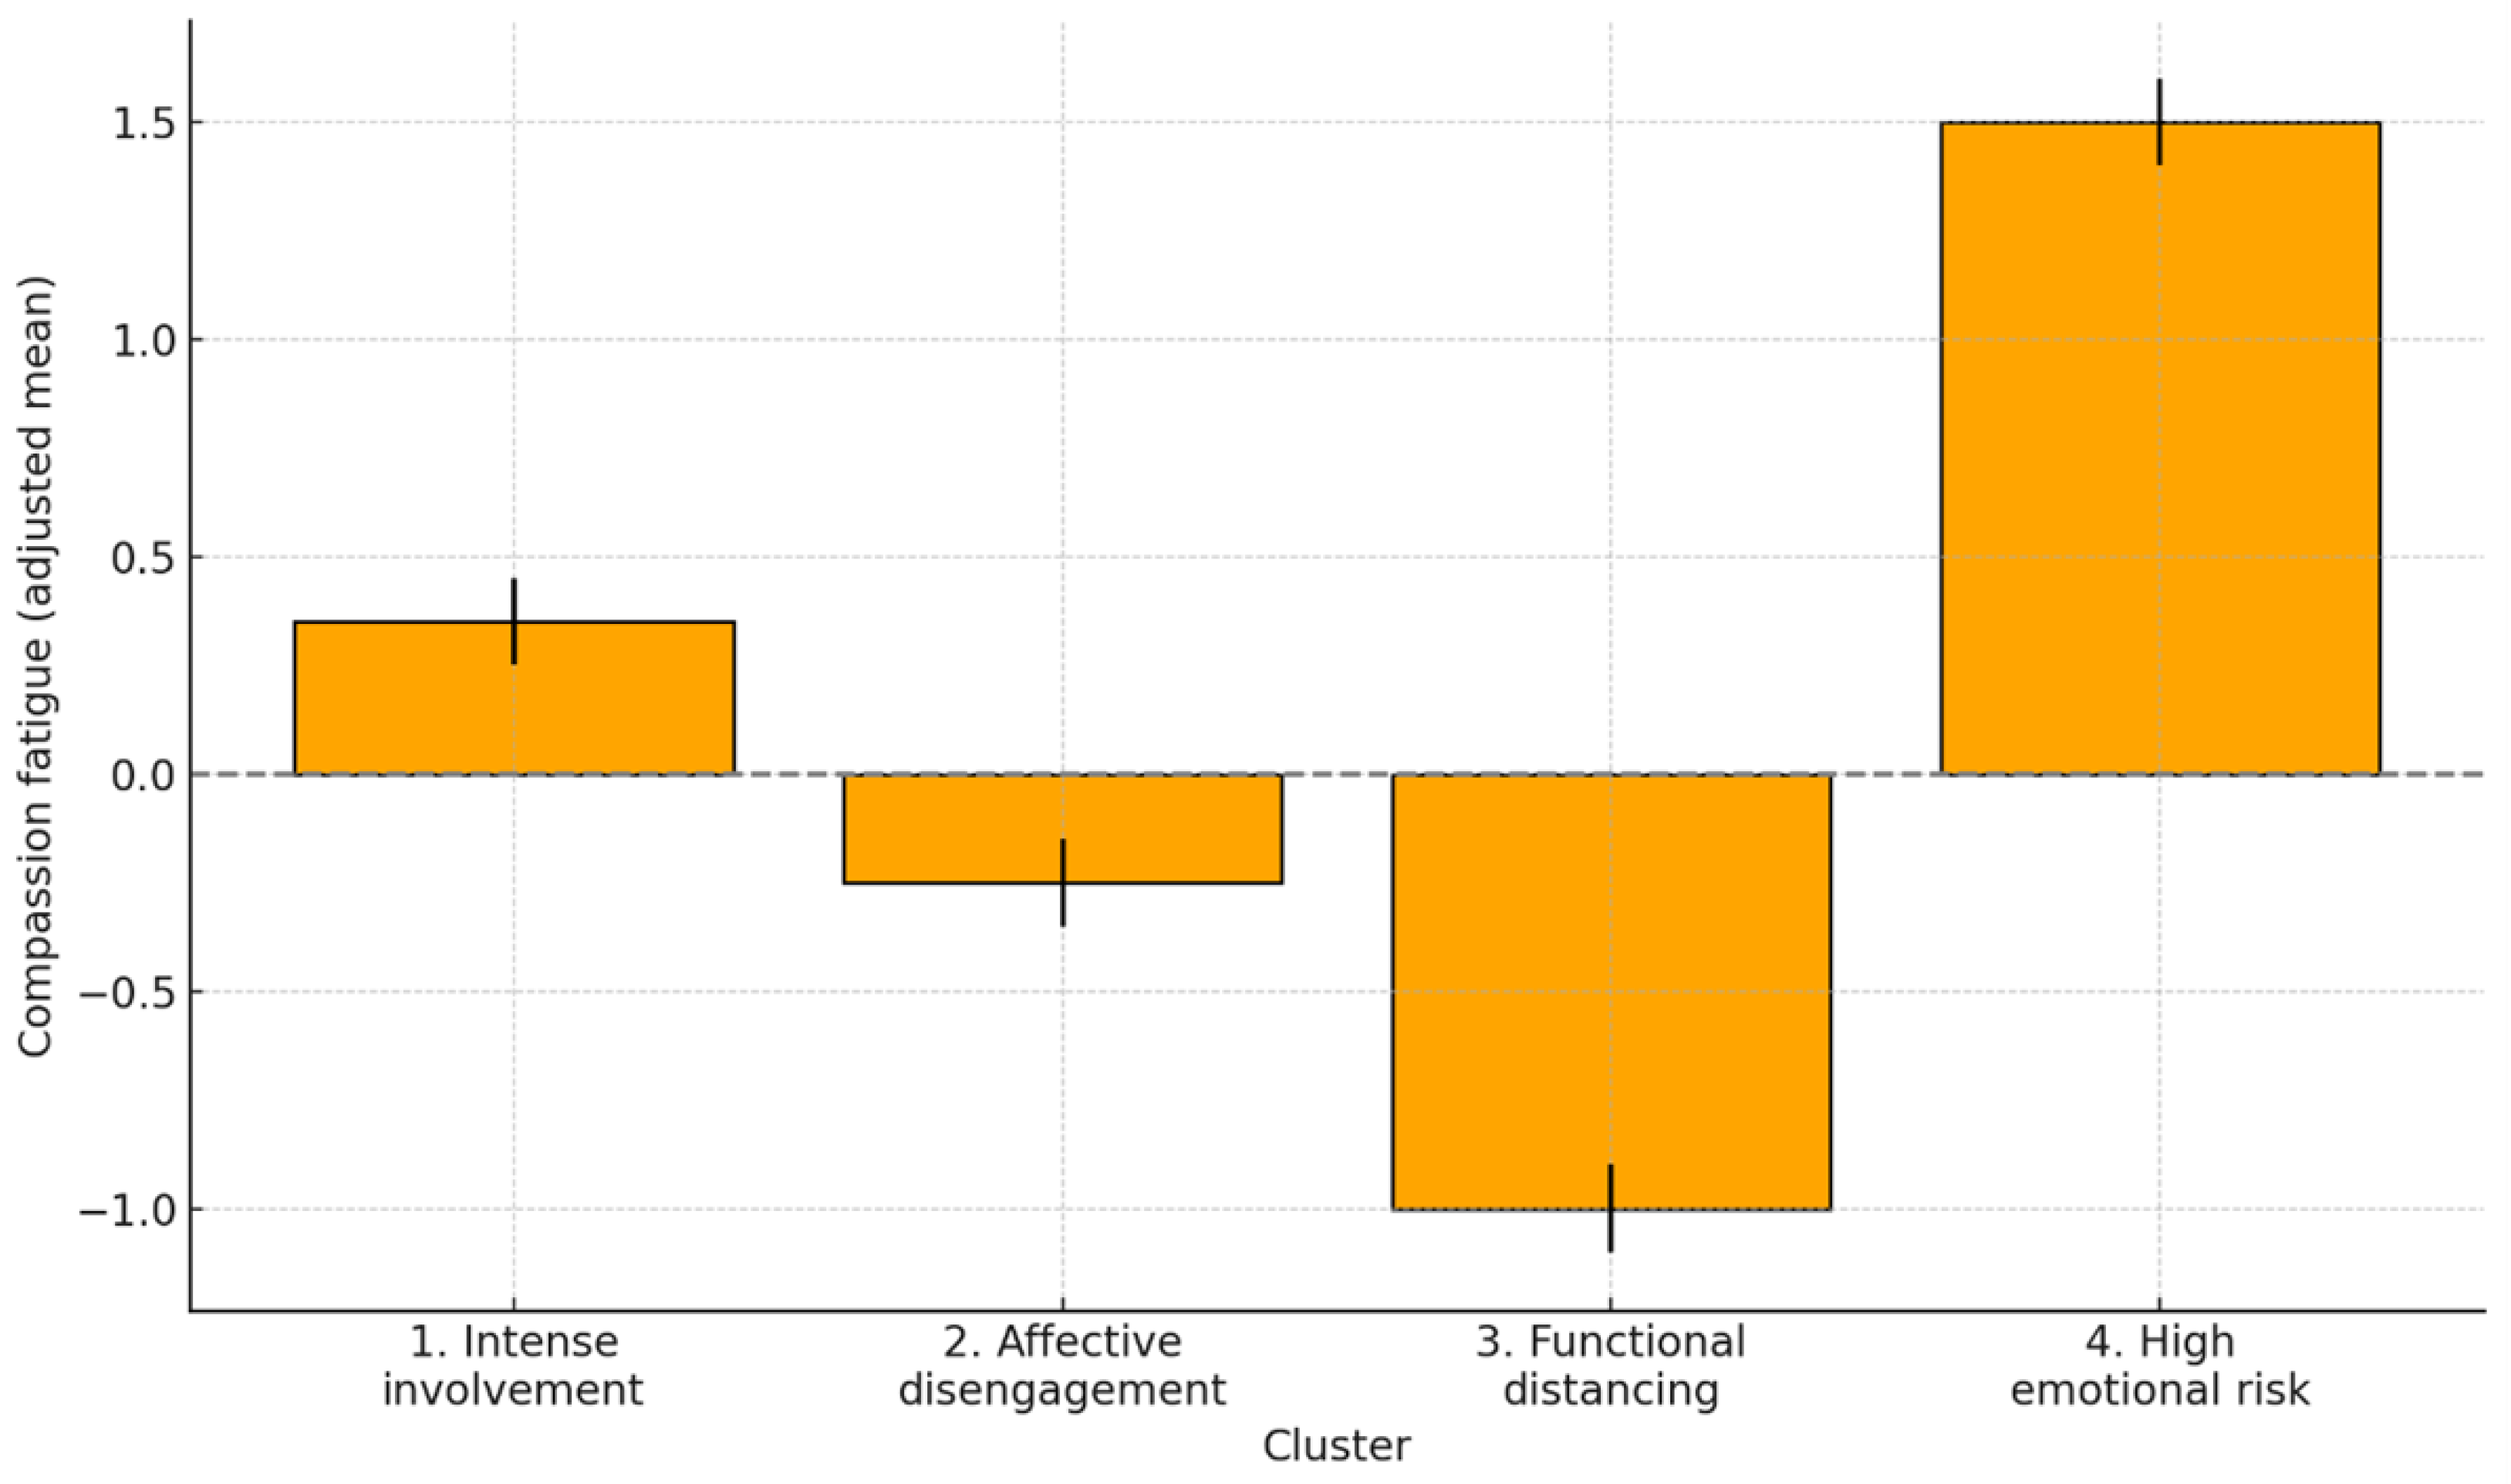
Figure 6.
The semantic network of co-occurrences between the categories of discomfort identified in the comments.
Figure 6.
The semantic network of co-occurrences between the categories of discomfort identified in the comments.
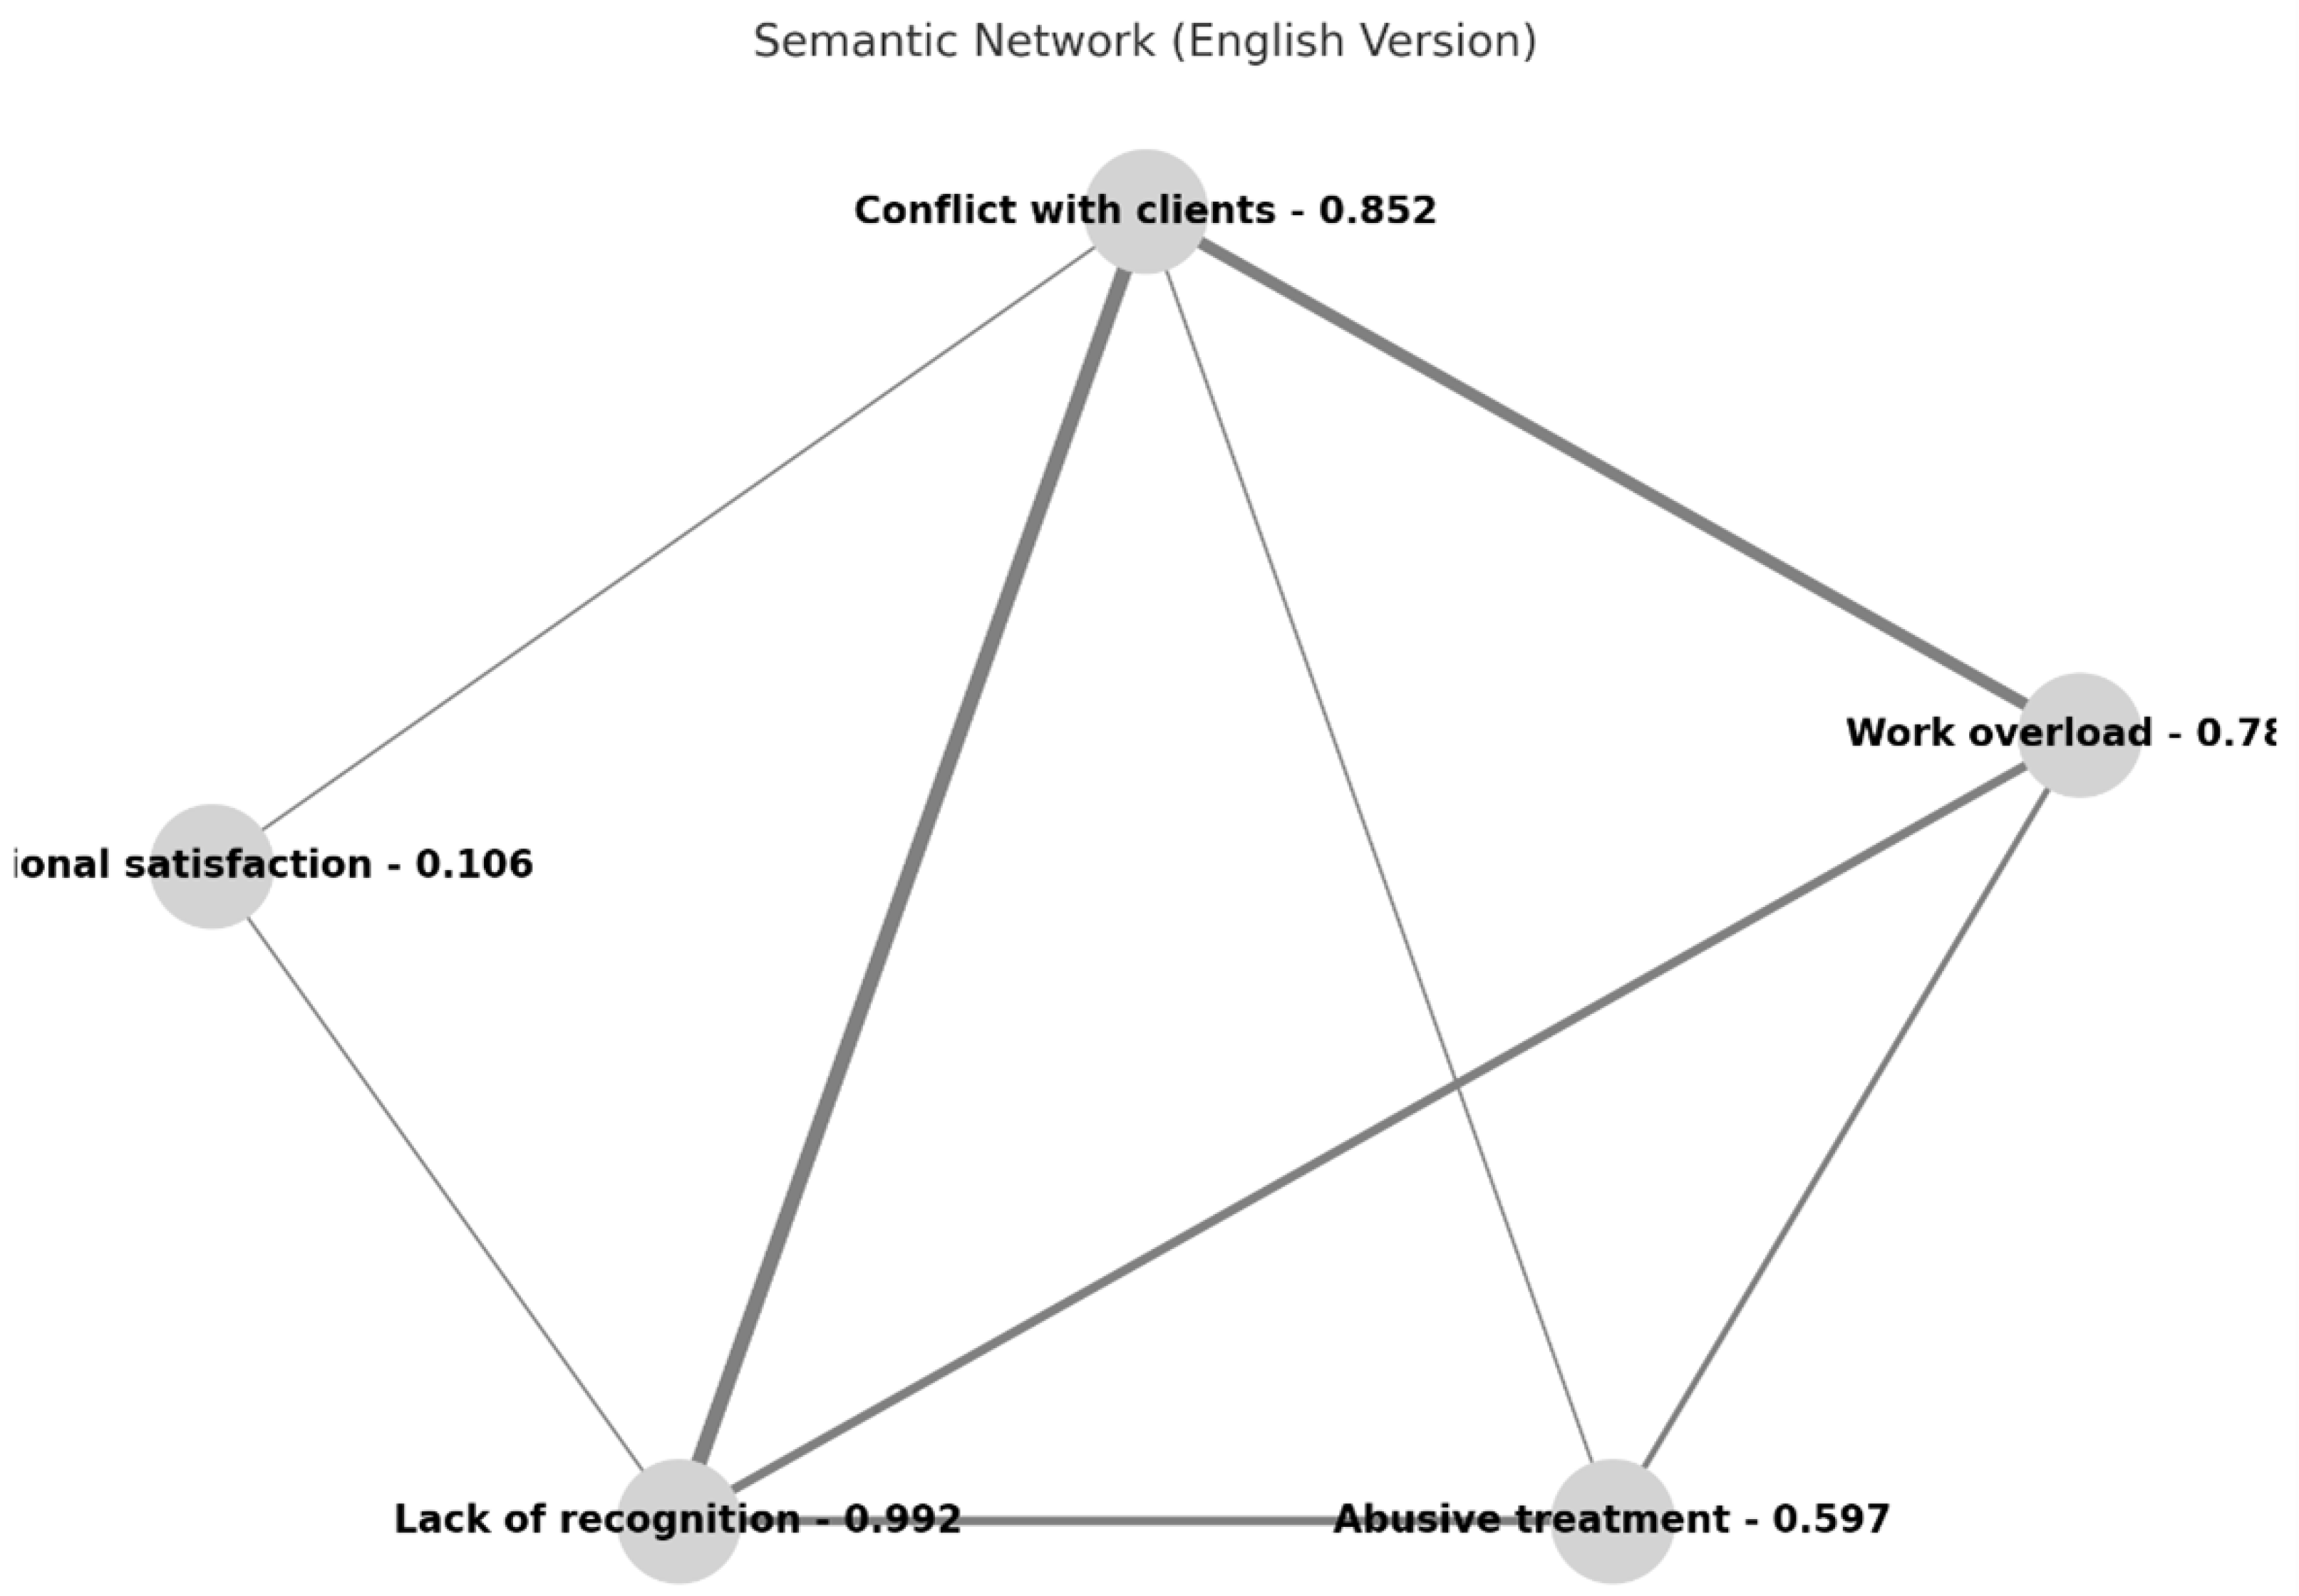
Table 3.
Crude mean adjusted mean and confidence intervals (95% CI) of compassion fatigue according to emotional profile1.
Table 3.
Crude mean adjusted mean and confidence intervals (95% CI) of compassion fatigue according to emotional profile1.
| Cluster | N | Mean FC (Raw) | HRT (Raw) | Adjusted Mean HR | SE Adjusted FC | 95% CI (Lower) | 95% CI (Upper) |
| 1. Intense emotional involvement | 37 | 0.363 | 0.426 | 0.352 | 0.85 | 0.184 | 0.52 |
| 2. Emotional detachment | 36 | -0.299 | 0.636 | -0.293 | 0 | -0.467 | -0.119 |
| 3. Functional distance | 30 | -0.103 | 0.524 | -1.035 | 0.95 | -1.223 | -0.847 |
| 4. High emotional risk | 3 | 1.477 | 0.457 | 1.489 | 0.95 | 1,301 | 1,677 |
1 Adjusted means were calculated controlling for gender, dichotomous age and cohabitation with a partner.
Table 5.
Results of the ordinal regression model: sociodemographic variables as predictors of emotional risk level 1.
Table 5.
Results of the ordinal regression model: sociodemographic variables as predictors of emotional risk level 1.
| Predictor | B | Standard Error | p | OR (Exp(B)) | 95% CI OR (Lower Limit–Upper Limit) |
| Sex (female) | 0.169 | 0.263 | .518 | 1.184 | 0.707 |
| Age > 44 years | 0.744 | 0.293 | .011 | 2.105 | 1,192 – 3,716 |
| Living with a partner | 0.662 | 0.292 | .02 | 1.93 | 1.098 |
1 Dependent variable: belonging to emotional risk profiles derived from cluster analysis. Reference category: least severe profile (functional distancing).
Disclaimer/Publisher’s Note: The statements, opinions and data contained in all publications are solely those of the individual author(s) and contributor(s) and not of MDPI and/or the editor(s). MDPI and/or the editor(s) disclaim responsibility for any injury to people or property resulting from any ideas, methods, instructions or products referred to in the content. |
© 2025 by the authors. Licensee MDPI, Basel, Switzerland. This article is an open access article distributed under the terms and conditions of the Creative Commons Attribution (CC BY) license (http://creativecommons.org/licenses/by/4.0/).
Copyright: This open access article is published under a Creative Commons CC BY 4.0 license, which permit the free download, distribution, and reuse, provided that the author and preprint are cited in any reuse.


