1. Introduction
Long period optical fiber gratings (LPG) have known for almost three decades [
1,
2,
3] and the most straightforward application being single- and multi-parameter sensing [
4,
5]. Phase-shifted and cascaded LPGs were soon developed and shown to open new opportunities for a variety of sensing applications [
6,
7,
8,
9].
The theoretical description of the principle of operation of the LPGs are the mode coupling equations [
2,
7,
9] both for non-birefringent and birefringent LPGs [
10]. The coupled mode equations describe the power exchange between the core fundamental mode and a higher order cladding mode. The difference between the effective refractive indices of the two modes is wavelength dependent. In case the wavelength dependence is monotonous and the dispersion does not change sign the LPG exhibits a single resonance wavelength for a particular pair of coupling modes. A particular case of a cascade of non-identic LPGs whose dispersion is with a constant sign has been analyzed theoretically and experimentally in [
9]. In case the dispersion changes sign over a specific spectral range the LPGs exhibits a double resonance [
11,
12,
13,
14]. Since the two minima at the resonance wavelengths shift in opposite directions double resonance (DR) LPGs exhibit a higher sensitivity to SRI, temperature and strain which is why they have caused an increased interest for a variety of sensing applications [
15,
16,
17,
18,
19,
20,
21,
22,
23,
24]. In the case of biochemical sensors the DR LPGs have to be functionalized to achieve a desired selectivity.
Thus far, single DR LPGs are basically used for large variety of biosensing applications [
13,
15,
18,
21,
22,
23,
24]. The LPGs are operated close to the turn around point (TAP) at which the single minimum splits and the grating becomes double resonance featuring a maximum sensitivity to SRI. However, while the sensitivity can be as high as 3000 nm/r.i.u. the minima are relatively broad and the accuracy of determining the positions of the minima and hence the splitting is lower.
To overcome the above problem the performance of a cascade of two coated DR LPGs has been simulated theoretically [
25] and it has been shown that much sharper resonance minima and a sensitivity to SRI as high as 12550 nm/RIU can be achieved around water refractive index (1.33- 1.334). Experimentally, cascaded DR LPGs have been fabricated using an 248 nm UV excimer laser in a PS1250/1500 photosensitive fiber and their sensitivities to SRI and temperature have been measured. While the experimentally obtained minima are sharper, the measured sensitivities were still comparable (≤ 3000 nm/r.i.u.) to those of single DR LPGs.
In this paper we present the general matrix description of cascaded LPGs and the case of effective refractive difference varying monotonically and non-monotonically with wavelength causing a split of the resonance leading to a cascade of DR LPGs. Our objectives are: i) to compare the performances of single DR LPGs and cascaded DR LPGs, ii) to study the techniques to fine-tune the cascaded grating to the TAP at a desired operational temperature and SRI; iii) to measure the sensitivity to SRI, temperature and strain for future biosensing applications.
2. Matrix Description of LPGs and Cascaded LPGs
2.1. Coupling Matrices
2.1.1. A Single LPG
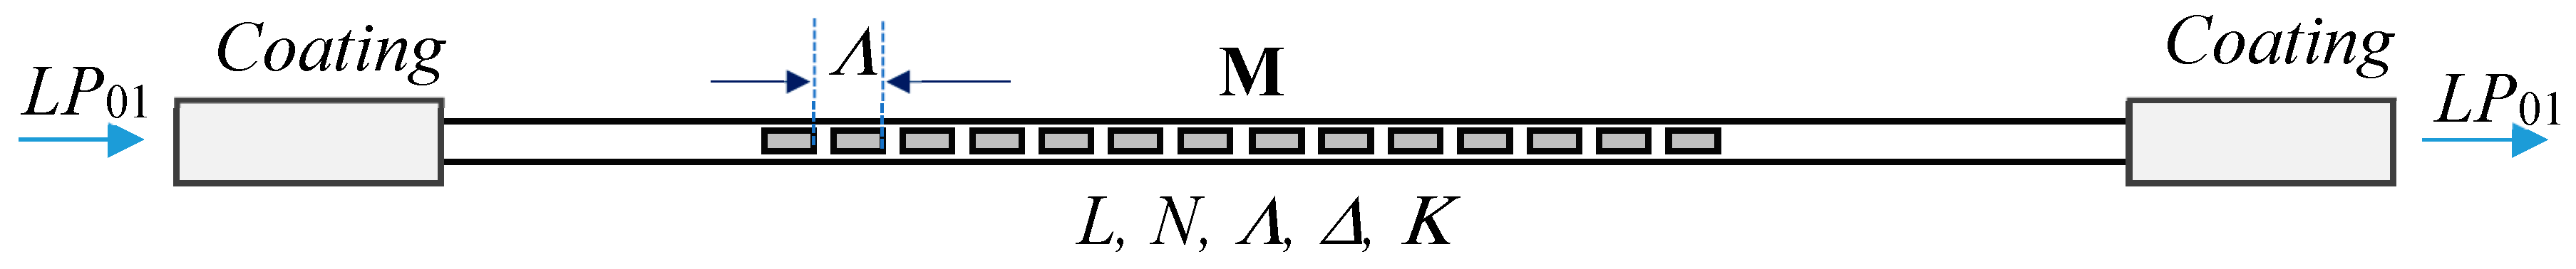
A long period grating (LPG) is a series of periodic opto-geometrical modifications of the fiber, which cause the fundamental
LP01 core mode to couple to a higher order LP
0p cladding mode of the glass-surrounding medium waveguide. During fabrication the surrounding medium is air and the effective waveguide is a glass-air waveguide. The fiber structural modifications can be introduced using different techniques such as refractive index modifications, geometrical deformations, mechanical stress and others. A schematic representation of an LPG is shown in
Figure 1. The fundamental LP
01 core mode with an amplitude
is launched into the grating at the input.
As the mode propagates along the grating periodically a fraction of its power is coupled to the higher order
LP0p cladding mode. At the output of the grating we have both modes with different amplitudes. The grating is described by a matrix
M which transforms the input vector
of the mode electric fields into an output vector
as [
2]:
where
Ao and
A are the input and output electric vectors containing electric field amplitudes
and
of the core LP
01 and
and
of the cladding LP
0p mode. The matrix describing the coupling between the core and the cladding mode is [
2]:
In (2)
δβ is the difference between propagation constant
β0 the fundamental core mode (LP
01) and
β0p of the higher order cladding mode (LP
0p) which is
where
κ is the coupling and
δ is the detuning coefficient between the core and cladding modes are obtained from [
2] as:
The coupling (Κ) and detuning (Δ) coefficients from (2) are normalized to
δβ as [
2]:
The effective refractive index difference
Δneff depends on the wavelength (
λ), temperature (
T), the refractive index (
n) of the surrounding medium, the fiber deformation (
ε) and under fixed external parameters the detuning parameter becomes zero at resonance wavelength which is obtained from (3b) as:
Thus, the resonance wavelength
λc is dependent on
n,
T and
ε so
which is the basis for the variety of sensing applications. With an LP
01 mode at the input
and the LP
0p mode attenuated in the coated section of the fiber, only the fundamental LP
01 mode is observed at the fiber output with an amplitude
Ac(
z =
L = NΛ)
By letting
C = cos(
δβL) and
S = sin(
δβL) the measured intensity
I is written as:
2.1.2. A Cascaded LPG (C LPG)
A cascaded LPG (C LPG) consists of (at least) two gratings LPG
1 and LPG
2 separated by a fiber section of length
L0, whose transmission matrix is
T0 (
Figure 2) and describes the parallel independent propagation of the LP
01 and LP
0p modes [
7,
9]
Physically, the CLPG (
Figure 2) is a Mach-Zehnder interferometer in which the LP
01 mode which is well confined in the fiber core stands for the reference arm, while the higher-order
LP0p cladding mode which is more sensitive to external perturbations is the sensing arm. In a classical interferometer the change of the phase difference between the two arms causes[7,9 the rise and displacement of new interference fringes. For a cascaded DR LPG (C DR LPG) the fringes will be manifested as an additional modulation in the spectral domain. Since in the general case the gratings are considered different, each one is characterized by its parameters
Li, Ni, Λi, Δi, Κi (
i = 1,2) [
9]. In the intermediate section with length
L0 the coupling coefficient is
κ0 = 0 while
Λ → ∞ so
δ = π
Δneff/λ so
and the accumulated phase difference between the modes (in 8b) is so
Also in (8b)
a0 and
a are amplitudes of the core LP
01 and the cladding LP
0p mode, the accumulated phase difference between which is
Assuming only core mode at the input and at the output, i.e.
and
after some manipulations the resultant intensity is obtained from (8) as [
9]:
where
and
η is the ratio of the cladding-to-core mode ratio
η =
a/
a0.
In the case of no intermediate section
a0 =
a = 1 and
Δφ=0.
which is the equation for an LPG of two non-identic parts.
In case the two parts are identic
L1 =
L2 =
L0 =
L/2,
C1 =
C2 =
C0 = cos(
δβL0),
S1 =
S2 = S
0 = sin(
δβL0), Δ
1 = Δ
2 = Δ, Κ
1 = Κ
2 = Κ and taking into account the normalization (4) as well as that we obtain that
which is the result for an LPG with
L = 2
L0 from (7).
Using the general expression (11) different particular cases can be studied and simulated. Intentionally [
5] or not, during fabrication the LPGs may be non-uniform and the simplest approach to account for existing non-uniformities is to assume that the two LPGs are different, though slightly.
2.2. Particular Cases
2.2.1. Non-Uniform and Uniform Structures
In case the two LPGs are identic Δneff1= Δneff2 =Δneff, N1 = N2 = N and Λ1 = Λ 2 = Λ and the same holds for the coupling and detuning coefficients. The structure is then uniform.
For specific applications as the simultaneous measurement of average temperature and thermal gradient [
5,
9], the cascade or the grating can be intentionally made non-uniform by either writing Λ
1 ≠ Λ
2 and Δn
eff1 = Δn
eff2 = Δn
eff or Λ
1 = Λ
2 = Λ and Δn
eff1 ≠ Δn
eff2. Differences in the Δn
eff can be achieved either by partially etching one of the subgratings, or by changing the intensity of the laser writing the grating. Such differences, though not constant can be obtained during fabrication due to laser instabilities, non-uniform additional coatings etc.
2.2.2. Effect of Dispersion
The effective refractive index difference Δneff is wavelength dependent and we can distinguish two important cases: linear dependence with a constant dispersion, and non-linear dependence with a change of the magnitude and of the sign of the dispersion:
In the linear case we assume that over a certain spectral range, the effective refractive index Δn
eff is a linear function of wavelength in the form
where
A and
B are some constants depending on the particular mod,
A being the dispersion illustrated by the examples in
Figure 3 below as recovered from [
3]. The detuning parameter (3b) can then be represented as:
At resonance δ = 0 at a wavelength λ
c which is from (15a) is related to the period as:
As an example, for mode 1 from
Figure 3a)
A = -0.0018 μm
-1 and
B = 0.007. So a resonance at λ
c = 1.5 μm would require a grating period of Λ = 348.4 μm.
The linear dependence of the type (14) has been taken into account for the analysis of the temperature behavior of cascaded LPGs made of non-identical LPGs [
9].
- B)
Non-linear dependence and double resonance LPGs
In this case we consider that for a specific higher order cladding mode over a certain spectral range
Δneff is nonlinear and exhibits a minimum. As an example we consider the detuning Δ
N between the fundamental core and a higher order cladding mode defined in [
19] as:
Figure 2b) reproduces the wavelength dependences of ΔN(λ) as calculated in [
19] which can be sufficiently well (
R2=0.999) approximated by a quadratic function in the form
With reference to (16) the detuning coefficient δ from (3b) is found in this case to be wavelength dependent as:
The resonance is then observed for wavelengths for which δ(λ) = 0 i.e.
ΔN(λ) =0 as follows from (17b). Taking the second order polynomial approximation (17a) we have:
or
The spectral separation Δλ between the two resonance wavelengths λ
c2 and λ
c1 is
By zeroing the first derivative of (18a) with respect to
λ the wavelength at which the detuning
ΔN(
λ) has a minimum is obtained as:
The fitting coefficients a, b and c depend on the particular mode, the strength of the coupling, cladding diameter, the ambient temperature, the SRI, the imposed strain and other factors.
If we take as examples the fitting coefficients for modes 24 and 21 from
Figure 3b) we can find using Equation (18) that
As the coefficient
c in (18a) shifts the parabolic function above or below the zero line for a certain value of
c the separation Δλ
c = 0 which from (18c) is found to be fulfilled for
In this case λ
c1 = λ
c2 = λ
m and is referred to as the turn around point (TAP). For
c <
cTAP the LPGs exhibits two minima which go apart as
c decreases and the grading becomes double resonance grating (DR LPG).
3. Experimental Part
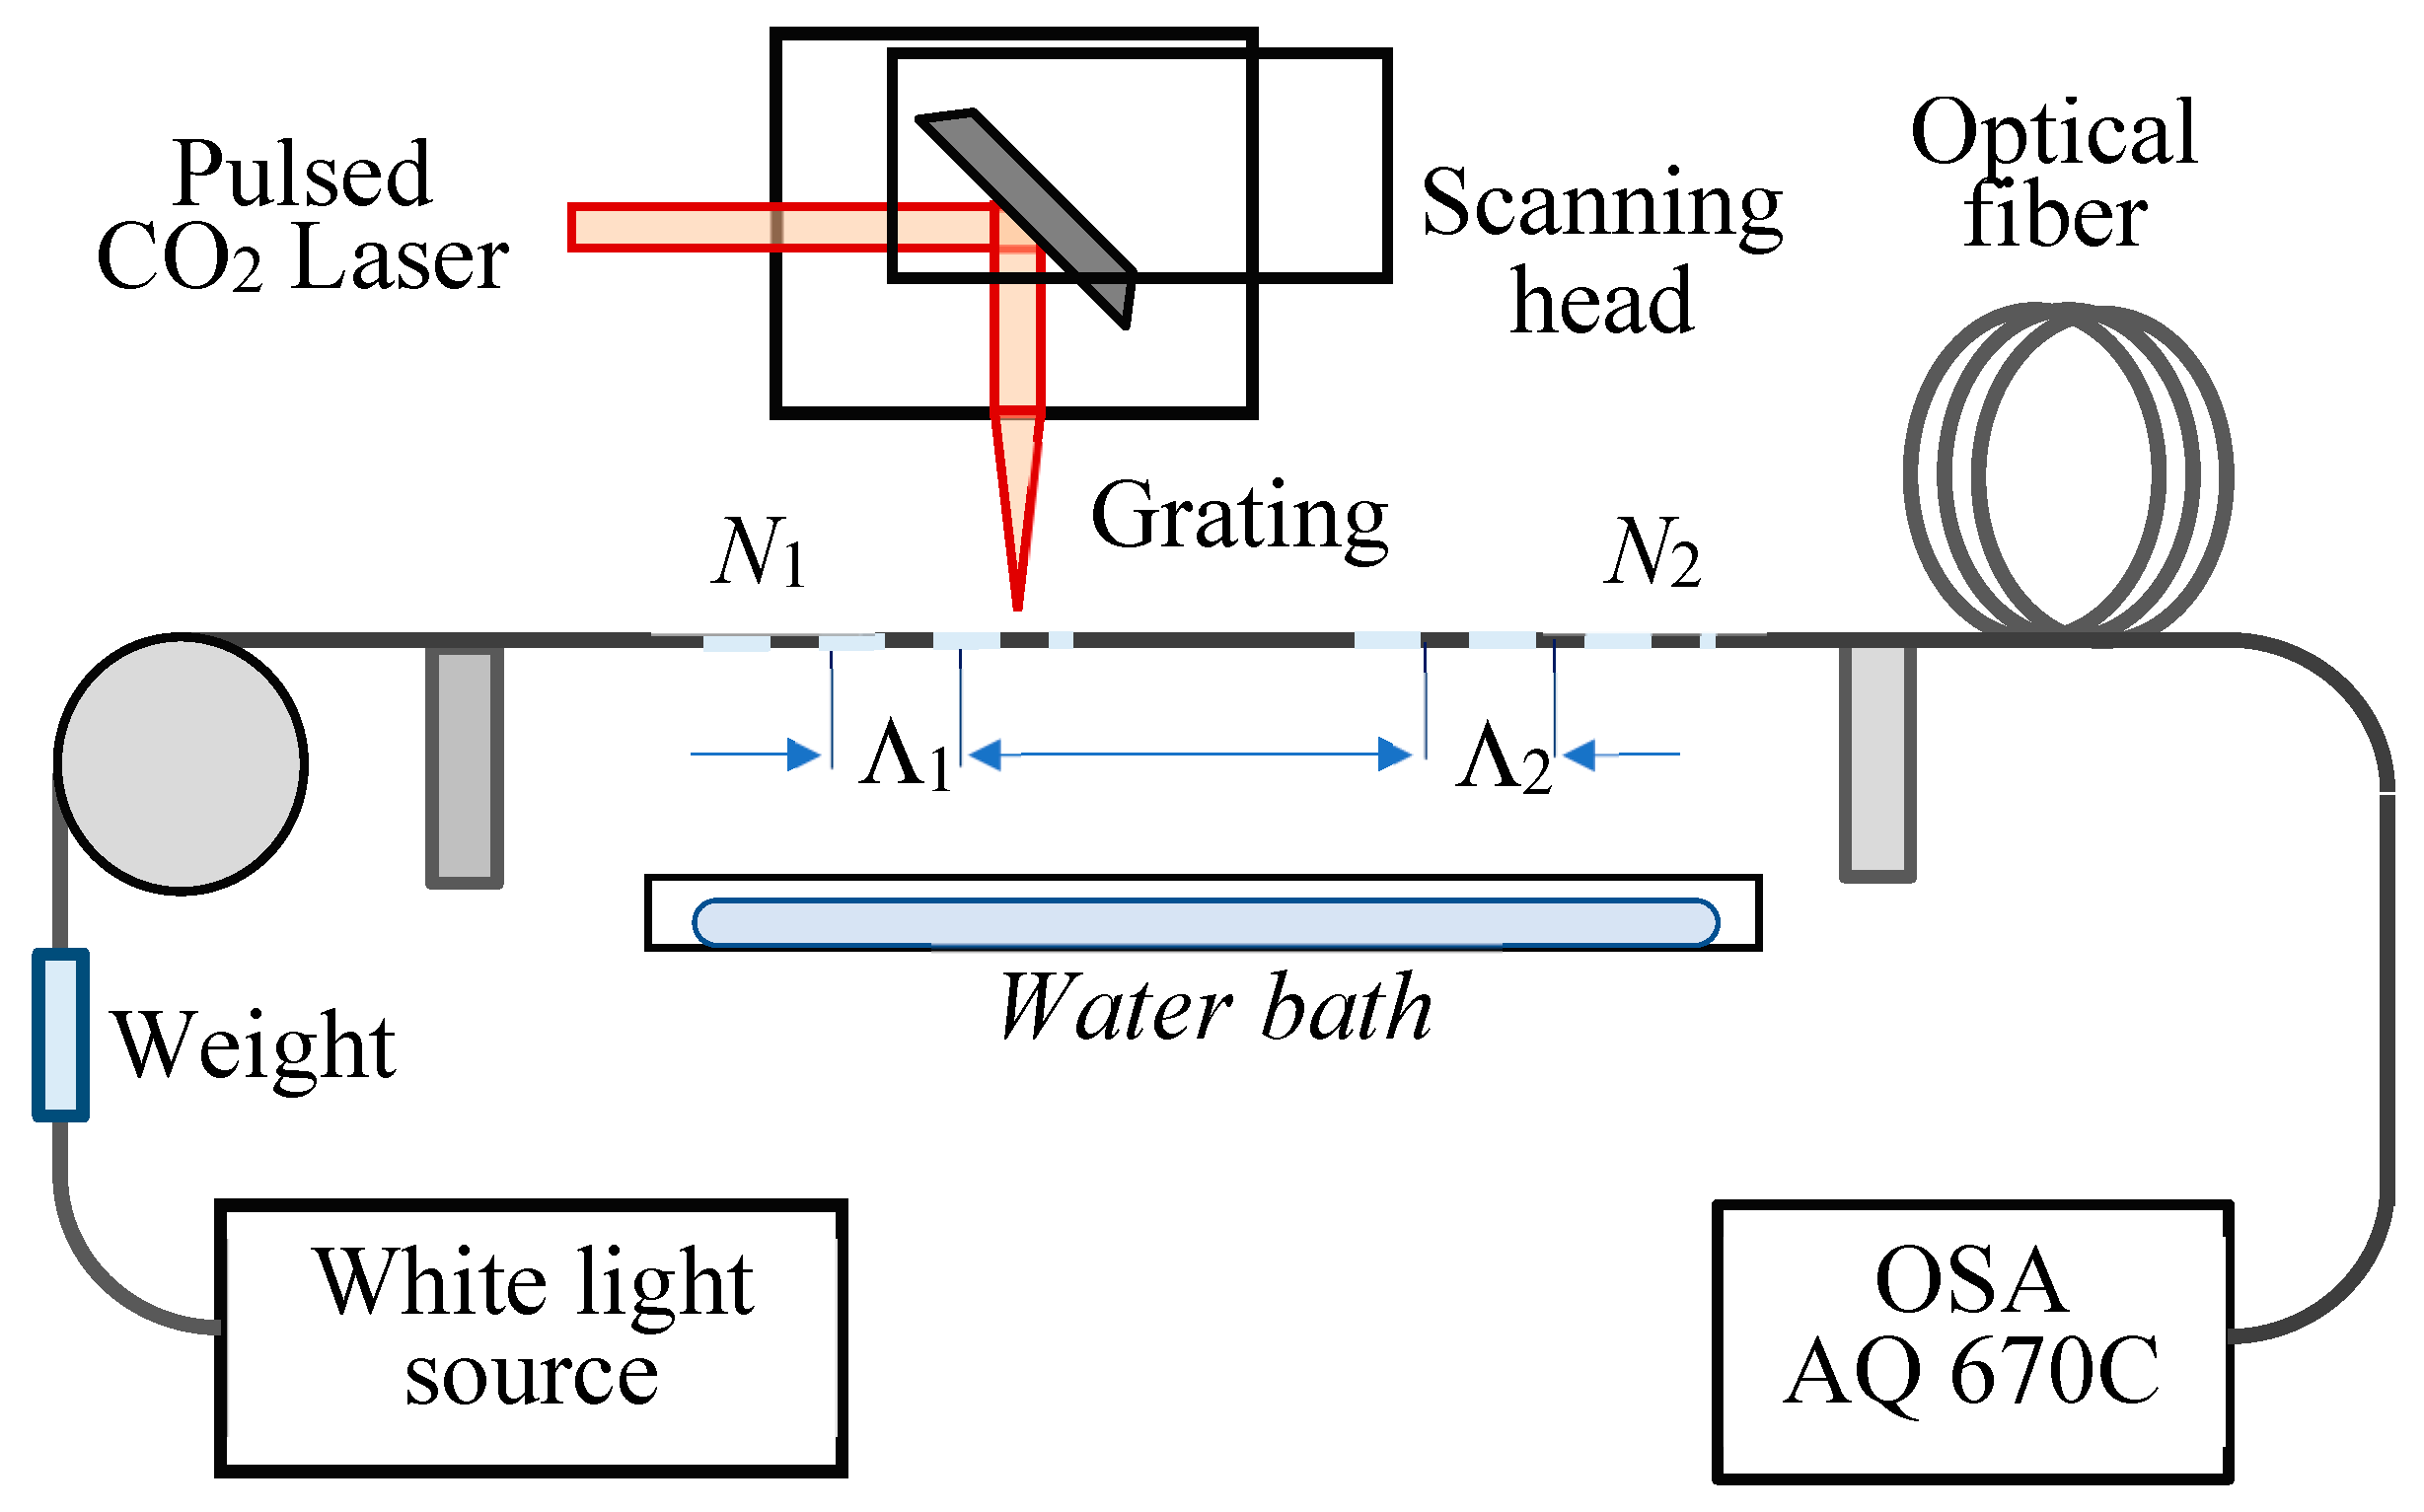
3.1. Experimental Setup
The DR LPGs and the cascaded DR LPGs were fabricated using a pulsed CO
2 laser (SYNRAD FHFL30-U) using the experimental arrangement presented schematically in
Figure 4. The optical fiber was a Fibercore photosensitive fiber PS1250/1500 with a 9.6 μm fundamental mode field diameter. The C DR LPGs consisted of two parts with same number of periods
N1 =
N2 and the same period Λ = 207.6 μm and effective refractive indices Δn
eff,i (
i = 1,2). The DR LPGs were labeled as P xxx, while the C DR LPGs as CP xxx. The laser power expressed as percentage of the maximum power P
max = 30W, sufficient to write the gratings was in the range between 13.1% and 14.4%. The scanning speed was 24 cm/s. Theoretically, the uncertainty in the total length is about 10 μm which is determined by the laser marking software. This ensures a better than 0.1 μm precision in the period of the gratings. A K- broadband light source was used to observe the spectrum in the 400 nm to 1700 nm range of the OSA (AQ 6370C).
3.2. CO2 Laser Writing Process
3.2.1. Fabrication Procedure
The fabrication procedure is as follows:
- i)
A section of about 10 cm of photosensitive PS1250/1500 fiber was cleaved, spliced in between SMF-28 lead-in/lead-out fibers and stripped bare over the whole length.
- ii)
The fiber was placed and fixed to one of the holders and kept straight with a small weight of 5g over a pulley at the other end.
- iii)
The particular grating pattern was drawn using the built-in software.
- iv)
The changes of the spectrum were controlled during the writing process which was carried out as consecutive scans if a single scan at a particular relative power was not sufficient to achieve the desired results.
- v)
After each scan the LPG was immersed in the water bath to check if the LPG splits in water.
- vi)
The process continues with the next scan until the LPG spectrum splits in water.
3.2.2. Fine Tuning Procedure
As the scanning during the writing process is not interrupted, in water the DR LPG may be split more than desired. To return it close to the TAP at a desired temperature (room temperature, for example) when immersed in a liquid with a desired refraction index (typically water) we used etching in HF acid. A U-shaped semicircular container was placed upon a thermoelectric cooler (TEC) with attached thermocouples which allow us to maintain a constant temperature during the etching process as well as to measure the temperature sensitivity.
The procedure is as follows:
- i)
The spectrum of the DR LPG is measured in water.
- ii)
The LPGs is then lifted from the U-shaped water container and is moved to a similar container filled with HF acid.
- iii)
The grating is kept in the acid and the spectrum is monitored continuously.
- iv)
As the spectrum approaches the TAP, the grating is returned to the water bath upon the TECs.
- v)
The temperature of the etched grating is varied to establish at what temperature exactly the grating splits.
4. Results
4.1. Postfabrication Tuning
4.1.1. Etching to TAP
As the process of fabrication is in the air and the desired spectrum is observed in water it is difficult to fine tune the grating during the writing process. One of the reasons is that if the writing process is interrupted before completing the fixed number of periods, then the cascade will be of non-identic gratings. In the general case if the desired initial spectrum is at turning point (TAP), then depending on the particular application, the operational ambient temperature, SRI and imposed longitudinal strain should also be known. We assume here that the desired initial operating conditions should be slightly split immediately after TAP around room temperature (T = 22C) and in water (SRI ≈ 1.333).
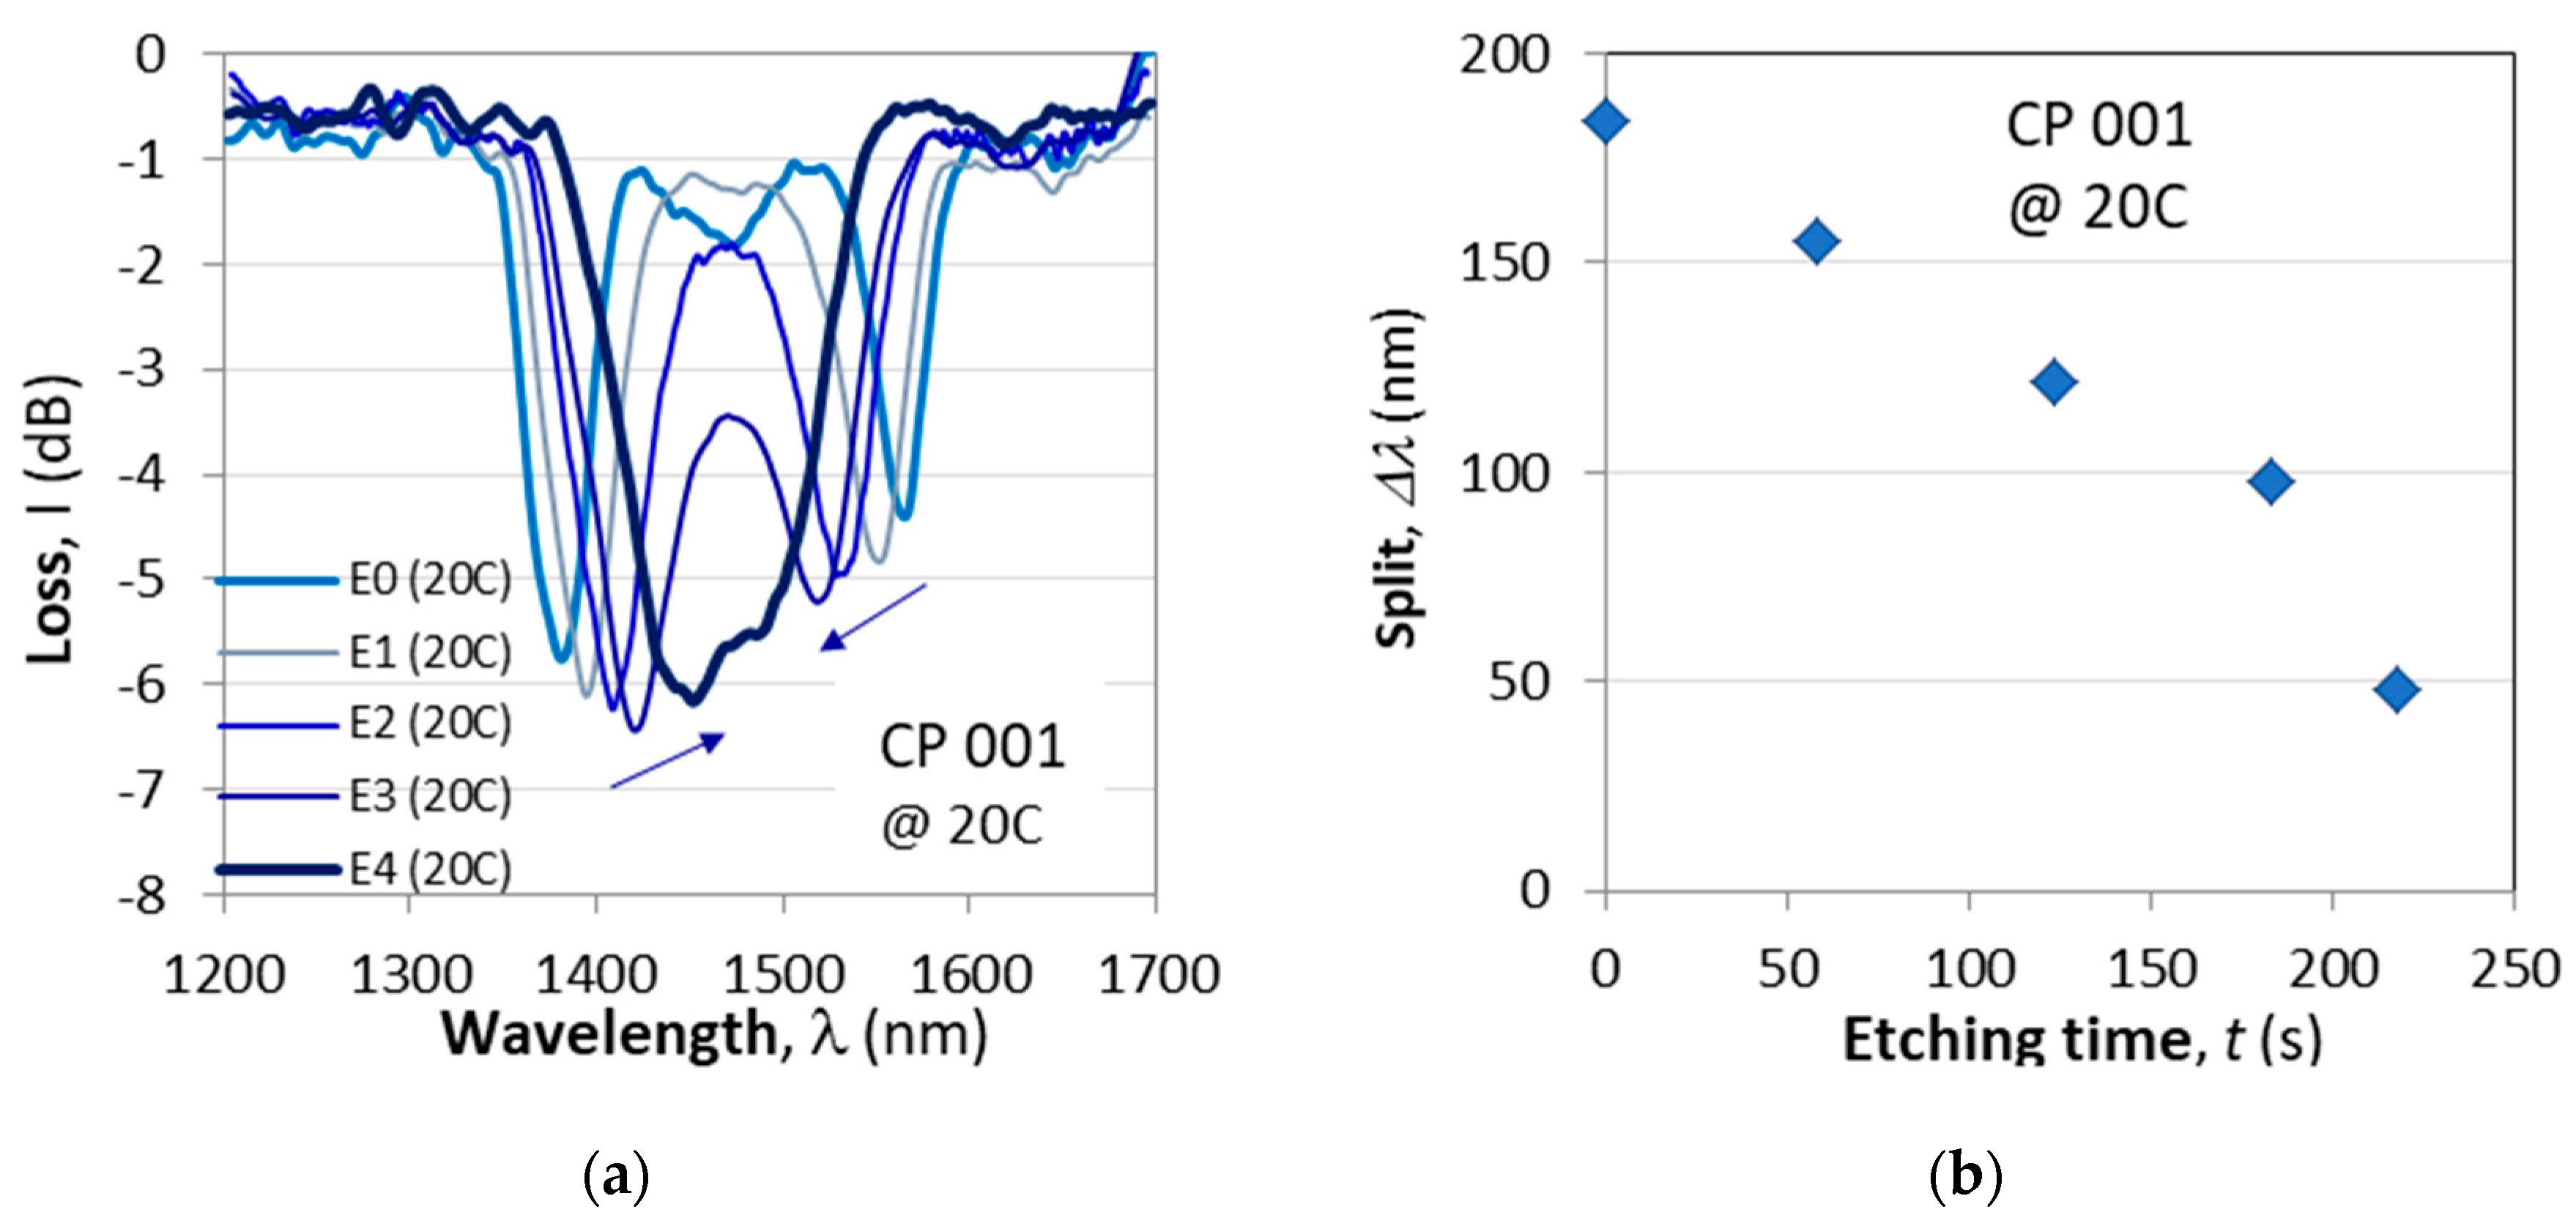
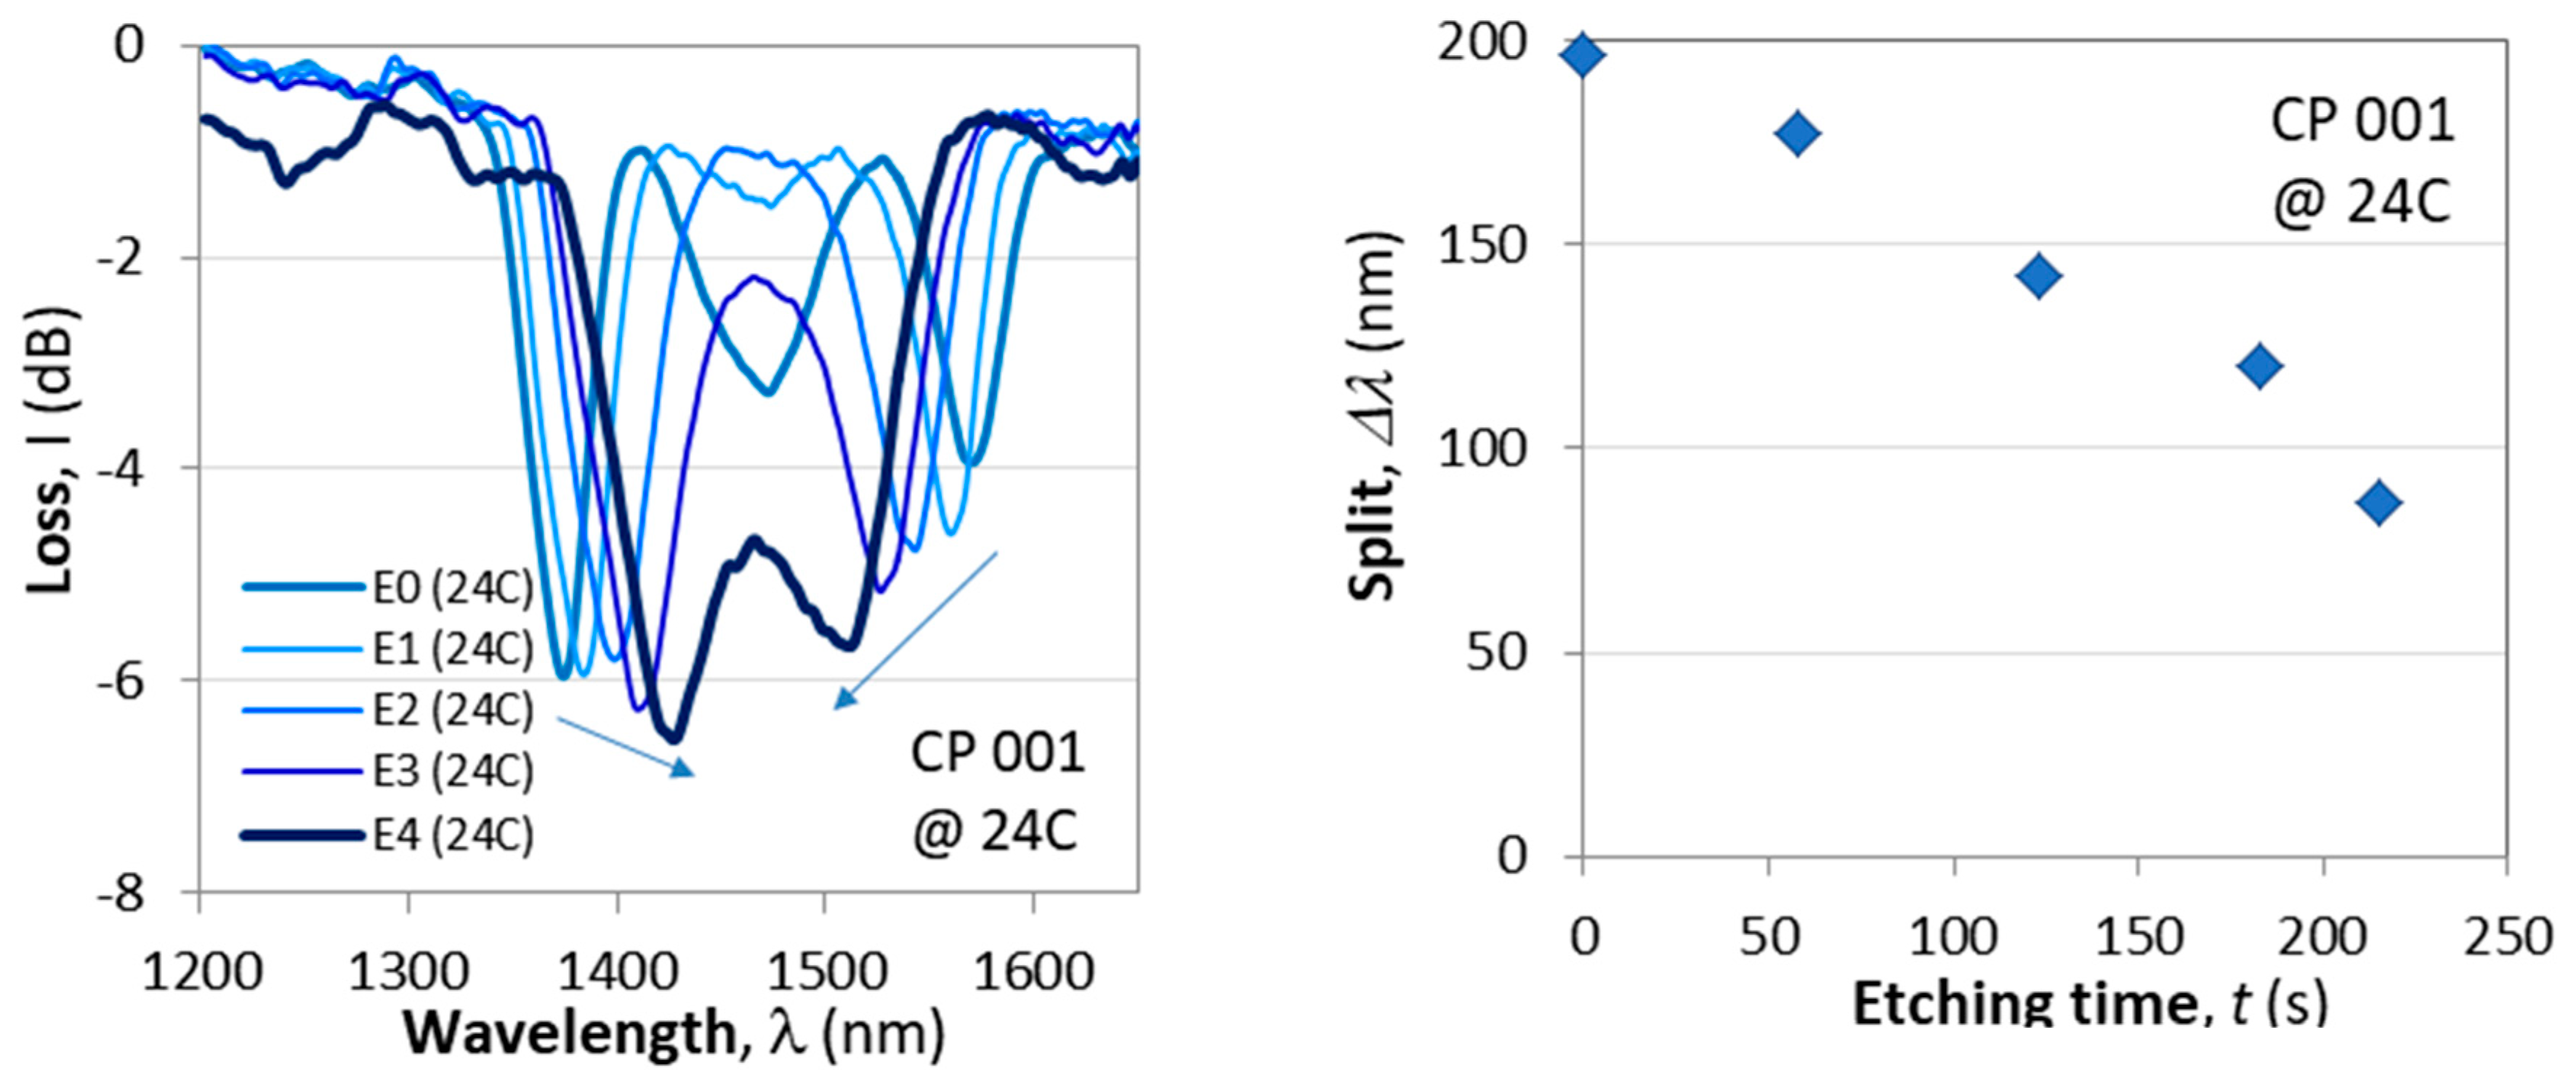
Figure 5a) illustrates the transition from a widely split C DR LPG before etching (E0) to the final spectral distribution of slightly split after the fourth etching (E4) as measured at 20C as a function of the etching time.
Figure 5c) shows the spectra of the same grating at 24C. To the right in
Figure 5b,d) are the corresponding plots of the spectral split Δλ vs. the etching time.
4.1.2. Fine Tuning to TAP by Means of Longitudinal Strain
For the purposes of sensing applications the C DR LPG’s initial spectrum should be slightly split, because after TAP the sensitivities are at a maximum. An additional fine-tuning to the point of discernible minima can be accomplished by means of a longitudinal strain which brings the minima closer to the TAP.
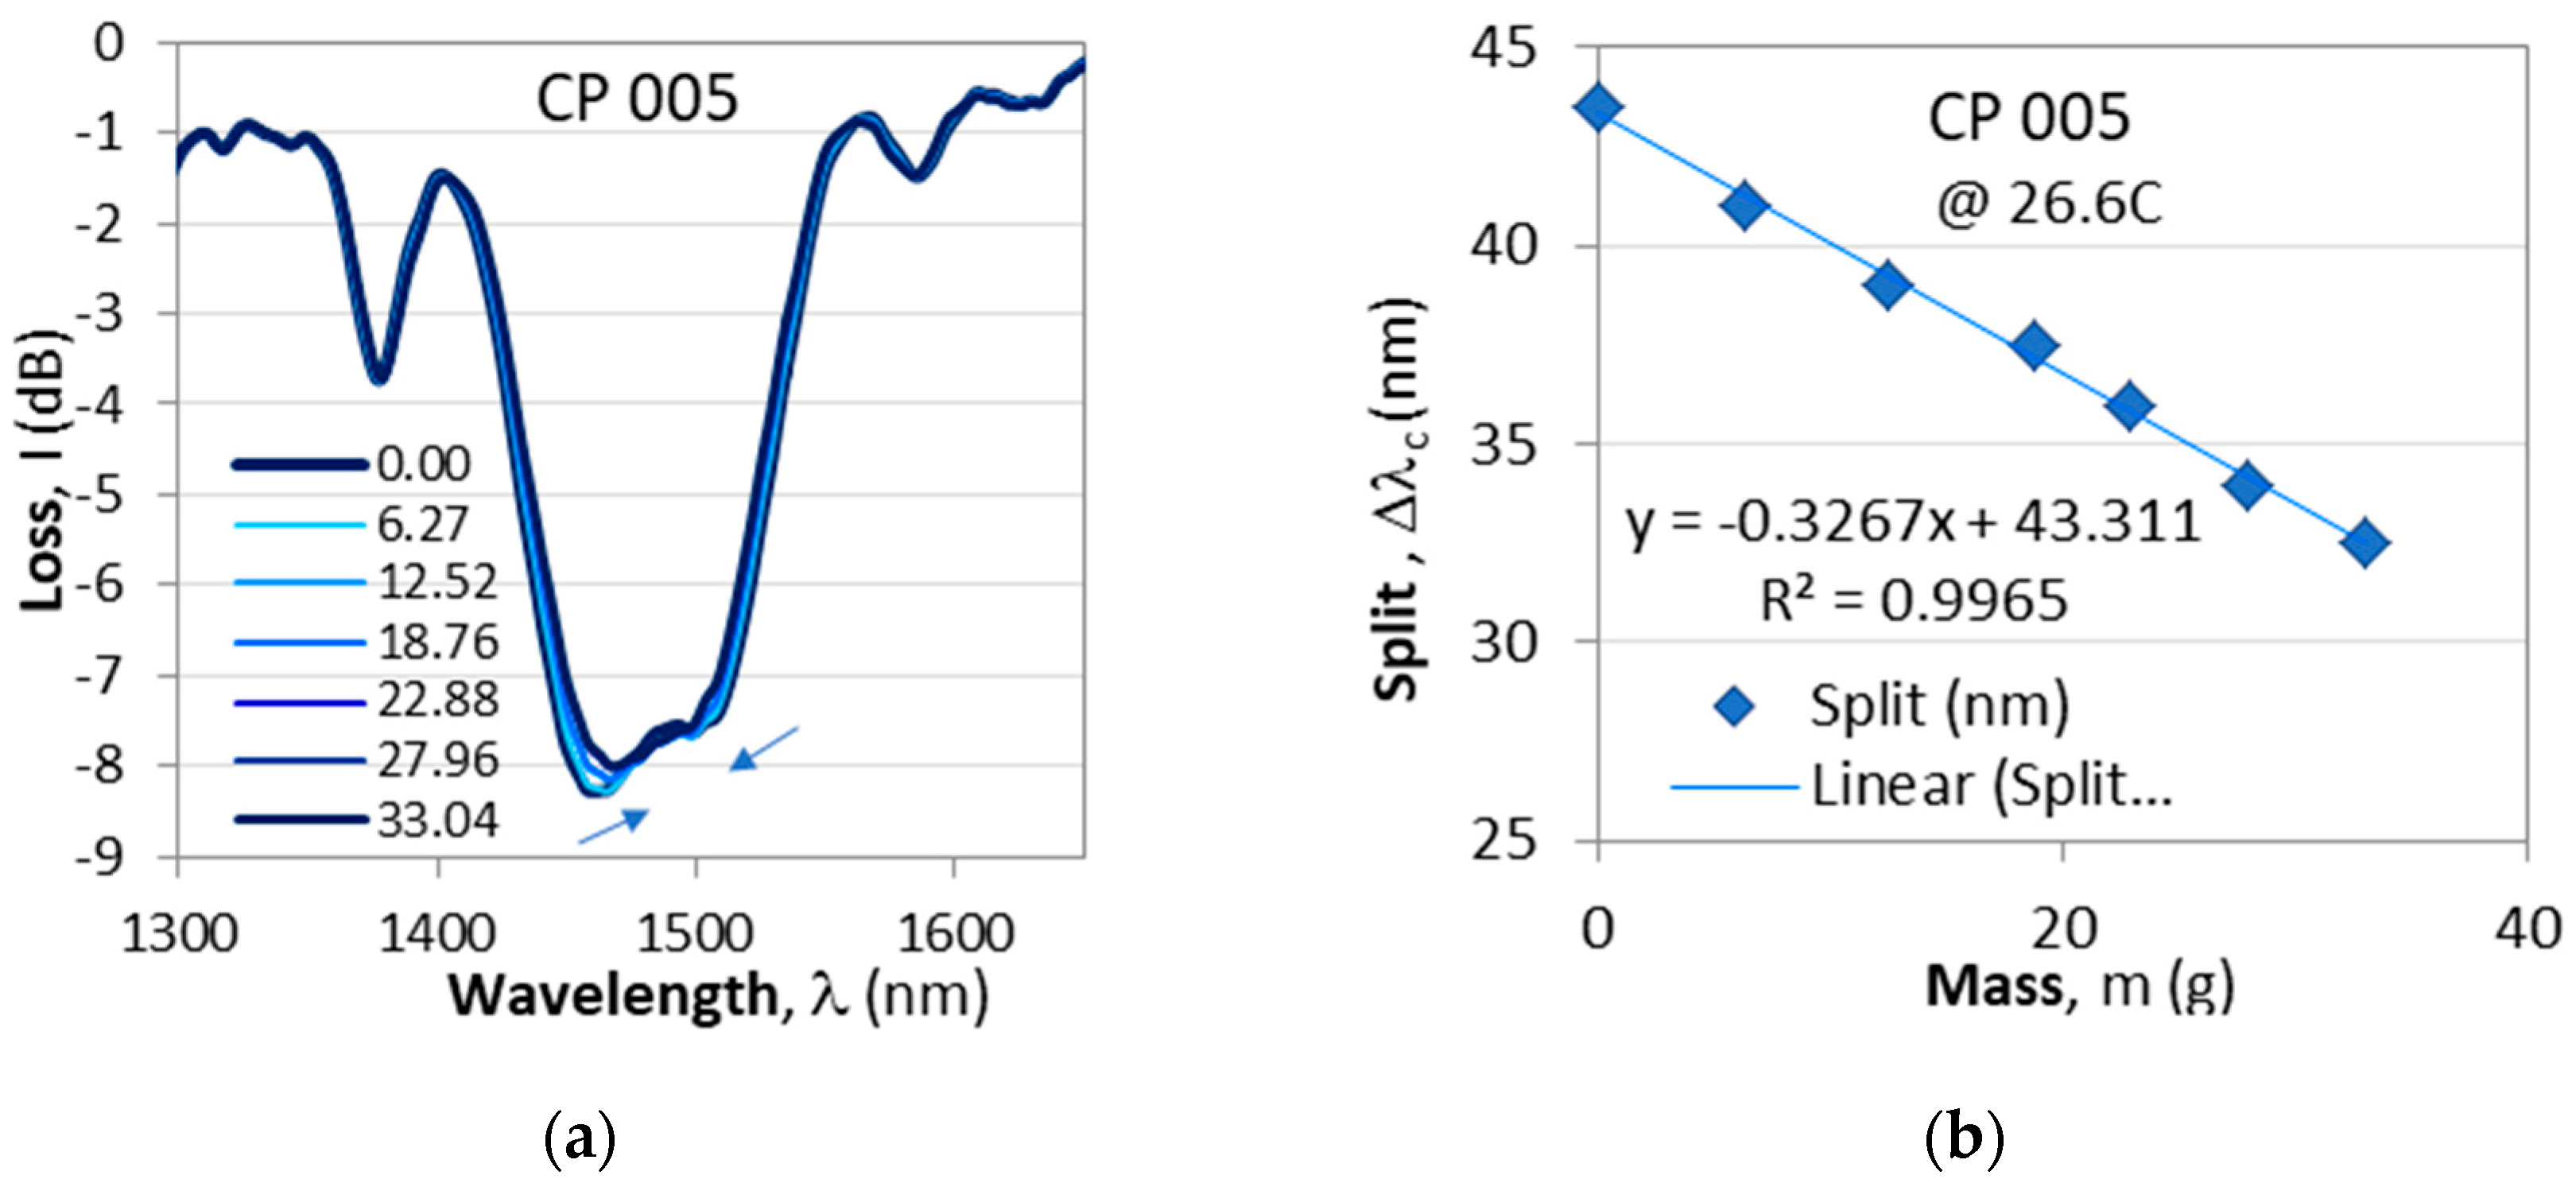
Figure 6 presents the spectral changes of a non-etched cascaded DR LPG as it is subjected to an increasing longitudinal strain by weights with a mass increasing to about
m = 33g.
4.2. Responses and Sensitivities to the Measurands
In this section we study the responses of the DR LPGs and cascaded DR LPGs SRI, temperature and strain
4.2.1. Responses and Sensitivities to SRI
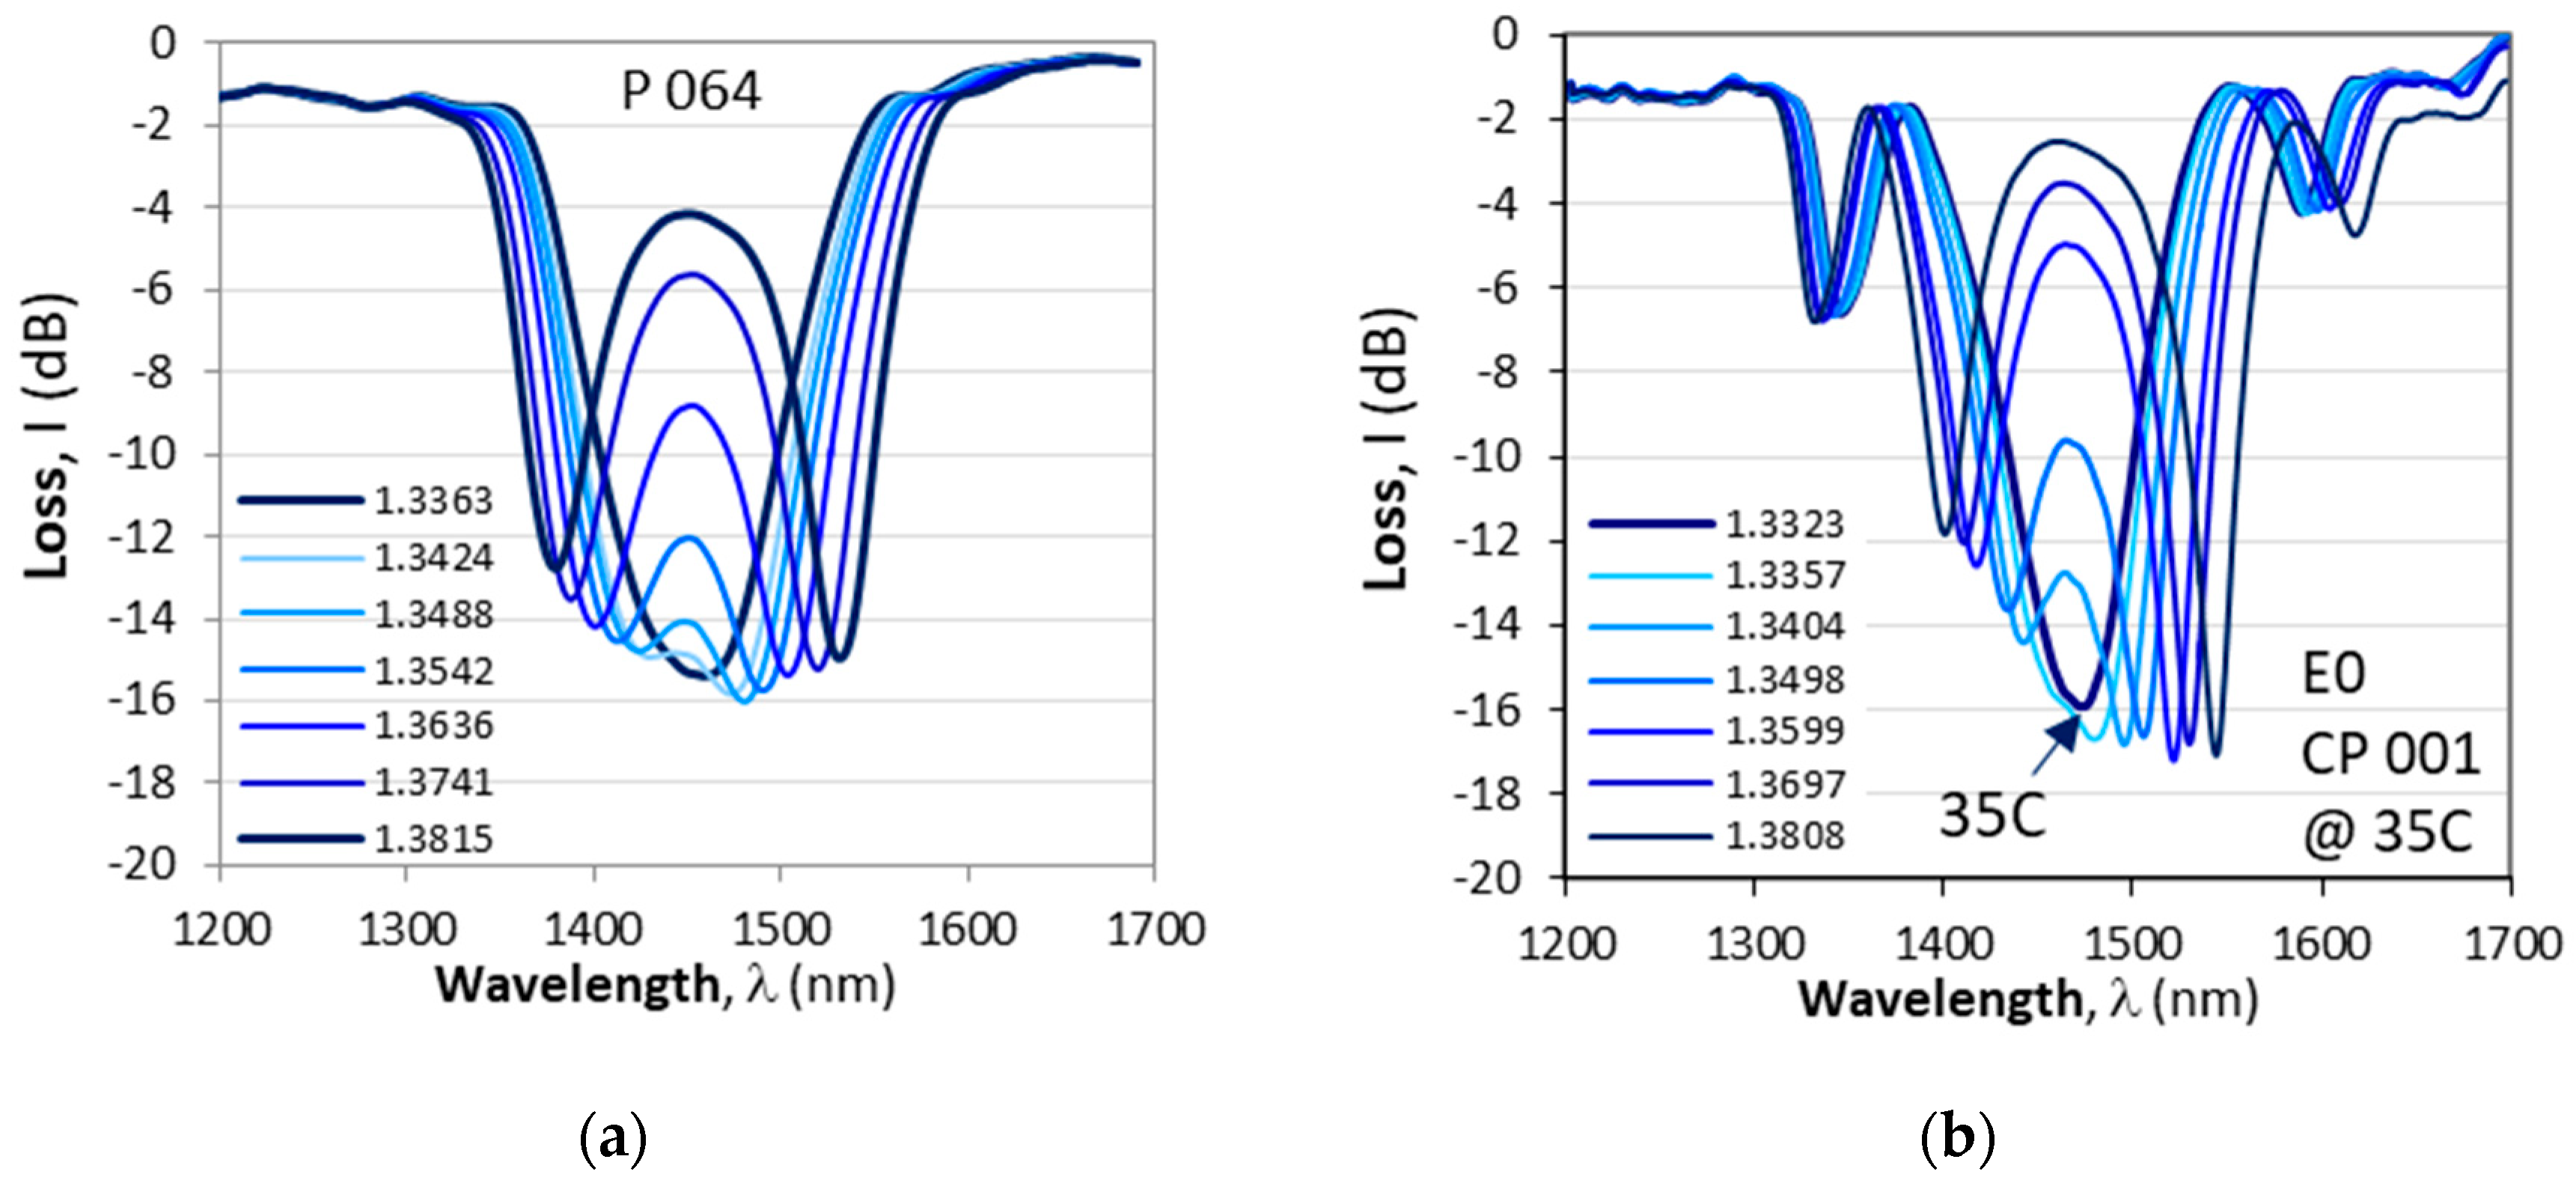
We start with the responses and the sensitivity to SRI changes and in
Figure 7 we show the responses to surrounding refractive index of a DR LPG (P 064) and a cascade of two DR LPGs (CP 001) at temperatures at which each one the gratings is at the TAP just about to split. Both gratings had the same period
Λ. A brief comparison between the two responses yields the following observations:
- i)
The cascaded DR LPGs (CP 001) is narrower Δλ0 = 171 nm (E0)vs. Δλ = 260 nm for the DR LPG (P064). The spectral width Δλ0 above was measured prior to etching, but after etching 175 nm (E1), 205nm (E2 @ 9C), 175 nm (E2 @ 48C), 181nm (E3 @ 10.5C), 177nm (E3 @ 52.5C) and essentially remains the same.
- ii)
The minima of the cascaded DR LPG are narrower compared to those of the ordinary DR LPGs
- iii)
The cascaded LPG exhibits additional minima because of the equivalent interferometer arrangements which shift at a lower sensitivity compared to the inner minima.
These observations mean that since the minima of the cascaded DR LPGs are sharper it would increase the accuracy of the wavelength shifts. Also, the additional minima can be used for sensing purposes though with a lower sensitivity.
The spectra of the gratings from
Figure 7a,b) were performed at different temperatures (20C for P 024 and 35C for CP 001) at which the observed splitting of the spectra occurs. This poses the question as to how the responses to SRI changes when etching is used to bring the TAP to a desired temperature.
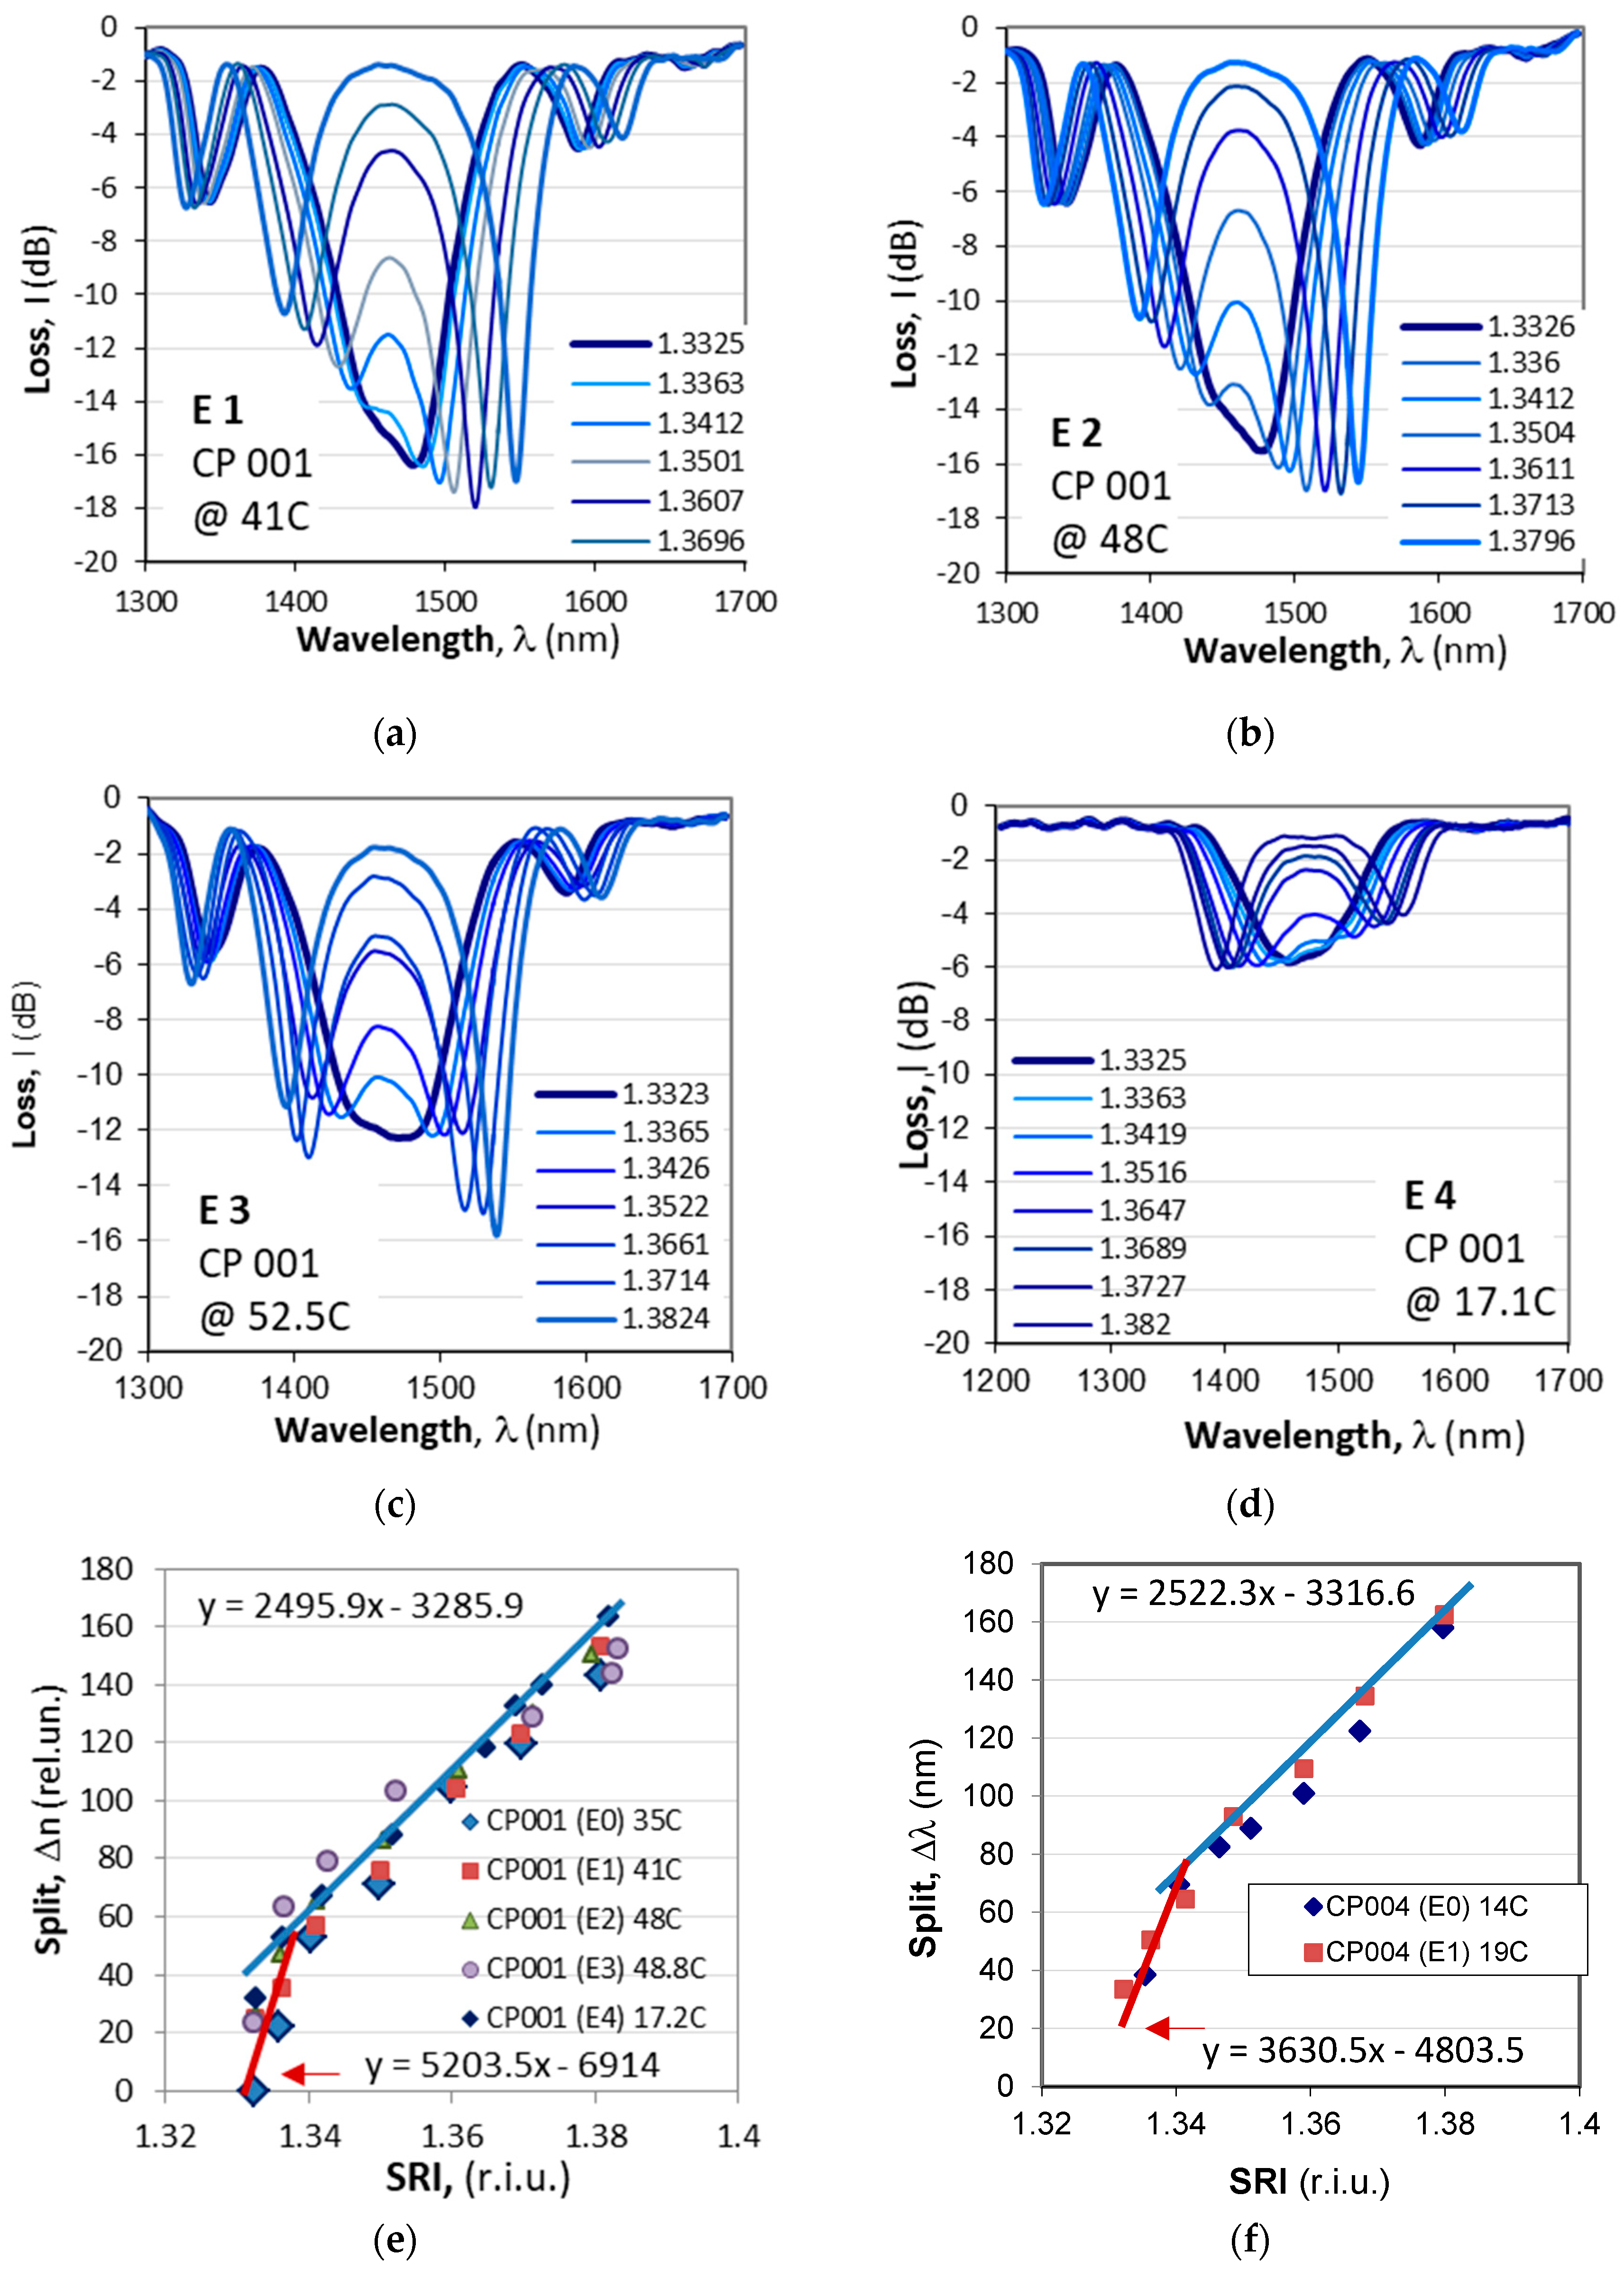
Figure 8 illustrate the change of the spectrum and the measured wavelength splits vs. SRI after the corresponding etchings.
Figure 8a–d) summarize the spectral changes at the corresponding splitting temperature. After the fourth etching (E4) the CP 001 cascade splits at two temperature: 17.2C and 58C.
Figure 8e) summarizes the spectral splits Δλ vs. SRI for CP 001 while
Figure 8f) – for CP 004 which was fine-tuned after the first etching.
Table 1 below summarizes the measured sensitivities in the two distinct SRI ranges that are readily outlined in
Figure 8e,f): in the 1.33 to 1.35 interval and above 1.35.
As seen from
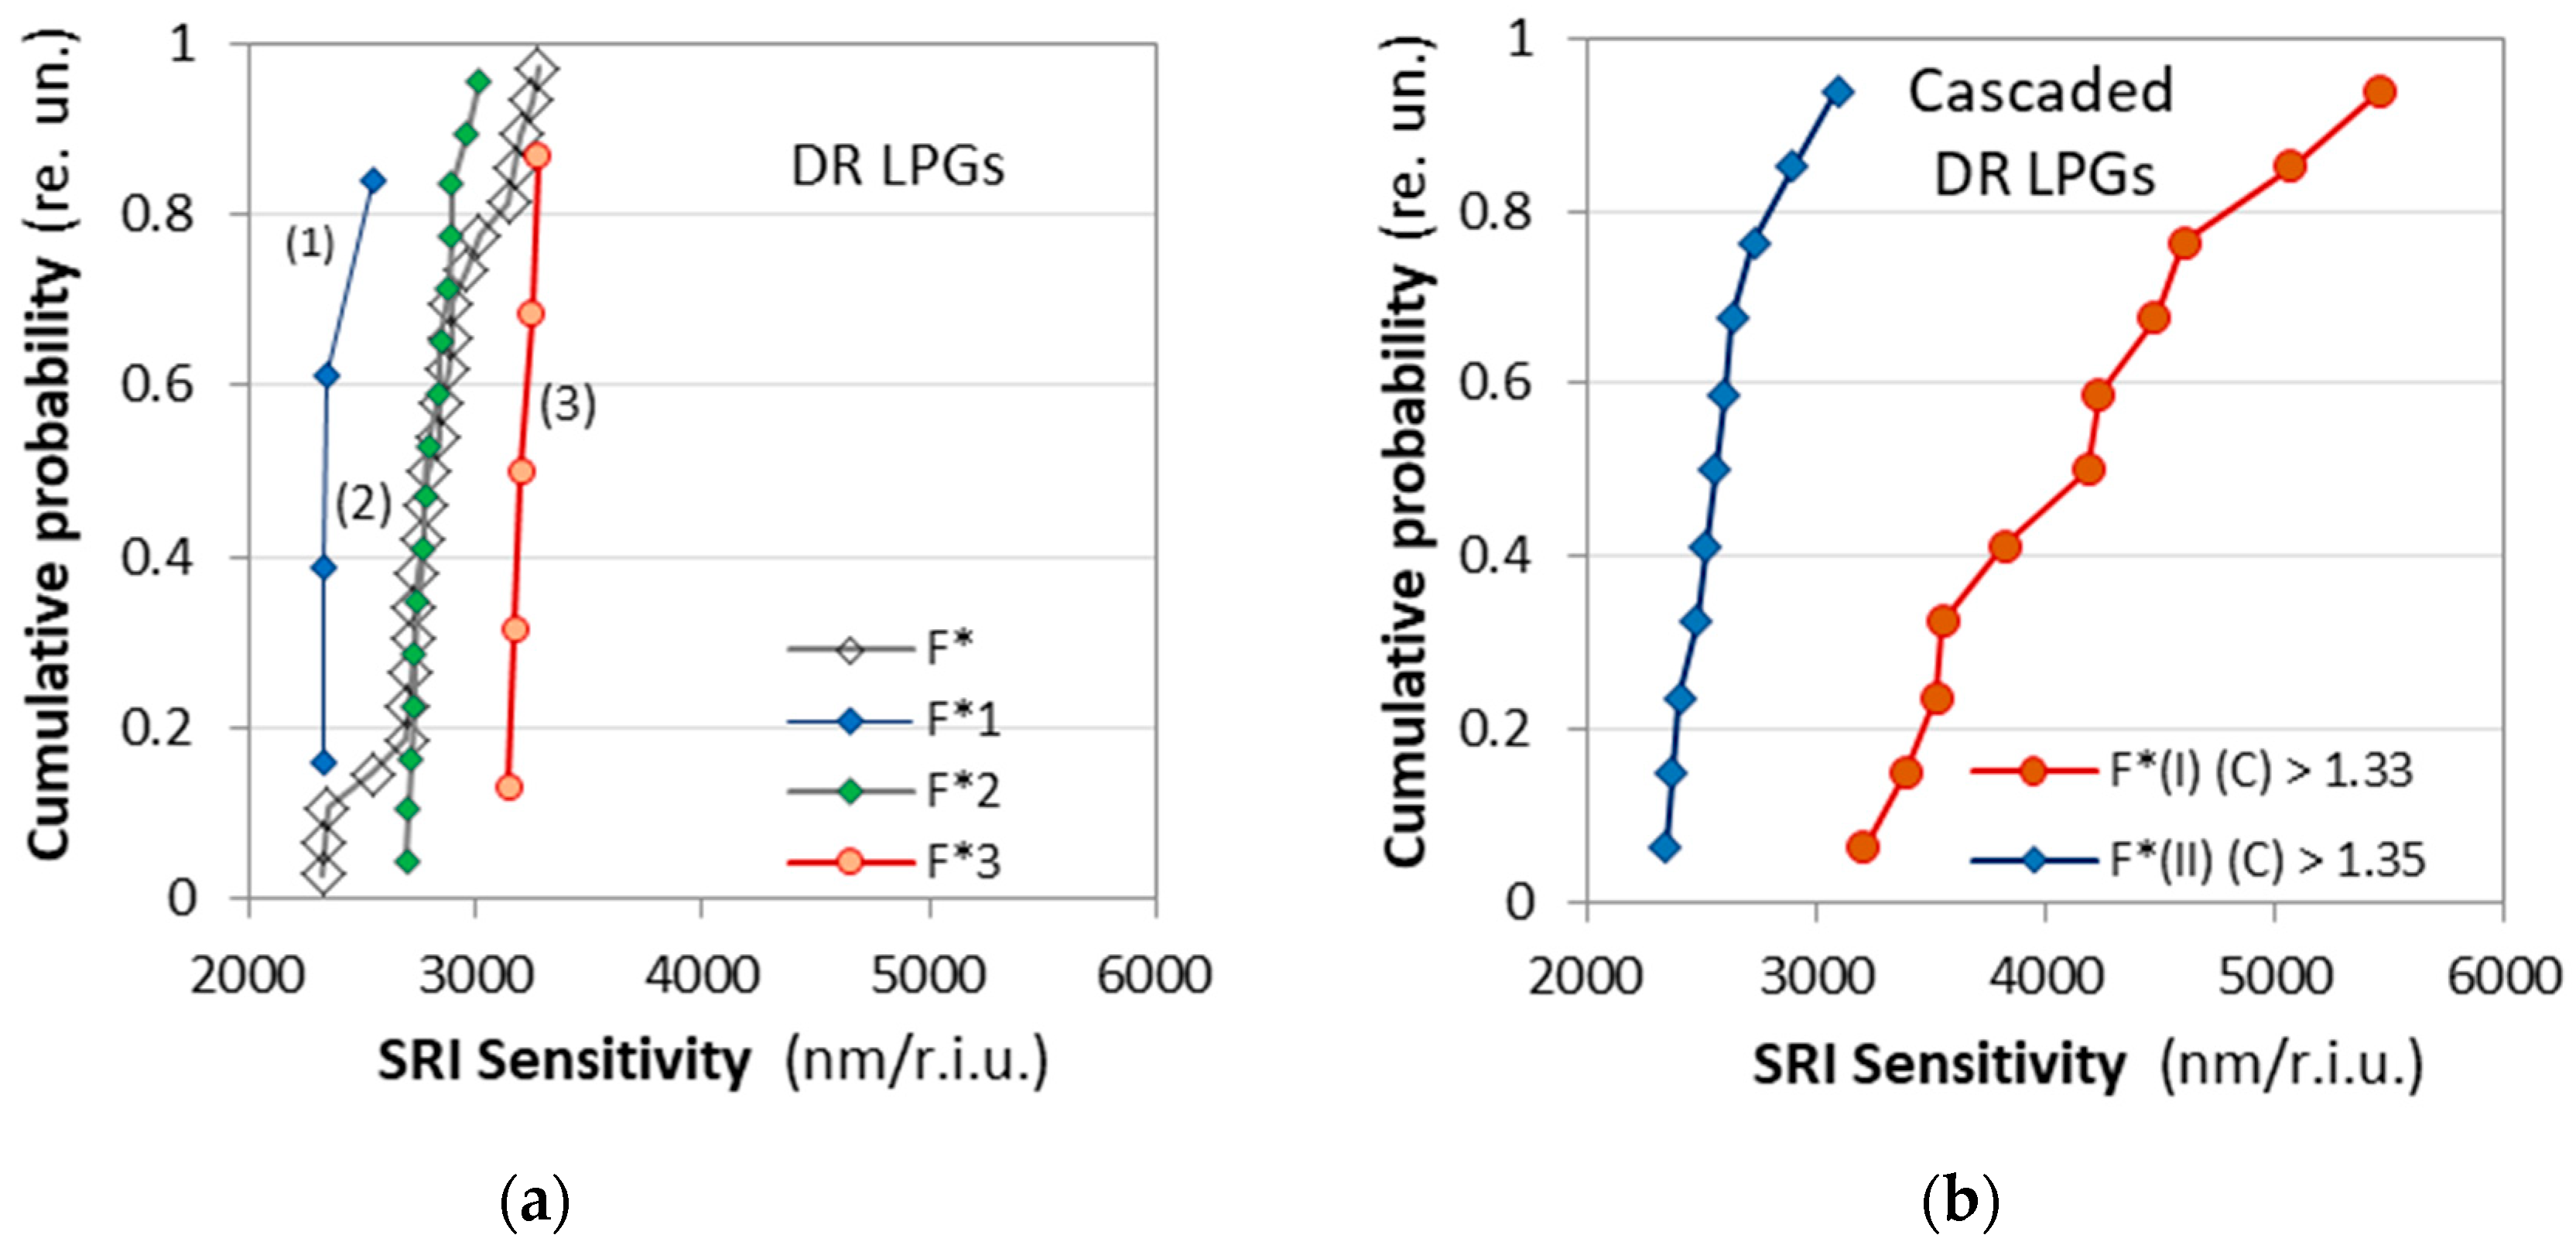
Table 1 the sensitivities S(I) and S(II) the two SRI intervals differ considerably and a statistical variation is clearly observable. To evaluate the practical difference between a simple DR LPG and a cascade of DR LPGs we performed some statistical analysis and the sensitivities of the eleven cascaded DR LPGs is compared to the sensitivities of 25 DR LPGs whose spectra are similar to those from
Figure 7a. In
Figure 9 we have plotted the cumulative probability F* of the measured sensitivities
Sn (n = 1 to N) with
N = 11 for the C DR LPGs and
N = 25 for the DR LPGs which calculated as:
The plots of the cumulative probability F* vs. the measured SRI sensitivity S for the single DR LPGs is plotted in
Figure 9a), while for the C DR LPGs – in
Figure 9b). The sensitivities for the DR LPGs were for the range ≥ 1.333 while those for the C DDR LPGs were for the two outlined in
Figure 8 (e) and 8 (d) intervals. As is seen the results for the DR LPGs (empty rhombs) in
Figure 9a) clearly indicate the existence of three subpopulations numbering 4, 16 and 5 samples centered correspondingly around different mean values, namely: (1) around 2387.7 nm/r.i.u., (2) around 2809.8 nm/r.i.u. and (3) around 3208 nm/r.i.u. The cumulative probability distributions
F1*,
F2* and
F3* for each of these subpopulations are plotted together for comparison. The average sensitivity over all subpopulation is 2821.9 nm/r.i.u. In comparison, the cascaded DR LPGs systematically exhibit a higher sensitivity S(I) over the initial SRI interval followed by a lower sensitivity above 1.35 – S(II) as listed for each grating in
Table 1.
Figure 9b) presents the cumulative probability distributions
F*(I) and
F*(II) of these two sensitivities, plotted in the same scale as those of the simple DR LPGs (
Figure 9a). Their averages are ≈ 2600 nm/r.i.u. for the lower sensitivity at higher SRI and ≈ 4135 nm/r.i.u. for the SRI around water.
The comparison of the statistical results as described by the cumulative probability distributions leads to the following observations:
- i)
The average sensitivity of the simple DR LPGs is by about 9% higher than the average sensitivity of the cascaded DR LPGs for SRI > 1.35.
- ii)
The sensitivity of the cascaded DR LPGs around water (SRI = 1.33 ÷ 1.35) is on the average by about 50 % higher than the average sensitivity of the simples DR LPGs.
- iii)
The variance of the sensitivities around lower SRI for the cascaded DR LPGs is quite large and can vary by up to 70%.
The above observations imply the following conclusions: First cascaded DR LPGs are better suited for more sensitive measurements over a limited range of SRI changes around water and second, individual calibrations must be performed for the gratings used.
4.3. Response and Sensitivity to Temperature
4.3.1. Spectral Evolution
We now consider the temperature responses of the cascaded and first note that in
Figure 8 the responses to SRI changes at higher temperatures (
Figure 8a–c) are deeper (around -17dB) compared to the same responses at lower (17.1C). As the number of temperatures is about 20, we present the evolution in two stages: at lower and at higher temperatures.
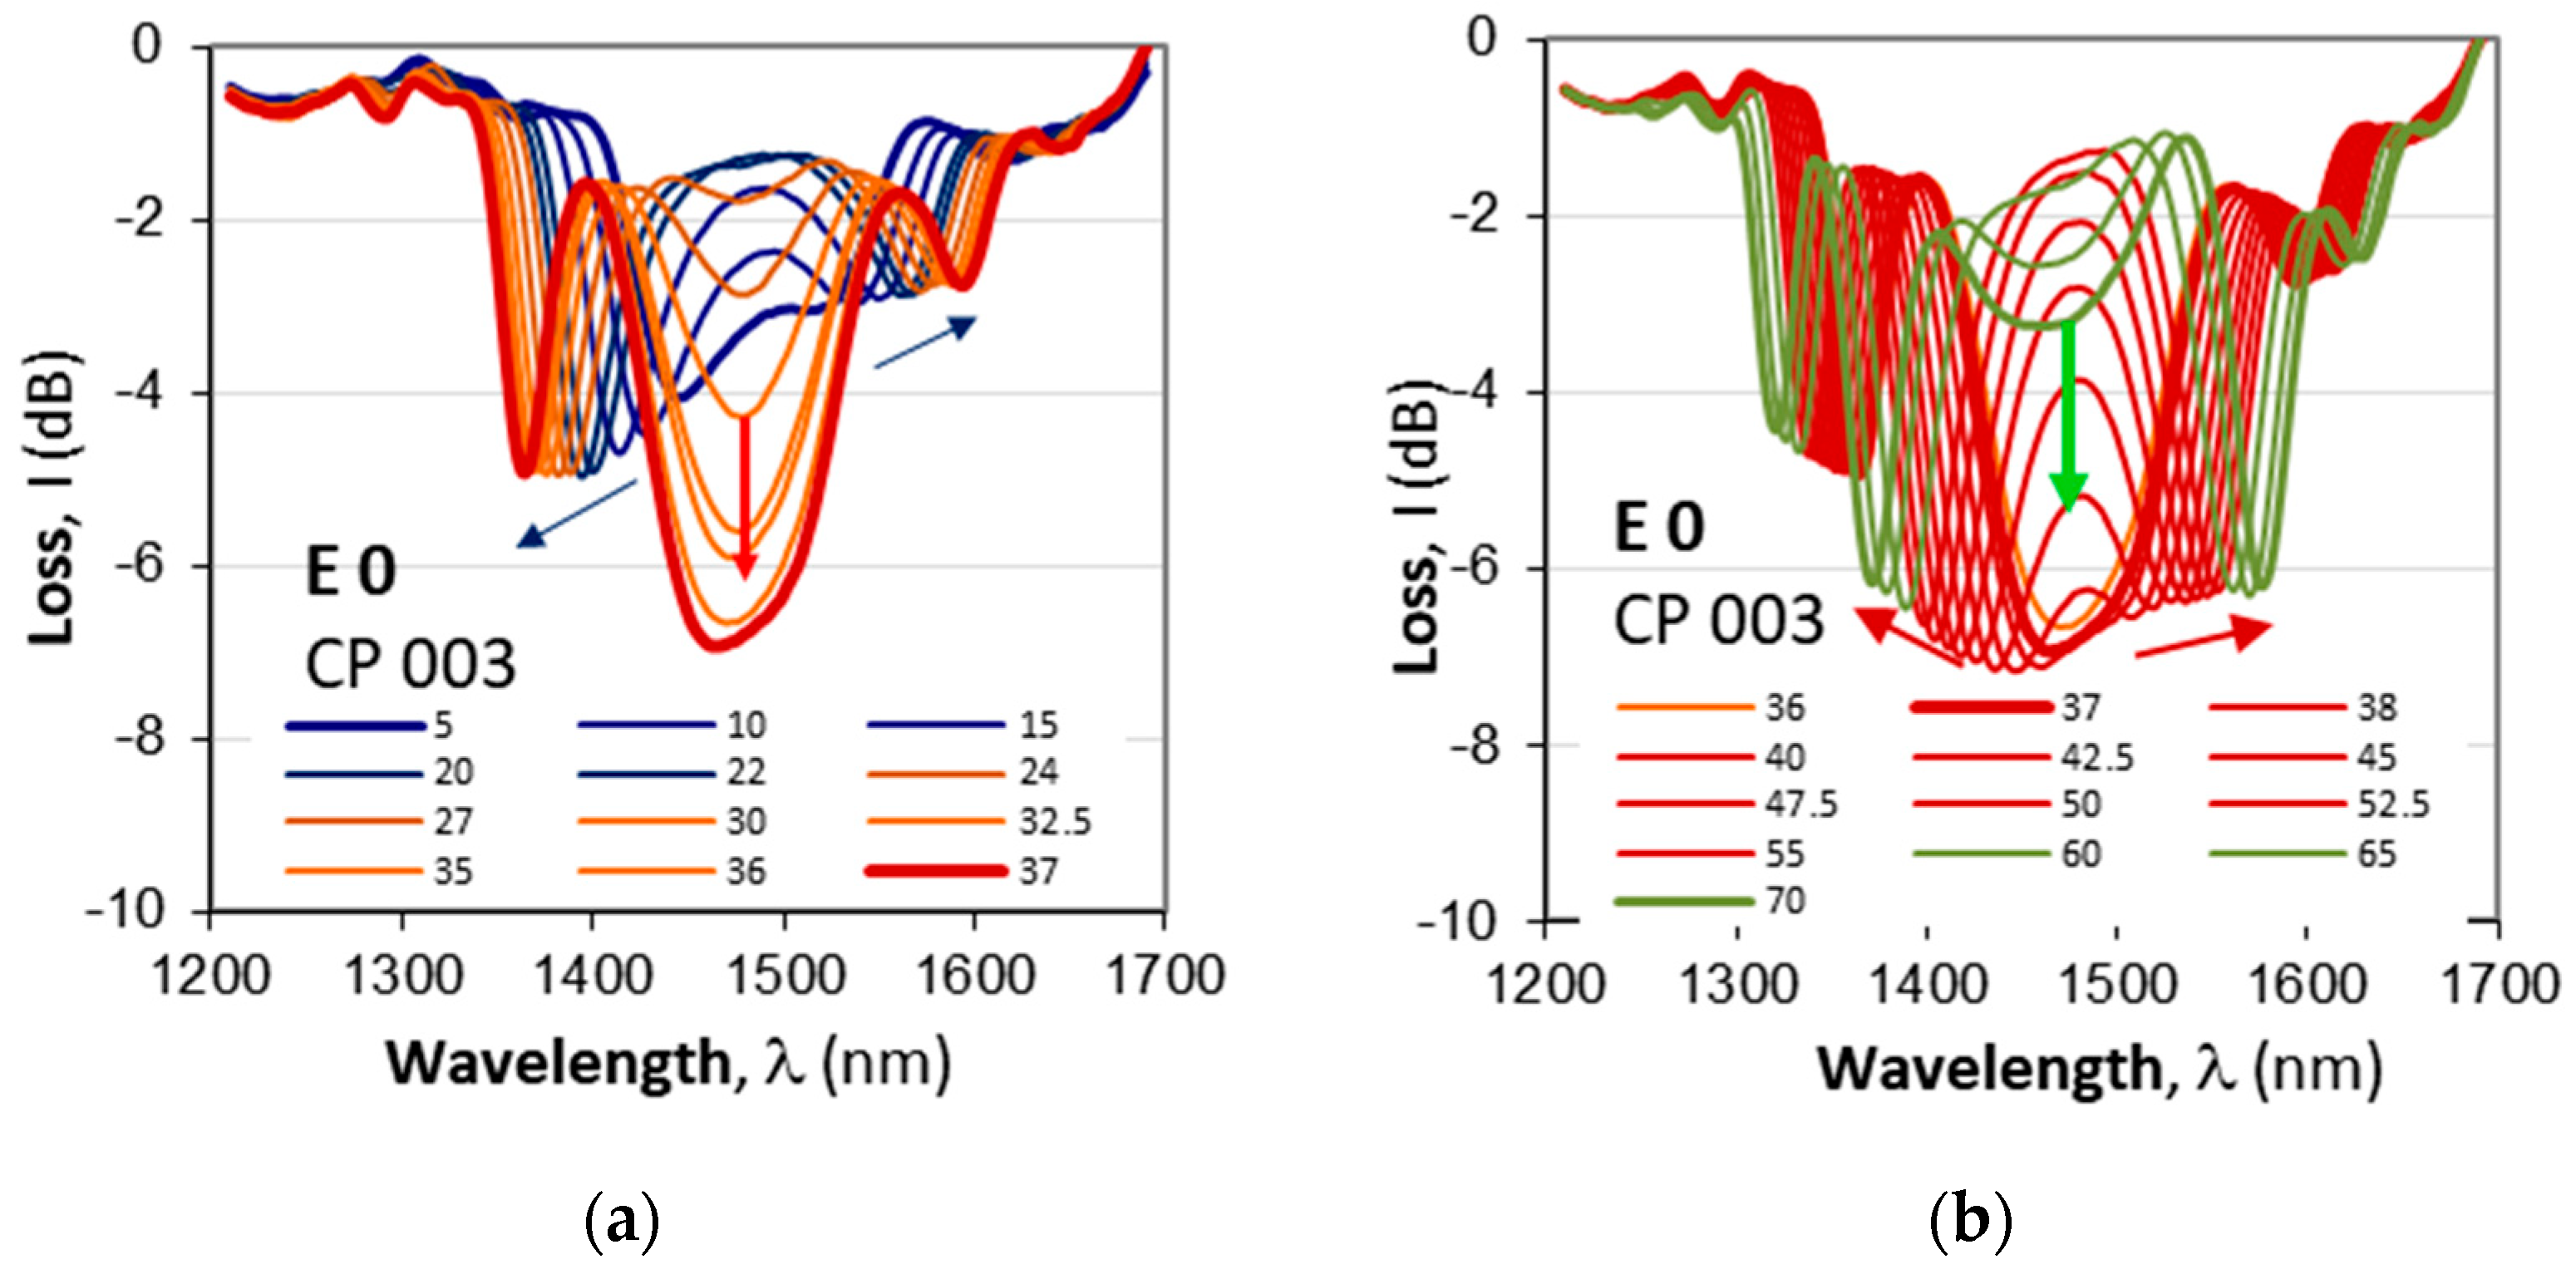
Figure 9a presents the results for CP 003 for temperatures from 5C, at which the spectra was already lightly split, until the first split at 37 C. As is seen, under 30C the depth of the cascaded DR LPG is between -3dB to -5 dB, after which it drops to -7dB as evidenced in
Figure 9a,b.
Table 2.
Evolution of the low and high temperature splits at TAP wavelength of 1467 nm for a non-etched cascaded DR LPG CP 003 (N1=N2=115, L0=13mm).
Table 2.
Evolution of the low and high temperature splits at TAP wavelength of 1467 nm for a non-etched cascaded DR LPG CP 003 (N1=N2=115, L0=13mm).
| Etching stage |
Low temperature split |
Mid temperature split |
High temperature split |
| E 0 (prior to etching) |
< 5C (≈ 0C) @ -4C |
36C @ -7dB |
> 70C |
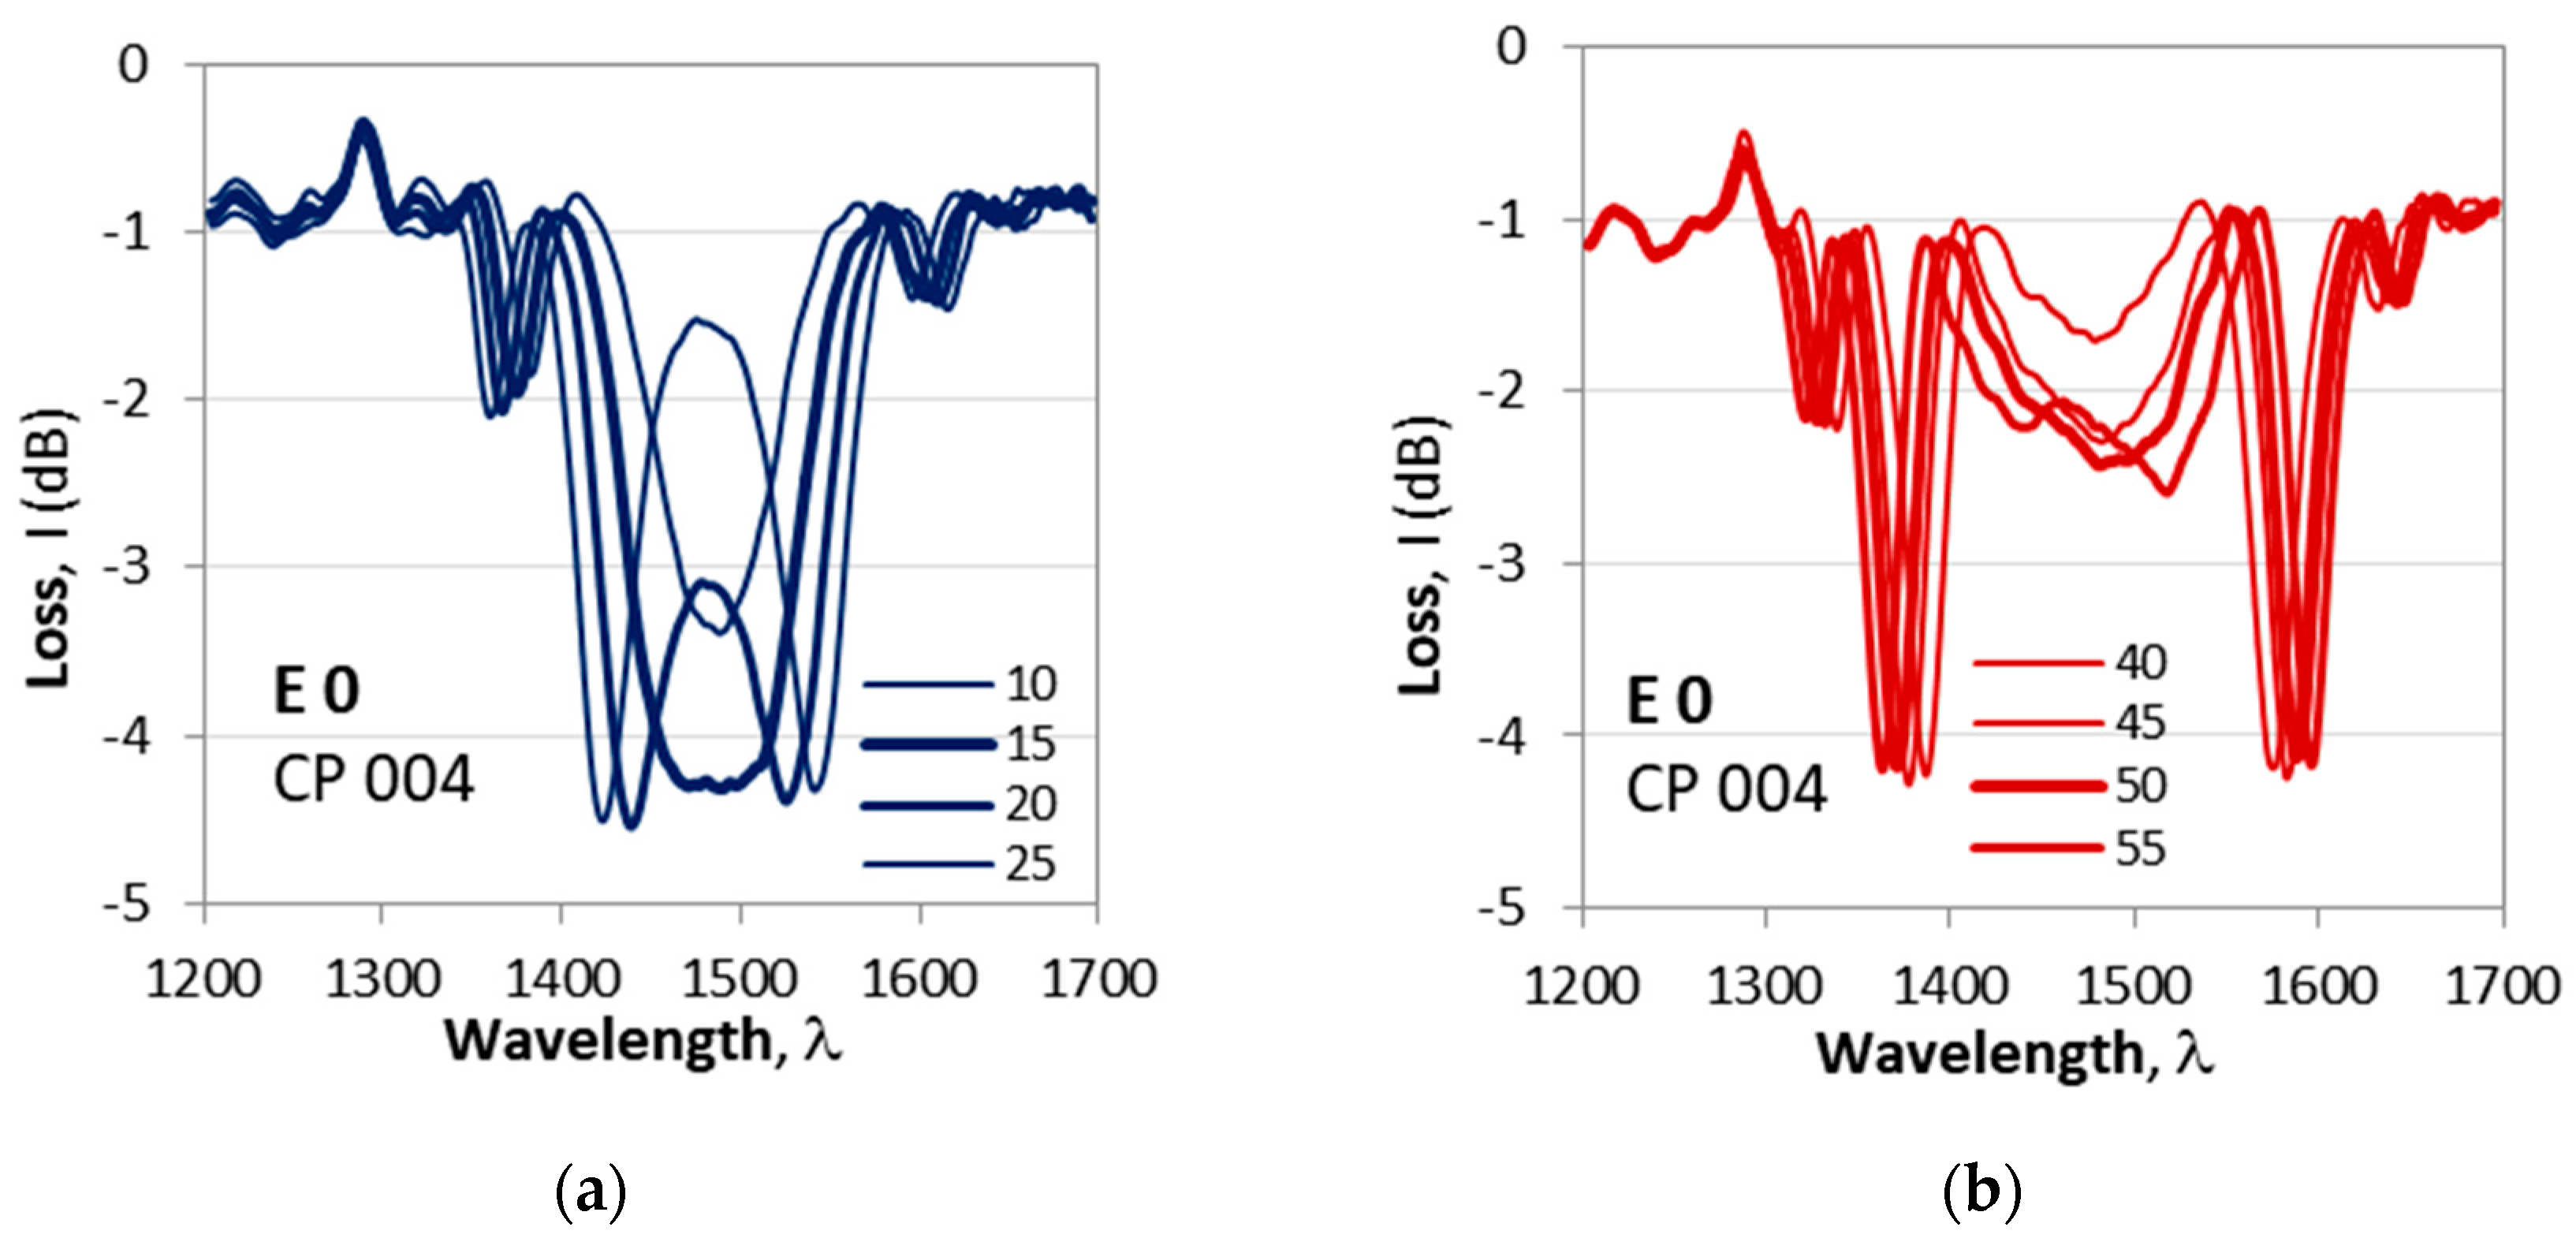
Cascaded DR LPG CP 004 exhibits a somewhat different behavior. The first observed split at 15C (
Figure 10a) is deeper (-4.2dB) compared to the next one at 50C (-2.3 dB) shown in
Figure 10b as summarized in
Table 3.
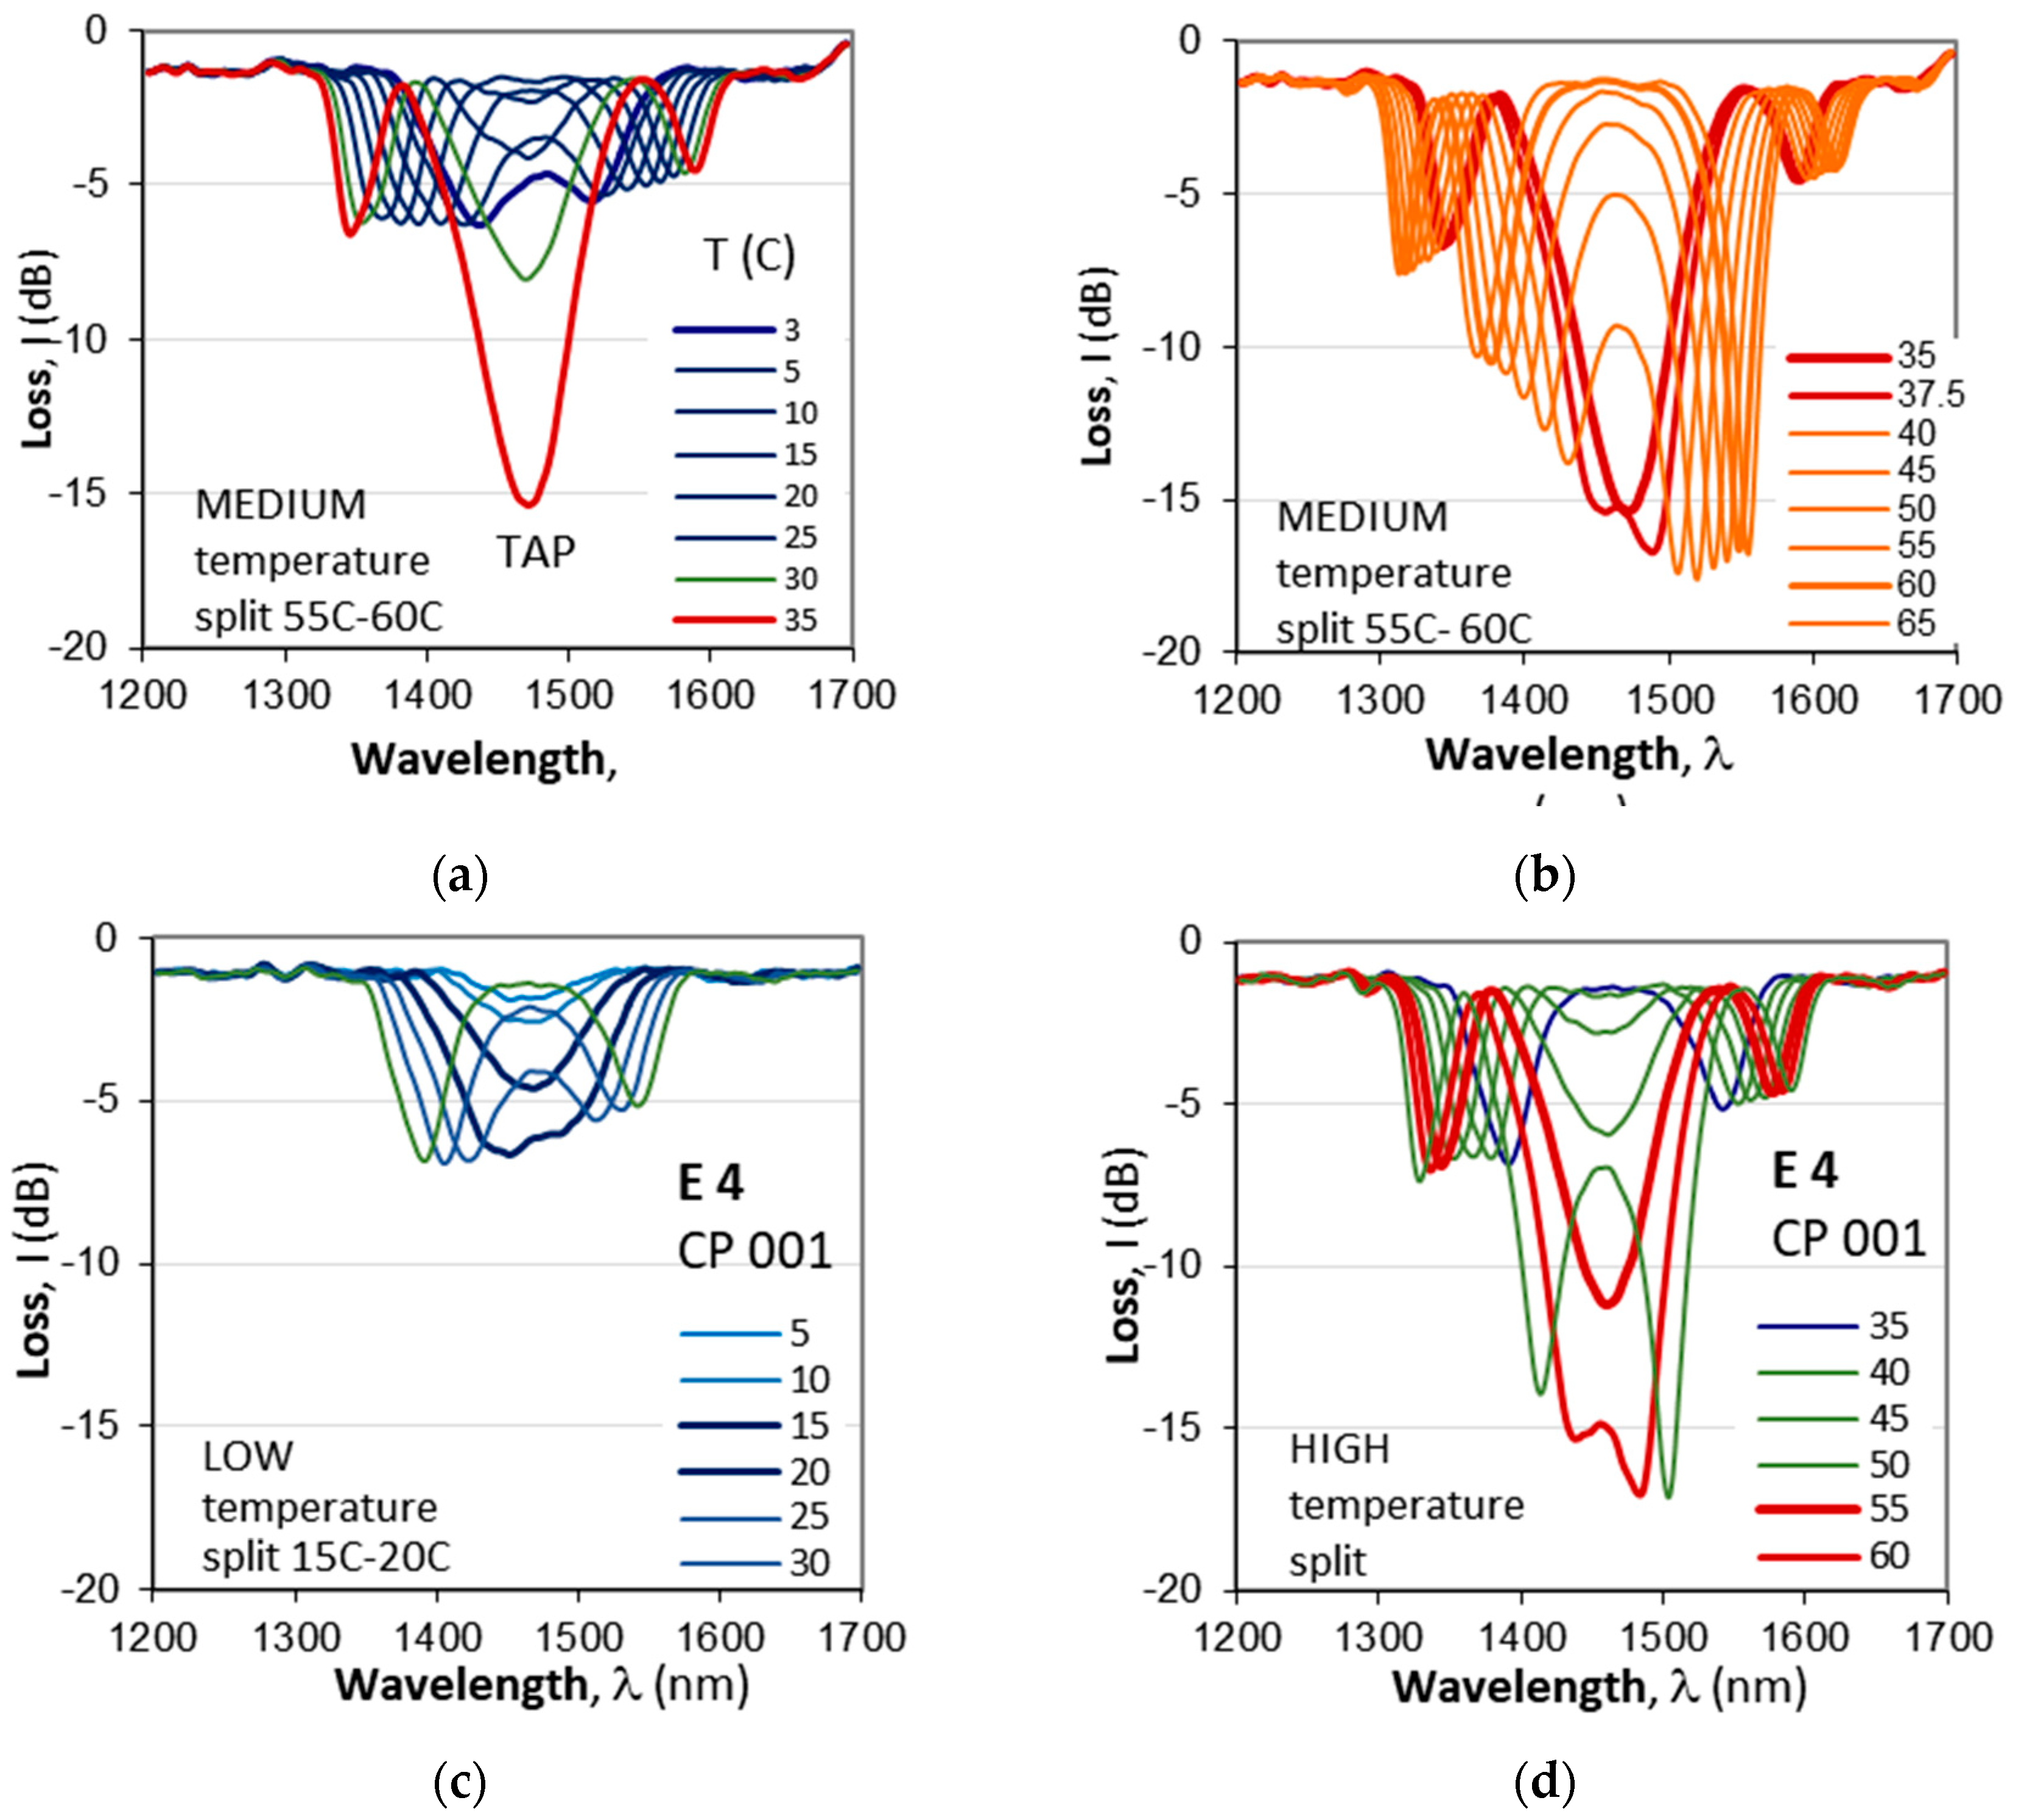
Gratings CP 003 and CP 004 are weak and shallow compared to CP 001 which is deeper. To study these observation we measured the evolution of the spectra of CP 001 vs. temperature changes before (E0) and after etching (E1, …, E4).
Figure 11a–d show the temperature dependence before etching (E0) and after the last fourth etching (E4). We clearly see the effect of the abrupt increase of the grating depth at TAP. Before etching the TAP is at 35C which is in the middle of the temperature range.
Table 4 summarizes the parameters of the splits at lower and higher temperatures which confirm the observation. It implies that the detuning δ(λ) at higher temperatures is lower than that at lower temperatures over the range of interest.
4.3.2. Sensitivity Curves
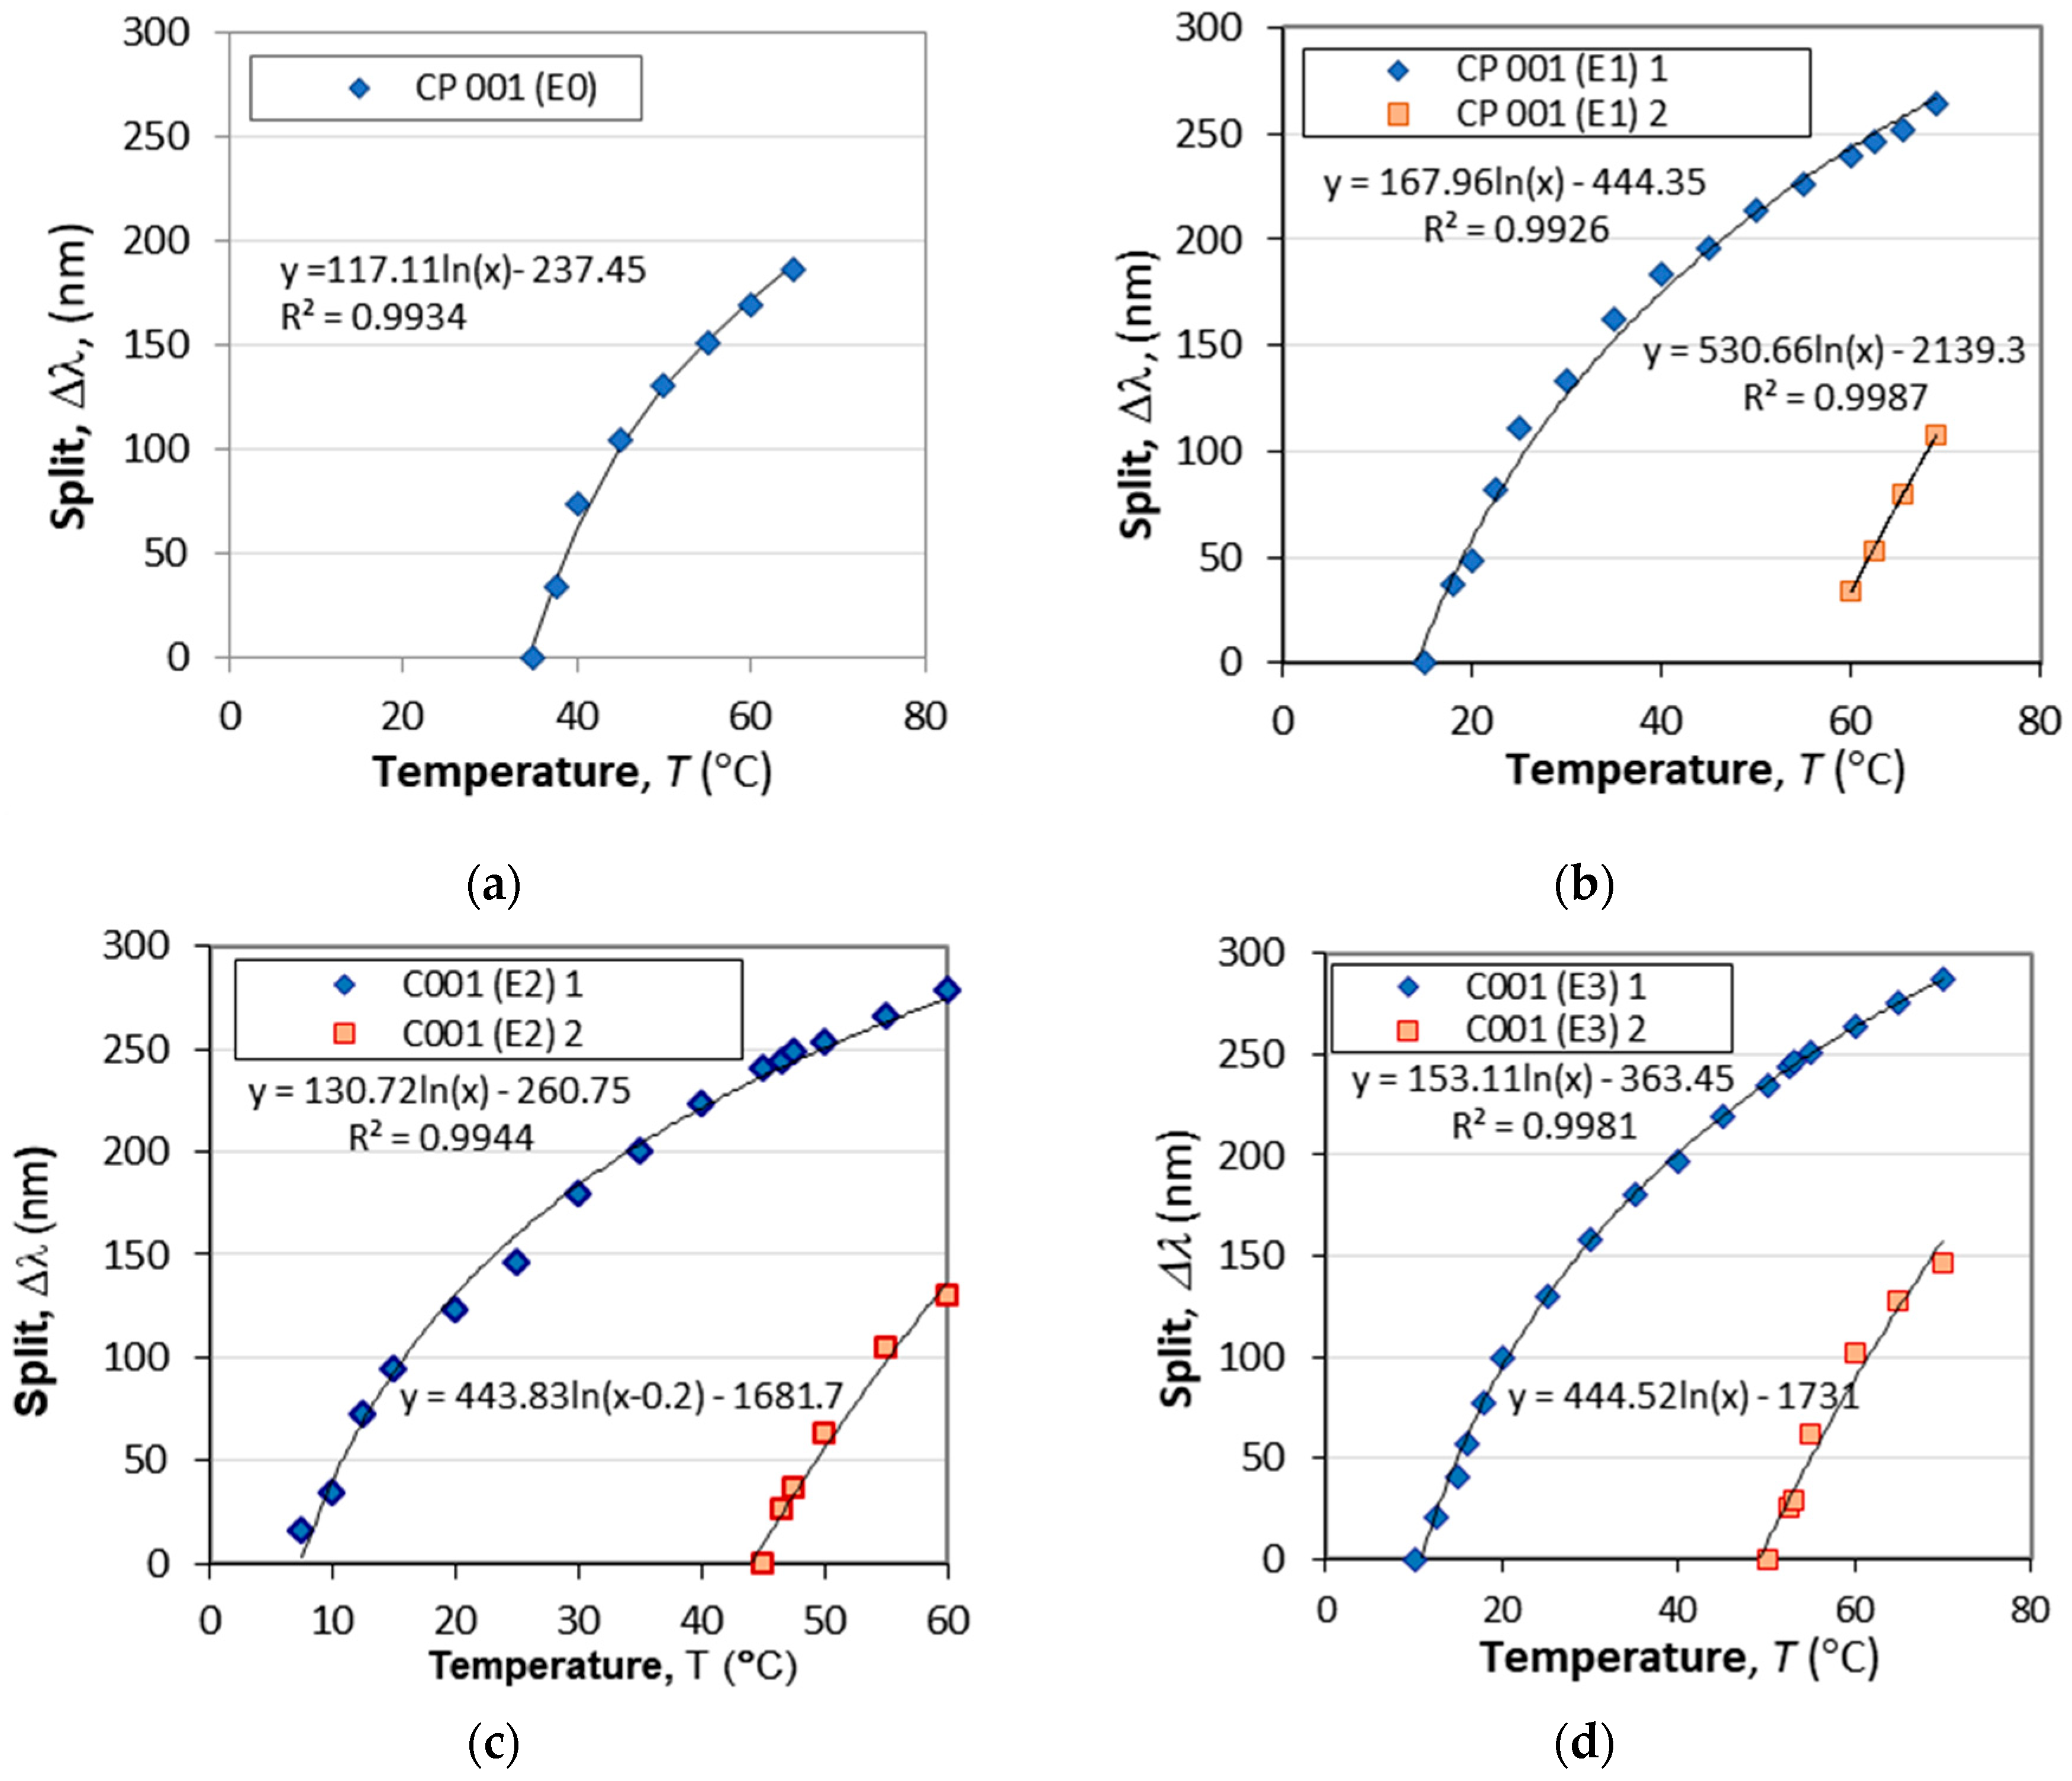
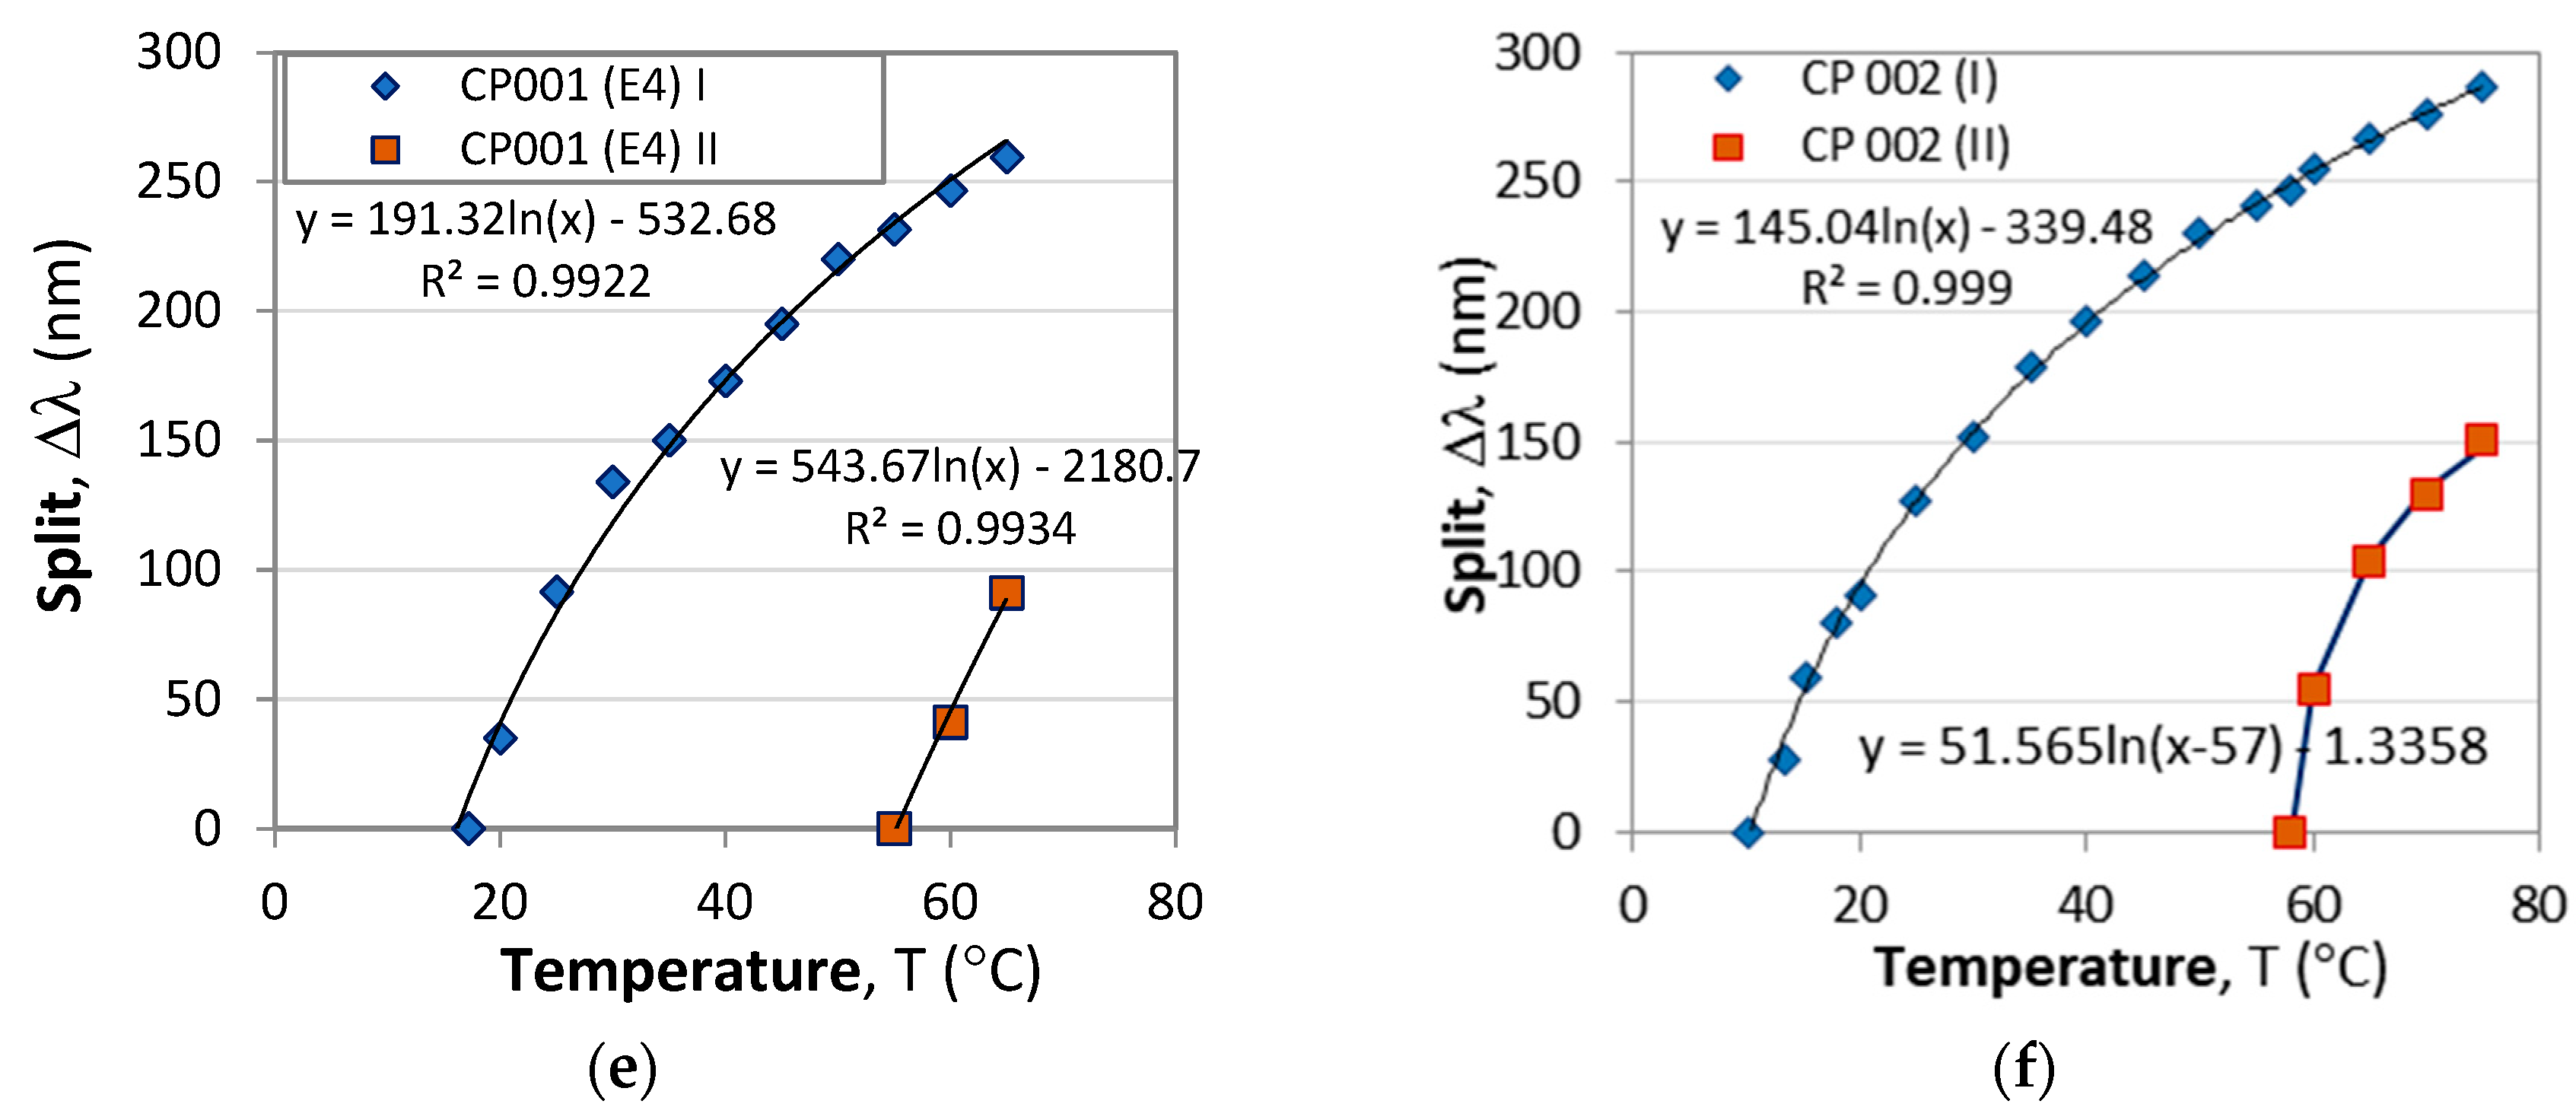
We now study the temperature dependence of the wavelength split Δλ(
T).
Figure 12а–e present the temperature dependences of the split of CP 001 before etching (E0) and after each consecutive etching (E1, …, E4) as well of grating CP 002 (
Figure 12f). The Δλ(
T) at lower are in blue rhombs while at higher temperatures in red squares. As we see from the figures the Δλ(
T) curves are very well fit by a logarithmic dependence in the form:
In (21)
C and
C0 are coefficients, while
Tb is a biasing temperature. Equation (21) is valid for temperatures above that of the turn a around point (TAP) i.e.,
T ≥
TTAP. The sensitivity to temperature S
T(
T) thus would be
and it is inversely proportional to temperature.
Figure 12.
The effect of HF acid etching on temperature dependence of the wavelength splits: (a) non-etched grating (E0); (b) after E1; (c) after E2; (d) after E3; (e) after E4 and (f) non-etched CP 002.
Figure 12.
The effect of HF acid etching on temperature dependence of the wavelength splits: (a) non-etched grating (E0); (b) after E1; (c) after E2; (d) after E3; (e) after E4 and (f) non-etched CP 002.
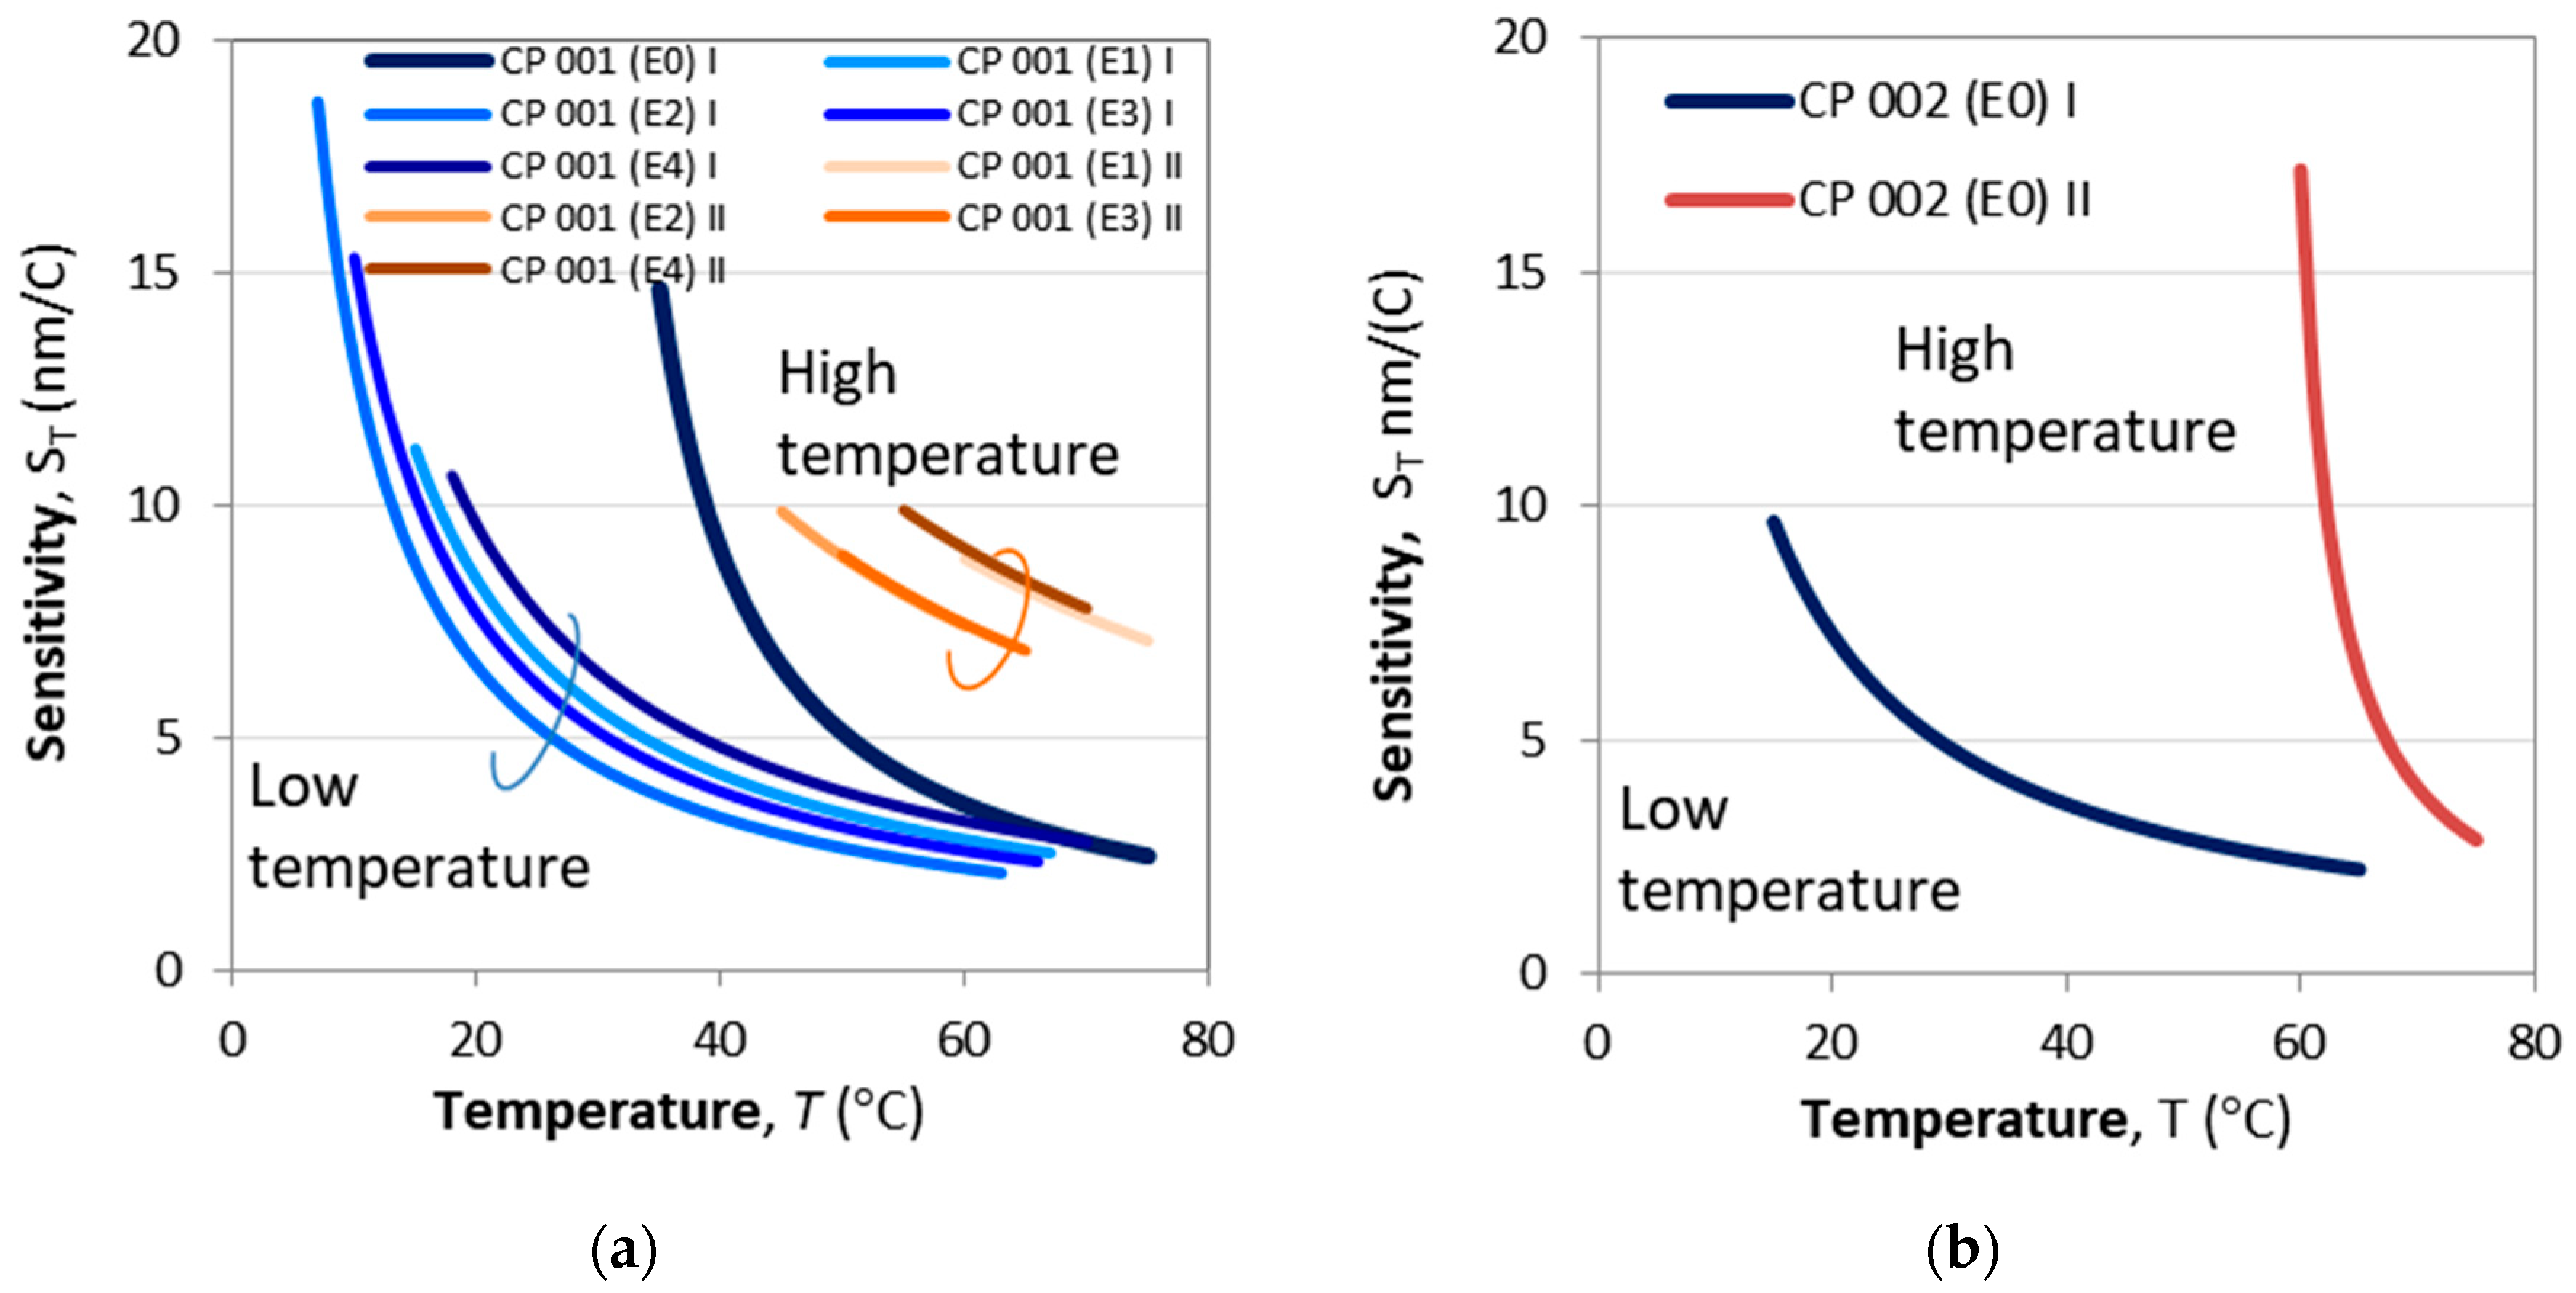
Figure 13a,b show the sensitivities at lower and higher temperature splits for CP 001 and CP 002 calculated using (22) and the fitting parameters from
Figure 12a–f. The plots in
Figure 13a show that the etching process does not basically change the dependence, but simply shifts along the temperature scale.
The logarithmic fits were found to be well suited for all of the cascaded DR LPGs and the results for the fitting parameters
Tb,
C and
C0,
TTAP as well as the sensitivity
STAP at TAP are listed in
Table 5.
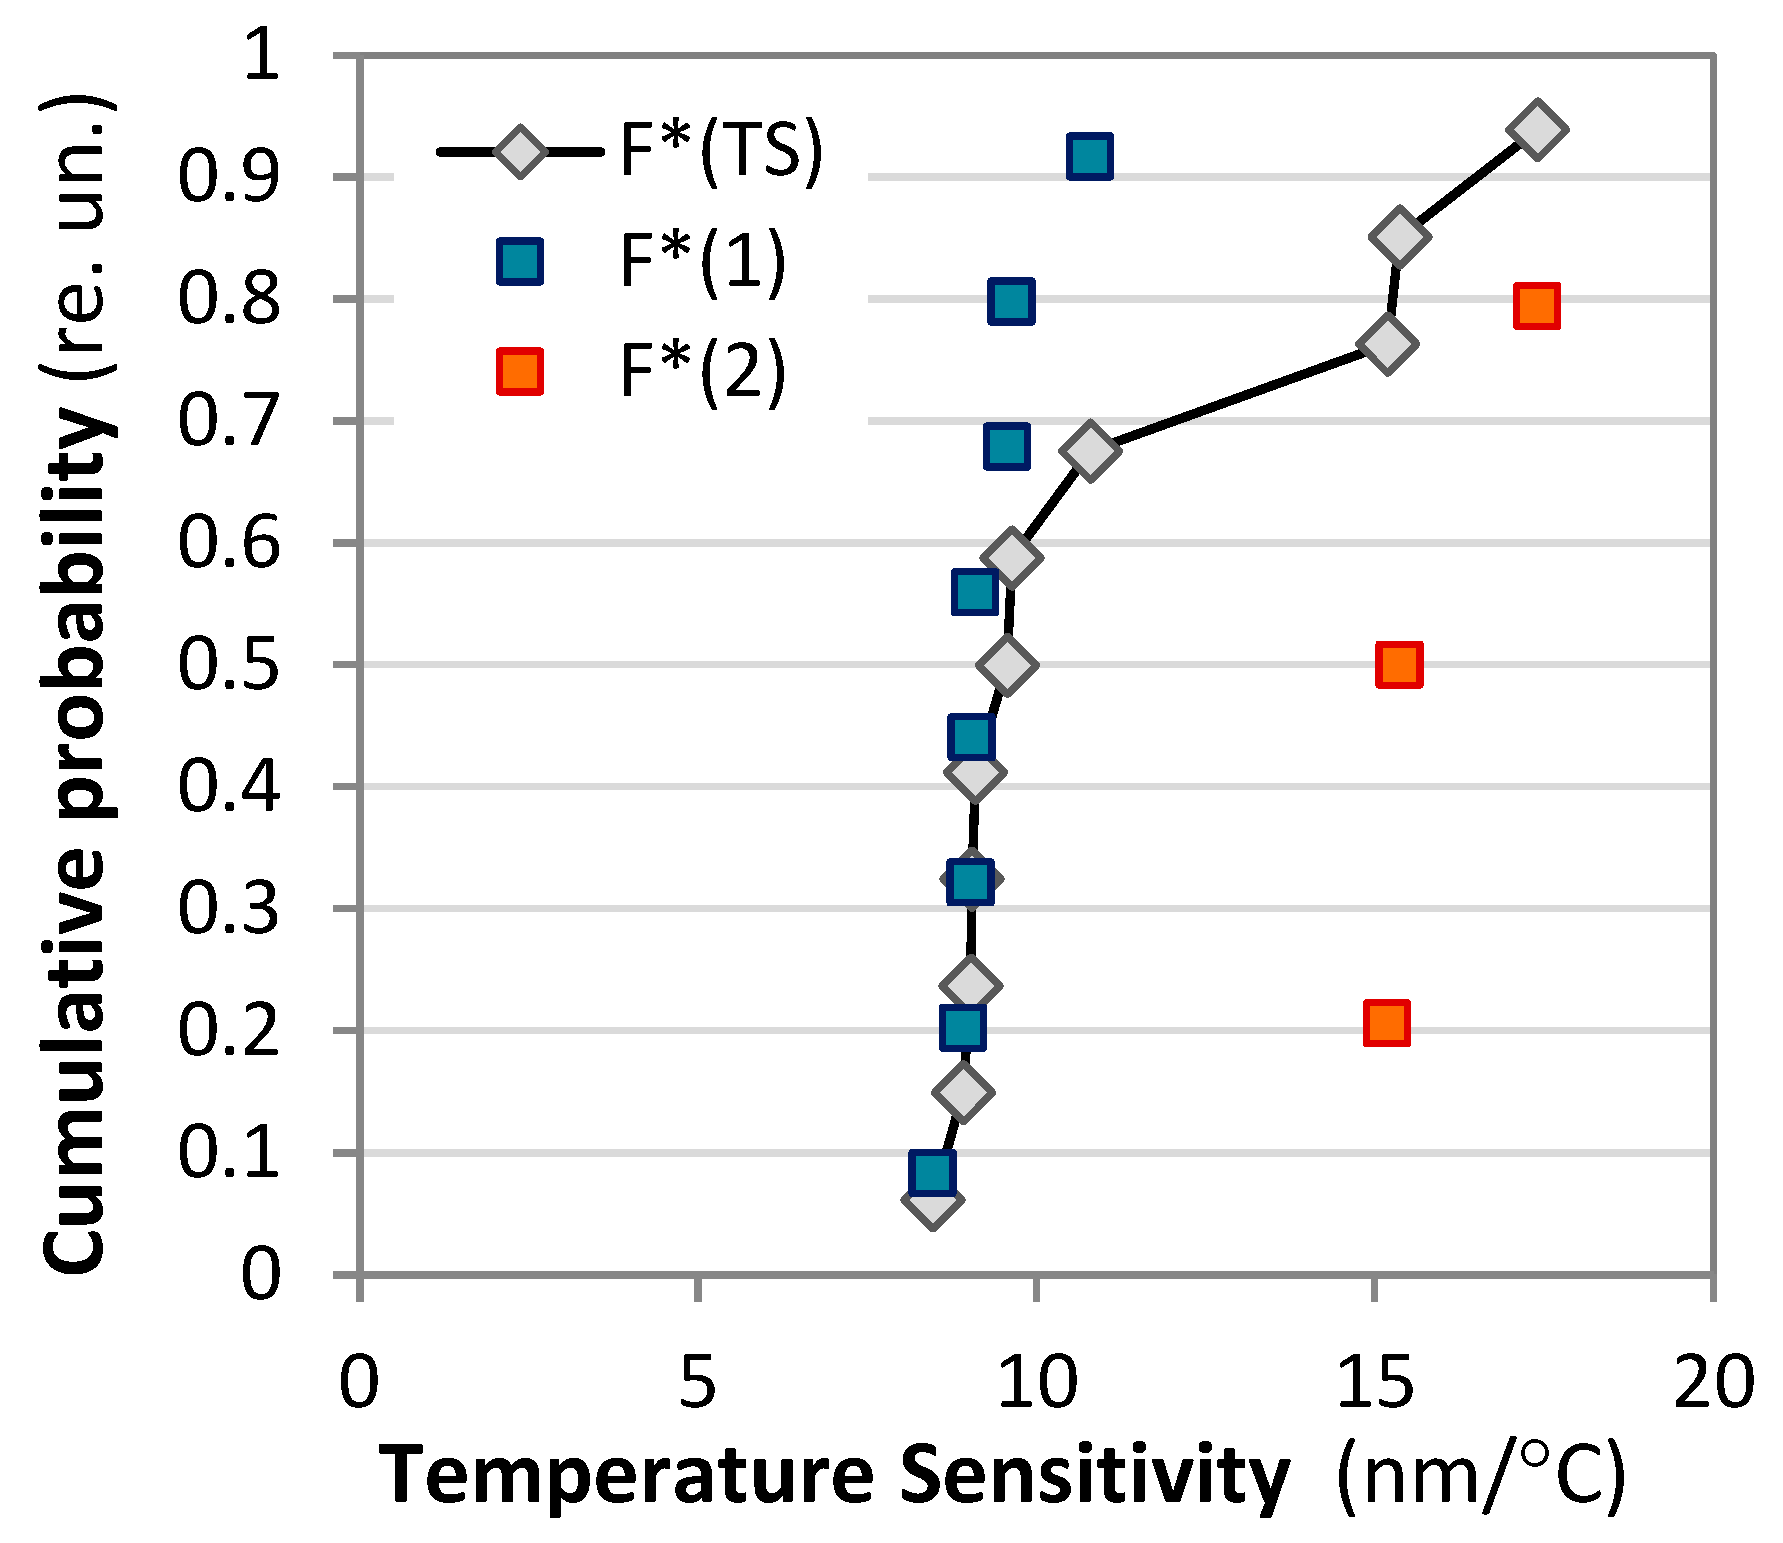
With reference to Table 6 in
Figure 14 we present a plot of the cumulative probability F*(TS) of the sensitivity to temperature around TAP temperature. The average sensitivity is S
T,avg ≈ 11.11 nm/°C but we clearly see two subpopulations with cumulative functions F*(1) and F*(2) whose mean values are 9.32 nm/°C and 16 nm/°C. Thus, we see that most of the C DR LPGs (73%) are well grouped around 9.32 nm/°C. The gratings from the second subpopulation centered around 16 nm/°C are among the subpopulation of higher sensitivity to SRI listed in
Table 1 and Figure 9b.
Figure 14.
Cumulative probability distributions F* vs. temperateyure sensitivity TS.
Figure 14.
Cumulative probability distributions F* vs. temperateyure sensitivity TS.
These results indicate that the highest sensitivity to temperature is observed at TAP, which is important in the case of SRI sensing applications in which temperature stability must be maintained. As seen from
Table 5 the temperature sensitivity varies between ≈ 8.5 and ≈ 17.4. Taking a meaningful value of 10 nm/°C, an instability of 0.1°C would lead to a 1 nm fluctuation of the reading the wavelength split which will lead to an uncertainty of the SRI determination of 1/S
n. For an average value S
n ≈ 4135 nm/r.i.u. (see Figure 9b) the SRI uncertainty would be ≈ 2.4 x 10
-4. If the accuracy of wavelength shift determination is 0.1 nm, then the SRI uncertainty would be ≈ 2.4 x 10
-5 which would require a temperature stability of 0.01 °C.
4.4. Sensitivity to Strain
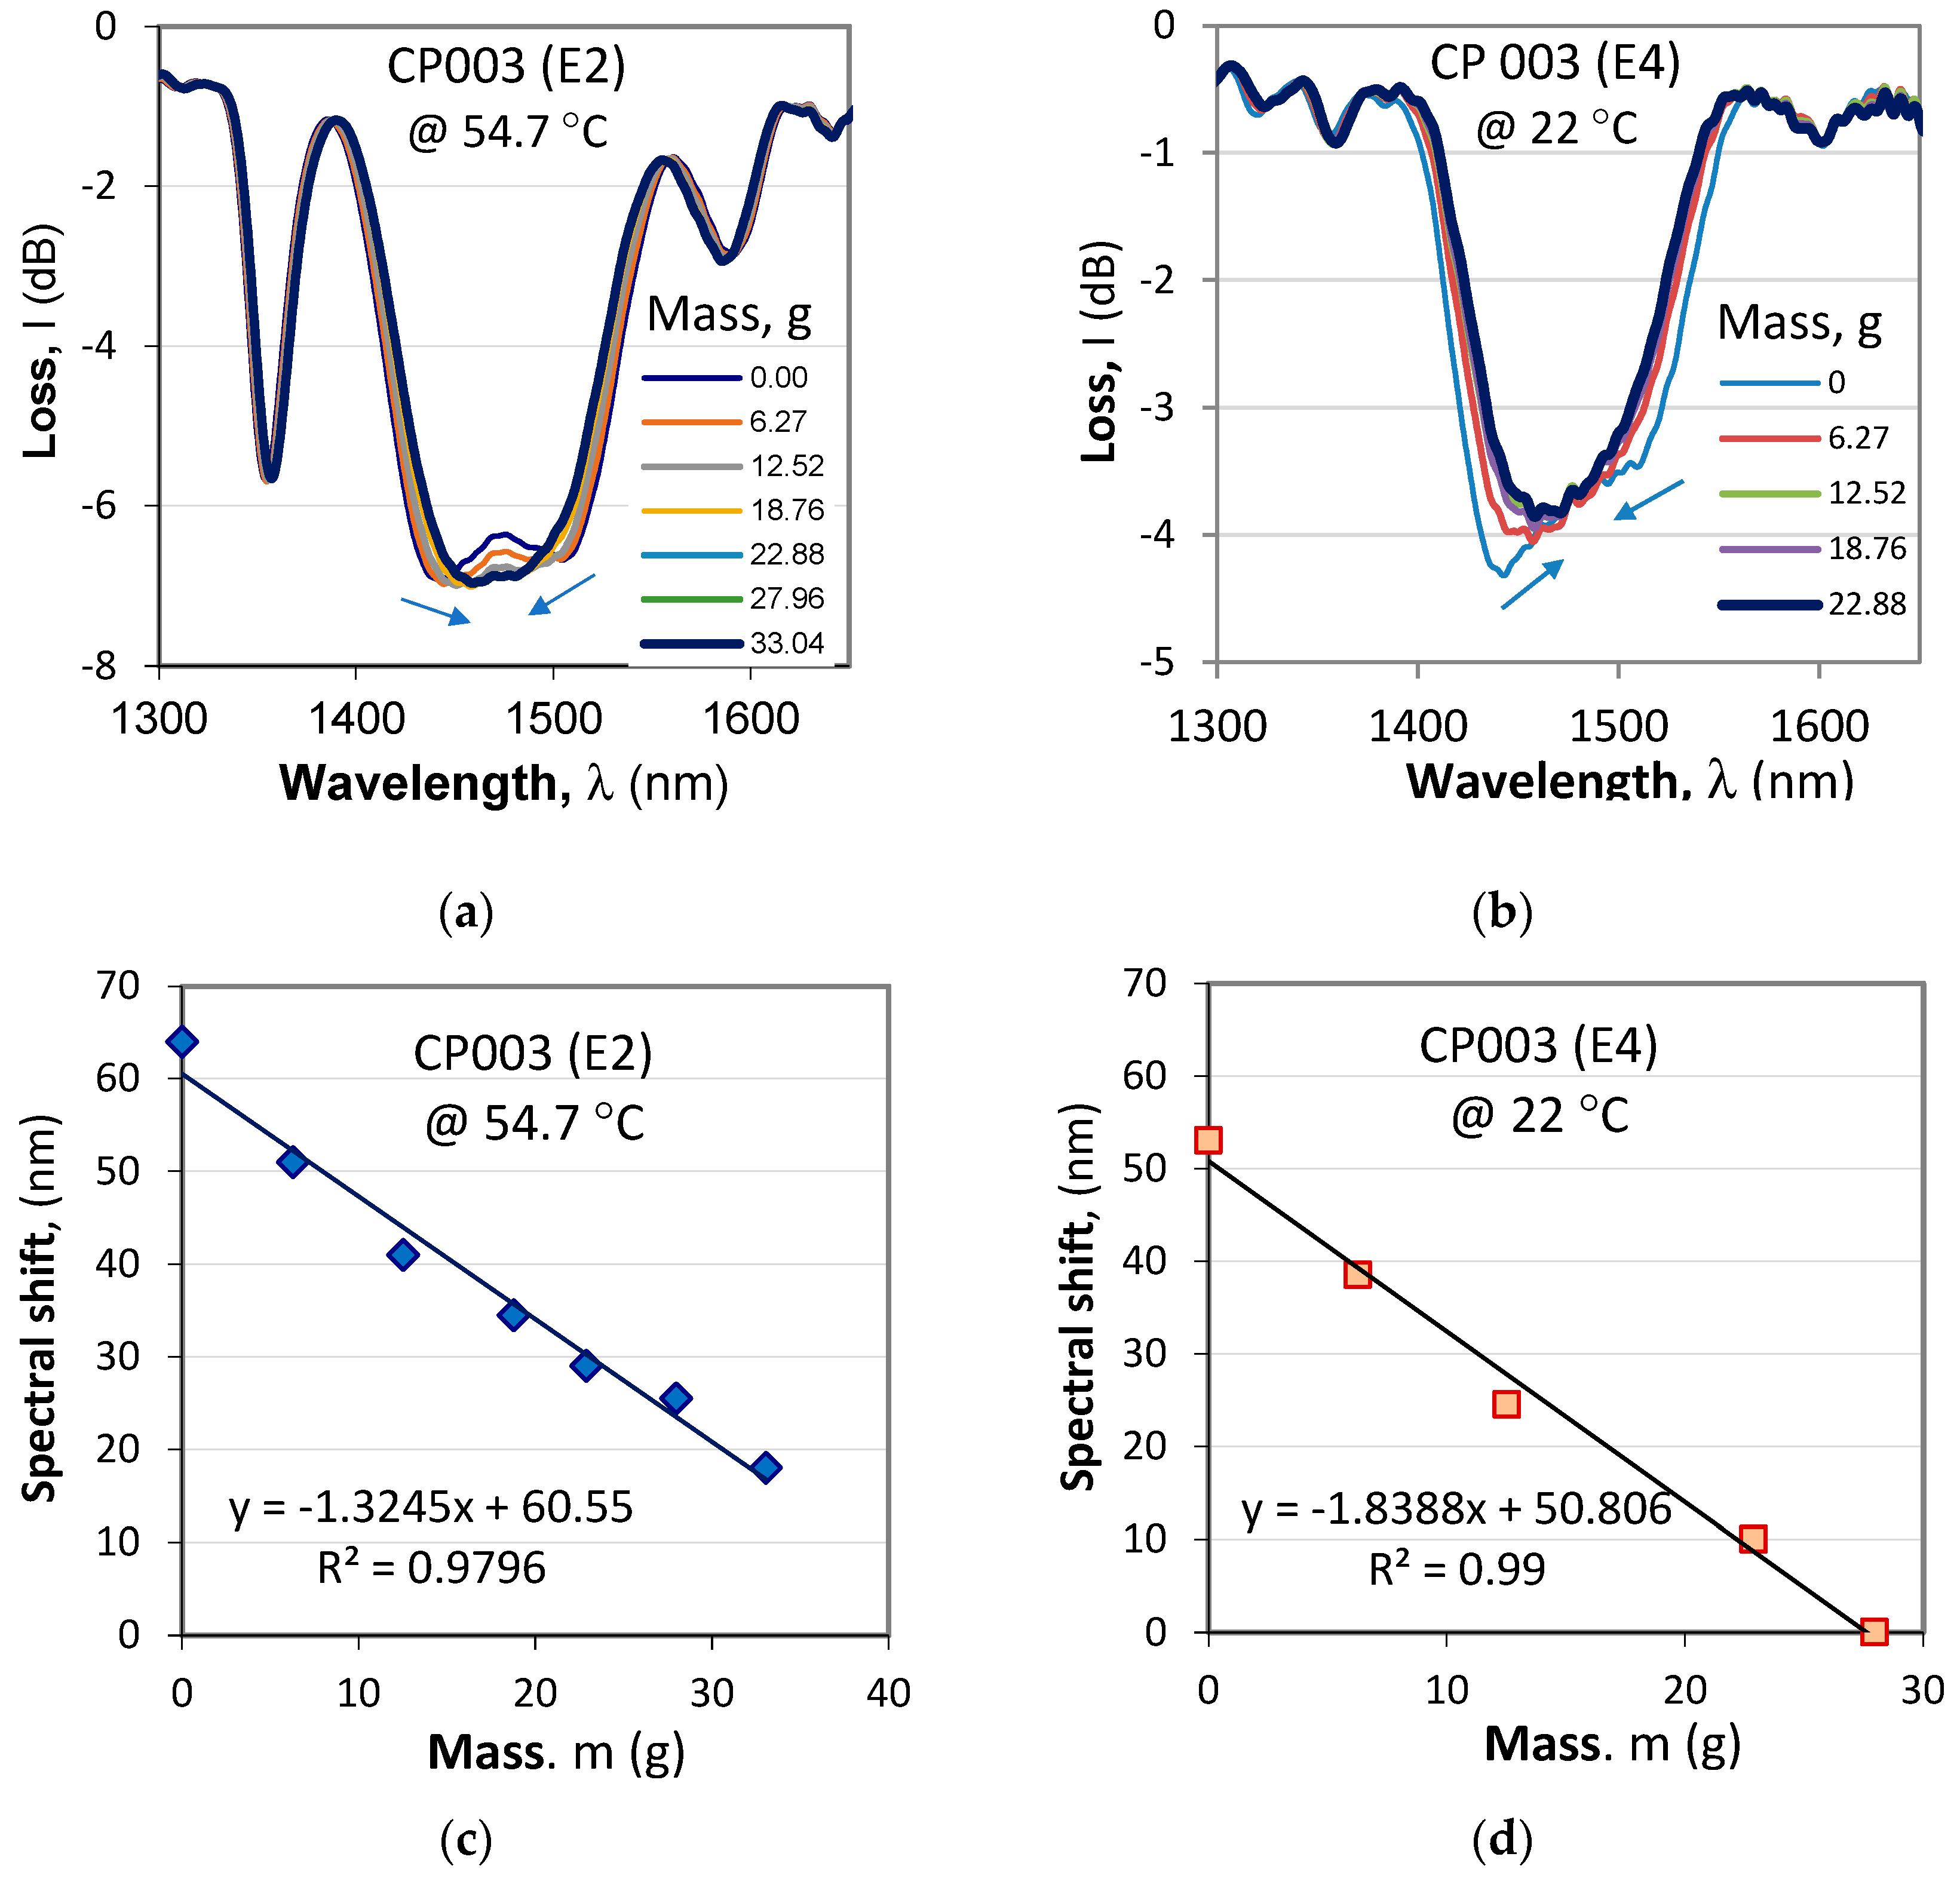
In section 4.1.2. we showed that accurate fine tuning to the TAP can be achieved by using additional weights to increase the strain along the grating. The sensitivity to strain, however, depends on the etching stage and the TAP temperature.
Figure 14 presents the shrinking spectra of grating CP 003 after second (E2) and fourth (E4) etching. After E2 the split occurs around 55C while after E4 the cascaded grating splits at around 22C. As is seen from
Figure 14c,d, the sensitivities are different and after E4 it is higher
Sm = -1.8388 nm/g.
Figure 14.
Fine tuning to TAP of cascaded grating CP 003 caused by additional weights: (a) shrinking spectra after E2 after 54.7 °C; (b) shrinking spectra after E4 at 22 °C; (c) spectral shift vs. additional mass after E2; (d) spectral shift vs. additional mass after E4.
Figure 14.
Fine tuning to TAP of cascaded grating CP 003 caused by additional weights: (a) shrinking spectra after E2 after 54.7 °C; (b) shrinking spectra after E4 at 22 °C; (c) spectral shift vs. additional mass after E2; (d) spectral shift vs. additional mass after E4.
These results show that the sensitivity to strain is quite individual and should be measured for each grating fabricated for sensing applications.
5. Discussion
The cascaded DR LPGs fabricated and experimentally studied in this paper demonstrated advantages over plain DR LPGs. Their SRI sensitivity is higher at TAP, which usually is at room temperature and in case the medium is water (n ≈ 1.333) which is the case for most of the biosensing applications. However, for other sensing applications in which the medium is not water but blood with a refractive index of 1.3475 at 1.55 μm [
27] the cascaded grating will have to be tuned to TAP around a different value using the two methods described and used in this work.
The importance of fine tuning becomes equally important in biosensing applications because n most of the case the outer surface of the gratings will have to be functionalized to become selective. Functionalization in most of the cases means the deposition of nanolayers of specific agents [
18,
21,
22,
23,
24,
25], which will increase the split and may change the sensitivity. The return to the TAP then can be best done only using additional strain which is easier to control than temperature.
As the sensitivity to temperature around TAP is maximum, ambient temperature needs to be strictly controlled and air currents suppressed.
The above means that fine-tuning using etching should be done for a particular set of operational temperature and SRI.
The wavelength split is temperature dependent and follows a logarithmic dependence and hence the sensitivity to temperature is inversely proportional to the temperature itself.
Several issues remain for future studies.
In the first place, a more systematic experimental investigation of the effect of intergrating spacing L0.
Second, more statistical data is needed on the strain sensitivities.
Third, as the TAP is for a given set of SRI, temperature and strain operational conditions, cross sensitivity studies need to be performed.
6. Conclusions
The presented results and analysis make it possible to formulate the following conclusions.
First, cascaded DR LPGs demonstrate definite advantage over single DR LPGs in so much as a higher sensitivity to SRI at TAP is concerned for applications to biosensing.
Second, the results of the increased SRI sensitivity as experimentally obtained in this work are significantly higher than those reported in the literature.
Third, around TAP the sensitivity to temperature is the highest (of the order of 10 nm/°C) which implies that to avoid thermally induced instabilities in SRI based biosensors, the ambient temperature must be stabilized with variations less than 0.01 which is demanding.
Fourth, fine tuning close to TAP can easily be realized by manipulating the longitudinal strain. This is all the more needed in case the cascaded DR LPGs are functionalized with nanolayers for a desired sensing selectivity which will additionally increase the split of the grating.
Author Contributions
For research articles with several authors, a short paragraph specifying their individual contributions must be provided. The following statements should be used “Conceptualization, T.E.; methodology, T.E.; validation, S.G. and V.V.; formal analysis, T.E..; investigation, S.G. and A.A.; resources, G.D..; data curation, S.G.; writing—original draft preparation, T.E.; writing—review and editing, S.G. and G.D; visualization, V.V.; supervision, T.E.; project administration, T.E.; funding acquisition, T.E..
Funding
This research was funded by the Natural Sciences and Engineering Reearch Council (NSERC) of Canada, under a Development Discovery Grant.
Data Availability Statement
The data presented in this study are available on request from the corresponding author.
Conflicts of Interest
The authors declare no conflicts of interest.
References
- Vengsarkar A.M.; Lemaire P.J.; Judkins J.B.; Bhatia V.; Erdogan T.; Sipe J.E., Long period fiber gratings as band-rejection filters, J. Lightwave Technol. 1996, 14, 58–65. [CrossRef]
- Erdogan, T. Fiber grating spectra. J. of Lightwave Technology, 1997, 15(8), 1277–1294. [CrossRef]
- Martinez-Rios, D. Monzon-Hernandez, I. Torres-Gomez and G. Salceda-Delgado, Long Period Fibre Gratings, Chapter · February 2012. IntechOpen, pp.275-294. [CrossRef]
- Bhatia V., Applications of long-period gratings to single and multi-parameter sensing, Opt. Express 1999, 4, 457-466.
- Koffi N’G.: T.Eftimov; Arapova A.; Lesage F.; J.Bock W.; Cherif A., Simultaneous measurement of thermal gradient and average temperature in concrete blocks using non-uniform long period optical fibre gratings, IEEE Trans. on Instrum. & Meas., 2022, 71. Art no. 9509308, pp.1-8.
- Cai, J.; Liu, Y.; Shu, X. Long-Period Fiber Grating Sensors for Chemical and Biomedical Applications, Sensors, 2023, 23, 542. [CrossRef]
- Liu Y.; Williams J.A.R.; Zhang L.; Bennion I., Phase shifted and cascaded long-period fiber gratings, Optics Communications 1999, 164, 27–31.
- Han, Y.-G.; Lee, B. H.; Han, W.-T.; Paek, U.-C.; Chung, Y. Fibre-optic sensing applications of a pair of long-period fibre gratings. Measurement Science and Technology, 2001, 12, 778–781. [CrossRef]
- Eftimov T.; Koffi N’G.; Lesage F.; Mikulic P.; Bock W. J., Responses to temperature and thermal gradients of non-uniform cascaded LPGs taking into account dispersion, Optical Fiber Techn., 2020, 55, 102098. [CrossRef]
- Eftimov T.A.; Bock W.J.; Chen J; Mikulic P., Müller–Stokes analysis of long-period gratings part I: uniformly birefringent LPGs, J. of Lightwave Techn., 2009, 27, 3752-3758.
- Lan, X.; Han, Q.; Wei, T.; Huang J.; and Xiao, H. Turn-Around-Point Long-Period Fiber Gratings Fabricated by CO2 Laser Point-by-Point Irradiations, IEEE Photonics Technology Letters, 2011, 23, 1664-1666. https://ieeexplore.ieee.org/document/6003759. [CrossRef]
- Shen F., Zhou K., Zhang L., and Shu X., Long Period Fiber Grating around the Dispersion Turning Point Fabricated with a Femtosecond Laser, in Asia Communications and Photonics Conference, OSA Technical Digest (online) (Optica Publishing Group, 2017), paper Su2A.104.
- Gambhir, M. and Gupta, S. Review of Turn around Point Long Period Fiber Gratings. J. of Sensor Technology, 2015, 5, 81-89. [CrossRef]
- Dey, T. K.; Tombelli, S.; Biswas, P.; Giannetti, A.; Basumallick, N.; Baldini, F.; Bandyopdhayay, S.; Trono, C. Analysis of the Lowest Order Cladding Mode of Long Period Fiber Gratings near Turn Around Point. J. of Lightwave Techn., 2020, 39, 4006 - 4012. [CrossRef]
- Wong R. Y.-N., Juan D. H., Ibsen M., and Shum P. P., Optical Fibre Long-Period Grating Sensors Operating at and around the Phase Matching Turning Point, Applications of Optical Fibers for Sensing. IntechOpen, Apr. 24, 2019. [CrossRef]
- Dey, T.K.; Tombelli, S.; Roy, A.; Biswas, P.; Giannetti, A.; Basumallick, N.; Baldini, F.; Bandyopadhyay, S.; Trono, C. Sensitivity Analysis of Sidelobes of the Lowest Order Cladding Mode of Long Period Fiber Gratings at Turn Around Point, Sensors 2022, 22, 2965. [CrossRef]
- Xiao, A.; Du, J.; Ling, Q.; Chen, Y.; Gu, Z.; Chen, H.; Yu, Z.; Mao, B.-M.; Guan, Z.; Chen, D. Angularly Cascaded Long-Period Fiber Grating for Curvature and Temperature Detection. Sensors 2024, 24, 184. [CrossRef]
- Trono C., Long period fiber grating-based biosensing: Recent trends and future perspectives, Trends in Analytical Chemistry 2024, 179, 117875. [CrossRef]
- Gu, Z.; Xu, Y.; Deng, C.; Zhang, J. (2009). Dual peak resonance and transmission spectrum characteristics in a coated long-period fiber grating. Journal of Optics A: Pure and Applied Optics, 11(8), 085701–. [CrossRef]
- Zawisza, R.; Eftimov, T.; Mikulic, P.; Bock, W.J.; Jaroszewicz, L.R. Ambient Refractive-Index Measurement with Simultaneous Temperature Monitoring Based on a Dual-Resonance Long-Period Grating Inside a Fiber Loop Mirror Structure. Sensors 2018, 18, 2370. [CrossRef]
- Dey, T.K.; Tombelli, S.; Biswas, P.; Giannetti, A.; Basumallick, N.; Baldini, F.; Bandyopadhyay, S.; Trono, C. Realization of Enhanced Evanescent Field Long Period Fiber Grating near Turn around Point for Label-Free Immunosensing. Proceedings 2020, 60, 9. [CrossRef]
- Dyankov, G.; Eftimov, T.; Hikova, E.O.; Najdenski, H.; Kusovski, V. Genova-Kalou, P.; Mankov, V.; Kisov, H.; Veselinov, P. Ghaffari, S. S.; Kovacheva-Slavova, M.; Vladimirov, B.; Malinowski, N. SPR and Double Resonance LPG biosensors for Helicobacter pylori BabA Antigen Detection, Sensors 2024, 2424, 2118. [CrossRef]
- Eftimov T.; Genova-Kalou P.; Dyankov G.; Bock W. J.; Mankov V.; Ghaffari S. S.; Veselinov P.; Arapova A. and Makouei S., Capabilities of Double Resonance LPG and SPR Methods for Hypersensitive Detection of SARS Cov-2 Structural proteins: A Comparative Study, Biosensors 2023, 13, 318. [CrossRef]
- Dyankov G.; Genova-Kalou P.; Eftimov T.; Ghaffari S.S.; Mankov V.; Kisov H.; Veselinov P.; Hikova E. and Malinowski N., Binding of SARS CoV-2 structural proteins to hemoglobin and myoglobin studied by SPR and DR LPG, Sensors 2023, 23, 3346. [CrossRef]
- Feng W.; and Gu Z., Design of a high-sensitivity cascaded long-period fiber grating sensor operating at PMTP, J. Opt. Soc. Am. 2018, B 35, 2788-2793.
- Zhou, W.; Ran, Y.; Yan, Z.; Sun, Q.; Liu, C.; Liu, D. Sensitivity Characterization of Cascaded Long-Period Gratings Operating near the Phase-Matching Turning Point. Sensors 2020, 20, 5978. [CrossRef]
- Lazareva E. N. and Tuchin V. V., Blood refractive index modelling in the visible and near infrared spectral regions, J of Biomedical Photonics & Eng, 2018, 4, 010503-1. [CrossRef]
Figure 1.
Schematic representation of a long period grating (LPG) of length L, containing N modulations of period Λ with normalized detuning Δ and coupling Κ coefficients.
Figure 1.
Schematic representation of a long period grating (LPG) of length L, containing N modulations of period Λ with normalized detuning Δ and coupling Κ coefficients.
Figure 2.
A cascaded LPG containing two different subgratings with parameters Li, Ni, Λi, Δi, ΚI. (i = 1,2) separated by a fiber section of length L0 as an equivalent Mach-Zehnder modal interferometer between the fundamental LP01 core mode and the higher order mode cladding LP0p.
Figure 2.
A cascaded LPG containing two different subgratings with parameters Li, Ni, Λi, Δi, ΚI. (i = 1,2) separated by a fiber section of length L0 as an equivalent Mach-Zehnder modal interferometer between the fundamental LP01 core mode and the higher order mode cladding LP0p.
Figure 3.
Effects of dispersion and the corresponding fits: (
a) linear dependence of the effective refractive difference Δn
eff between the fundamental HE
11 and six higher order HE
1m modes on the wavelength [
3]; (
b) nonlinear spectral dependence exhibiting a minimum of the detuning ΔN between the fundamental guided and two higher order cladding modes [
19].
Figure 4.
Experimental set-up to fabricate LPGs.
Figure 4.
Experimental set-up to fabricate LPGs.
Figure 5.
Fine tuning of the C DR LPG CP001 to TAP by means of etching in HF: (a) evolution of spectra at 20C; (b) reduction of spectral split vs. etching time at 20C; (c) same as (a) but at 24C; (d) same as (b) but at 24C.
Figure 5.
Fine tuning of the C DR LPG CP001 to TAP by means of etching in HF: (a) evolution of spectra at 20C; (b) reduction of spectral split vs. etching time at 20C; (c) same as (a) but at 24C; (d) same as (b) but at 24C.
Figure 6.
Fine tuning to TAP by additional weights: (a) shrinking spectra; (b) wavelength split decreasing with the cumulative mass.
Figure 6.
Fine tuning to TAP by additional weights: (a) shrinking spectra; (b) wavelength split decreasing with the cumulative mass.
Figure 7.
Evolution of spectra for a varying SRI of a single DR LPG and a cascaded DR LPG having the same period Λ = 207.65 μm: (a) DR LPG with N = 235 ( p = 13.6%) splitting at 24.5C; (b) C DR LPG with N1 = N2 = 80 and L0 = 6 m.
Figure 7.
Evolution of spectra for a varying SRI of a single DR LPG and a cascaded DR LPG having the same period Λ = 207.65 μm: (a) DR LPG with N = 235 ( p = 13.6%) splitting at 24.5C; (b) C DR LPG with N1 = N2 = 80 and L0 = 6 m.
Figure 8.
Evolution of spectra for a varying SRI of the cascaded DR LPG CP 001 (see
Table 1): (
a) after E1 at 41C; (
b) after E2 at 48C; (
c) after E3 at 48.8C; (
d) after E4 at 17.2C; (
e) all plots of Δλ vs SRI; (
f) same as (
e) but for CP 004.
Figure 8.
Evolution of spectra for a varying SRI of the cascaded DR LPG CP 001 (see
Table 1): (
a) after E1 at 41C; (
b) after E2 at 48C; (
c) after E3 at 48.8C; (
d) after E4 at 17.2C; (
e) all plots of Δλ vs SRI; (
f) same as (
e) but for CP 004.
Figure 9.
Cumulative probability distributions F* vs. SRI sensitivity S: (a) F* for 25 DR LPGs and their three subpopulations; (b) F* for the two subintervals of the 11 C DR LPGs.
Figure 9.
Cumulative probability distributions F* vs. SRI sensitivity S: (a) F* for 25 DR LPGs and their three subpopulations; (b) F* for the two subintervals of the 11 C DR LPGs.
Figure 9.
Evolution of spectra for a varying temperature in the 5C to 65C temperature range for cascaded DR LPG CP 003 with
N1=
N2=115,
L0=13mm: (
a) lower temperature range from 5C to 37C splitting at ≈36C; (
b) higher temperature range from 36C to 65C and a new minimum appearing at 60C for a high temperature split. The spectra suggest that a splitting under 5C (around 0C), a second at 36C, and a third above 70C as summarized in
Table 2.
Figure 10.
Evolution of spectra for a varying SRI of a single DR LPG and a cascaded DR LPG having the same period Λ = 207.65 μm: (a) DR LPG with N = 235 ( p = 13.6%) splitting at 24.5C; (b) C DR LPG with N1 = N2 = 80 and L0 = 6 m.
Figure 10.
Evolution of spectra for a varying SRI of a single DR LPG and a cascaded DR LPG having the same period Λ = 207.65 μm: (a) DR LPG with N = 235 ( p = 13.6%) splitting at 24.5C; (b) C DR LPG with N1 = N2 = 80 and L0 = 6 m.
Figure 11.
Temperature induced evolution of the spectra of a C DR LPG prior to etching (E0) and after 4th etching (E4): (a) a medium temperature split before etching at the extremity of the 5C - 35C low temperature range; (b) a spectral split before etching (E0) in the 35C-37.5C range within the 35C-65C interval; (c) Low temperature split after 4th etching (E4) around the middle of the 5C – 35C range; (d) high temperature split after 4th etching (E4) around the middle of the 40C – 65C range.
Figure 13.
Temperature dependence of the sensitivity to temperature ST calculated from (22): (a) sensitivities to temperature at lower and higher temperature splits after four consecutive etchings for CP 001; (b) sensitivity to temperature at lower and higher temperature splits for a non-etched CP 002.
Table 1.
Comparison table of the sensitivities to SRI of the eleven cascaded DR LPGs.
Table 1.
Comparison table of the sensitivities to SRI of the eleven cascaded DR LPGs.
| # |
Label |
2xN +L0
|
S(I)
1.33 to 1.35 |
S(II)
> 1.35 |
@ T(C) |
| 1 |
CP 001 |
2x80+6mm |
4182.7 |
2369.1 |
20C |
| 2 |
CP 005 |
2x80+6mm |
3518.4 |
2518 |
24.2 C |
| 3 |
CP 013 |
2x118+13mm |
4231.1 |
2342.3 |
25.5 C |
| 4 |
CP 014 |
2x118+13mm |
3385.4 |
2555.3 |
23 C |
| 5 |
CP 015 |
2x118+13mm |
4602.5 |
2399.1 |
22.5C |
| 6 |
CP 017 |
2x118+13mm |
3549 |
2728.5 |
20.5C |
| 7 |
CP 018 |
2x118+13mm |
5457.4 |
2634.1 |
25.5C |
| 8 |
CP 019 |
2x118+20mm |
5063.2 |
2476.9 |
22.7C |
| 9 |
CP 020 |
2x118+20mm |
3816.9 |
2599.3 |
20.5C |
| 10 |
CP 022 |
2x118+20mm |
4475.2 |
2893.2 |
22C |
| 11 |
CP 023 |
2x118+20mm |
3201.8 |
3090.2 |
25C |
Table 3.
Evolution of the low and high temperature splits at TAP wavelength of 1467nm for a non-etched cascaded DR LPG CP 004 (N1=N2=118, L0=13mm).
Table 3.
Evolution of the low and high temperature splits at TAP wavelength of 1467nm for a non-etched cascaded DR LPG CP 004 (N1=N2=118, L0=13mm).
| Etching stage |
Low temperature split |
High temperature split |
| E 0 (prior to etching) |
15 C @ -4.2 dB |
50C @ -2.3dB |
Table 4.
Evolution of the low and high temperature splits at TAP wavelength of 1451.5 nm for cascaded DR LPG CP 001.
Table 4.
Evolution of the low and high temperature splits at TAP wavelength of 1451.5 nm for cascaded DR LPG CP 001.
| Etching stage |
Low temperature split |
High temperature split |
| E 0 (prior to etching) |
< 0C |
36C @ -14dB |
| E 1 (after 1st etching) |
5.2C @ -3 dB |
41.1 C @ -16dB |
| E 2 (after 2nd etching) |
10C @ -5.8 dB |
46.5C @ -16dB |
| E 3 (after 3rd etching) |
12 C @ -6.2dB |
52C @-16dB |
| E 4 (after 4th etching) |
17.2C @ -6.5dB |
58C @ -16dB |
Table 5.
Comparison table of the sensitivities to temperature of the eleven cascaded DR LPGs.
Table 5.
Comparison table of the sensitivities to temperature of the eleven cascaded DR LPGs.
| # |
Label |
Tb (°C) |
C |
C0 |
TAP temperature (°C) |
STAP (nm/ °C) |
| 1 |
CP 001 |
0 |
191.32 |
-532.68 |
20 C |
9.57 |
| 2 |
CP 005 |
0 |
233.3 |
-730.48 |
24.2 C |
9.64 |
| 3 |
CP 013 |
0 |
221.24 |
-680.88 |
24.8 C |
8.92 |
| 4 |
CP 014 |
0 |
212.12 |
-642.47 |
23.5 C |
9.03 |
| 5 |
CP 015 |
0 |
242.94 |
-732.46 |
22.5C |
10.8 |
| 6 |
CP 017 |
0 |
204.86 |
-608.7 |
22.5 C |
9.1 |
| 7 |
CP 018 |
0 |
215.89 |
-666.4 |
25.5C |
8.47 |
| 8 |
CP 019 |
18 |
100.94 |
-154.28 |
23.8C |
17.40 |
| 9 |
CP 020 |
15 |
98.373 |
-154.45 |
21.4C |
15.37 |
| 10 |
CP 022 |
14 |
121.51 |
-247.33 |
22C |
15.19 |
| 11 |
CP 023 |
0 |
199.09 |
-597.34 |
22C |
9.05 |
|
Disclaimer/Publisher’s Note: The statements, opinions and data contained in all publications are solely those of the individual author(s) and contributor(s) and not of MDPI and/or the editor(s). MDPI and/or the editor(s) disclaim responsibility for any injury to people or property resulting from any ideas, methods, instructions or products referred to in the content. |
© 2025 by the authors. Licensee MDPI, Basel, Switzerland. This article is an open access article distributed under the terms and conditions of the Creative Commons Attribution (CC BY) license (http://creativecommons.org/licenses/by/4.0/).