
Submitted:
04 August 2025
Posted:
06 August 2025
You are already at the latest version
Abstract
Early and accurate detection of pneumonia from chest X-ray images is essential for improving
treatment and clinical outcomes. However, medical imaging datasets often exhibit class
imbalance and considerable uncertainty in the extracted image features, which complicates the use of
conventional classification methods and motivates the adoption of advanced techniques such as deep
learning and fuzzy logic. This study proposes a hybrid approach combining deep learning architectures
(VGG16, EfficientNetV2, MobileNetV2, ResNet50) for feature extraction with fuzzy logic-based
classifiers, including models that handle uncertainty and fuzzy rules. Additionally, feature selection
techniques were employed to enhance feature extraction. The model achieved an overall accuracy of
approximately 93.5%. For the Abnormal class, precision was around 97.4%, sensitivity was 95.4%, and
the F1-score was approximately 96.4%. For the Normal class, precision was near 88.5%, sensitivity
was 89.3%, and the F1-score was about 88.9%. The results demonstrate that integrating deep feature
extraction with fuzzy logic improves diagnostic accuracy and robustness, providing a reliable tool for
clinical support. Future research will focus on optimizing model efficiency and interpretability.
Keywords:
pneumonia detection
; chest X-ray
; deep learning
; feature selection
; VGG16
; Efficient- NetV2
; MobileNetV2
; ResNet50
; fuzzy classifiers
; medical imaging
; hybrid model
; clinical decision support
1. Introduction
Pneumonia is a respiratory disease that causes inflammation in the lungs and is one of the leading causes of morbidity and mortality worldwide, particularly among vulnerable populations such as children, the elderly, and immunocompromised patients [1]. Early and accurate detection of this condition is crucial for initiating appropriate treatment and improving the patient’s clinical prognosis [2].
In this regard, chest X-rays (CXR) remain the most widely used imaging diagnostic tool due to their low cost, speed, and availability [3]. However, interpreting chest radiographs can be complex and subjective, even for experienced radiologists, because of overlapping anatomical structures, low image resolution in some cases, and the visual similarity between pneumonia and other pulmonary conditions [4]. Moreover, in many parts of the world, resource limitations and a shortage of specialists hinder timely and high-quality diagnosis [5].
Given these challenges, computer-aided diagnosis (CAD) systems have gained increasing importance in the field of medical imaging [6]. In particular, artificial intelligence (AI)-based approaches have shown great potential to enhance diagnostic accuracy, reduce the workload on healthcare professionals, and accelerate clinical workflows [7]. Among these, deep learning techniques have enabled significant progress in image classification tasks due to their ability to learn discriminative representations directly from data without the need for manual feature engineering [8].
In addition to traditional machine learning methods, fuzzy logic-based techniques have proven highly useful in biomedical applications due to their ability to handle the uncertainty and imprecision inherent in medical data [9]. In particular, fuzzy systems offer a flexible and interpretable way to model relationships between clinical variables, facilitating decision-making in complex scenarios such as medical diagnosis [10,11]. These characteristics make fuzzy algorithms a promising tool to complement and enhance automatic disease detection systems, such as those used for identifying pneumonia in medical imaging.
In recent years, several studies have explored the use of automated models for detecting pneumonia in CXR, leveraging large-scale public datasets. However, significant challenges remain, including class imbalance in medical data, inter-patient variability, and uncertainty in visual patterns. These factors can affect model robustness and limit generalization in real-world clinical settings.
Therefore, this work focuses on the development of an automatic system for pneumonia detection in chest radiographs, employing advanced deep learning techniques to improve the accuracy and efficiency of computer-aided diagnosis—ultimately contributing to timely and effective clinical care.
1.1. Proposed Work
This study proposes a hybrid approach for the automated detection of pneumonia in CXR, combining advanced deep learning techniques with fuzzy logic to enhance the accuracy, robustness, and interpretability of computer-aided diagnosis systems. For automatic feature extraction from medical images, pretrained deep neural networks such as VGG16[12], EfficientNetV2[13] , MobileNetV2 [14], and ResNet50[15] are employed.
Subsequently, a genetic algorithm (GA) [16] is applied to optimize the feature selection process, enabling the identification of the most informative and relevant features for the classification task. The resulting feature subsets are evaluated using clustering validation metrics—specifically, the Silhouette coefficient and the Calinski-Harabasz index (CH index) jointly referred to as the quality metric Q, in order to determine the optimal representations for classification.
These optimized features are then processed by a set of fuzzy logic-based classifiers, including fuzzy Support Vector Machine (Fuzzy SVM), Fuzzy Bayesian Network (Fuzzy BN), Fuzzy Decision Tree (Fuzzy DT), Fuzzy K-Nearest Neighbors (Fuzzy KNN), l (FGK), and Fuzzy C-Means (Fuzzy CM). These classifiers are capable of handling the uncertainty inherent in medical data through the use of fuzzy rules and specialized inference models. The integration of feature selection techniques further improves data representation, contributing to increased system efficiency and overall performance.
The structure of this paper is organized as follows. Section 2 introduces the classification strategies explored in this work, with an emphasis on deep learning techniques Convolutional neural network (CNNs) and fuzzy logic-based approaches. Section 3 describes the fuzzy logic-based classification models employed in the study. Section 4 details the data sources and outlines the methodological framework, including the training scheme, feature extraction process, and evaluation protocol. Section 5 presents the experimental results, which are further analyzed and discussed in Section 6. Finally, Section 8 summarizes the main contributions of this work and outlines directions for future research.
2. Fundamental Concepts CNN
This section provides an overview of CNNs, focusing on the particular architecture adopted for this research.
CNNs have gained widespread attention due to their superior accuracy in tasks involving image recognition and classification. Fundamentally, they can be viewed as specialized feedforward artificial neural networks (ANNs) [17], as depicted in Figure 1.
These networks consist of multiple layers, each containing trainable filters or kernels (also called neurons) with weights and biases that are optimized during training. The process involves convolving these filters over the input data, often followed by nonlinear activation functions to introduce complexity [18]. A standard CNN architecture is composed of the following elements:
- Convolutional layers (CONV): These layers apply convolutional operations to extract features from the input data.
- Pooling layers (POOL): They reduce the spatial dimensions of feature maps, commonly through subsampling, to decrease computational load and capture dominant features.
- Fully connected layers (FCL): These layers connect every neuron from the previous layer to each neuron in the current layer, similar to a traditional perceptron, to interpret extracted features.
- Classification layer (Softmax): This final layer computes probabilities for each class, assigning the input to the most likely category.
2.1. Optimization of Hyperparameters
Hyperparameters in CNNs are parameters that are not learned during training but must be predefined . They significantly affect model performance and training efficiency .
Important hyperparameters include:
- Number of layers: Typically a combination of convolutional, activation (e.g., ReLU), pooling, and fully connected layers [19].
- Filter size (kernel size): Examples include , , or , which influence feature extraction granularity [20].
- Number of filters: Determines the depth and expressiveness of feature maps, balancing computational cost and accuracy [21].
- Stride: Controls the step size of filters over the input; common values are 1 or 2, affecting output size [22].
- Padding: Preserves spatial dimensions, typically set as ‘same’ or ‘valid’ [23].
- Activation functions: Such as ReLU, leaky ReLU, or Sigmoid; ReLU is favored for simplicity and effectiveness [24].
- Pooling layers: Max pooling or average pooling with typical pool sizes of reduce spatial dimensions and computational load [25].
- Fully connected layers: Size varies depending on task complexity; output layer size matches the number of classes [26].
- Dropout: A regularization technique to prevent overfitting by randomly deactivating neurons during training, usually with rates between 0.2 and 0.5 [27].
- Batch size: Number of samples processed per training iteration, impacting convergence speed and computational requirements [28].
- Number of epochs: Defines how many times the entire dataset is passed through the network during training [29].
- Learning rate: Controls the optimization step size; too small slows convergence, too large risks instability [30].
- Optimizers: Algorithms such as Stochastic Gradient Descent (SGD), Adam, and RMSprop influence training efficiency and model accuracy [31].
Selecting optimal hyperparameters depends on the dataset, problem domain, and available computational resources, often requiring iterative tuning and experimentation-
2.2. CNN Approaches Implemented
In this study, four CNN architectures with distinct characteristics and purposes were employed for image classification and analysis: VGG16, EfficientNetV2, MobileNetV2, and ResNet50. VGG16 is recognized for its simplicity and depth, stacking exclusively small convolutional filters across multiple layers to increase representational capacity. It also uses pooling layers to reduce spatial dimensions and fully connected layers for classification. EfficientNetV2 optimizes both accuracy and efficiency by applying compound scaling of depth, width, and resolution, along with improved training techniques. This architecture achieves strong performance with fewer parameters and faster training times compared to previous models. MobileNetV2 is designed specifically for efficiency on mobile and embedded devices, utilizing depthwise separable convolutions to significantly reduce the number of parameters and computational cost. It introduces bottleneck layers and residual connections to further enhance performance. ResNet50, a deep residual network, addresses the degradation problem in very deep networks by using skip connections that facilitate gradient flow during training. This architecture enables training of very deep models while maintaining high accuracy. Each of these architectures offers unique advantages that complement one another to enhance visual data analysis in this study.
3. Fuzzy Logic-Based Classification Models
Fuzzy logic, introduced by Zadeh in 1965, is a mathematical framework designed to handle imprecision and uncertainty [32]. Unlike classical binary logic, where variables are either true or false, fuzzy logic allows for degrees of truth by assigning membership values in the range . This capability makes it especially suitable for modeling uncertainty in medical data and supporting decision-making processes.
Fuzzy sets are defined by membership functions that quantify the degree to which an element belongs to a fuzzy set. Several types of membership functions are commonly employed, each characterized by specific shapes and properties. Among the most widely used are the triangular, trapezoidal, and Gaussian membership functions. These functions are fundamental in fuzzy systems as they determine how input features influence the fuzzy inference rules.
Figure 2 illustrates examples of these membership functions applied to three different input features.
In the context of fuzzy classification, several models have been developed by integrating fuzzy logic principles with traditional machine learning techniques. These models differ in how they incorporate fuzzy sets, membership functions, and inference mechanisms. Below, we briefly describe some representative fuzzy classification algorithms commonly found in the literature and relevant to this work.
3.1. Fuzzy SVM
According to CHEN [33], Fuzzy SVM extends the classical SVM by incorporating fuzzy membership values to handle uncertainty and noise in the training data. Given a training set , where each input represents a feature vector and is the corresponding class label, the classical SVM aims to find the optimal separating hyperplane by solving the following optimization problem:
subject to the constraints
In Fuzzy SVM, each training sample is assigned a fuzzy membership value that reflects its importance or reliability. The objective function is modified to weight the slack variables accordingly, resulting in:
with the same constraints as in Equation (2). This weighting reduces the influence of noisy or less reliable samples during training.
3.2. Fuzzy BN
As described in ZAREI [34], Fuzzy BNs integrate probabilistic reasoning with fuzzy logic to effectively handle uncertainty and imprecision in classification problems. Given a feature vector , the fuzzy posterior probability of each class is computed by combining the prior probability of the class with the membership degrees , which represent how strongly each feature belongs to the fuzzy set associated with class . Formally, this relationship is expressed as:
Here, is the prior probability of class , and denotes the fuzzy membership degree for the feature .
The final classification decision assigns the class with the highest fuzzy posterior probability, defined by:
3.3. Fuzzy DT
According to [35], Fuzzy Decision Trees (Fuzzy DT) extend classical decision trees by allowing fuzzy memberships at each decision node, enabling better handling of uncertainty in attribute values. Given a set of attributes , the fuzzy membership degree of an example to a particular branch j at a decision node is calculated by aggregating the individual memberships corresponding to the node’s conditions on each attribute.
This aggregation is formally expressed as:
where represents the membership degree of attribute with respect to the j-th fuzzy condition, and T is a t-norm operator (such as the minimum or product) used to combine these memberships.
The final class assignment is made by aggregating the fuzzy memberships obtained from all relevant branches and leaves, thus allowing the model to express uncertainty and partial membership during the decision-making process.
Equation (6) highlights how fuzzy logic is incorporated into the decision nodes to improve classification robustness under ambiguity.
3.4. Fuzzy KNN
As explained in LOHRMANN [36], the Fuzzy KNN algorithm extends the traditional KNN by assigning fuzzy memberships to the query point based on its proximity to neighbors, allowing a soft classification that accounts for uncertainty.
Let x be the sample to classify, and its K nearest neighbors with corresponding class labels . The fuzzy membership degree of x to a particular class c is computed by weighting the memberships of its neighbors, where weights depend inversely on the distances between x and each neighbor .
Formally, this membership is given by
where indicates whether the neighbor belongs to class c, is the distance between the points, and is the fuzziness parameter controlling how sharply the membership values decline with distance.
The final classification decision assigns the point x to the class with the highest membership value:
3.5. FGK
According to SAKRWAR [37], the FGK algorithm is a clustering method that adapts the distance metric to the shape of each cluster, allowing ellipsoidal cluster forms through the use of an adaptive distance matrix.
Let denote a data point and be the centroid of cluster j, for , where c is the total number of clusters. The adaptive squared distance between and the centroid is defined as
where is a symmetric positive definite matrix that controls the shape and orientation of cluster j.
Using these distances, the membership degree of to cluster j, denoted , is computed by
where is the fuzziness parameter that regulates the degree of cluster overlap.
3.6. FCM
As described by abdullah [38], given a dataset in a d-dimensional space , the goal of FCM clustering is to find c cluster centroids and the membership degrees that represent the degree to which each data point belongs to cluster j.
This is achieved by minimizing the objective function defined in Equation (11), which sums the weighted squared distances between data points and cluster centers, weighted by the membership degrees raised to the fuzziness parameter m.
The memberships satisfy the constraint given in Equation (12), ensuring that the sum of membership degrees of each point across all clusters equals one.
Here, denotes the membership degree of point to cluster j, controls the fuzziness or softness of cluster boundaries, and is the Euclidean distance between and centroid .
The algorithm iteratively updates the membership degrees and centroids according to Equations (13) and (14), respectively. The membership update (Equation (13)) calculates memberships based on relative distances to centroids, while the centroid update (Equation (14)) computes centroids as the weighted average of data points.
subject to:
4. Materials and Methods
This study proposes a hybrid methodology for the automatic detection of pneumonia in CXR images, combining deep learning for feature extraction with fuzzy logic-based classification. The general pipeline includes dataset preparation, feature extraction using CNN architectures, feature selection viaGAs, and classification using fuzzy systems. Finally, the quality of the selected features is evaluated through clustering and separability metrics. Figure 3 illustrates the overall workflow.
4.1. Dataset Preparation
- The dataset consists of labeled CXR images divided into pneumonia-positive and normal classes.
- The data was split into training and testing sets, maintaining class balance and representative sampling.
- Preprocessing involved normalization and resizing images to fit the input requirements of the CNN models.
4.2. CNN Architectures for Deep Feature Extraction
- Pre-trained CNN architectures such as VGG16, EfficientNetV2, MobileNetV2, and ResNet50 were employed.
- The models were fine-tuned on the training dataset.
- Features were extracted from the penultimate layers to be used in subsequent classification steps.
4.3. Feature Selection Using GAs
- The deep features extracted from the CNNs are typically high-dimensional and may contain redundant or irrelevant components.
- To address this, two GA-based feature selection methods were applied to reduce dimensionality and retain the most discriminative features.
- Each method uses a different fitness criterion: one based on a supervised quality metric Q, and the other on the unsupervised Silhouette index.
- The selected subsets were evaluated using clustering and separability metrics such as Calinski-Harabasz and Davies-Bouldin indices.
- The best-performing feature set was used as input to the fuzzy logic-based classifiers to optimize accuracy and robustness.
4.4. Fuzzy Classification Models and Evaluation
- Several fuzzy logic-based classifiers were trained using the selected features.
- Classifiers included Fuzzy SVM, Fuzzy BN, Fuzzy DT, Fuzzy KNN, FGK, and Fuzzy CM.
- Performance was evaluated on the test set using metrics such as accuracy, precision, recall, F1-score, and ROC curves.
4.5. Testing and Validation
- The test images were preprocessed and passed through the trained CNN feature extractors.
- Selected features were input into the trained fuzzy classifiers.
- The model’s performance was assessed on unseen data to verify generalization.
4.6. Dataset Preparation
The dataset used in this study is the publicly available CXR Images (Pneumonia) dataset, which was originally introduced as part of a clinical study published in Cell journal [39]. It comprises 5,863 anterior-posterior (AP) CXR images of pediatric patients aged between one and five years. The data were collected at the Guangzhou Women and Children’s Medical Center in China as part of routine clinical care. All radiographs were initially screened for quality assurance, and low-quality or unreadable scans were excluded. Diagnostic labels—classified as either Normal or Pneumonia (bacterial or viral)—were assigned based on expert evaluation. Each image was graded independently by two certified radiologists, and to ensure diagnostic accuracy, a third specialist reviewed the evaluation subset to mitigate annotation errors.
The dataset is organized into three predefined folders: training, validation, and testing. These subsets are balanced across the two classes, facilitating supervised learning and consistent performance evaluation. The images are in JPEG format and exhibit sufficient resolution for feature extraction via CNNs. The dataset is available under a Creative Commons (CC BY 4.0) license and can be accessed through Mendeley Data [40]. Figure 4 provides example CXR scans illustrating the visual differences between normal lungs and those affected by bacterial and viral pneumonia.
4.7. CNN Architectures for Deep Feature Extraction
To extract rich and discriminative feature representations from CXR images, several well-known CNN architectures were employed in a transfer learning setting. The models used include VGG16, EfficientNetV2, MobileNetV2, and ResNet50. Each of these networks was initialized with weights pretrained on the ImageNet dataset. Their original classification layers were removed, and the convolutional base was kept frozen during training in order to retain the generic visual features learned from large-scale natural image datasets.
On top of each frozen base CNN, a custom classification head was added to adapt the model to the binary task (normal vs. pneumonia). This head consists of a Global Average Pooling layer, followed by two fully connected (dense) layers with ReLU activation, and a final dense layer with a sigmoid activation function to perform binary classification. During training, only these top layers were optimized. The output of the penultimate dense layer was extracted as a deep feature vector for each image.
Table 1 presents the complete architecture used across all CNN models.
These deep features were then used as inputs to fuzzy logic-based classifiers, combining the automatic and powerful feature extraction capability of CNNs with the flexibility and uncertainty management provided by fuzzy models. This hybrid approach aims to improve diagnostic accuracy and robustness by leveraging the strengths of both methodologies.
4.8. Feature Selection Using Genetic Algorithms (GAs)
Although CNNs can extract highly informative features, many of them may be redundant or irrelevant for the final classification task. To address this, we employed two feature selection strategies based on Genetic Algorithms (GAs), aimed at reducing dimensionality and enhancing classification performance. The resulting subsets were then evaluated to determine the optimal combination of features for use in fuzzy logic-based classifiers, thus improving the system’s robustness and accuracy.
Method 1: GA-Based Feature Selection Using Quality Metric Q
This method is centered on maximizing the separability between classes. It uses a quality metric Q, defined in Equation (15), that computes the average Euclidean distance between all pairs of samples belonging to different classes:
where and are the sets of selected feature vectors belonging to class 0 and class 1, respectively, and denotes the Euclidean distance between samples x and y. The GA searches for the subset that maximizes Q, thus promoting better class separability.
Method 2: GA-Based Feature Selection Using the Silhouette Index
In this unsupervised approach, the fitness of a feature subset is evaluated using the average Silhouette index, which quantifies how well each data point is clustered with its own group versus others. The objective function is defined in Equation (16):
where is the average distance from sample i to other points in the same cluster, and is the minimum average distance from sample i to points in any other cluster. The GA aims to find feature subsets that maximize this index, thereby improving intra-cluster compactness and inter-cluster separation.
In addition to the Silhouette index, other cluster validity indices are used to assess clustering quality:
- CH: Measures the ratio of between-cluster dispersion to within-cluster dispersion. It is defined in Equation (17):where and are the traces of the between-cluster and within-cluster dispersion matrices, respectively.
- Davies-Bouldin Index (DB): Captures the average similarity between each cluster and its most similar counterpart, as shown in Equation (18):where is the intra-cluster distance of cluster i, and is the distance between centroids of clusters i and j.
4.9. Fuzzy Classification Models and Evaluation
The optimal feature subset, obtained through the GAs described in the previous section, was used as input for several fuzzy classifiers. These models leverage fuzzy logic rules and membership functions to handle the uncertainty and imprecision often present in medical data. The classifiers evaluated include: Fuzzy KNN, Fuzzy DT, Fuzzy SVM, Fuzzy BC, and FCM.
Each model was tuned using different types of membership functions (triangular, trapezoidal, and Gaussian) and decision thresholds to optimize classification performance.
To ensure fair and robust evaluation, the dataset—originally organized into separate training, validation, and test folders—was restructured by merging all samples into a single pool grouped only by class label (Normal or Pneumonia). This restructuring enabled the application of stratified 5-fold cross-validation, ensuring consistent class distribution across folds.
We used 80% of the dataset for training, which included both feature selection and model tuning. Within this portion, 20% was reserved internally for validation. The remaining 20% of the total dataset was set aside for final testing.
The evaluation metrics used in this study—accuracy, precision, recall (sensitivity), specificity, F1-score, and AUC—are standard in binary classification problems. These metrics provide complementary views of the model’s performance and are widely used in medical diagnosis tasks.
5. Results
Before presenting the experimental results in detail, Figure 5 shows the overall workflow of the proposed approach. The methodology starts with preprocessing and enhancement of medical images, followed by two main analysis paths:
- Path 1: Direct use of the original images as input to the fuzzy classification system, without applying any feature extraction or selection.
- Path 2: Deep feature extraction and selection using several CNN architectures, including MVGG16, EfficientNetV2, MobileNetV2, and ResNet50. This step is followed by optimization through a genetic algorithm (GA) to identify the most informative features. The resulting feature subsets are evaluated with clustering validation metrics—specifically the Silhouette coefficient and the Calinski-Harabasz Index (referred to as the quality metric Q)—to select the most discriminative representations.
The following subsections analyze the results obtained at each stage of the proposed process, including a detailed comparison of the models and their quantitative performance metrics.
5.1. Direct Image-Based Classification
The results in Table 2 correspond to the classifiers’ outputs when the original images—resized but without any feature extraction—are used directly as input. Various fuzzy classification methods and membership functions were evaluated under these conditions. The reported metrics (sensitivity, specificity, precision, F1-score, true negatives, false positives, false negatives, true positives) provide a comprehensive assessment of each configuration’s performance.
Overall, the results indicate limited effectiveness of the classifiers on raw image data. While some metrics appear high in certain cases, a deeper analysis reveals misleading performance. For example, the Fuzzy DT classifier exhibits a sensitivity of 100% and specificity of 0% in several configurations, indicating that it classifies all samples as positive and fails to detect negative cases, which is a clear bias rather than effective classification.
Similarly, Fuzzy BN and Fuzzy CM show consistently poor results. For instance, Fuzzy BN with a trapezoidal membership function achieves only 38.03% sensitivity and 48.40% F1-score. Fuzzy CM yields one of the lowest performances, with an F1-score of 30.94%, far below acceptable levels.
Although some configurations of Fuzzy SVM and Fuzzy KNN yield better results—such as Fuzzy SVM with a Gaussian membership function achieving an F1-score of 95.52%—these are exceptions. Most methods present critical shortcomings in at least one key metric (sensitivity, specificity, or precision).
These findings suggest that using the original images directly as input to fuzzy classifiers does not provide reliable results. Significant improvements are necessary, both in the choice of fuzzy method and in the tuning of membership functions and other parameters. Additionally, isolated high metric values should be interpreted cautiously and in the context of all relevant measures to properly assess model performance.
5.2. Feature Extraction Based on Images
5.2.1. Feature Selection Analysis Based on Quality Metric Q
This section presents the results of applying a GA for feature selection using the quality metric Q as the fitness function. The process was performed on features extracted from five different CNN models: MobileNetV2, ResNet50, VGG16, EfficientNetV2, and a custom CNN. The objective is to identify the most representative and discriminative subsets of features that enhance class separability and improve classification performance in image-based tasks.
Feature Quality Visualization Based on Metric Q
Table 3 presents PCA-based visualizations of the selected features for each evaluated CNN model. Each subfigure shows the projection of the data onto the first two principal components, PC1 and PC2, allowing visualization of class distribution and separability in the reduced feature space.
Table 3(a) displays the selected features extracted by the custom CNN model, showing a clear separation between classes. Table 3(b) corresponds to EfficientNetV2, where clusters exhibit some degree of overlap. Table 3(c) illustrates the feature representation for MobileNetV2, while Table 3(d) shows the projection for ResNet50. Finally, Table 3(e) presents the feature distribution for VGG16, demonstrating high class separability.
As shown in Table 4, the maximum Q values achieved by each model are reported alongside the number of features selected by the GA. The Q metric evaluates the quality of clustering produced by the selected features, with higher values indicating better class separability and representational capacity.
The results indicate that the VGG16 model attained the highest clustering quality, achieving a score of with 95 selected features. This suggests that the feature space of VGG16, when optimized by the GA, offers strong class discrimination. In comparison, MobileNetV2 selected a relatively large number of features (74), but its maximum Q score was notably lower, reflecting less effective class separability.
A visual comparison of these outcomes is presented in Figure 6, which illustrates both the clustering quality Q and the number of selected features for all evaluated CNN models.
Quantitative Comparison of Feature Quality and Dimensionality:
- VGG16 obtained the highest clustering quality (), showing the best class separability in its selected features.
- MobileNetV2 and VGG16 selected a similar number of features (74 and 95), but VGG16 achieved significantly better quality, indicating stronger feature discrimination.
- ResNet50 and EfficientNetV2 had lower Q scores, with ResNet50 performing the worst (), suggesting weaker feature separability.
- The Custom CNN model selected fewer features (44) and achieved a moderate quality score (), balancing feature compactness and discriminative ability.
Overall, the feature subset from VGG16 was the most effective, achieving the highest clustering quality among the evaluated models.
5.2.2. Feature Selection Using a GA Based on Clustering Metrics (Silhouette Index, Calinski–Harabasz, and Davies–Bouldin)
To evaluate the effectiveness of the feature subsets selected by the GA, three widely recognized clustering validation metrics were utilized: the Silhouette Score, Calinski–Harabasz Index, and Davies–Bouldin Index. These metrics were computed on the selected feature subsets obtained from each CNN-based representation following dimensionality reduction.
Table 5 summarizes the clustering quality metrics and the number of selected features for each CNN model after feature selection using the GA.
The VGG16 model stands out as the best performer overall, achieving the highest Silhouette Score (0.7343), a strong Calinski–Harabasz score (8233.05), and a low Davies–Bouldin Index (0.4292). This combination reflects excellent cluster compactness and separation, indicating that the selected features from VGG16 provide the most discriminative representation for the classification task. MobileNetV2 showed competitive results, with a Silhouette Score close to that of VGG16 (0.7229). However, it required a larger number of selected features (44), which may imply lower efficiency in feature reduction compared to VGG16’s 16 features. The Custom CNN model exhibited the highest Calinski–Harabasz score (9038.60) and the lowest Davies–Bouldin Index (0.4254), suggesting very well-separated clusters. However, its slightly lower Silhouette Score (0.6541) implies that cluster cohesion was somewhat reduced relative to VGG16. EfficientNetV2 demonstrated moderate and balanced performance across all three metrics but did not excel in any particular measure. This suggests an average clustering quality for its selected features. Finally, ResNet50 showed the weakest clustering quality among the evaluated models, with the lowest Silhouette Score (0.5678) and comparatively higher Davies–Bouldin Index, indicating less effective clustering and feature separability.
Figure 7 provides a visual comparison of the three clustering validation metrics (Silhouette Score, Calinski–Harabasz Index, and Davies–Bouldin Index) across the CNN-based feature subsets. This visualization further highlights the differences in clustering quality among the models and supports the quantitative results presented in Table 5.
In summary, these clustering metrics confirm that VGG16 provides the most effective feature subset for this problem, balancing cluster compactness and separation while using a compact feature set.
Visual Analysis of Cluster Structure:
Table 6 presents PCA visualizations of the selected feature subsets from each CNN model. These 2D projections illustrate the distribution and separability of clusters based on the selected features.
Dimensionality reduction via Principal Component Analysis (PCA) was applied to the selected feature subsets to visually assess their clustering structure. Feature representations from VGG16 and the Custom CNN model resulted in clearly separated clusters, consistent with their favorable clustering metrics. For MobileNetV2, the projected data revealed reasonably defined clusters with some overlap, indicating moderate separability. In contrast, ResNet50 exhibited poorly separated clusters in the PCA space, aligning with its lower performance on clustering validation metrics.
Overall, among the evaluated CNN models, VGG16 demonstrates the greatest ability to produce compact and well-separated clusters while using a relatively small number of features, making it a particularly suitable candidate for subsequent classification tasks.
Fitness Evolution Across Generations
The convergence behavior of the GA was monitored by tracking the best fitness value—represented by the Silhouette Score—over successive generations for each CNN model. Figure 8 illustrates this evolution. VGG16 exhibited a rapid improvement in fitness, reaching its optimal value within the early generations and maintaining stability thereafter. In contrast, MobileNetV2 demonstrated a more gradual convergence pattern. Although its fitness increased steadily, the final value remained slightly lower compared to VGG16. ResNet50 showed limited improvement throughout the generations, suggesting that the quality of its extracted features may have hindered effective optimization. Meanwhile, EfficientNetV2 and the Custom CNN model displayed smooth and consistent growth in fitness values, indicating stable convergence behavior and the presence of moderately informative features.
5.2.3. Fuzzy Classification Using Optimal Feature Set
Based on the feature selection process described in previous sections, the feature subset that yielded the best clustering quality and dimensionality balance—obtained via a GA—was used as input for various fuzzy classification methods. The classification was performed using different membership functions (Gaussian, Trapezoidal, and Triangular) to evaluate the sensitivity of each method to fuzzification strategies.
5.2.4. Fuzzy Classification Using Optimal Feature Set
Based on the feature selection process described in previous sections, the feature subset that yielded the best clustering quality and dimensionality balance—obtained via a GA—was used as input for various fuzzy classification methods. The classification was performed using different membership functions (Gaussian, Trapezoidal, and Triangular) to evaluate the sensitivity of each method to fuzzification strategies.
Performance Summary: Table 7 presents the classification results of fuzzy methods using different membership functions. The evaluation is based on the same metrics previously described.
Table 7 presents a detailed breakdown of fuzzy classification performance by class and method, including metrics such as Sensitivity, Specificity, Precision, F1-Score, Accuracy, and confusion matrix components (TN, FP, FN, TP). Accuracy is consistent across classes for each method as it reflects overall performance, while the other metrics provide insight into per-class behavior. Notably, Fuzzy KNN and Fuzzy DT with triangular and trapezoidal membership functions maintain high and balanced metrics, whereas FGK shows very low sensitivity despite high specificity, indicating a bias toward negative classification.
Among the methods evaluated, Fuzzy KNN consistently achieved high classification performance across all membership functions, with F1-Scores exceeding 95% for Class 1 and balanced sensitivity and specificity values above 90%. Notably, the triangular and trapezoidal membership functions yielded nearly identical results, indicating robustness to the choice of fuzzification shape.
Fuzzy Decision Tree (Fuzzy DT) also demonstrated strong performance, especially with triangular and trapezoidal membership functions, achieving F1-Scores above 95% for Class 1 and balanced precision-recall trade-offs. Sensitivity and specificity were well aligned, supporting reliable classification across classes.
Fuzzy SVM showed competitive results, with the Gaussian membership function delivering a strong balance between sensitivity (around 95%) and precision (around 96%), while trapezoidal and triangular functions provided slightly lower but still acceptable metrics. Accuracy values were consistently above 93%.
In contrast, Fuzzy Bayesian Network (Fuzzy BN) exhibited variable results. While it performed well with the Gaussian function (F1-Score around 96% for Class 1), the triangular membership function led to a sharp decline in performance (F1-Score around 78% for Class 1 and below 67% for Class 0), likely due to poor generalization and high false negatives in one of the classes. The trapezoidal function showed moderate performance between these extremes.
FGK (Fuzzy Genetic Kernel) produced highly imbalanced results, with excellent specificity (around 99%) but very low sensitivity (around 17%), resulting in an overall low F1-Score (approximately 28%). This indicates a strong bias toward negative classification and poor detection of positive instances.
Finally, Fuzzy CM achieved high F1-Scores close to 96%, with balanced sensitivity and specificity around 93–94%, and consistent accuracy above 93%, making it a competitive alternative.
Overall, the results underscore the importance of selecting both an appropriate fuzzy classification model and membership function. Fuzzy KNN and Fuzzy DT, particularly with triangular or trapezoidal membership functions, stand out as the most effective approaches due to their robust and balanced classification performance across both classes.
Comparative Analysis Using ROC and Precision-Recall Curves
To evaluate the performance of fuzzy classifiers applied directly to images without prior feature extraction, two key visual metrics were used: the ROC curve (Receiver Operating Characteristic) and the Precision-Recall curve (PRC). These curves allow analysis of the models’ ability to differentiate between classes and maintain precision under various decision thresholds.
The Fuzzy KNN models with trapezoidal and triangular membership functions showed the best overall performance. Both configurations achieved an area under the curve (AUC) close to 0.94 in the ROC curve and an Average Precision (AP) of 0.96 in the PRC. This reflects excellent capability to distinguish between classes, even in imbalanced data contexts, as well as strong stability in prediction precision.
Regarding Fuzzy Naive Bayes, performance strongly depended on the membership function used. With a Gaussian function, the model reached an AUC of approximately 0.93 and an AP of 0.96, indicating good discrimination and high precision. However, with trapezoidal and triangular functions, performance dropped significantly, with AUCs of 0.63 and 0.52 and APs of 0.80 and 0.74, respectively. This highlights the sensitivity of the model to the shape of the membership function.
The Fuzzy CM model achieved an AUC close to 0.94, comparable to the best models, but its AP was lower, around 0.76. This suggests that, although it can discriminate between classes, its prediction precision may be less reliable depending on the decision threshold.
Finally, the FGK model exhibited the weakest performance, with an AUC of about 0.16 and an AP of 0.69, reflecting poor discriminative ability and limited predictive precision. This indicates that FGK is not suitable for use directly on raw images without preprocessing or feature extraction, possibly due to its high sensitivity to the structure of the input space.
6. Discussion
The results of this study underscore the effectiveness of hybrid systems that integrate deep feature extraction with fuzzy logic-based classification for pneumonia detection in chest X-ray images. High diagnostic accuracy was achieved across models, particularly when Gaussian and Trapezoidal membership functions were employed, supporting the hypothesis that fuzzy inference mechanisms enhance both interpretability and uncertainty management in clinical decision-making.
Among the classifiers evaluated, Fuzzy CM and Fuzzy KNN consistently delivered the most balanced and reliable performance, with F1-scores exceeding 95%. Their ability to maintain high sensitivity and specificity demonstrates strong potential for deployment in real-world healthcare environments, where both false negatives and false positives can have significant implications. Fuzzy DT and Fuzzy SVM also exhibited robust performance, especially when combined with Gaussian and Trapezoidal membership functions. These models achieved sensitivity levels above 95%, indicating effective detection of pneumonia-positive cases. Their stable performance across different fuzzification strategies suggests good generalizability and resilience to variations in data representation. Conversely, the Bayesian-inspired fuzzy model showed notable sensitivity to the choice of membership function. While its performance was competitive when using Gaussian functions, sensitivity dropped markedly with the Triangular function—despite nearly perfect specificity. This imbalance highlights concerns about its practical applicability in medical diagnostics, where minimizing false negatives is critical. Similarly, the classifier based on the Gustafson-Kessel approach displayed a strong bias toward negative predictions. Although it achieved very high specificity and precision, its poor sensitivity and low F1-score indicate a tendency to miss positive cases, limiting its usefulness in screening contexts where false negatives are more detrimental than false positives.
These variations emphasize the importance of selecting membership functions that are well-aligned with the underlying data distribution and the intended clinical application. Gaussian and Trapezoidal functions consistently yielded superior results, offering a better trade-off between sensitivity, specificity, and precision.
Compared to traditional classification pipelines, the proposed hybrid framework not only demonstrates strong predictive performance but also enhances interpretability through its fuzzy rule-based component. This transparency is particularly valuable in healthcare, where explainability supports clinical trust, accountability, and broader adoption. The final model achieved F1-scores of 90.7% for the Normal class and 96.55% for the Pneumonia class, reflecting robustness to class imbalance and variability commonly encountered in real-world settings. This study contributes to the development of models that combine accuracy with interpretability by systematically analyzing how the design of membership functions influences fuzzy system behavior and classification performance.
6.1. Comparative Analysis with Previous Studies
Table 11 presents a performance comparison between our proposed hybrid method and existing approaches for pneumonia detection using deep learning techniques. This comparison highlights several key aspects:
Our approach, which integrates GA-based feature selection with fuzzy classifiers, achieved notable improvements in overall accuracy and classification metrics. Specifically, the Fuzzy KNN classifier using triangular and trapezoidal membership functions attained the best results, with an overall accuracy of 93.5% and F1-scores exceeding 95% for the Abnormal class. Similarly, the Fuzzy Decision Tree with trapezoidal membership also demonstrated strong performance with accuracy above 92%.
Regarding individual CNN architectures for feature extraction, our implementation of VGG16 reached an accuracy of 87.28%, surpassing the results reported by Liang et al. [41] (74.2%) and Varshni et al. [42] (80.02%). Our VGG19 model further improved accuracy to 88.46%. ResNet50, combined with fuzzy classification, achieved an accuracy of 77.56%, exceeding Sirazitdinov et al. [43]’s ensemble method at 75.8%.
Unlike many previous methods that rely on complex ensembles or object detection frameworks, our approach emphasizes a balanced trade-off between model complexity, interpretability, and high diagnostic accuracy. The use of fuzzy logic classifiers effectively handles uncertainty and improves transparency, which is crucial for clinical applications.
Overall, our results demonstrate that careful integration of deep learning feature extraction with fuzzy classification and GA-based feature selection can outperform existing state-of-the-art approaches while maintaining computational efficiency and interpretability.
7. Application in a Real Clinical Setting
In contemporary clinical practice, artificial intelligence—particularly deep learning techniques such as CNNs is increasingly adopted as a valuable tool to support diagnostic decision-making. This is especially relevant for conditions like pneumonia, where timely and accurate diagnosis is critical to preventing complications and reducing mortality.
Although CXR imaging is widely available and cost-effective, it poses significant interpretation challenges due to overlapping anatomical structures and the subtlety of pathological signs. Advanced CNN architectures such as VGG16, ResNet50, and InceptionV3 have demonstrated strong capabilities in addressing these challenges by extracting discriminative features and identifying complex visual patterns that may not be readily apparent to human observers.
Building on this capability, our study integrates fuzzy logic-based classifiers to manage the inherent uncertainty and imprecision of medical data. This hybrid approach not only achieves high classification accuracy but also enhances model robustness and interpretability—critical factors for real-world clinical deployment, where transparency is often as important as predictive performance.
In practical scenarios such as emergency departments or resource-constrained environments, AI-assisted systems can assist in prioritizing patients, streamlining radiology workflows, and reducing diagnostic delays. However, successful integration into clinical settings requires thorough model validation, regulatory compliance, and the establishment of clinician trust through explainable outputs.
The proposed framework contributes to bridging the gap between research and clinical application by providing a reliable, interpretable, and efficient tool for pneumonia detection across both routine and acute care settings.
8. Conclusions
This study presented a hybrid framework for pneumonia detection in chest X-ray images by integrating deep convolutional neural networks (CNNs) for feature extraction with fuzzy logic-based classifiers to enhance interpretability and handle uncertainty. The combination of pre-trained models such as VGG16, EfficientNetV2, MobileNetV2, and ResNet50 with GA-based feature selection demonstrated strong classification performance across key metrics, including sensitivity, specificity, precision, F1-score, and overall accuracy.
The incorporation of fuzzy logic contributed not only to improved diagnostic accuracy—with overall accuracy values reaching approximately 93.5%—but also to greater transparency in decision-making, an essential requirement in clinical applications. Among the evaluated configurations, fuzzy classifiers employing triangular and trapezoidal membership functions, especially in KNN and Decision Tree algorithms, yielded the most balanced and reliable results, achieving F1-scores above 95% for the Abnormal class and balanced performance for the Normal class.
These findings support the potential of interpretable, AI-driven systems to assist radiologists in diagnosing pneumonia from chest X-ray images, particularly in scenarios requiring rapid decision-making or limited specialist availability.
Future work will focus on optimizing the computational efficiency of the framework, enhancing interpretability through explainable AI techniques, and validating the system on diverse external datasets. Furthermore, extending the model to support localization of affected lung regions could further improve its clinical utility, advancing toward a comprehensive computer-aided diagnosis solution.
Author Contributions
Conceptualization, A.M. and A.R; methodology, A.M. and A.R.; software, A.M.; validation, A.M.and A.R.; formal analysis, A.M.and A.R.; investigation, A.M. and A.R.; resources ; data curation, A.M. and A.R.; writing—original draft preparation, A.M., and A.R; writing—review and editing, A.M. and A.R.; supervision, A.R.; project administration, A.R. All authors have read and agreed to the published version of the manuscript
Funding
This research received no external funding.
Institutional Review Board Statement
Informed Consent Statement
.
Data Availability Statement
Conflicts of Interest
The authors declare no conflicts of interest.
References
- Prasanna, H.; Inderjeeth, C.A.; Nossent, J.C.; Almutairi, K.B. The global prevalence of interstitial lung disease in patients with rheumatoid arthritis: a systematic review and meta-analysis. Rheumatology International 2025, 45, Article–34. [Google Scholar] [CrossRef] [PubMed]
- Kayembe, J.M.N.; Kayembe, H.C.N. Challenges of Early Diagnosis and Effective Treatment of Pneumonia in Resource-Limited Settings. In Viral Infectious Diseases; IntechOpen, 2025. ,: Published, 26 March. [CrossRef]
- Nurbaiti, N.; Azarah, N.F. Revolutionizing Pneumonia Diagnostics: A Systematic Review of Deep Learning Applications in Chest Radiography. Jurnal Sains 2025, 4. [Google Scholar]
- Al Nufaiei, Z.F.; Alshamrani, K.M. Comparing Ultrasound, Chest X-Ray, and CT Scan for Pneumonia Detection. Medical Devices: Evidence and Research 2025, 18, 149–159. [Google Scholar] [CrossRef]
- Adekola, H.A.; Bamidele, T.; Chukwu, E.; Fowora, M.; Ajibaye, S.; Salako, A.; Musa, Z.; Ezechi, O. Challenges in the phenotypic detection of streptococcus Pneumoniae from clinical samples in low resource settings. Clinical Microbiology Newsletter 2025, 51, 37–41. [Google Scholar] [CrossRef]
- Xin, H.; Wang, W.; Wang, X.; Huang, J.; Di, Y.; Du, J.; Cao, X.; Feng, B.; Shen, L.; He, Y.; et al. The performance of computer-aided detection for chest radiography in tuberculosis screening: a population-based retrospective cohort study. Emerging Microbes & Infections 2025, 14, 2470998. [Google Scholar] [CrossRef]
- Lastrucci, A.; Iosca, N.; Wandael, Y.; Barra, A.; Lepri, G.; Forini, N.; Ricci, R.; Miele, V.; Giansanti, D. AI and Interventional Radiology: A Narrative Review of Reviews on Opportunities, Challenges, and Future Directions. Diagnostics 2025, 15. [Google Scholar] [CrossRef]
- Munir, K.; Usama Tanveer, M.; Alyamani, H.J.; Bermak, A.; Ur Rehman, A. PneuX-Net: An Enhanced Feature Extraction and Transformation Approach for Pneumonia Detection in X-Ray Images. IEEE Access 2025, 13, 84024–84037. [Google Scholar] [CrossRef]
- Choi, S.H.; Yoon, H.; Baek, H.J.; Long, X. Biomedical Signal Processing and Health Monitoring Based on Sensors. Sensors 2025, 25. [Google Scholar] [CrossRef]
- Sharma, P.; Thakur, P.; Anwar, K.; Mittal, Y. Fuzzy Deep Learning in Skin Cancer Diagnosis: A Review. In Proceedings of the 2025 International Conference on Next Generation Information System Engineering (NGISE), 2025; Vol. 1, pp. 1–6. [Google Scholar] [CrossRef]
- Mallidi, S.K.R. Enhancing Pneumonia Diagnosis and Severity Assessment through Deep Learning: A Comprehensive Approach Integrating CNN Classification and Infection Segmentation. arXiv 2025, arXiv:cs.CV/2502.06735. [Google Scholar]
- Fatima, T.; Soliman, H. Application of VGG16 Transfer Learning for Breast Cancer Detection. Information 2025, 16. [Google Scholar] [CrossRef]
- Tariq, A.; Iqbal, M.M.; Javed Iqbal, M.; Iftikhar Ahmad, a. Transforming Brain Tumor Detection Empowering Multi-Class Classification With Vision Transformers and EfficientNetV2. IEEE Access 2025, 13, 63857–63876. [Google Scholar] [CrossRef]
- Gao, Z.; Tian, Y.; Lin, S.C.; Lin, J. A CT Image Classification Network Framework for Lung Tumors Based on Pre-trained MobileNetV2 Model and Transfer learning, And Its Application and Market Analysis in the Medical field. arXiv 2025, arXiv:eess.IV/2501.04996. [Google Scholar] [CrossRef]
- Bohlol, P.; Hosseinpour, S.; Soltani Firouz, M. Improved food recognition using a refined ResNet50 architecture with improved fully connected layers. Current Research in Food Science 2025, 10, 101005. [Google Scholar] [CrossRef] [PubMed]
- Alhijawi, B.; Awajan, A. Genetic algorithms: theory, genetic operators, solutions, and applications. Evolutionary Intelligence 2024, 17, 1245–1256. [Google Scholar] [CrossRef]
- da Costa, M.F.P.; Araújo, R.d.S.; Silva, A.R.; Pereira, L.; Silva, G.M.M. Predictive Artificial Neural Networks as Applied Tools in the Remediation of Dyes by Adsorption—A Review. Applied Sciences 2025, 15. [Google Scholar] [CrossRef]
- Cömert, Z.; Çıbuk, M.; Şengür, A.; Ümit Budak. DCCMED-Net: Densely connected and concatenated multi Encoder-Decoder CNNs for retinal vessel extraction from fundus images. Medical Hypotheses 2020, 134, 109426. [Google Scholar] [CrossRef]
- Victoria, A.H.; Maragatham, G. Automatic Tuning of Hyperparameters Using Bayesian Optimization. Evolving Systems 2021, 12, 217–223. [Google Scholar] [CrossRef]
- Young, S.R.; Rose, D.C.; Karnowski, T.P.; Lim, S.H.; Patton, R.M. Optimizing Deep Learning Hyper-Parameters through an Evolutionary Algorithm. In Proceedings of the Proceedings of the Workshop on Machine Learning in High-Performance Computing Environments (MLHPC ’15).; Published: 15 November 2015; November 2015, ACM; pp. 1–5. [CrossRef]
- Cui, H.; Bai, J. A new hyperparameters optimization method for convolutional neural networks. Pattern Recognition Letters 2019, 125, 828–834. [Google Scholar] [CrossRef]
- Lee, W.Y.; Park, S.M.; Sim, K.B. Optimal hyperparameter tuning of convolutional neural networks based on the parameter-setting-free harmony search algorithm. Optik 2018, 172, 359–367. [Google Scholar] [CrossRef]
- Lee, W.Y.; Park, S.M.; Sim, K.B. Optimal hyperparameter tuning of convolutional neural networks based on the parameter-setting-free harmony search algorithm. Optik 2018, 172, 359–367. [Google Scholar] [CrossRef]
- Kiliçarslan, S.; Celik, M. RSigELU: A nonlinear activation function for deep neural networks. Expert Systems with Applications 2021, 174, 114805. [Google Scholar] [CrossRef]
- Zou, X.; Wang, Z.; Li, Q.; Sheng, W. Integration of residual network and convolutional neural network along with various activation functions and global pooling for time series classification. Neurocomputing 2019, 367, 39–45. [Google Scholar] [CrossRef]
- Basha, S.S.; Vinakota, S.K.; Dubey, S.R.; Pulabaigari, V.; Mukherjee, S. AutoFCL: automatically tuning fully connected layers for handling small dataset. Neural Computing and Applications 2021, 33, 8055–8065. [Google Scholar] [CrossRef]
- Dahl, G.E.; Sainath, T.N.; Hinton, G.E. Improving deep neural networks for LVCSR using rectified linear units and dropout. In Proceedings of the 2013 IEEE International Conference on Acoustics, Speech and Signal Processing; 2013; pp. 8609–8613. [Google Scholar] [CrossRef]
- Radiuk, P.M. Impact of training set batch size on the performance of convolutional neural networks for diverse datasets. Information Technology and Management Science 2017, 20, 20–24. [Google Scholar] [CrossRef]
- Utama, A.B.P.; Wibawa, A.P.; Muladi, M.; Nafalski, A. PSO based Hyperparameter tuning of CNN Multivariate Time-Series Analysis. Jurnal Online Informatika 2022, 7, 193–202. [Google Scholar] [CrossRef]
- Zeiler, M.D. Adadelta: an adaptive learning rate method. 6 pages, Machine Learning (cs.LG). arXiv, 2012; arXiv:1212.5701. [Google Scholar] [CrossRef]
- Gulcehre, C.; Moczulski, M.; Bengio, Y. Adasecant: robust adaptive secant method for stochastic gradient. 8 pages, 3 figures, ICLR workshop submission. arXiv, 2024; arXiv:1412.7419. [Google Scholar] [CrossRef]
- Zadeh, L.A. Fuzzy logic—a personal perspective. Fuzzy Sets and Systems 2015, 281, 4–20. [Google Scholar] [CrossRef]
- Chen, Y.; Xiao, C.; Yang, S.; Yang, Y.; Wang, W. Research on long term power load grey combination forecasting based on fuzzy support vector machine. Computers and Electrical Engineering 2024, 116, 109205. [Google Scholar] [CrossRef]
- Zarei, E.; Khakzad, N.; Cozzani, V.; Reniers, G. Safety analysis of process systems using Fuzzy Bayesian Network (FBN). Journal of Loss Prevention in the Process Industries 2019, 57, 7–16. [Google Scholar] [CrossRef]
- Zhu, X.; Hu, X.; Yang, L.; Pedrycz, W.; Li, Z. A Development of Fuzzy-Rule-Based Regression Models Through Using Decision Trees. IEEE Transactions on Fuzzy Systems 2024, 32, 2976–2986. [Google Scholar] [CrossRef]
- Lohrmann, C.; Lohrmann, A.; Kumbure, M.M. On the benefit of feature selection and ensemble feature selection for fuzzy k-nearest neighbor classification. Applied Soft Computing 2025, 171, 112784. [Google Scholar] [CrossRef]
- Sakrwar, M.S.; Ranadive, A.; Pamucar, D. A novel Gustafson–Kessel based clustering algorithm using n-Pythagorean fuzzy sets. Systems and Soft Computing 2025, 7, 200345. [Google Scholar] [CrossRef]
- Abdullah, A.A.; Ahmed, A.M.; Rashid, T.; Veisi, H.; Rassul, Y.H.; Hassan, B.; Fattah, P.; Ali, S.A.; Shamsaldin, A.S. Advanced Clustering Techniques for Speech Signal Enhancement: A Review and Metanalysis of Fuzzy C-Means, K-Means, and Kernel Fuzzy C-Means Methods. arXiv, 2024; arXiv:cs.SD/2409.19448. [Google Scholar]
- Kermany, D.S.; Zhang, K.; Goldbaum, M. Identifying Medical Diagnoses and Treatable Diseases by Image-Based Deep Learning. Cell 2018, 172, 1122–1131. [Google Scholar] [CrossRef] [PubMed]
- Kermany, D.S.; Zhang, K.; Goldbaum, M. Chest X-Ray Images (Pneumonia). https://data.mendeley.com/datasets/rscbjbr9sj/2, 2018. Mendeley Data, Version 2, CC BY 4.0.
- Liang, G.; Zheng, L. A transfer learning method with deep residual network for pediatric pneumonia diagnosis. Computer Methods and Programs in Biomedicine 2020, 187, 104964. [Google Scholar] [CrossRef] [PubMed]
- Varshni, D.; Thakral, K.; Agarwal, L.; Nijhawan, R.; Mittal, A. Pneumonia Detection Using CNN based Feature Extraction. In Proceedings of the 2019 IEEE International Conference on Electrical, Computer and Communication Technologies (ICECCT). IEEE; 2019; pp. 1–7. [Google Scholar]
- Sirazitdinov, I.; Kholiavchenko, M.; Mustafaev, T.; Yixuan, Y.; Kuleev, R.; Ibragimov, B. Deep neural network ensemble for pneumonia localization from a large-scale chest x-ray database. Computers & Electrical Engineering 2019, 78, 388–399. [Google Scholar]
- Ismail, A.; Rahmat, T.; Aliman, S. Chest X-ray Image Classification Using Faster R-CNN. Malaysian Journal of Computing 2019, 4, 225–236. [Google Scholar] [CrossRef]
- Ayan, E.; Ünver, H.M. Diagnosis of Pneumonia from Chest X-Ray Images Using Deep Learning. In Proceedings of the 2019 Scientific Meeting on Electrical-Electronics & Biomedical Engineering and Computer Science (EBBT); IEEE, 2019; pp. 1–5. [Google Scholar]
Figure 1.
Illustration of a typical CNN architecture used for image classification.
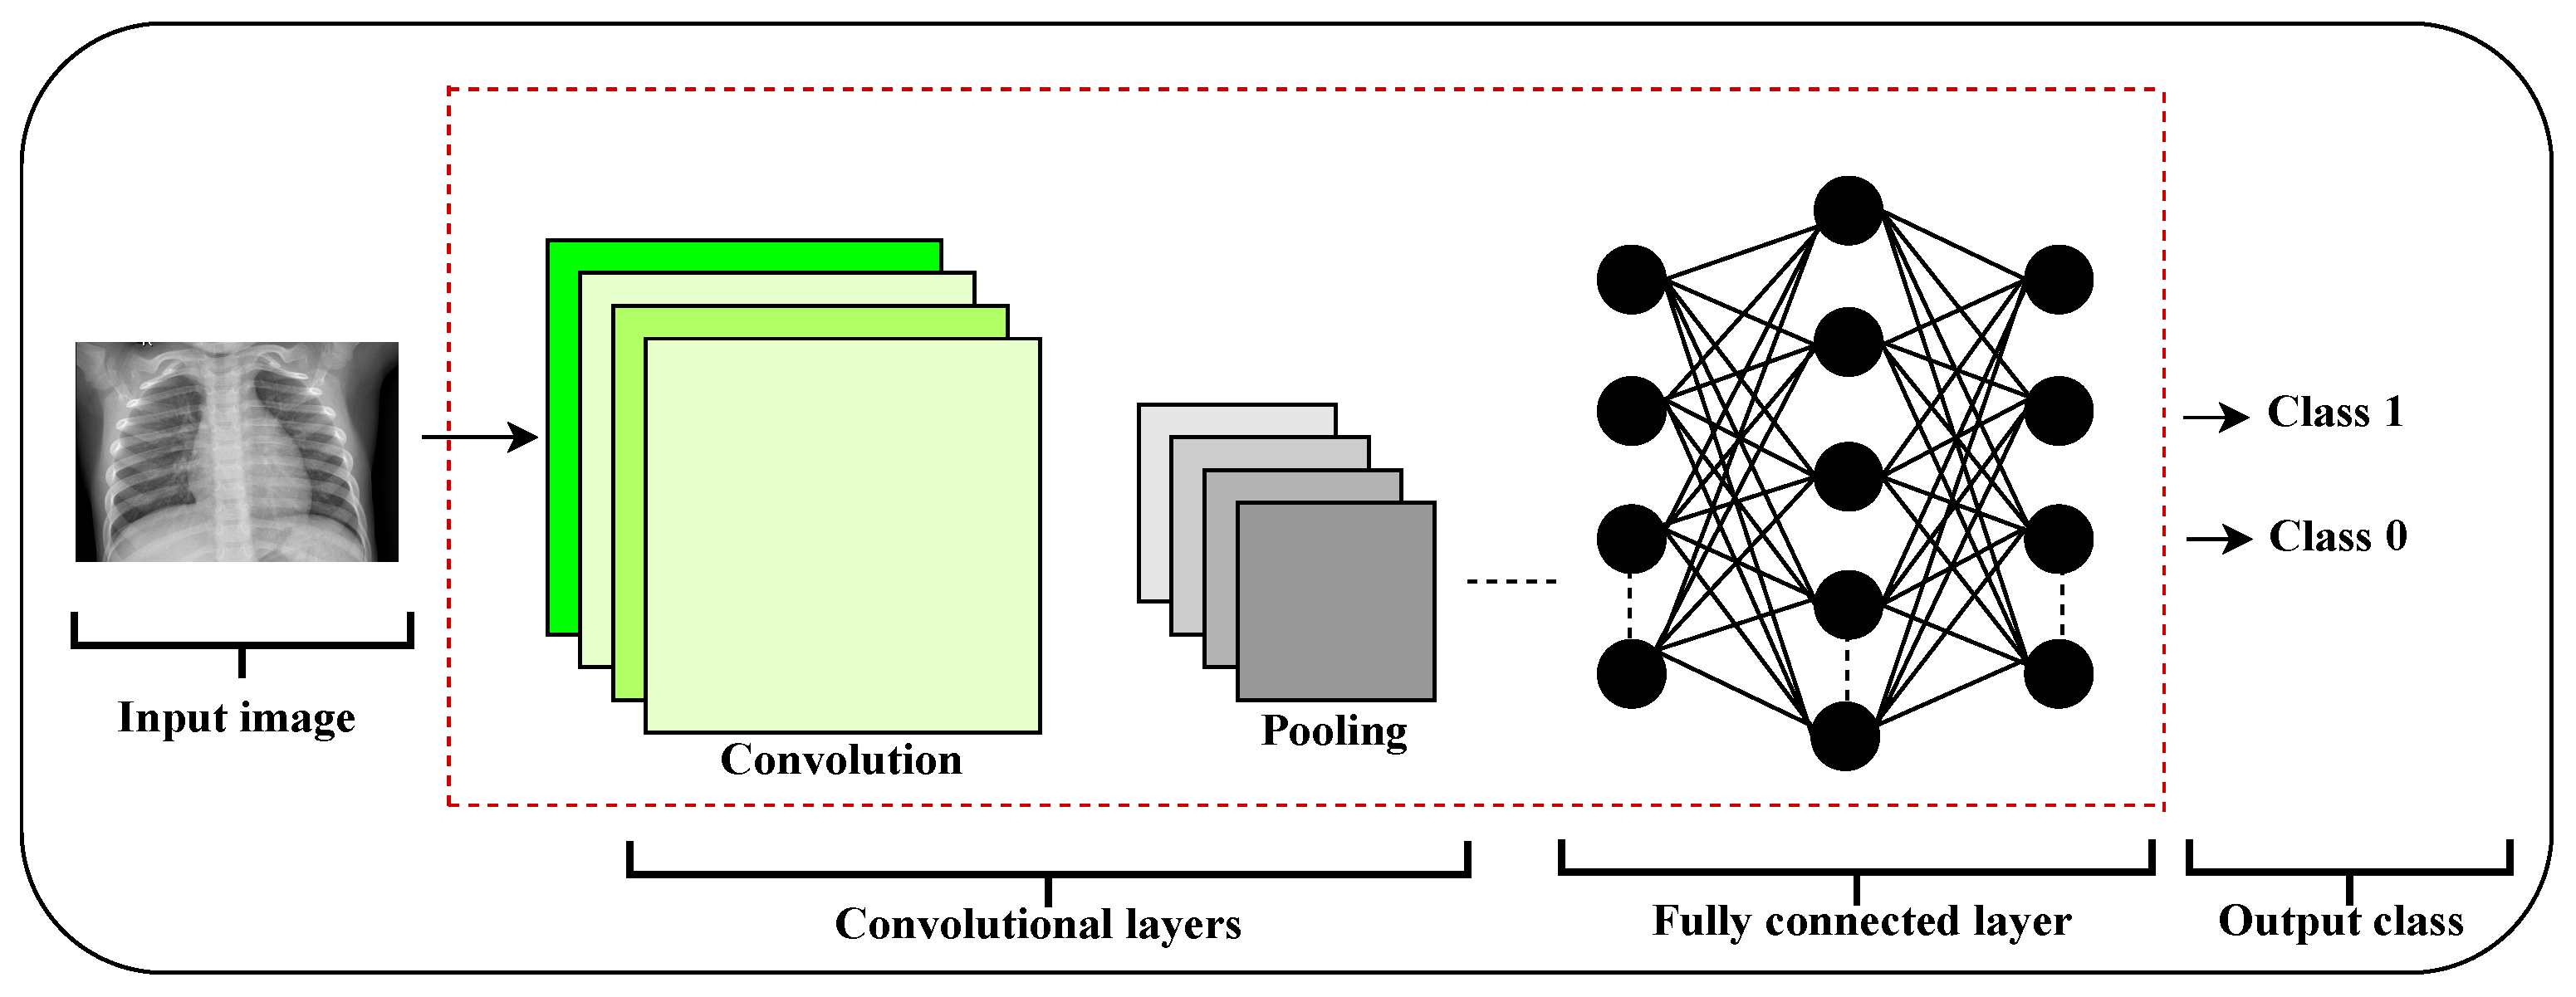
Figure 2.
Examples of fuzzy membership functions for three input features. Each subplot (from left to right) represents Feature 1, Feature 2, and Feature 3. In each plot, three membership functions are shown: triangular (dashed), trapezoidal (dash-dotted), and Gaussian (solid).
Figure 2.
Examples of fuzzy membership functions for three input features. Each subplot (from left to right) represents Feature 1, Feature 2, and Feature 3. In each plot, three membership functions are shown: triangular (dashed), trapezoidal (dash-dotted), and Gaussian (solid).
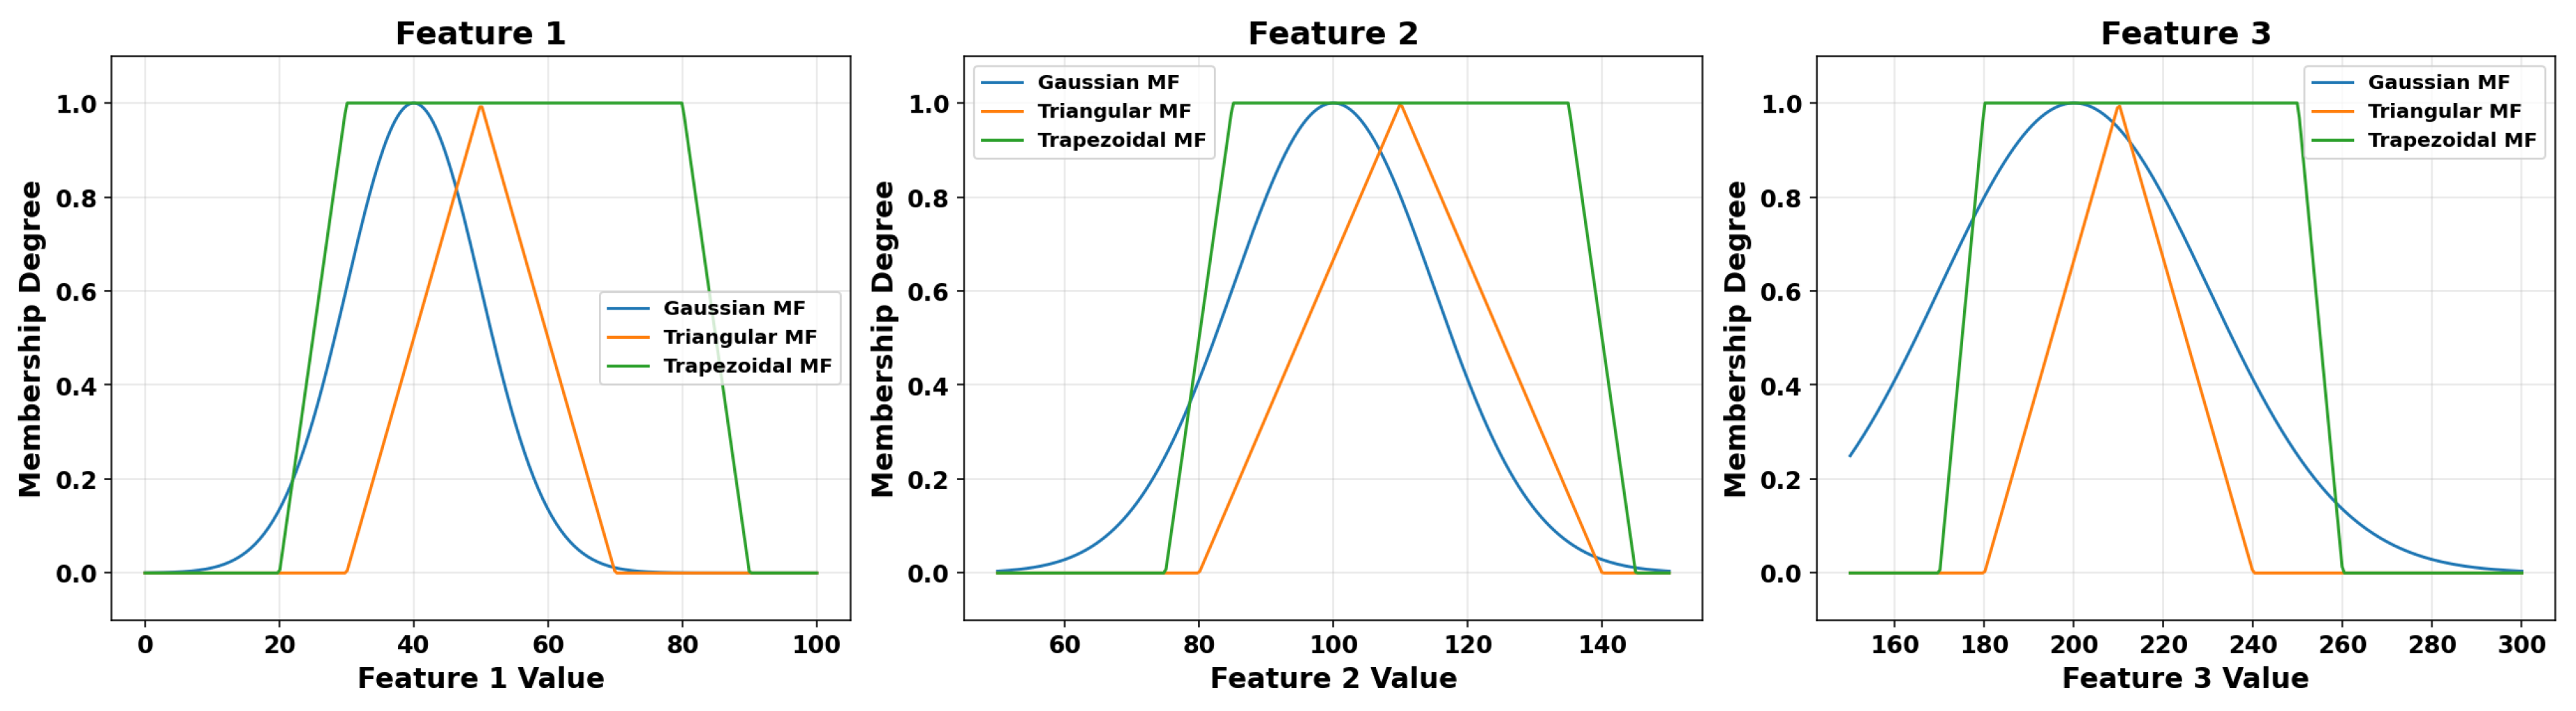
Figure 3.
Training and evaluation pipeline for the proposed hybrid model.
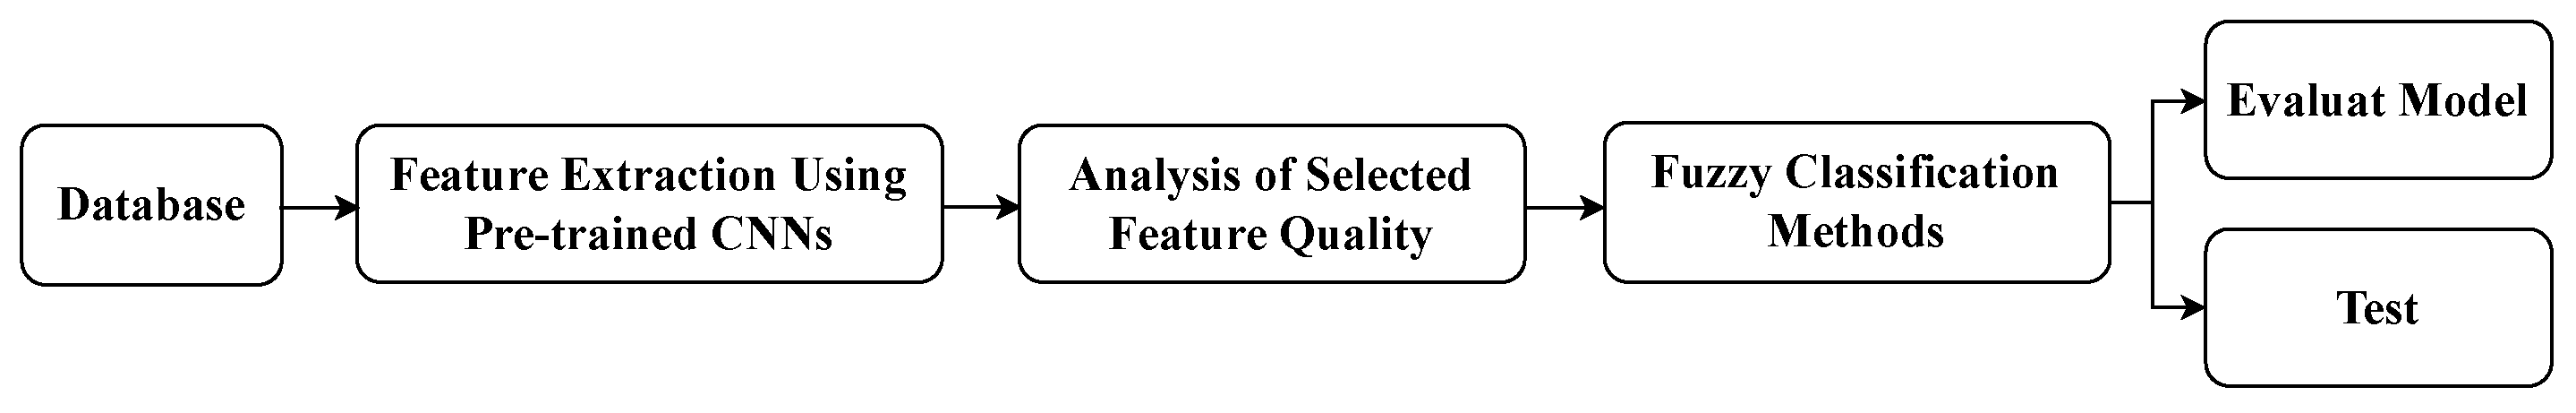
Figure 4.
Examples of pediatric CXR images: (left) normal lung, (middle) bacterial pneumonia with localized consolidation, and (right) viral pneumonia with bilateral interstitial patterns.
Figure 4.
Examples of pediatric CXR images: (left) normal lung, (middle) bacterial pneumonia with localized consolidation, and (right) viral pneumonia with bilateral interstitial patterns.
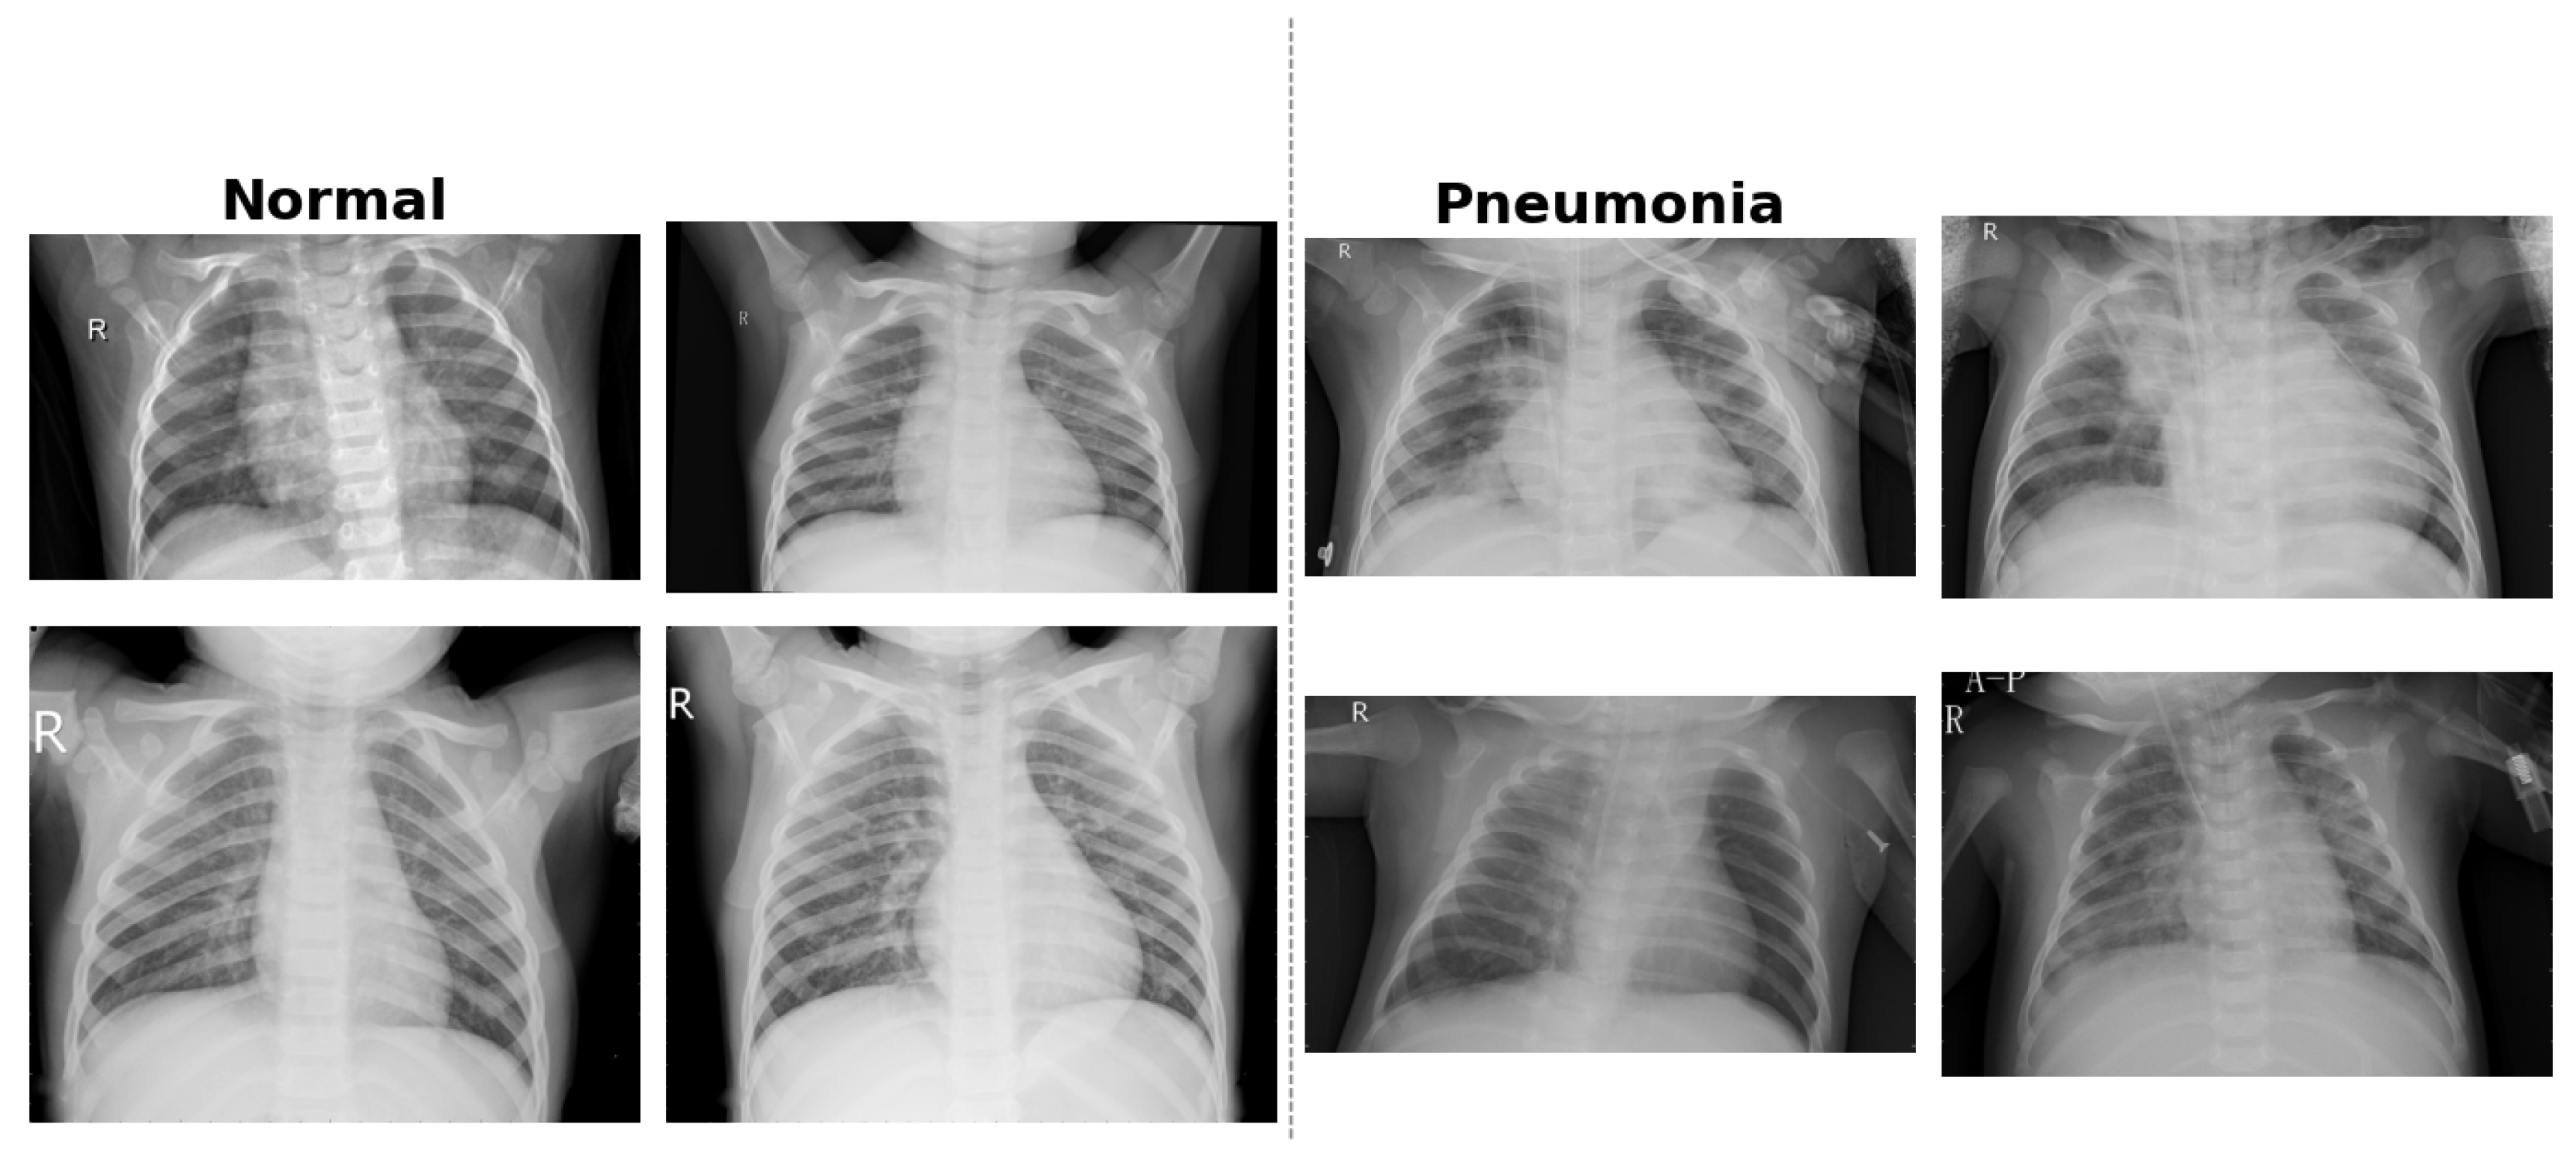
Figure 5.
Schematic representation of the proposed fuzzy-based diagnostic system.
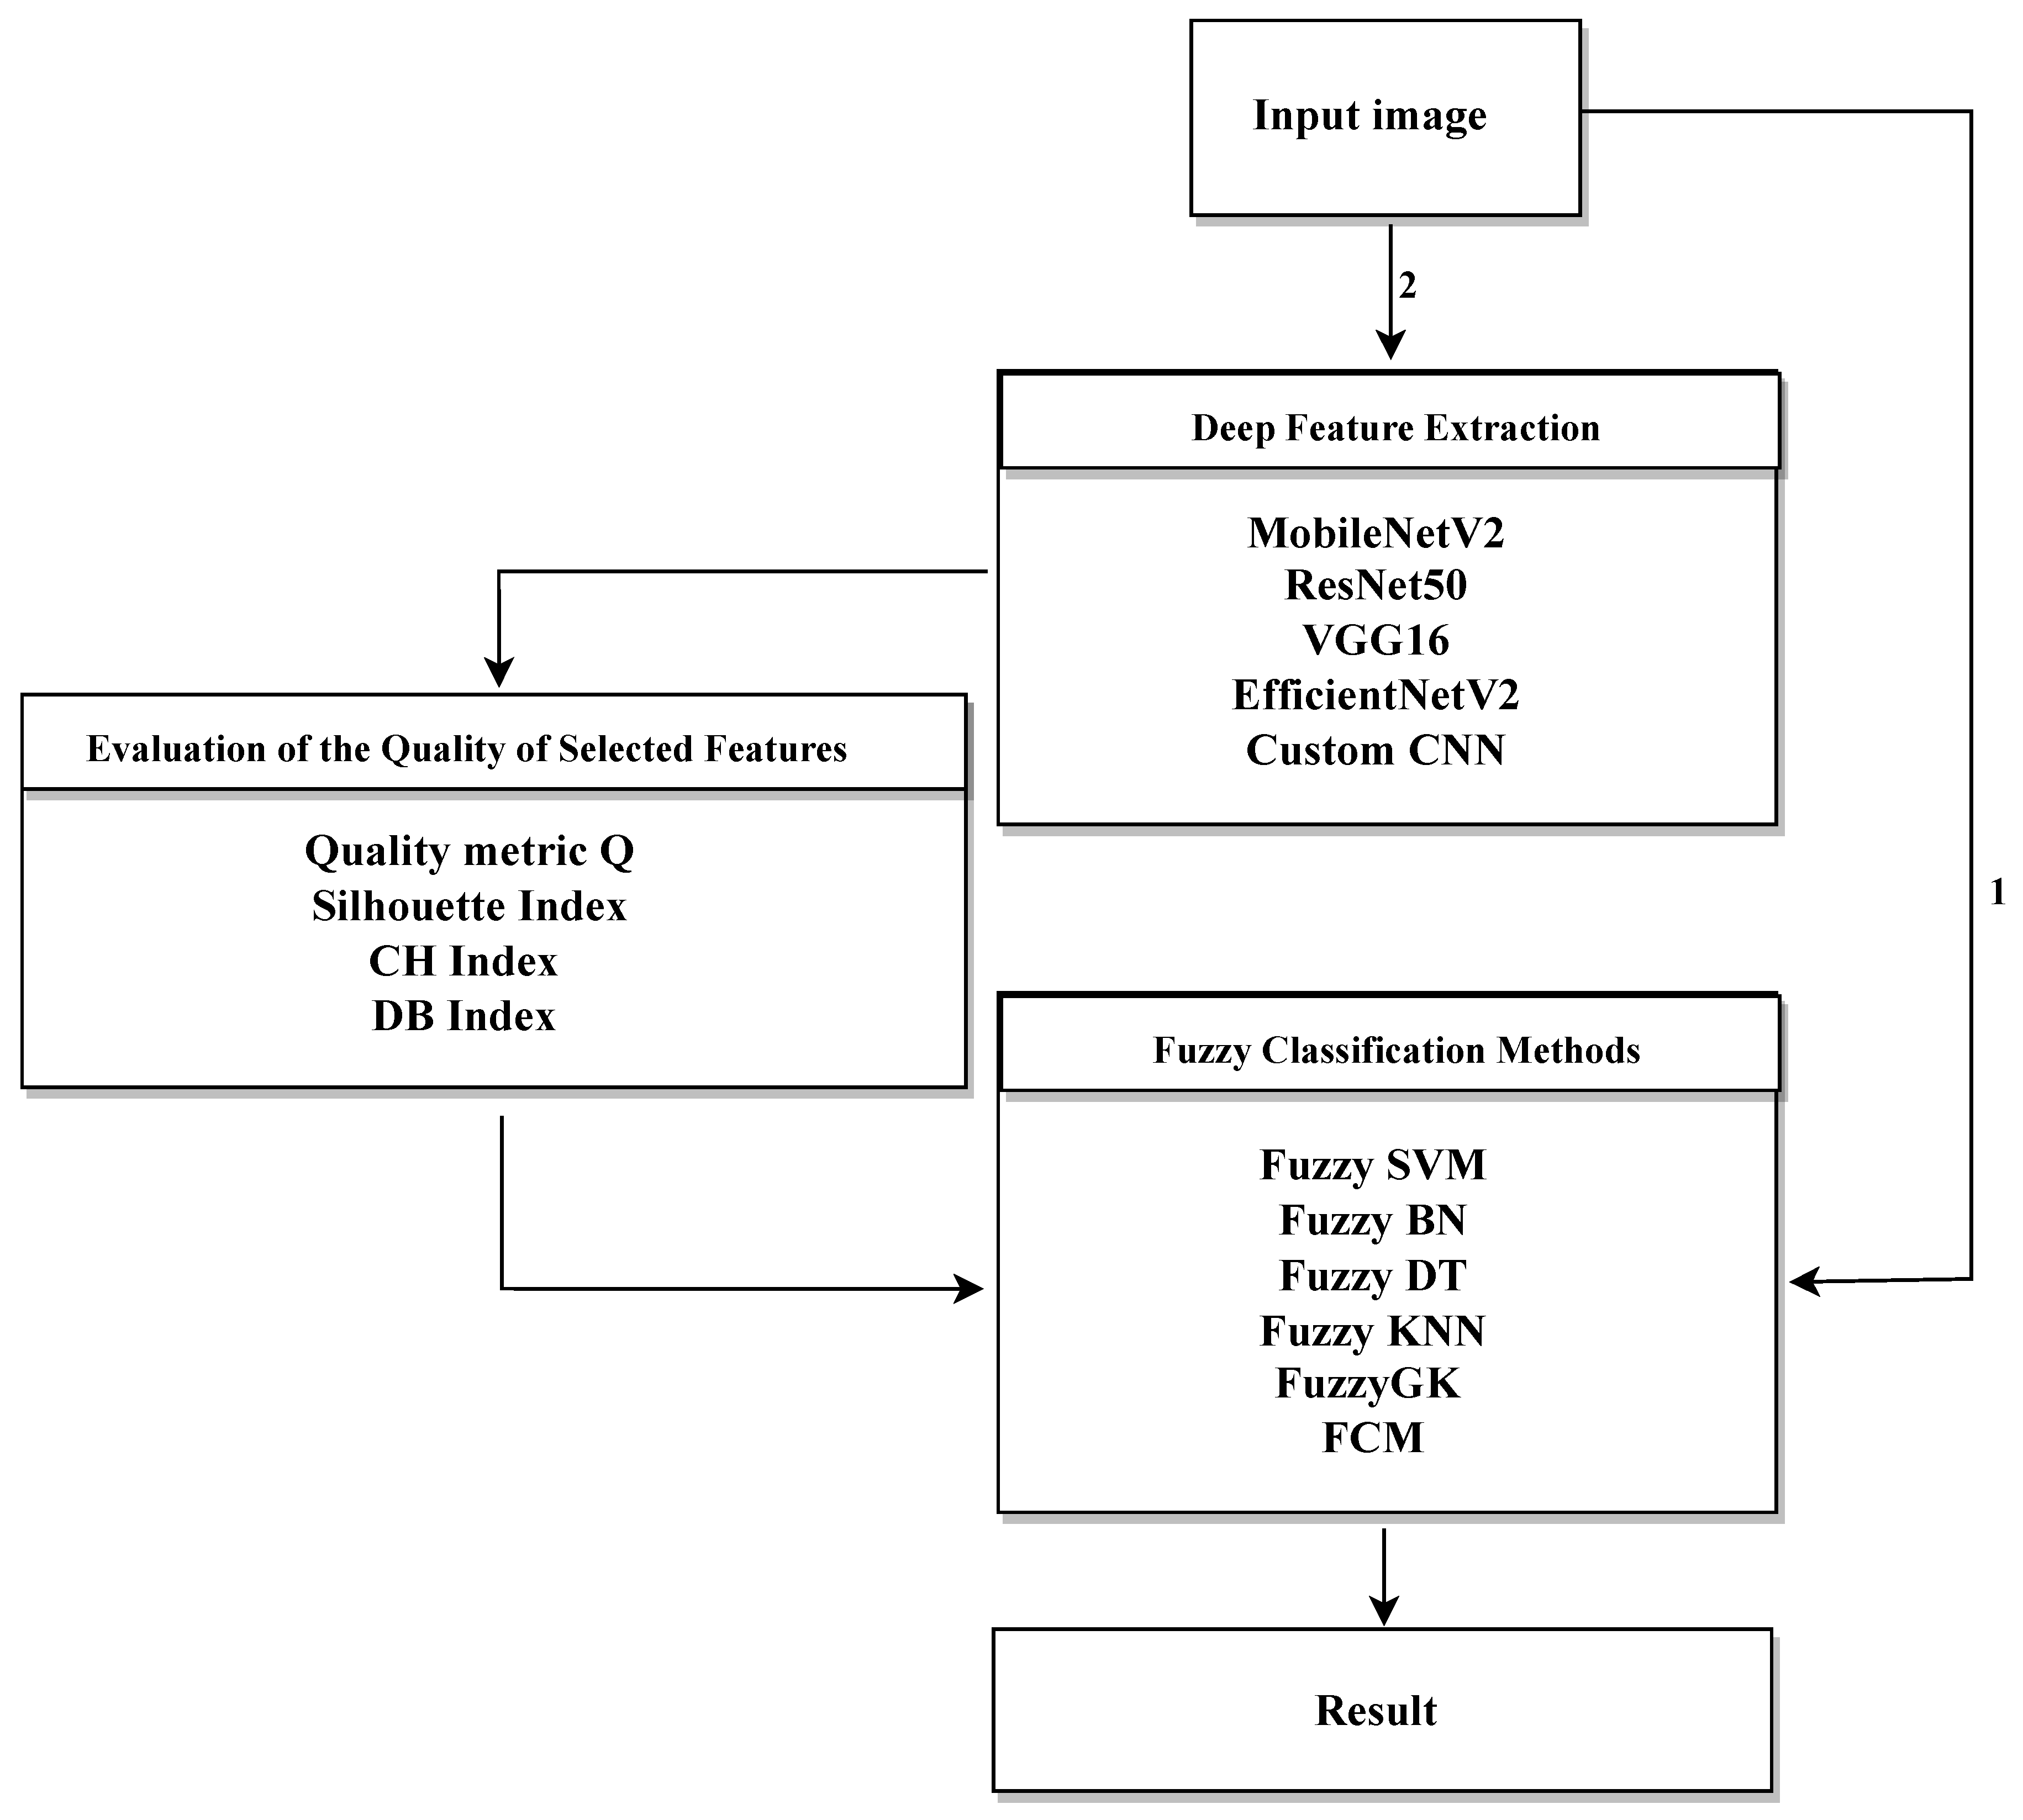
Figure 6.
Comparison of clustering quality Q and number of selected features across all CNN models.
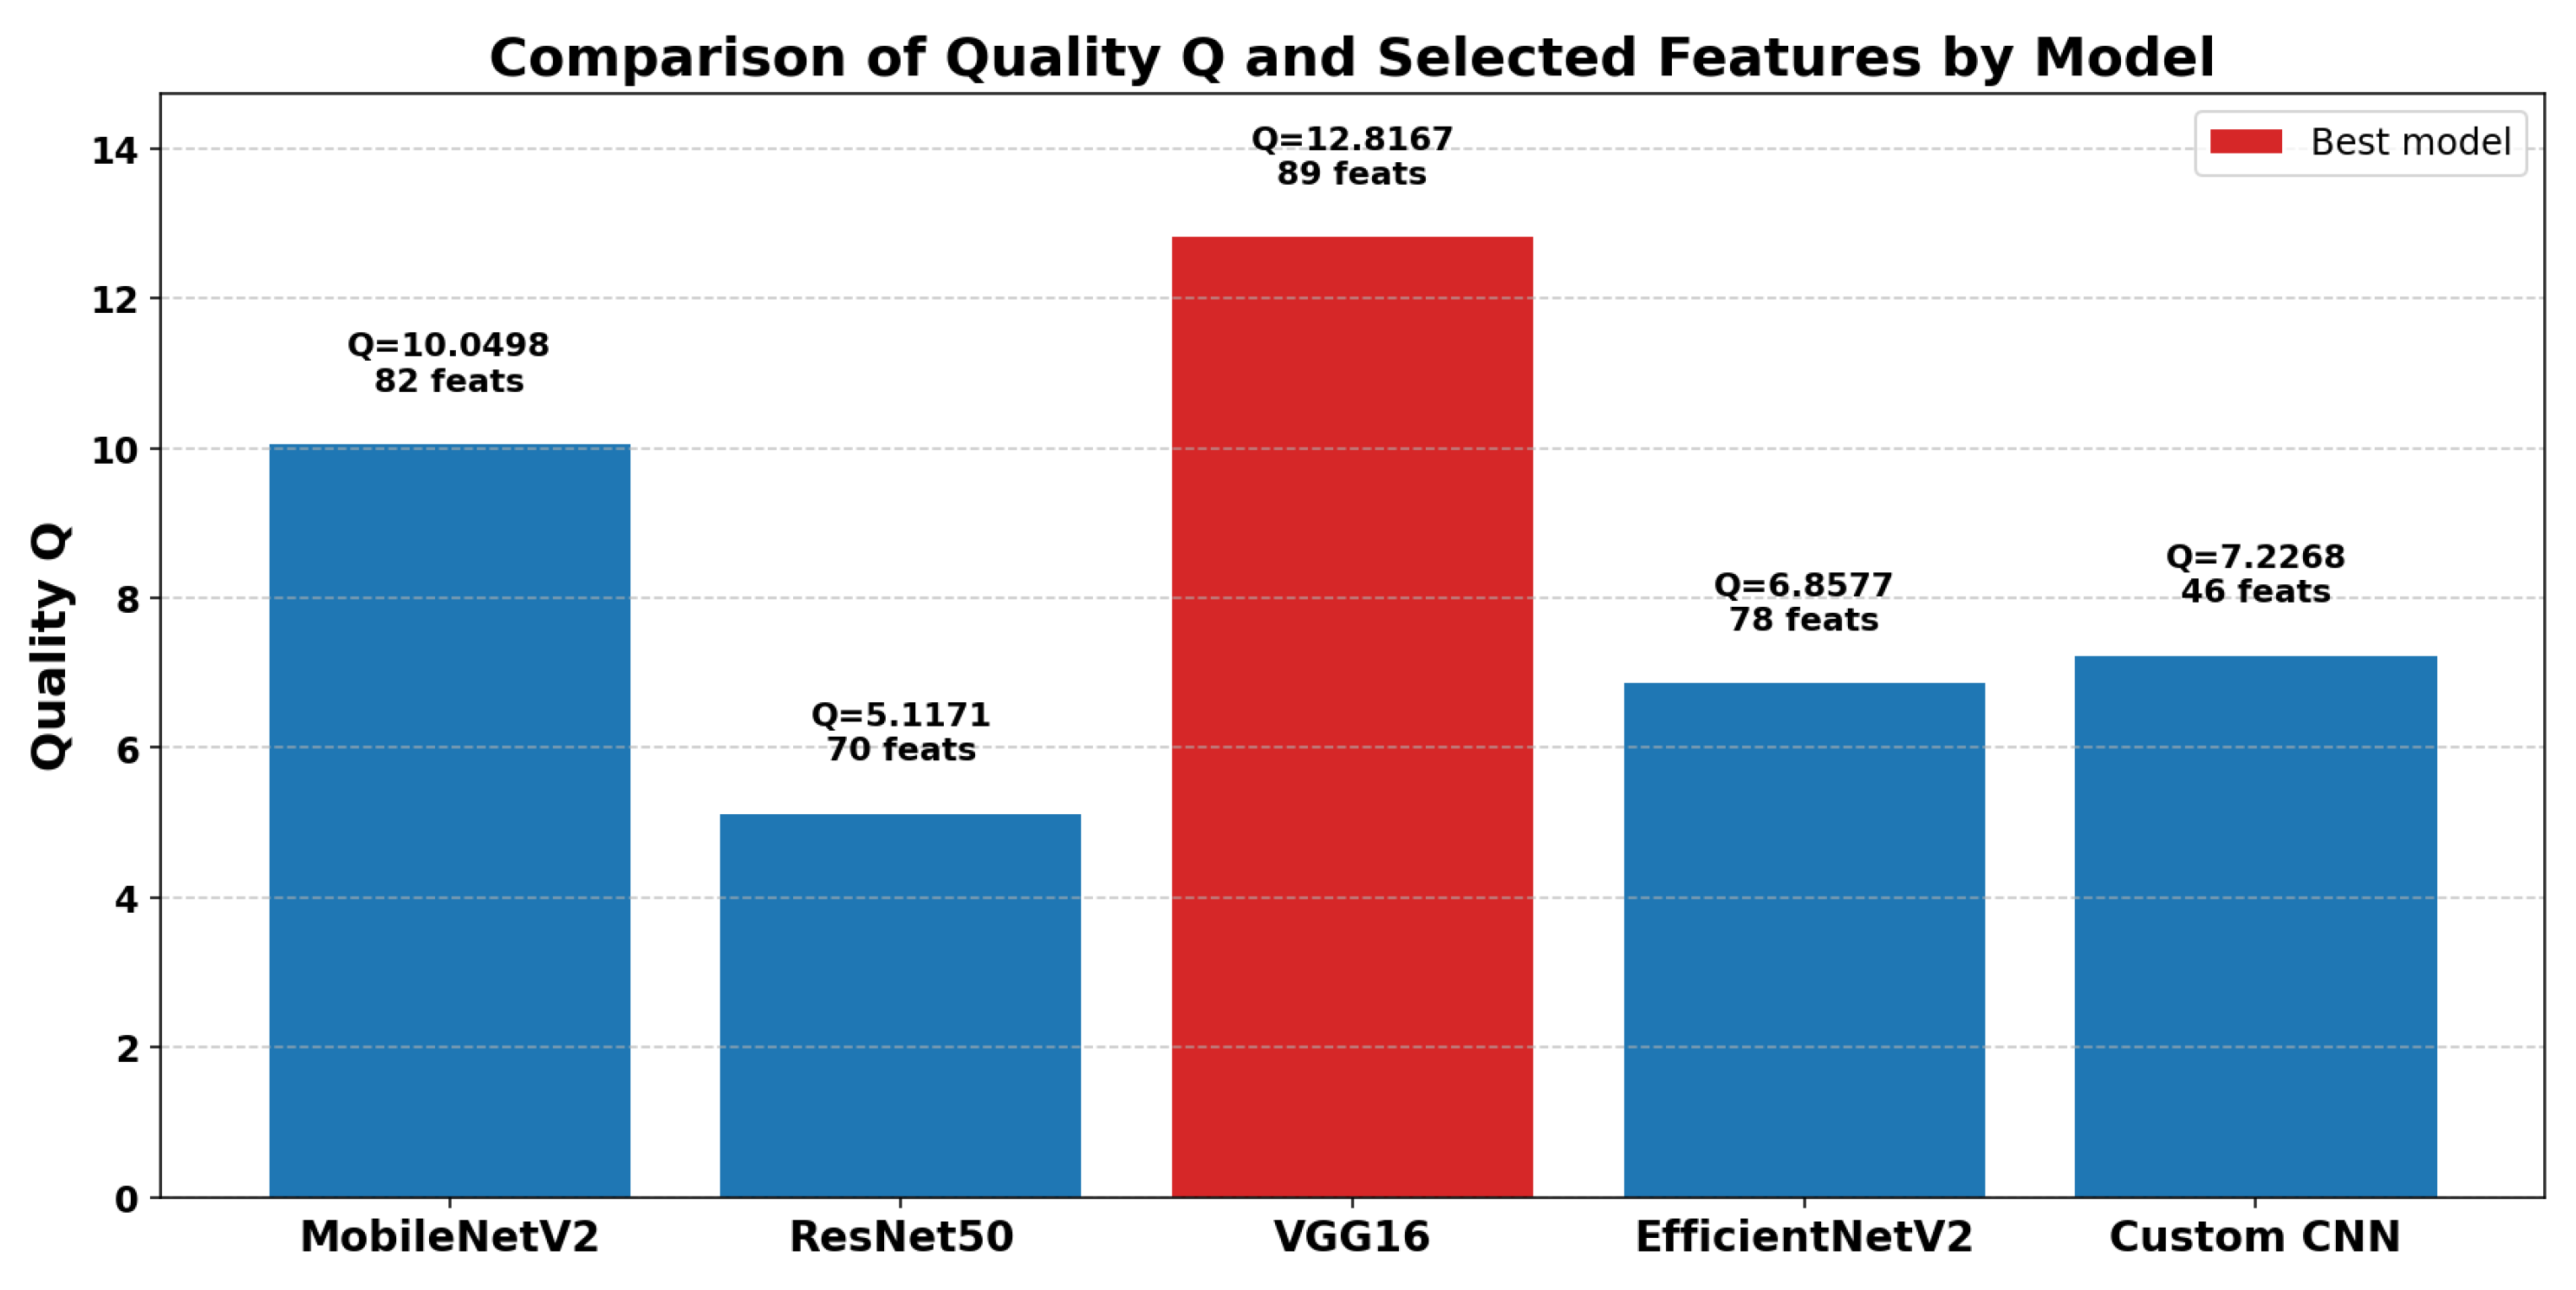
Figure 7.
Comparison of clustering validation metrics across CNN-based feature sets.
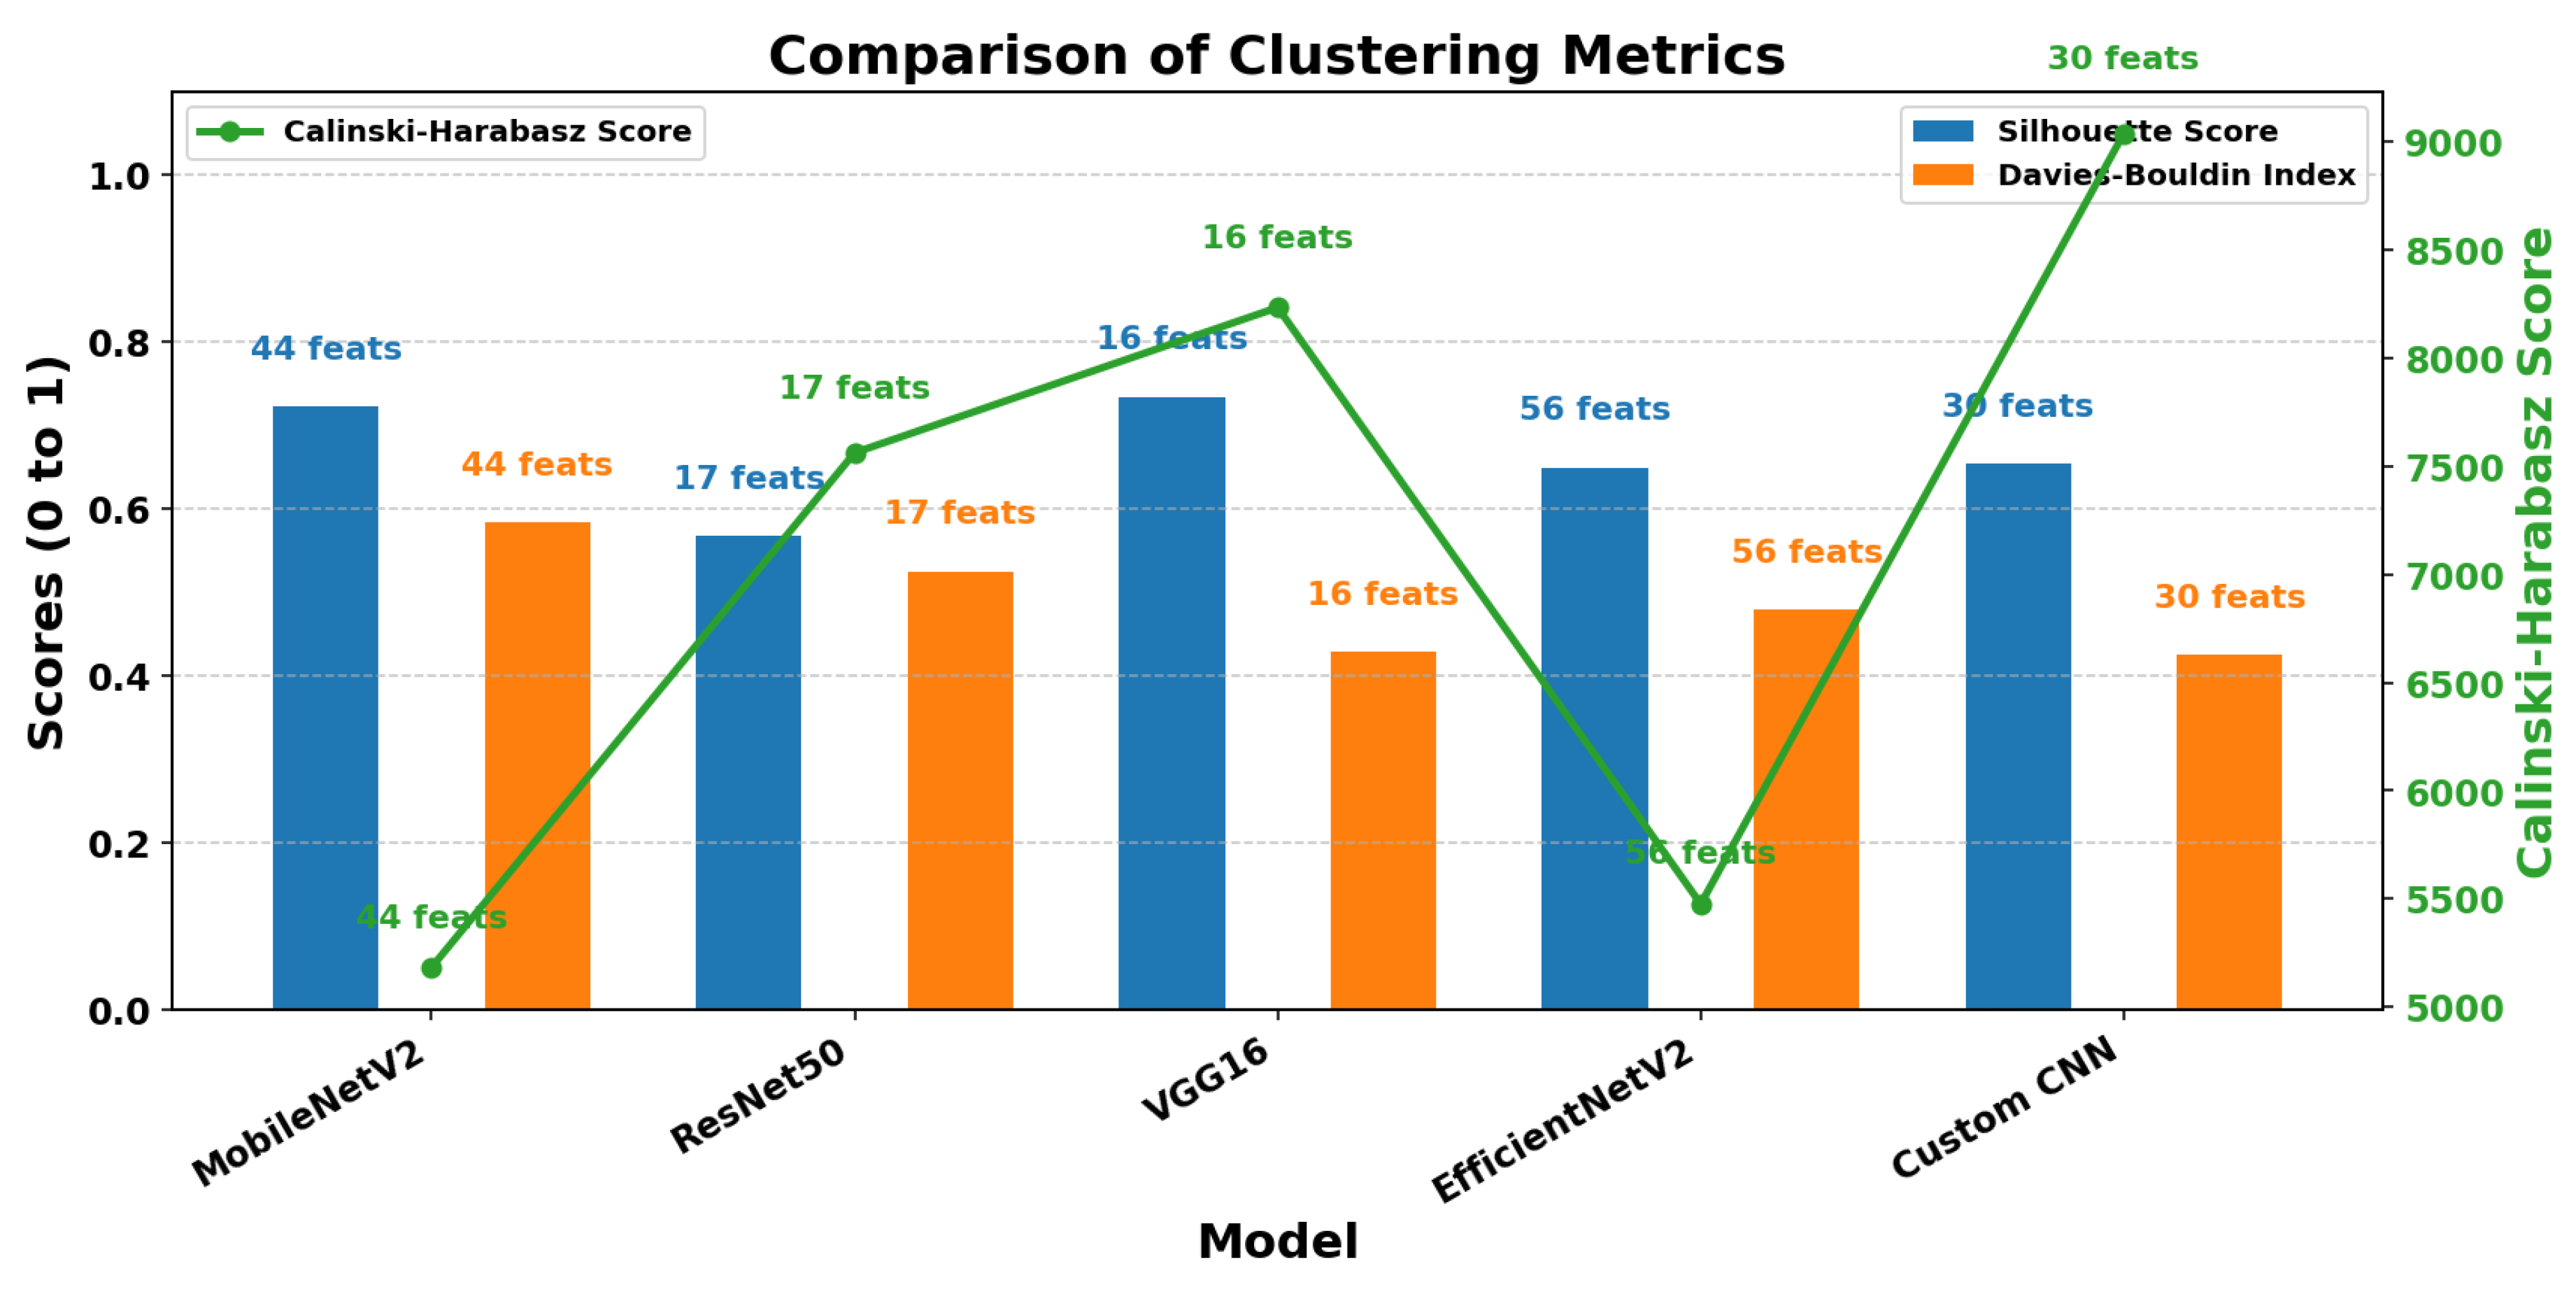
Figure 8.
Fitness evolution (Silhouette Score) over generations for each CNN model.
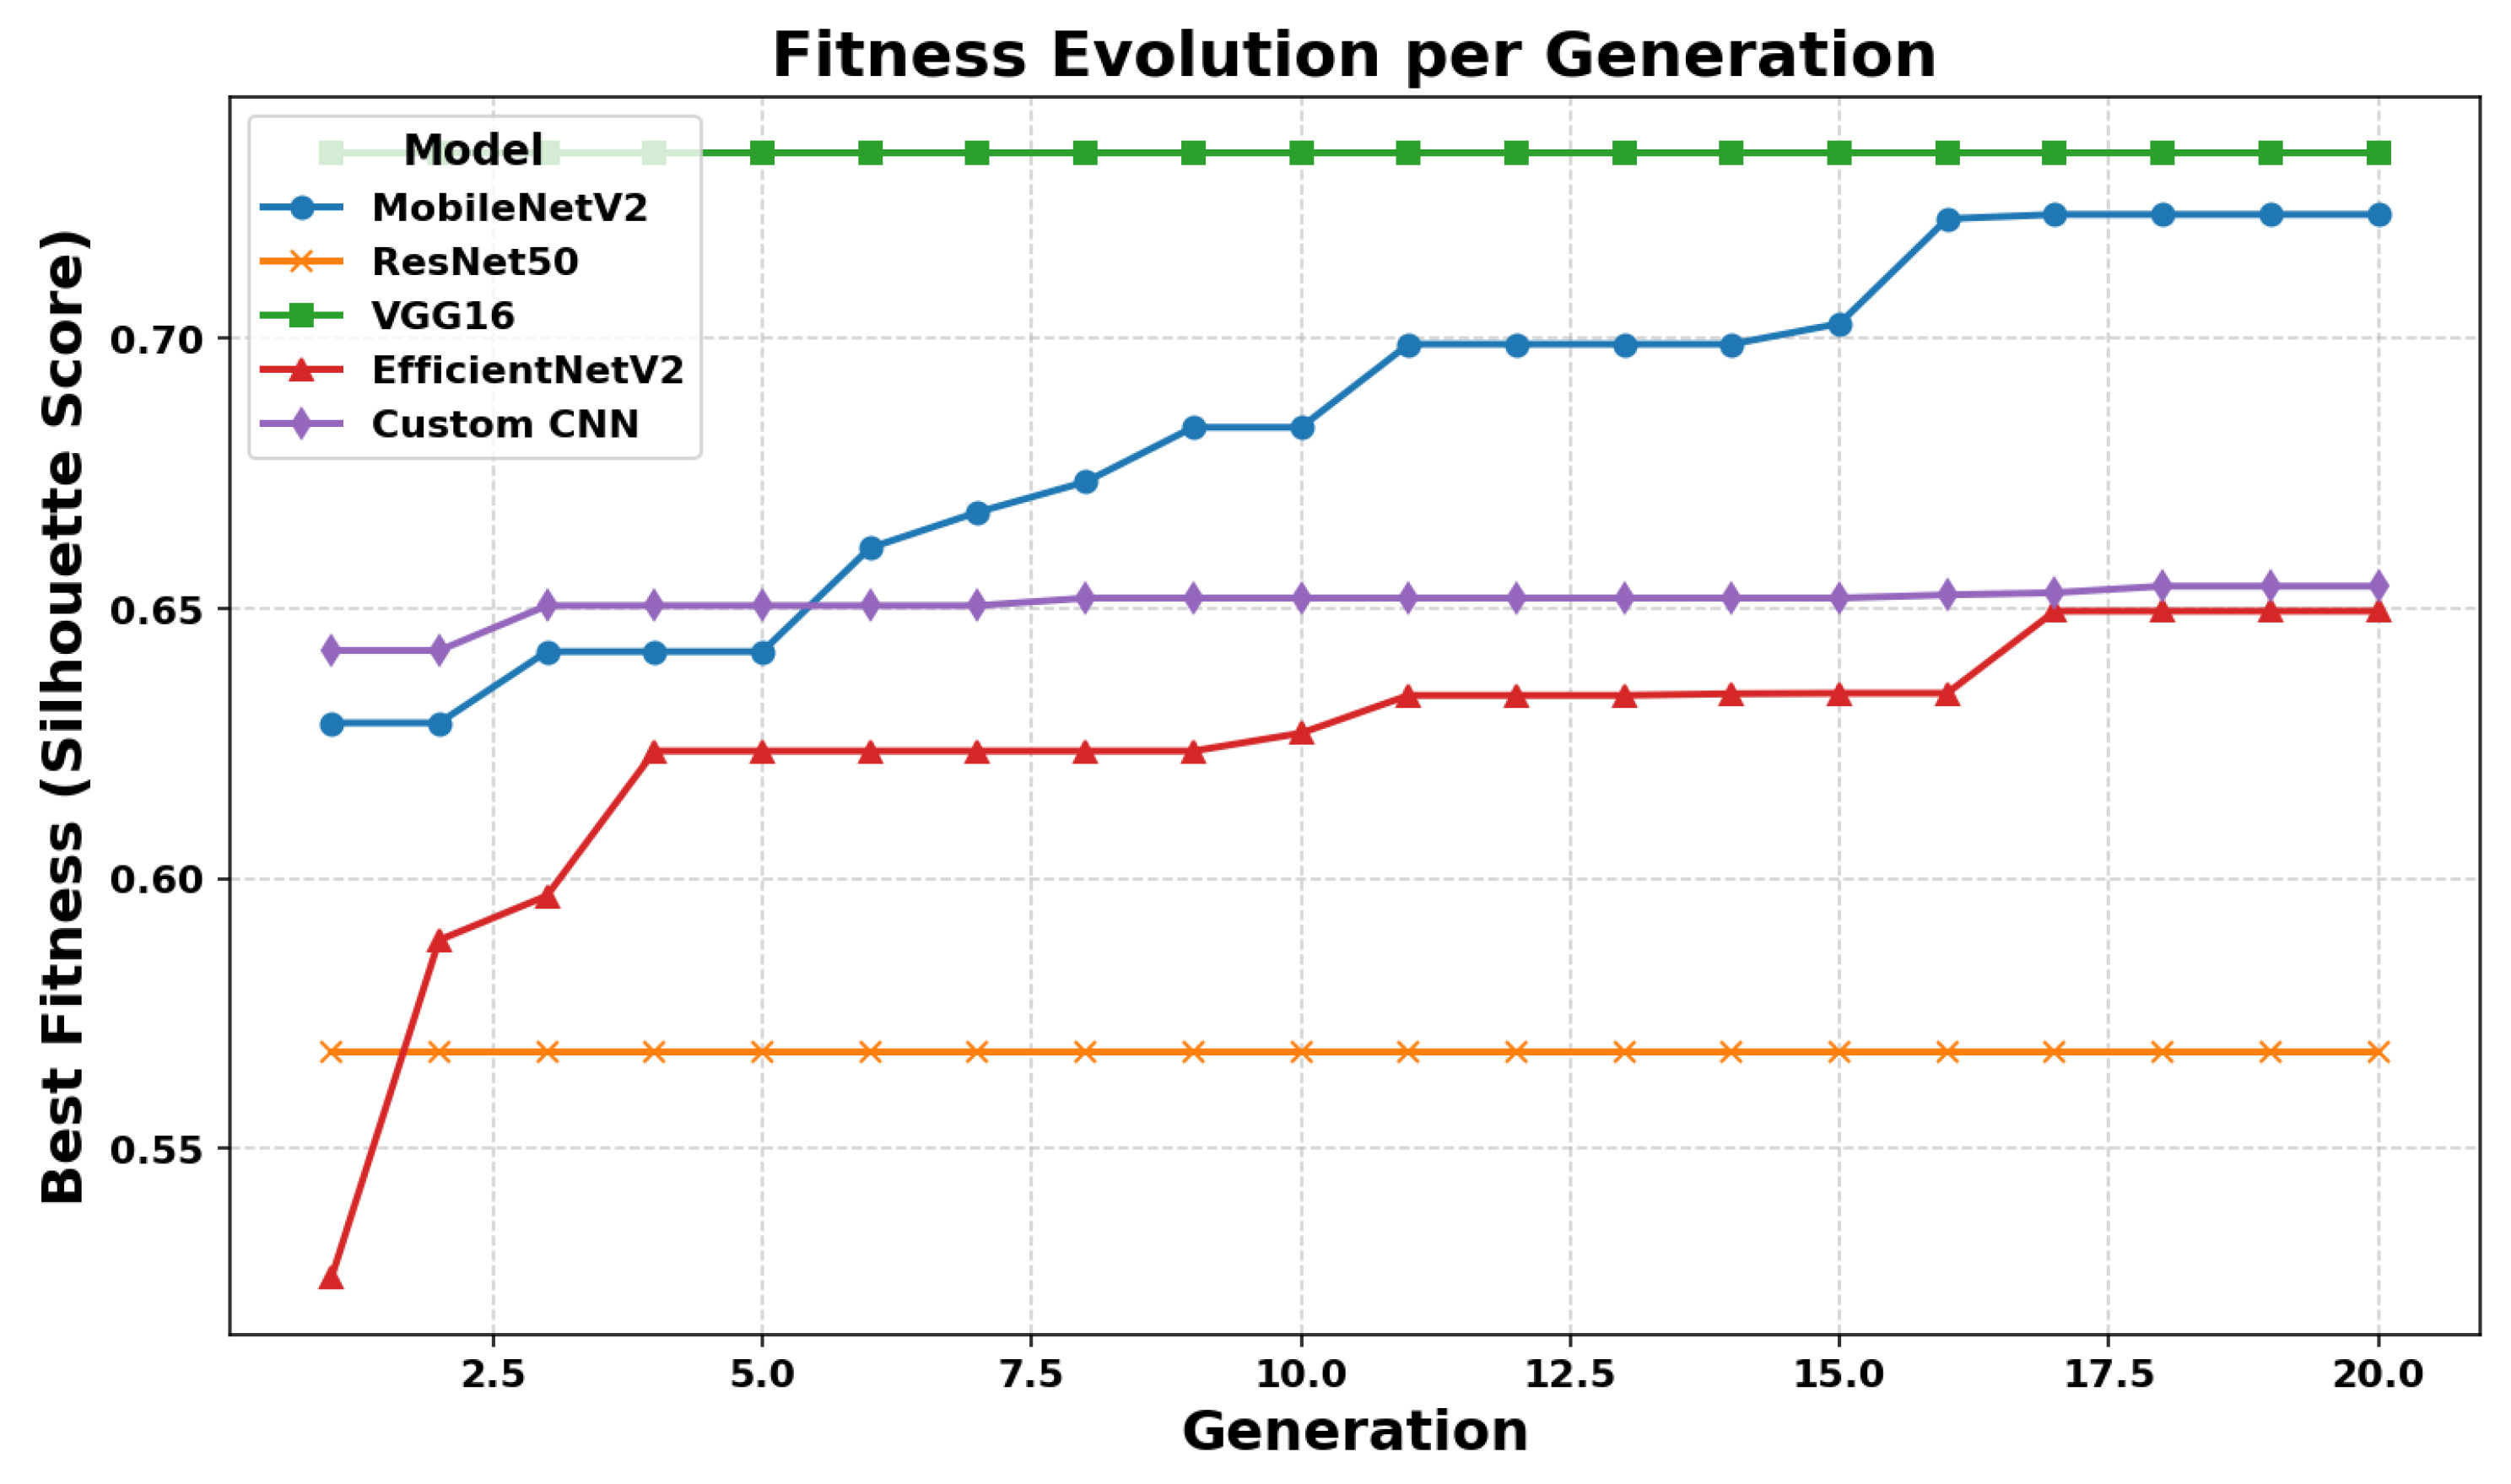

Table 1.
Summary of the deep CNN architectures used for feature extraction.
| Component | Description | Output Shape |
|---|---|---|
| Common Structure (added to all CNN bases) | ||
| Input | RGB image | (InceptionV3: ) |
| Global Average Pooling | Aggregates spatial features | Depends on base model |
| Dense Layer | 128 units, ReLU activation | 128 |
| Dense Layer | 64 units, ReLU activation | 64 |
| Output Layer | 1 unit, Sigmoid activation (binary classification) | 1 |
| Frozen CNN Backbones | ||
| VGG16 | ImageNet pretrained base (without classification head) | |
| DenseNet121 | ImageNet pretrained base (without classification head) | |
| EfficientNetV2B0 | ImageNet pretrained base (without classification head) | |
| InceptionV3 | ImageNet pretrained base (without classification head) | |
| MobileNetV2 | ImageNet pretrained base (without classification head) | |
| ResNet50 | ImageNet pretrained base (without classification head) | |
Table 2.
Performance comparison of fuzzy classification methods using different membership functions, evaluated per class.
Table 2.
Performance comparison of fuzzy classification methods using different membership functions, evaluated per class.
| Method | Membership Function | Sensitivity (%) | Specificity (%) | Precision (%) | F1-Score (%) |
|---|---|---|---|---|---|
| Gaussian (class 0) | 96.39 | 86.89 | 94.68 | 95.52 | |
| Gaussian (class 1) | 86.89 | 96.39 | 90.85 | 88.83 | |
| Fuzzy SVM | Triangular (class 0) | 94.23 | 87.12 | 94.68 | 94.45 |
| Triangular (class 1) | 87.12 | 94.23 | 86.07 | 86.59 | |
| Trapezoidal (class 0) | 95.18 | 88.86 | 95.42 | 95.30 | |
| Trapezoidal (class 1) | 88.86 | 95.18 | 88.33 | 88.59 | |
| Gaussian (class 0) | 86.95 | 68.03 | 75.29 | 80.84 | |
| Gaussian (class 1) | 68.03 | 86.95 | 75.27 | 71.44 | |
| Fuzzy BN | Triangular (class 0) | 57.49 | 72.73 | 83.69 | 68.84 |
| Triangular (class 1) | 72.73 | 57.49 | 57.17 | 57.33 | |
| Trapezoidal (class 0) | 38.03 | 56.00 | 67.82 | 48.40 | |
| Trapezoidal (class 1) | 56.00 | 38.03 | 67.83 | 47.90 | |
| Gaussian (class 0) | 100.00 | 0.00 | 70.91 | 82.95 | |
| Gaussian (class 1) | 0.00 | 100.00 | 0.00 | 0.00 | |
| Fuzzy DT | Triangular (class 0) | 100.00 | 0.29 | 70.95 | 82.98 |
| Triangular (class 1) | 0.29 | 100.00 | 70.91 | 0.58 | |
| Trapezoidal (class 0) | 95.44 | 18.76 | 74.10 | 83.36 | |
| Trapezoidal (class 1) | 18.76 | 95.44 | 74.35 | 30.02 | |
| Gaussian (class 0) | 95.79 | 73.31 | 89.76 | 93.62 | |
| Gaussian (class 1) | 73.31 | 95.79 | 73.96 | 73.63 | |
| Fuzzy KNN | Triangular (class 0) | 89.89 | 85.34 | 93.01 | 91.42 |
| Triangular (class 1) | 85.34 | 89.89 | 81.71 | 83.47 | |
| Trapezoidal (class 0) | 95.79 | 73.31 | 89.76 | 93.62 | |
| Trapezoidal (class 1) | 73.31 | 95.79 | 73.96 | 73.63 | |
| FGK | - (class 0) | 89.03 | 29.03 | 77.78 | 82.96 |
| - (class 1) | 29.03 | 89.03 | 48.65 | 35.94 | |
| Fuzzy CM | - (class 0) | 34.02 | 64.97 | 28.50 | 30.94 |
| - (class 1) | 64.97 | 34.02 | 70.59 | 67.57 |
Table 3.
PCA visualization of the feature subsets selected via GA based on quality metric Q, for each CNN model.
Table 3.
PCA visualization of the feature subsets selected via GA based on quality metric Q, for each CNN model.
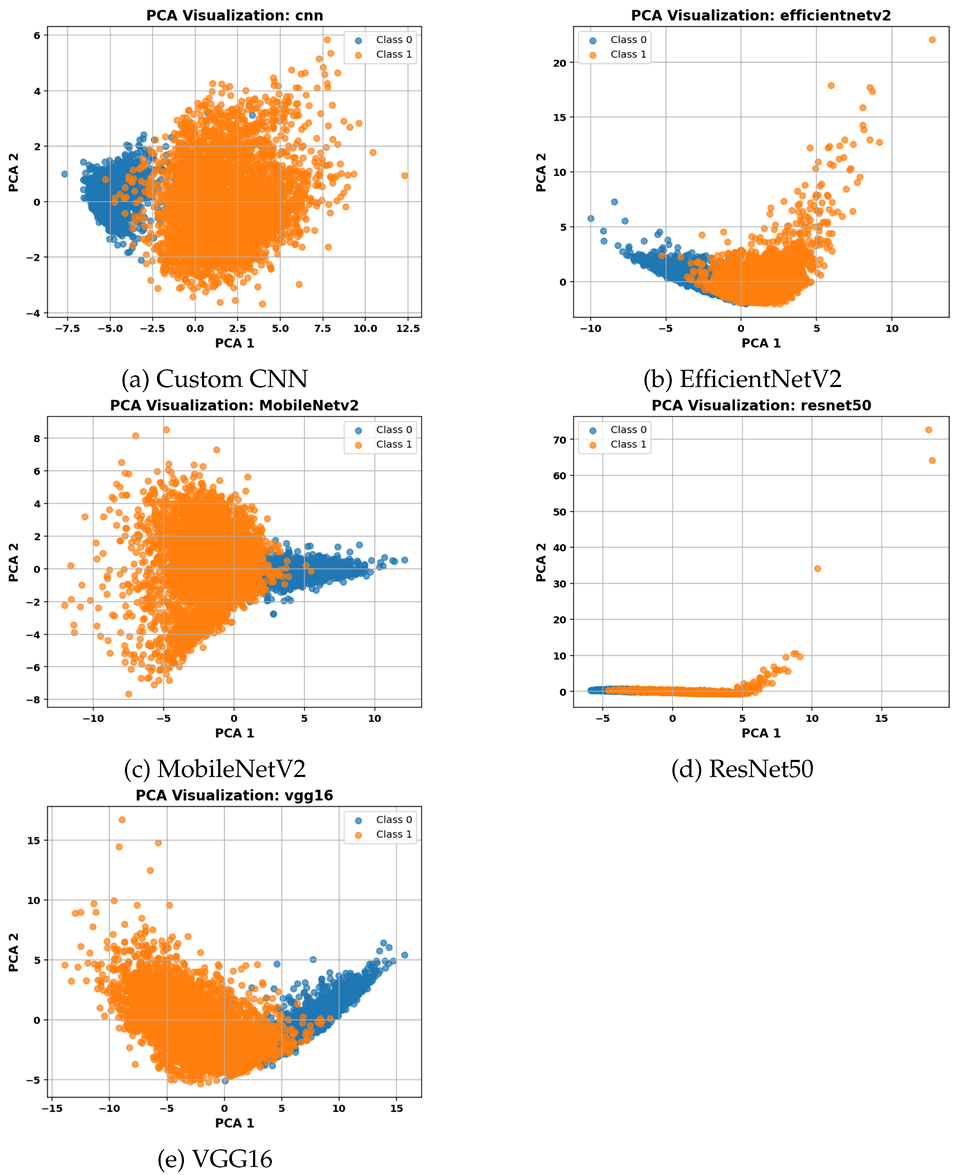 |
Table 4.
Maximum clustering quality Q and number of selected features for each CNN model.
| Model | Maximum Quality Q | Selected Features |
|---|---|---|
| MobileNetV2 | 10.10 | 74 |
| ResNet50 | 5.11 | 74 |
| VGG16 | 12.89 | 95 |
| EfficientNetV2 | 6.84 | 69 |
| Custom CNN | 7.22 | 44 |
Table 5.
Comparison of clustering metrics and number of selected features for each CNN model.
| Model | Silhouette Score | Calinski–Harabasz Score | Davies–Bouldin Index | Selected Features |
|---|---|---|---|---|
| MobileNetV2 | 0.7229 | 5182.68 | 0.5834 | 44 |
| ResNet50 | 0.5678 | 7561.61 | 0.5251 | 17 |
| VGG16 | 0.7343 | 8233.05 | 0.4292 | 16 |
| EfficientNetV2 | 0.6495 | 5476.06 | 0.4790 | 56 |
| Custom CNN | 0.6541 | 9038.60 | 0.4254 | 30 |
Table 6.
PCA visualizations of feature subsets selected via GA based on clustering metric (Silhouette Index) for each CNN model. Each subplot shows the projection onto the first two principal components (PC1 and PC2): (a) EfficientNetV2, (b) MobileNetV2, (c) ResNet50, (d) Custom CNN, and (e) VGG16.
Table 6.
PCA visualizations of feature subsets selected via GA based on clustering metric (Silhouette Index) for each CNN model. Each subplot shows the projection onto the first two principal components (PC1 and PC2): (a) EfficientNetV2, (b) MobileNetV2, (c) ResNet50, (d) Custom CNN, and (e) VGG16.
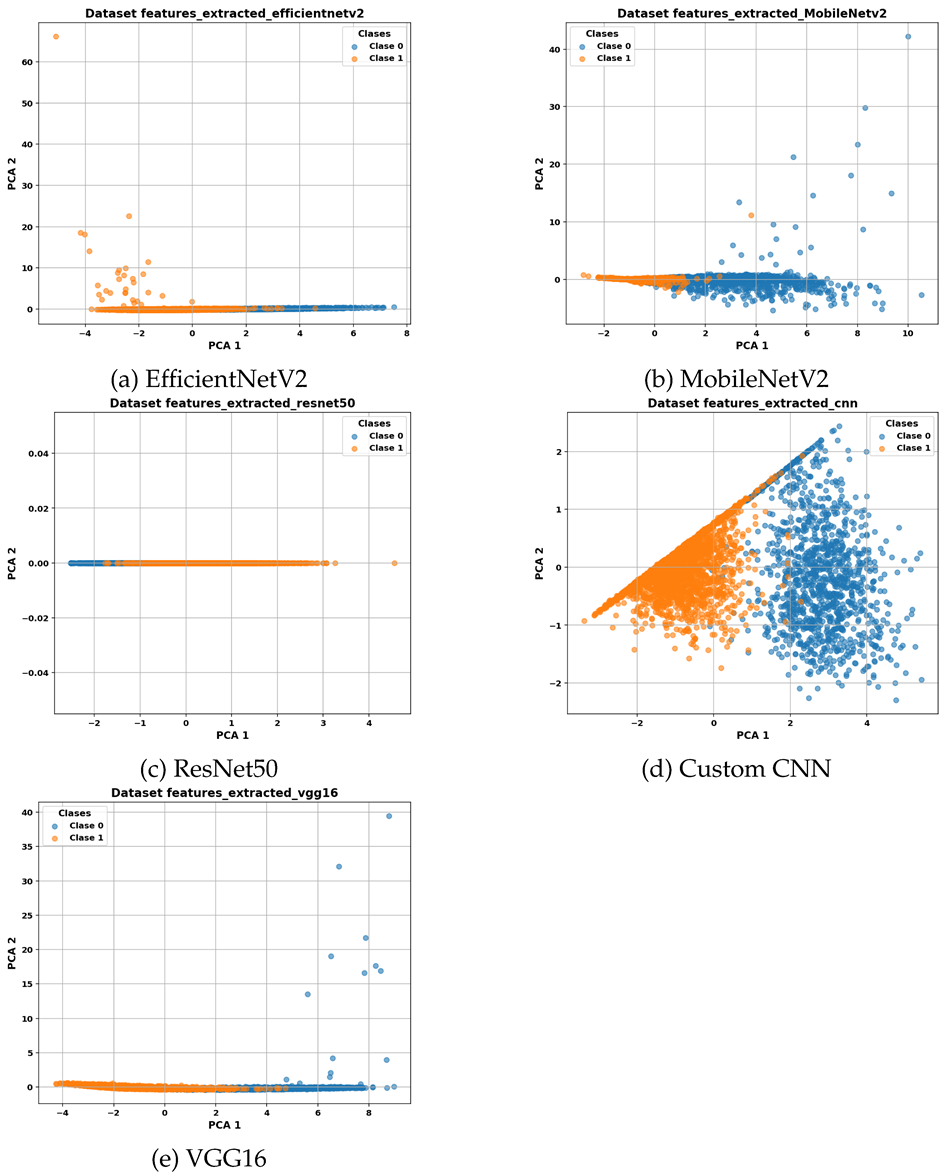 |
Table 7.
Classification metrics computed per class using confusion matrix values, including Accuracy (equal for both classes).
Table 7.
Classification metrics computed per class using confusion matrix values, including Accuracy (equal for both classes).
| Method | Class | Accuracy | Sensitivity | Specificity | Precision | F1-Score | TN | FP | FN | TP |
|---|---|---|---|---|---|---|---|---|---|---|
| Fuzzy SVM - Gaussian | Class 1 | 0.9360 | 0.9509 | 0.8959 | 0.9610 | 0.9559 | 284 | 33 | 42 | 813 |
| Class 0 | 0.9360 | 0.8959 | 0.9509 | 0.8712 | 0.8834 | 813 | 42 | 33 | 284 | |
| Fuzzy SVM - Trapezoidal | Class 1 | 0.9378 | 0.9544 | 0.8927 | 0.9600 | 0.9572 | 283 | 34 | 39 | 817 |
| Class 0 | 0.9378 | 0.8927 | 0.9544 | 0.8789 | 0.8858 | 817 | 39 | 34 | 283 | |
| Fuzzy SVM - Triangular | Class 1 | 0.9326 | 0.9532 | 0.8770 | 0.9543 | 0.9538 | 278 | 39 | 40 | 815 |
| Class 0 | 0.9326 | 0.8770 | 0.9532 | 0.8742 | 0.8756 | 815 | 40 | 39 | 278 | |
| Fuzzy BN - Gaussian | Class 1 | 0.9437 | 0.9509 | 0.9243 | 0.9713 | 0.9610 | 293 | 24 | 42 | 813 |
| Class 0 | 0.9437 | 0.9243 | 0.9509 | 0.8746 | 0.8988 | 813 | 42 | 24 | 293 | |
| Fuzzy BN - Triangular | Class 1 | 0.7372 | 0.6444 | 0.9874 | 0.9928 | 0.7816 | 313 | 4 | 304 | 551 |
| Class 0 | 0.7372 | 0.9874 | 0.6444 | 0.5073 | 0.6702 | 551 | 304 | 4 | 313 | |
| Fuzzy BN - Trapezoidal | Class 1 | 0.8761 | 0.8453 | 0.9590 | 0.9823 | 0.9081 | 304 | 13 | 132 | 723 |
| Class 0 | 0.8761 | 0.9590 | 0.8453 | 0.8458 | 0.8522 | 723 | 132 | 13 | 304 | |
| Fuzzy DT - Gaussian | Class 1 | 0.9320 | 0.9520 | 0.8768 | 0.9544 | 0.9532 | 278 | 39 | 41 | 814 |
| Class 0 | 0.9320 | 0.8768 | 0.9520 | 0.8683 | 0.8725 | 814 | 41 | 39 | 278 | |
| Fuzzy DT - Triangular | Class 1 | 0.9360 | 0.9510 | 0.8927 | 0.9550 | 0.9530 | 283 | 34 | 42 | 813 |
| Class 0 | 0.9360 | 0.8927 | 0.9510 | 0.8847 | 0.8887 | 813 | 42 | 34 | 283 | |
| Fuzzy DT - Trapezoidal | Class 1 | 0.9334 | 0.9544 | 0.8802 | 0.9544 | 0.9544 | 279 | 38 | 39 | 816 |
| Class 0 | 0.9334 | 0.8802 | 0.9544 | 0.8802 | 0.8802 | 816 | 39 | 38 | 279 | |
| Fuzzy KNN - Gaussian | Class 1 | 0.9378 | 0.9497 | 0.9147 | 0.9679 | 0.9587 | 290 | 27 | 43 | 812 |
| Class 0 | 0.9378 | 0.9147 | 0.9497 | 0.8831 | 0.8986 | 812 | 43 | 27 | 290 | |
| Fuzzy KNN - Triangular | Class 1 | 0.9435 | 0.9462 | 0.9306 | 0.9737 | 0.9598 | 295 | 22 | 46 | 809 |
| Class 0 | 0.9435 | 0.9306 | 0.9462 | 0.8985 | 0.9143 | 809 | 46 | 22 | 295 | |
| Fuzzy KNN - Trapezoidal | Class 1 | 0.9435 | 0.9462 | 0.9306 | 0.9737 | 0.9598 | 295 | 22 | 46 | 809 |
| Class 0 | 0.9435 | 0.9306 | 0.9462 | 0.8985 | 0.9143 | 809 | 46 | 22 | 295 | |
| FGK | Class 1 | 0.5938 | 0.1675 | 0.9937 | 0.9863 | 0.2854 | 315 | 2 | 712 | 143 |
| Class 0 | 0.5938 | 0.9937 | 0.1675 | 0.1671 | 0.1673 | 143 | 712 | 2 | 315 | |
| Fuzzy CM | Class 1 | 0.9399 | 0.9449 | 0.9337 | 0.9748 | 0.9596 | 296 | 21 | 47 | 808 |
| Class 0 | 0.9399 | 0.9337 | 0.9449 | 0.8726 | 0.9021 | 808 | 47 | 21 | 296 |
Table 8.
Visual evaluation of model performance using confusion matrices (CM), ROC curves, and precision-recall curves (PRC) for each classifier with different fuzzy membership functions
Table 8.
Visual evaluation of model performance using confusion matrices (CM), ROC curves, and precision-recall curves (PRC) for each classifier with different fuzzy membership functions
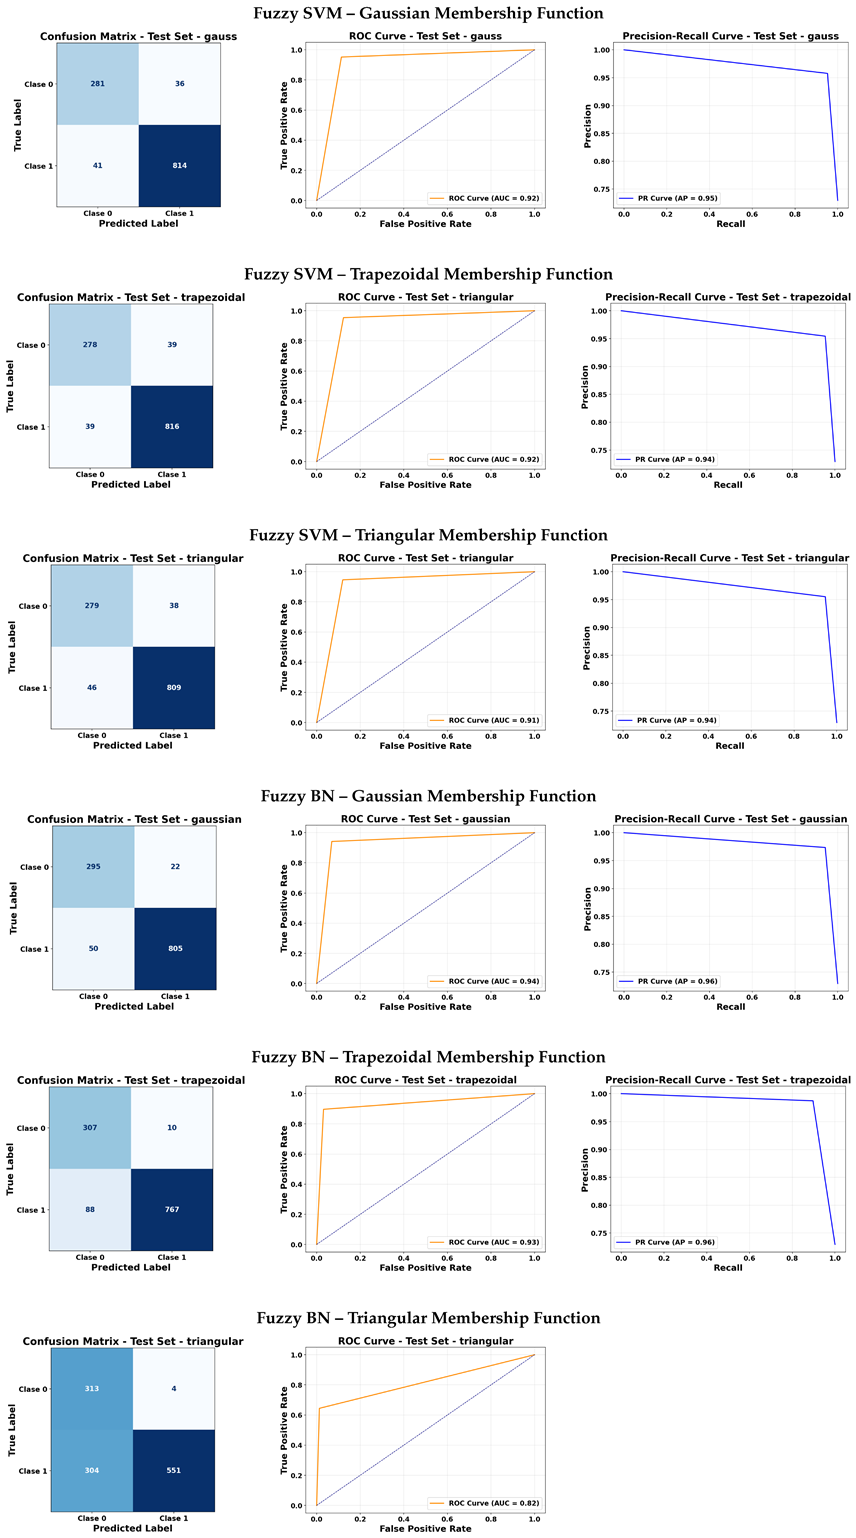 |
Table 9.
Visual evaluation of model performance using confusion matrices, ROC curves, and precision-recall curves (PRC) for each classifier and membership function.
Table 9.
Visual evaluation of model performance using confusion matrices, ROC curves, and precision-recall curves (PRC) for each classifier and membership function.
 |
Table 10.
Visual evaluation of model performance using confusion matrices, ROC curves, and precision-recall curves (PRC) for each fuzzy classifier.
Table 10.
Visual evaluation of model performance using confusion matrices, ROC curves, and precision-recall curves (PRC) for each fuzzy classifier.
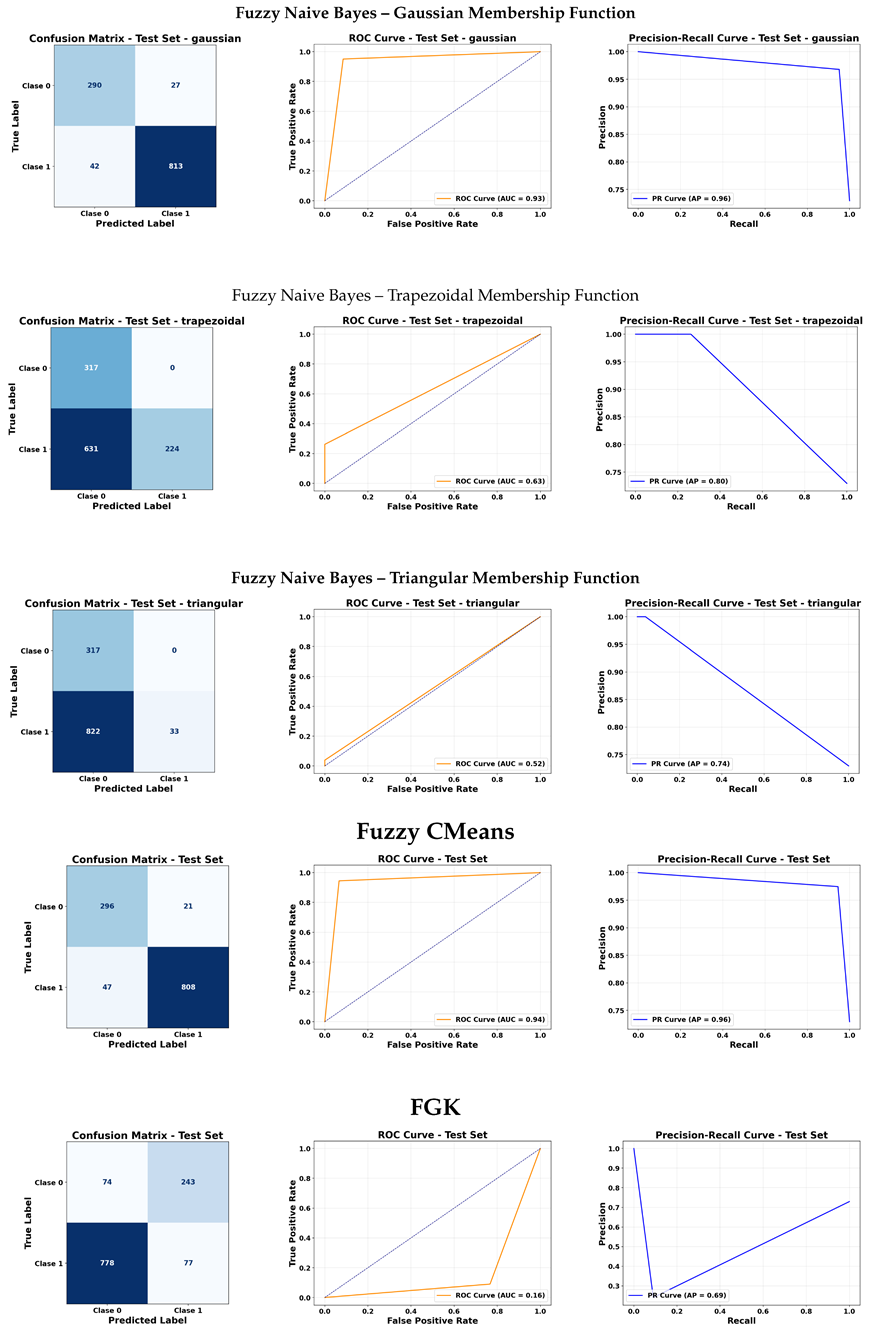 |
Table 11.
Comparison with Previous Studies on Pneumonia Detection
| Reference | Study Focus | Methodology | Reported Accuracy |
|---|---|---|---|
| [44] | CXR image classification using Faster R-CNN | Fully connected RCNN | 62% |
| [41] | Pediatric pneumonia diagnosis via transfer learning | VGG16 and CNN | 74.2% (VGG16) |
| [42] | Pneumonia detection using CNN-based feature extraction | DenseNet-169 + SVM | 80.02% (DenseNet-169) |
| [45] | Pneumonia diagnosis using deep learning | VGG16 and Xception | 87% (VGG16), 82% (Xception) |
| [43] | Pneumonia localization on large-scale dataset | Ensemble of RetinaNet and Mask R-CNN | 75.8% |
| This work | Hybrid fuzzy classification with GA-based feature selection | Fuzzy KNN (Triangular Membership) | Accuracy: 93.5% |
Disclaimer/Publisher’s Note: The statements, opinions and data contained in all publications are solely those of the individual author(s) and contributor(s) and not of MDPI and/or the editor(s). MDPI and/or the editor(s) disclaim responsibility for any injury to people or property resulting from any ideas, methods, instructions or products referred to in the content. |
© 2025 by the authors. Licensee MDPI, Basel, Switzerland. This article is an open access article distributed under the terms and conditions of the Creative Commons Attribution (CC BY) license (http://creativecommons.org/licenses/by/4.0/).
Copyright: This open access article is published under a Creative Commons CC BY 4.0 license, which permit the free download, distribution, and reuse, provided that the author and preprint are cited in any reuse.


