
Submitted:
04 August 2025
Posted:
05 August 2025
You are already at the latest version
Abstract
This study employs a combined k-mer based comparative genomics and mitochondrial genome analysis to investigate genetic variation in S.t. tatarica. Whole genome sequencing data were used to assess genomic diversity, revealing significant variation between samples, with 25.55-28.49% of k-mers being sample-specific. Mitochondrial genome sequencing provided 100% coverage for all samples and identified 532 variants. These variants were predominantly variants of the ND4, ND5, ND6, and CYTB genes, with uneven distribution among samples and mitochondrial genes. The results indicate a noticeable level of genetic diversity in S.t. tatarica and provide insight into the population structure of the species.
Keywords:
Saiga tatarica tatarica
; whole genome sequencing
; K-mer analysis
; mitochondrial genome
; genetic diversity
; Ural population
; Betpak-dala population
1. Introduction
Saiga is a migratory herbivore inhabiting central Asia. Currently, it is found in Kazakhstan, Russia, Mongolia, Turkmenistan, and Uzbekistan. It has been reintroduced into the Ukrainian reserve (Askania Nova).
The genus Saiga is a member of the Polyhoridae family and according to various sources belongs to the subfamilies Antilopinae and Saiga (Saiginae) [1]. The animal has an unusual appearance due to its characteristic feature of a pair of closely flared nostrils, which point downwards and form a mobile, meek proboscis [2,3]. Males also have thick, slightly twisted horns with pronounced rings and a light waxy colour. The saiga is one of the few extant relics of the Ice Age, well adapted to the harsh, sharply continental climatic conditions of the steppes. Saigas were previously widespread on the Eurasian continent, with their range extending from Western Europe to the Chukotka Autonomous Area of the Russian Federation [4,5].
To a greater or lesser extent, each of these populations undertakes seasonal migrations, heading north to their summer ranges and south to their winter ranges in search of favorable climatic conditions and more fertile pastures. As of April 2025, the saiga population in Kazakhstan reached 4.1 million individuals, an increase of 45% compared to the previous year. The Ural saiga population, the largest in Kazakhstan, numbers 2,300,000 individuals. The second largest population is the Betpak-dala population, which has 1,600,000 individuals. The smallest population, the Ustyurt population, numbers only 92,200 individuals [6]. Saigas are generally a migratory species that are prone to mass mortality, but their high reproductive rate helps populations recover. Dzud and disease are the two main factors causing mass mortality [7,8]. Poaching also poses a constant threat, leading to a sharp decline in population numbers [9,10]. Given that female saigas mainly give birth to twins, this fact allows populations to quickly increase in number after a decline [11].
An analysis of the dynamics of saiga population numbers over the last hundred years clearly shows that the species has twice experienced the “bottleneck effect”. This effect refers to a sharp decline in population numbers due to various factors (disease, natural disasters, uncontrolled hunting, etc.). A significant decline in population size leads to a reduction in the genetic diversity of the species. If the population subsequently increases, the previous levels of genetic diversity are not restored, as the frequency of inbreeding increases, reducing the heterozygosity of the population and causing the loss of alleles [12,13].
The first such effect was observed in the 1940s and 1950s, when no more than ten herds of several hundred individuals and one herd of just over a thousand were recorded in Kazakhstan [14]. After that, measures were taken to ban saiga hunting, and the population quickly grew to 1 million individuals, at which point hunting was once again permitted. A second similar case occurred in the late 1990s, when the saiga population fell to 21,000 (just over 2% of the original population survived). The main cause at that time was poaching [9,10]. In addition, in 2015, there was a mass death of saigas caused by Pasteurella multocida bacteria [7].
The recovery of the saiga population after each reduction was most likely accompanied by a loss of genetic diversity. The depletion of the gene pool leads to an increased probability of extinction, reduces the adaptive potential of the species, and decreases the viability of animals. Without the necessary work to restore the gene pool, there will be further loss of alleles that may be responsible for the body's immunity to infectious diseases, i.e., outbreaks of infections will occur more frequently and with more massive animal deaths. Diseases caused by genetic abnormalities will also spread [15,16].
However, the internal structure of populations and their level of genetic diversity remain poorly understood, especially at the genomic and mitochondrial DNA levels. It is worth noting that research on saiga genetic material has been and continues to be conducted by the international scientific community. However, the number of such studies is extremely small, and most of them are conducted by Chinese scientists on the Mongolian subspecies of saigas (Saiga t. mongolica) or on archaeological remains found in the Middle Paleolithic and Neolithic periods [17,18,19,20]. Work is underway to find molecular genetic methods for identifying biomaterial and determining its origin from saigas [21,22].
The last major study of the Kazakh saiga population was conducted in 2013, when the genome of two individuals from the Ural saiga population was analyzed and markers for microsatellite analysis of Saiga t. tatarica were identified [23]. A significant problem is the lack of data on sequences and genetic polymorphism, which seriously hinders the application of genomic approaches to solving biological problems. A whole-genome analysis capable of identifying polymorphic markers is required to assess the population characteristics of saigas.
Thus, in Kazakhstan, where all three modern populations of Saiga tatarica tatarica are predominantly concentrated, no studies have yet been conducted to characterize the genetic structure of the populations.
Our study aimed to determine the characteristics of genetic differences between individuals of Saiga tatarica tatarica based on whole-genome DNA analysis.
The results of studies on genomic and mitochondrial variation are fundamental to our understanding of the biology of species and broader ecological and evolutionary studies.
A detailed analysis of the mitochondrial genome, including the identification of variants, provides valuable markers for population genetic studies. These data can be used to reconstruct phylogenetic relationships within a species, assess population dispersal history, and identify centres of origin or refugia.
The results of this study will inform future conservation efforts for this species. Understanding the genetic structure will enable effective management strategies and plans for conserving genetic resources to be developed.
2. Materials and Methods
2.1. Sampling
Ear plucks from dead wild animals of the Ural and Betpak-dala saiga populations were used as biomaterial for research.

Table 1.
Characteristics of selected samples.
| Sample number | Population | Gender | Date of selection | Place of collection |
| 10u | Ural | Male | May 2023 | West Kazakhstan Region, Zhanibek district, Talovka village |
| 14u | Male | |||
| 18u | Female | |||
| 20u | Female | |||
| 20b | Betpak-dala | Male | November 2023 | Akmola Region, Korgalzhyn district, Sabyndy village |
| 28b | Female | |||
| 41b | Male | |||
| 42b | Male |
2.2. DNA Extraction and Genetic Analysis
DNA from saiga tissues was extracted using the commercial «PureLink Genomic DNA Mini Kit» (Invitrogen, USA).
For sequencing, we used a platform from BGI (Beijing Genomics Institute) based on DNBseq technology. DNA libraries were prepared according to the manufacturer's recommendations, after which the concentration and quality of the material were checked using a fluorimeter and gel electrophoresis. The DNA was then fragmented to the desired size, and adapters and primers were added to the fragments to bind to the sequencing platform. This was followed by PCR amplification of the target regions. The data were read in paired-end sequencing mode with a read length of 100-150 bp. After sequencing, low-quality data were filtered and adapters were removed using FastQC, MultiQC, and Trimmomatic software [24]. The data obtained were saved in FASTQ format for further processing.
2.3. Sequence Processing and Quality Control
Paired-end whole genome sequencing data were obtained for eight S. t. tatarica samples. Raw sequencing reads were processed using fastp v0.20.0 [25] to remove low-quality sequences and adapter contamination. Quality filtering was performed with the following parameters: 4 bp sliding window for quality trimming with a mean quality threshold of 20, minimum base quality score of 15, maximum percentage of unqualified bases allowed of 40%, maximum number of N bases of 5, and minimum read length of 36 bp after trimming. Adapter sequences were automatically detected and removed. Both 5' and 3' ends of reads were trimmed based on quality thresholds. Quality control metrics and reports were generated for each sample.
2.4. K-mer Based Comparative Genomic Analysis
To analyze genomic variation without requiring a reference genome assembly, we employed a k-mer based comparative approach [26,27]. Raw FASTQ files were converted to FASTA format using BBMap (version 38.90) [28]. For the k-mer analysis, we selected a k-mer size of 17 nucleotides, which provides an optimal balance between specificity and sensitivity for comparative genomics [29,30]. A minimum count threshold of 2 was implemented to filter potential sequencing errors [31]. For computational efficiency, 50,000 sequences were randomly sampled from each individual [32]. K-mers were extracted, counted, and filtered using a custom-developed computational pipeline. Pairwise genomic similarities between samples were calculated using multiple metrics including the Jaccard index (J = |A∩B|/|A∪B|) [33], Szymkiewicz–Simpson coefficient (|A∩B|/min(|A|,|B|)) [34,35], and Sorensen-Dice coefficient (2|A∩B|/(|A|+|B|)), where A and B represent the sets of k-mers from two samples. Sample-specific genomic elements were identified by systematically removing k-mers shared with any other sample [36].
2.5. Mitochondrial Genome Mapping and Variant Analysis
Filtered paired-end reads were aligned to the S.t. tatarica mitochondrial reference genome (NC_020746.1, 16,375 bp) using BWA-MEM v0.7.17 [37] with default parameters and 20 threads. Read groups were assigned during alignment with sample identifiers. Post-alignment processing was performed using SAMtools v1.19 [38] and included the following steps: name-based sorting, fixing mate pair information, position-based sorting, and marking (but not removing) duplicate reads. Alignment statistics, including mapping rates and coverage, were generated using samtools flagstat and samtools coverage commands. Variant calling was performed using BCFtools v1.19 mpileup and call functions [39,40]. The mpileup command was executed with a maximum depth of 1,000,000 and a minimum base quality of 0 to ensure capture of all potential variants. The call command used the multiallelic-caller model to identify variants. Variants were filtered based on quality and depth using BCFtools filter with the criteria QUAL ≥ 20 and DP ≥ 10. The resulting variants were normalized using BCFtools norm to ensure proper representation of indels and complex variants.
Filtered variants were annotated using SnpEff [41] with a custom database built for the S.t. tatarica mitochondrial genome (NC_020746.1). The annotation process classified variants into four impact categories: HIGH (variants with high impact on gene function), MODERATE (non-synonymous substitutions), LOW (synonymous variants), and MODIFIER (variants with minimal impact, typically in non-coding regions). Variant statistics were generated using BCFtools stats [42] to summarize the types and distributions of variants across samples. Additional analyses included quantification of variant impact by gene, variant distribution across samples, and identification of patterns in variant distribution. Genomic features were compared using BEDTools [43]. Figures and statistical analyses were created using R v4.2.0 [44] with packages including ggplot2 [45], dplyr [46], tidyr [47], and ggpubr [48].
3. Results
Genetic variance
K-mer analysis of eight S. t. tatarica whole genome sequences revealed substantial genomic variation, with each sample containing a significant proportion of unique genomic content (Table 2).
Pairwise genomic comparisons demonstrated relatively uniform genomic distances across all sample pairs, with Jaccard similarities falling within a narrow range (0.2785-0.2890). Table 3 presents the three most and least similar sample pairs, along with average similarity metrics across all pairwise comparisons.
The Szymkiewicz–Simpson coefficient and Sørensen-Dice coefficient values averaged 0.4567 and 0.4429 respectively across all sample pairs. The consistency of similarity values, coupled with the substantial proportion of sample-specific k-mers (25.55-28.49%), suggests a population with moderate genetic diversity but no evidence of distinct subpopulations or highly divergent individuals.
Mitochondrial Variance
The analysis of the S. t. tatarica mitochondrial genome sequencing data revealed complete coverage across all samples, with each sample achieving 100% coverage of the reference genome (NC_020746.1, 16,375 bp total length). Despite the uniformity in coverage breadth, there was considerable variation in sequencing depth among the samples. Sample 20b exhibited the highest mean depth at 1048.06x, followed by sample 14u (887.55x) and sample 10u (831.87x). Moderate depth was observed in samples 18u (597.42x), 42b (526.15x), and 28b (461.63x). The lowest sequencing depths were found in samples 41b (395.45x) and 20b (306.96x). The average sequencing depth across all samples was 631.89x (Table 4).
The sequencing quality metrics were consistent across all samples, with mean base quality scores ranging from 34.5 (sample 20u) to 35.0 (sample 41b), and a mean of 34.74 across all samples. Similarly, the mapping quality was highly uniform across samples, with values ranging from 59.4 (sample 18u) to 59.7 (sample 28b), and an average of 59.54. The high and consistent coverage across all samples, coupled with the substantial sequencing depth, provides a robust foundation for the identification of mitochondrial variants. The uniformity in quality metrics further indicates that the sequencing data is of high quality across all samples, making it suitable for downstream analyses, including variant calling and phylogenetic investigations.
Eight mitochondrial genome samples were analyzed for genetic variants (Figure 1). Three samples (18u, 20u, and 41b) each contained the highest number of variants, with exactly 101 variants. Sample 14u followed by 89 variants. Samples 10u and 20b both had 43 variants, while 28b contained 36 variants. Sample 42b showed the fewest variants, with only 18. The average quality scores for these variants were consistently high across all samples, ranging from 221.83 to 228.14, with 42b showing the highest average quality score.
The mitochondrial variants were classified into different types based on their predicted functional impact (Figure 2). Upstream gene variants were the most prevalent type, with 254 occurrences, followed closely by synonymous variants with 214 occurrences. Missense variants were the third most common type with 61 occurrences. Stop gained (2) and stop lost (1) variants were comparatively rare. This distribution indicates that while many variants occur in non-coding regions upstream of genes, a substantial proportion also occur within coding sequences, but most of these coding variants do not alter the amino acid sequence (synonymous variants). Comprehensive results of the annotation are available in supplementary table.
The variants were mapped to specific genes within the mitochondrial genome to identify the most affected genes (Figure 3A). The analysis revealed that ND4 was the most affected gene with over 400 variants, followed closely by ND5 and ND6, each with approximately 350-380 variants. Other significantly affected genes included CYTB (~250 variants), ATP6 (~180 variants), and the COX family genes (COX1, COX2, and COX3), each with approximately 100-150 variants. The genes with fewer variants included ND3, ATP8, ND4L, ND2, and ND1, with variant counts ranging from approximately 50 to 100. The impact of these variants was classified into four categories: HIGH, MODERATE, LOW, and MODIFIER (Figure 3A). The majority of variants across all genes were classified as MODIFIER, indicating they likely have minimal impact on gene function. LOW-impact variants were the second most common category, followed by MODERATE-impact variants. HIGH-impact variants, which could potentially disrupt gene function, were rare across all genes. The distribution of variants across genes showed distinct patterns among the eight samples (Figure 3B). Samples 41b, 18u, and 20u had the highest number of variants across most genes, particularly in the ND4, ND5, ND6, and CYTB genes, where variant counts reached 60-80 per gene. In contrast, samples 42b and 28b showed fewer variants across all genes. The heatmap visualization (Figure 3B) revealed a clear pattern where samples 41b, 18u, 20u, and 14u formed a cluster with higher variant counts, while samples 10u, 20b, 28b, and 42b formed a separate cluster with lower variant counts. This pattern was consistent across all mitochondrial genes, suggesting potential population structure or evolutionary relationships between the samples.
The variant analysis revealed a total of 532 variants across all eight mitochondrial genome samples of S. t. tatarica. The variants were predominantly upstream gene variants (47.7%) and synonymous variants (40.2%), with a smaller proportion of missense variants (11.5%) and rare stop-gained/lost variants (0.6%). The variant distribution was not uniform across samples, with three samples showing significantly higher numbers of variants (101 each) compared to the sample with the lowest number (18). The variant distribution across genes and their functional impact classifications provide a comprehensive overview of the genetic variation present in the mitochondrial genome of S. t. tatarica.
4. Discussion
Authors should discuss the results and how they can be interpreted from the perspective of previous studies and of the working hypotheses. The findings and their implications should be discussed in the broadest context possible. Future research directions may also be highlighted.
This study represents the first attempt at a comprehensive analysis of the variability of the nuclear and mitochondrial genomes of the saiga antelope S. t. tatarica using whole-genome sequencing. The study of genomic variation within and between species is fundamental to understanding evolutionary processes, adaptation, and speciation. Advances in sequencing technologies have provided researchers with unprecedented access to genomic data, enabling detailed studies of the genetic architecture of diverse organisms.
K-mer analysis, a method that does not require a reference genome, allows the variability of the genome to be investigated by breaking down sequences into smaller units (k-mers) and comparing their presence and frequency of occurrence in different samples [26,27]. This approach is particularly useful for species where high-quality reference genomes are either unavailable or difficult to obtain [49] Jaccard index [33], Szymkiewicz–Simpson coefficient [34,35] and the Sorensen-Dice coefficient [50] are effective tools for quantitatively assessing the degree of genomic similarity and differences based on comparing a set of common and unique elements between two genomes.
Mitochondrial DNA (mtDNA) analysis is an additional, widely used approach in evolutionary and population genetics. The mitochondrial genome, due to maternal inheritance, the absence of recombination, and a relatively high mutation rate, is a powerful tool for reconstructing phylogeographic patterns and studying the demographic history of populations.
The combination of genomic and mitochondrial analysis provides a comprehensive picture of the genetic diversity of S. t. tatarica. This multifaceted approach contributes to a deeper understanding of the evolutionary processes that shape the genetic structure of this species.
Genetic analysis of S. t. tatarica individuals conducted as part of our work has provided new data on intraspecific variability and the potential structure of saiga populations. The results of our study showed that the population of S. t. tatarica maintains a moderate level of genetic diversity at the nuclear and mitochondrial levels, despite known cases of sharp declines in numbers in the past.
The use of a k-mer analysis approach without reference to a reference genome revealed moderate but stable divergence between samples, reflecting the overall picture of genetic diversity within the species. The proportion of unique k-mers, ranging from 25.5% to 28.5% in individual samples, indicates the presence of individual genetic characteristics.
While individual genomes showed unique features, pairwise comparisons indicated a relatively limited range of genomic distances, as reflected in the Jaccard index (0.2785–0.2890). The average values of the Jaccard index and Szymkiewicz–Simpson coefficient indicate a fairly high degree of genetic similarity between individuals, but the preservation of unique DNA fragments suggests that each individual contributes to the overall pool of genetic variability. These data are consistent with previous findings that, despite a sharp decline in population size, the saiga has been able to maintain a certain level of genetic heterogeneity [51,52]. A similar level of individual specificity was also observed in other studies on saigas and pointed to the important role of local adaptive processes and historical migrations in shaping genetic structure [51,52].
Analyzing the data in Table 3, it is necessary to note the high genomic similarity at the k-mer level between two samples belonging to different populations (42b – Betpak-dala and 20u - Ural populations). The most obvious explanation for the similarity found is the ongoing gene flow (migration and interbreeding) between the Betpak-dala and Ural populations. To confirm this theory, we randomly selected several genes for alignment (16S rRNA, cytochrome b, and RAG2-Recombination activating gene 2). Alignment was performed using the widely used ClustalW program. As a result, each alignment led to the formation of two fairly close clusters that separate the populations according to the sampling locations (Figure 4). In each of the trees presented, sample 42b was closer to individuals from the Ural population. This fact may serve as further confirmation of migration between the indicated populations, although it was previously believed that the Ural population was more isolated from the other two due to the large distances between them and that the main migration occurs between the Betpak-dala and Ustyurt populations [51].
Mitochondrial genome analysis has further contributed to our understanding of the genetic structure of S. t. tatarica. While all samples showed complete coverage of the mitochondrial reference genome, there was significant variation in sequencing depth. However, this variation in depth did not affect data quality, as sequencing quality metrics were consistent across samples.
Particular attention is drawn to the division of samples into two main groups based on the distribution of mitochondrial variants. One group, including samples 18u, 20u, 14u, and 41b, showed significantly more variants in key mitochondrial genes (ND4, ND5, ND6, CYTB) than the second group. Such differences may be the result of historical substructuring of the population, possibly due to geographical barriers or asynchronous waves of migration in the past, which has previously been noted for saigas in genetic studies [53,54]. Previously, a similar substructure was observed in saigas from Kalmykia and Kazakhstan based on mtDNA data [51], which suggests the presence of stable phylogenetic lines within the species.
In the mitochondrial genome of S. t. tatarica, 532 genetic variants were found, most of which were located in non-coding regions or represented synonymous substitutions, indicating the predominance of evolutionary pressure of stabilizing selection on mitochondrial genes [55] and suggesting a potentially limited impact on protein function. The high proportion of upstream variants in mitochondrial genes is also consistent with data from other ungulates, where regulatory elements have been subject to more frequent mutations than coding regions [56]. This mutation profile is typical for the mitochondrial genomes of most mammals, where there is strong stabilizing pressure aimed at preserving the basic functions of cellular respiration [55,56]. However, the presence of missense variants and variants that alter the stop codon suggests the possibility of functional consequences, and these deserve closer attention in future work.
The distribution of polymorphic variants across mitochondrial genes was also uneven, with the ND4, ND5, and ND6 genes showing the greatest number of variants. This observation is consistent with data obtained for other ungulate species [57,58], as well as birds [59,60], rodents [61] and even amphibians [62], where these genes showed the greatest variability and potential role in adaptation to environmental conditions: in ungulates, to hypoxic conditions or high levels of physical activity; in birds, to hot climates; and in amphibians, to cold stress.
The ND4, ND5, and ND6 genes encode subunits of the NADH dehydrogenase complex (ubiquinone dehydrogenase complex, NADH-ubiquinone dehydrogenase (Complex I)), which plays a central role in cellular respiration and oxidative phosphorylation in mammals. Mutations in ND4 and ND6 prevent the assembly of complex I, leading to a deficiency of complex I [63,64,65], while mutations in ND5 disrupt the activity of complex I, causing a mild defect in the assembly of complex I [66,67]. Although the proteins encoded by these genes are involved in key cellular processes, mtDNA evolution has long been considered almost neutral, and many studies have ignored the direct influence of positive and/or negative selection on the formation of mitochondrial genome diversity. However, an increasing number of studies support the view that variations in the mitochondrial genome are not selectively neutral [59,68,69]. Negative (cleansing) selection is considered to be the predominant force shaping the evolution of the mitogenome, limiting the accumulation of harmful mutations in such evolutionarily constrained regions as NADH dehydrogenase (ND) subunits (Bazin et al., 2006). The identification of specific genes, such as ND4, ND5, and ND6, as hotspots of variation raises questions about the evolutionary pressure acting on these components of the mitochondrial respiratory chain.
5. Conclusions
In conclusion, this study provides a comprehensive analysis of genomic and mitochondrial variation in S. t. tatarica. The data obtained contribute to our understanding of the genetic diversity and population structure of this species and lay the foundation for future studies of the evolutionary and ecological factors shaping its genetic landscape.
The observed patterns of genomic and mitochondrial variation in S. tatarica raise several interesting questions. Moderate but uniform genomic diversity may indicate a recent population bottleneck or expansion event. Differences in the number of mitochondrial variants between samples may reflect population structure or historical demographic processes. The functional impact of the identified variants, especially in coding regions, requires further study to fully understand their potential adaptive significance.
From a practical point of view, the data obtained emphasize the need to take into account the identified genetic differences when developing strategies for the conservation and management of Saiga tatarica populations. Genetically enriched groups with higher levels of mitochondrial and nuclear variability may represent priority targets for biodiversity conservation measures.
Thus, the results confirm that, despite demographic shocks, the population of S. t. tatarica retains significant genetic potential for further recovery. High intrapopulation variability and signs of substructure confirm the need for a differentiated approach to the conservation of different population groups. An important direction for further research will be to include more samples from various regions of the range and expand the set of genetic markers through whole-genome sequencing and metagenomic approaches.
Supplementary Materials
The following supporting information can be downloaded at the website of this paper posted on Preprints.org.
Author Contributions
Conceptualisation: V.U. and I.B.; methodology: V.U., A.K., K.Y.; laboratory research: T.U., A.K., A.K.; formal analysis: Z.T., N.G.; investigation: A.K., K.Y. and V.U.; resources: A.S., K.K.; data curation: V.U., I.B.; writing – original draft: V.U., T.U..; writing – review and editing: V.U., T.U.; visualisation: N.G., K.Y.; project administration: V.U., I.B. All authors have read and agreed to the published version of the manuscript.
Funding
This research was funded by the Science Committee of the Ministry of Science and Higher Education of the Republic of Kazakhstan, project individual registration number AP19577569 «Molecular genetic analysis of the gene pool of Kazakh populations of Saiga tatarica tatarica based on whole genome SNP genotyping» (№ state registration 0123РК00054).
Institutional Review Board Statement
This study was conducted in accordance with ethical standards and was approved by the Commission on Bioethics of NJSC “West Kazakhstan Agrarian and Technical University named after Zhangir Khan”, Uralsk, Kazakhstan. The animals used in this study were not slaughtered, and no special treatment was applied.
Informed Consent Statement
Not applicable.
Data Availability Statement
The data are contained within the article.
Conflicts of Interest
The authors declare no conflicts of interest.
References
- Grubb, P.; Wilson, D.E.; Reeder, D.M. Mammal species of the world: A taxonomic and geographic reference; Johns Hopkins University Press, 2005. [Google Scholar]
- Heptner, V.G.; Nasimovish, A.; Bannikov, A. Mammals of the Soviet Union (v. 1 (1988)). Smithsonian Institution Libraries and National Science Foundation. 1988. Retrieved from https://library.si.edu/digital-library/book/mammalsofsovietu11988gept.
- Sokolov, E.V. Saiga tatarica. Mammalian Species 1974, 38, 1–4. [Google Scholar] [CrossRef]
- Baryshnikov, G.; Tikhonov, A. Notes on skulls of Pleistocene Saiga of Northern Eurasia. Historical Biology 1994, 8, 209–234. [Google Scholar] [CrossRef]
- Kahlke, R.D. The origin of Eurasian mammoth faunas (Mammuthus-coelodonta faunal complex). Quaternary Science Reviews 2014, 96, 32–49. [Google Scholar] [CrossRef]
- Kazinform. The number of saigas in Kazakhstan has reached 4.1 million individuals - Nurken Sharbiyev. 2025. https://www.inform.kz/ru/chislennost-saygakov-v-kazahstane-dostigla-41-mln-osobey-nurken-sharbiev-946812.
- Kock, R.A.; Orynbayev, M.; Robinson, S.; Zuther, S.; Singh, N.J.; Beauvais, W.; Morgan, E.R.; Kerimbayev, A.; Khomenko, S.; Martineau, H.M.; Rystaeva, R.; Omarova, Z.; Wolfs, S.; Hawotte, F.; Radoux, J.; Milner-Gulland, E.J. Saigas on the brink: Multidisciplinary analysis of the factors influencing mass mortality events. Science advances 2018, 4, eaao2314. [Google Scholar] [CrossRef]
- Aguilar, X.F.; Fine, A.E.; Pruvot, M.; Njeumi, F.; Walzer, C.; Kock, R.; Shiilegdamba, E. PPR virus threatens wildlife conservation. Science (New York, N.Y.) 2018, 362, 165–166. [Google Scholar] [CrossRef]
- Milner-Gulland, E.J.; Kholodova, M.V.; Bekenov, A.; Bukreeva, O.M.; Grachev, Iu. A.; Amgalan, L.; Lushchekina, A.A. Dramatic declines in saiga antelope populations. Oryx 2001, 35, 340–345. [Google Scholar] [CrossRef]
- Kühl, A.; Balinova, N.V.; Bykova, E.A.; Arylov, Y.; Esipov, A.V.; Lushchekina, A.; Milner-Gulland, E.J. The role of saiga poaching in rural communities: linkages between attitudes, socio-economic circumstances and behaviour. Biological Conservation 2009, 142, 1442–1449. [Google Scholar] [CrossRef]
- Milner-Gulland, E.J.; Hughes, P.; Bykova, E.; Buuveibaatar, B.; Chimeddorj, B.; Karimova, T.Y.; Lushchekina, A.A.; Salemgareyev, A.; von Meibom, S.; Zuther, S. The sustainable use of Saiga Antelopes: Perspectives and Prospects. Report to the Bundesamt für Naturschutz and the Convention on the Conservation of Migratory Species of Wild Animals. 2020. [Google Scholar]
- Gillespie, J.H. Population genetics. Quick Reference; Johns Hopkins University Press, 1998. [Google Scholar]
- Pierce, B. Genetics: a conceptual approach; Worth Publishers Inc., 2003. [Google Scholar]
- Afanasyev, A.V.; Bazhanov, V.S.; Korelov, M.N.; Sludsky, A.A.; Strautman, E.I. Animals of Kazakhstan. Academy of Sciences of the Kazakh SSR, Institute of Zoology. 1953. [Google Scholar]
- Eding, H.; Meuwissen, T.H.E. Marker based estimates of between and within population kinships for the conservation of genetic diversity. Journal of Animal Breeding and Genetics 2001, 118, 141–159. [Google Scholar] [CrossRef]
- Toro, M.A.; Fernandez, J.; Caballero, A. () Molecular Characterization of Breeds and Its Use in Conservation. Livestock Science 2009, 120, 174–195. [Google Scholar] [CrossRef]
- Ding, X.; Wu, J.; Xiao, H.; Wang, Z.; Liu, Q.; Liu, X.; Jin, K.; Zheng, D. Complete mitochondrial genome of Saiga tatarica (Ruminantia; Pecora; Bovidae) isolate Wuwei in China. Mitochondrial DNA. Part B, Resources 2017, 2, 681–682. [Google Scholar] [CrossRef]
- Paula, C.F.; Kristensen, T.; Orlando, L.; Sher, A.; Kholodova, M.V.; Götherström, A.; Hofreiter, M. Ancient DNA sequences point to a large loss of mitochondrial genetic diversity in the saiga antelope (Saiga tatarica) since the Pleistocene. Molecular Ecology 2010, 19, 4863–4875. [Google Scholar] [CrossRef]
- Zhao, S.; Xu, C.; Liu, G.; Liu, S.; Zhao, C.; Cui, Y.; Hu, D. Microsatellite and mitochondrial DNA assessment of the genetic diversity of captive Saiga antelopes (Saiga tatarica) in China. Chinese Science Bulletin 2013, 58, 2163–2167. [Google Scholar] [CrossRef]
- Rey-Iglesia, A.; Hjort, J.; Silva, T.L.; Buuveibaatar, B.; Dalannast, M.; Ulziisaikhan, T.; Chimeddorj, B.; Espregueira-Themudo, G.; Campos, P.F. Genetic diversity of the endangered Mongolian saiga antelope Saiga tatarica mongolica (Artiodactyla: Bovidae) provides insights into conservation. Biological Journal of the Linnean Society 2022, 137, 100–111. [Google Scholar] [CrossRef]
- Chen, J.; Jiang, Z.; Li, C.; Ping, X.; Cui, S.; Tang, S.; Chu, H.; Liu, B. Identification of ungulates used in a traditional Chinese medicine with DNA barcoding technology. Ecology and evolution 2015, 5, 1818–1825. [Google Scholar] [CrossRef] [PubMed]
- Mukantayev, K.; Kanayev, D.; Zhumabekova, S.; Shevtsov, A.; Tursunov, K.; Mukanov, K.; Ramankulov, Y. Optimization of polymerase chain reaction for the identification of Roe deer, Saiga, and Siberian stag living in Kazakhstan. Veterinary world 2022, 15, 2067–2071. [Google Scholar] [CrossRef]
- Nowak, C.; Zuther, S.; Leontyev, S.V.; Geismar, J. Rapid development of microsatellite markers for the critically endangered Saiga (Saiga tatarica) using Illumina® Miseq next generation sequencing technology. Conservation Genetics Resources 2013, 6, 159–162. [Google Scholar] [CrossRef]
- Bolger, A.M.; Lohse, M.; Usadel, B. Trimmomatic: a flexible trimmer for Illumina sequence data. Bioinformatics (Oxford, England) 2014, 30, 2114–2120. [Google Scholar] [CrossRef]
- Chen, S.; Zhou, Y.; Chen, Y.; Gu, J. fastp: an ultra-fast all-in-one FASTQ preprocessor. Bioinformatics 2018, 34, i884–i890. [Google Scholar] [CrossRef]
- Zielezinski, A.; Vinga, S.; Almeida, J.; Karlowski, W.M. Alignment-free sequence comparison: benefits, applications, and tools. Genome biology 2017, 18, 186. [Google Scholar] [CrossRef]
- Ondov, B.D.; Treangen, T.J.; Melsted, P.; Mallonee, A.B.; Bergman, N.H.; Koren, S.; Phillippy, A.M. Mash: fast genome and metagenome distance estimation using MinHash. Genome Biology 2016, 17, 132. [Google Scholar] [CrossRef]
- Bushnell, B. BBMap: A Fast, Accurate, Splice-Aware Aligner. Lawrence Berkeley National Laboratory. LBNL Report #: LBNL-7065E. 2014. [Google Scholar]
- Marçais, G.; Kingsford, C. A fast, lock-free approach for efficient parallel counting of occurrences of k-mers. Bioinformatics 2011, 27, 764–770. [Google Scholar] [CrossRef]
- Chikhi, R.; Medvedev, P. Informed and automated k-mer size selection for genome assembly. Bioinformatics 2014, 30, 31–37. [Google Scholar] [CrossRef]
- Rizk, G.; Lavenier, D.; Chikhi, R. DSK: k-mer counting with very low memory usage. Bioinformatics 2013, 29, 652–653. [Google Scholar] [CrossRef]
- Rodriguez-R, L.M.; Konstantinidis, K.T. Nonpareil: a redundancy-based approach to assess the level of coverage in metagenomic datasets. Bioinformatics 2014, 30, 629–635. [Google Scholar] [CrossRef] [PubMed]
- Jaccard, P. The distribution of the flora in the alpine zone. New Phytologist 1912, 11, 37–50. [Google Scholar] [CrossRef]
- Szymkiewicz, D. Une contribution statistique à la géographie floristique. Acta Societatis Botanicorum Poloniae 1934, 11, 249–265. [Google Scholar] [CrossRef]
- Simpson, G.G. Holarctic mammalian faunas and continental relationships during the cenozoic. Geological Society of America Bulletin 1947, 58, 613–688. [Google Scholar] [CrossRef]
- Nordström, K.J.; Albani, M.C.; James, G.V.; Gutjahr, C.; Hartwig, B.; Turck, F.; Paszkowski, U.; Coupland, G.; Schneeberger, K. Mutation identification by direct comparison of whole-genome sequencing data from mutant and wild-type individuals using k-mers. Nature biotechnology 2013, 31, 325–330. [Google Scholar] [CrossRef]
- Li, H. Aligning sequence reads, clone sequences and assembly contigs with BWA-MEM. arXiv 2013. [Google Scholar] [CrossRef]
- Li, H.; Handsaker, B.; Wysoker, A.; Fennell, T.; Ruan, J.; Homer, N.; Marth, G.; Abecasis, G.; Durbin, R.; 1000 Genome Project Data Processing Subgroup. The Sequence Alignment/Map format and SAMtools. Bioinformatics 2009, 25, 2078–2079. [Google Scholar] [CrossRef]
- Danecek, P.; Bonfield, J.K.; Liddle, J.; Marshall, J.; Ohan, V.; Pollard, M.O.; Whitwham, A.; Keane, T.; McCarthy, S.A.; Davies, R.M.; Li, H. Twelve years of SAMtools and BCFtools. GigaScience 2021, 10, giab008. [Google Scholar] [CrossRef]
- Li, H. A statistical framework for SNP calling, mutation discovery, association mapping and population genetical parameter estimation from sequencing data. Bioinformatics 2011, 27, 2987–2993. [Google Scholar] [CrossRef]
- Cingolani, P.; Platts, A.; Wang, L.L.; Coon, M.; Nguyen, T.; Wang, L.; Land, S.J.; Lu, X.; Ruden, D.M. A program for annotating and predicting the effects of single nucleotide polymorphisms, SnpEff: SNPs in the genome of Drosophila melanogaster strain w1118; iso-2; iso-3. Fly 2012, 6, 80–92. [Google Scholar] [CrossRef]
- Danecek, P.; McCarthy, S.A. BCFtools/csq: haplotype-aware variant consequences. Bioinformatics 2017, 33, 2037–2039. [Google Scholar] [CrossRef] [PubMed]
- Quinlan, A.R.; Hall, I.M. BEDTools: a flexible suite of utilities for comparing genomic features. Bioinformatics 2010, 26, 841–842. [Google Scholar] [CrossRef] [PubMed]
- R Core Team. (2022). R: A language and environment for statistical computing. R Foundation for Statistical Computing, Vienna, Austria. https://www.R-project.org/.
- Wickham, H. ggplot2: Elegant Graphics for Data Analysis. Springer-Verlag New York, 2016; ISBN 978-3-319-24277-4. [Google Scholar]
- Wickham, H.; François, R.; Henry, L.; Müller, K. dplyr: A Grammar of Data Manipulation. R package version 1.0.9. 2022. https://CRAN.R-project.org/package=dplyr.
- Wickham, H.; Henry, L. tidyr: Tidy Messy Data. R package version 1.2.0. 2022. https://CRAN.R-project.org/package=tidyr.
- Kassambara, A. ggpubr: 'ggplot2' Based Publication Ready Plots. R package version 0.4.0. 2020. https://CRAN.R-project.org/package=ggpubr.
- Moeckel, C.; Mareboina, M.; Konnaris, M.A.; Chan, C.S.Y.; Mouratidis, I.; Montgomery, A.; Chantzi, N.; Pavlopoulos, G.A.; Georgakopoulos-Soares, I. A survey of k-mer methods and applications in bioinformatics. Computational and structural biotechnology journal 2024, 23, 2289–2303. [Google Scholar] [CrossRef] [PubMed]
- Dice, L.R. Measures of the amount of ecologic association between species. Ecology 1945, 26, 297–302. [Google Scholar] [CrossRef]
- Kholodova, M.V. Formation of phylogeographic structure and genetic diversity of even-toed ungulate mammals (Artiodactyla, Ruminantia). A.N. Severtsov Institute of Ecology and Evolution of the Russian Academy of Sciences. 2006. [Google Scholar]
- Kashinina, N.V.; Lushchekina, A.A.; Sorokin, P.A.; Tarasyan, K.K.; Kholodova, M.V. The modern state of the European saiga population (Saiga tatarica tatarica): mtDNA, DRB3 MHC gene, and microsatellite diversity. Integrative zoology 2023, 18, 661–676. [Google Scholar] [CrossRef]
- Karimova, T.Y.; Lushchekina, A.A.; Neronov, V.M. Saiga Populations of Russia and Kazakhstan: Current Status and Retrospective Analysis of Some Biological Parameters. Arid Ecosystems 2021, 11, 164–172. [Google Scholar] [CrossRef]
- Kholodova, M.V.; Milner-Gulland, E.J.; Easton, A.J.; Amgalan, L.; Arylov, Iu. A.; Bekenov, A.; Grachev, Iu.A.; Lushchekina, A.A.; Ryder, O. Mitochondrial DNA variation and population structure of the Critically Endangered saiga antelope Saiga tatarica. Oryx 2006, 40, 103–107. [Google Scholar] [CrossRef]
- Barr, C.M.; Neiman, M.; Taylor, D.R. Inheritance and recombination of mitochondrial genomes in plants, fungi and animals. The New phytologist 2005, 168, 39–50. [Google Scholar] [CrossRef]
- Wolstenholme, D.R. Animal mitochondrial DNA: structure and evolution. International review of cytology 1992, 141, 173–216. [Google Scholar] [CrossRef] [PubMed]
- Mohandesan, E.; Fitak, R.R.; Corander, J.; Yadamsuren, A.; Chuluunbat, B.; Abdelhadi, O.; Raziq, A.; Nagy, P.; Stalder, G.; Walzer, C.; Faye, B.; Burger, P.A. Mitogenome Sequencing in the Genus Camelus Reveals Evidence for Purifying Selection and Long-term Divergence between Wild and Domestic Bactrian Camels. Scientific Reports 2017, 7, 9970. [Google Scholar] [CrossRef] [PubMed]
- Chávez-Galarza, J.C.; Arévalo-Rojas, V.M.; Livia, G.L.G.; Ferro-Mauricio, R.D.; Vecco, D.; Cerna-Mendoza, A.; Guerra-Teixeira, A.A.; Henriques, D.; Domínguez, F.F.; Macedo-Córdova, W.; Llanto-López, M.A. Characterization of the complete mitogenome data of collared peccary, Dicotyles tajacu (Linnaeus, 1758) (Suina: Tayassuidae) from Ucayali, Peru. Data in brief 2024, 57, 111142. [Google Scholar] [CrossRef] [PubMed]
- Kryukov, A.P.; Kryukov, K.A.; Collier, K.; Fang, B.; Edwards, S.V. Mitogenomics clarifies the position of the Nearctic magpies (Pica hudsonia and Pica nuttalli) within the Holarctic magpie radiation. Current zoology 2023, 70, 618–630. [Google Scholar] [CrossRef]
- Lamb, A.M.; Gan, H.M.; Greening, C.; Joseph, L.; Lee, Y.P.; Morán-Ordóñez, A.; Sunnucks, P.; Pavlova, A. Climate-driven mitochondrial selection: A test in Australian songbirds. Molecular ecology 2018, 27, 898–918. [Google Scholar] [CrossRef]
- Tu, F.; Qiao, Y.; Zhao, W.; Wu, T. Comparative selective pressure analysis on mitochondrial protein-coding genes in flying squirrels (Pteromyini) and tree squirrels (Sciurini). Mitochondrial DNA. Part A, DNA mapping, sequencing, and analysis 2025, 35, 75–83. [Google Scholar] [CrossRef]
- Cai, L.N.; Zhang, L.H.; Lin, Y.J.; Wang, J.Y.; Storey, K.B.; Zhang, J.Y.; Yu, D.N. Two-Fold ND5 Genes, Three-Fold Control Regions, lncRNA, and the "Missing" ATP8 Found in the Mitogenomes of Polypedates megacephalus (Rhacophridae: Polypedates). Animals 2023, 13, 2857. [Google Scholar] [CrossRef]
- Hofhaus, G.; Attardi, G. Lack of assembly of mitochondrial DNA-encoded subunits of respiratory NADH dehydrogenase and loss of enzyme activity in a human cell mutant lacking the mitochondrial ND4 gene product. The EMBO journal 1993, 12, 3043–3048. [Google Scholar] [CrossRef]
- Bai, Y.; Attardi, G. The mtDNA-encoded ND6 subunit of mitochondrial NADH dehydrogenase is essential for the assembly of the membrane arm and the respiratory function of the enzyme. The EMBO journal 1998, 17, 4848–4858. [Google Scholar] [CrossRef]
- Bai, Y.; Hu, P.; Park, J.S.; Deng, J.H.; Song, X.; Chomyn, A.; Yagi, T.; Attardi, G. Genetic and functional analysis of mitochondrial DNA-encoded complex I genes. Annals of the New York Academy of Sciences 2004, 1011, 272–283. [Google Scholar] [CrossRef]
- Hofhaus, G.; Attardi, G. Efficient selection and characterization of mutants of a human cell line which are defective in mitochondrial DNA-encoded subunits of respiratory NADH dehydrogenase. Molecular and cellular biology 1995, 15, 964–974. [Google Scholar] [CrossRef]
- Malfatti, E.; Bugiani, M.; Invernizzi, F.; de Souza, C.F.; Farina, L.; Carrara, F.; Lamantea, E.; Antozzi, C.; Confalonieri, P.; Sanseverino, M.T.; Giugliani, R.; Uziel, G.; Zeviani, M. Novel mutations of ND genes in complex I deficiency associated with mitochondrial encephalopathy. Brain: a journal of neurology 2007, 130 Pt 7, 1894–1904. [Google Scholar] [CrossRef]
- Meiklejohn, C.D.; Montooth, K.L.; Rand, D.M. Positive and negative selection on the mitochondrial genome. Trends in genetics: TIG 2007, 23, 259–263. [Google Scholar] [CrossRef]
- Sokolova, I. Mitochondrial adaptations to variable environments and their role in animals’ stress tolerance. Integrative and Comparative Biology 2018, 58, 519–531. [Google Scholar] [CrossRef]
- Bazin, E.; Glémin, S.; Galtier, N. Population size does not influence mitochondrial genetic diversity in animals. Science (New York, N.Y.) 2006, 312, 570–572. [Google Scholar] [CrossRef] [PubMed]
Figure 1.
Distribution of mitochondrial genome variants across all samples.
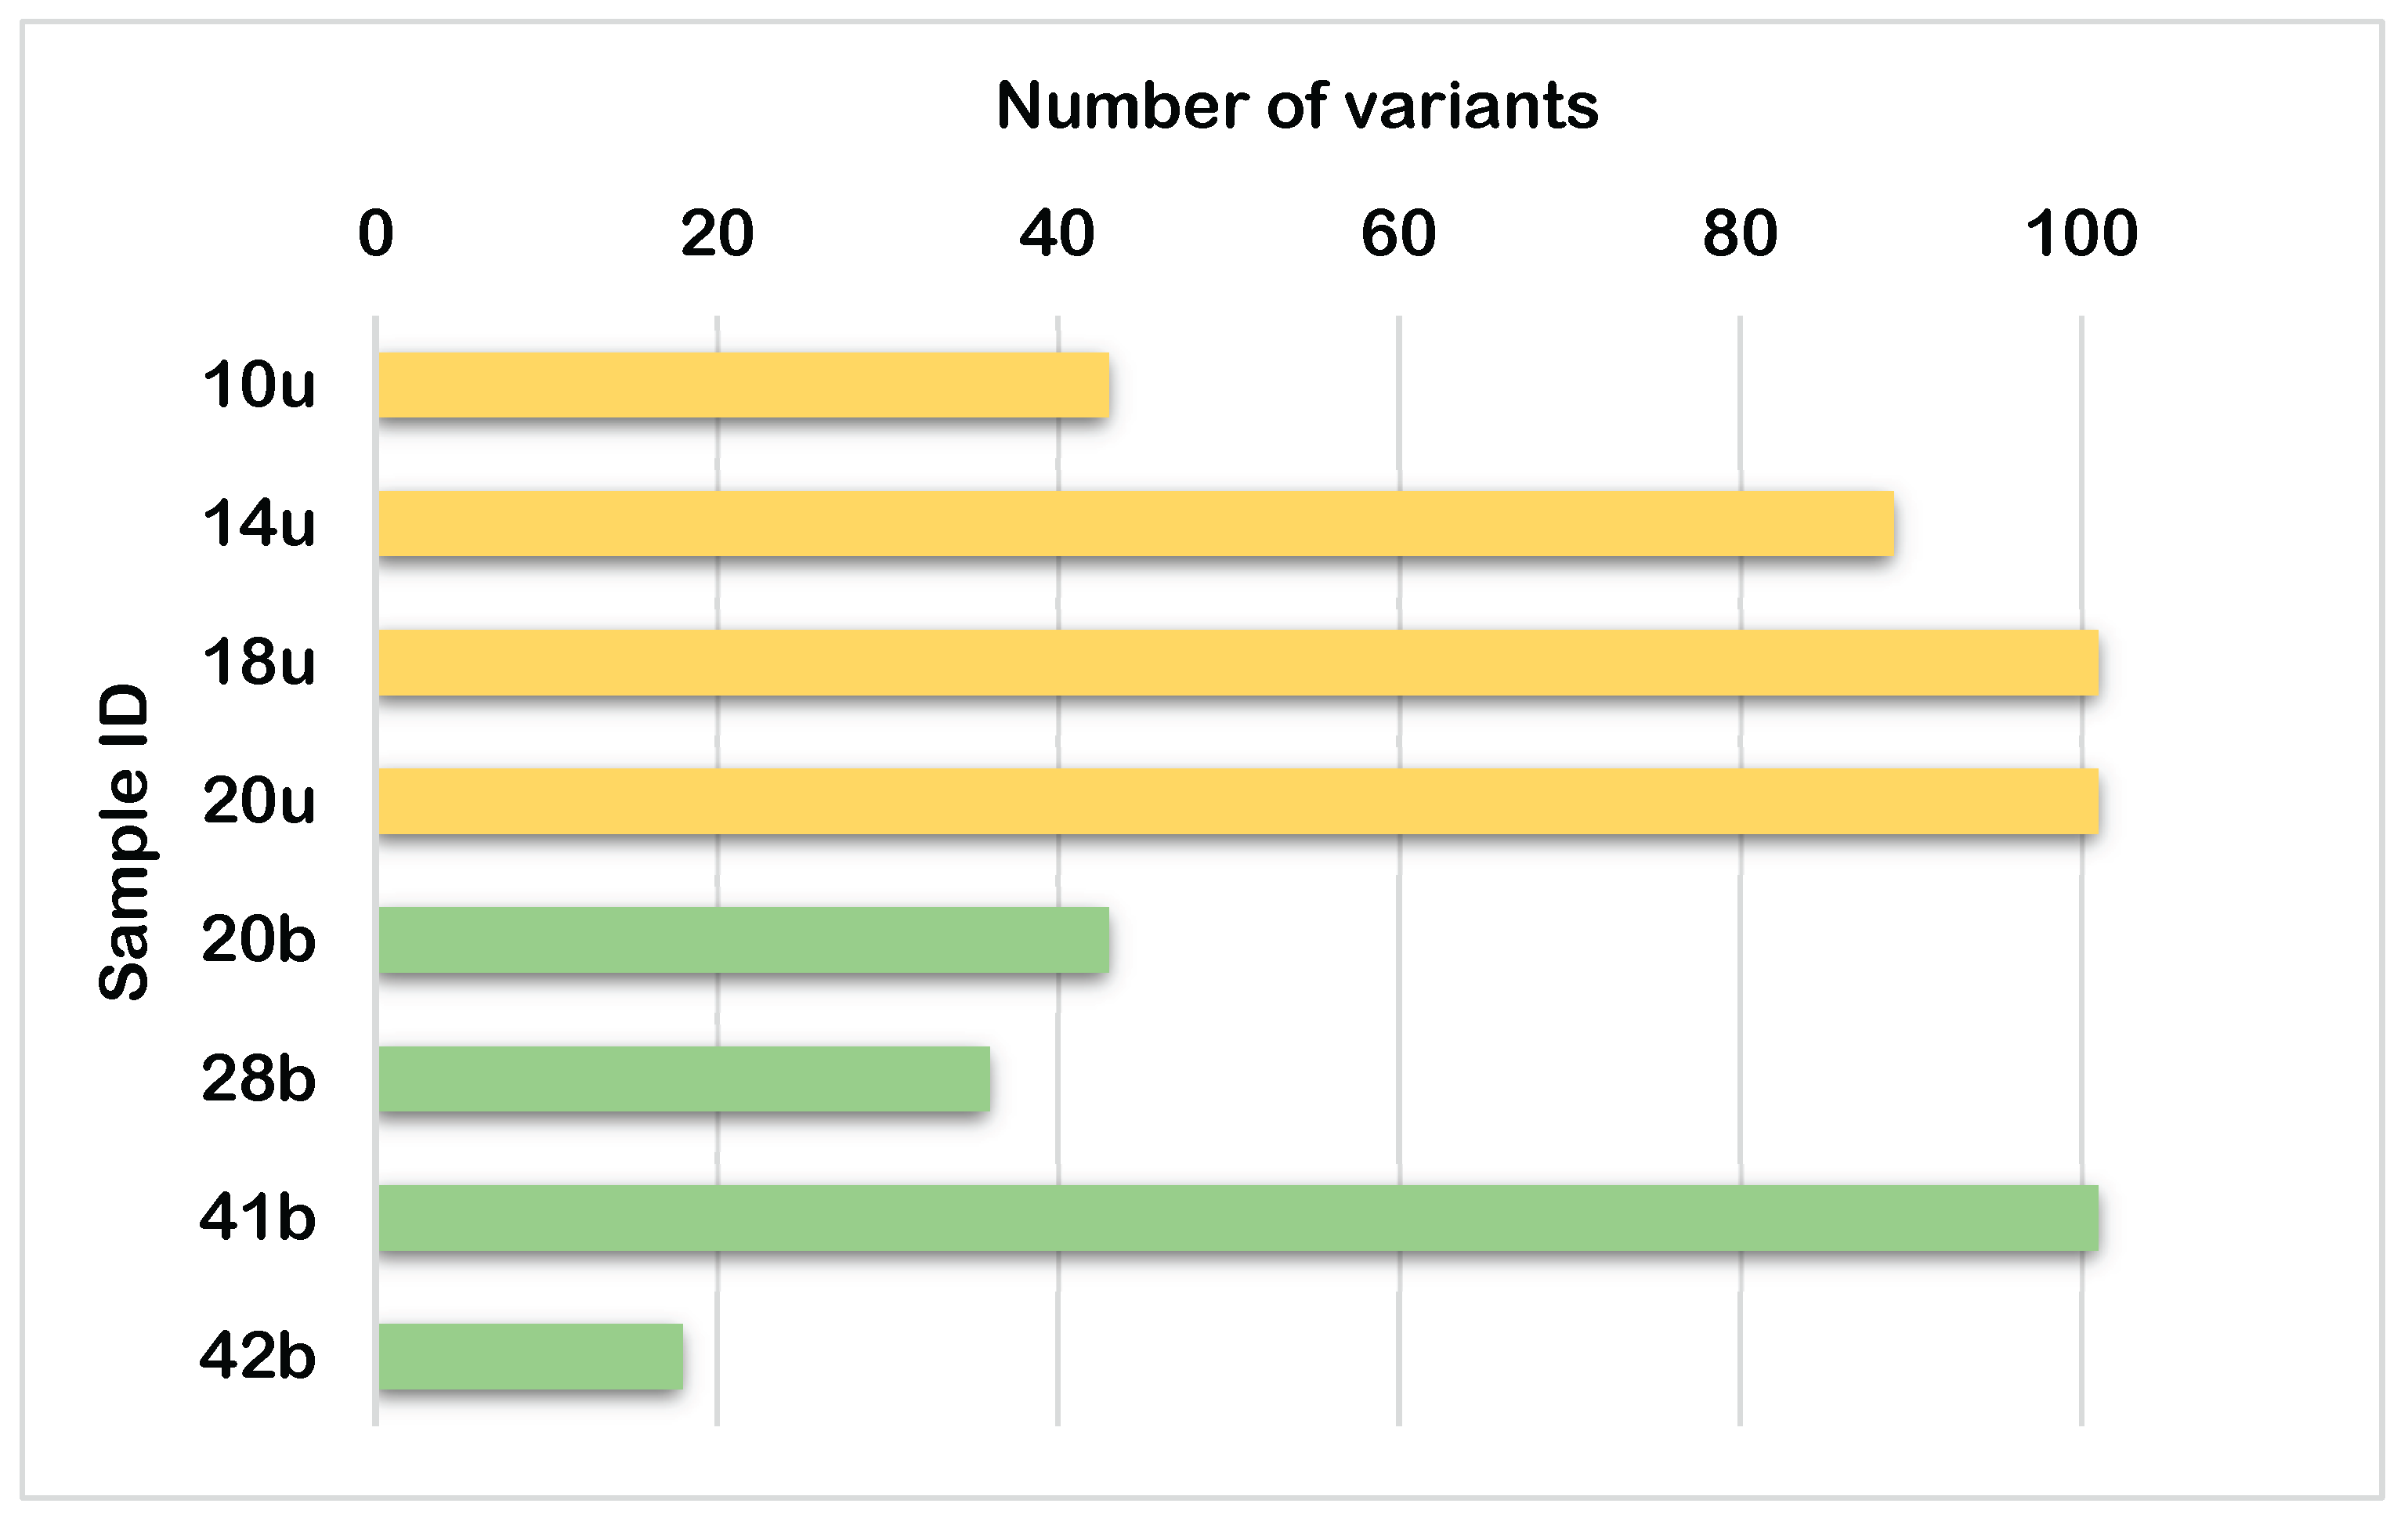
Figure 2.
Distribution of functional impact of mitochondrial variants in S. t. tatarica.
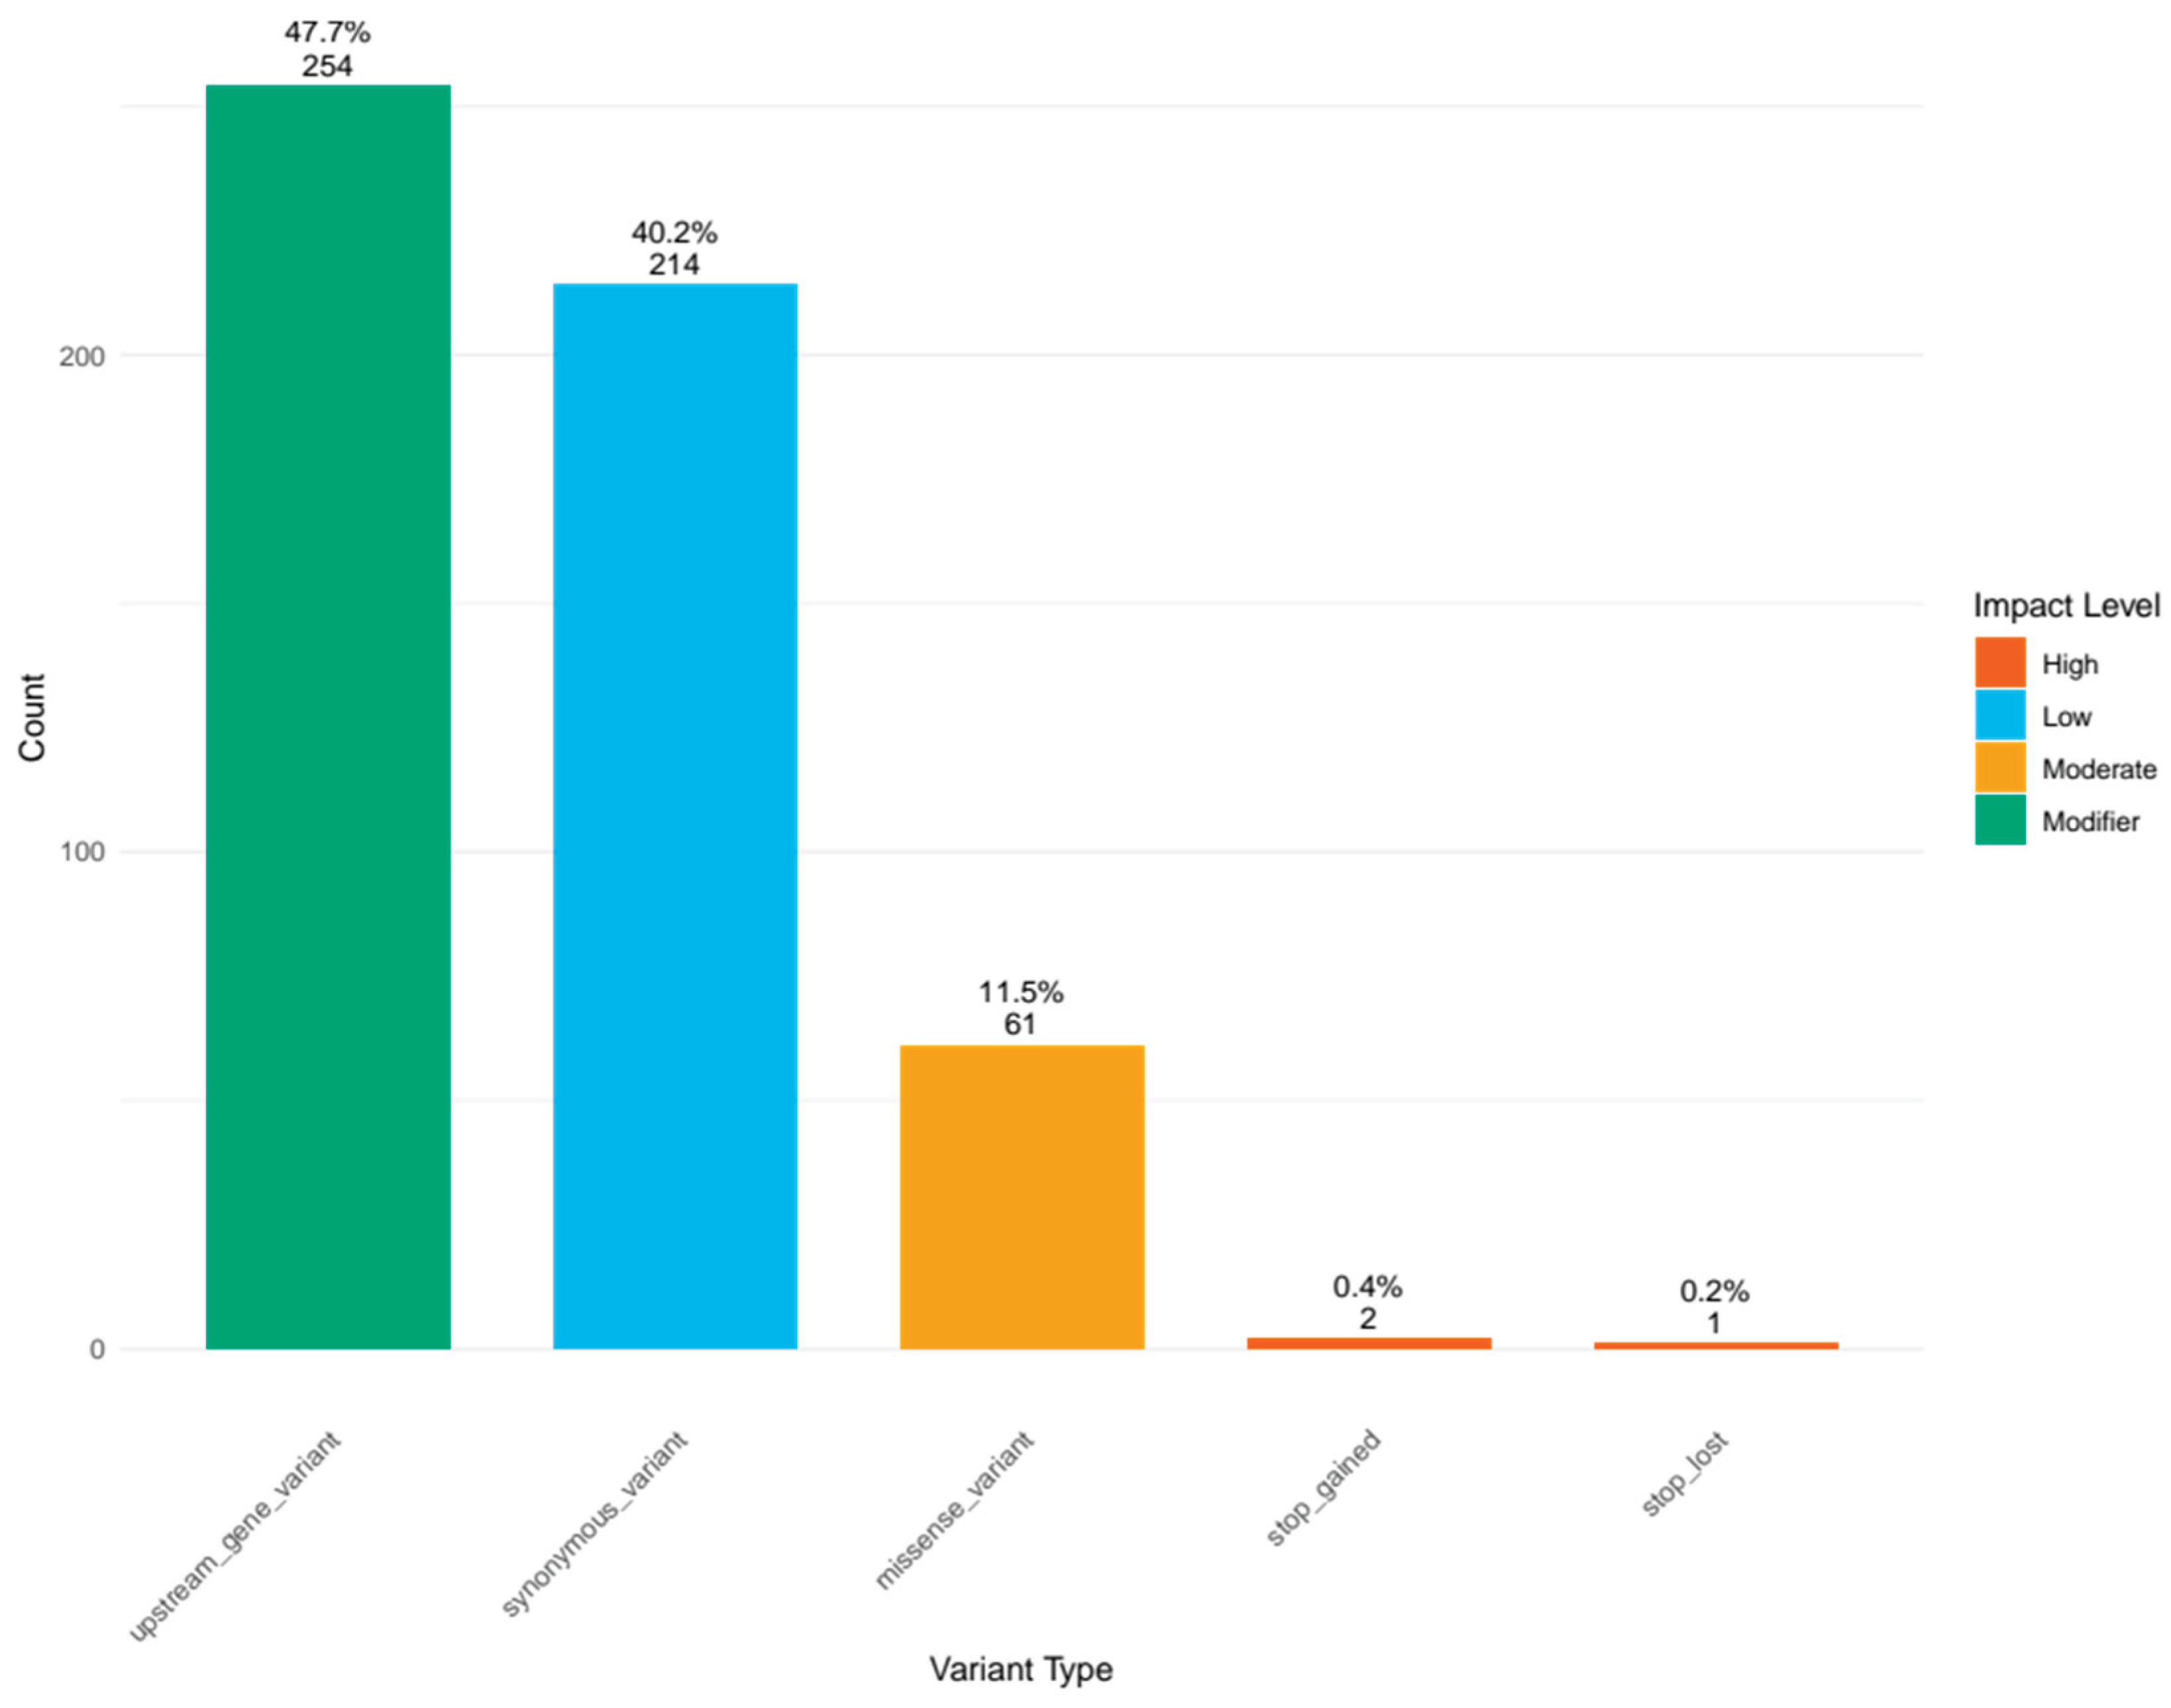
Figure 3.
Distribution of variants across mitochondrial genes in S. t. tatarica. (A) Total number of variants detected in each mitochondrial gene, colored by predicted functional impact (HIGH, LOW, MODERATE, or MODIFIER). (B) Heatmap showing the distribution of variants across all genes (y-axis) and samples (x-axis), with color intensity representing variant count as indicated in the legend.
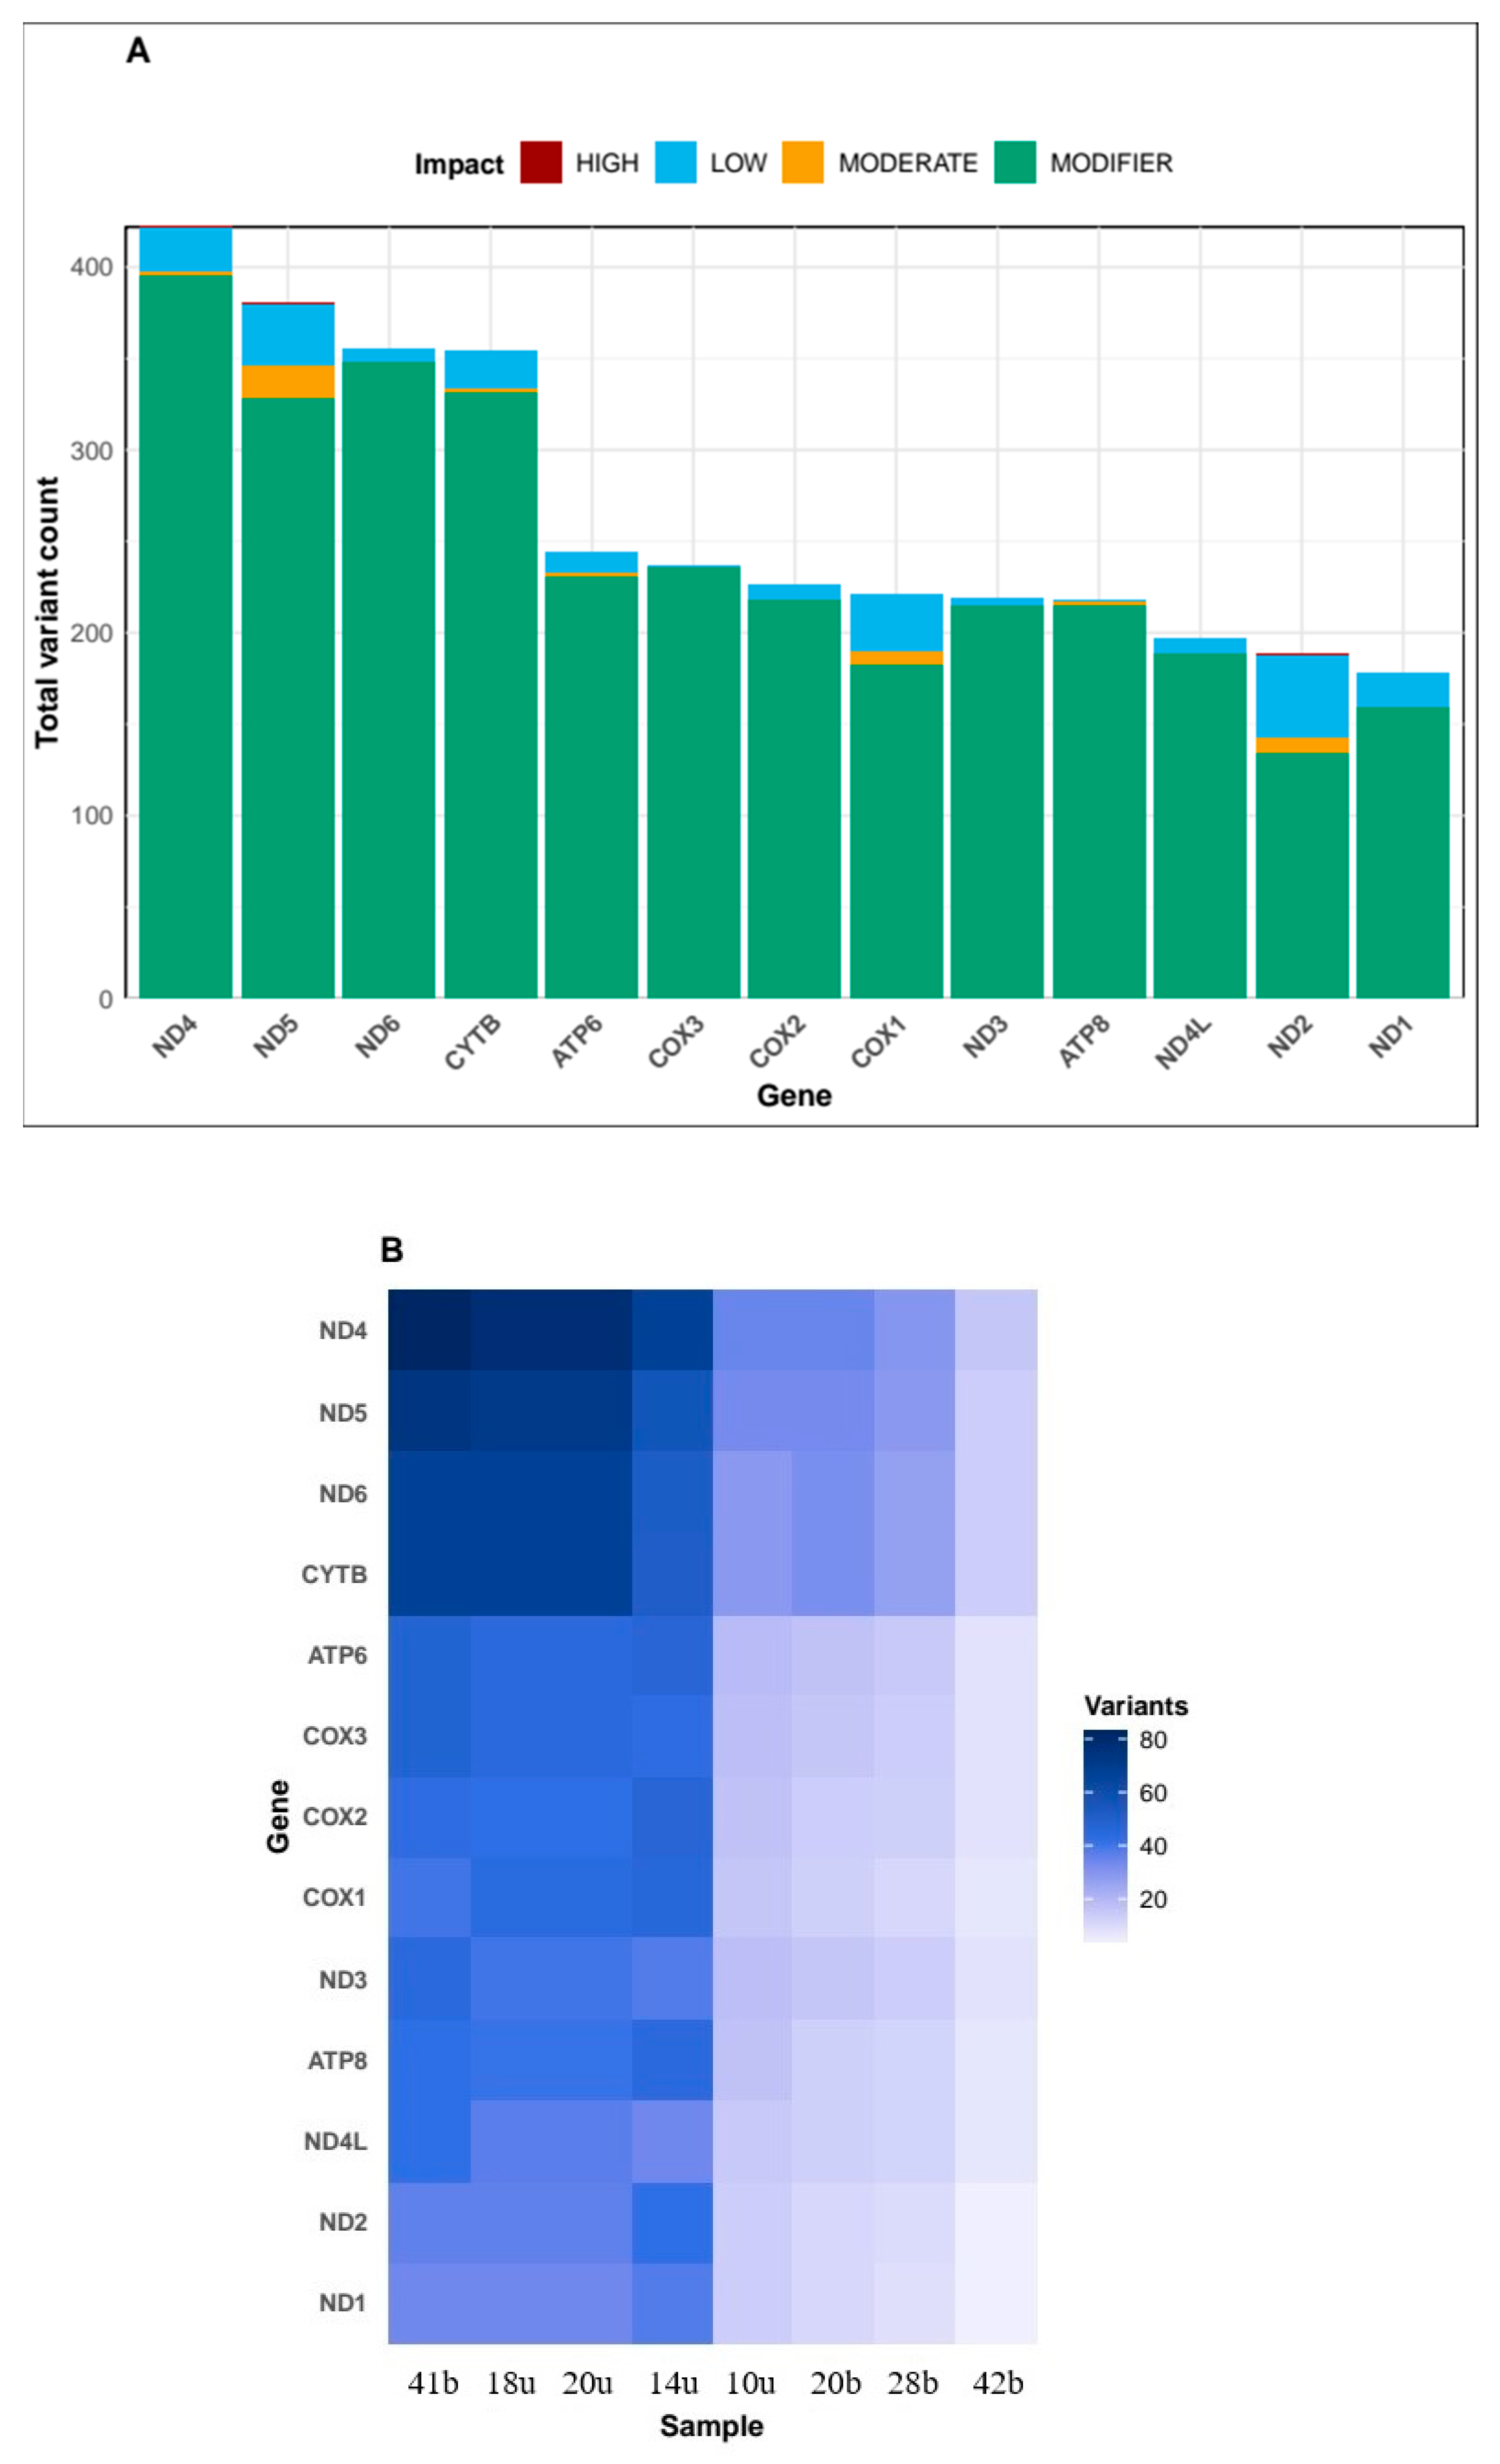
Figure 4.
Phylogenetic trees based on gene alignment of 16S rRNA, Cytb, and RAG2.
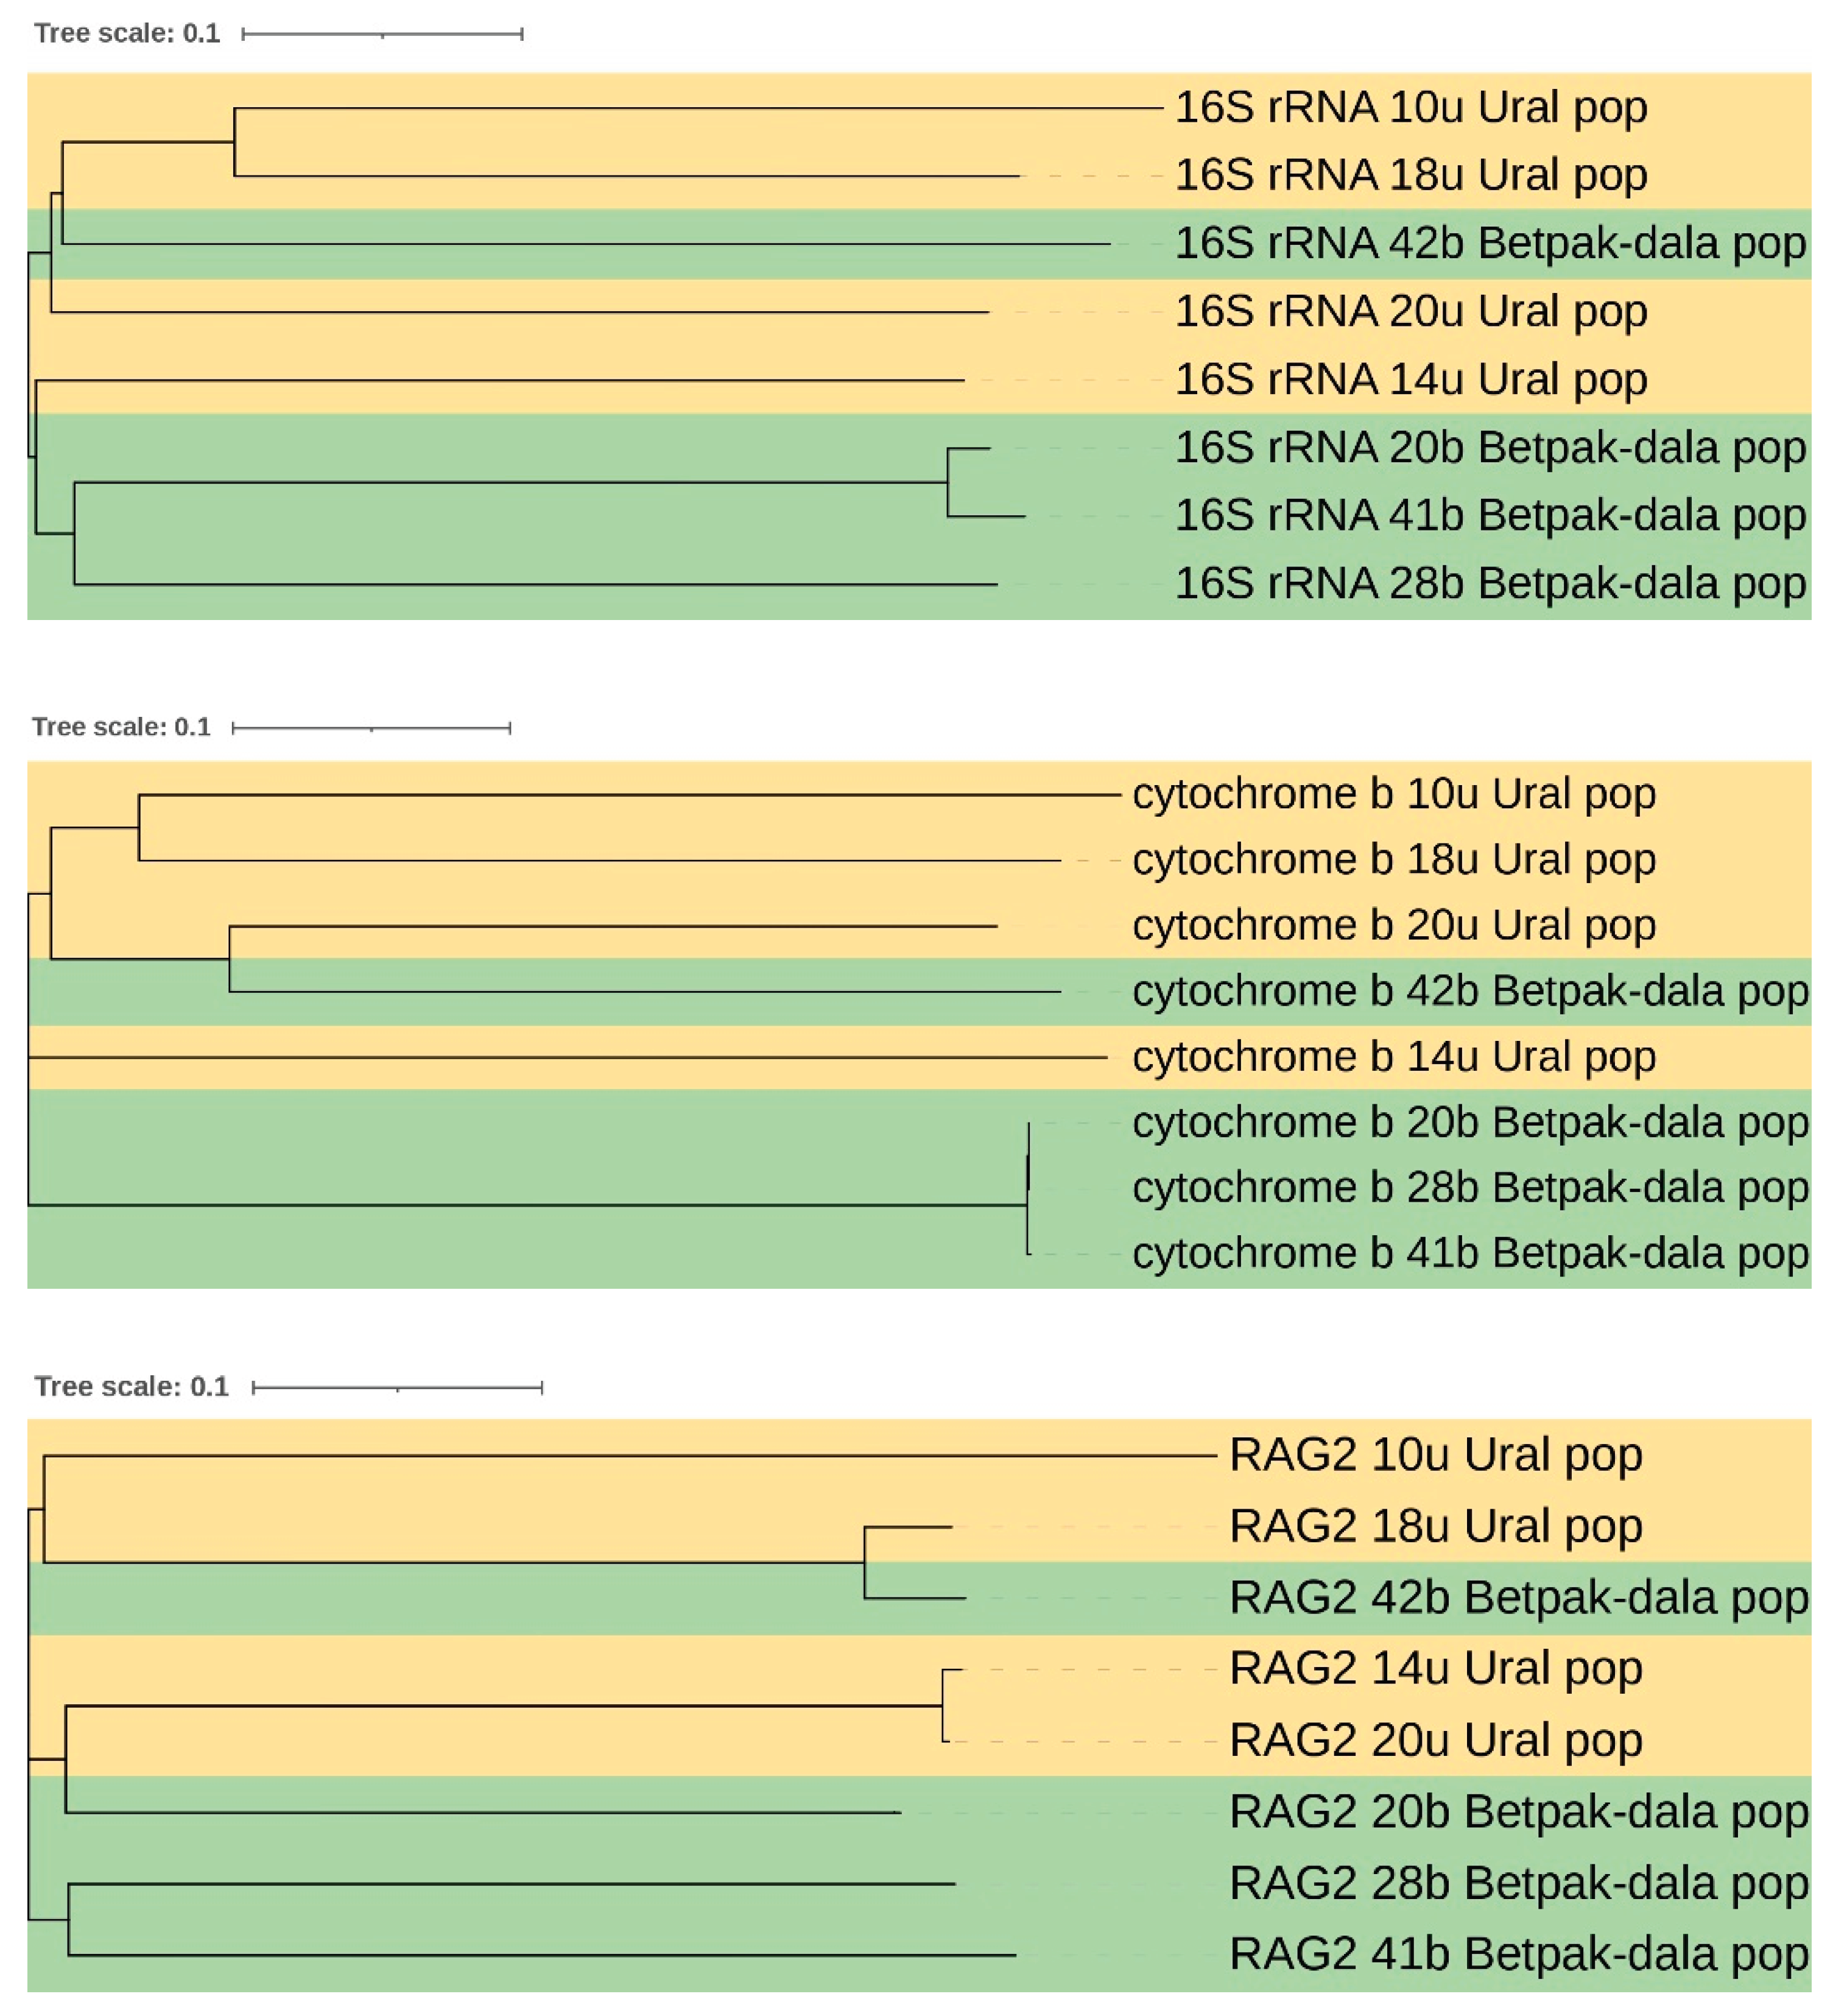
Table 2.
Sample-specific genomic content in S. t. tatarica whole genome sequences.
| Sample ID | Total k-mers | Unique k-mers | Percent unique (%) |
| 10u | 216,751 | 61,095 | 28.19 |
| 14u | 198,414 | 50,700 | 25.55 |
| 18u | 229,716 | 64,426 | 28.05 |
| 20u | 221,489 | 61,019 | 27.55 |
| 20b | 223,576 | 62,011 | 27.74 |
| 28b | 207,013 | 54,384 | 26.27 |
| 41b | 230,539 | 65,689 | 28.49 |
| 42b | 222,589 | 59,762 | 26.85 |
Table 3.
Genomic similarity between S. t. tatarica samples.
| Ranking | Sample pair | Jaccard index | Shared k-mers | Total unique k-mers |
| Most similar 1 | 20b-42b | 0.2890 | 100,027 | 346,138 |
| Most similar 2 | 42b-20u | 0.2889 | 99,528 | 344,550 |
| Most similar 3 | 42b-41b | 0.2877 | 101,235 | 351,893 |
| Least similar 1 | 10u-42b | 0.2785 | 95,694 | 343,646 |
| Least similar 2 | 10u-20b | 0.2791 | 96,081 | 344,246 |
| Least similar 3 | 10u-41b | 0.2803 | 97,918 | 349,372 |
| Average | All pairs | 0.2844 | - | - |
Table 4.
Mapping statistics for S. t. tatarica mitochondrial genome analysis.
| Sample |
Mean coverage |
Mean depth |
Mean baseq |
Mean mapq |
Total reads | Mapped reads |
Mapping rate |
| 10u | 100 | 831.871 | 34.8 | 59.5 | 244 707 792 | 98 095 | 98.79 |
| 14u | 100 | 887.549 | 34.8 | 59.5 | 256 199 931 | 106 036 | 98.82 |
| 18u | 100 | 597.415 | 34.8 | 59.4 | 226 731 405 | 70 796 | 98.5 |
| 20u | 100 | 306.962 | 34.5 | 59.5 | 87 524 401 | 35 609 | 98.68 |
| 20b | 100 | 1048.06 | 34.7 | 59.6 | 253 852 993 | 122 952 | 98.94 |
| 28b | 100 | 461.625 | 34.7 | 59.7 | 97 374 897 | 53 302 | 98.94 |
| 41b | 100 | 395.453 | 35 | 59.6 | 102 013 937 | 45 799 | 98.87 |
| 42b | 100 | 526.15 | 34.6 | 59.5 | 181 278 666 | 61 213 | 98.74 |
Disclaimer/Publisher’s Note: The statements, opinions and data contained in all publications are solely those of the individual author(s) and contributor(s) and not of MDPI and/or the editor(s). MDPI and/or the editor(s) disclaim responsibility for any injury to people or property resulting from any ideas, methods, instructions or products referred to in the content. |
© 2025 by the authors. Licensee MDPI, Basel, Switzerland. This article is an open access article distributed under the terms and conditions of the Creative Commons Attribution (CC BY) license (http://creativecommons.org/licenses/by/4.0/).
Copyright: This open access article is published under a Creative Commons CC BY 4.0 license, which permit the free download, distribution, and reuse, provided that the author and preprint are cited in any reuse.


