
Submitted:
01 August 2025
Posted:
05 August 2025
You are already at the latest version
Abstract
Background: Galectin-3 (Gal-3) levels have been indicated as a promising diagnostic, prognostic, and therapeutic target in breast cancer patients. Serum galectin-3 levels are traditionally measured using manual Enzyme-Linked Immunosorbent Assay (ELISA), but recent automated methods, such as ProteinSimple’s SimplePlex assay run on an Ella instrument, have shown promising evidence of being faster and less error-prone than manual methods. This paper aims to assess whether there are differences in serum galectin-3 measurements between automated and manual ELISA methods. Methods: Galectin-3 serum levels were analyzed from one hundred and five breast cancer samples using both manual ELISA and the Ella instrument. JMP was used to perform paired t-tests and regression analyses. Results: The Ella instrument resulted in significantly lower coefficients of variation (CV), confirming that it is more precise and reliable than manual ELISA methods. There was a moderate correlation between ELISA and Ella measurements (r=0.54), but a paired t-test revealed that automated ELISA using Ella resulted in significantly lower galectin-3 levels compared to manual ELISA (p< 0.0001). Regression analysis showed a significant increase in the difference between Ella and manual ELISA measurements as serum galectin-3 levels increase (p< 0.0001). Conclusions: While the Ella instrument is a fast and reliable tool, the discrepancies between manual ELISA and the Ella instrument in quantifying galectin-3 levels are important to address prior to widespread use.
Keywords:
ELISA
; automated assay
; Ella
; galectin-3
; breast cancer
1. Introduction
Galectins are a family of β-galactoside-binding proteins that modulate immune responses and tissue growth, differentiation, and regeneration [1]. Of the 15 known mammalian galectins, galectin-3 is the only chimera-type with two distinct but homologous carbohydrate recognition domains [2]. Expression of galectin-3 has been identified in many tissues, including the lungs, colon, kidneys, blood, heart, urogenital tracts, reproductive tract, and digestive tracts [3]. Additionally, galectin-3 expression has been demonstrated in myeloid, epithelial, and endothelial cells [4]. Intracellularly, galectin-3 is localized within the cytoplasm, nucleus, cell membrane, and even extracellularly, with some cells exclusively or predominantly expressing the protein in either the nucleus or the cytoplasm, depending on the cell type [5]. Galectin-3 has been implicated across pathologies as an important biomarker and factor in disease processes. Utilizing galectin-3 as a prognostic factor and potential therapeutic target has shown promising results in many diseases, including diabetes, intracerebral hemorrhage, cardiovascular disease, kidney disease, and many types of cancers [6,7,8,9,10,11,12].
Galectins are highly involved in immune system regulation, and galectin-3 is a significant modulator of the signaling pathways governing immune system activation. Galectin-3 is an important modulator of T-cell growth [13]. Previous studies suppressing galectin-3 levels have shown a significant reduction in T-cell proliferation [14]. Additionally, galectin-3 is involved in the activation of mast cells, monocytes, and macrophages as well as facilitating neutrophil invasion through a pro-inflammatory response [2,15,16,17]. Intracellularly, galectin-3 also acts as an important pre-mRNA splicing factor with galectin-1 [18]
In cancer cells, galectin-3 promotes cell survival, growth, and proliferation. Previous studies have consistently shown that galectin-3 is upregulated in many types of cancer, including breast cancer[19]. Galectin-3 is highly expressed in both natural and chemically induced tumors [20]. The exact mechanistic role of galectin-3 has not yet been determined, as galectin-3 is implicated in many signaling pathways involved in breast cancer disease progression, such as the Ras/Raf/MEK/ERK and Notch pathways, which modulate cell survival and metastasis [21]. Angiogenesis, a critical element in metastasis and tumor growth, is also heavily modulated by galectin-3 [22]. In endothelial cells, galectin-3 acts as a scaffolding protein, stabilizing and promoting the vascularization process [21]. Additionally, galectin-3’s activation of the Vascular Endothelial Growth Factor A Receptor 2 (VEGFR2) signal transduction pathway and Jagged-1/NOTCH-1 activation is another mechanism for promoting angiogenesis and metastasis in breast cancers [23].
Galectin-3 plays another crucial role in chemoresistance and tumor survival. Under stressed conditions such as hypoxia and nutrient deficiency, where cancerous cell growth might normally be slowed, upregulation of galectin-3 promotes cell survival and migration to areas with more nutrients and oxygen [21]. When exposed to apoptotic agents such as nitric oxide, galectin-3 overexpression results in higher rates of survival for breast carcinoma cells. Mechanistically, galectin-3 promotes apoptosis resistance in this case by maintaining mitochondrial integrity by inhibiting cytochrome c release and caspase activation, as well as preventing the loss of cell adhesion [24]. Cisplatin, an important therapeutic drug that induces apoptosis in breast cancer cells, is inhibited by high levels of galectin-3 expression [25,26].
As an innate immune regulator, galectin-3 is involved in lymphocyte regulation within the tumor microenvironment to promote immunosuppression. Galectin-3 is implicated in regulating many factors of T-cell receptor signaling [27]. While intracellular galectin-3 inhibits chemotherapeutic-induced apoptosis in tumor cells, extracellular galectin-3 promotes T-cell and thymocyte death by binding to surface glycoproteins [28]. As a mechanism for promoting immunosuppression, galectin-3 suppresses the proliferation of tumor-reactive T cells [29]. Because of its role in immunosuppression, galectin-3 inhibitors have shown promise in early-phase clinical trials as potential immunotherapies across many cancer types [27].
Galectin-3 has also shown promise as a potential biomarker for disease progression. Galectin-3 levels vary across molecular subtypes, with noted upregulation in Triple Negative Breast Cancer [30]. Across breast cancer subtypes, certain cancer-critical gene mutations are correlated with an upregulation of galectin-3 levels, indicating the possibility of utilizing gene panels and galectin levels in tandem to guide treatment options [31]. Galectin-3 levels have also been found to be significantly elevated among patients with invasive ductal carcinoma compared to those with ductal carcinoma in situ [32]. Because of its role in metastasis and chemoresistance, galectin-3 is an important prognostic factor, and its accurate measurement in patients could provide an important guide for selecting treatment plans and predicting treatment response.
Manual ELISA is the traditional method for measuring galectin-3 levels. The four major types of ELISA are direct, indirect, sandwich, and competitive ELISA [33]. There are galectin kits available that utilize each of the types of ELISA, but sandwich ELISA, which sandwiches the target antigen between capture and detection layers of antibodies, is the most often employed [34]. Each type of ELISA presents different disadvantages, such as low sensitivity, high cost, time, cross-reactivity with secondary detection antibodies, and large sample requirements [35]. Manual ELISA introduces variability in results due to human error, including pipetting errors, contamination, incubation time, or temperature differences [36]. The complexity and number of steps involved in manual ELISA result in decreased reliability between tests and testers. Due to limitations in the precision of results as well as the high time and sample requirements, automated machines have been developed to carry out ELISA tests.
Researchers are increasingly moving towards automated assays for measuring galectin-3 in favor of efficiency and accuracy. The ARCHITECT assay has proven to be both cost-effective and reliable in producing results similar to those in traditional manual ELISA when measuring galectin-3 in heart failure patients [37,38]. ProteinSimple, under Biotechne, has developed an automated immunoassay platform called SimplePlex, which is run on an Ella instrument. Ella is capable of running a simultaneous analysis of up to four analytes and up to seventy-two samples in a single run [39]. Due to its automated nature, Ella reduces sample volume, run time, and manual steps, which not only increases efficiency but also reduces potential sources of error [40]. Each cartridge features a built-in calibration curve, eliminating the need for manual creation of calibration curves, which is typically required for traditional ELISA. The SimplePlex runner then automatically calculates the concentrations of the desired target from these calibration curves. In traditional ELISA, multiplexing, measuring multiple analytes in a single experiment, usually reduces the sensitivity of the measurements due to cross-reactivity between analytes [39]. The microfluidic channels of the Ella cartridges separate each analyte during multiplexing, which eliminates the possibility of cross-reactivity and maintains a high level of sensitivity [41]. Previous studies have shown that SimplePlex analysis with Ella maintains a high level of reproducibility between days and users, making it a highly reliable analysis method [39].
While measuring galectin-3 using manual ELISA compared with the automated SimplePlex analysis on Ella has yet to be done, Ella has shown promising results when measuring other biomarkers. In healthy volunteers, ELISA and Ella showed good concordance in measuring MCP-1/CCL2, VEGF-A, TNF-α, and IL-6 levels [40]. Additionally, Ella possesses higher sensitivity than manual ELISA while minimizing the sample, time, and manual step requirements as well as test-retest and user variability. Another study found agreement between manual ELISA and Ella in immunoglobulin G and antidrug antibody quantification [41]. This study noted that Ella possesses a wider assay range, facilitating a more dynamic range of measurements that it can collect. Additionally, ELISA and Ella possess similar levels of precision in the drug quantification assay, but Ella exhibits significantly higher precision in the immune complex assay. Within healthy women participating in breast cancer prevention trials, adiponectin and leptin levels show good agreement between manual ELISA and automated Ella measurements [42]. However, as the leptin measurements increase, there is a greater difference between Ella and ELISA measurements, with Ella measurements being greater on average than ELISA measurements. As adiponectin measurements increase, there is a greater difference between Ella and ELISA measurements, with Ella measurements being lower on average than ELISA measurements at high adiponectin levels. This indicates a possible overestimation of leptin levels and an underestimation of adiponectin levels at higher values [42]. These variations in ELISA and Ella levels highlight the importance of understanding the comparisons between performing ELISA and Ella to ensure accurate data collection for patients.
This paper aims to compare the serum galectin-3 levels of breast cancer patients with manual ELISA and automated Simple Plex with the Ella instrument. This addresses a gap in current research related to the comparison between manual ELISA and automated ELISA using an Ella instrument when measuring galectin-3 levels in breast cancer patients. With clinical researchers increasingly looking towards galectins as potential cancer biomarkers or therapy targets, it is imperative to understand the differences between these two methods.
2. Materials and Methods
2.1. Sample Collection
One hundred and five breast cancer serum samples were obtained from Prisma Health Cancer Institute’s (PHCI) Biorepository. Patients signed a consent form at the time of sample collection. Patient sample data is included in the supplementary data section.
2.2. ELISA
Serum galectin-3 levels were measured in July of 2022 using enzyme-linked immunosorbent assay (ELISA) kits from R&D Systems (Minneapolis, MN, USA). The procedure can be found at: https://www.rndsystems.com/products/human-galectin-3-quantikine-elisa-kit_dgal30#assay-procedure. ELISA was measured in duplicate for all samples. Ninety-six samples had coefficients of variation (CV) less than 10%, and there was one outlier, so ninety-five samples were included for the data analysis.
2.3. Ella
Galectin-3 levels of each serum sample were also analyzed using Simple Plex human galectin-3 cartridges on an Ella instrument, both from ProteinSimple (San Jose, CA, USA) within Biotechne (Minneapolis, MN, USA). The procedure can be found at: https://www.bio-techne.com/pdf-download-arena-document/user-manual/w-doc-0009/24. Ella was measured in triplicate for all samples. All samples had a CV less than 10%.
2.4. Data Analysis
Data analysis was performed using JMP Pro 17, a software developed by the SAS Institute (Cary, NC, USA). Figures were generated using Prism, which is a part of GraphPad Software Version 10.4.2 (Boston, MA, USA). Differences in serum galectin-3 levels were compared using a paired t-test and a least-squares regression line.
3. Results
3.1. Data Overview
Table 1 shows the overall distribution of serum galectin-3 levels determined using the two techniques for the ninety-five samples with a CV less than 10%. The average Ella measurements for serum galectin-3 levels were lower than the ELISA measurements.
3.2. Assay Precision
When performing ELISA analysis, CV values are used to quantify the variability in measurements due to the duplicate or triplicate nature of such analyses. Lower CV values indicate higher reproducibility and higher precision. CV less than 10% is the typical standard for intra-assay values, and CV less than 15% for inter-assay values. Table 2 shows the distribution of CV values between manual ELISA and automated Ella techniques. On average, Ella resulted in significantly lower CV values (p<0.001). These results are consistent with previous findings that Ella is significantly more precise than manual ELISA methods [40].
3.3. Comparison of ELISA and Ella Measurements
Pearson’s r coefficient was used to assess the strength of correlation between manual ELISA and automated Ella estimates of serum galectin-3 levels. The correlation coefficient was r = 0.54, indicating a moderate correlation between ELISA and Ella estimates of serum galectin-3 levels. Figure 1 shows the line of best fit of the ELISA and Ella measurements. The spread of data around the best fit line indicates a moderate positive correlation between ELISA and Ella measurements of serum galectin-3 levels.
Galectin-3 levels measured using ELISA and Ella were compared with a paired t-test. The mean difference was 5.19 ng/mL with a 95% confidence interval of (-6.57–-3.80). On average, Ella resulted in a significantly lower recorded serum galectin-3 level than ELISA (p<0.0001). The difference remained significant across all ELISA and Ella plates, with no significant difference found between plates. Even when only data points with a CV less than 5% (N = 56) are included in the sample, the paired t-test still yields a significant difference between ELISA and Ella test results (p<0.0001). Among samples with CV less than 5%, there was a mean difference of - 4.79 ng/mL with a 95% confidence interval of (-6.67–-2.91). As the serum galectin-3 level increases, there seems to be a greater difference between the Ella and ELISA levels, as shown in the Bland-Altman Plot in Figure 2.
3.4. ELISA and Ella Measurements: Regression Line
To quantify the apparent greater difference between ELISA and Ella measurements as serum galectin-3 levels increase, a least-squares regression line was fitted to the data. A significant relationship was found with, on average, an increase of 0.92 ng/mL (p<0.0001) in the difference between ELISA and Ella measurements for each 1 ng/mL increase in mean serum galectin-3 levels. The R2 of this model is 0.5093, indicating that approximately 50.93% of the variance in the difference between ELISA and Ella measurements could be attributed to differences in the mean serum galectin-3 level. Figure 3 shows the fitted regression line with an increasing difference between the two techniques associated with an increasing mean serum galectin-3 level.
When a least squares regression line is fitted to only measurements with %CV less than 5%, a significant relationship is maintained. For each 1 ng/mL increase in the mean serum galectin-3 level between the two techniques, there is an approximately 0.86 ng/mL increase in the difference between ELISA and Ella values (p<0.0001). The R2 of this model is 0.5257, indicating that approximately 52.57% of the variance in the difference between ELISA and Ella measurements could be attributed to differences in the mean serum galectin-3 level. Figure 4 shows the fitted regression line with an increasing difference between the two techniques associated with an increasing mean serum galectin-3 level, in agreement with Figure 3.
4. Discussion
4.1. Study Findings
In concordance with previous studies, our findings confirm that the Ella instrument results in significantly lower CV values, making it a more reliable and precise measurement technique than traditional manual ELISA methods.
This study found that there is a significant difference between the manual ELISA and automated Ella results for serum galectin-3 levels in the same sample, with Ella on average resulting in significantly lower galectin-3 measurements than manual ELISA. This deviates from the results found in another study that compared different proteins in healthy controls using both Ella and manual ELISA. In that study, Ella accurately quantified protein levels consistent with manual ELISA [40].
A significant relationship was found between an increasing mean serum galectin-3 level and an increasing difference between ELISA and Ella levels. This is similar to previous findings on adiponectin levels using both ELISA and Ella, which found an increasing difference in ELISA and Ella measurements at higher adiponectin concentrations [42]. When the %CV threshold is relaxed from less than 5% to less than 10%, the slope of the fitted-least squares regression increases. This suggests that additional, more variable data show greater divergence between ELISA and Ella measurements at higher concentrations.
4.2. Implications
Due to the rising clinical importance of galectin-3 in breast cancer pathways, automation of analysis methods is an important investment [30]. These findings underscore the need for standardization across galectin-3 assays, as researchers and clinicians may draw different conclusions solely based on the analytical method used. Additionally, if galectin-3 is used as a diagnostic or prognostic biomarker, different ELISA methods could result in different conclusions due to the divergence between methods. Because of the speed of analysis and higher precision of results, the automated Ella instrument is a promising tool for ensuring precise, replicable analysis of critical cancer biomarkers. This is the first study to date to compare the Ella instrument with traditional manual ELISA methods for quantifying galectin-3. This marks a crucial step towards the possibility of utilizing automated methods to measure galectin-3 in breast cancer patients as a potential diagnostic, prognostic, and therapeutic target.
4.3. Limitations
Despite interesting differences between ELISA and Ella measurements of galectin-3 levels, it is not possible to discern from the results of this study whether Ella is underestimating ELISA or ELISA is overestimating Ella. Additionally, due to the lack of control samples, it isn’t possible to determine whether these findings are unique to breast cancer patients or indicative of a universal discrepancy between Ella and ELISA measurements of galectin-3 levels. Additionally, this sample size was constrained by sample availability in the Prisma Health Cancer Institute Biorepository. Repeating this analysis with a larger sample size would provide greater statistical power. If galectin-3 levels are to be used for diagnostic purposes or as therapeutic targets, more analysis must be done to determine which method provides the most accurate analysis.
4.4. Future Direction
Future studies should continue to analyze discrepancies in protein measurements to evaluate whether this is unique to the Ella instrument and galectin-3 levels or whether discrepancies are found among other instruments and proteins. Additionally, exploring whether these results are maintained for other cancer types and among control samples is an important direction for future research.
5. Conclusions
The speed, reproducibility, and lower susceptibility to errors of the Ella instrument represent its promising potential as a tool for assessing biomarkers in breast cancer patients. However, understanding the cause of the differences between manual ELISA and Ella measurements is imperative for accurate assessment of galectin-3 levels in breast cancer patients.
Supplementary Materials
The following supporting information can be downloaded at the website of this paper posted on Preprints.org. Figure S1: title; Table S1: title; Video S1: title.
Author Contributions
Conceptualization, E.G.M., S.H., and A.V.B..; methodology, E.G.M., S.H., D.H.A., and A.V.B.; validation, E.G.M. and S.H.; formal analysis, E.M. and S.H.; investigation, E.G.M., S.H., D.H.A., J.C.M, W.J.E., and A.V.B.; resources, J.C.M., W.J.E., and A.V.B.; data curation, E.G.M., S.H., J.C.M., and A.V.B.; writing—original draft preparation, E.G.M.; writing—review and editing, E.G.M., S.H., D.H.A., J.C.M., W.J.E., and A.V.B.; visualization, E.G.M.; supervision, A.V.B.; project administration, A.V.B.; funding acquisition, A.V.B. All authors have read and agreed to the published version of the manuscript.
Funding
This research was funded by the Prisma Health transformative seed grant. S.H. and D.H.A. were funded by 2024 Summer Scholar stipends through the SOARinG Research Program at the University of South Carolina School of Medicine Greenville. The APC was funded by the Department of Biomedical Sciences at the University of South Carolina School of Medicine Greenville.
Institutional Review Board Statement
Ethical review and approval were waived for this study, which is nonhuman subject research and therefore does not require IRB approval. The study was approved by the Tissue Utilization Committee per the IRB-approved biorepository protocol and SOPs (IRB #Pro00069834).
Informed Consent Statement
Informed consent was obtained from all subjects involved in the study.
Data Availability Statement
The data presented in this study are available in this article.
Acknowledgments
The authors thank the Prisma Health Cancer Institute’s biorepository staff for assistance with acquisition of the patient sera samples.
Conflicts of Interest
The authors declare no conflicts of interest. The funders had no role in the design of the study; in the collection, analyses, or interpretation of data; in the writing of the manuscript; or in the decision to publish the results.
Abbreviations
The following abbreviations are used in this manuscript:
| ELISA | Enzyme Linked Immunosorbent Assay |
| Gal-3 | Galectin-3 |
| CV | Coefficient of Variation |
| Ras | Rat Sarcoma |
| Raf | Rapidly Accelerated Fibrosarcoma |
| ERK | Extracellular Signal-Regulated Kinase |
| MEK | Mitogen-Activated Protein Kinase Kinase |
| VEGFR2 | Vascular Endothelial Growth Factor A Receptor 2 |
| MCP-1 | Monocyte Chemoattractant Protein-1 |
| CCL2 | Chemokine (C-C motif) Ligand 2 |
| VEGF-A | Vascular Endothelial Growth Factor A |
| TNF-α | Tumor Necrosis Factor Alpha |
| IL-6 | Interleukin-6 |
References
- Liu, F. Intracellular functions of galectins. Biochim. Biophys. Acta (BBA)-Gen. Subj. 2002, 1572, 263–273. [Google Scholar] [CrossRef]
- Nio-Kobayashi, J. Tissue- and cell-specific localization of galectins, β-galactose-binding animal lectins, and their potential functions in health and disease. Anat. Sci. Int. 2016, 92, 25–36. [Google Scholar] [CrossRef]
- Díaz-Alvarez, L.; Ortega, E. The Many Roles of Galectin-3, a Multifaceted Molecule, in Innate Immune Responses against Pathogens. Mediat. Inflamm. 2017, 2017, 1–10. [Google Scholar] [CrossRef] [PubMed]
- Anadón, A.; Castellano, V.; Martínez-Larrañaga, M.R. (2014). Chapter 55—Biomarkers in drug safety evaluation. In R. C. Gupta (Ed.), Biomarkers in Toxicology (pp. 923–945). Academic Press. [CrossRef]
- Haudek, K.C.; Spronk, K.J.; Voss, P.G.; Patterson, R.J.; Wang, J.L.; Arnoys, E.J. Dynamics of galectin-3 in the nucleus and cytoplasm. Biochim. et Biophys. Acta (BBA) - Gen. Subj. 2010, 1800, 181–189. [Google Scholar] [CrossRef] [PubMed]
- Li, Y.; Li, T.; Zhou, Z.; Xiao, Y. Emerging roles of Galectin-3 in diabetes and diabetes complications: A snapshot. Rev. Endocr. Metab. Disord. 2022, 23, 569–577. [Google Scholar] [CrossRef]
- Yan, X.-J.; Yu, G.-F.; Jie, Y.-Q.; Fan, X.-F.; Huang, Q.; Dai, W.-M. Role of galectin-3 in plasma as a predictive biomarker of outcome after acute intracerebral hemorrhage. J. Neurol. Sci. 2016, 368, 121–127. [Google Scholar] [CrossRef]
- Blanda, V.; Bracale, U.M.; Di Taranto, M.D.; Fortunato, G. Galectin-3 in Cardiovascular Diseases. Int. J. Mol. Sci. 2020, 21, 9232. [Google Scholar] [CrossRef] [PubMed]
- Boutin, L.; Dépret, F.; Gayat, E.; Legrand, M.; Chadjichristos, C.E. Galectin-3 in Kidney Diseases: From an Old Protein to a New Therapeutic Target. Int. J. Mol. Sci. 2022, 23, 3124. [Google Scholar] [CrossRef]
- Aureli, A.; Del Cornò, M.; Marziani, B.; Gessani, S.; Conti, L. Highlights on the Role of Galectin-3 in Colorectal Cancer and the Preventive/Therapeutic Potential of Food-Derived Inhibitors. Cancers 2022, 15, 52. [Google Scholar] [CrossRef] [PubMed]
- Blair, B.B.; Funkhouser, A.T.; Goodwin, J.L.; Strigenz, A.M.; Chaballout, B.H.; Martin, J.C.; Arthur, C.M.; Funk, C.R.; Edenfield, W.J.; Blenda, A.V. Increased Circulating Levels of Galectin Proteins in Patients with Breast, Colon, and Lung Cancer. Cancers 2021, 13, 4819. [Google Scholar] [CrossRef]
- Gomes, T.S.; Oshima, C.T.F.; Forones, N.M.; Lima, F.D.O.; Ribeiro, D.A. Expression of galectin-3 in gastric adenocarcinoma. Indian J. Med. Res. 2014, 140, 69–76. [Google Scholar] [PubMed]
- Yang, R.Y.; Hsu, D.K.; Liu, F.T. Expression of galectin-3 modulates T-cell growth and apoptosis. Proc. Natl. Acad. Sci. 1996, 93, 6737–6742. [Google Scholar] [CrossRef] [PubMed]
- Joo, H.-G.; Goedegebuure, P.S.; Sadanaga, N.; Nagoshi, M.; von Bernstorff, W.; Eberlein, T.J. Expression and function of galectin-3, a β-galactoside-binding protein in activated T lymphocytes. J. Leukoc. Biol. 2001, 69, 555–564. [Google Scholar] [CrossRef] [PubMed]
- Frigeri, L.G.; Zuberi, R.I.; Liu, F.T. .epsilon.BP, a.beta.-galactoside-binding animal lectin, recognizes IgE receptor (Fc.epsilon.RI) and activates mast cells. Biochemistry 1993, 32, 7644–7649. [Google Scholar] [CrossRef] [PubMed]
- Dragomir, A.-C.D.; Sun, R.; Choi, H.; Laskin, J.D.; Laskin, D.L. Role of Galectin-3 in Classical and Alternative Macrophage Activation in the Liver following Acetaminophen Intoxication. J. Immunol. 2012, 189, 5934–5941. [Google Scholar] [CrossRef] [PubMed]
- Yamaoka, A.; Kuwabara, I.; Frigeri, L.G.; Liu, F.T. A human lectin, galectin-3 (epsilon bp/Mac-2), stimulates superoxide production by neutrophils. J. Immunol. 1995, 154, 3479–3487. [Google Scholar] [CrossRef]
- Dagher, S.F.; Wang, J.L.; Patterson, R.J. Identification of galectin-3 as a factor in pre-mRNA splicing. Proc. Natl. Acad. Sci. 1995, 92, 1213–1217. [Google Scholar] [CrossRef] [PubMed]
- Blair, B.B.; Funkhouser, A.T.; Goodwin, J.L.; Strigenz, A.M.; Chaballout, B.H.; Martin, J.C.; Arthur, C.M.; Funk, C.R.; Edenfield, W.J.; Blenda, A.V. Increased Circulating Levels of Galectin Proteins in Patients with Breast, Colon, and Lung Cancer. Cancers 2021, 13, 4819. [Google Scholar] [CrossRef]
- Raz, A.; Lotan, R. Endogenous galactoside-binding lectins: a new class of functional tumor cell surface molecules related to metastasis. Cancer Metastasis Rev. 1987, 6, 433–452. [Google Scholar] [CrossRef]
- Cardoso, A.C.F.; Andrade, L.N.d.S.; Bustos, S.O.; Chammas, R. Galectin-3 Determines Tumor Cell Adaptive Strategies in Stressed Tumor Microenvironments. Front. Oncol. 2016, 6, 127. [Google Scholar] [CrossRef] [PubMed]
- Funasaka, T.; Raz, A.; Nangia-Makker, P. Galectin-3 in angiogenesis and metastasis. Glycobiology 2014, 24, 886–891. [Google Scholar] [CrossRef]
- Cano, I.; Hu, Z.; AbuSamra, D.B.; Saint-Geniez, M.; Ng, Y.S.E.; Argüeso, P.; D’aMore, P.A. Galectin-3 Enhances Vascular Endothelial Growth Factor-A Receptor 2 Activity in the Presence of Vascular Endothelial Growth Factor. Front. Cell Dev. Biol. 2021, 9. [Google Scholar] [CrossRef]
- Moon, B.-K.; Lee, Y.J.; Battle, P.; Jessup, J.M.; Raz, A.; Kim, H.-R.C. Galectin-3 Protects Human Breast Carcinoma Cells against Nitric Oxide-Induced Apoptosis: Implication of Galectin-3 Function during Metastasis. Am. J. Pathol. 2001, 159, 1055–1060. [Google Scholar] [CrossRef] [PubMed]
- Wang, Y.; Nangia-Makker, P.; Balan, V.; Hogan, V.; Raz, A. Calpain activation through galectin-3 inhibition sensitizes prostate cancer cells to cisplatin treatment. Cell Death Dis. 2010, 1, e101–e101. [Google Scholar] [CrossRef] [PubMed]
- Wang, H.; Guo, S.; Kim, S.-J.; Shao, F.; Ho, J.W.K.; Wong, K.U.; Miao, Z.; Hao, D.; Zhao, M.; Xu, J.; et al. Cisplatin prevents breast cancer metastasis through blocking early EMT and retards cancer growth together with paclitaxel. Theranostics 2021, 11, 2442–2459. [Google Scholar] [CrossRef] [PubMed]
- Farhad, M.; Rolig, A.S.; Redmond, W.L. The role of Galectin-3 in modulating tumor growth and immunosuppression within the tumor microenvironment. OncoImmunology 2018, 7, e1434467. [Google Scholar] [CrossRef]
- Stillman, B.N.; Hsu, D.K.; Pang, M.; Brewer, C.F.; Johnson, P.; Liu, F.-T.; Baum, L.G. Galectin-3 and Galectin-1 Bind Distinct Cell Surface Glycoprotein Receptors to Induce T Cell Death. J. Immunol. 2006, 176, 778–789. [Google Scholar] [CrossRef]
- Melief, S.M.; Visser, M.; van der Burg, S.H.; Verdegaal, E.M.E. IDO and galectin-3 hamper the ex vivo generation of clinical grade tumor-specific T cells for adoptive cell therapy in metastatic melanoma. Cancer Immunol. Immunother. 2017, 66, 913–926. [Google Scholar] [CrossRef]
- Zhang, H.; Liang, X.; Duan, C.; Liu, C.; Zhao, Z.; Glynn, S.A. Galectin-3 as a Marker and Potential Therapeutic Target in Breast Cancer. PLOS ONE 2014, 9, e103482. [Google Scholar] [CrossRef] [PubMed]
- Funkhouser, A.T.; Strigenz, A.M.; Blair, B.B.; Miller, A.P.; Shealy, J.C.; Ewing, J.A.; Martin, J.C.; Funk, C.R.; Edenfield, W.J.; Blenda, A.V. KIT Mutations Correlate with Higher Galectin Levels and Brain Metastasis in Breast and Non-Small Cell Lung Cancer. Cancers 2022, 14, 2781. [Google Scholar] [CrossRef]
- Markalunas, E.G.; Arnold, D.H.; Funkhouser, A.T.; Martin, J.C.; Shtutman, M.; Edenfield, W.J.; Blenda, A.V. Correlation Analysis of Genetic Mutations and Galectin Levels in Breast Cancer Patients. Genes 2024, 15, 818. [Google Scholar] [CrossRef]
- Alhajj, M. , Zubair, M., & Farhana, A. (2025). Enzyme Linked Immunosorbent Assay. In StatPearls. StatPearls Publishing. http://www.ncbi.nlm.nih. 5559. [Google Scholar]
- Engvall, E. The ELISA, Enzyme-Linked Immunosorbent Assay. Clin. Chem. 2010, 56, 319–320. [Google Scholar] [CrossRef]
- Shah, K.; Maghsoudlou, P. Enzyme-linked immunosorbent assay (ELISA): the basics. Br. J. Hosp. Med. 2016, 77, C98–C101. [Google Scholar] [CrossRef]
- Aydin, S. A short history, principles, and types of ELISA, and our laboratory experience with peptide/protein analyses using ELISA. Peptides 2015, 72, 4–15. [Google Scholar] [CrossRef] [PubMed]
- Gruson, D.; Mancini, M.; Ahn, S.; Rousseau, M. Measurement of Galectin-3 with the ARCHITECT assay: Clinical validity and cost-effectiveness in patients with heart failure. Clin. Biochem. 2014, 47, 1006–1009. [Google Scholar] [CrossRef] [PubMed]
- Meijers, W. (2019). Circulating factors in heart failure: Biomarkers, markers of co-morbidities and disease factors. [Groningen]: Rijksuniversiteit Groningen.
- Aldo, P.; Marusov, G.; Svancara, D.; David, J.; Mor, G. Simple Plex™: A Novel Multi-Analyte, Automated Microfluidic Immunoassay Platform for the Detection of Human and Mouse Cytokines and Chemokines. Am. J. Reprod. Immunol. 2016, 75, 678–693. [Google Scholar] [CrossRef] [PubMed]
- Dysinger, M.; Marusov, G.; Fraser, S. Quantitative analysis of four protein biomarkers: An automated microfluidic cartridge-based method and its comparison to colorimetric ELISA. J. Immunol. Methods 2017, 451, 1–10. [Google Scholar] [CrossRef] [PubMed]
- Wessels, U.; Mackeben, K.; Stubenrauch, K. Use of Ella ® to Facilitate drug Quantification and Antidrug Antibody Detection in Preclinical Studies. Bioanalysis 2019, 11, 153–164. [Google Scholar] [CrossRef]
- Macis, D.; Aristarco, V.; Johansson, H.; Guerrieri-Gonzaga, A.; Raimondi, S.; Lazzeroni, M.; Sestak, I.; Cuzick, J.; DeCensi, A.; Bonanni, B.; et al. A Novel Automated Immunoassay Platform to Evaluate the Association of Adiponectin and Leptin Levels with Breast Cancer Risk. Cancers 2021, 13, 3303. [Google Scholar] [CrossRef]
Figure 1.
Best fit line of ELISA and Ella serum galectin-3 measurements with CV less than 10%.
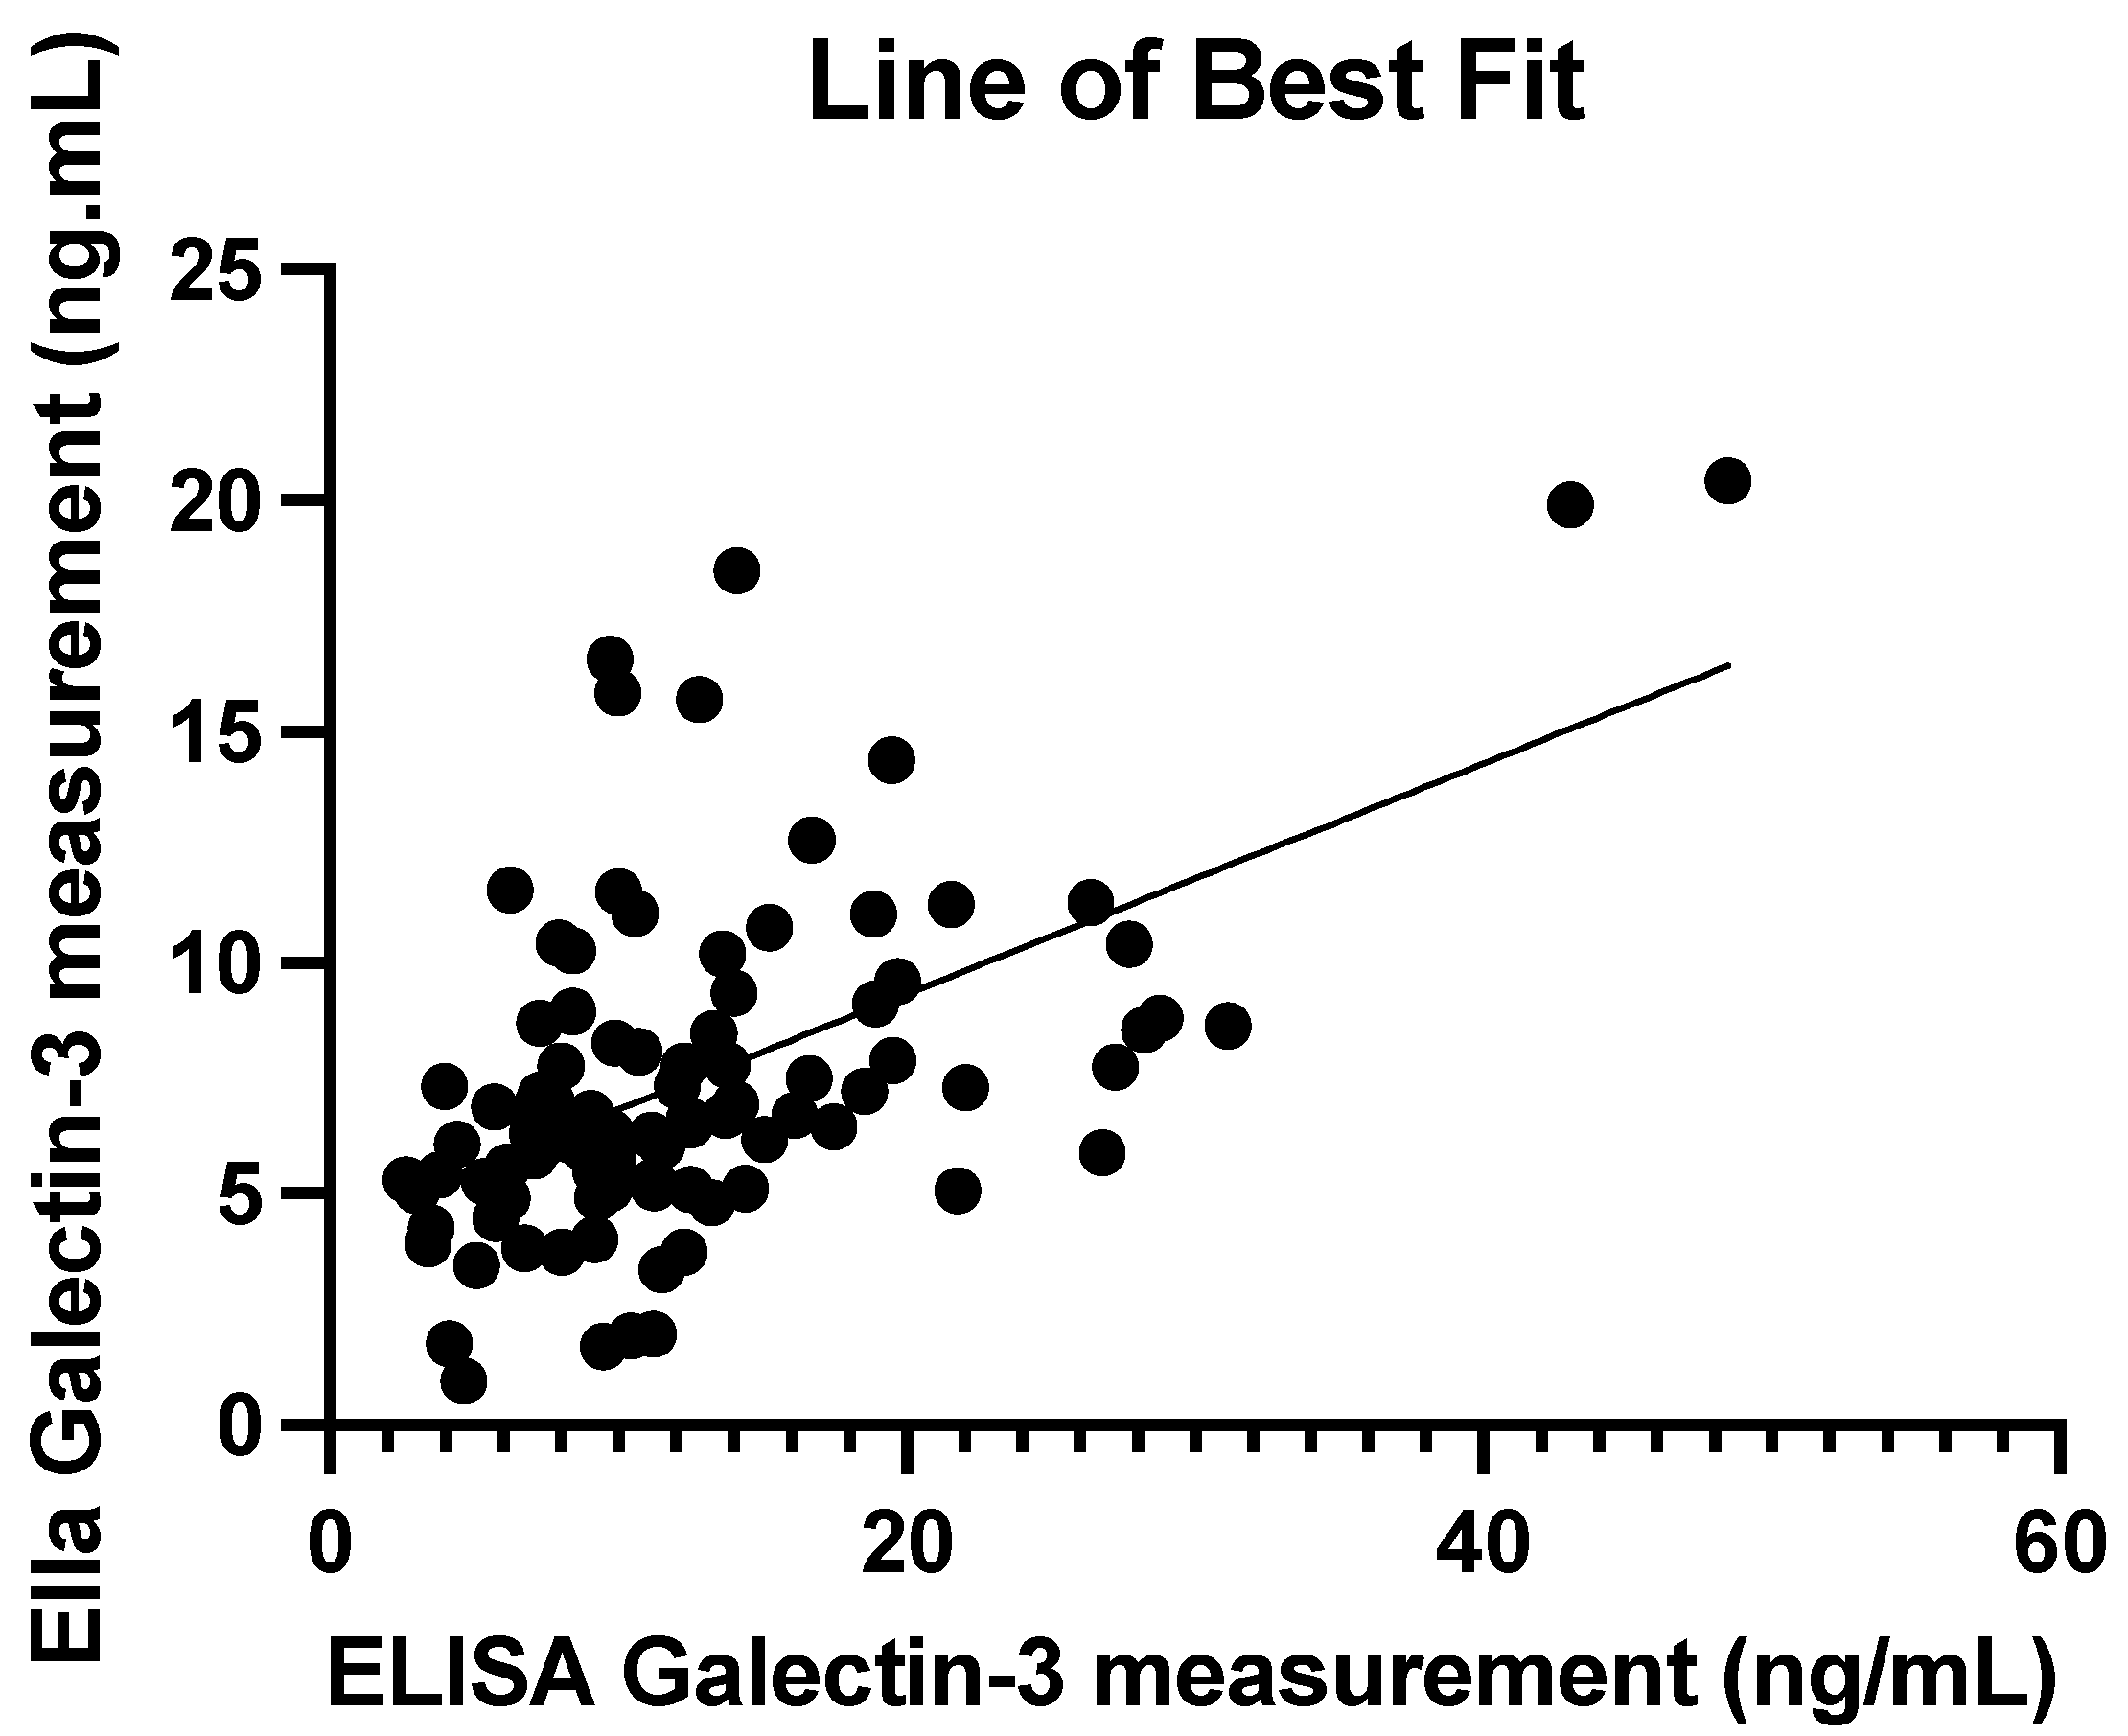
Figure 2.
Bland-Altman Plot comparing the average serum galectin-3 levels between Ella and ELISA measurements with the differences between the two techniques.
Figure 2.
Bland-Altman Plot comparing the average serum galectin-3 levels between Ella and ELISA measurements with the differences between the two techniques.
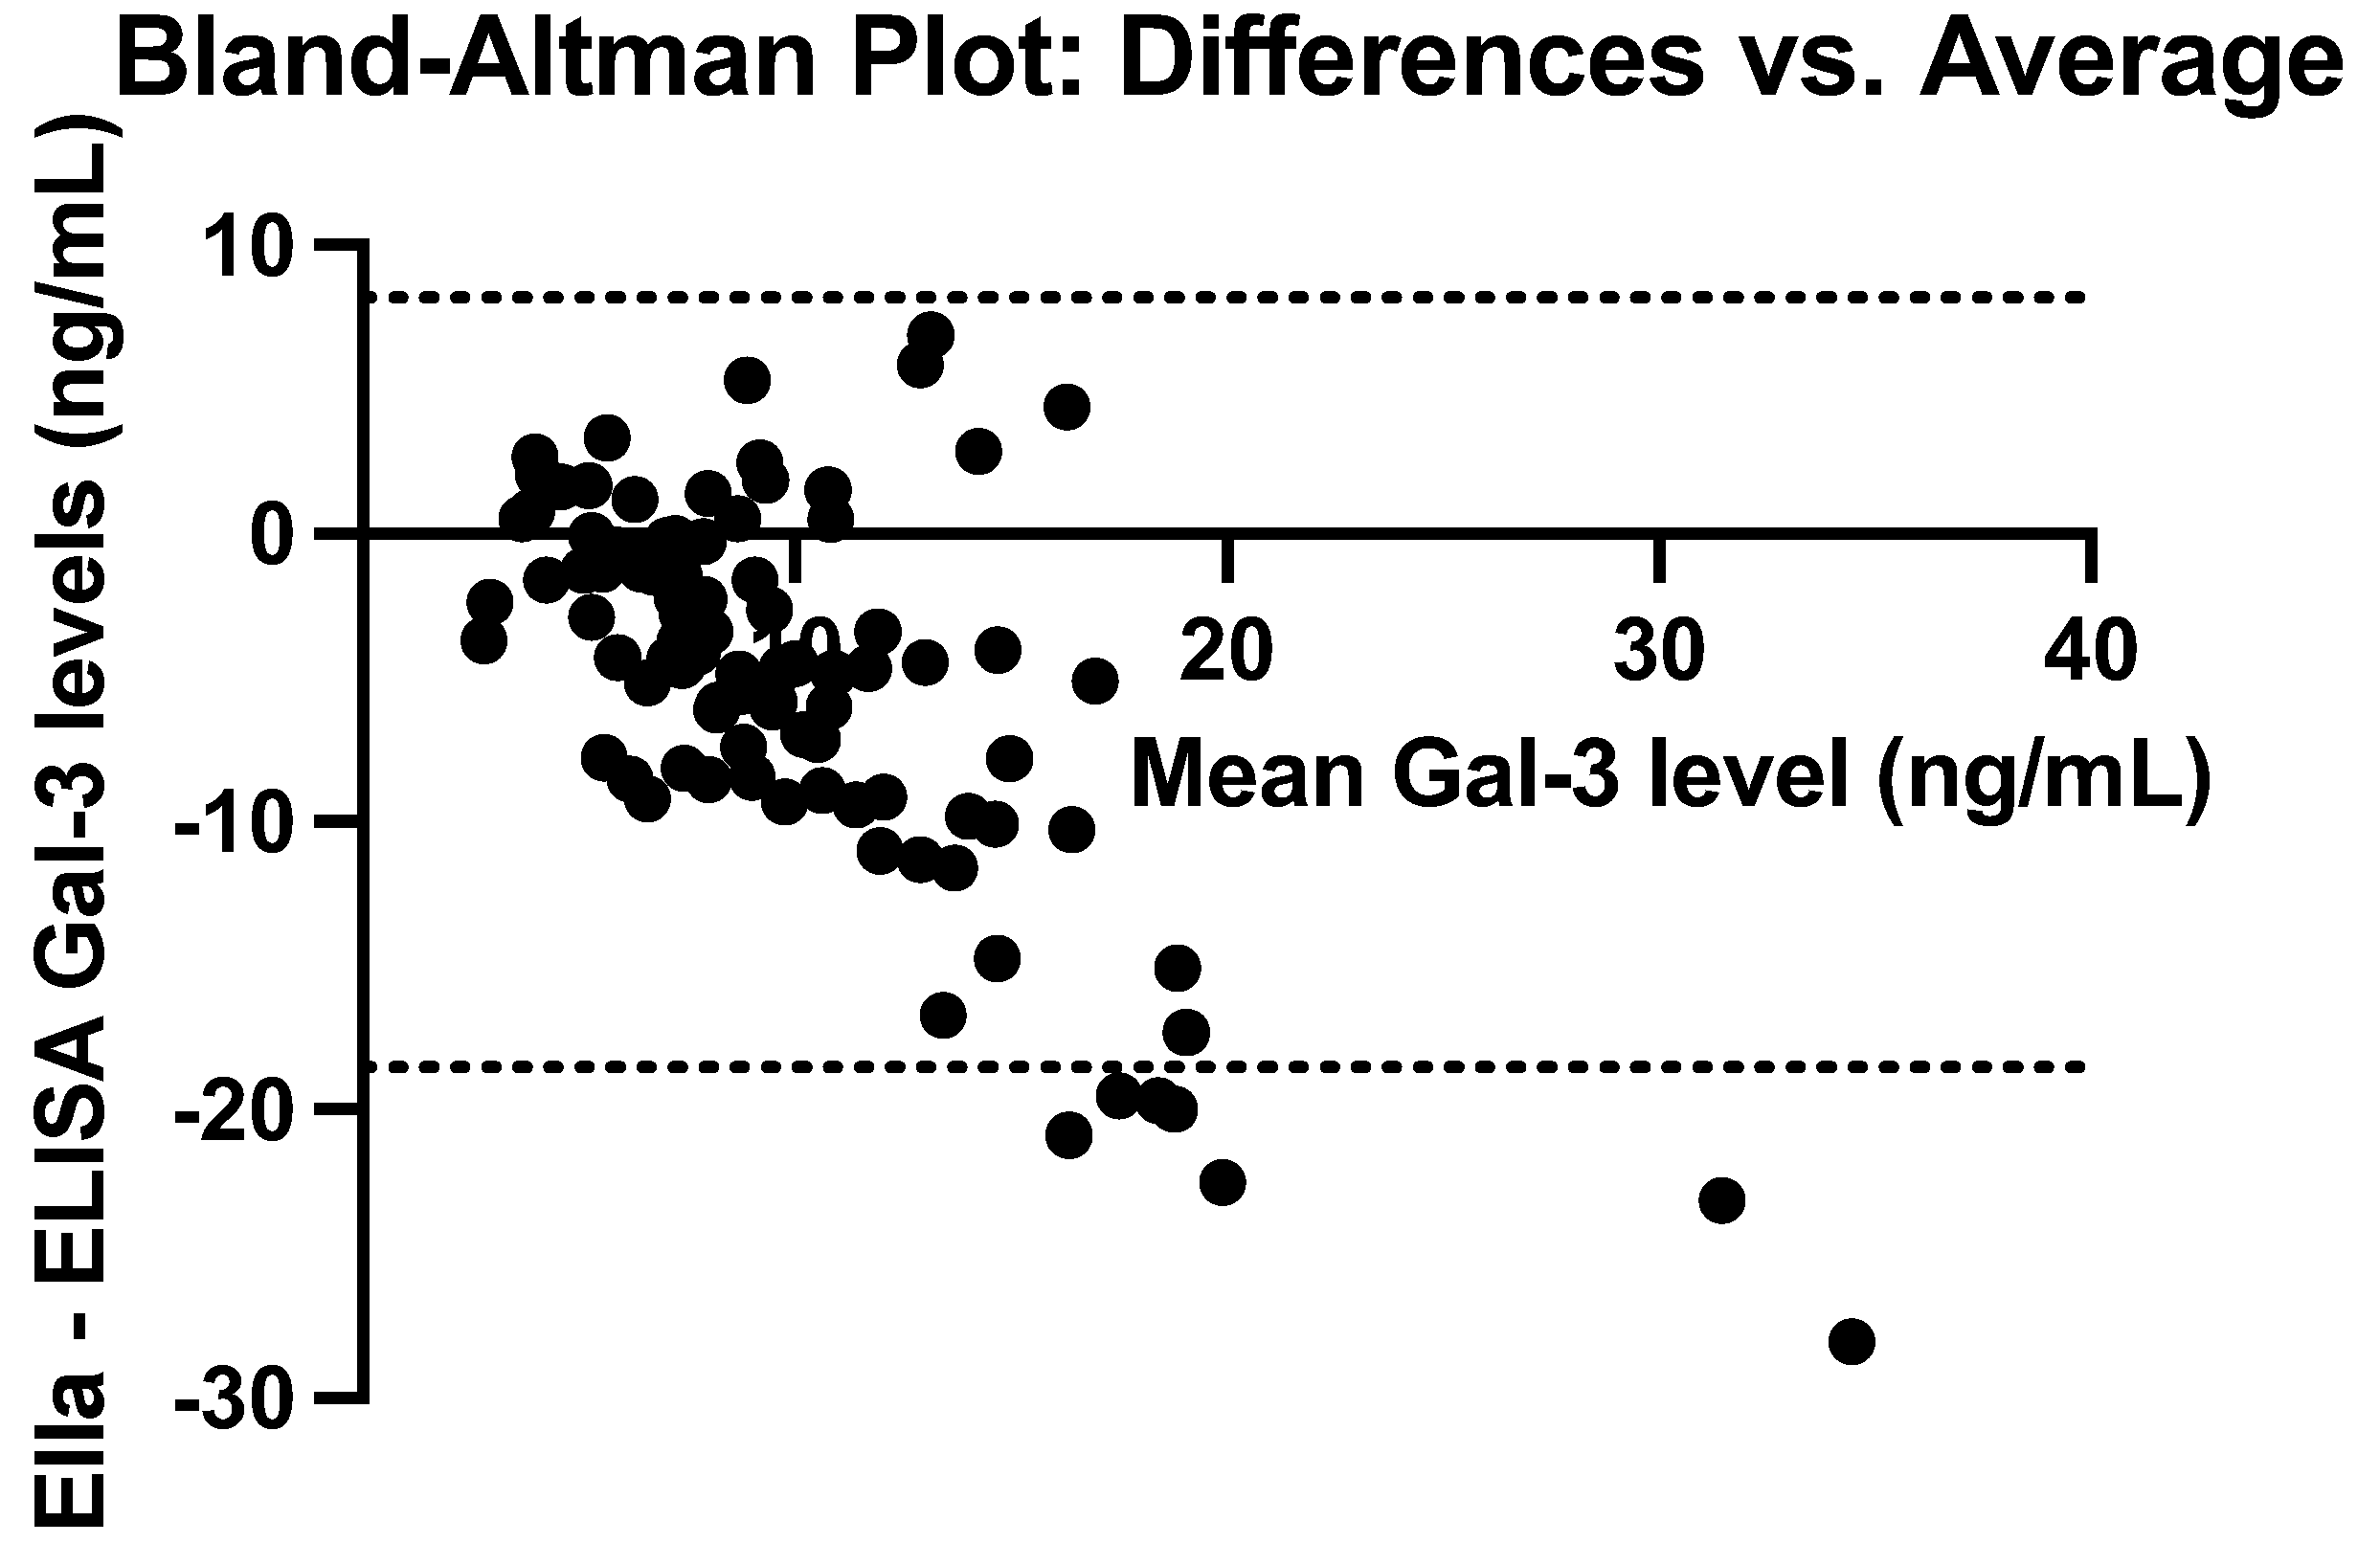
Figure 3.
A fitted least-squares regression line between mean serum galectin-3 levels and the difference between Ella and ELISA values with %CV<10%. Slope estimate = 0.92 (p<0.0001).
Figure 3.
A fitted least-squares regression line between mean serum galectin-3 levels and the difference between Ella and ELISA values with %CV<10%. Slope estimate = 0.92 (p<0.0001).
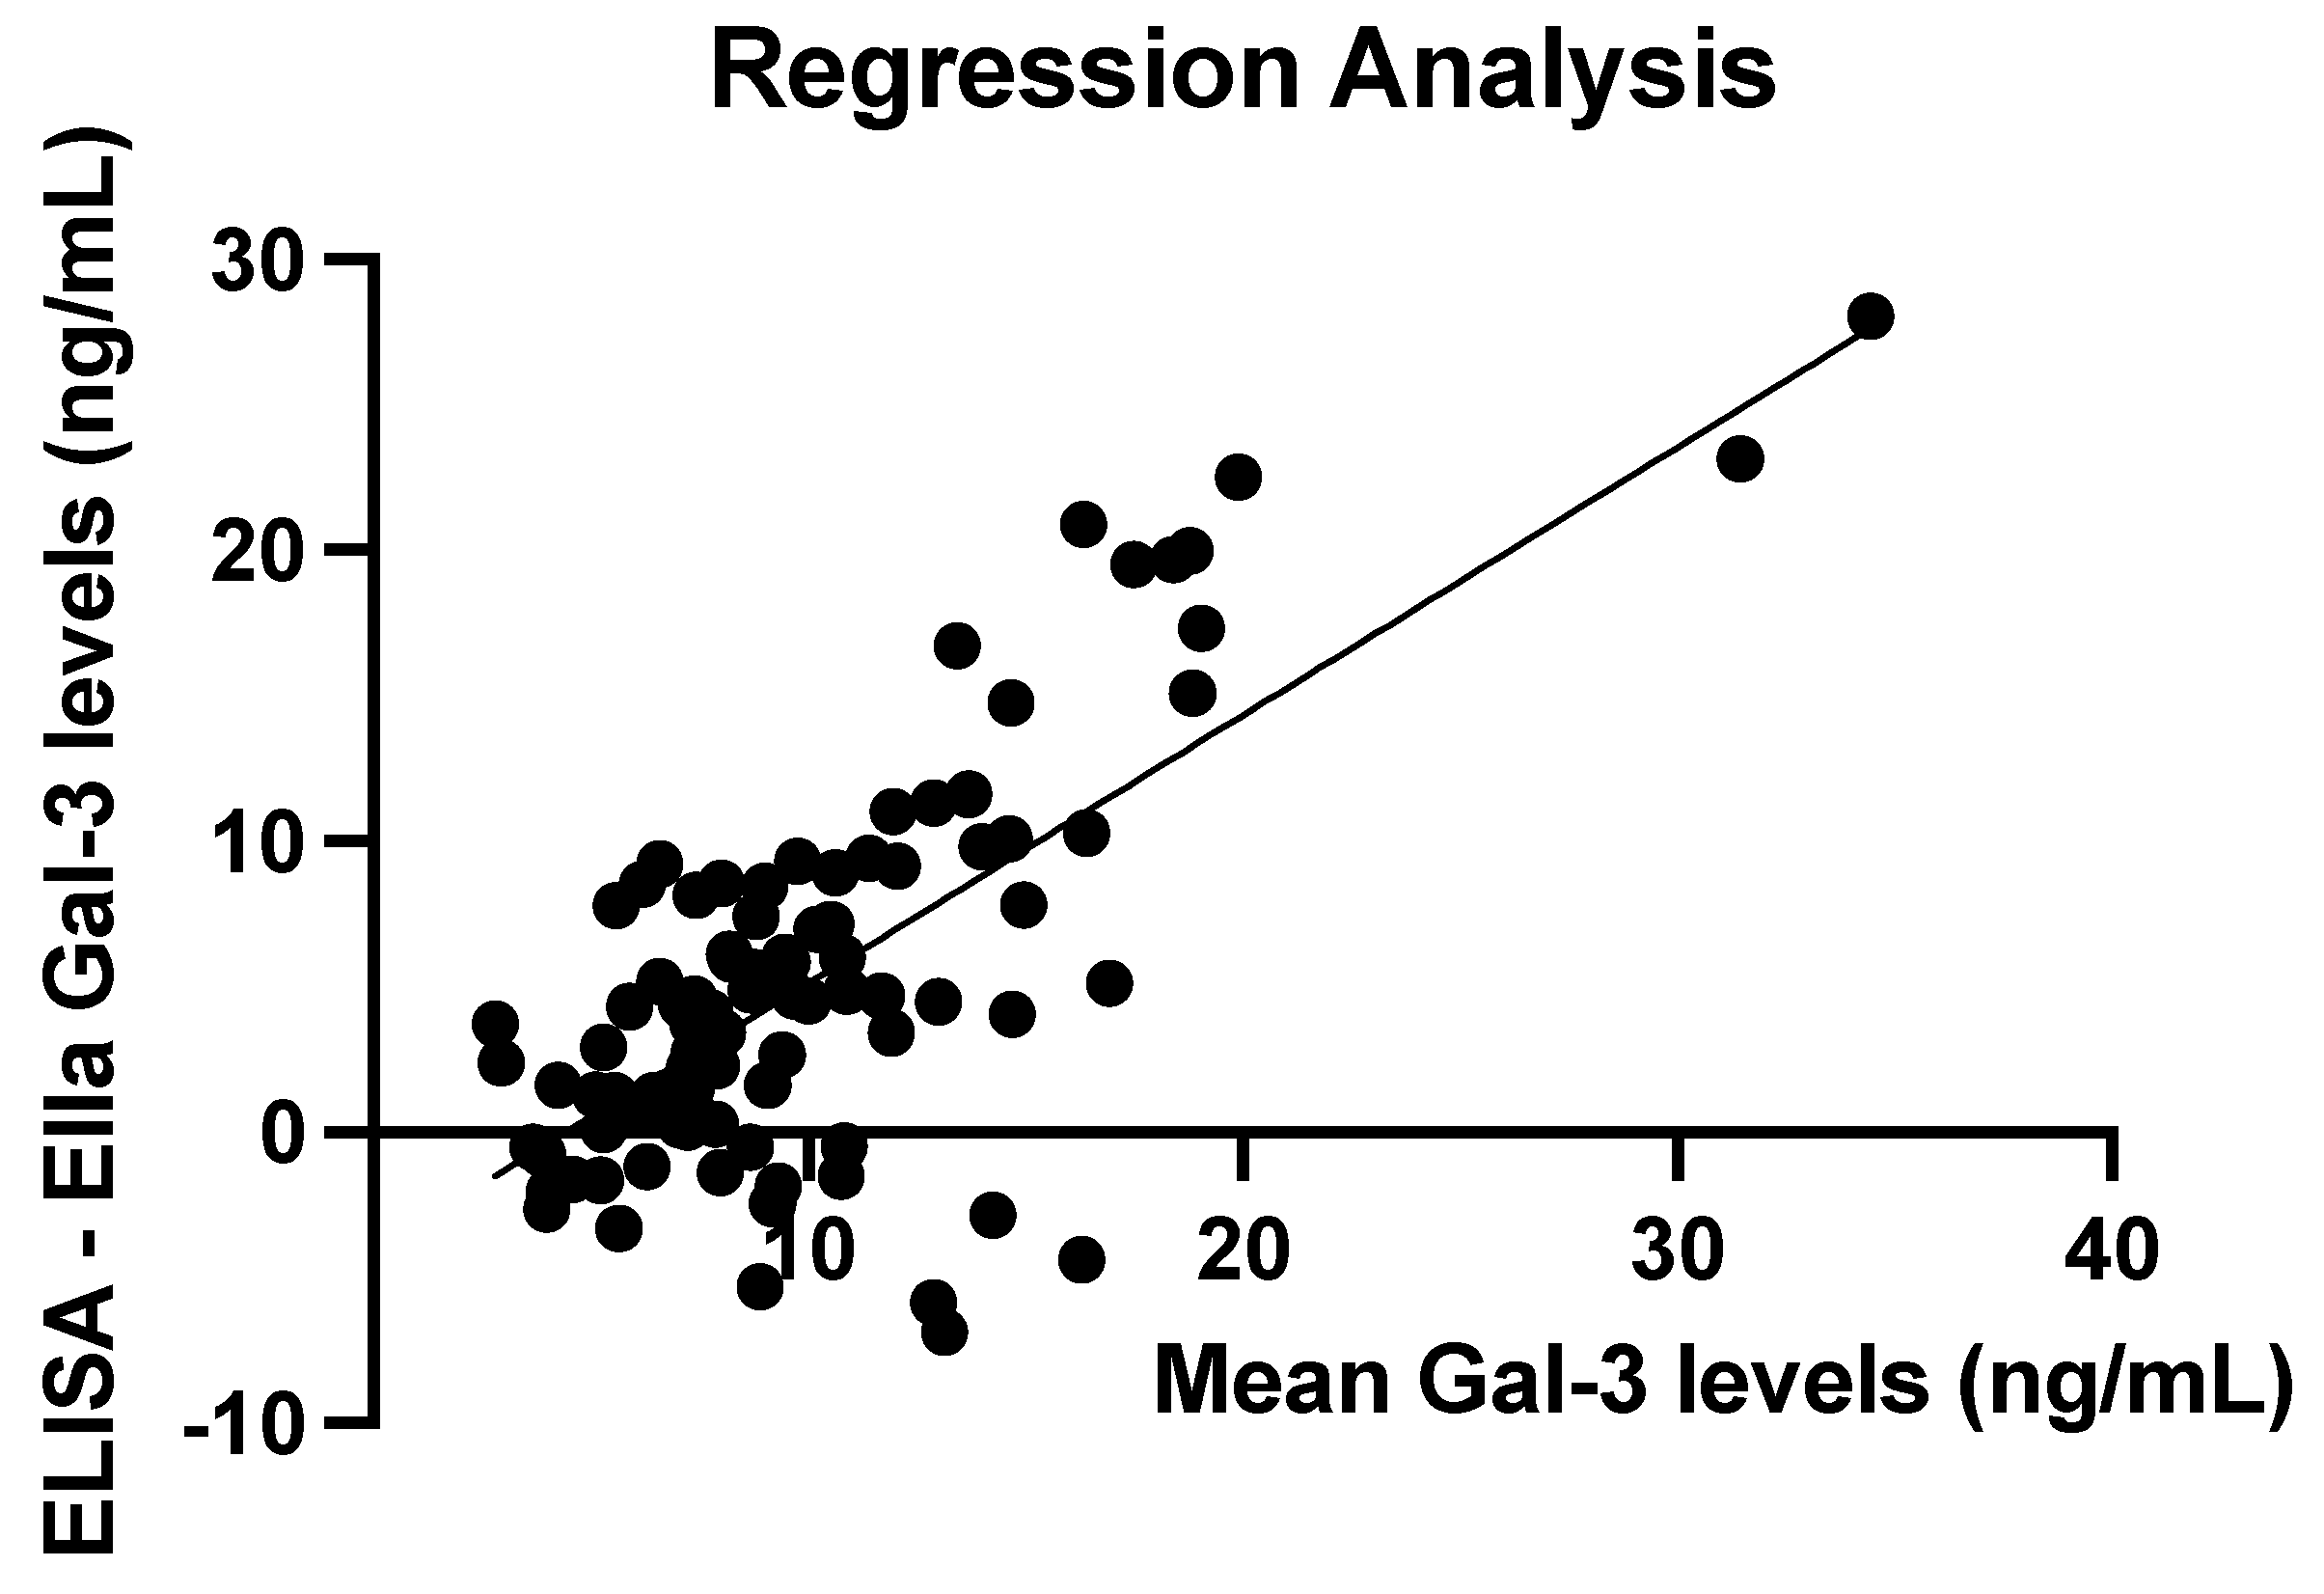
Figure 4.
A fitted least-squares regression line between mean serum galectin-3 levels and the difference between Ella and ELISA values with %CV<5%. Slope estimate = 0.86 (p<0.0001).
Figure 4.
A fitted least-squares regression line between mean serum galectin-3 levels and the difference between Ella and ELISA values with %CV<5%. Slope estimate = 0.86 (p<0.0001).
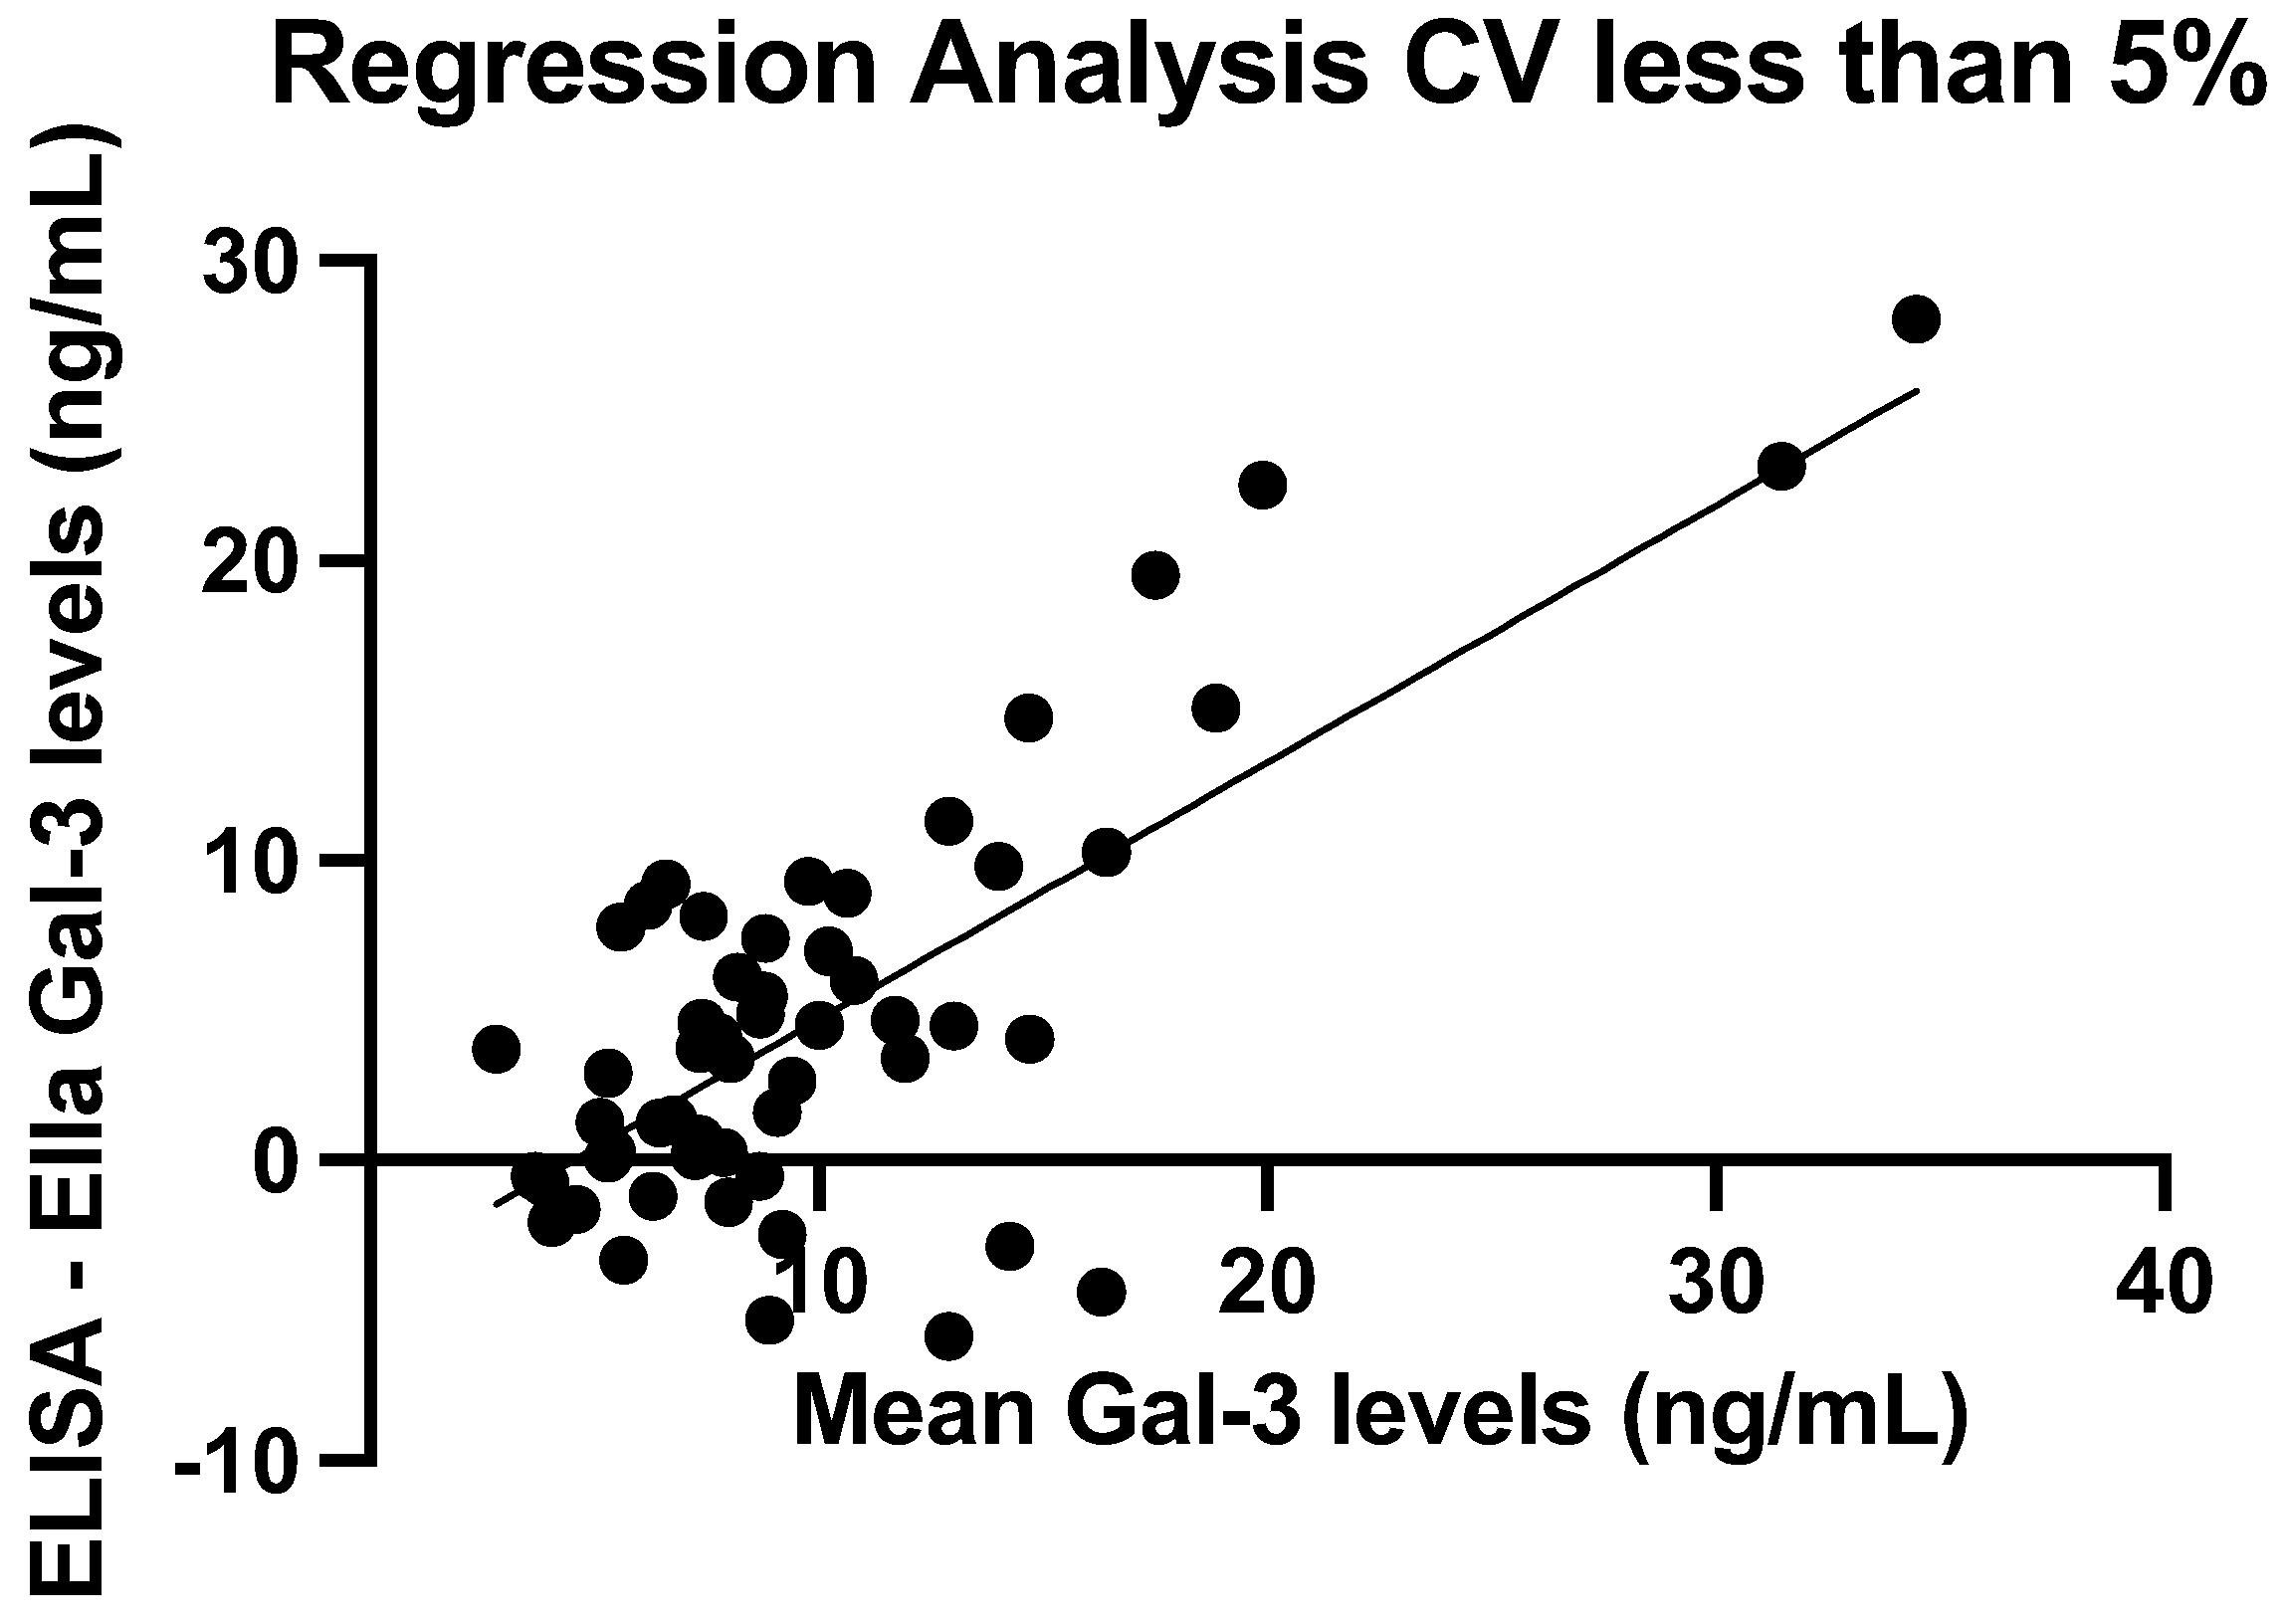

Table 1.
Summary statistics of galectin-3 concentrations measured using ELISA and Ella.
| Mean (ng/mL) | SD (ng/mL) | Median (ng/mL) | IQR (ng/mL) | Min–Max (ng/mL) | |
|---|---|---|---|---|---|
| ELISA | 12.68 | 8.07 | 10.59 | 7.43–15.10 | 2.65–48.48 |
| Ella | 7.49 | 3.71 | 6.70 | 5.20–8.80 | 0.95–20.43 |
| ELISA—Ella | -5.19 | 6.81 | -4.32 | -8.54–-0.30 | -28.06–6.88 |
Table 2.
Summary statistics of CV values with ELISA and Ella.
| Mean (%) | SD (%) | Median (%) | IQR (%) | Min–Max (%) | |
|---|---|---|---|---|---|
| ELISA | 7.50 | 13.78 | 4.75 | 1.85–7.82 | 0.17–127.84 |
| Ella | 2.41 | 1.46 | 2.10 | 1.37–3.27 | 0.19–6.86 |
Disclaimer/Publisher’s Note: The statements, opinions and data contained in all publications are solely those of the individual author(s) and contributor(s) and not of MDPI and/or the editor(s). MDPI and/or the editor(s) disclaim responsibility for any injury to people or property resulting from any ideas, methods, instructions or products referred to in the content. |
© 2025 by the authors. Licensee MDPI, Basel, Switzerland. This article is an open access article distributed under the terms and conditions of the Creative Commons Attribution (CC BY) license (http://creativecommons.org/licenses/by/4.0/).
Copyright: This open access article is published under a Creative Commons CC BY 4.0 license, which permit the free download, distribution, and reuse, provided that the author and preprint are cited in any reuse.


