Submitted:
01 August 2025
Posted:
04 August 2025
You are already at the latest version
Abstract
Rapid urbanization has highlighted the importance of sustainable and equitable urban green infrastructure, notably schoolyard greening, as a means of improving public health, resilience, and social equity. Despite methodological developments in measuring the impact of green spaces on property values, major gaps and inconsistencies remain. This critical review systematically examines recent methodological developments in urban green space and schoolyard greening research, focusing on quantitative approaches such as hedonic pricing models, spatial econometrics, and machine learning, as well as the incorporation of remote sensing and GIS data. Significant gaps include a lack of longitudinal and mixed- methods research, an insufficient emphasis on schoolyard-specific interventions, and an underrepresentation of equality, justice, and Global South contexts. The review promotes consistent measuring frameworks, increased transparency, and the incorporation of qualitative and participative methodologies. Future research on urban greening and property outcomes should be more methodologically rigorous, inclusive, and policy relevant, according to the recommendations.
Keywords:
urban green space
; schoolyard greening
; hedonic pricing model
; spatial econometrics
; machine learning
; Geographic information systems (GIS)
; remote sensing
; property value
; urban equity
; methodological review
; participatory methods
; longitudinal analysis
; Global South
1. Introduction
To establish sustainable, healthy, and equitable urban environments, it is essential to implement initiatives such as schoolyard greening and the development of urban green spaces, including parks and vegetation. As urban areas globally expand, planners, legislators, and communities will increasingly vie for space and resources. To create resilient cities, it is essential to strategically develop green infrastructure (Chen et al., 2022; Droj et al., 2024). Green spaces are vital for ecology as they regulate temperature and provide habitats. They enhance resilience, facilitate interpersonal relationships, and promote public health (Setiowati et al., 2024). Enhancing schoolyards through greening is a straightforward although underutilized method to elevate community health and the quality of educational environments (Li et al., 2025).
Urban greening offers benefits that extend beyond environmental enhancement and aesthetic appeal. Green spaces influence property values, which then impact investment trends, community development, and, in certain instances, gentrification. Therefore, these processes must be considered in the formulation of urban equity and social policy (Brander and Koetse, 2016; Zhang et al., 2022). Rising property values can enhance municipal revenue from taxes and encourage public investment. Nonetheless, they may increase expenses and risk the displacement of existing residents, particularly in rapidly growing urban areas (Caprioli et al., 2023; Ledraa & Aldubikhi, 2025). Consequently, local governments and community organizations are increasingly endeavoring to find out the impact of urban green areas, particularly the greening of schoolyards, on property values.
Although the expansion of studies regarding the correlation between urban green spaces and property values, methodological issues and limitations persist. Numerous research employing different versions of the hedonic price model (HPM) utilize traditional regression techniques. Although these methodologies are beneficial, they frequently overlook the intricate definitions and assessments of "greenness" employed by researchers, as well as its regional variability (Setiowati et al., 2024; Ben et al., 2023). Currently, a small cohort of academics is employing advanced spatial and statistical methodologies to address these issues, such as spatial regression, geographically weighted regression (GWR), and machine learning. Nevertheless, these approaches are somewhat uncommon (Chen, Lin et al., 2022; Droj et al., 2024).
Most of the study concentrates on large parks or general green spaces, thereby neglecting the methodological limitations and opportunities associated with schoolyard greening. The lack of generalization of findings or the development of targeted strategies is limited by inadequate attention (Ewane et al., 2023). Insufficient research in the Global South and particular urban areas exacerbates the issue by developing uncertainty over the efficacy of current treatments in varied circumstances.
Researchers measure green space by various approaches, such as proximity analysis, remote sensing indices (e.g., NDVI), and subjective quality evaluations, which may provide conflicting outcomes (Zhang et al., 2022; Lieber, 2022). The combination of diverse data sources, including municipal records, satellite imagery, household surveys, and interviews, offers innovative prospects; yet it causes concerns regarding policy relevance, transparency, and data comparability (Chen, Yao et al., 2020; Droj et al., 2024). The methodological inconsistencies underscore the necessity for a comprehensive and critical evaluation that distinguishes modern approaches and assesses their benefits, drawbacks, and applicability across various urban and socioeconomic contexts.
This review offers a thorough and critical evaluation of the methodology utilized by studies to investigate urban green spaces, particularly on schoolyard greening and its relationship to property outcomes. It addresses current limits and highlights emerging methodological trends, emphasizing advanced methods in statistics and geographic information systems (GIS). The evaluation is founded on three primary objectives:
1. Evaluate and integrate methodologies for assessing urban green spaces in real estate valuation research, including traditional approaches such as the Hedonic Pricing Model and Ordinary Least Squares (OLS) regression, as well as advanced methods like spatial regression, Geographically Weighted Regression (GWR), and machine learning (Ben et al., 2023; Chen, Lin et al., 2022).
2. Examine spatial-statistical and geographic information systems (GIS) methodologies for evaluating "greenness," taking into consideration spatial dependency and neighborhood-level influences (Chen, L. et al., 2020; Droj et al., 2024).
3. Provide recommendations for assessing schoolyard greening, the direction of future research, and its impact on urban sustainability and equality policies (Ewane et al., 2023; Ledraa & Aldubikhi, 2025).
2. Review Scope and Methodology
A complete and systematic literature search was conducted in accordance with the Preferred Reporting Items for Systematic Reviews and Meta-Analyses (PRISMA) guidelines. To ensure full coverage of peer-reviewed literature, searches were limited to three major databases: Scopus, Web of Science, and Google Scholar.
The investigation examined publications published between January 2010 and June 2025. The databases used the following Boolean search string, with minor changes for database syntax: ("urban green space" OR "schoolyard greening" OR "urban parks") AND ("property value" OR "real estate" OR "land price" OR "hedonic pricing") AND ("GIS" OR "remote sensing" OR "spatial analysis" OR "statistical modeling").
The reference lists of pertinent papers were examined to identify more research.
The systematic review adhered to PRISMA criteria for identification, screening, eligibility, and inclusion (see Appendix A for a flow diagram). The preliminary searches produced 1,015 documents, with 427 from Scopus, 338 from Web of Science, and 250 from Google Scholar. After removing duplicates, 250 publications were evaluated based on their abstracts and titles. A total of 56 papers were thoroughly reviewed, with 12 research projects meeting all synthesis criteria.
Studies were eligible for consideration if they met the following:
Publication in peer-reviewed journals (English only).
Emphasize urban green spaces or schoolyards over rural or agricultural areas.
Use property values or land prices as primary outcome measures.
Utilize GIS or formal statistical methods like hedonic pricing, spatial regression, ormachine learning.
Use schoolyard or small-scale greening programs whenever possible.
Only peer-reviewed and English-language studies with unique approaches were considered.
Did not use GIS or statistical analysis.
Primarily focused on rural or non-urban properties.
Following the removal of duplicates, 250 papers were first evaluated based on their titles and abstracts. Two independent examiners evaluated all titles and abstracts for relevance. Comprehensive reviews were conducted on the 56 studies that matched the inclusion criteria.
To improve uniformity and decrease bias, 75% of the publications underwent double screening.
The final synthesis included 12 papers published from 2020 to 2025 that met all requirements.
The data were collected using a standardized extraction and coding form based on variables found in recent meta-analyses.
Author's name, publication year, and geographic area.
Green area category (for example, park, playground, or urban green).
Data sources include transactional data, remote sensing, surveys, and qualitative analysis.
Used various GIS and statistical approaches, such as HPM, OLS, spatial regression, GWR, and machine learning.
Using "greenness" metrics (such as proximity, NDVI, and GVI).
Research design (cross-sectional, longitudinal, and quasi-experimental)
Considering equality, justice, and distributive effects.
Key discoveries and methodological constraints.
This review has certain limitations.
Linguistic and publishing bias: Limiting research to English-language peer-reviewed publications may exclude relevant studies published in other languages or in grey literature, such as municipal reports and practitioner studies. As a result, coverage of innovative approaches and marginalized geographic areas is limited.
The exclusion of non-English language and gray literature introduces significant selection bias. A multitude of innovative concepts, especially those originating from the Global South or non-academic sectors, may remain unacknowledged in peer-reviewed English-language journals. This may diminish the methodological and contextual diversity in this research, resulting in outcomes tilted towards more established, Western-centric methodologies.
The final selection of 12 studies, while methodologically sound, may not reflect the whole variety of green space interventions or worldwide urban situations. The findings are predicted to be more applicable to regions well-represented in the research, such as North America, Europe, and East Asia. Standardized coding processes lessen subjectivity, but the extraction and synthesis of qualitative data still require some degree of subjective interpretation.
Variable definitions and assessments of "greenness" and property value outcomes prevent the comparability and universality of research.
To address these constraints, future research should extend inclusion criteria (such as non-English publications and grey literature) and work with worldwide teams to increase geographic and contextual diversity.
Restricting the review to English-language, peer-reviewed literature improves consistency and quality control while introducing language and publication biases. Significant methodological improvements may be found in municipal documents, practitioner reports, or non-English academic publications, particularly those from underrepresented countries (Global South, Eastern Europe, and Latin America). As a result, the findings may not accurately reflect the discipline's methodological diversity or contextual developments.
Future assessments should involve international and multilingual teams to fully capture crucial non-English sources and gray literature. To ensure thorough coverage, undertake concentrated gray literature searches on key policy and practice topics such as context-specific greenness evaluation or targeted schoolyard interventions.
A checklist for urban green space and real estate value studies is presented to encourage transparency, rigor, and comparability in future research.
Detailed description of data sources, including spatial and geographic properties.
Give comprehensive explanations and rationales for "greenness" measurements such NDVI, closeness, and GVI.
Provide an in-depth description of all statistical and geographic models, including their justification for applicability.
Document any spatial autocorrelation findings or modifications made.
The data are divided into equity-relevant areas such as income, duration, and race/ethnicity.
Provide code and anonymised data to make repeatability easier.
Key phrases in this paper include: GWR (Geographically Weighted Regression), a spatial analysis methodology that reveals localized effects by changing model interactions across geographic space.

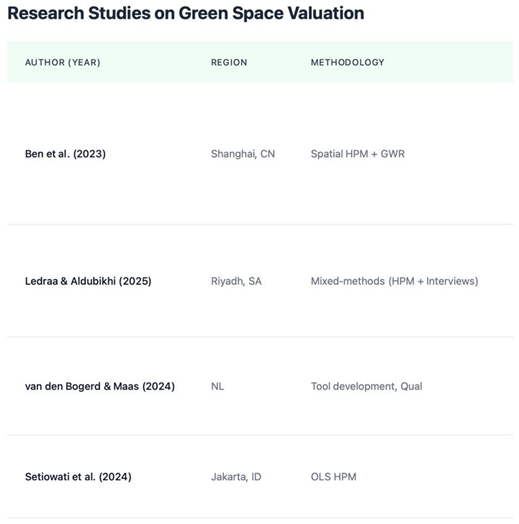
Table 1.
Summary of Included Studies on Urban Green Space and Schoolyard Greening.
 |
The Normalized Difference Vegetation metric (NDVI) is a remote sensing-based metric that measures the density and vigor of green vegetation.
The Green View Index (GVI) measures the proportion of visible vegetation in street-level imagery, providing a "human-eye" viewpoint on urban greenery.
SHAP (Shapley Additive Explanations) is a comprehensible machine learning technique that deconstructs complex model outputs to find the smallest possible effect of each variable.
Most research depend on transactional data and quantitative models, with minimal use of longitudinal or mixed methods approaches. A limited portion specifically concentrate on schoolyard greening or equality outcomes, underscoring substantial research deficiencies.
3. Thematic Organization of Methods
The study found significant diversity in data sources regarding the benefits of urban green space and schoolyard greening on property valuation. Researchers typically use three types of data: (1) transactional data (real estate sales, assessed values, rental prices), (2) spatial and remote sensing data (satellite imagery, street view images, NDVI, canopy cover), and (3) survey and qualitative data (questions, interviews, field observations).
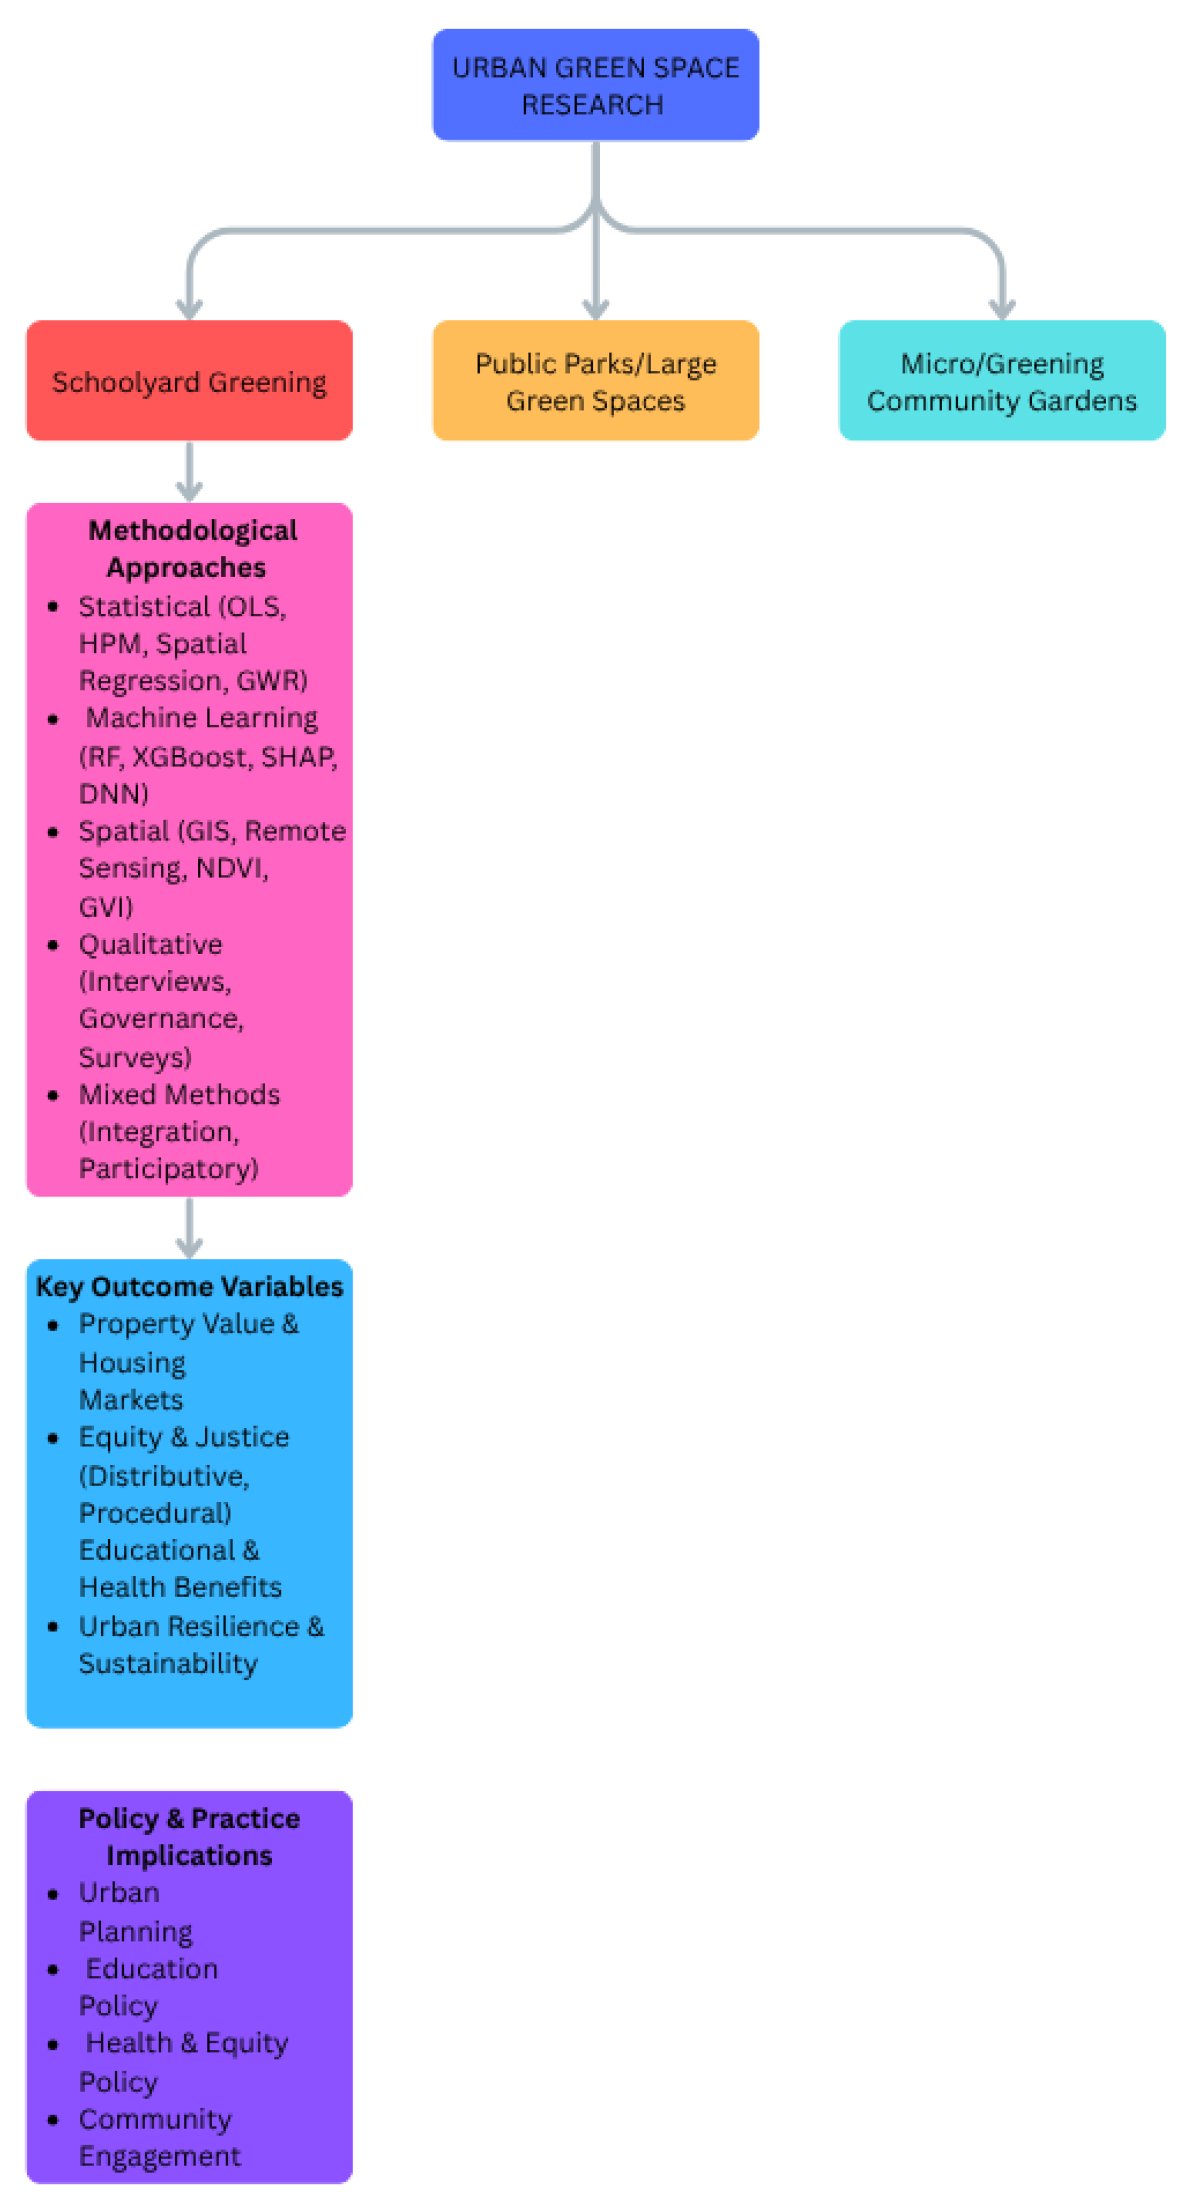
The framework illustrated in Figure 1 situates schoolyard greening within the broader scope of urban green space research, explaining the connections among methodological approaches (e.g., statistical, geographical, qualitative), key outcome variables (property value, equity, health), and policy significance. This visual model emphasizes the specific methodological and policy challenges associated with schoolyard greening, which often overlaps with educational, social, and environmental issues.
Most of the quantitative research is based on transactional data. Sale prices per square meter, listing prices, and land price zoning data, which are commonly obtained from real estate agencies, government records, or online platforms, provide accuracy and objectivity for property valuation but can be difficult to obtain (Ben et al., 2023; Chen, Lin et al., 2022; Lieber, 2022; Moradi et al., 2022; Zhang et al., 2022).
Spatial and distant sensing data are becoming important. The widespread use of NDVI (Normalized Difference Vegetation Index), tree canopy coverage from satellite data, and the Green View Index (GVI) derived from street views enables an objective and scalable assessment of "greenness." Landsat, Google Earth Engine, and Baidu Maps are widely used for high-resolution research (Ben et al., 2023; Chen, L. et al., 2020; Ewane et al., 2023; Zhang et al., 2022). Several research use various spatial datasets for deep analysis, including transactional, administrative, and environmental datasets (Droj et al., 2024; Chen, L. et al., 2020).
Surveys and qualitative data enhance traditional sources, particularly where official records are unavailable or local viewpoints are important. Questionnaire-based studies (Aziz et al., 2021; Setiowati et al., 2024), interviews with real estate agents (Ledraa & Aldubikhi, 2025), and field observations all contribute to the empirical framework and contextualization of quantitative data. This data is especially useful for measuring subjective elements of green space value and community sentiments toward greening programs (Setiowati et al., 2024; Lieber, 2022).
The operationalization of "greenness" serves as a methodological focus point, which includes several major strategies:
1. Researchers typically use proximity-based metrics to evaluate greenness, such as straight-line (Euclidean) or network distances between properties and nearby green areas, parks, or schoolyards (Moradi et al., 2022; Lieber, 2022; Zhang et al., 2022). This method gives a baseline statistic, but it may oversimplify actual access in densely crowded metropolitan areas.
2. Common remote sensing metrics include NDVI, tree canopy cover, and green coverage percentages, which measure vegetation density and health. These indicators, which are used at several geographical sizes (parcel, neighborhood, and buffer zones), are recognized for their impartiality and replicability. The Green View Index (GVI), created from street-level pictures, provides a "human perspective" on visible greenery (Chen, L. et al., 2020; Ewane et al., 2023; Zhang et al., 2022).
3. Accessibility and Synthesis Indexes: Recent research has developed accessibility indices that assess green spaces based on size, population serviced, and potential congestion, often using floating catchment or kernel density approaches (Ben et al., 2023; Zhang et al., 2022). These approaches realize that not every green area provides equal access and benefits to all demographics.
4. Use qualitative and checklist-based techniques. Certain studies use checklists or established techniques to evaluate the quality, upkeep, or amenity value of green spaces, such as resident questionnaires or expert panels (Zhang et al., 2022). Nonetheless, subjective metrics are unusual in large valuation studies.
5. Tools specific to the schoolyard: The Green Schoolyard Evaluation Tool (GSET) and its associated tools are intended to promote greenness in educational settings (van den Bogerd & Maas, 2024), however they are rarely used in property value research.
The research consistently shows a lack of schoolyard-specific data and methodological focus. Due to data restrictions, most studies combine schoolyards with other green areas or remove them entirely (Clauzel et al., 2025; Ewane et al., 2023). There are numerous issues associated with maintaining schoolyard greening.
Data on schoolyard characteristics, vegetation condition, and accessibility vary.
Inadequate use of specialist approaches, such as GSET, leads to poor comparability across settings (van den Bogerd & Maas, 2024).
Sekulova and Ruiz Mallén (2024) contend that proximity measurements usually overlook specific school-community linkages and usage patterns.
These constraints are made worse in the Global South, where municipal records and remote sensing coverage are frequently insufficient (Setiowati et al., 2024; Ewane et al., 2023).
The hedonic pricing model (HPM) is widely used in urban green space valuation research, regularly breaking down real estate prices into structural, locational, and environmental components (Setiowati et al., 2024; Moradi et al., 2022; Ben et al., 2023). Traditional hedonic price models (HPMs) use ordinary least squares (OLS) regression in log-linear or semi-logarithmic format to determine the hidden value of green space attributes (Lieber, 2022; Aziz et al., 2021).
Recognizing the limits of classic models, particularly their incapacity to account for regional dependency and local variation, researchers are increasingly using complex spatial econometric models. Geographic lag and error models are common approaches for addressing autocorrelation in property pricing.
Geographically weighted regression (GWR) takes into consideration local changes in the link between greenness and property values (Chen, Lin et al., 2022; Chen, K. et al., 2022).
Machine Learning and Scenario Simulation Collective learning approaches, such as XGBoost, deep neural networks, and SHAP value interpretation, are widely used to improve prediction precision and simulate nonlinear interactions (Chen, L. et al., 2020; Droj et al., 2024). Nonetheless, criticisms of their "black box" character persist (Chen, L. et al., 2020).
Machine learning approaches such as random forests, XGBoost, and neural networks are increasingly being used to determine property value. These models often exceed OLS and spatial regression models in predicting accuracy due to their capacity to capture nonlinearities and high-dimensional interactions (Ben et al., 2023; Chen, L. et al., 2020). XGBoost explained 20% more variance in housing prices than OLS, particularly in places with diverse green space distributions (Chen et al., 2020).
To overcome the "black box" difficulty, recent research has adopted explainable AI approaches such as SHAP (Shapley Additive Explanations), which divide model predictions into progressive contributions from each input variable. This makes it easier to analyze the impact of variables such as NDVI or green view index at various spatial scales on property value, connecting forecasting capability to policy significance.
Although machine learning improves predictive accuracy, spatial econometric methods (e.g., GWR, spatial lag/error models) are still preferred for comprehending spatial dependency and heterogeneity. As a result, future research will increasingly combine machine learning into interpretable and spatially specific methodologies.
Although machine learning techniques such as random forests, XGBoost, and neural networks surpass ordinary least squares and traditional spatial regression, they possess limitations. The complex nature of numerous machine learning models often hinders interpretability, creating obstacles for policy implementation and restricting the transparency essential for public sector decision-making. Overfitting, especially in the context of limited sample numbers or biased distributions of greenness variables, might compromise external validity. Moreover, although explainable AI methods such as SHAP values assist in mitigating these challenges by quantifying variable significance, they may inadequately provide the nuanced causal explanations essential for policy formulation and strategic planning. The transferability of machine learning models across different geographies and contexts is inadequately comprehended, and numerous studies lack robust out-of-sample or cross-validation methodologies, hence raising concerns about generalizability.
Geographic Information Systems (GIS) are now an essential methodological tool for identifying properties and green areas, calculating distances, establishing buffer zones (typically 400-1000 meters), doing network modeling, and executing spatial overlays (Droj et al., 2024; Ben et al., 2023). Researchers utilize GIS to show the spatial distribution of facilities, educational institutions, and environmental dangers (Aziz et al., 2021).
Ben et al. (2023) propose using floating catchment areas and network analysis to simulate pedestrian accessibility in real-world scenarios.
Use many geographical data layers, such as green cover, demographics, and zoning, for multivariate analysis and scenario simulations (Chen, L. et al., 2020; Droj et al., 2024).
Some research use 3D GIS, remote sensing categorization (SVM, deep learning), and interaction with BIM or other digital systems to enable advanced modeling (Droj et al., 2024; Chen, L. et al., 2020).
Remote sensing (NDVI, canopy), spatial indicators (e.g., forest size-distance index), and field observations for characteristics such as tree species or ecosystem state are the primary sources of ecological evaluation. While these methods give objective metrics, few research have compared distant measurements to direct ecological assessments.
Behavioral techniques include surveys and interviews to gather information about residents' preferences and perceptions of the quality, safety, and amenities of their green spaces. However, the integration of such data with geographic analysis is rare, and questionnaire validation is inconsistent.
Despite the increasing number of quantitative methods in the literature, qualitative and governance-focused approaches are increasingly being applied to address issues such as urban justice, participation, and context-specificity. Here are a few typical methodologies:
Investigating urban greening policies, zoning regulations, and equity issues (Ledraa & Aldubikhi, 2025).
Stakeholder mapping and governance frameworks identify key actors and power relations, focusing on equality, procedural involvement, and equitable outcomes (Sekulova & Ruiz Mallén, 2024).
Case studies and semi-structured interviews provide context for quantitative findings, especially in distinct urban or socio-cultural settings (Ledraa & Aldubikhi, 2025; Setiowati et al., 2024). Thematic coding and qualitative comparative analysis emphasize local perspectives, sector-specific implications, and details like maintenance quality and safety concerns.
Delphi panels and expert workshops may occasionally help consensus on indicators or evaluation frameworks; however, their usefulness in property value investigations is limited.
Mixed methods design that combine HPM or GIS-based models with qualitative interviews help to explain both observed effects and their underlying causes in urban settings (Ledraa & Aldubikhi, 2025; Setiowati et al., 2024). This integration is especially useful in dry, fast urbanizing, or culturally diverse places, where Western-derived models may not fully reflect crucial phenomena.
Advantages and Common Challenges of Governance/Qualitative Analysis.
Advantages:
Recognize basic mechanisms such as privacy, safety, and local standards, which quantitative approaches may neglect.
Provide sector-specific and equality assessments to inform policy suggestions tailored to the local context (Ledraa & Aldubikhi, 2025; Sekulova & Ruiz Mallén, 2024).
Challenges: Interpretative bias and insufficient reproducibility.
Interview samples may be selected to represent specific demographics or stakeholder groups.
Insufficient integration with spatial-statistical models may limit the policy implications of qualitative insights (Setiowati et al., 2024).
Hedonic pricing models (HPM) continue to be the gold standard for determining the economic worth of green space due to their transparency and consistency across research (Setiowati et al., 2024; Ben et al., 2023). Their extensive application illustrates objectivity and economic theory. Traditional HPMs, on the other hand, are coming under fire for failing to account for spatial dependency, nonlinear effects, and context-specific complications (Chen, L. et al., 2020; Ewane et al., 2023).
Spatial econometric models and machine learning approaches provide methodological breakthroughs that improve precision and allow for the simulation of complicated, context-sensitive interactions. The use of spatial lag/error models, Geographically Weighted Regression (GWR), and artificial intelligence/machine learning techniques (e.g., XGBoost, deep learning) indicates a shift toward more advanced and complex research (Ben et al., 2023; Chen, L. et al., 2020; Droj et al., 2024).
GIS and remote sensing allow for objective and scalable assessments of greenness, as well as complete mapping. The merging of several data kinds (transactional, geographical, and social) exhibits methodological progress and has the potential to improve accuracy and policy significance (Droj et al., 2024; Chen, L.; et al., 2020).
Common Strengths:
Transactional, remote sensing, and GIS data are objective and reproducible, allowing for testing and comparison across cities and regions (Ewane et al., 2023; Droj et al., 2024). Relevant to policy: Quantitative estimates of the "green premium" benefit planners, municipalities, and real estate markets (Setiowati et al., 2024; Ledraa & Aldubikhi, 2025).
Potential for Integration: Recent improvements make it easier to integrate quantitative and qualitative methodologies, increasing explanatory power and practical significance (Ledraa & Aldubikhi, 2025; Setiowati et al., 2024).
Common weaknesses:
A lack of connection. Cross-sectional designs are popular, which limits the ability to deduce causality and comprehend long-term consequences or gentrification processes.
Limitations of universality. The emphasis on research undertaken in a single area, typically in the Global North or East Asia, reduces cross-context validity, particularly for small-scale or schoolyard interventions (Setiowati et al., 2024).
According to Sekulova and Ruiz Mallén (2024), most quantitative models fail to account for the implications of distributive and procedural equity in greening, as well as the distinct effects of wealth, race, and tenancy.
There is a scarcity of research that uses schoolyard-specific data and methodology, and methodological innovation for educational or child-centered greening processes is limited (Clauzel et al., 2025; van den Bogerd & Maas, 2024).
Despite frequent recommendations for increased emphasis, schoolyard greening is underrepresented in the methodological literature. The primary challenges are:
Insufficient data quality to distinguish schoolyard effects from overall green space trends.
The poor use of specialist methodologies such as GSET has resulted in a limited understanding of greening's effects on educational and local outcomes (van den Bogerd & Maas, 2024).
According to Sekulova and Ruiz Mallén (2024), quantitative and qualitative models fail to fully integrate the school community's perspectives.
In contrast to quantitative models, qualitative and governance-oriented methodologies offer essential context and capture mechanisms (e.g., equity, participation, governance configurations) that are often imperceptible to mere statistics models. Nevertheless, these approaches possess inherent limitations, such as subjectivity, limited sample sizes, and challenges in scalability or replicability of results. Although thematic coding, stakeholder interviews, and governance mapping may uncover mechanisms of inclusion or exclusion, the incorporation of quantitative spatial or statistical analyses is infrequent and methodologically challenging. Mixed-methods studies that explicitly connect qualitative findings to model outputs are highly valuable; however, they are underrepresented in the examined literature.
In summary, conventional regression models like HPM and OLS continue to be employed to assess the "green premium" in property values due to their simplicity and clarity. Nonetheless, these techniques typically neglect spatial autocorrelation and local variability. Spatial econometric methodologies (e.g., GWR, spatial lag/error models) address these deficiencies; nonetheless, they are computationally intensive and necessitate high-quality geographical data.
Machine learning models advance the field by encapsulating nonlinearities and intricate interactions, but at the cost of clarity and, in certain instances, causal inference. Explainable AI technologies offer advantages; yet their practical implementation by policymakers remains constrained. Qualitative and governance-oriented studies provide essential insights into context, process, and justice; yet they may be undermined unless carefully combined with quantitative data.
Consequently, the most methodologically rigorous and policy-relevant research increasingly integrates several approaches, leveraging their strengths while mitigating their weaknesses.
4. Synthesis of Findings and Critical Gaps
In recent studies on methodologies for evaluating urban green areas, including the greening of schoolyards, several significant themes have been identified. Quantitative research that employs the hedonic pricing model (HPM) is the primary focus of the literature, with ordinary least squares (OLS) regression serving as the primary analytical method in a variety of contexts (Setiowati et al., 2024; Moradi et al.,2022). By investigating the progressive influence of green space proximity and attributes on residential property values, these models offer empirical evidence for urban planning and real estate economics (Ben et al., 2023). Researchers are increasingly integrating advanced spatial econometric techniques, including spatial lag and error models, geographically weighted regression (GWR), and, more recently, machine learning methodologies, into HPMs to address spatial dependence and local heterogeneity (Chen et al., 2022; Droj et al., 2024; Chen, L. et al., 2020).
The utilization of an extensive variety of data sources is exhibiting distinct trends. Real estate transaction records are substantial; however, researchers are increasingly integrating them with high-resolution remote sensing data (e.g., NDVI, tree canopy cover), GIS-based spatial data, and, less frequently, survey or qualitative data (Ewane et al., 2023; Lieber, 2022). To quantify "greenness," recent research has employed street-level assessments and satellite imagery (e.g., Green View Index). This method facilitates precise analyses that differentiate between horizontal and vertical vegetation, as well as public and private green spaces (Chen, L. et al., 2020; Ben et al., 2023). Despite these advancements, many studies are cross-sectional, suggesting a lack of longitudinal or experimental research (Setiowati et al., 2024; Droj et al., 2024).
Although methodological advancements, especially in spatial and machine learning techniques, substantial gaps persist. This encompasses a lack of representation for schoolyard greening as a unique urban solution, inadequate focus on justice and equity, and a persistent dependence on cross-sectional, non-causal research methodologies. Numerous studies amalgamate schoolyards with expansive green spaces, so constraining comprehension of their distinct effects and policy implications. Moreover, methodological innovation in fine-scale, longitudinal, and mixed-methods approaches is rare, particularly for interventions aimed at vulnerable or underrepresented populations.
Neglects the qualitative, design, and community engagement components of schoolyard greening, instead relying solely on proximity or area metrics.
Inadequate data or methodological constraints prevent the implementation of specialized methodologies, including the Green Schoolyard Evaluation Tool (GSET) or comparable frameworks.
The collection of schoolyard data in municipalities is not governed by a consistent methodology.
Research funding and publishing trends frequently provide support for urban parks that are extensive or renowned.
It is exceedingly rare to locate interdisciplinary methodologies for investigating the educational, social, and environmental implications.
Stakeholders may advocate for funding agencies and journals to prioritize research on schoolyard greening to address this disparity.
Establish and execute consistent testing protocols, such as GSET, in a diverse array of urban areas.
Identify the advantages and challenges that exist within school communities by utilizing hybrid methodologies, such as participatory mapping and qualitative interviews.
Promote the application of open data principles and the accumulation of school-specific data at the municipal and school district levels.
Remote sensing and geographic information systems (GIS) have enhanced the objectivity and geographic resolution of green space assessments. Nevertheless, many studies continue to employ basic proximity, area, or coverage metrics, with minimal application of multi-source, multi-scalar, or context-sensitive indicators (Ewane et al., 2023; Chen, L. et al., 2020). Systematic integration of field survey data and remote sensing has been lacking due to the potential for enhanced comprehension of the condition, usage, and local perception of natural spaces. Street-level and "human perspective" metrics are on the rise; however, they are still underutilized (Chen, L. et al., 2020). In numerous studies, the subjective character or preservation of green spaces is frequently overlooked in favor of quantity or proximity (Ben et al., 2023).
Although equity is mentioned in a multitude of studies, only a small number of them make it the primary focus of their research. Methodologies that are both transparent and replicable must be implemented by researchers to promote equity and justice within the field. Urban greening valuation research is advised to adhere to the subsequent equity protocol:
Examine statistics that are classified according to income, race/ethnicity, and housing status (ownership/rental).
Assess the advantages and disadvantages of the situation, including the potential for displacement or increased expenditures, as well as the individuals who are benefiting from escalating property values and enhanced amenities.
Incorporate community perspectives into the design, data collection, and interpretation of the study to ensure the inclusion of perspectives from underrepresented groups.
Employ both distributive justice and procedural justice perspectives.
Share data and methodology in a transparent manner to facilitate local adaptation, research, and replication.
These criteria may be necessary for future journals and reviewers, particularly for research that is intended to influence policy or funding decisions.
Contextual and geographic biases are frequently demonstrated in literature. The United States, Western Europe, China, and Australia are the primary high-income countries in which research is conducted. Conversely, urban regions in the Global South, arid and swiftly urbanizing cities, and low-income neighborhoods remain largely unexplored (Setiowati et al., 2024; Ewane et al., 2023; Ledraa & Aldubikhi, 2025). There is a dearth of studies that examine the impact of green spaces on vulnerable populations, including renters, low-income households, and children, despite the extensive research conducted on these spaces in numerous locations. Furthermore, there is an inadequate emphasis on unconventional or inferior green spaces, including schoolyards, green roofs, and community gardens (Lieber, 2022; van den Bogerd & Maas, 2024).
Despite their substantial potential to enhance urban health and equity, cemeteries, vacant lots, roadside vegetation, and micro-greening projects such as schoolyards are frequently disregarded in most of the research, which places a higher priority on extensive urban parks and forests (Setiowati et al., 2024; Moradi et al., 2022; Ben et al., 2023).
The literature is primarily composed of cross-sectional, observational designs, with a limited number of studies that employ longitudinal, panel, or quasi-experimental methodologies that could potentially substantiate the causal hypothesis (Chen et al., 2022; Droj et al., 2024). This limitation is essential because the advantages of greening initiatives, particularly those that are more gradual or scaled down, such as schoolyard rehabilitation, may not be realized for an extended period or until legislative or environmental changes occur. Due to the paucity of natural experiments, policy evaluations, or before-after-control-impact (BACI) designs, the field is unable to progress beyond correlation and address issues of causation and long-term effects (Ewane et al., 2023; Setiowati et al., 2024).
The literature exhibits significant deficiencies, including an insufficient emphasis on schoolyard greening, limited fine-scale and longitudinal assessments, underrepresentation of justice and equity paradigms, and substantial gaps in global coverage, as well as in the types of green spaces and populations being examined, despite substantial gains in data availability and methodological improvement. Urban greening research will be methodologically robust and relevant to a diverse array of urban contexts and policy concerns through the correction of these persistent deficiencies.
There are only a handful of examples that demonstrate methodological innovation, despite the scarcity of research on schoolyard greening. To evaluate the influence of schoolyard greening on urban biodiversity, Clauzel et al. (2025) implemented high-resolution GIS and field biological surveys, thereby establishing a foundation for site-specific, comprehensive research. Van den Bogerd and Maas (2024) devised the Green Schoolyard Evaluation Tool (GSET). This instrument evaluates the ecological and social repercussions of greening initiatives by incorporating stakeholder feedback and observational data. In Shanghai, Ben et al. (2023) implemented spatial hedonic pricing by integrating GWR with NDVI and accessibility indices to illustrate the average and localized impacts of green space on property values. This methodology is especially relevant to research conducted in schoolyards.
5. Recommendations for Future Research
Future research should emphasize methodological rigor and transparency by utilizing longitudinal, quasi-experimental, and mixed methods designs that integrate both quantitative and qualitative methodologies. There is an immediate necessity for standardized and context-specific evaluations of "greenness," as instruments such as the Green Schoolyard Evaluation Tool (GSET) gain broader application. Data and code sharing should be standardized to enhance reproducibility and facilitate global knowledge transfer. Equity considerations must be integrated at every phase, from study design to distribution, with data categorized by significant social groups and a focus on underrepresented areas. Ultimately, concentrated study on schoolyard greening, especially in disadvantaged or marginalized regions, ought to be expanded and included into conventional urban sustainability initiatives.
Despite substantial methodological advances in the assessment of urban green spaces and schoolyard greening, there are still opportunities to improve the rigor, relevance, and equity of future research in this sector. The existing literature supports several suggestions.
Incorporate high-resolution and multisource datasets, such as transactional property data, detailed remote sensing imagery (e.g., NDVI, LiDAR, street-level Green View Index), and complete administrative records (Ben et al., 2023; Chen, L. et al., 2020; Ewane et al., 2023).
Combine many data streams, such as sales transactions, remote sensing, surveys, and qualitative interviews, to synthesis results and reduce data-specific biases (Droj et al., 2024; Setiowati et al., 2024).
Use advanced spatial-statistical and machine learning models, such as spatial lag/error models, geographically weighted regression (GWR), and understandable AI techniques (e.g., SHAP), to address spatial dependence, clarify nonlinear effects, and provide localized interpretations of green space impacts (Chen, Lin et al., 2022; Chen, L. et al., 2020).
In situations when such strategies are employed, it is critical to prioritize explainability and openness to avoid "black box" errors and improve policy relevance (Chen, L. et al., 2020; Droj et al., 2024).
Establish similar definitions for "greenness," green space quality, and accessibility to allow for cross-study and regional comparisons (Zhang et al., 2022; Ben et al., 2023).
Create and apply standardized, context-specific methodology for quantifying schoolyard greening, such as the GSET, and ensure correct documentation of geographical scales, buffer lengths, and classification systems (van den Bogerd & Maas, 2024; Ewane et al., 2023).
Create standardized measuring frameworks that distinguish between different types of green spaces (public parks, community greens, schoolyards, etc.) and include both objective (remote sensing, GIS) and subjective (surveys, perceptions) measurements.
This clarity will aid in determining the most important greenness criteria across a variety of urban and cultural situations.
To better detect the effects of green space on property values, use longitudinal studies, natural experiments, and quasi-experimental approaches (e.g., difference-in-differences designs) (Ben et al., 2023; Droj et al., 2024).
These skills are essential for comprehending dynamic phenomena like gentrification, displacement, and periodic changes in green space quality.
Integrate rigorous quantitative methodologies (e.g., hedonic modeling, spatial econometrics) with comprehensive qualitative approaches (e.g., stakeholder interviews, focus groups) to clarify both the effects of greening and the underlying causes, as well as the various effects on different groups (Ledraa & Aldubikhi, 2025; Setiowati et al., 2024).
This integration is especially useful when cultural, political, or socioeconomic variables influence the relationship between greening and property outcomes.
Transition from assessing overall real estate value impacts to a more focused analysis of distributive and procedural justice: identify the beneficiaries of greening initiatives, identify those at risk of displacement, and investigate ways to improve inclusivity in decision-making processes (Sekulova & Ruiz Mallén, 2024; Ledraa & Aldubikhi, 2025).
Include equity metrics in spatial and statistical models by stratifying analyses by income, race, tenure, or vulnerability, and use participatory and governance frameworks to evaluate the planning, implementation, and experiences of various stakeholders with greening interventions (Setiowati et al., 2024; Ledraa & Aldubikhi, 2025).
Use case studies and policy analyses to identify the most effective methods for incorporating justice considerations into the design and evaluation of urban greening initiatives.
Maintain the ideals of open science throughout the sector. Encourage data sharing, comprehensive documenting of analytical approaches, and the use of reproducible workflows as best practices (Droj et al., 2024; Chen, L. et al., 2020).
Journals and funding organizations must distribute code, data (while maintaining privacy and ethical norms), and methodological enhancements to encourage replication and secondary analysis.
Encourage collaborative comparative research across cities or nations, using open data and proven procedures to yield more generalizable results and foster methodological innovation (Ewane et al., 2023; Droj et al., 2024).
To further develop the field, establish collaborative repositories for green space, property valuation, and contextual data, as well as best-practice rules for preserving sensitive information.
Future research must highlight the following evident methods to rectify the ongoing underrepresentation of the Global South and vulnerable urban regions: (1) Encourage North-South and South-South research partnerships to develop local research capacity and facilitate context-sensitive methodologies; (2) Utilize open-source satellite imagery, participatory GIS, and mobile survey tools to address data constraints that are prevalent in resource-limited environments; (3) Collaborate with local stakeholders, such as community groups, school administrators, and municipal officials, to co-design research questions and data collection protocols to guarantee cultural relevance and sustainability; (4) Advocate for journal special issues and targeted funding opportunities that concentrate on schoolyard greening and urban sustainability in the Global South; and (5) Encourage multilingual dissemination of findings and open-access data repositories to enhance accessibility and replication across contexts.
Essential Action Items:
Increase methodological rigor and transparency, particularly on causality, endogeneity, and generalizability.
Create standardized definitions and evaluation frameworks for sustainability and property outcomes.
Prioritize justice and equity in research inquiries, methodology, and documentation.
Fund research on schoolyard greening, a critical aspect of urban sustainability that is often disregarded.
Peer-reviewed articles must offer supplementary data, code, and comprehensive methods.
Future assessments should explicitly seek to incorporate non-English and gray literature, maybe through global, multilingual research teams. This extension is essential for gathering context-specific innovations and guaranteeing that best practices in schoolyard greening and urban sustainability are globally comprehensive and inclusive.
6. Implications for Policy and Practice
A thorough assessment of the most recent methodological developments in urban green space and schoolyard greening research emphasizes their significant importance for schoolyard design, planning, and policy. The credibility, relevance, and transformative efficacy of evidence-based green space policy are dependent upon methodological rigor and innovation, which exceed ordinary academic endeavors.
Recent research has consistently shown that rigorous methodological frameworks, particularly those that employ advanced spatial-statistical techniques, high-resolution remote sensing, and mixed-methods designs, generate findings that are more practical and nuanced for policymakers (Ben et al., 2023; Chen et al., 2022; Droj et al., 2024). Hedonic pricing models (HPM), particularly when combined with spatial regression or geographically weighted regression (GWR), provide a more precise understanding of the influence of green space characteristics and proximity on property values, thus impacting urban equity and investment priorities (Setiowati et al., 2024; Ben et al., 2023).
Inaccurate policy recommendations may result from methodological deficiencies, such as the reliance on cross-sectional designs, fundamental proximity measurements, and an insufficient analysis of spatial dependence. The differential impacts of greening across socioeconomic or geographic contexts could be masked by avoiding spatial autocorrelation or neighborhood heterogeneity (Ewane et al., 2023; Chen, L. et al., 2020). To ensure that investments produce the anticipated social and ecological results, urban greening initiatives, which are increasingly sponsored by "green premiums," demand methodological transparency and rigor (Chen et al., 2022; Droj et al., 2024).
The transition of research methodologies from conventional high-performance computing to machine learning, explainable artificial intelligence (such as SHAP values), and human-centric remote sensing provides planners and policymakers with powerful new tools (Chen, L. et al., 2020). These advancements enable the creation of context-sensitive metrics, including accessibility indices that assess the quality, density, and dimensions of green spaces, and enable a more thorough evaluation of initiatives such as schoolyard greening (Ben et al., 2023; Chen, L. et al., 2020).
In rapidly urbanizing or culturally unique environments, these methodological advancements can facilitate the identification of both overall value increases and potential risks, such as gentrification, displacement, and disparities in access (Ledraa & Aldubikhi, 2025; Setiowati et al., 2024). This evidential foundation allows policymakers to come up with solutions that effectively balance environmental, economic, and social equity objectives.
The peer-reviewed literature is increasingly acknowledging that participatory and multidisciplinary approaches should be implemented to improve methodological rigor. The combination of quantitative spatial models with qualitative methodologies, including participatory mapping and stakeholder interviews, results in more profound and contextually relevant results, particularly in the areas of governance, community choices, and equality (Sekulova & Ruiz Mallén, 2024; Ledraa & Aldubikhi, 2025). Mixed methods approach enables the elucidation of the extent and mechanisms of green space effects, resulting in more comprehensive and equitable policy determinations (Setiowati et al., 2024).
Moreover, participatory and interdisciplinary methodologies are crucial for resolving persistent data deficiencies, particularly those that pertain to vulnerable communities lived experiences or schoolyard interventions. By incorporating stakeholders from a variety of sectors, such as urban planning, education, public health, and community advocacy, research can improve culturally relevant and widely supported schoolyard design and urban greening initiatives (Sekulova & Ruiz Mallén, 2024; Ledraa & Aldubikhi, 2025).
In conclusion, the development of equitable, evidence-based policies for schoolyards and green spaces necessitates interdisciplinary, participatory research and methodological precision. Scholars and practitioners must prioritize the translation of methodological innovations into policy and practice for cities to realize the comprehensive social, environmental, and educational benefits of urban greening (Ben et al., 2023; Droj et al., 2024; Chen et al., 2022).
7. Conclusion
Methodological rigor is crucial for advancing urban sustainability, equity, and climate resilience, particularly as cities globally seek to utilize green spaces, such as schoolyard greening, to enhance environmental and social outcomes. The thorough assessment of the impact of urban green initiatives on property values exceeds mere academic inquiry; it significantly shapes public investment, urban planning, and policies designed to encourage equitable and resilient cities (Chen et al., 2022; Setiowati et al., 2024). In the absence of methodological rigor, there exists a risk of overstating benefits, overlooking trade-offs, and sustaining inequalities, especially in rapidly urbanizing or historically marginalized regions (Ledraa & Aldubikhi, 2025).
This evaluation emphasizes several key insights for the discipline. Hedonic pricing models and OLS regression remain prevalent, yet they are increasingly enhanced by spatial econometric techniques (e.g., GWR, spatial lag/error models) and machine learning methods to more effectively capture spatial dependence, local heterogeneity, and nonlinear dynamics (Ben et al., 2023; Chen, L. et al., 2020; Droj et al., 2024). Secondly, methodological advancements are particularly important in the combination of multisource data, ranging from high-resolution remote sensing to street-level photography and survey responses, facilitating more nuanced and human-centered assessments of "greenness" (Ewane et al., 2023; Chen, L. et al., 2020). Nonetheless, considerable limitations are present: Cross-sectional designs hinder causal inference; most studies are context-specific, restricting generalizability; and the incorporation of equity and justice metrics is insufficiently addressed, especially regarding distributive and procedural outcomes (Setiowati et al., 2024; Sekulova & Ruiz Mallén, 2024).
To advance, enhanced methodological transparency, the triangulation of quantitative and qualitative methods, and greater focus on underrepresented situations and small-scale initiatives such as schoolyard greening are necessary. Mitigating data limitations, investing in the creation and validation of context-specific tools, and integrating longitudinal and mixed-methods designs will enable the field to advance from correlational findings to actionable, policy-relevant insights (Droj et al., 2024; Ledraa & Aldubikhi, 2025). Ultimately, augmenting methodological rigor exceeds basic technical necessity; it is essential to guarantee that the benefits of urban greening are realized equitably, efficiently, and sustainably for diverse urban populations.
References
- Aziz, A.; Anwar, M. M.; Dawood, M. The impact of neighborhood services on land values: An estimation through the hedonic pricing model. GeoJournal 2021, 86, 1915–1925. [Google Scholar] [CrossRef]
- Ben, S.; Zhu, H.; Lu, J.; Wang, R. Valuing the accessibility of green spaces in the housing market: A spatial hedonic analysis in Shanghai, China. Land 2023, 12, 1660. [Google Scholar] [CrossRef]
- Caprioli, C.; Bottero, M.; De Angelis, E. Combining an agent-based model, hedonic pricing and multicriteria analysis to model green gentrification dynamics. Computers, Environment and Urban Systems 2023, 102, 101955. [Google Scholar] [CrossRef]
- Chen, K.; Lin, H.; You, S.; Han, Y. Review of the impact of urban parks and green spaces on residence prices in the environmental health context. Frontiers in Public Health 2022, 10, 993801. [Google Scholar] [CrossRef] [PubMed]
- Chen, L.; Yao, X.; Liu, Y.; Zhu, Y.; Chen, W.; Zhao, X.; Chi, T. Measuring impacts of urban environmental elements on housing prices based on multisource data—A case study of Shanghai, China. ISPRS International Journal of Geo-Information 2020, 9, 106. [Google Scholar] [CrossRef]
- Chen, Y.; Ye, Y.; Liu, X.; Yin, C.; Jones, C. A. Examining the nonlinear and spatial heterogeneity of housing prices in urban Beijing: An application of GeoShapley. Habitat International 2025, 162, 103439. [Google Scholar] [CrossRef]
- Clauzel, C.; Louis-Lucas, T.; Bortolamiol, S.; Blanc, N.; Grésillon, E.; Bouteau, F.; Laurenti, P.; Clavel, J. Schoolyard greening to improve functional connectivity in the city and support biodiversity. Urban Forestry & Urban Greening 2025, 112, Article 128937. [Google Scholar] [CrossRef]
- Droj, G.; Kwartnik-Pruc, A.; Droj, L. A comprehensive overview regarding the impact of GIS on property valuation. ISPRS International Journal of Geo-Information 2024, 13, 175. [Google Scholar] [CrossRef]
- Ewane, E. B.; Bajaj, S.; Velasquez-Camacho, L.; Srinivasan, S.; Maeng, J.; Singla, A.; Luber, A.; de-Miguel, S.; Richardson, G.; Broadbent, E. N.; Cardil, A.; Wan Mohd Jaafar, W. S.; Abdullah, M.; Dalla Corte, A. P.; Silva, C. A.; Doaemo, W.; Mohan, M. Influence of urban forests on residential property values: A systematic review of 2088. 2023. [Google Scholar] [CrossRef]
- Gorjian, M. (2025, July 10). Greening schoolyards and the spatial distribution of property values in Denver, Colorado (Version 1). OSF Preprints. [CrossRef]
- Gorjian, M. (2025, July 11). The impact of greening schoolyards on residential property values. SSRN. [CrossRef]
- Gorjian, M. (2025, July 11). Schoolyard greening, child health, and neighborhood change: A comparative study of urban US cities. arXiv preprint, A: health, and neighborhood change; arXiv:2507.08899). [CrossRef]
- Gorjian, M. (2025, July 17). Green schoolyard investments influence local-level economic and equity outcomes through spatial-statistical modeling and geospatial analysis in urban contexts. arXiv preprint, arXiv:2507.14232). [CrossRef]
- Gorjian, M. (2025). Greening schoolyards and urban property values: A systematic review of geospatial and statistical evidence (Version 1). OSF Preprints. [CrossRef]
- Gorjian, M. (2025). Green schoolyard investments and urban equity: A systematic review of economic and social impacts using spatial-statistical methods (Research Square Preprint). [CrossRef]
- Gorjian, M.; Caffey, S. M.; Luhan, G. A. (2025). Analysis of design algorithms and fabrication of a graph-based double-curvature structure with planar hexagonal panels. arXiv. [CrossRef]
- Gorjian, M.; Caffey, S. M.; Luhan, G. A. Exploring architectural design 3D reconstruction approaches through deep learning methods: A comprehensive survey. Athens Journal of Sciences 2025, 12, 1–29. [Google Scholar] [CrossRef]
- Ledraa, T.; Aldubikhi, S. A. Unveiling the value of green amenities: A mixed-methods analysis of urban greenspace impact on residential property prices across Riyadh neighborhoods. Buildings 2025, 15. [Google Scholar] [CrossRef]
- Li, Q.; Wu, R.; Zhu, P. Quality or quantity of urban greenery: Which matters more to mental health? Evidence from housing prices in the Pearl River Delta. Landscape and Urban Planning 2025, 263, 105438. [Google Scholar] [CrossRef]
- Lieber, J. K. (2022). A hedonic pricing model in Helsinki, Finland: Exploring the impacts of green infrastructure on apartment listing prices (Master’s thesis, Glasgow Caledonian University, LAB University of Applied Sciences, University of Huelva).
- Moradi, G.; Operajuneghani, E.; Dehghan Benadkuki, F.; Ghanbari, S.; Moradi, M. The effect of green spaces on housing prices using hedonic method in Iran. Environmental Resources Research 2022, 10, 279–290. [Google Scholar] [CrossRef]
- Raina, A. S.; Mone, V.; Gorjian, M.; Quek, F.; Sueda, S.; Krishnamurthy, V. R. (2024, June 3). Blended physical-digital kinesthetic feedback for mixed reality-based conceptual design-in-context. In Proceedings of the 50th Graphics Interface Conference; pp. 1–6. [CrossRef]
- Ramírez-Juidías, E.; Amaro-Mellado, J.-L.; Leiva-Piedra, J. L. Influence of the urban green spaces of Seville (Spain) on housing prices through the hedonic assessment methodology and geospatial analysis. Sustainability 2022, 14, 16613. [Google Scholar] [CrossRef]
- Sekulova, F.; Ruiz Mallén, I. The governance configurations of green schoolyards. Environmental Science and Policy 2024, 156, Article 103752. [Google Scholar] [CrossRef]
- Seo, J.; Kim, J. Exploring the moderating effect of private green space on the relationship between density and housing prices. Habitat International 2024, 154, 103231. [Google Scholar] [CrossRef]
- Setiowati, R.; Koestoer, R. H.; Andajani, R. D. Valuation of urban green open space using the Hedonic price model. Global Journal of Environmental Science and Management 2024, 10, 451–472. [Google Scholar] [CrossRef]
- van den Bogerd, N.; Maas, J. Development and testing of the green schoolyard evaluation tool (GSET). Landscape and Urban Planning 2024, 241, Article 104921. [Google Scholar] [CrossRef]
- van den Bogerd, N.; Struiksma, M.; Hovinga, D.; Maas, J. From green to greener: Exploring associations between green schoolyard design and primary school children’s recess behaviors. Urban Forestry & Urban Greening 2025, 107, Article 128809. [Google Scholar] [CrossRef]
- Zhang, Y.; Wang, S.; Ma, Y.; Peng, C.; Qu, M.; Xu, A.; Xing, X.; Yin, W. Value-added benefits of green space: A systematic analysis of the relationship between urban green space and commercial house prices in Beijing based on remote sensing technology. Sensors and Materials 2022, 34, 4247–4262. [Google Scholar] [CrossRef]
Figure 1.
Conceptual Framework for Methodological Approaches in Urban Green Space and Schoolyard Greening Research.
Figure 1.
Conceptual Framework for Methodological Approaches in Urban Green Space and Schoolyard Greening Research.
Disclaimer/Publisher’s Note: The statements, opinions and data contained in all publications are solely those of the individual author(s) and contributor(s) and not of MDPI and/or the editor(s). MDPI and/or the editor(s) disclaim responsibility for any injury to people or property resulting from any ideas, methods, instructions or products referred to in the content. |
© 2025 by the authors. Licensee MDPI, Basel, Switzerland. This article is an open access article distributed under the terms and conditions of the Creative Commons Attribution (CC BY) license (http://creativecommons.org/licenses/by/4.0/).
Copyright: This open access article is published under a Creative Commons CC BY 4.0 license, which permit the free download, distribution, and reuse, provided that the author and preprint are cited in any reuse.


