
Submitted:
01 August 2025
Posted:
04 August 2025
You are already at the latest version
Abstract
Freeze-thaw cycles (FTCs) influence soil nitrogen dynamics and soil aggregate stability. However, the driving mechanism affecting aggregate stability from the combined perspective of nitrogen (N) components and nitrogen distribution by 15N tracing technology in both bulk soils and soil aggregates remains worth exploring. This study took the farmland Mollisols in Hailun City, Heilongjiang Province, as the research object, and investigated the variations of soil nitrogen components and aggregate stability across five freeze-thaw frequencies (1, 3, 5, 9, and 17 cycles) under three freeze-thaw temperatures (-9 ℃/5 ℃, -18 ℃/5 ℃, and -26 ℃/5 ℃) using 15N tracing technology. Results demonstrated that freeze-thaw frequency and temperature both influenced aggregate stability in Mollisols. Specifically, with the increase of freeze-thaw frequency, soil aggregate stability was reduced through decreasing the proportion of macroaggregates (2-0.25 mm), increasing the proportion of silt + clay fractions (<0.053 mm), and reducing the TN content of silt + clay fractions and ¹⁵N-labeled TN content of macroaggregates, under higher freezing temperature (-9 ℃/5 ℃). In contrast, for lower freezing temperature (-18 ℃/5 ℃ and -26 ℃/5 ℃), the increased freeze-thaw frequency enhances soil aggregate stability by decreasing the proportion of silt + clay fractions, increasing the proportion of microaggregates (0.25-0.053 mm), and reducing the TN and ¹⁵N-labeled TN contents of microaggregates and silt + clay fractions. Therefore, in regions with higher freezing temperature, conservation tillage practices are recommended to maintain soil aggregate stability and preserve soil structure by minimizing exposure to additional freeze-thaw cycles. In regions with lower freezing temperature, it is advisable to limit the application of excessive nitrogen fertilizers to mitigate potential nitrogen losses. These findings are essential for developing strategies to mitigate the adverse effects of FTCs on soil quality and ecosystem functions in cold regions.
Keywords:
freeze-thaw frequency
; freeze-thaw temperature
; nitrate nitrogen
; microbial biomass nitrogen
; relative contribution rate
; allocation amount and ratio
1. Introduction
Freeze-thaw cycles (FTCs), which are a common phenomenon in cold regions during the winter-spring transition, significantly impact soil structure, nutrient dynamics, and microbial activity, thereby affecting soil quality and ecosystem functions [1,2,3,4,5,6]. Understanding the effects of FTCs on soil properties is crucial for sustainable land management and predicting soil responses to climate change.
Soil total nitrogen (TN) is crucial for maintaining soil fertility, supporting plant growth, and enhancing soil health, which plays a vital role in soil structure, nutrient cycling, microbial activity, and nitrogen accumulation [7]. However, due to the high organic matter content in soil, TN is often unresponsive to short-term agricultural management changes, making it difficult to detect changes over brief periods [8]. Soil labile nitrogen components, such as nitrate nitrogen (NO₃⁻-N), ammonium nitrogen (NH₄⁺-N), and microbial biomass nitrogen (MBN), which have short turnover times, can rapidly respond to changes in soil management practices and environmental conditions, and serve as important indicators for assessing soil quality and sustainability [9,10,11,12,13]. The contents of TN and labile nitrogen (N) components could be increased, decrease, or show no significant differences, or exhibit a fluctuating tendency due to freeze-thaw action [14,15,16,17]. This demonstrates that FTCs can exert diverse impacts on soil nitrogen availability, emphasizing the complexity of nitrogen dynamics in soils subjected to FTCs.
Soil aggregates serve as the fundamental units of soil structure, influencing soil porosity, water retention, and resistance to erosion, among other properties [18,19,20,21]. The amount and size of these aggregates are crucial factors that determine the rate and extent of physical processes such as soil erosion and compaction [22]. Soil aggregate stability is also one of the important indicators that reflect the soil structure status, which not only plays an important role in regulating soil fertility and maintaining land productivity, but also has a close relationship with soil erosion and environmental quality [23,24,25]. As an abiotic force, freeze-thaw can change soil water content, water distribution and soil temperature, and also affect soil microbial activity to a certain extent, thus affecting the physical structure and properties of soils [26,27]. When freezing, the water in the soil void condenses into ice crystals and expands in volume, thus breaking the bond between soil particles and destroying soil aggregates [28]. The alternating cycle of freeze-thaw can effectively break the larger aggregates in the soil into smaller aggregates, and the fine particles in the soil tend to aggregate to medium-sized particles [29].
The study of Taskin and Ferhan (2003) on clay and sandy soil showed that the content of wet aggregates decreased by 28.6-51.7% when the soil was frozen and thawed for 9 times, and the increase of water content promoted the decrease of aggregates [30]. However, the content of soil wet aggregates increased gradually at 3-6 times of freezing and thawing, and began to decrease after six FTCs. Edwards (2013) concluded that after freezing and thawing a loam for 15 cycles, the content of macroaggregates (> 4.75 mm) decreased by 20-28%, and that of while microaggregates (< 0.5 mm) increased by 32-50% [31]. The mass fraction of macroaggregates was higher than that of microaggregates, and the overall aggregate content decreased [32]. Due to the increase of porosity, the moisture conductivity of saturated soil after freezing and thawing increases compared with that before freezing, and the increment is most significant when the soil has undergone one freeze-thaw and the fine grain and dry bulk density increase [33]. Compared with the soil that has undergone one freeze-thaw, the moisture conductivity of soil after multiple freeze-thaw increases slightly, but tends to a constant [34]. Therefore, the balance between these effects depends on the frequency and temperature of FTCs, as well as the initial soil conditions.
The application of ¹⁵N-labeled corn straw provides a robust tracer approach to quantify the relative contribution rate, allocation patterns, and transformation efficiency of residue-derived nitrogen within soil nitrogen fractions [35,36]. Straw nitrogen can enter the soil nitrogen component after decomposition and transformation in the soil, and the undecomposed straw will remain in the soil to enhance the soil nitrogen storage [37,38]. Currently, there is limited research on the distribution and fixation of corn straw nitrogen in the bulk soils and aggregates in Mollisols under different freeze-thaw frequencies and intensities. Additionally, studies on the driving mechanisms of soil aggregate stability induced by freeze-thaw action from the combined perspective of nitrogen components and nitrogen allocation in both bulk soils and soil aggregates are also scarce. Therefore, this study aims to (1) investigate the effects of FTCs on the nitrogen components and nitrogen distribution by stable isotope tracing technique in bulk soils and soil aggregates, (2) quantify soil aggregate stability under different freeze-thaw frequencies and intensities, and (3) identify the relationship between soil aggregate stability and nitrogen components under freeze-thaw action in Mollisols. This knowledge is essential for developing strategies to mitigate the adverse effects of FTCs on soil quality and ecosystem functions in cold regions.
2. Materials and Methods
2.1. Experimental Site
This study selected the typical farmland Mollisols in the black soil belt of Northeast China. The research area is located in Hailun agricultural ecological experiment station, Chinese Academy of Sciences of Hailun City, Heilongjiang Province (47°27′N, 126°56′E). The parent material is Quaternary loeslike parent material, which belongs to the middle and temperate continental monsoon climate, with an annual average temperature of 1.5℃ and annual precipitation of 550 mm. In agricultural fields, crops such as soybean (Glycine max Merr.) and corn (Zea mays L.) are grown under a one-crop-per-year system. The soil is a typical Black soil or Mollisols [39]. The percentage of soil silt, clay, and sand is 43%, 35%, and 22%, respectively. The basic physicochemical properties of soil are as following: soil pH of 6.10, soil organic matter (SOM) of 50.6 g kg-1, bulk density (BD) of 1.27 g cm-3, TN of 2.6 g kg-1, total phosphorus (TP) of 1.6 g kg-1 and total potassium (TK) of 13.8 g kg-1.
2.2. Preparation of the Straw Used in the Experiment
The straw in freeze-thaw experiment was corn straw with 15N-labeled nitrogen content. The soil used for planting corn in the microplot experiment was collected from the 0-30 cm depth by the Hailun Agricultural Ecological Experimental Station, Chinese Academy of Sciences. The plastic pots used for growing corn had an inner diameter of 30 cm and a height of 32 cm. Each microplot was filled with 19 kg of soil and fertilized with urea, potassium chloride, and triple superphosphate as the base fertilizers. 15N-labeled fertilizers were applied at different growth stages of corn to label the nitrogen in the straw. Corn was sown in March 2021 and harvested in November 2021. After the corn was harvested, the corn straw was collected for weighing and measuring plant height. The plants were separated into grains, straw, and roots. After testing, the straw was subjected to steaming at 105 ℃ for 30 minutes, dried at 65 ℃ until constant weight, ground, and then passed through a 0.25 mm sieve before being bagged for later use. The basic physicochemical properties of the experimental corn straw are as following: pH of 6.31, total carbon (TC) of 457.20 g kg-1, TN of 5.82 g kg-1, the ratio of carbon to nitrogen (C/N) of 78.58, and δ15N value of 5439.72 ‰.
2.3. Soil Column Filling
The soil columns used in the experiment were cylindrical polyethylene (PE) bottles with a diameter of 10 cm and a height of 13 cm. Each soil column was filled with 1300 g of soil, and the soil moisture content was adjusted to 25% using distilled water. The experiment included the addition of straw containing 15N-labeled nitrogen. The straw was applied at a rate equivalent to 7500 kg ha-1, which corresponded to adding 3.6750 g of straw per soil column. The straw was mixed evenly and placed into nylon mesh bags with a mesh size of 350 and dimensions of 7 cm × 7 cm. These bags were buried in the soil columns to ensure that the thickness of the soil above and below the straw was consistent. To mitigate the immobilization of soil nitrogen caused by the high C/N ratio of the straw, nitrogen fertilizer in the form of urea was applied to the soil columns in proportion. The caps of the bottles were put back on after all the soil columns were filled.
2.4. Soil Pre-Cultivation, Freeze-Thaw Treatment, and Soil Sampling
The three freeze-thaw intensities were conducted with different temperatures for freezing and thawing: -9 ℃/5 ℃, -18 ℃/5 ℃, and -26 ℃/5 ℃. After the 7-day pre-cultivation, the soil columns were placed into a refrigerator for freezing. The timing began when the refrigerator temperature reached the set point of -9 ℃/-18 ℃/-26 ℃. After freezing for 84 hours, the soil columns were removed and placed into a refrigerator set at 5 ℃ for 84 hours of thawing, thus constituting a freeze-thaw cycle.
Under the three different freeze-thaw intensities, the soil columns were subjected to 1, 3, 5, 9, and 17 freeze-thaw cycles, respectively. Each treatment of the freeze-thaw frequency and temperature had three replications. During the incubation period, soil columns corresponding to each freeze-thaw frequency treatment were taken out for destructive sampling to facilitate subsequent experiments. Soil samples from each treatment were collected and divided into three portions. Two portions were air dried, ground, and sieved through mesh sizes of 10 mm and 0.149 mm to determine soil aggregates and TN content, respectively. The remaining soil was manually disrupted, plant debris removed, sieved through a 2-mm sieve, and stored at -80 ℃ for the analysis of NO3--N, NH4+-N, and MBN contents.
2.5. Determination Indicators and Methods
2.5.1. TN and 15N-Labeled TN Contents in Bulk Soils
The measurements were conducted using an elemental analyzer coupled with an isotope ratio mass spectrometer (lementar vario PYRO cube-Iso Prime100 Isoto Pe Ratio Mass SPectrometer, Germany). The δ¹⁵N (δ, ‰), ¹⁵N abundance (F, %), and 15N-labeled TN content in soils were calculated using Equations (1) - (3), respectively.
δ = (R-Rstandard)/Rstandard × 1000
F= [(δ+1000) × Rstandard]/[(δ+1000) × Rstandard + 1000] × 100
15N-labeled TN content = TN content × F
In the formula, R and Rstandard represent the 15N/14N atomic ratios of the sample and the standard material, respectively. The nitrogen standard material is pure atmospheric nitrogen, with Rstandard being 0.0036765 [40].
2.5.2. NO3--N, NH4+-N, and Their 15N-Labeled Nitrogen Contents in Bulk Soils
Soil NH₄⁺-N and NO₃⁻-N were extracted with KCl solution. NH₄⁺-N was measured by indophenol blue colorimetry, and NO₃⁻-N was determined by dual-wavelength ultraviolet spectrophotometry [41]. The measurement of NH₄⁺-¹⁵N, and NO₃⁻-¹⁵N contents in soil was conducted using the modified micro-diffusion method, as described by Griesheim and Mulvaney (2019) [42]. A 20 mL portion of the filtrate was transferred into a 250 mL Schott bottle fitted with a suspended filter paper. Subsequently, 0.1 g of MgO and 20 µL of 1 mol L⁻¹ oxalic acid were added. The bottle was then placed on a shaker and shaken at 25°C, 140 r min⁻¹ for 24 hours to facilitate the diffusion of NH₄⁺-¹⁵N. The filter paper was removed and placed into a desiccator for drying over a period of 24 hours. Concurrently, two acidified filter papers were inserted into the Schott bottle, and the diffusion process continued for an additional 48 hours to eliminate any residual NH₄⁺-¹⁵N. Following, two more acidified filter papers and 0.1 g of Devarda’s alloy were added, and the diffusion was carried out for another 24 hours to complete the diffusion of NO₃⁻-¹⁵N. Thereafter, the filter papers were removed and placed into the desiccator to dry for an additional 24 hours. After drying, the filter papers were analyzed for 15N abundance using an elemental analyzer connected to an isotope ratio mass spectrometer (Elementar vario PYRO cube-Iso Prime100 Isotope Ratio Mass Spectrometer, Germany). The 15N-labeled NO₃⁻-N and NH₄⁺-N contents are calculated as the products of their respective NO₃⁻-N and NH₄⁺-N contents and 15N abundance.
2.5.3. MBN and 15N-Labeled MBN Contents in Bulk Soils
The soil microbial biomass was determined using the chloroform fumigation with 0.5 mol L-1 K2SO4 solution extraction method [43]. The TN content in the extract was measured using the 3% alkaline persulfate oxidation method combined with an AA3 flow injection analyzer (Bran + Luebbe, Germany). The soil MBN content is the difference in labile nitrogen content between fumigated and non-fumigated soil samples, with a correction factor (kEC) of 0.45 [12,44,45]. Six milliliters of the non-fumigated or fumigated extract (with chloroform removed for fumigated samples) were taken and freeze-dried. The δ15N value in the samples were then determined using an elemental analyzer coupled with an isotope ratio mass spectrometer (lementar vario PYRO cube-Iso Prime100 Isoto Pe Ratio Mass SPectrometer, Germany).
The fumigated δMB¹⁵N (δ1, ‰), non-fumigated δMB¹⁵N (δ2, ‰), fumigated MB¹⁵N abundance (F1, %), non-fumigated MB¹⁵N abundance (F2, %), fumigated 15N-labeled MBN content, and non-fumigated 15N-labeled MBN content in soils were calculated using Equations (4)-(9), respectively.
δ1= (R1-Rstandard)/Rstandard × 1000
δ2= (R2-Rstandard)/Rstandard × 1000
F1= [(δ1+1000) × Rstandard]/[(δ1+1000) × Rstandard + 1000] × 100
F2= [(δ2+1000) × Rstandard]/[(δ2+1000) × Rstandard + 1000] × 100
Fumigated 15N-labeled MBN content = Fumigated MBN content × F1
Non-fumigated 15N-labeled MBN content = Non-fumigated MBN content × F2
15N-labeled MBN content = Fumigated 15N-labeled MBN content -Non- fumigated 15N-labeled MBN content
In the formula, R1 and R2 represent the 15N/14N atomic ratios of the fumigated and non-fumigated samples, respectively. Rstandard indicate the 15N/14N atomic ratios of the standard material. The nitrogen standard material is pure atmospheric nitrogen, with Rstandard being 0.0036765 [41].
2.5.4. Soil Aggregate Fractionation Methods, and TN and 15N-Labeled TN Contents in Soil Aggregates
A Soil Aggregate Analyzer (TTF-100 type, China) was utilized to separate the soil aggregates through the wet-sieving method. 50 g of air-dried soil samples passed through a 10 mm sieve were uniformly spread across the nested sieves with mesh sizes of 2 mm, 1 mm, 0.5 mm, 0.25 mm, and 0.053 mm to separate the soil into six different aggregate sizes. The nest was positioned at the peak of the oscillating cylinder, with distilled water being added to each cylinder until it reached above the highest sieve. Before proceeding with wet-sieving, the soils were immersed in distilled water for 10 minutes. Throughout the fractionating process, the stroke length in the vertical direction stayed constant at 4 cm, the oscillation time at 10 minutes, and the frequency at 900 cycles per hour. According to the procedures mentioned above, the soil aggregates were classified into six different sizes of > 2 mm, 2-1 mm, 1-0.5 mm, 0.5-0.25 mm, 0.25-0.053 mm, and < 0.053 mm. The TN content and δ15N value in each aggregate size were then measured using an elemental analyzer coupled with an isotope ratio mass spectrometer. The 15N-labeled TN content is calculated as the product of TN content and 15N abundance.
2.6. Data Calculation
2.6.1. Soil Aggregate Stability
The indicators of soil aggregate stability included proportion of aggregates with a size larger than 0.25 mm in diameter (R0.25), mean weight diameter (MWD), geometric mean diameter (GMD), and fractal dimension (D). These four indicators were computed by Equations (11)-(14), based on the methods described by Zhou et al. (2020), Bavel (1950), Kemper and Rosenau (1986), and Yang et al. (1993), respectively [19,46,47,48].
where Mr>0.25 indicates the mass of aggregates that are larger than 0.25 mm, MT means the total mass of the aggregates, refers to the mean diameter of each size (mm), calculated as the average of the minimum and maximum diameters within each aggregate, Xmax indicates the soil particles with a diameter of 10 mm, and signifies the sum of soil weights with size ≤ .
2.6.2. Relative Contribution Rate, Allocation Amount, and Allocation Rate
Relative contribution rate (f, %), allocation amount (Cs-straw, mg kg-1) and allocation ratio (P, %) of straw nitrogen in soil nitrogen components were calculated by Equations (15)-(17), which was according to the methods described by De Troyer et al. (2011), Liang et al. (2011), and Chen et al. (2018), respectively [9,12,49].
where δs and δCK represent the δ15N (‰) in soil nitrogen components after incubation with and without added straw, respectively. δR represents the initial δ15N (‰) of the corn straw before incubation. Cs denotes the content of soil nitrogen components in the straw-added treatment after incubation (mg kg-1 soil), and C’R represents the initial TN content of the corn straw (g kg-1 soil).
f = (δs-δCK)/(δR-δCK) × 100
Cs-straw = Cs × f
P= Cs-straw / C’R × 100
2.7. Statistical Analysis
A one-way ANOVA was conducted to compare the contents of soil nitrogen components (TN, NO3--N, NH4+-N, and MBN) and their 15N-labeled nitrogen components, and relative contribution rate, allocation amount and ratio, as well as the distribution of each soil aggregate size and soil aggregate stability indicators, across the different freeze-thaw frequencies. The mean treatment effects were compared by the test of Tukey’s honestly significant difference at p < 0.05. The Pearson correlation analysis was conducted by SPSS software version 20.0 (IBM, Armonk, NY, USA). The plots showing the contents of nitrogen components and 15N-labeled nitrogen components, relative contribution rate, allocation amount and ratio in bulk soils and soil aggregates, as well as the distribution of each soil aggregate size, and soil aggregate stability indicators were generated using Origin software 2021 (OriginLab, Northampton, MA, USA).
3. Results
3.1. Effects of Freeze-Thaw Frequency and Temperature on Soil Nitrogen Components and 15N-Labeled Nitrogen Components Dynamics in Bulk Soils
As the frequency of freeze-thaw cycles grows, there was a noticeable increase in the contents of soil nitrogen components, including TN (Figure 1a), NO3--N (Figure 1b), NH4+-N (Figure 1c), and MBN (Figure 1d), within the range of freezing temperatures studied. Specifically, across the three freezing temperatures, compared with 1 freeze-thaw cycle, the 17 cycles were all significantly (p < 0.05) enhanced soil TN, NO3--N, NH4+-N, and MBN contents by 18.87-20.04%, 51.28-66.71%, 62.66-221.20%, and 1.36-6.49 fold, respectively (Figure 1a–d). Simultaneously, their corresponding 15N-labeled counterparts had the similar tendency (Figure 1e–h). Among the three freezing temperatures, the 15N-labeled TN, NO3--N, NH4+-N, and MBN contents were also all significantly increased (p < 0.05) after 17 freeze-thaw cycles compared to 1 cycle, with enhancements ranging from 29.58-31.84% (Figure 1e), 150.96-172.84% (Figure 1f), 107.87-275.74% (Figure 1g), and 3.65-9.79 fold (Figure 1h) correspondingly.
Lower freezing temperature led to greater reduction in soil TN and NO3--N contents, as well as their corresponding 15N-labeled nitrogen contents, within the range of the numbers of freeze-thaw cycles studied (Figure 1a,b,e,f). The contents of soil NH4+-N and 15N-labeled NH4+-N changed inconsistently with the decrease of freezing temperature under the five freeze-thaw frequencies (Figure 1c,g). Specifically, as freezing temperature decreases, the contents of soil NH4+-N and 15N-labeled NH4+-N in the 1 and 3 freeze-thaw cycles both increased, while that in the 5, 9 and 17 freeze-thaw cycles decreased first and then increased (Figure 1c,g). In addition, soil MBN and 15N-labeled MBN contents in the five freeze-thaw frequencies all increased first and then decreased with the decrease of freezing temperature (Figure 1d,h).
3.2. Effects of Freeze-Thaw Frequency and Temperature on Relative Contribution Rate, Allocation Amount and Allocation Ratio of Corn Straw Nitrogen in Soil Nitrogen Components for Bulk Soils
In general, the relative contribution rate, allocation amount and allocation ratio of corn straw nitrogen in soil TN, NO3--N, NH4+-N, and MBN all enhanced as freeze-thaw frequency increases at any freezing temperature (Figure 2). Specifically, the relative contribution rate of corn straw nitrogen in soil TN significantly (p < 0.05) increased by 21.11% and 19.82% under 17 freeze-thaw cycles compared to 1 cycle at freezing temperatures of -9 ℃ and -18 ℃ (Figure 2a). Simultaneously, compared with 1 freeze-thaw cycle, the relative contribution rate of corn straw nitrogen in soil NO3--N under 5, 9, and 17 cycles were significantly increased (p < 0.05) by 43.1-139.51% for -9 ℃, by 55.03-164.24% for -18 ℃, and by 34.62-112.93% for -26 ℃ freezing temperature (Figure 2b). In regard to the relative contribution rate of corn straw nitrogen in soil NH4+-N, only 17 freeze-thaw cycles increased by 64.36% than 1 cycle at -18 ℃ freezing temperature, other freeze-thaw cycles at the three freezing temperatures showed no significant (p ≥ 0.05) difference (Figure 2c). With respect to the relative contribution rate of corn straw nitrogen in soil MBN, compared to 1 freeze-thaw cycle, the 17 freeze-thaw cycles increased by 33.02% at -9 ℃ freezing temperature, and 9 and 17 cycles enhanced by 23.59% and 35.06% at -26 ℃ freezing temperature respectively, while no obvious difference (p ≥ 0.05) was observed among the five freeze-thaw frequencies at -18 ℃ freezing temperature (Figure 2d).
The similar tendency was observed between allocation amount and allocation ratio of corn straw nitrogen in soil nitrogen components (Figure 2e–l). In comparison with 1 freeze-thaw cycle, the other four cycles both increased allocation amount and ratio of corn straw nitrogen in soil TN, NO3--N, NH4+-N, and MBN to varying degrees across the three freezing temperatures (Figure 2e–l). The increments for allocation amount ranged from 29.58-69.58% (Figure 2e), 89.82-621.61% (Figure 2f), 2.1-4.49 fold (Figure 2g), and 4.74-13.54 fold (Figure 2h) correspondingly, and allocation ratio showed the same increments (Figure 2i–l).
The labile nitrogen components, including NO3--N, NH4+-N, and MBN, showed the noticeable changes under the same freeze-thaw frequency among the three freezing temperatures (Figure 2a–i). With the decrease of freezing temperature (the decrease of freezing temperature), the relative contribution rate, allocation amount and ratio of corn straw nitrogen in soil NO3--N all first increased and then slowly decreased (Figure 2b,f,j). The allocation amount and ratio of soil TN and NH4+-N showed a decreasing trend (Figure 2a,e,i,c,g,k), and that of soil MBN raised first and then fell sharply (Figure 2d,h,l).
3.3. Effects of Freeze-Thaw Frequency and Temperature on Soil Total Nitrogen and 15N-Labeled Total Nitrogen Dynamics in Soil Aggregates
With the increase of freeze-thaw frequency, TN contents in each soil aggregate size tended to decrease at any freezing temperature (Figure 3a–c). However, the 15N-labeled TN content in > 2 mm, 2-1 mm, 0.25-0.053 mm, and < 0.053 mm aggregate sizes mostly decreased or remained constant, while the 15N-labeled TN content in 1-0.5 mm and 0.5-0.25 mm aggregate sizes fluctuated (Figure 3d–f). Detailedly, at -9 ℃ freezing temperature, compared to 1 freeze-thaw cycle, the 3, 4, and 17 cycles all significantly (p < 0.05) reduced 15N-labled TN content by 13.33%, 19.90%, and 12.21 respectively, for 1-0.5 mm aggregate size; the 3 cycles significantly (p < 0.05) increased 15N-labled TN content by 10.23%, while 17 cycles obviously (p < 0.05) decreased it by 13.85%, for 0.5-0.25 mm aggregate size (Figure 3d). At -18 ℃ freezing temperature, in comparison with 1 freeze-thaw cycle, the 3 and 17 cycles significantly (p < 0.05) decreased 15N-labled TN content by 9.82% and 12.39% correspondingly, while 9 cycles significantly (p < 0.05) enhanced it by 16.03%, for 1-0.5 mm aggregate size; the other four cycles all significantly reduced 15N-labled TN content by 21.91-29.63%, for 0.5-0.25 mm aggregate size (Figure 3e). At -26 ℃ freezing temperature, only 5 freeze-thaw cycles increased 12.84% 15N-labled TN content than 1 cycle, for 1-0.5 mm aggregate size (Figure 3f).
Furthermore, with the decrease of soil aggregate sizes, the contents of TN and 15N-labeled TN at each freezing temperature and frequency showed a trend of decreasing-increasing- decreasing, and the maximum value basically appeared in the aggregate size of 0.25-0.053 mm (Figure 3). In addition, the contents of TN and 15N-labeled TN under the five freeze-thaw frequencies on each soil aggregate size generally showed a decreasing trend as freezing temperature decreases (Figure 3).
3.4. Effects of Freeze-Thaw Frequency and Temperature on Relative Contribution Rate, Allocation Amount and Allocation Ratio of Corn Straw Nitrogen in Total Nitrogen for Soil Aggregates
With the increase of freeze-thaw frequency, at -9 and -18 ℃, the most obvious changes in relative contribution rate was 0.5-0.25 mm aggregate size, and the other 4 freeze-thaw cycles reduced relative contribution rate by 24.64-43.55% than 1 cycle (Figure 4a,b). At -26 ℃, the relative contribution rate of < 0.053 mm aggregate size exhibited the largest variation, showing a trend of first rising and then falling (Figure 4c). Compared with 1 freeze-thaw cycle, the relative contribution rate of 3 cycles significantly (p < 0.05) increased by 33.46%, while that of 5, 9, and 17 cycles significantly (p < 0.05) decreased by 27.34%, 17.33% and 24.52% respectively (Figure 4c).
In regard to allocation amount, as freeze-thaw frequency increases, the largest changes were existed in the 1-0.5 mm and 0.5-0.25 mm aggregate sizes at -9 ℃ freezing temperature (Figure 4d). Compared with 1 freeze-thaw cycle, the other 4 cycles reduced allocation amount by 19.59-43.18% and 31.74-41.46% in the 1-0.5 mm and 0.5-0.25 mm aggregate sizes correspondingly (Figure 4d). At -18 ℃, only 0.5-0.25 mm size showed the largest change (Figure 4e). Compared with the first freeze-thaw cycle, the other 4 freeze-thaw cycles significantly (p < 0.05) reduced allocation amount by 52.68-58.77% than 1 cycle for 0.5-0.25 mm aggregate size (Figure 4e). At -26 ℃, the biggest change was found in the < 0.053 mm size, which showed a trend of first increasing and then decreasing (Figure 4f). Compared with 1 freeze-thaw cycle, the allocation amount was increased by 43.17% in the 3 cycles, while it was decreased significantly in the 5, 9, and 17 cycles by 42.49%, 32.38% and 40.38% respectively, for the < 0.053 mm size (Figure 4f). Simultaneously, the variation tendency of allocation ratio was consistent with allocation amount (Figure 4g–i).
3.5. Effects of Freeze-Thaw Frequency and Temperature on Soil Aggregate Distribution
As the freeze-thaw frequency increases, the proportion of each aggregate size changed significantly, but its variation trend was different under the three freezing temperatures (Figure 5). At the freezing temperature of -9 ℃, with the increase of freeze-thaw frequency, the proportions of > 2 mm and < 0.053 mm sizes tended to increase with the increments of 120.42% and 150.96% respectively, while those of 2-1 mm, 1-0.5 mm and 0.5-0.25 mm sizes decreased, and the proportion of 0.25-0.053 mm size remained unchanged (Figure 5a).
Different from the treatment at -9 ℃, with the increase of freeze-thaw frequency at -18 ℃ and -26 ℃, the proportions of > 2 mm and 2-1 mm aggregate sizes showed an “M” shaped trend of increasing-decreasing-increasing (Figure 5b,c). The proportion of 0.5-0.25 mm size at -18 ℃ and 0.25-0.053 mm size at -26 ℃ significantly (p < 0.05) increased as freeze-thaw frequency increases, and the increments were 71.54% and 93.53% after 17 freeze-thaw cycles compared with 1 cycle, respectively (Figure 5b,c). The proportion of < 0.053 mm size decreased as the frequency of freeze-thaw increased. Specifically, it decreased by 22.59% at -18℃ and by 23.13% at -26℃ after 17 freeze-thaw cycles compared to just 1 cycle (Figure 5b,c).
3.6. Effects of Freeze-Thaw Frequency and Temperature on Soil Aggregate Stability
At -9 ℃ freezing temperature, with the increase of freeze-thaw frequency, the values of R0.25, MWD and GMD gradually decreased, but the value of fractal dimension gradually increased, indicating the decreasing aggregate stability (Figure 6a–d). At -18 ℃ and -26 ℃, the situation was basically opposite to that at -9 ℃. MWD and GMD showed an M-shaped trend (Figure 6b,c). The fractal dimension of soil aggregates tended to be stable after 3 freeze-thaw cycles under three different freezing temperatures (Figure 6d). In comparison with 1 cycle, the 17 cycles significantly (p < 0.05) reduced the value of fractal dimension by 26.51%, 3.56%, and 3.10% at -9 ℃, -18 ℃, and -26 ℃, correspondingly (Figure 6d).
3.7. Relationships of Soil Properties in Bulk Soils and Soil Aggregate Sizes Under Freeze-Thaw Action
Two factor analysis of variance revealed that the freeze-thaw frequency, freeze-thaw temperature, and their interaction showed significant effects on the MBN content, as well as the relative contribution rate, allocation amount and allocation ratio of NO3--N in the bulk soil, and all of them have reached the extreme significant level (Table 1). For soil aggregates, freeze-thaw frequency, freeze-thaw temperature, and their interaction had significant effects on the 15N-labeled TN content of each size, and presented significant effects on the relative contribution rate of 1-0.5 mm, 0.5-0.25 mm, 0.25-0.053 mm and < 0.053 mm sizes (Table 1). Simultaneously, it showed significant influence on the allocation amount and ratio of > 2 mm, 1-0.5 mm, 0.5-0.25 mm, 0.25-0.053 mm and < 0.053 mm sizes. Moreover, the freeze-thaw frequency, freeze-thaw temperature, and their interaction had extremely significant effects on the four indexes of aggregate stability (Table 1).
Pearson correlation analysis demonstrated that the contents of NO3--N and MBN in bulk soils, as well as the proportion of 2-1 mm, 0.5-0.25 mm, and < 0.053 mm aggregate sizes, the TN content of 2-1 mm aggregate size, and the 15N-labeled TN content of 2-1 mm and < 0.053 mm aggregate sizes all had the significant correlation with fractal dimension (Table 2). There were negative and significant correlations between the fractal dimension and the relative contribution rate, allocation amount, and allocation ratio in bulk soils under the freeze-thaw action of -26 ℃/5 ℃. However, as for the aggregates, no consensus was observed between the fractal dimension and the relative contribution rate, allocation amount, and allocation ratio for each freeze-thaw temperature (Table 2). Therefore, the conceptual diagram illustrating the response mechanism of soil nitrogen components to aggregate stability under varying freeze-thaw frequencies and intensities was illustrated in Figure 7.
4. Discussion
4.1. Dynamics of Nitrogen Components and 15N-Labeled Nitrogen Components in Bulk Soils Due to Freeze-Thaw Action
This study found that with increasing freeze-thaw frequency (number of cycles), the nitrogen components (TN, NO3--N, NH4+-N, and MBN) and 15N-labeled nitrogen components, as well as their relative contribution rate, allocation amount, and allocation ratio in bulk soils, all showed an increasing trend under three freeze-thaw intensities (Figure 1 and Figure 2), which was consistent with the previous research finding [50]. This phenomenon may be explained by the following aspects. Firstly, freeze-thaw action will destroy the soil aggregate structure, rupture soil microbial cells, release mineral nitrogen, and then release a large amount of nutrients accumulated during the freezing period of soil, increasing the content of inorganic nitrogen nutrients in soils [51,52]. Secondly, frequent freeze-thaw alternations during the thawing of frozen soil increase soil water content, enhance microbial activity, accelerate the nitrification and denitrification processes of soil nitrogen [53,54,55], accelerate the mineralization and decomposition rate of litter, and further increase the effective resources in soils. Thirdly, multiple freeze-thaw alternations can cause the death of soil microorganisms, so that the residual microorganisms in the soil have enough matrix, stimulate microbial activity, and stabilize and utilize the labile nutrients in the soil [56]. Simultaneously, these dead microorganisms decompose under the action of decomposing bacteria, releasing small molecules of amino acids and sugars, thus increasing the soil microbial biomass [57].
With decreasing freezing temperature, the TN and NO3--N contents in bulk soils, as well as their corresponding 15N-labeled nitrogen compounds, tended to decrease, for each freeze-thaw frequency (Figure 1a,b,e,f). Freeze-thaw cycles can enhance nitrogen transformation processes, leading to increased nitrogen losses through leaching and denitrification. Research has indicated that freeze-thaw cycles enhance the leaching of NO₃⁻-N, especially in soils with high initial nitrate levels, which is probably intensified with more intense freeze-thaw activity, leading to a decrease in soil NO₃⁻-N content [58].
The relative contribution rate, as well as the allocation amount and ratio of nitrogen compounds, are also influenced by the temperature of freeze-thaw cycles. The initial increase in MBN indicators followed by a sharp decline in bulk soils with lower freezing temperature (Figure 2d,h,l) aligns with the observation that microbial activity is initially enhanced by freeze-thaw processes, promoting nitrogen mineralization and microbial biomass accumulation [59]. Nevertheless, as the freezing temperature decreases, the extreme temperature changes can impose significant stress on microbial communities, resulting in a reduction of microbial biomass nitrogen [57]. This reduction can further diminish the availability of nitrogen in the soil, since microbial biomass serves as a vital reservoir of organic nitrogen [60]. Furthermore, as freezing temperature decreases, the relative contribution rate and the allocation amount and ratio of NH4+-N decrease (Figure 2c,g,k), while NO3--N shows an initial increase followed by a gradual decline (Figure b,f,j). This trend is likely due to the differential sensitivity of NH4+-N and NO3--N to freeze-thaw processes. NH4+-N is more tightly bound to soil particles due to its positive charge, which allows it to be adsorbed onto negatively charged soil surfaces and makes it less susceptible to leaching. In contrast, NO3--N is more mobile and can be easily lost through leaching and denitrification [61,62].
Freeze-thaw cycles lead to alterations in soil pH, redox potential, and soil structure, thereby influencing nitrogen dynamics [26,63]. Freezing can cause soil compaction and reduce pore size, limiting oxygen availability and promoting denitrification. In contrast, thawing can improve soil aeration, enhancing nitrification [26]. These opposing processes can result in complex changes in nitrogen forms and their availability.
As a consequence, the observed variations in nitrogen components, ¹⁵N-labeled nitrogen compounds, as well as their relative contribution rate, allocation amount and ratio with increasing freeze-thaw frequency and decreasing freezing temperature are probably due to the combined effects of nitrogen transformation and loss, microbial dynamics, differential sensitivity of nitrogen forms, and soil chemical and physical changes [64]. These mechanisms together shape the observed tendencies in nitrogen cycling and availability.
4.2. Variations of Soil Aggregate Stability Induced by Freeze-Thaw Action
As freeze-thaw frequency increases, higher freezing temperature (-9 ℃/5 ℃) are likely to decrease the proportion of macroaggregates (2-1 mm, 1-0.5 mm, and 0.5-0.25 mm) while increasing the proportion of silt + clay fractions (< 0.053 mm) (Figure 5a), resulting in reduced soil aggregate stability (Figure 6). This reduction in macroaggregates is mainly due to the mechanical disruption caused by the expansion of water during freezing, which damages the physical structure of these aggregates [65]. Repeated freeze-thaw cycles at this temperature cause larger aggregates to break down into smaller particles, making them more vulnerable to erosion and loss of stability [66]. Moreover, the relatively higher freezing temperature might not be strong enough to trigger substantial re-aggregation during thawing, leading to an overall decline in aggregate stability [67]. The rise in silt + clay fractions is probably because finer particles are more resilient to the freeze-thaw process or are released from macroaggregates during breakdown [66]. Additionally, as freeze-thaw frequency increases, higher freezing temperature reduce the ¹⁵N-labeled TN content in macroaggregates (2-1 mm, 1-0.5 mm, and 0.5-0.25 mm) (Figure 3d) and the TN content in silt + clay fractions (< 0.053 mm) (Figure 3a). This likely results from the mechanical disruption of macroaggregates during freezing, which releases nitrogen compounds and causes their redistribution into smaller fractions [68]. The decrease in TN content in silt + clay fractions may also be due to these finer particles being more susceptible to leaching and loss during freeze-thaw cycles [14,69].
In contrast, as freeze-thaw frequency increases, lower freezing temperature (-18 ℃/5 ℃ and -26 ℃/5 ℃) tend to increase the proportion of microaggregates (0.25-0.053 mm) while decreasing the proportion of silt + clay fractions (< 0.053 mm) (Figure 5b,c), thereby enhancing soil aggregate stability (Figure 6). The increase in microaggregates could be attributed to the more intense mechanical action of freezing and thawing, which may cause smaller particles to bind together more tightly [70].
Additionally, the reduction in the silt + clay fractions suggests that these particles are either being incorporated into macroaggregates or are being lost through processes like leaching or erosion [16]. Meanwhile, with the increase in freeze-thaw frequency, the TN content tends to decline induced by lower freezing temperature, both in microaggregates (0.25-0.053 mm) and in silt + clay fractions (< 0.053 mm) (Figure 3b,c,e,f). This indicates that higher intense freeze-thaw cycles can induce substantial alterations in the physical structure of smaller aggregates, resulting in the release and potential loss of nitrogen compounds. The decline may also be associated with increased microbial activity and nitrogen mineralization processes that take place during intense freeze-thaw cycles [16,71].
Furthermore, the mechanical pressure exerted by the expansion of water during freezing causes soil aggregates to break down. At -9℃, the mechanical action is strong enough to break apart macroaggregates, but it is not intense enough to facilitate significant re-aggregation during thawing. In contrast, at -18℃ and -26℃, the more extreme temperature changes result in greater mechanical stress, which causes soil particles to reorganize and form more stable aggregates during thawing [72]. At the same time, freeze-thaw cycles can boost microbial activity, especially during thawing. When temperatures are low (-18℃ and -26℃), extreme freeze-thaw cycles can increase microbial activity, which results in the creation of organic compounds that serve as binding agents for soil particles. These organic compounds enhance aggregate stability by facilitating the development of larger and more stable aggregates [72]. In addition, the stability of soil aggregates is also affected by soil pore structure and water content. At -9℃, the relatively higher freezing temperature may not be strong enough to cause substantial alterations in soil pore structure, leading to less stable soil aggregates. In contrast, at -18℃ and -26℃, the more intense freeze-thaw cycles can modify soil pore structure, resulting in improved water retention and movement within the soil. This alteration in soil structure can further boost aggregate stability [66].
The influence of freeze-thaw cycles on soil aggregate stability and nitrogen dynamics is strongly influenced by the temperature and frequency of these cycles. Higher freezing temperature cycles often decrease aggregate stability by fragmenting macroaggregates and increasing the proportion of silt and clay complexes, whereas lower freezing temperature cycles improve aggregate stability by facilitating the formation of microaggregates.
Consequently, understanding these dynamics is essential for forecasting soil behavior in areas with frequent freeze-thaw cycles, especially in high-latitude and high-altitude regions. Future research should concentrate on clarifying the specific mechanisms by which freeze-thaw cycles impact soil aggregate stability and nitrogen dynamics, including the roles of soil physicochemical properties and microbial communities.
5. Conclusion
In terms of bulk soils, with the increase of freeze-thaw frequency, the contents of nitrogen components (TN, NO3--N, NH4+-N, and MBN) and their corresponding15N-labeled nitrogen components, as well as their relative contribution rate, allocation amount and ratio all showed an increasing trend, under the three freeze-thaw intensities. Simultaneously, decreased freezing temperature reduced the contents of TN, NO3--N, 15N-labeled TN, and 15N-labeled NO3--N regardless of freeze-thaw frequency. Additionally, as freezing temperature decreases, the relative contribution rate, allocation amount and ratio of TN and NH4+-N all showed a decreasing trend, while those of NO3--N increased first and then slowly decreased, and those of MBN increased first and then rapidly decreased under the five freeze-thaw frequencies.
For soil aggregates, the freeze-thaw action significantly affect both the proportion of soil aggregates and the nitrogen content within them. With the increase of freeze-thaw frequency, the proportion of macroaggregates (2-1 mm, 1-0.5 mm and 0.5-0.25 mm) and silk + clay fractions (< 0.053 mm) were decreased under the higher freezing temperature (-9 ℃/5 ℃). However, lower freezing temperature (-18 ℃/5 ℃ and -26 ℃/5 ℃) increased the proportion of microaggregates (0.25-0.053 mm) and decrease that of silk + clay fractions (< 0.053 mm). Both higher and lower freezing temperature reduced the contents of TN and 15N-labeled TN in each aggregate size to varying degrees.
Furthermore, both the number of freeze-thaw cycles and freeze-thaw temperature are important factors affecting the stability of soil aggregates. As freeze-thaw frequency increases, higher freezing temperature reduced the stability of soil aggregates, while lower freezing temperature increased the stability in Mollisols. The factors that showed significant relationship with soil aggregate stability included the contents of NO3--N and MBN in bulk soils, the proportions of 2-1 mm, 0.5-0.25 mm and < 0.053 mm aggregate sizes, the TN content of 2-1 mm size and the 15N-labeled TN content of 2-1 mm and < 0.053 mm sizes, regardless of the freeze-thaw frequency and temperature in Mollisols.
Author Contributions
Conceptualization, X.J. and M.Z.; methodology, Y.W., L.M. and M.Z.; software, Y.W. and M.Z.; validation, M.Z.; formal analysis, Y.W. and M. Z.; investigation, H.Y. and Y.C.; resources, X.J. and Y.S.; data curation, Y.W., L.M. and M.Z.; writing—original draft preparation, M.Z.; writing—review and editing, M.Z.; visualization, Y.W. and L.M.; supervision, X.J. and Y.S.; project administration, X.J., M.Z. and Y.S.; funding acquisition, X.J., M.Z. and Y.S. All authors have read and agreed to the published version of the manuscript.
Funding
This research was funded by the National Natural Science Foundation of China (42077081), the National Basic Research Program of China (2021FY100400), the Excellent Young Scientist Program of the Natural Science Foundation of Heilongjiang Province in China (YQ2023D007), the Young Program of the National Natural Science Foundation of China (42307437), and the General Program of the Natural Science Foundation of Jilin Province in China (20240101052JC).
Data Availability Statement
The raw data supporting the conclusions of this article will be made available by the authors on request.
Conflicts of Interest
The authors declare no conflicts of interest.
References
- Rooney, E.C.; Bailey, V.; Patel, K.F.; Dragila, M.; Battu, A.K.; Buchko, A.C.; Gallo, A.C.; Hatten, J.; Possinger, A.R. , Qafoku, O.; Reno, L.R.; SanClements, M.; Varga, T. and Lybrand, R.A. Soil pore network response to freeze-thaw cycles in permafrost aggregates. Geoderma 2022, 411, 115674. [Google Scholar] [CrossRef]
- de Bruijn, A.M.G.; Butterbach-Bahl, K.; Blagodatsky, S.; Grote, R. Model evaluation of different mechanisms driving freeze-thaw N2O emissions. Agric. Ecosyst. Environ. 2009, 133 (3−4), 196−207. [CrossRef]
- Ji, X.M.; Liu, M.H.; Yang, J.L.; Feng, F.J. Meta-analysis of the impact of freeze-thaw cycles on soil microbial diversity and C and N dynamics. Soil Biol. Biochem. 2022, 168, 108608. [Google Scholar] [CrossRef]
- Henry, H.A.L. Soil freeze-thaw cycle experiments: Trends, methodological weaknesses and suggested improvements. Soil Biol. Biochem. 2007, 39, 977–986. [Google Scholar] [CrossRef]
- Wagner-Riddle, C.; Congreves, K.A.; Abalos, D.; Berg, A.A.; Brown, S.E.; Ambadan, J.T.; Gao, X.P.; Tenuta, M. Globally important nitrous oxide emissions from croplands induced by freeze-thaw cycles. Nat. Geosci. 2017, 10, 279–283. [Google Scholar] [CrossRef]
- Wang, X.; Zi, H.B.; Wang, J.B.; Guo, X.W.; Zhang, Z.H.; Yan, T.; Wang, Q.; He, J.S. Grazing-induced changes in soil microclimate and aboveground biomass modulate freeze-thaw processes in a Tibetan alpine meadow. Agric. Ecosyst. Environ. 2023, 357, 108659. [Google Scholar] [CrossRef]
- Chen, Z.M.; Wang, H.Y.; Liu, X.W.; Zhao, X.L.; Lu, D.J.; Zhou, J.M.; Li, C.Z. ; Changes in soil microbial community and organic carbon fractions under short-term straw return in a rice-wheat cropping system. Soil Tillage Res. 2017, 165, 121–127. [Google Scholar] [CrossRef]
- Zhu, L.Q.; Hu, N.J.; Yang, M.F.; Zhan, X.H.; Zhang, Z.W. Effects of different tillage and straw return on soil organic carbon in a rice-wheat rotation system. Plos One 2014, 9, e88900. [Google Scholar] [CrossRef]
- Liang, B.; Yang, X.Y.; He, X.H.; Zhou, J.B. Effects of 17-year fertilization on soil microbial biomass C and N and soluble organic C and N in loessial soil during maize growth. Biol. Fertil. Soils. 2011, 47, 121–128. [Google Scholar] [CrossRef]
- Pabst, H.; Kuhnel, A.; Kuzyakov, Y. Effect of land-use and elevation on microbial biomass and water extractable carbon in soils of Mt. Kilimanjaro ecosystems. Appl. Soil Ecol. 2013, 67, 10–19. [Google Scholar] [CrossRef]
- Mi, W.H.; Sun, Y.; Zhao, C.; Wu, L.H. Soil organic carbon and its labile fractions in paddy soil as influenced by water regimes and straw management. Agric. Water Manage. 2019, 224: 105752. [CrossRef]
- De Troyer. I.; Amery, F.; Van Moorleghem, C.; Smolders, E.; Merckx, R. Tracing the source and fate of dissolved organic matter in soil after incorporation of a 13C labelled residue: A batch incubation study. Soil Biol. Biochem. 2011, 43, 513–519. [Google Scholar] [CrossRef]
- Zhu, L.Q.; Hu, N.J.; Zhang, Z.W.; Xu, J.L.; Tao, B.R.; Meng, Y.L. Short-term responses of soil organic carbon and carbon pool management index to different annual straw return rates in a rice–wheat cropping system. Catena 2015, 135, 283–289. [Google Scholar] [CrossRef]
- Liu, Y.Q.; Wang, X.C.; Wen, Y.J.; Cai, H.X.; Song, X.M.; Zhang, Z.P. Effects of freeze-thaw cycles on soil greenhouse gas emissions: A systematic review. Environ. Res. 2024, 248, 118386. [Google Scholar] [CrossRef] [PubMed]
- Gao, D.C.; Zhang, L.; Liu, J.; Peng, B.; Fan, Z.Z.; Dai, W.W.; Jiang, P.; Bai, E. Responses of terrestrial nitrogen pools and dynamics to different patterns of freeze-thaw cycle: A meta-analysis. Global Change Biol. 2018, 24, 2377–2389. [Google Scholar] [CrossRef] [PubMed]
- Zhang, Y.P.; Fu, Y.; Xu, J.Z.; Li, Y.; Zhao, Y.K.; Wei, S.Y.; Liu, B.J.; Zhang, X.Y.; Lei, H.Z.; Shao, S. Impact of freeze–thaw cycling on the stability and turnover of black soil aggregates. Geoderma 2024, 449, 117004. [Google Scholar] [CrossRef]
- Nie, S.Y.; Jia, X.; Zou, Y.C.; Bian, J.M. Effects of Freeze–Thaw Cycles on Soil Nitrogen Transformation in Improved Saline Soils from an Irrigated Area in Northeast China. Water 2024, 16, 653. [Google Scholar] [CrossRef]
- Rabot, E.; Wiesmeier, M.; Schlüter, S.; Vogel, H.J. Soil structure as an indicator of soil functions: A review. Geoderma 2018, 314, 122–137. [Google Scholar] [CrossRef]
- Zhou, M.; Liu, C.Z.; Wang, J.; Meng, Q.F.; Yuan, Y.; Ma, X.F.; Liu, X.B.; Zhu, Y.X.; Ding, G.W.; Zhang, J.Z.; Zeng, X.N.; Du, W.L. Soil aggregates stability and storage of soil organic carbon respond to cropping systems on Black Soils of Northeast China. Sci. Rep. 2020, 10, 265. [Google Scholar] [CrossRef]
- Yudina, A.; Kuzyakov, Y. Dual nature of soil structure: The unity of aggregates and pores. Geoderma 2023, 434, 116478. [Google Scholar] [CrossRef]
- Xiao, Y.; Zhou, M.; Liu, X.B.; Zhang, X.Y.; Xiao, L.L; Liu, J.; Cruse, R.M. Pore connectivity and anisotropy affect carbon mineralization via extracellular enzymes in > 2 mm aggregates under conservation tillage of Mollisols. Soil Tillage Res. 2024, 244, 106253. [Google Scholar] [CrossRef]
- Zhu, X.A.; Liu, W.J.; Yuan, X.; Chen, C.F.; Zhu, K.; Zhang, W.J.; Yang, B. Aggregate stability and size distribution regulate rainsplash erosion: Evidence from a humid tropical soil under different land-use regimes. Geoderma 2022, 420, 115880. [Google Scholar] [CrossRef]
- Almajmaie, A.; Hardie, M.; Acuna, T.; Birch, C. Evaluation of methods for determining soil aggregate stability. Soil Tillage Res. 2017, 167, 39–45. [Google Scholar] [CrossRef]
- Rieke, E.L.; Bagnall, D.K.; Morgan, C.L.S.; Flynn, K.D.; Howe, J.A.; Greub, K.L.H. Evaluation of aggregate stability methods for soil health. Geoderma 2022, 428, 116156. [Google Scholar] [CrossRef]
- Zhu, Y.C.; Zhang, M.; Han, X.Z.; Lu, X.C.; Chen, X.; Feng, H.L.; Wu, Z.M.; Liu, C.Z.; Yan, J.; Zou, W.X. Evaluation of the soil aggregate stability under long term manure and chemical fertilizer applications: Insights from organic carbon and humic acid structure in aggregates. Agric. Ecosyst. Environ. 2024, 376, 109217. [Google Scholar] [CrossRef]
- Klöffel, T.; Larsbo, M.; Jarvis, N.; Barron, J. Freeze-thaw effects on pore space and hydraulic properties of compacted soil and potential consequences with climate change. Soil Tillage Res. 2024, 239, 106041. [Google Scholar] [CrossRef]
- Li, X.B.; Chen, X.Y.; Gao, Y.C.; Yang, J.H.; Ding, W.T.; Zvomuya, F.; Azad, N.; Li, J.B.; He, H.L. Freezing induced soil water redistribution: A review and global meta-analysis. J. Hydrol. 2025, 651, 132594. [Google Scholar] [CrossRef]
- Meng, F.S.; Chen, Q.; Du, J.; Wu, Y.M.; Lin, Z.K.; Tian, J.Q.; Wang, C. Evaluating soil freezing characteristic curve models for predicting unfrozen water content in freezing soils. Phys. Chem. Earth. 2024, 135, 103697. [Google Scholar] [CrossRef]
- Lehrsch, G.A.; Sojka, R.E.; Carter, D.L.; Jolley, P.M. Freezing effects on aggregate stability affected by texture, mineralogy, and organic matter. Soil Sci. Soc. Am. J. 1991, 55, 1401–1406. [Google Scholar] [CrossRef]
- Taskin, O.; Ferhan, F. Effect of freezing and thawing processes on soil aggregate stability. Catena 2003, 52, 1–8. [Google Scholar] [CrossRef]
- Edwards, L.M. The effects of soil freeze-thaw on soil aggregate breakdown and concomitant sediment flow in Prince Edward Island: A review. Can. J. Soil Sci. 2013, 93, 459–472. [Google Scholar] [CrossRef]
- Li, X.; Liu, X.Y.; Vinci, G.; Sun, B.B.; Drosos, M.; Li, L.Q.; Piccolo, A.; Pan, G.X. Aggregate fractions shaped molecular composition change of soil organic matter in a rice paddy under elevated CO2 and air warming. Soil Biol. Biochem. 2021, 159, 108289. [Google Scholar] [CrossRef]
- Shi, Y.J.; Zhang, L.H.; Mu, Y.H.; Ma, W.; Kong, X.B.; Yang, C.S. Dynamic characteristics of soil pore structure and water-heat variations during freeze-thaw process. Eng. Geol. 2024, 343, 107785. [Google Scholar] [CrossRef]
- Xu, W.S.; Li, K.S.; Chen, L.X.; Kong, W.H.; Liu, C.X. The impacts of freeze-thaw cycles on saturated hydraulic conductivity and microstructure of saline-alkali soils. Sci. Rep. 2021, 11, 18655. [Google Scholar] [CrossRef]
- Zhang, J.; He, P.; Wei, D.; Jin, L.; Zhang, L.; Li, L.; Zhao, S.; Xu, X.; Zhou, W.; Qiu, S. Changes in nitrogen pools in the maize–soil system after urea or straw application to a typical intensive agricultural soil: A 15N Tracer Study. Agronomy 2021, 11, 1134. [Google Scholar] [CrossRef]
- Zhao, X.H.; Quan, Z.; Gurmesa, G.A.; Huang, B.; Yu, H.M.; Zhu, F.F.; Xun, Z.F.; Liu, C.; Liu, D.; Yang, X.S.; Li, J.; Fang, Y.T.; Lu, C.Y.; Chen, X. Effects of nitrification inhibitor and maize straw application on N2O and N2 emissions from two agricultural soils: A 15N tracer study. Soil Ecol. Lett. 2025, 7, 240276. [Google Scholar] [CrossRef]
- Lorenz, K.; Lal, R. The depth distribution of soil organic carbon in relation to land use and management and the potential of carbon sequestration in subsoil horizons. Adv. Agron. 2005, 88, 35–66. [Google Scholar] [CrossRef]
- Majumder, B.; Kuzyakov, Y. Effect of fertilization on decomposition of 14C labelled plant residues and their incorporation into soil aggregates. Soil Tillage Res. 2010, 109, 94–102. [Google Scholar] [CrossRef]
- Soil Survey Staff, 2010. Keys to soil taxonomy. 11th. United States Department of Agriculture Natural Resources Conservation Service. Washington (DC): U.S. Government Printing Office.
- Zhang, Y.L.; Hou, W.; Chi, M.J.; Sun, Y.; An, J.; Yu, N.; Zou, H.T. Simulating the effects of soil temperature and soil moisture on CO2 and CH4 emissions in rice straw-enriched paddy soil. Catena 2020, 194, 104677. [Google Scholar] [CrossRef]
- Bao, S.D. Soil and Agricultural Chemistry Analysis, third ed. China Agricultural Press, Beijing, China, 2008.
- Griesheim, K.L.; Mulvaney, R.L. Improving the accuracy of diffusion for inorganic 15N analyses of soil extracts and water. Commun. Soil Sci. Plant Anal. 2019, 50, 1–9. [Google Scholar] [CrossRef]
- Brookes, P.C.; Landman, A.; Pruden, G.; Jenkinson, D.S. Chloroform fumigation and the release of soil nitrogen: A rapid direct extraction method to measure microbial biomass nitrogen in soil. Soil Biol. Biochem. 1985, 17, 837–842. [Google Scholar] [CrossRef]
- Vance, E.D.; Brookes, P.C.; Jenkinson, D.S. An extraction method for measuring soil microbial biomass C. Soil Biol. Biochem. 1987, 19, 703–707. [Google Scholar] [CrossRef]
- Wu, J.; Jorgensen, R.G.; Pommerening, B.; Chaussod, R.; Brookes, P.C. Measurement of soil microbial biomass C by fumigation-extraction-an automated procedure. Soil Biol. Biochem. 1990, 22, 1167–1169. [Google Scholar] [CrossRef]
- Bavel, C.H.M.V. Mean weight-diameter of soil aggregates as a statistical index of aggregation. Soil Sci. Soc. Am. J. 1950, 14, 20–23. [Google Scholar] [CrossRef]
- Kemper, W.D.; Rosenau, R.C. Aggregate stability and size distributions. In Methods of Soil Analysis, 2nd ed.; American Society of Agronomy: Madison, U.S. 1986; pp. 837–871. [Google Scholar]
- Yang, P.L.; Luo, Y.P.; Shi, Y.C. Characterized soil fractal characteristics by weight distribution of particle size. Chin. Sci. Bull. 1993, 38, 1896–1899. [Google Scholar]
- Chen, Z.M.; Wang, Q.; Wang, H.Y.; Bao, L.; Zhou, J.M. Crop yields and soil organic carbon fractions as influenced by straw incorporation in a rice-wheat cropping system in southeastern China. Nutr. Cycling Agroecosyst. 2018, 112, 61–73. [Google Scholar] [CrossRef]
- Edwards, K.A.; McCulloch, J.; Kershaw, G.P.; Jefferies, R.L. Soil microbial and nutrient dynamics in a wet arctic sedge meadow in late winter and early spring. Soil Biol. Biochem. 2006, 38, 2843–2851. [Google Scholar] [CrossRef]
- Oztas, T.; Fayetorbay, F. Effect of freezing and thawing processes on soil aggregate stability. Catena 2003, 52, 1–8. [Google Scholar] [CrossRef]
- Ping, C.L.; Michaelson, G.J.; Kimble, J.M. Carbon storage along a Latitudinal transect in Alaska. Nutr. Cycling Agroecosyst. 1997, 49, 235–242. [Google Scholar] [CrossRef]
- Koponen, H.T.; Martikainen, P.J. Soil water content and freezing temperature affect freeze–thaw related N2O production in organic soil. Nutr. Cycl. Agroecosyst. 2004, 69, 213–219. [Google Scholar] [CrossRef]
- Koponen, H.T.; Jaakkola, T.; Keinänen-Toivola, M.M.; Kaipainen, S.; Tuomainen, J.; Servomaa, K.; Martikainen, P.J. Microbial communities, biomass, and activities in soils as affected by freeze thaw cycles. Soil Biol. Biochem. 2006, 38, 1861–1871. [Google Scholar] [CrossRef]
- Sahoo, M. Winter soil temperature and its effect on soil nitrate Status: A Support Vector Regression-based approach on the projected impacts. Catena 2022, 211, 105958. [Google Scholar] [CrossRef]
- Schimel, J.P.; Clein, J.S. Microbial response to freeze-thaw cycles in tundra and taiga soils. Soil Biol. Biochem. 1996, 28, 1061–1066. [Google Scholar] [CrossRef]
- Liu, M.H.; Zhang, Z.M.; He, P.; Zhang, Y.F.; Li, L.J. Changes in soil microbial community and carbon use efficiency in freeze-thaw period restored after growth season under warming and straw return. Appl. Soil Ecol. 2025, 205, 105779. [Google Scholar] [CrossRef]
- Krogstad, K.; Gharasoo, M.; Jensen, G.; Hug, L.A.; Rudolph, D.; Van Cappellen, P.; Rezanezhad, F. Nitrogen leaching from agricultural soils under imposed freeze-thaw cycles: A column study with and without fertilizer amendment. Front. Environ. Sci. 2022, 10, 915329. [Google Scholar] [CrossRef]
- Gao, D.C.; Bai, E.; Yang, Y.; Zong, S.W.; Hagedorn, F. A global meta-analysis on freeze-thaw effects on soil carbon and phosphorus cycling. Soil Biol. Biochem. 2021, 159, 108283. [Google Scholar] [CrossRef]
- Deng, F.B.; Xie, H.T.; Zheng, T.T.; Yang, Y.L.; Bao, X.L.; He, H.B.; Zhang, X.D.; Liang, C. Dynamic responses of soil microbial communities to seasonal freeze-thaw cycles in a temperate agroecosystem. Sci. Total Environ. 2024, 950, 175228. [Google Scholar] [CrossRef]
- Xiang, X.M.; De, K.J.; Lin, W.S.; Feng, T.X.; Li, Fei. ; Wei, X.J.; Wang, Wei. Different fates and retention of deposited NH4+ and NO3− in the alpine grasslands of the Qinghai-Tibet plateau. Ecol. Indic. 2024, 158, 111415. [Google Scholar] [CrossRef]
- Almaraz, M.; Wang, C.; Wong, M.Y. Deep soil contributions to global nitrogen budgets. Nat. Commun. 2025, 16, 966. [Google Scholar] [CrossRef]
- Berns-Herrboldt, E.C.; O'Meara, T.A.; Herndon, E.M.; Sulman, B.N.; Gu, B.H.; Klingeman, D.M.; Lowe, K.A.; Graham, D.E. Dynamic soil columns simulate Arctic redox biogeochemistry and carbon release during changes in water saturation. Sci. Rep. 2025, 15, 3093. [Google Scholar] [CrossRef]
- Wei, C.C.; Li, Y.L.; Yang, P.L.; Nadeem, A.A.; Luo, W.B.; Wang, Y.; Chi, Y.B. Variable soil carbon and nitrogen mineralization dynamics under freeze-thaw and constant temperature with brackish water irrigation. Irrig. Sci. 2024. [Google Scholar] [CrossRef]
- Li, J.F.; Lu, X.H.; Wang, P.; Yu, Y.; Sun, L.; Li, M. Influence of freeze-thaw process on as migration and microorganisms in aggregates of paddy soil. J. Environ. Manage. 2024, 370, 122847. [Google Scholar] [CrossRef]
- Dong, C.J.; Gu, Y.Z.; Jia, Y.L.; Wei, P.J.; Jin, J.W.; Deng, Y.F.; Yang, P.Z.; Chen, S.Y. Effects of freeze-thaw cycles on the size distribution and stability of soil aggregate in the permafrost regions of the Qinghai-Tibetan Plateau. Environ. Res. Commun. 2023, 12, 129501. [Google Scholar] [CrossRef]
- Zhang, Y.P.; Fu, Y.; Xu, J.Z.; Li, Y.; Zhao, Y.K.; Wei, S.Y.; Liu, B.J.; Zhang, X.Y.; Lei, H.Z.; Shao, S. Impact of freeze–thaw cycling on the stability and turnover of black soil aggregates. Geoderma 2024, 449, 117004. [Google Scholar] [CrossRef]
- Liu, B.; Fan, H.M.; Jiang, Y.; Ma, R.M. Evaluation of soil macro-aggregate characteristics in response to soil macropore characteristics investigated by X-ray computed tomography under freeze-thaw effects. Soil Tillage Res. 2023, 225, 105559. [Google Scholar] [CrossRef]
- Zhang, C.; Li, J.; Sosa, F.A.; Chen, Q.; Zhang, X. Black soil quality after 19 years of continuous conservation tillage. Agronomy 2024, 14, 2859. [Google Scholar] [CrossRef]
- Xiang, B.; Liu, E.; Yang, L. Influences of freezing–thawing actions on mechanical properties of soils and stress and deformation of soil slope in cold regions. Sci. Rep. 2022, 12, 5387. [Google Scholar] [CrossRef]
- Li, D.N.; Li, Y.; Yao, S.H.; Zhou, H.; Huang, S.; Peng, X.L.; Meng, Y.L. Dynamics of nitrogen mineralization and nitrogen cycling functional genes in response to soil pore size distribution. Eur. J. Soil Biol. 2024, 123, 103692. [Google Scholar] [CrossRef]
- Gu, W.Q.; Wang, Y.N.; Sun, Y.Y.; Liu, Z.F.; Wang, W.J.; Wu, D.; Zhang, Y.X.; Sun, W.; Wang, X.; Feng, Z.B.; Zhang, W.M.; Chen, W.F. Assessing the formation and stability of paddy soil aggregate driven by organic carbon and Fe/Al oxides in rice straw cyclic utilization strategies: Insight from a six-year field trial. Sci. Total Environ. 2024, 951, 175607. [Google Scholar] [CrossRef]
Figure 1.
Contents of soil nitrogen components (a, b, c, d) and 15N-labeled soil nitrogen components (e, f, g, h) in bulk soils under different freeze-thaw frequencies and temperatures. The different lowercase letters of the same freezing temperature exhibit significant differences at the p < 0.05 level via Tukey’s HSD test under the different freeze-thaw frequencies. TN and MBN represent total nitrogen and microbial biomass nitrogen respectively. NO3--N and NH4+-N indicate nitrate nitrogen and ammonia nitrogen respectively.
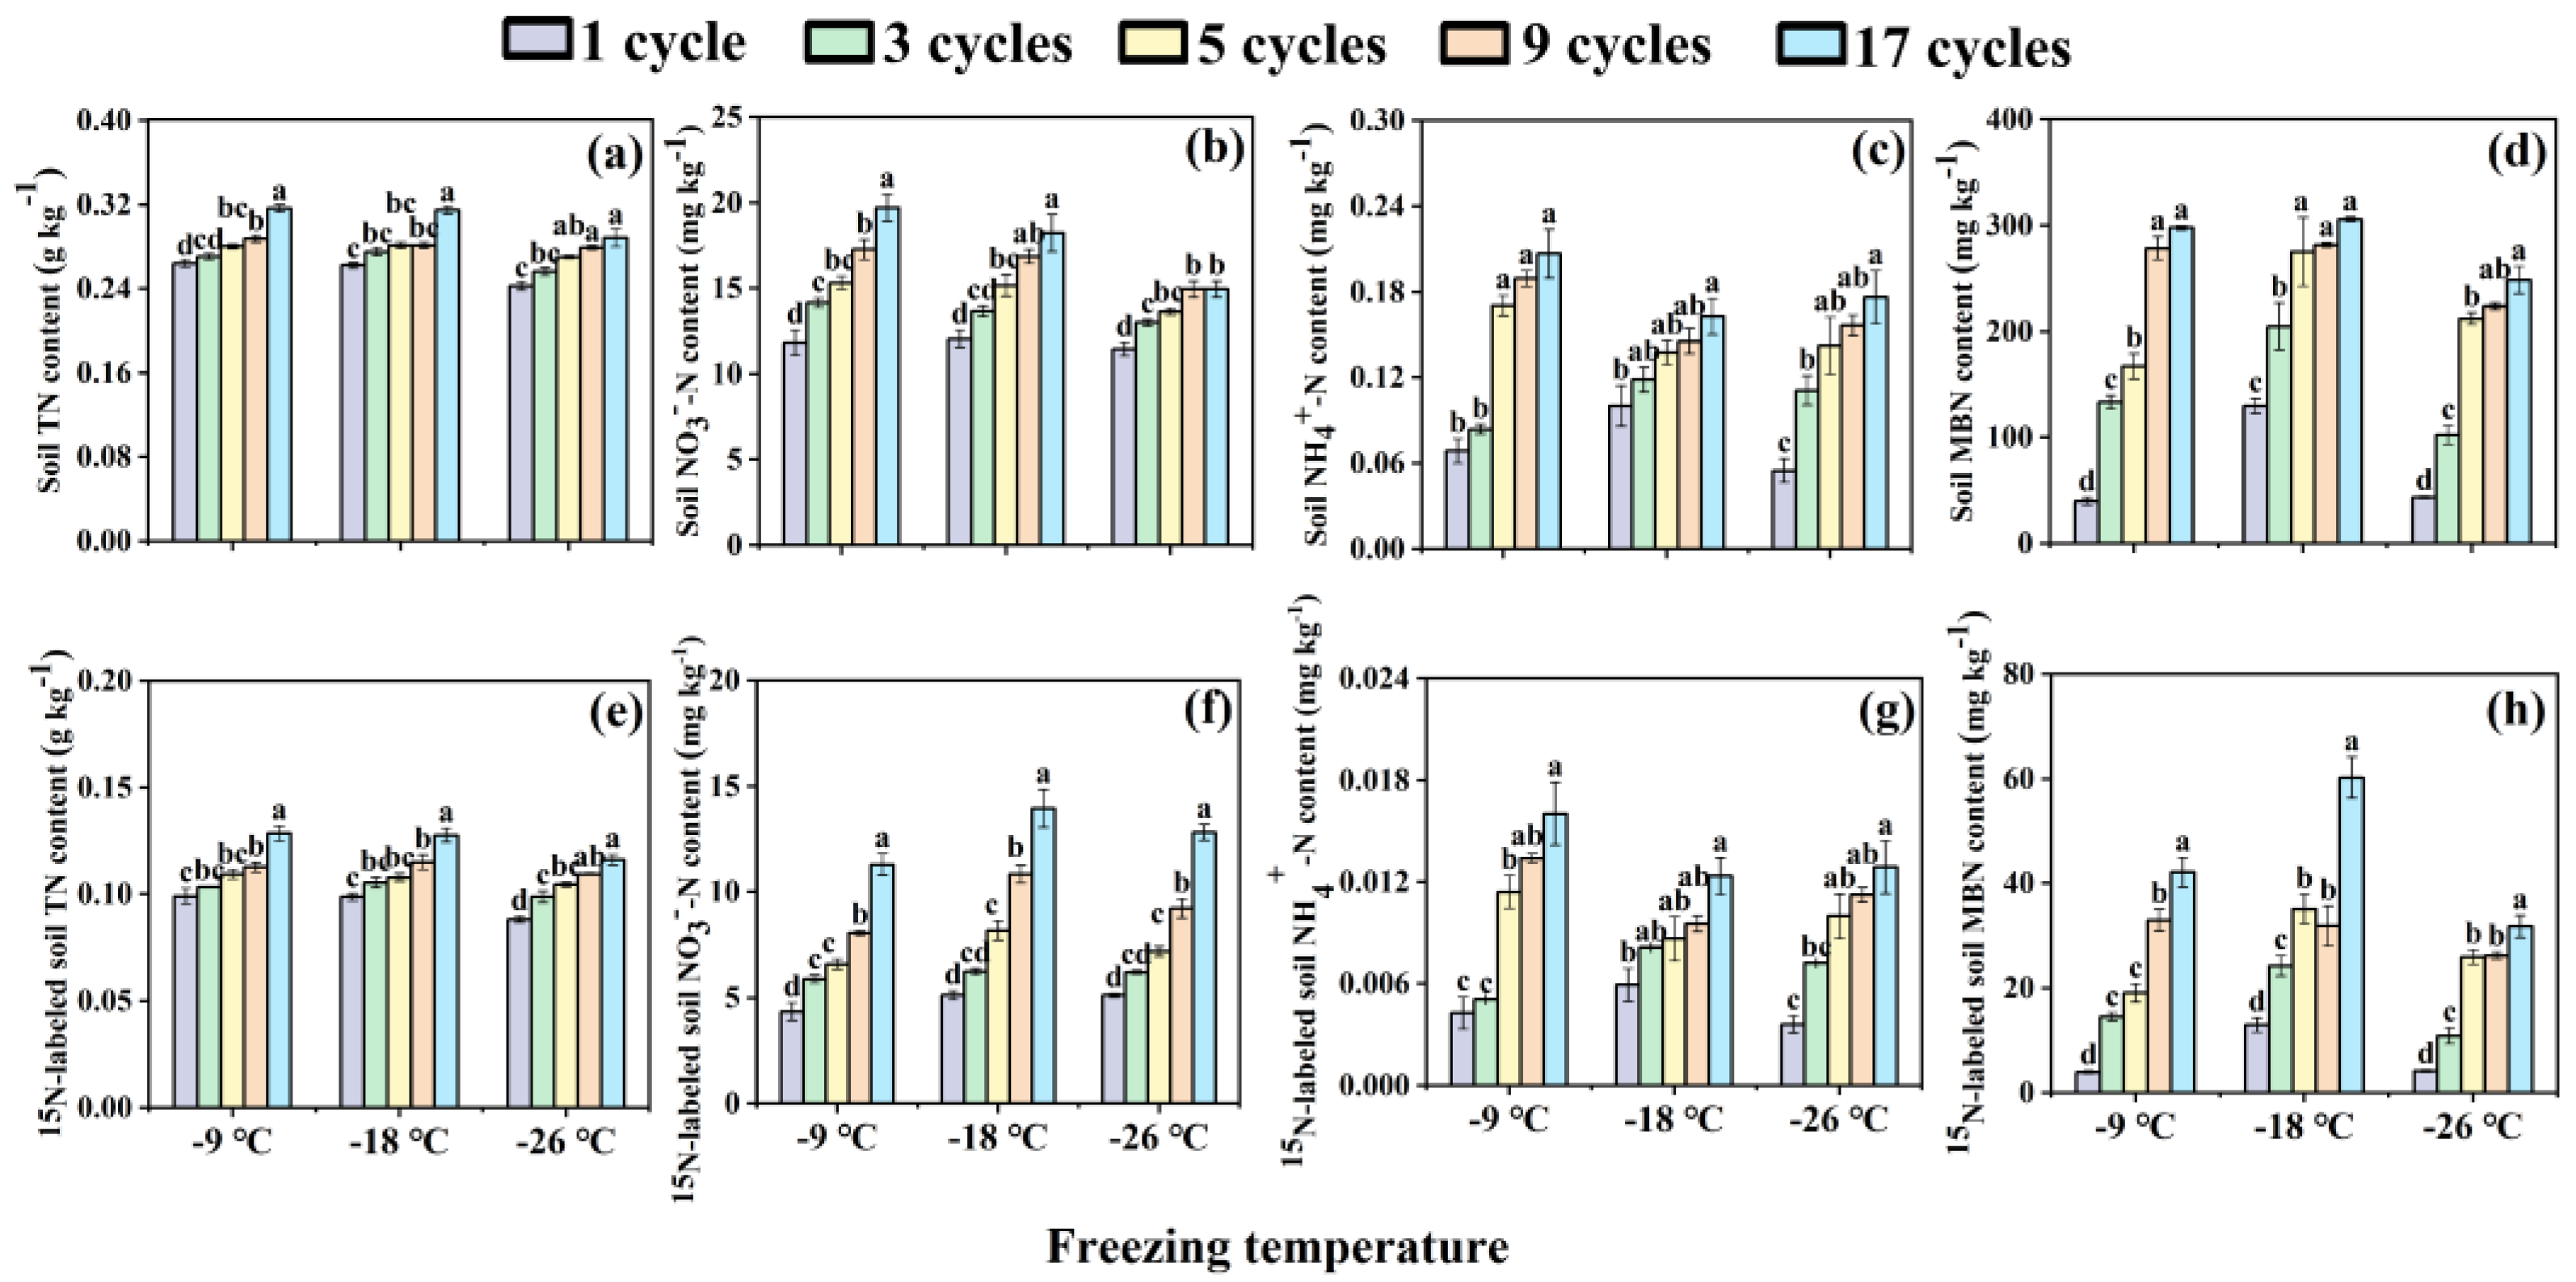
Figure 2.
Relative contribution rate (a, b, c, d), allocation amount (e, f, g, h) and allocation ratio (i, j, k, l) of straw nitrogen to soil nitrogen components in bulk soils under different freeze-thaw frequencies and temperatures. The different lowercase letters of the same freezing temperature exhibit significant differences at the p < 0.05 level via Tukey’s HSD test under the different freeze-thaw frequencies. TN and MBN represent total nitrogen and microbial biomass nitrogen respectively. NO3--N and NH4+-N indicate nitrate nitrogen and ammonia nitrogen respectively.
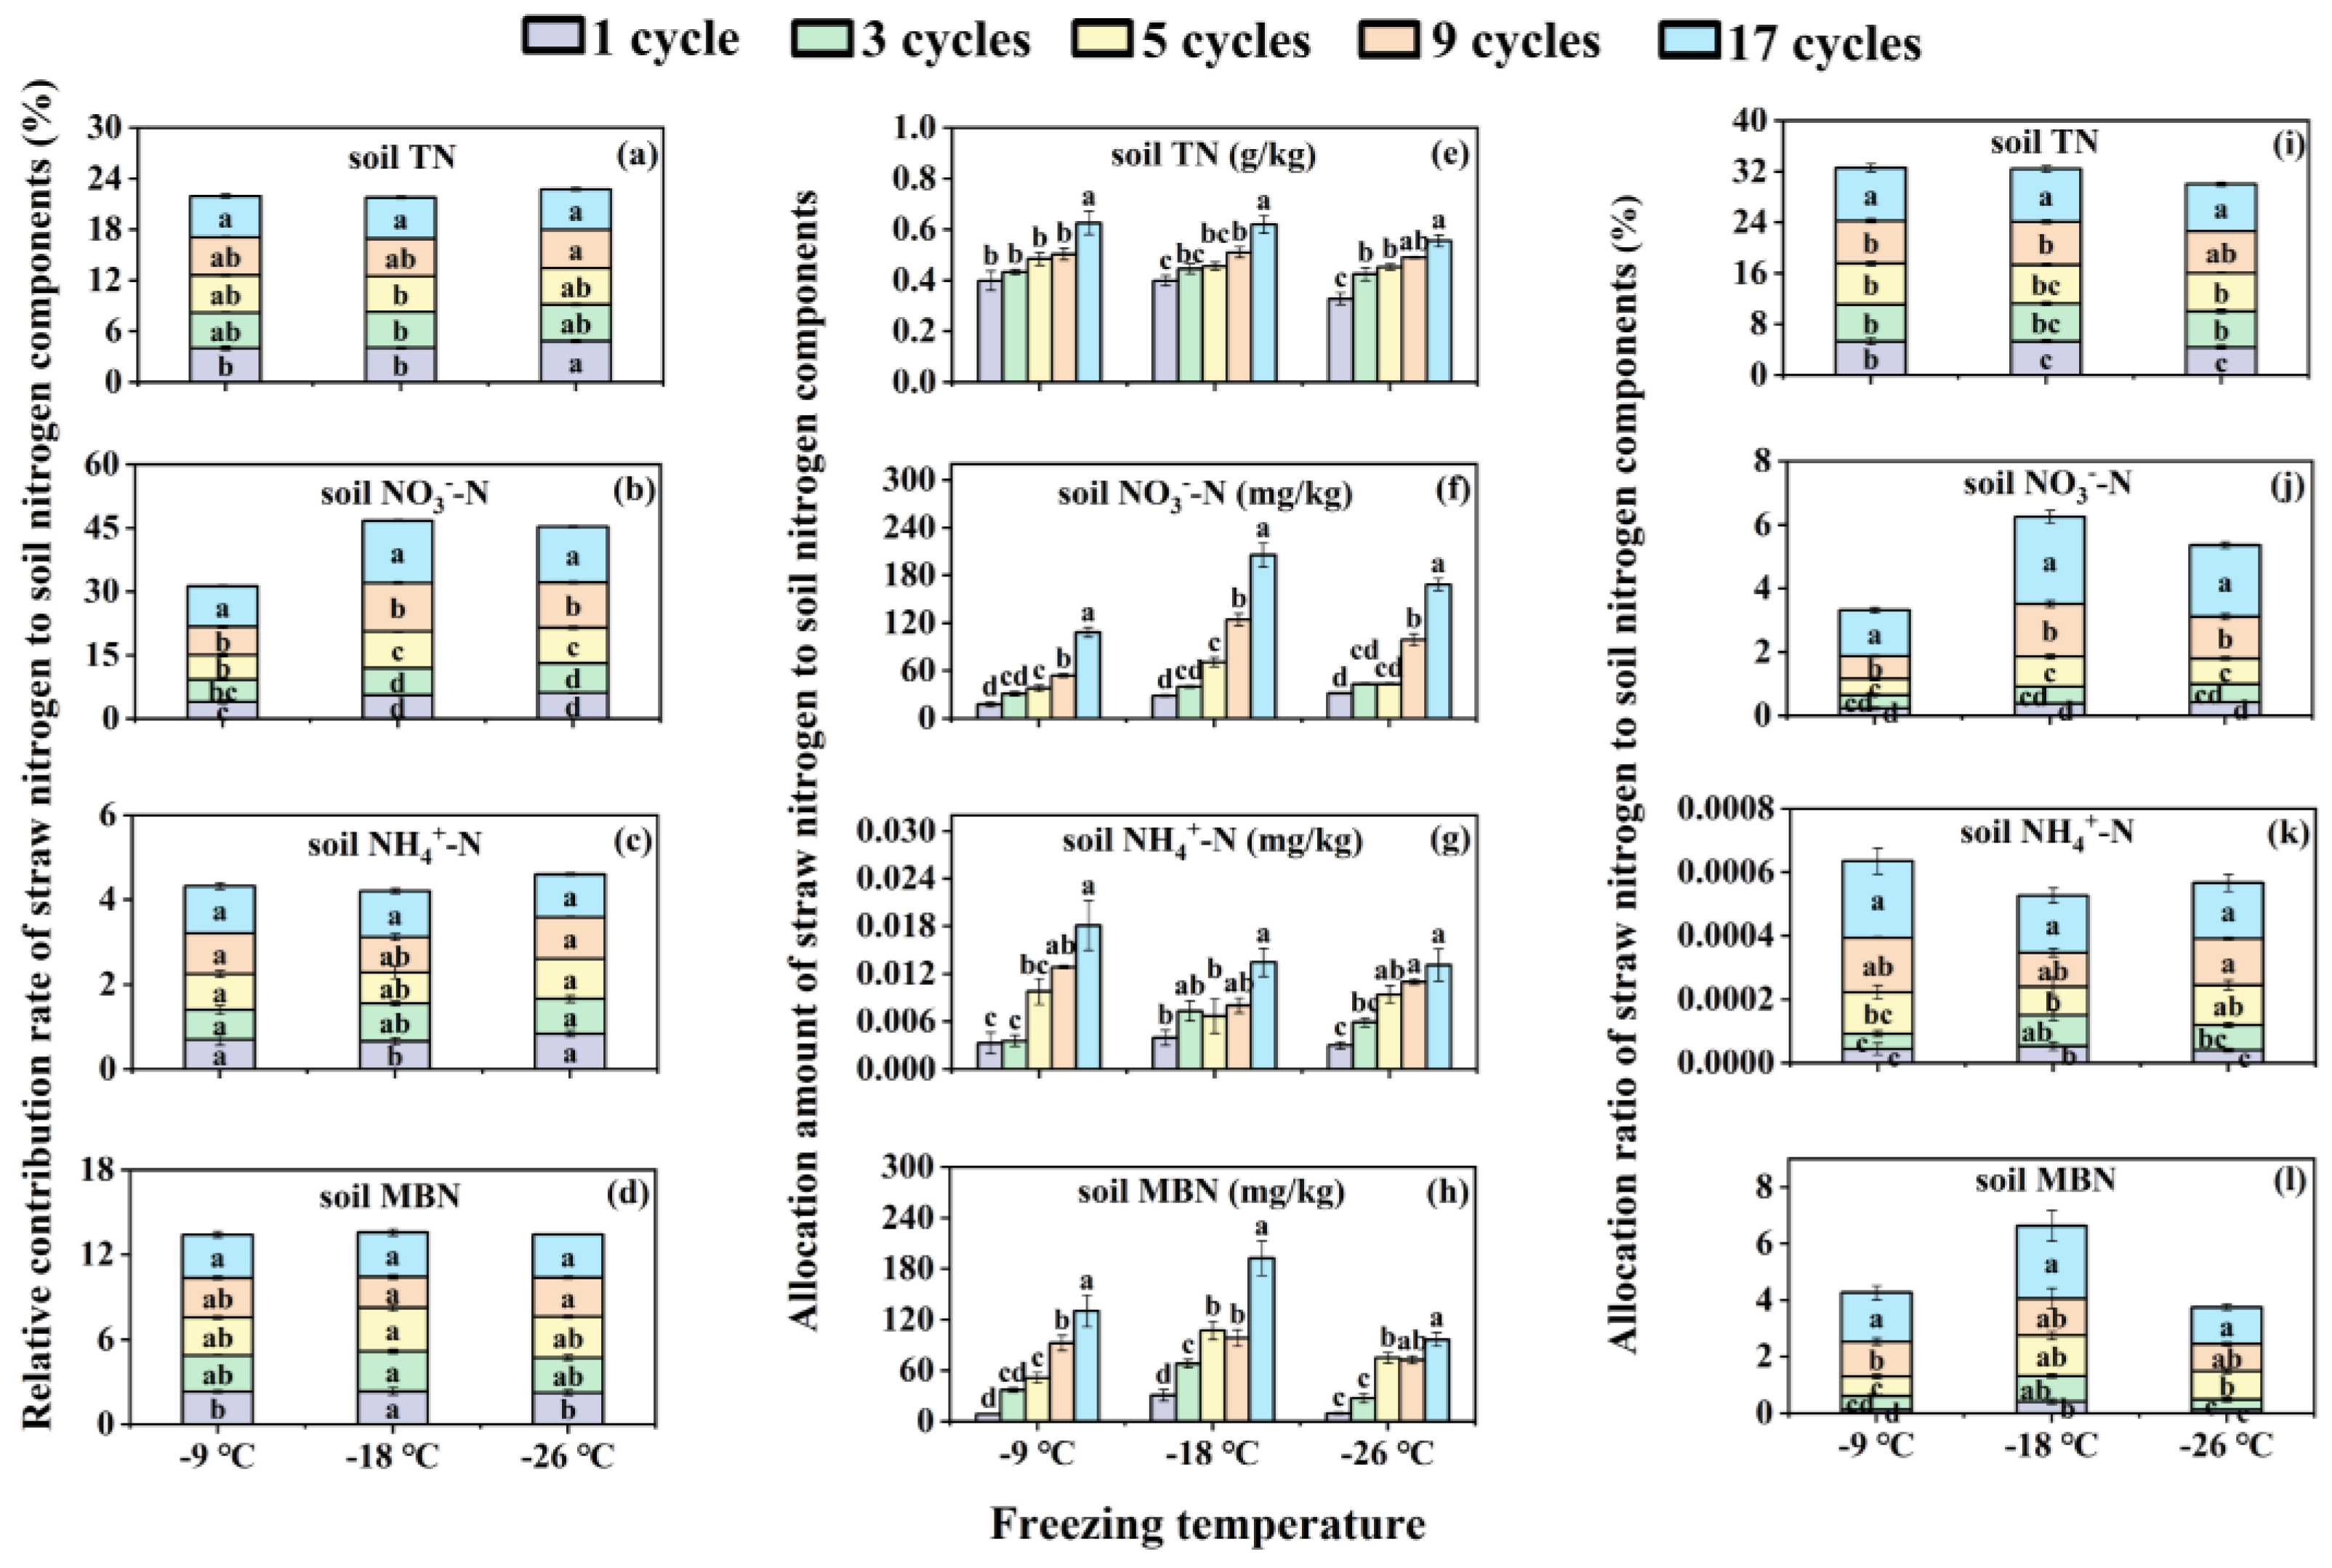
Figure 3.
Contents of total nitrogen (a, b, c) and 15N-labeled total nitrogen (d, e, f) in soil aggregates under different freeze-thaw frequencies and temperatures. The different lowercase letters indicate significant differences at the p < 0.05 level among the same aggregate sizes within the same freezing temperature, as determined by Tukey’s HSD test across different freeze-thaw frequencies. TN represents total nitrogen.
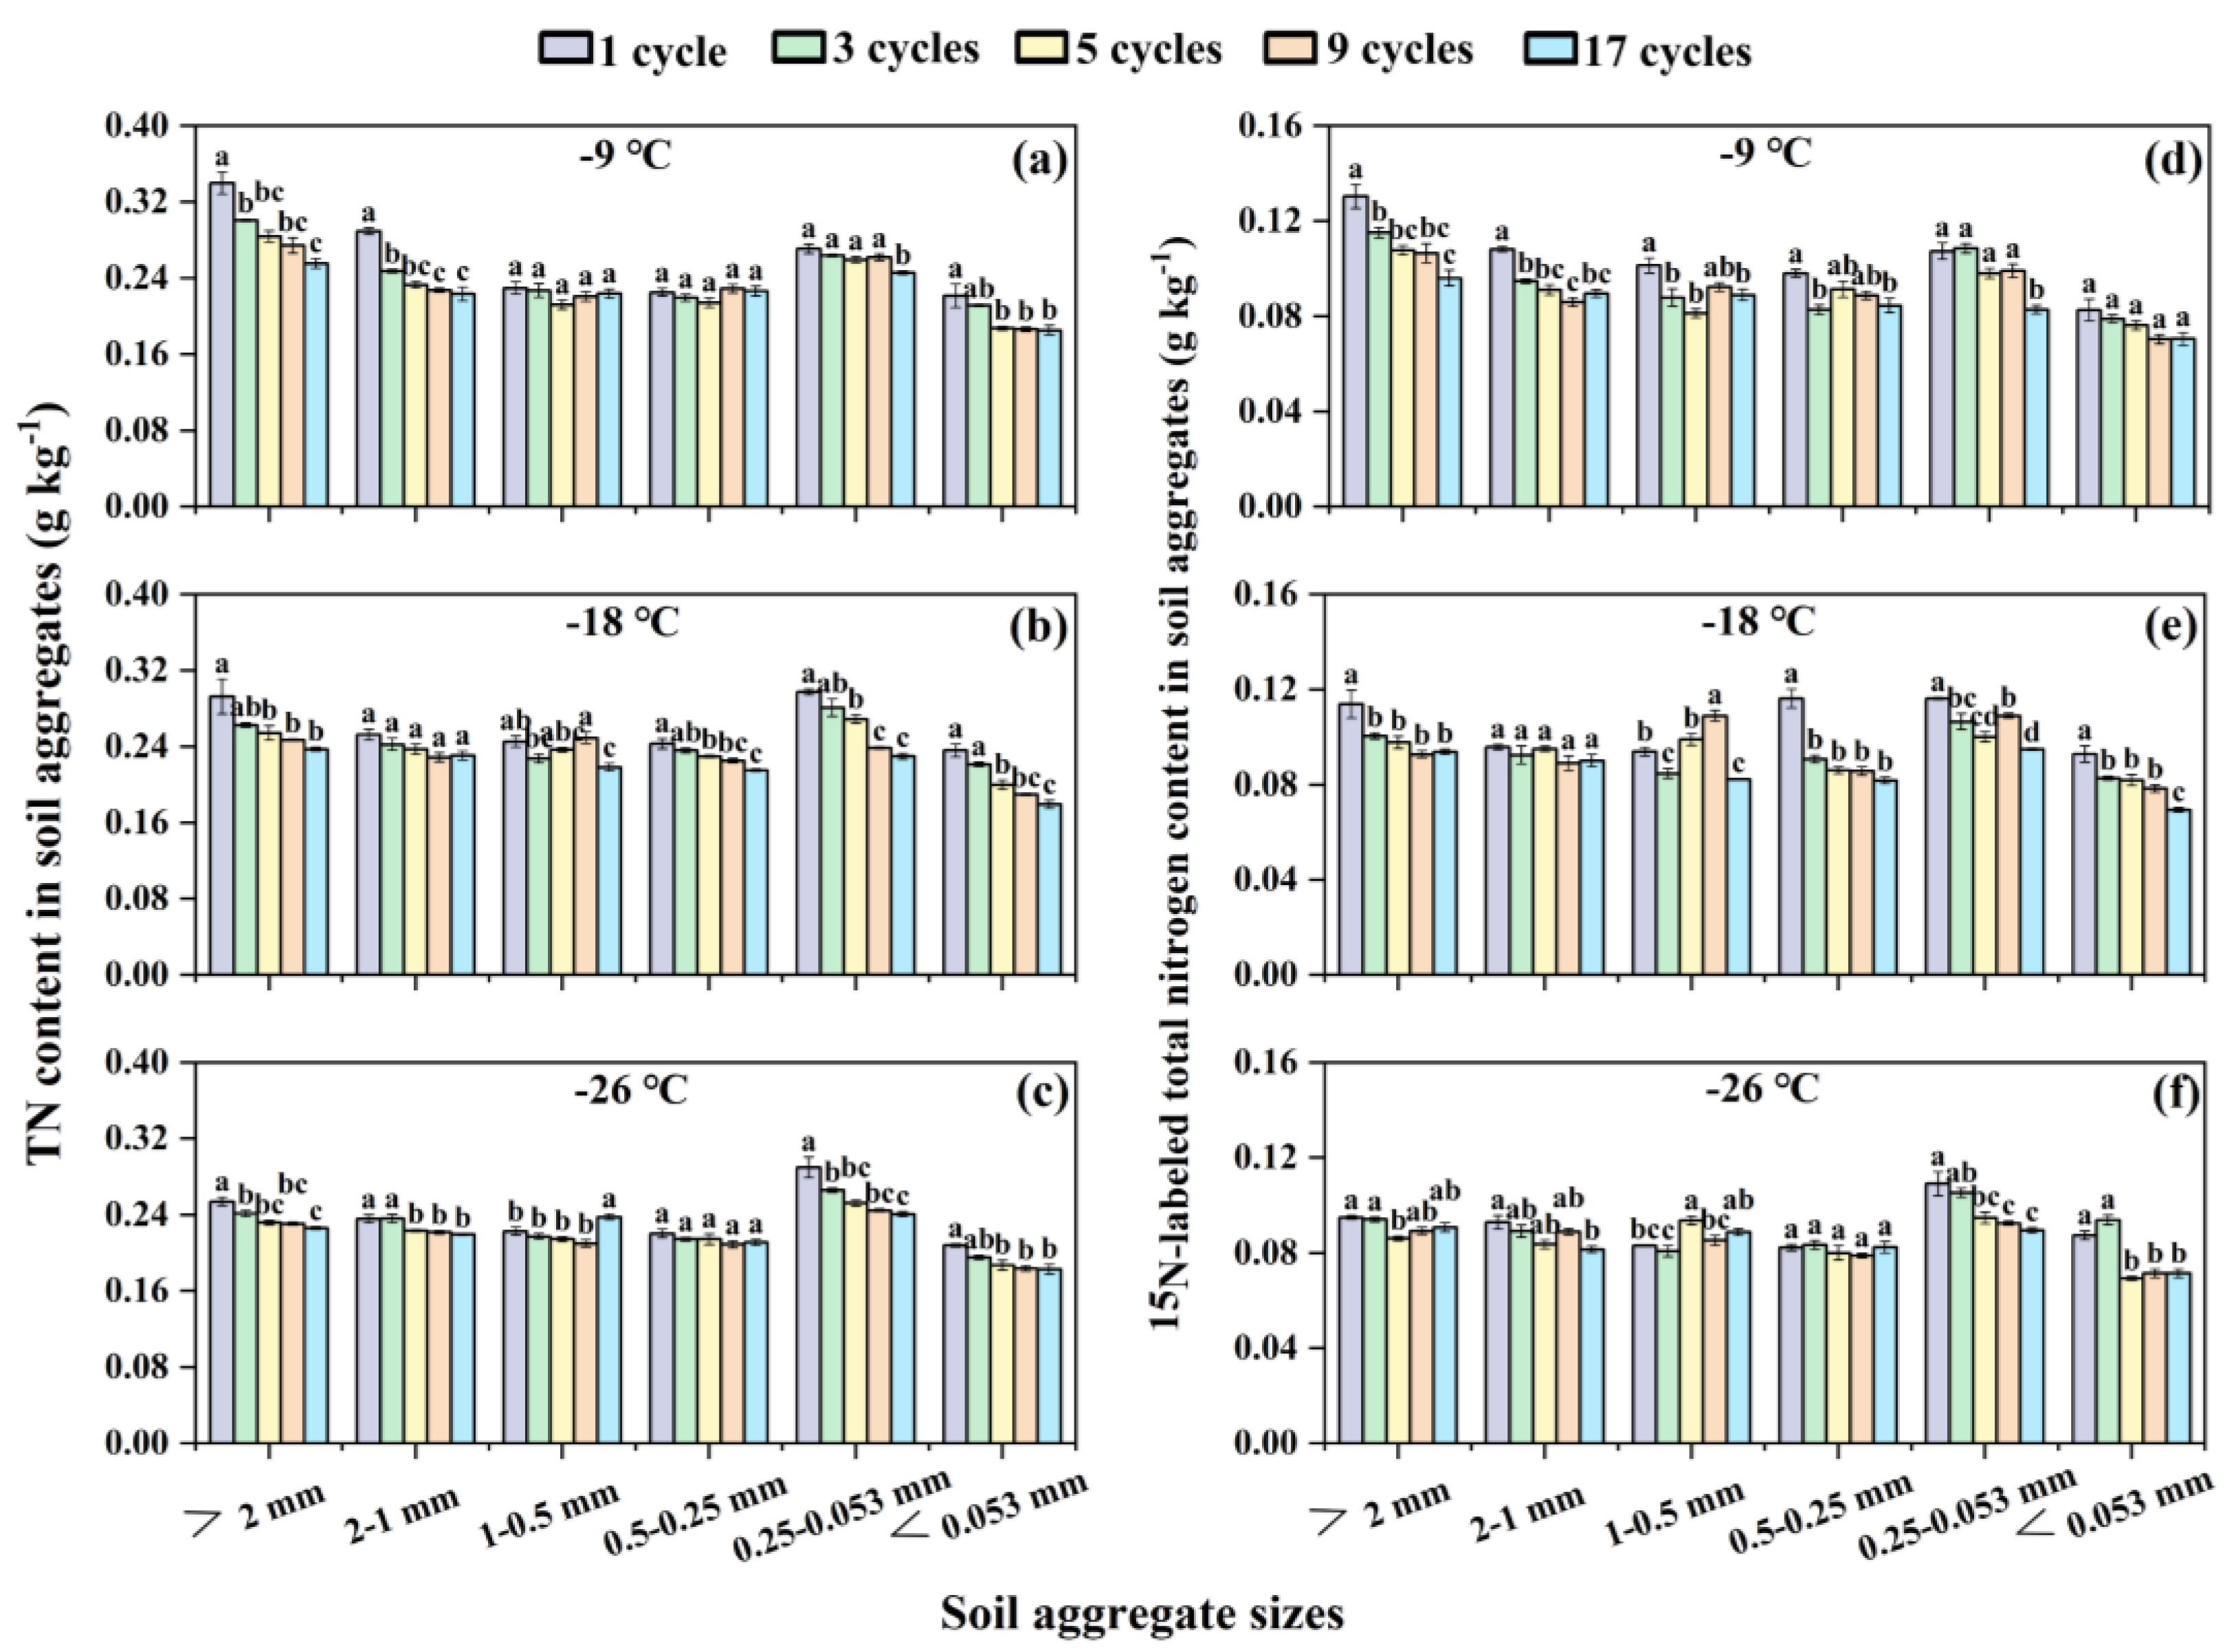
Figure 4.
Relative contribution rate (a, b, c), allocation amount (d, e, f) and allocation ratio (g, h, i,) of straw nitrogen to soil nitrogen components in soil aggregates under different freeze-thaw frequencies and temperatures. The different lowercase letters indicate significant differences at the p < 0.05 level among the same aggregate sizes within the same freezing temperature, as determined by Tukey’s HSD test across different freeze-thaw frequencies. TN represents total nitrogen.
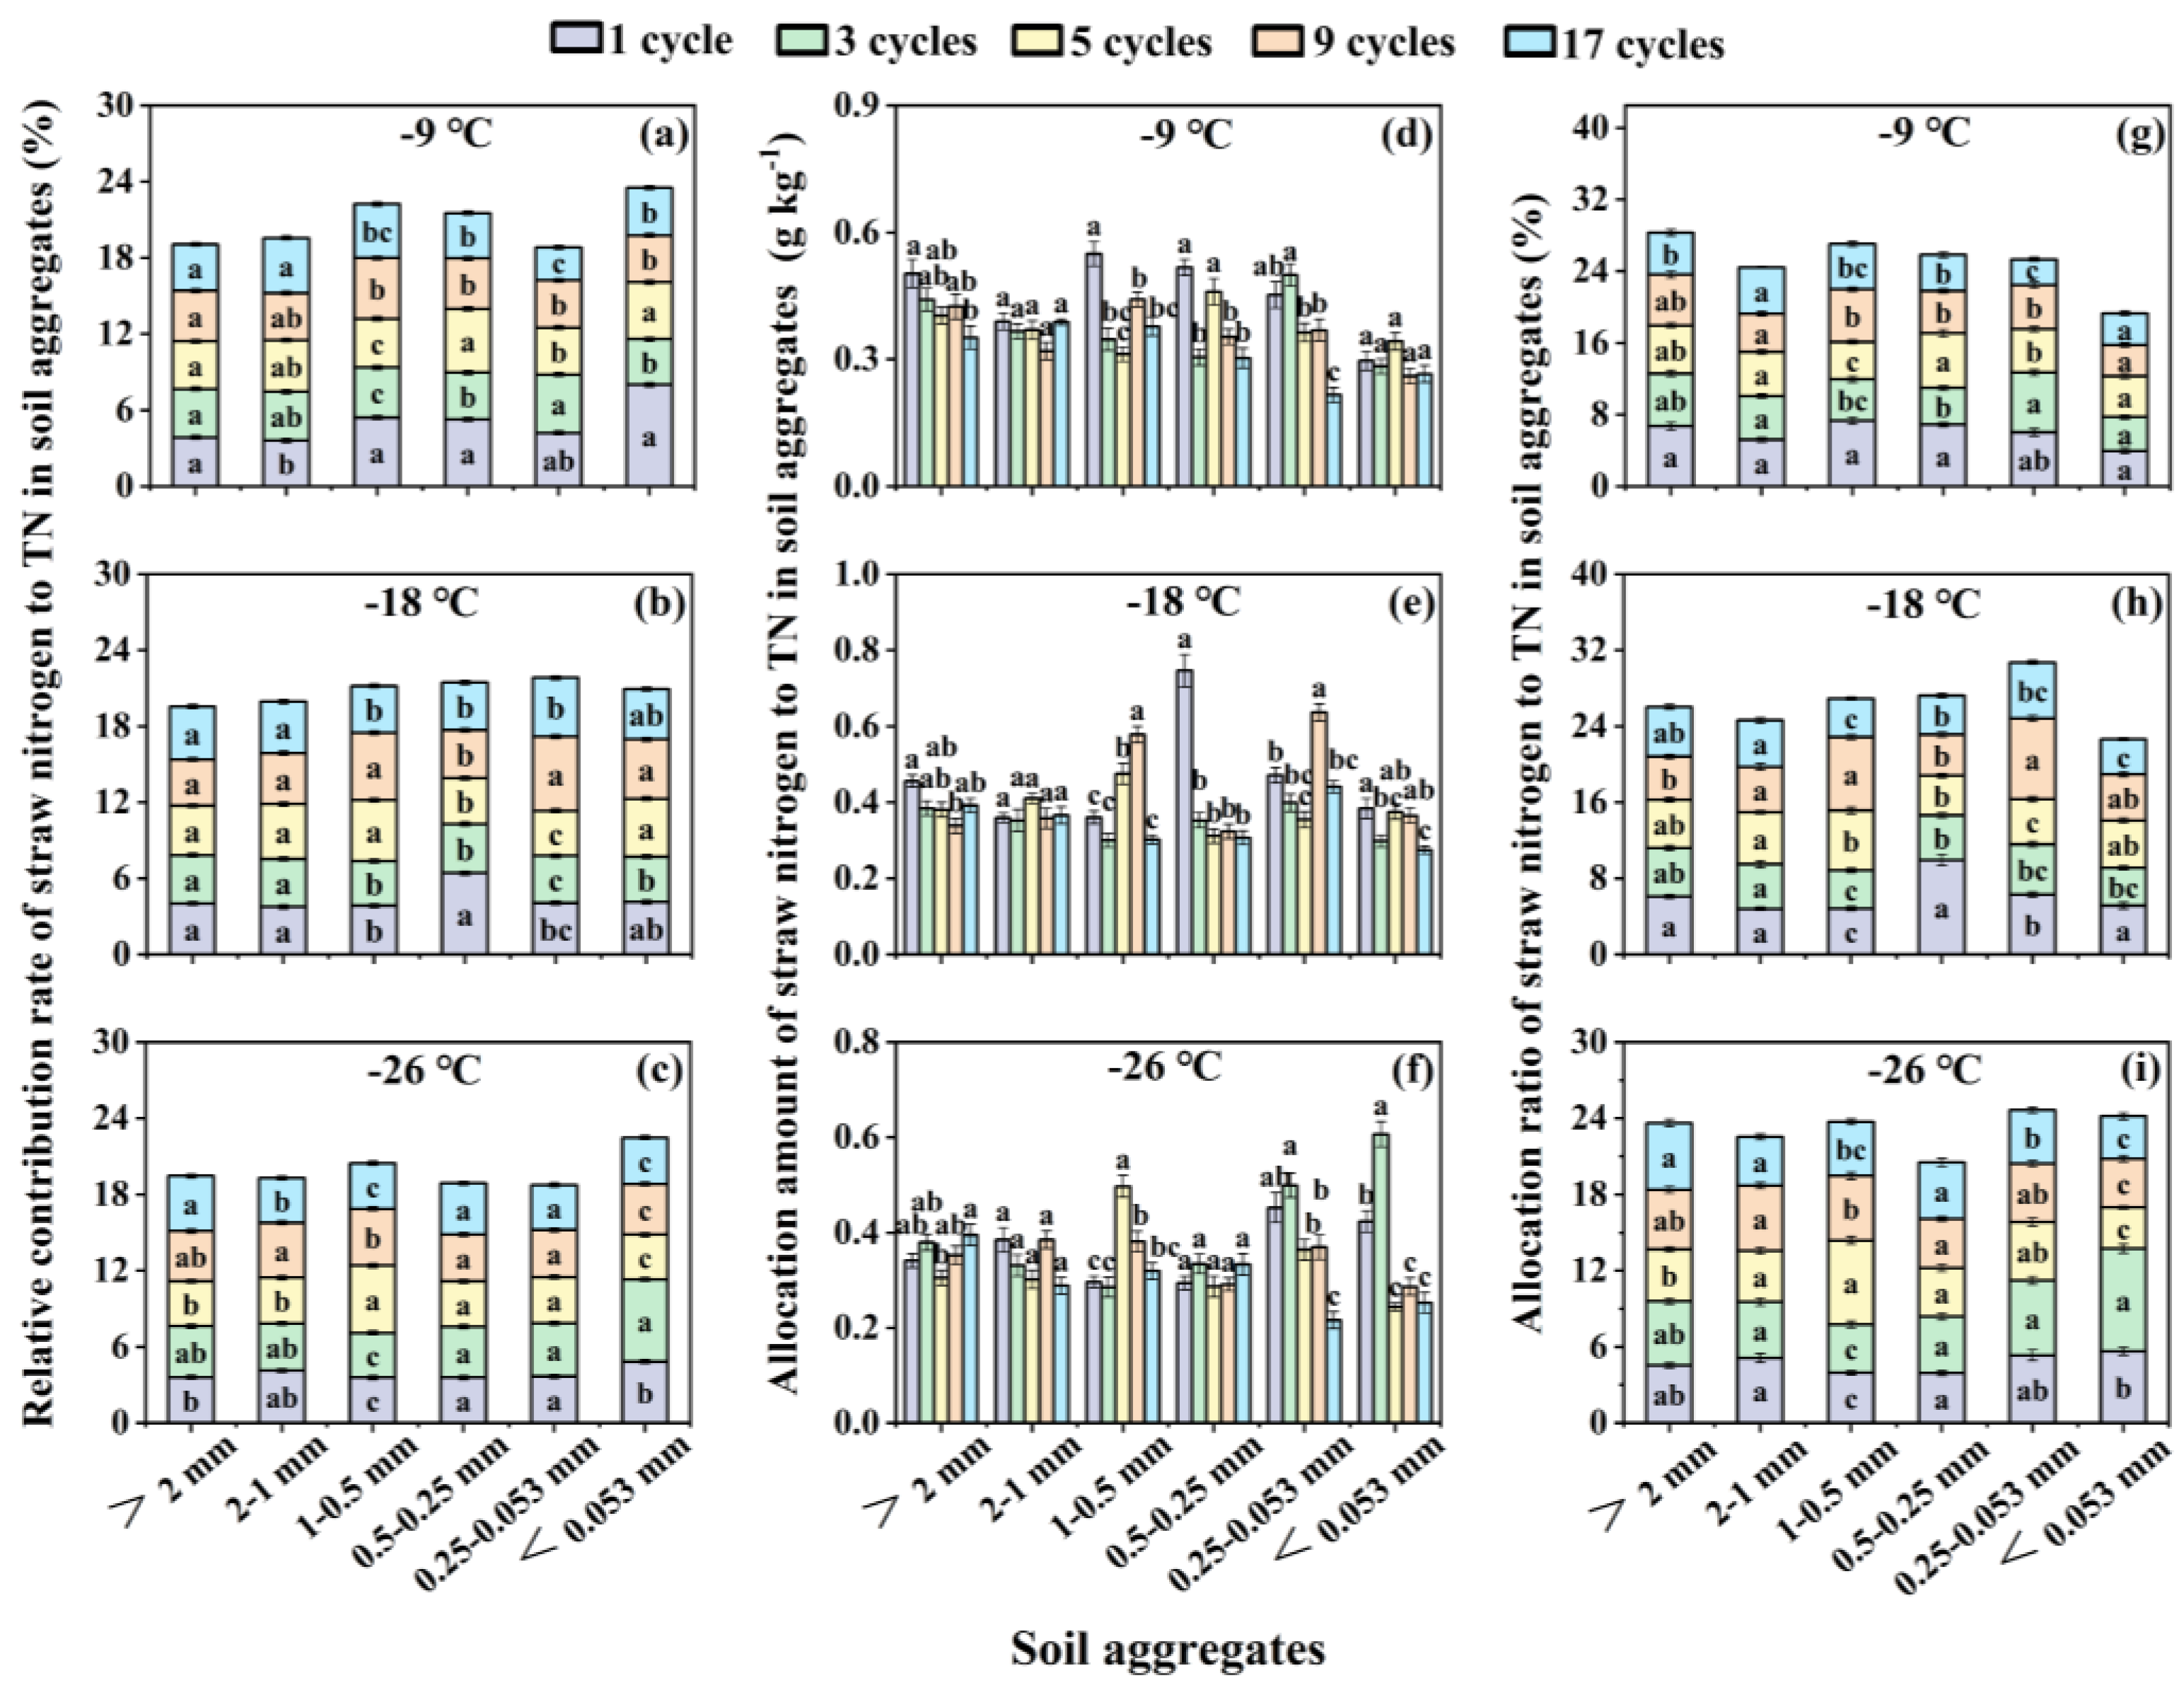
Figure 5.
Distribution of each soil aggregate size under freezing temperature of -9 ℃ (a), -18 ℃ (b), and -26 ℃ (c) among different freeze-thaw cycles. The different lowercase letters indicate significant differences at the p < 0.05 level among the same aggregate sizes within the same freezing temperature, as determined by Tukey’s HSD test across different freeze-thaw frequencies.
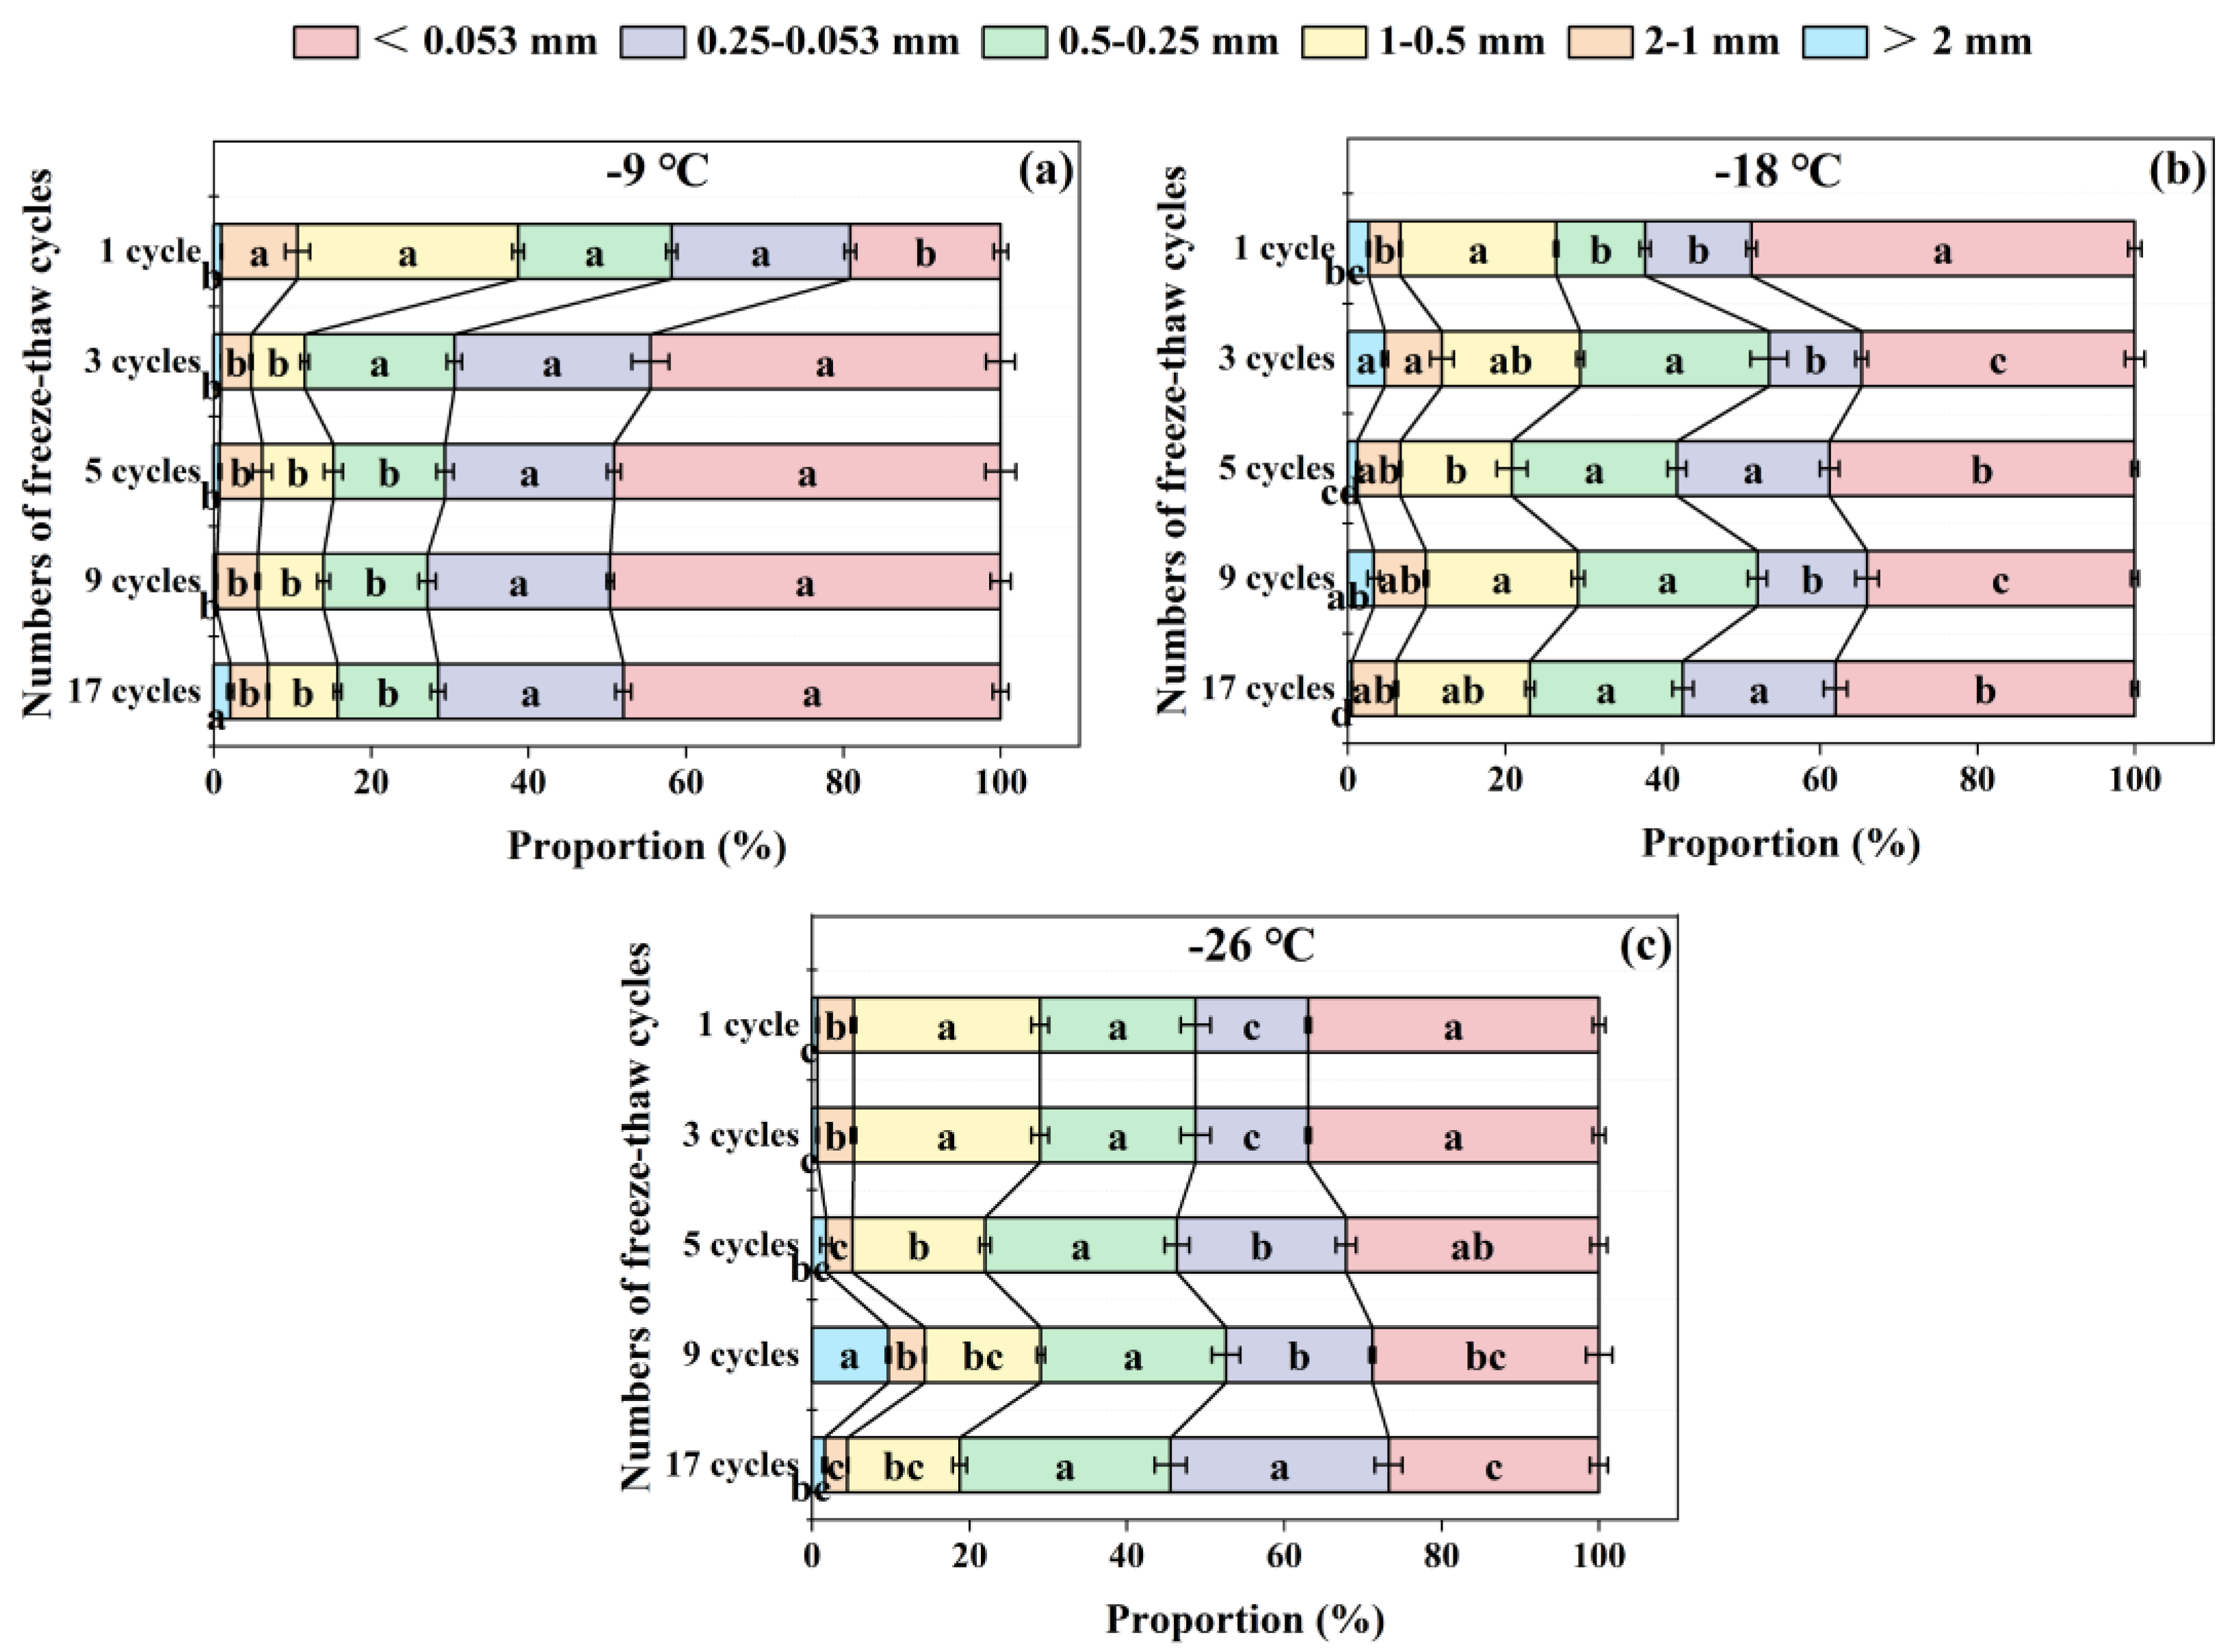
Figure 6.
Soil aggregate stability indicators of R0.25 (a), MWD (b), GMD (c), and fractal dimension (d) under different freeze-thaw frequencies and temperatures. The different lowercase letters indicate significant differences at the p < 0.05 level within the same freezing temperature, as determined by Tukey’s HSD test across the different freeze-thaw frequencies. R0.25 indicates distribution of aggregates larger than 0.25 mm in diameter. MWD and GMD represent mean weight diameter and geometric mean diameter respectively.
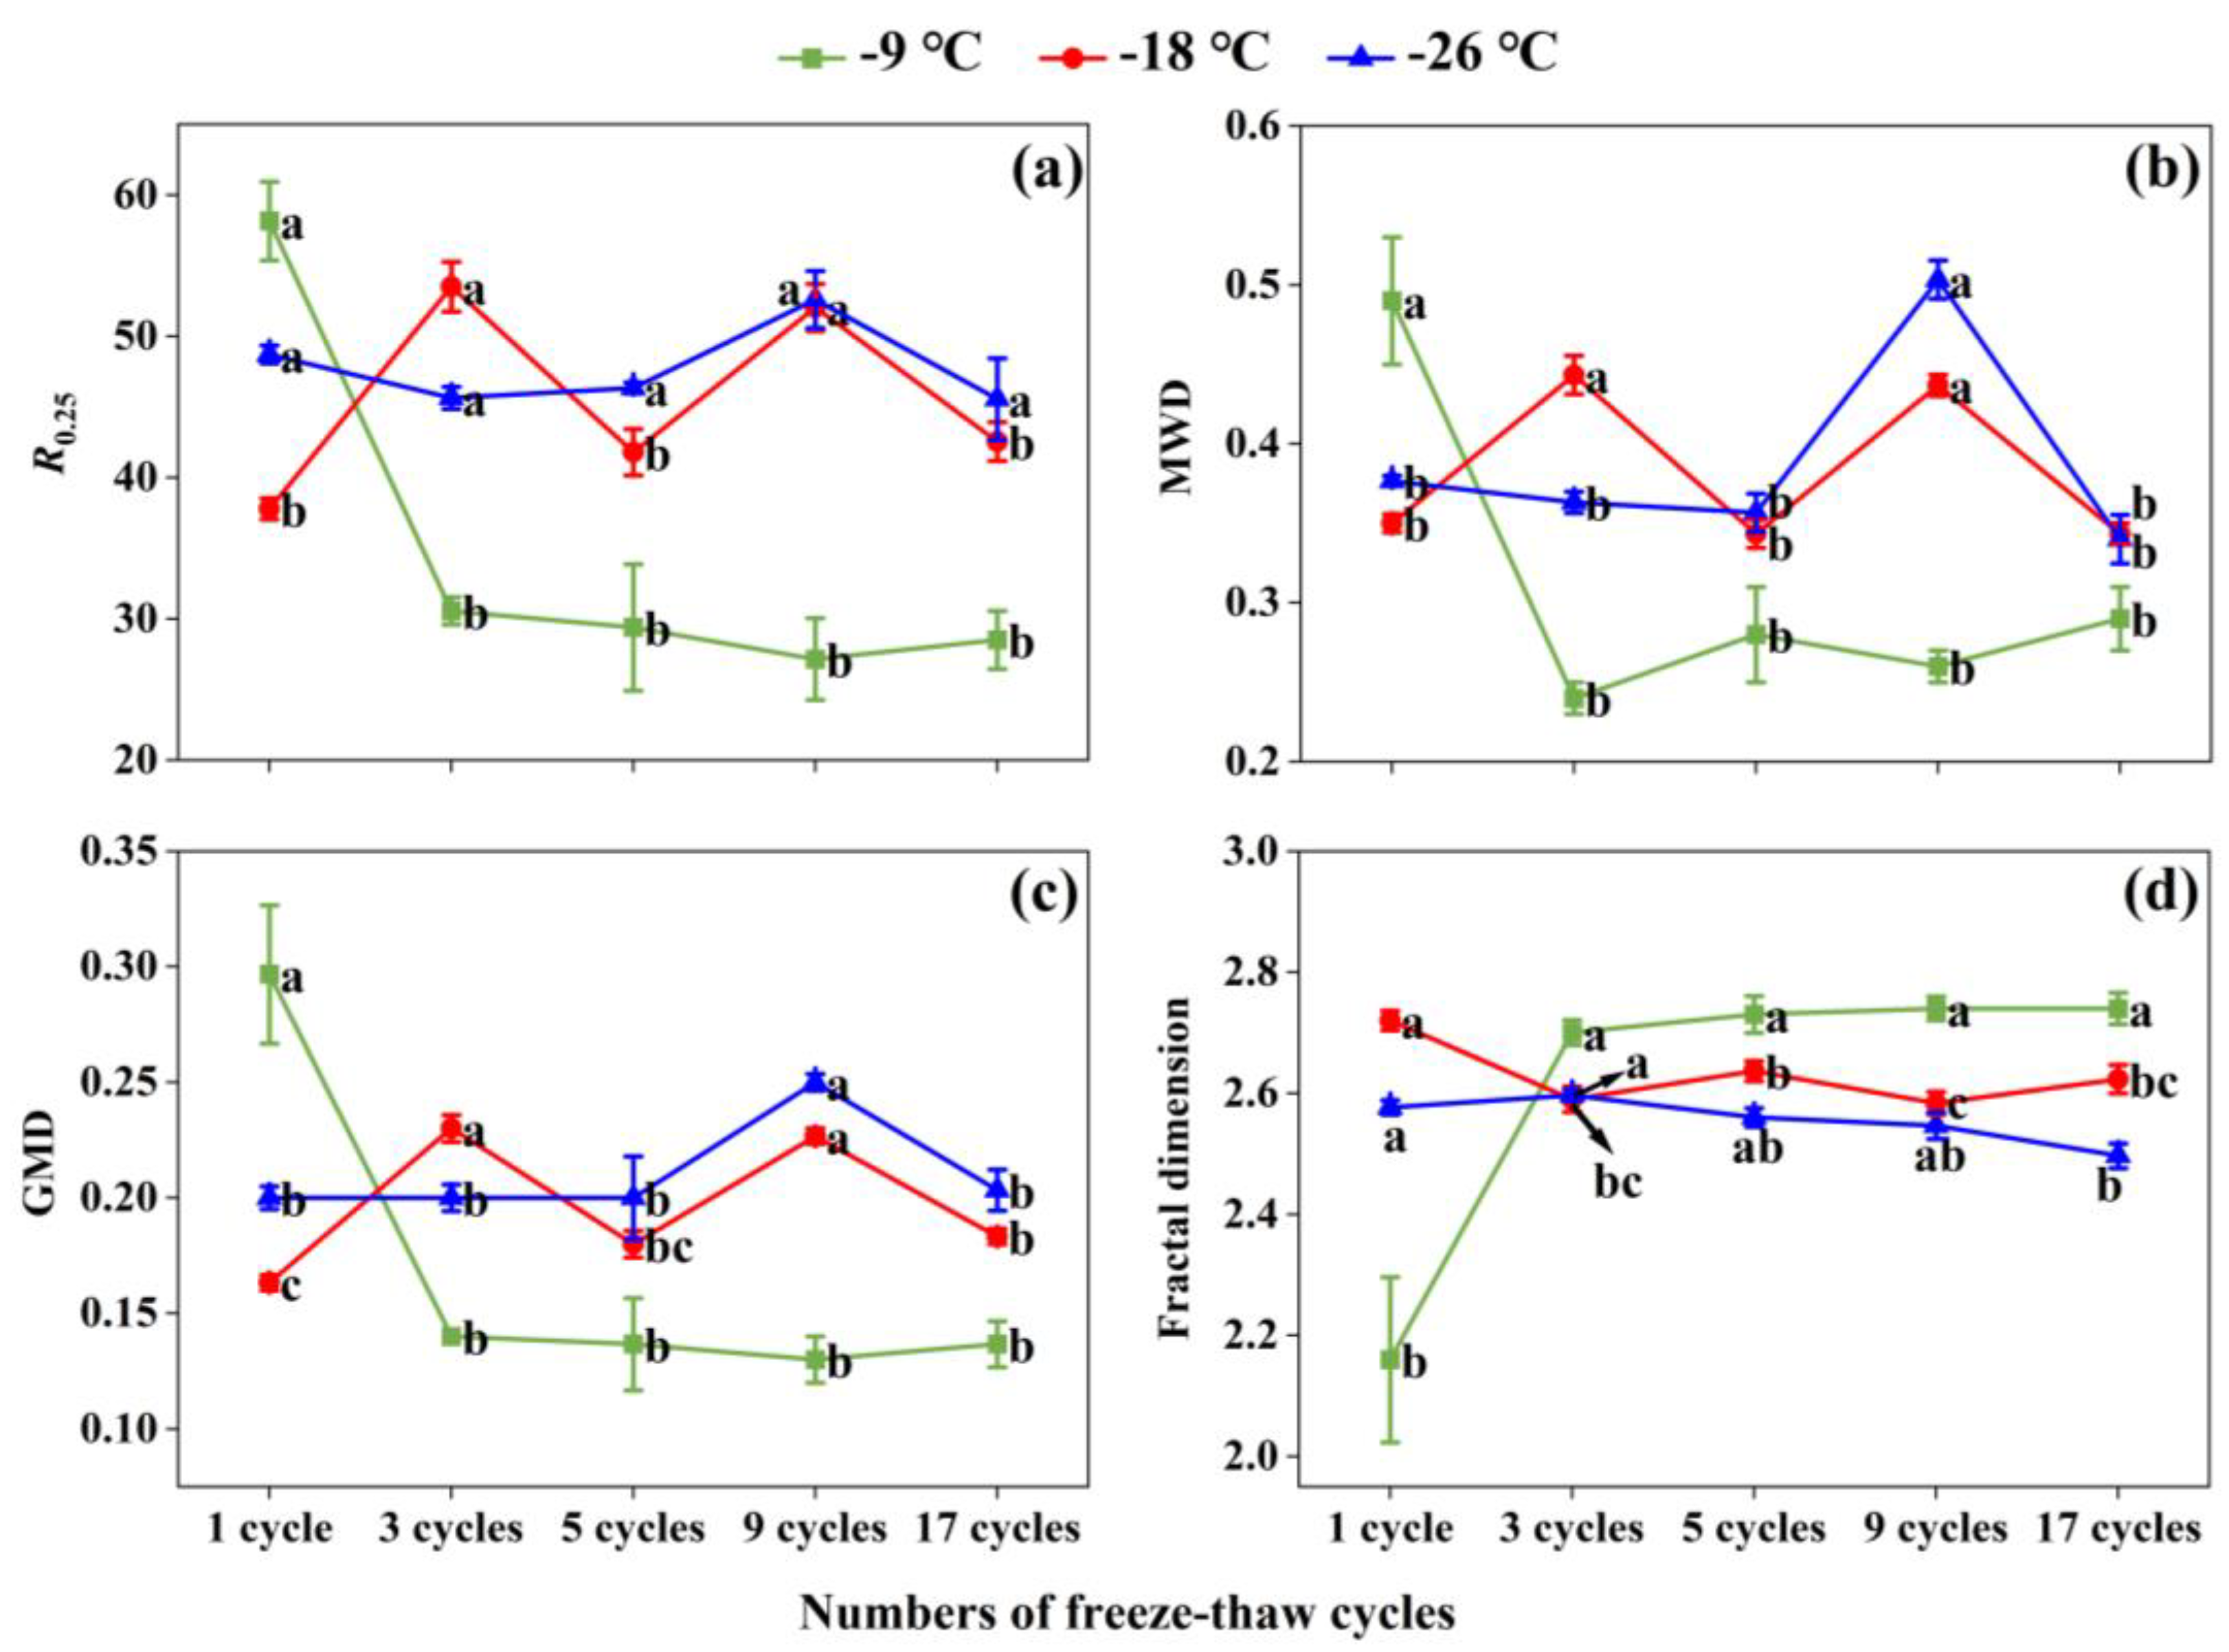
Figure 7.
Conceptual diagram illustrating the response mechanism of soil properties to aggregate stability under varying freeze-thaw frequencies and temperatures. TN, NO3--N, NH4+-N, and MBN represent total nitrogen, Nitrate nitrogen, ammonium nitrogen, and microbial biomass nitrogen, respectively.
Figure 7.
Conceptual diagram illustrating the response mechanism of soil properties to aggregate stability under varying freeze-thaw frequencies and temperatures. TN, NO3--N, NH4+-N, and MBN represent total nitrogen, Nitrate nitrogen, ammonium nitrogen, and microbial biomass nitrogen, respectively.
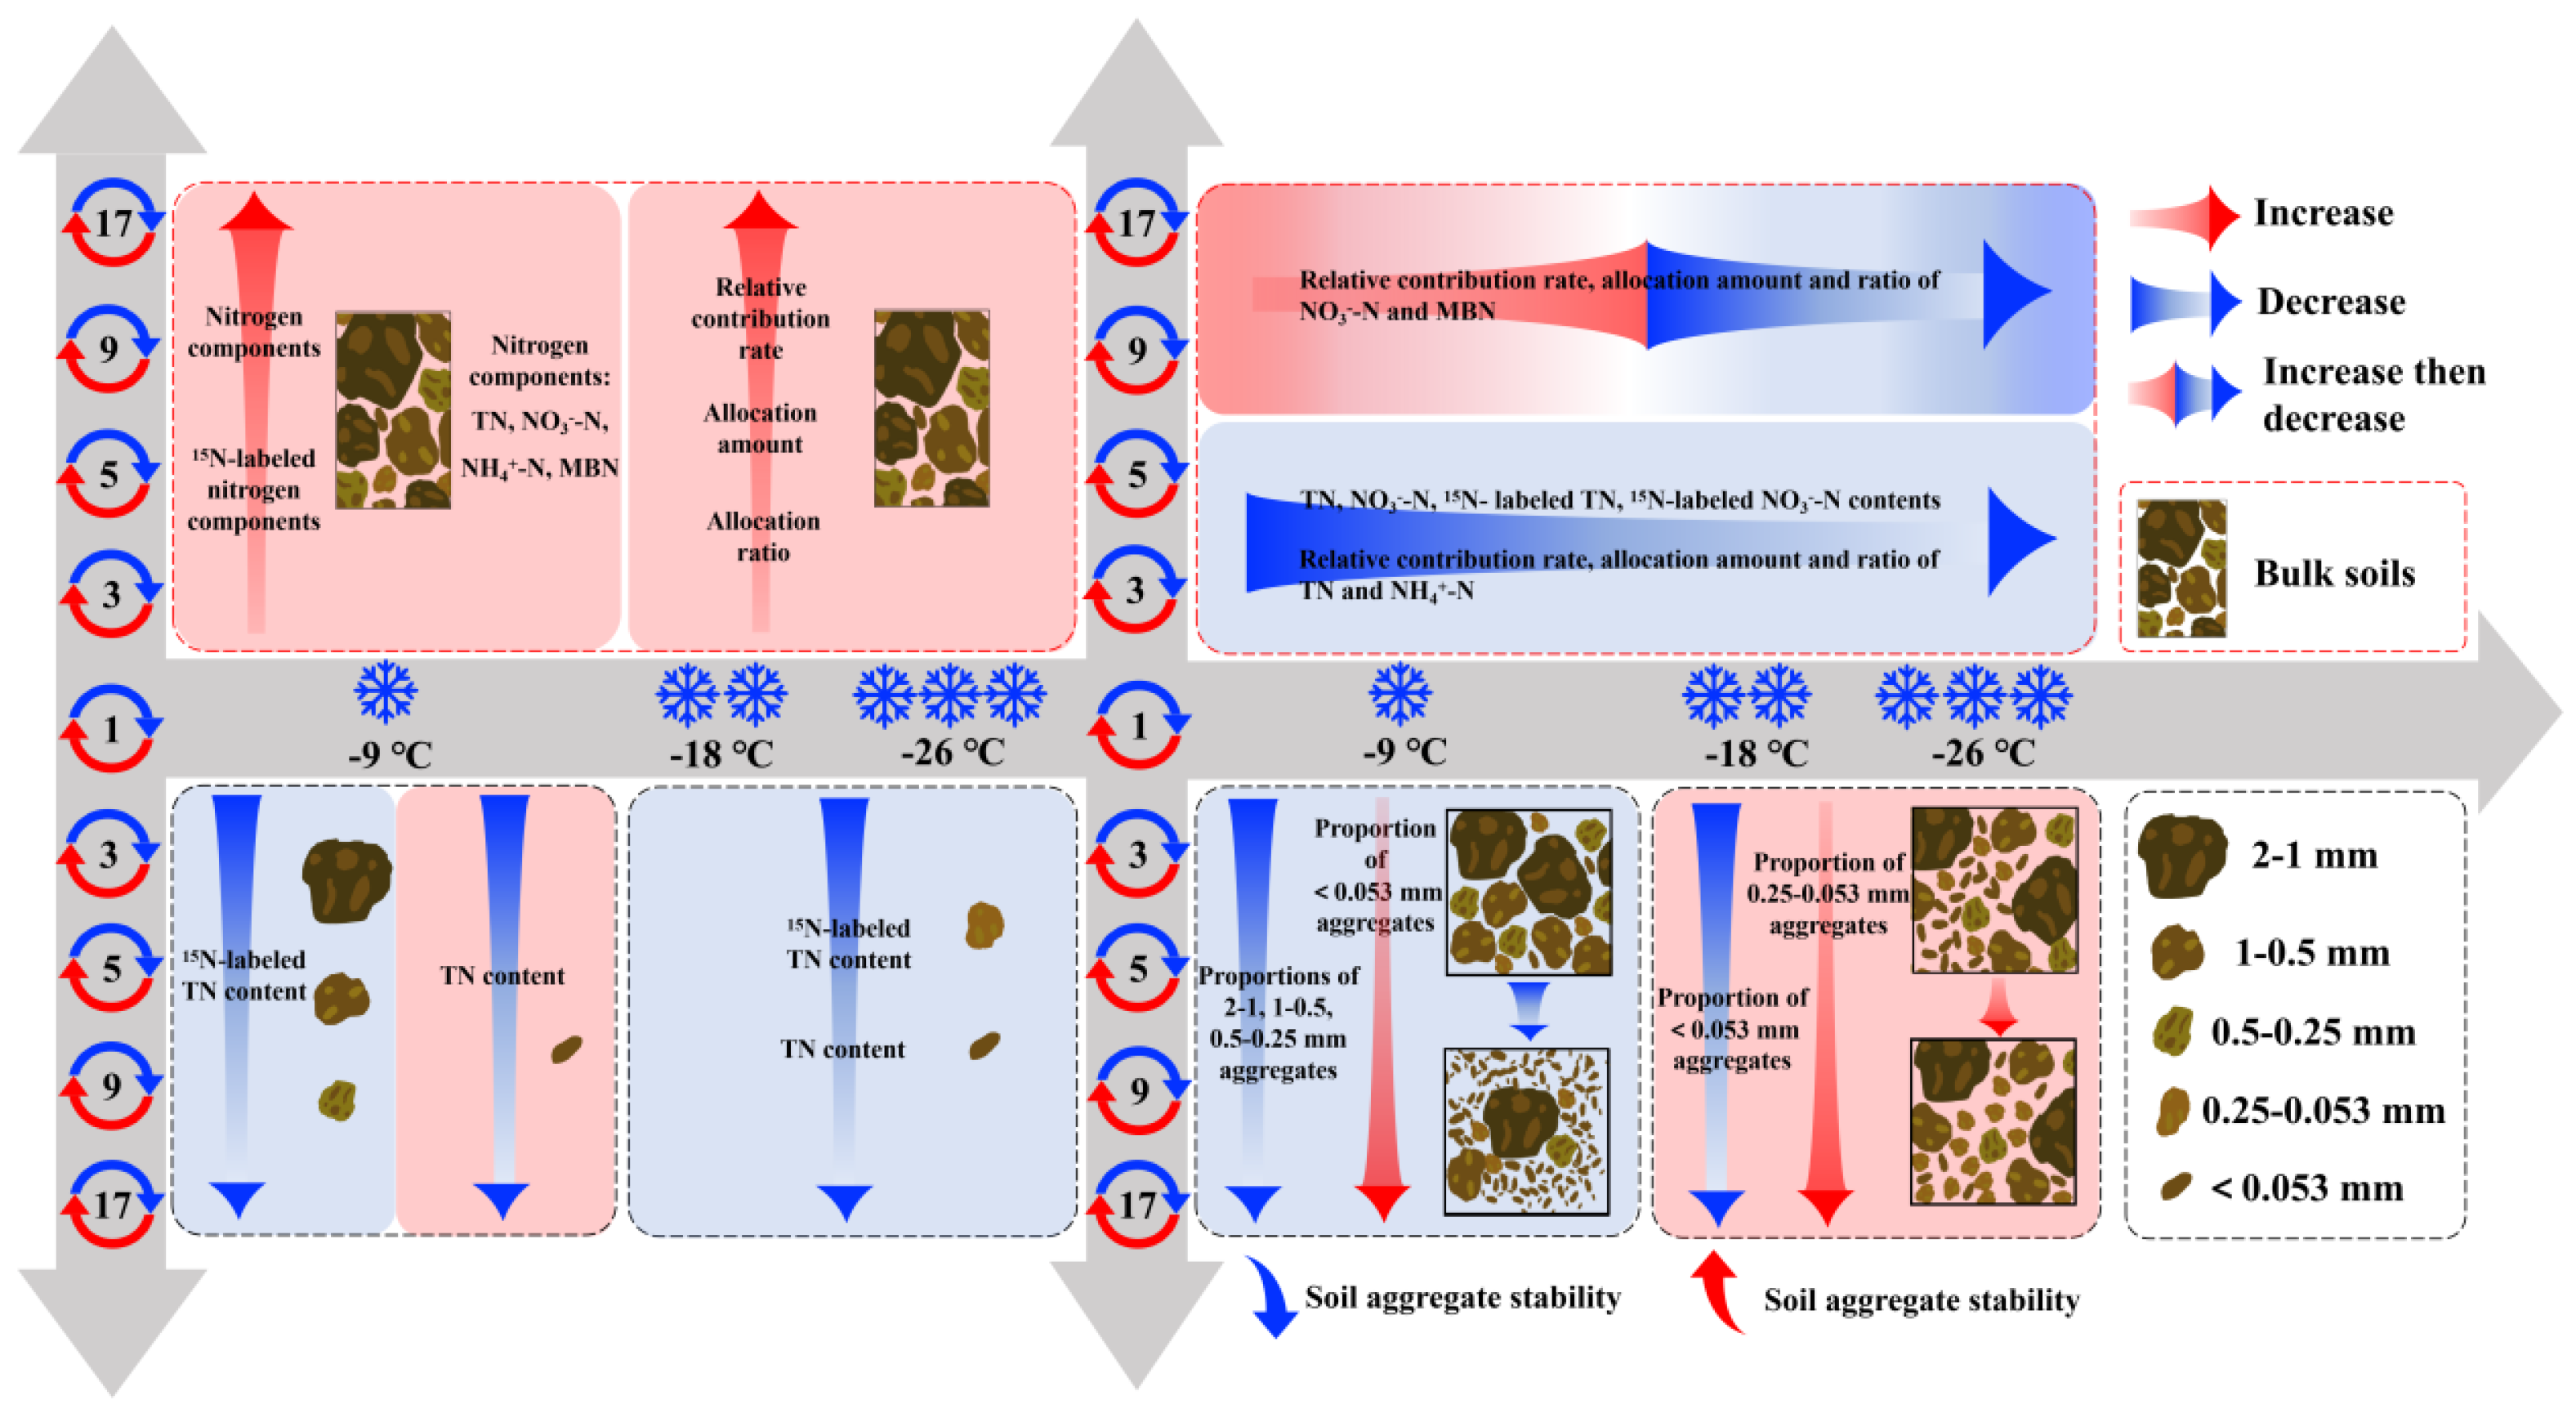

Table 1.
The p values of two-factor variance analysis of freeze-thaw frequency and freeze-thaw temperature on soil properties.
Table 1.
The p values of two-factor variance analysis of freeze-thaw frequency and freeze-thaw temperature on soil properties.
| Soil types | Soil indicators | Nitrogen components/ Aggregate sizes |
Factors | ||
|---|---|---|---|---|---|
| Freeze-thaw frequency | Freeze-thaw temperature | Freeze-thaw frequency × Freeze-thaw temperature | |||
| Bulk soils | Soil nitrogen component contents | TN | <0.001*** | <0.001*** | 0.401 |
| NO3--N | <0.001*** | 0.001** | 0.593 | ||
| NH4+-N | <0.001*** | 0.108 | 0.005** | ||
| MBN | <0.001*** | <0.001*** | 0.001** | ||
| 15N-labeled nitrogen component contents | TN | <0.001*** | <0.001*** | 0.518 | |
| NO3--N | <0.001*** | <0.001*** | 0.060 | ||
| NH4+-N | <0.001*** | 0.156 | 0.016 | ||
| MBN | <0.001*** | <0.001*** | 0.210 | ||
| Relative contribution rate | TN | <0.001*** | 0.753 | 0.859 | |
| NO3--N | <0.001*** | <0.001*** | <0.001*** | ||
| NH4+-N | <0.001*** | 0.294 | 0.333 | ||
| MBN | 0.042* | 0.983 | 0.851 | ||
| Allocation amount | TN | <0.001*** | 0.034 | 0.807 | |
| NO3--N | <0.001*** | <0.001*** | <0.001*** | ||
| NH4+-N | <0.001*** | 0.214 | 0.079 | ||
| MBN | <0.001*** | 0.001** | 0.457 | ||
| Allocation ratio | TN | <0.001*** | 0.034* | 0.807 | |
| NO3--N | <0.001*** | <0.001*** | <0.001*** | ||
| NH4+-N | <0.001*** | 0.213 | 0.078 | ||
| MBN | <0.001*** | 0.001** | 0.457 | ||
| Soil aggregates | TN contents | >2 mm | <0.001*** | <0.001*** | 0.040* |
| 2-1 mm | <0.001*** | <0.001*** | <0.001*** | ||
| 1-0.5 mm | 0.062 | <0.001*** | <0.001*** | ||
| 0.5-0.25 mm | 0.007** | <0.001*** | 0.006** | ||
| 0.25-0.053 mm | <0.001*** | 0.296 | <0.001*** | ||
| <0.053 mm | <0.001*** | <0.001*** | 0.061 | ||
| 15N-labeled TN contents | >2 mm | <0.001*** | <0.001*** | 0.002** | |
| 2-1 mm | <0.001*** | <0.001*** | 0.002** | ||
| 1-0.5 mm | <0.001*** | <0.001*** | <0.001*** | ||
| 0.5-0.25 mm | <0.001*** | <0.001*** | <0.001*** | ||
| 0.25-0.053 mm | <0.001*** | <0.001*** | 0.021* | ||
| <0.053 mm | <0.001*** | 0.003** | <0.001*** | ||
| Relative contribution rate | >2 mm | 0.151 | 0.563 | 0.034* | |
| 2-1 mm | 0.273 | 0.431 | 0.001*** | ||
| 1-0.5 mm | <0.001*** | 0.004** | <0.001*** | ||
| 0.5-0.25 mm | <0.001*** | <0.001*** | <0.001*** | ||
| 0.25-0.053 mm | <0.001*** | <0.001*** | <0.001*** | ||
| <0.053 mm | <0.001*** | <0.001*** | <0.001*** | ||
| Allocation amount | >2 mm | 0.003** | <0.001*** | 0.003** | |
| 2-1 mm | 0.384 | 0.038 | 0.005** | ||
| 1-0.5 mm | <0.001*** | 0.001** | <0.001*** | ||
| 0.5-0.25 mm | <0.001*** | <0.001*** | <0.001*** | ||
| 0.25-0.053 mm | <0.001*** | <0.001*** | <0.001*** | ||
| <0.053 mm | <0.001*** | <0.001*** | <0.001*** | ||
| Allocation ratio | >2 mm | 0.003** | <0.001*** | 0.003** | |
| 2-1 mm | 0.384 | 0.038* | 0.005** | ||
| 1-0.5 mm | <0.001*** | 0.001** | <0.001*** | ||
| 0.5-0.25 mm | <0.001*** | <0.001*** | <0.001*** | ||
| 0.25-0.053 mm | <0.001*** | <0.001*** | <0.001*** | ||
| <0.053 mm | <0.001*** | <0.001*** | <0.001*** | ||
| Soil aggregate stability | R0.25 | <0.001*** | <0.001*** | <0.001*** | |
| MWD | <0.001*** | <0.001*** | <0.001*** | ||
| GMD | <0.001*** | <0.001*** | <0.001*** | ||
| D | <0.001*** | <0.001*** | <0.001*** | ||
1 *, **, and ** indicate the significant differences at p<0.5, p<0.1, and p<0.001, respectively. n = 45. TN signifies total nitrogen, NO3--N and NH4+-N indicate nitrate nitrogen and ammonium nitrogen respectively, and MBN means microbial biomass nitrogen. R0.25 indicates distribution of aggregates larger than 0.25 mm in diameter. MWD and GMD represent mean weight diameter and geometric mean diameter, respectively. D indicates fractal dimension.
Table 2.
Pearson correlation analysis between soil properties and fractral dimension under the three freeze-thaw intensities.
Table 2.
Pearson correlation analysis between soil properties and fractral dimension under the three freeze-thaw intensities.
| Soil types | Soil properties | Soil indicators/ Aggregate sizes |
Freezing temperatures | ||
|---|---|---|---|---|---|
| -9 ℃ | -18 ℃ | -26 ℃ | |||
| Bulk soils | TN | Nitrogen content | 0.521* | -0.440 | -0.609* |
| 15N-labeled nitrogen content | 0.504 | -0.418 | -0.666** | ||
| Relative contribution rate | 0.433 | -0.369 | -0.604* | ||
| Allocation amount | 0.466 | -0.379 | -0.680** | ||
| Allocation ratio | 0.466 | -0.379 | -0.680** | ||
| NO3--N | Nitrogen content | 0.723** | -0.532* | -0.726** | |
| 15N-labeled nitrogen content | 0.635* | -0.433 | -0.741** | ||
| Relative contribution rate | 0.624* | -0.418 | -0.711** | ||
| Allocation amount | 0.530* | -0.356 | -0.752** | ||
| Allocation ratio | 0.530* | -0.356 | -0.752** | ||
| NH4+-N | Nitrogen content | 0.694** | -0.474 | -0.531* | |
| 15N-labeled nitrogen content | 0.643** | -0.459 | -0.564* | ||
| Relative contribution rate | 0.489 | -0.403 | -0.532* | ||
| Allocation amount | 0.558* | -0.388 | -0.595* | ||
| Allocation ratio | 0.558* | -0.388 | -0.595* | ||
| MBN | Nitrogen content | 0.767** | -0.589* | -0.650** | |
| 15N-labeled nitrogen content | 0.694** | -0.256 | -0.674** | ||
| Relative contribution rate | 0.593* | 0.019 | -0.582* | ||
| Allocation amount | 0.632* | -0.248 | -0.689** | ||
| Allocation ratio | 0.632* | -0.248 | -0.689** | ||
| Soil aggregates | Proportion | >2 mm | 0.061 | 0.007 | 0.007 |
| 2-1 mm | -0.868** | 0.597* | 0.597* | ||
| 1-0.5 mm | -0.971** | 0.098 | 0.098 | ||
| 0.5-0.25 mm | -0.602* | -0.622* | -0.622* | ||
| 0.25-0.053 mm | 0.112 | -0.533* | -0.533* | ||
| <0.053 mm | 0.978** | 0.861** | 0.861** | ||
| TN content | >2 mm | -0.817** | 0.469 | 0.469 | |
| 2-1 mm | -0.917** | 0.599* | 0.599* | ||
| 1-0.5 mm | -0.348 | -0.434 | -0.434 | ||
| 0.5-0.25 mm | -0.100 | 0.205 | 0.205 | ||
| 0.25-0.053 mm | -0.631* | 0.461 | 0.461 | ||
| <0.053 mm | -0.651** | 0.435 | 0.435 | ||
|
15N-labeled TN content |
>2 mm | -0.765** | 0.076 | 0.076 | |
| 2-1 mm | -0.862** | 0.531* | 0.531* | ||
| 1-0.5 mm | -0.675** | -0.361 | -0.361 | ||
| 0.5-0.25 mm | -0.674** | -0.177 | -0.177 | ||
| 0.25-0.053 mm | -0.494 | 0.454 | 0.454 | ||
| <0.053 mm | -0.576* | 0.550* | 0.550* | ||
| Relative contribution rate | >2 mm | -0.007 | -0.535* | -0.535* | |
| 2-1 mm | 0.524* | 0.247 | 0.247 | ||
| 1-0.5 mm | -0.702** | -0.029 | -0.029 | ||
| 0.5-0.25 mm | -0.653** | -0.469 | -0.469 | ||
| 0.25-0.053 mm | -0.379 | 0.156 | 0.156 | ||
| <0.053 mm | 0.247 | 0.509 | 0.509 | ||
| Allocation amount | >2 mm | -0.575* | -0.419 | -0.419 | |
| 2-1 mm | -0.227 | 0.354 | 0.354 | ||
| 1-0.5 mm | -0.734** | -0.103 | -0.103 | ||
| 0.5-0.25 mm | -0.698** | -0.400 | -0.400 | ||
| 0.25-0.053 mm | -0.429 | 0.360 | 0.360 | ||
| <0.053 mm | -0.131 | 0.541* | 0.541* | ||
| Allocation ratio | >2 mm | -0.575* | -0.420 | -0.420 | |
| 2-1 mm | -0.227 | 0.355 | 0.355 | ||
| 1-0.5 mm | -0.734** | -0.103 | -0.103 | ||
| 0.5-0.25 mm | -0.698** | -0.400 | -0.400 | ||
| 0.25-0.053 mm | -0.429 | 0.360 | 0.360 | ||
| <0.053 mm | -0.131 | 0.541* | 0.541* | ||
1 * and ** indicate the significant differences at p<0.5 and p<0.1, respectively. n = 15. TN signifies total nitrogen, NO3--N and NH4+-N indicate nitrate nitrogen and ammonium nitrogen respectively, and MBN means microbial biomass nitrogen.
Disclaimer/Publisher’s Note: The statements, opinions and data contained in all publications are solely those of the individual author(s) and contributor(s) and not of MDPI and/or the editor(s). MDPI and/or the editor(s) disclaim responsibility for any injury to people or property resulting from any ideas, methods, instructions or products referred to in the content. |
© 2025 by the authors. Licensee MDPI, Basel, Switzerland. This article is an open access article distributed under the terms and conditions of the Creative Commons Attribution (CC BY) license (http://creativecommons.org/licenses/by/4.0/).
Copyright: This open access article is published under a Creative Commons CC BY 4.0 license, which permit the free download, distribution, and reuse, provided that the author and preprint are cited in any reuse.


