
Submitted:
31 July 2025
Posted:
01 August 2025
You are already at the latest version
Abstract
Graph Neural Networks (GNNs) face significant challenges in node classification across diverse graph structures. Traditional message passing mechanisms often fail to adaptively weight node relationships, thereby limiting performance in both homophilic and heterophilic graph settings. We propose the Eigenvector Distance-Modulated Graph Neural Network (EDM-GNN), which enhances message passing by incorporating spectral information from the graph’s eigenvectors. Our method introduces a novel weighting scheme that modulates information flow based on a combined similarity measure that balances feature-based similarity with structural similarity derived from eigenvector distances. This approach creates a more discriminative aggregation process that adapts to the underlying graph topology without requiring prior knowledge of homophily characteristics. We implement a hierarchical neighborhood aggregation framework that utilizes these spectral weights across multiple powers of the adjacency matrix. Experimental results on benchmark datasets demonstrate that EDM-GNN achieves competitive performance with state-of-the-art methods across both homophilic and heterophilic settings. Our approach provides a unified solution for node classification problems with strong theoretical foundations in spectral graph theory and significant empirical improvements in classification accuracy.
Keywords:
graph neural networks
; spectral graph theory
; eigenvector distance
; node classification
; edge weighting
; graph representation learning
1. Introduction
Graph Neural Networks (GNNs) have emerged as powerful tools for learning representations of graph-structured data, with applications spanning diverse domains including social network analysis [1], molecular property prediction [2], and recommendation systems [3]. Despite their success, GNNs still face significant challenges in effectively modeling complex graph structures, particularly in heterophilic environments where connected nodes tend to have different labels [4].
A fundamental limitation of conventional GNNs is their message-passing (MP) mechanism [2,5], which typically treats all neighboring nodes equally or employs simple attention mechanisms that may not capture the structural properties of the graph [6]. This approach proves inadequate when dealing with the intricate connectivity patterns found in real-world heterophilic graphs [7]. Recent research has explored various strategies to address this issue, including the incorporation of higher-order neighborhood information [8], adaptive aggregation mechanisms [9], and community-aware approaches [10]. Spectral graph theory (SGT) provides valuable insights into the structural properties of graphs through the eigendecomposition of graph matrices. The graph spectrum encodes rich information about connectivity patterns, community structures, and node similarities [11]. However, existing spectral approaches often focus solely on using eigenvectors for embedding or clustering [12,13,14], without effectively integrating this information into the MP mechanism of GNNs.
In this paper, we propose the Eigenvector Distance-Modulated Graph Neural Network (EDM-GNN), a novel approach that enhances MP by incorporating eigenvector distances from the graph’s spectral domain. Our key innovation is a weighting scheme that modulates information flow based on a combined similarity measure that balances feature-based similarity with structural similarity derived from eigenvector distances between node pairs. This technique creates a more discriminative aggregation process that adapts to the underlying graph topology. The eigenvector distance between nodes captures their structural positioning in the graph’s spectral representation, complementing traditional feature similarity measures. By combining these two dimensions, our approach can identify nodes that are both semantically similar (in feature space) and structurally aligned (in spectral space), leading to more effective information propagation. This is particularly valuable in heterophilic graphs, where connected nodes may have different labels but similar structural roles. Our contributions can be summarized as follows:
- We introduce a spectral modulation mechanism that leverages eigenvector distances to weight MP between nodes, enhancing the model’s ability to capture structural properties.
- We implement a multi-order neighborhood aggregation framework that applies our spectral weighting strategy across various powers of the adjacency matrix.
- We demonstrate through extensive experiments on benchmark datasets that our approach consistently outperforms state-of-the-art (SOTA) methods in both homophilic and heterophilic settings.
The remainder of this paper is organized as follows: Section 2 reviews related work in GNNs and SGT. Section 3 provides the necessary preliminary concepts. Section 4 presents our proposed EDM-GNN method in detail. Section 5 describes the experimental setup and results, followed by a discussion of the findings. Finally, Section 6 concludes the paper and outlines directions for future research.
2. Related Work
Our work intersects several key areas of research in GNNs and SGT. We organize the related work into three main categories: GNNs for node classification, approaches to handling heterophily, and spectral methods in graph learning.
2.1. Graph Neural Networks for Node Classification
Traditional GNN architectures, such as Graph Convolutional Networks (GCNs) [6] and Graph Attention Networks (GATs) [15], have proven effective for homophilic graphs where connected nodes tend to share similar characteristics [1].
However, recent work has highlighted significant limitations of conventional GNNs when applied to heterophilic settings. The fundamental assumption that neighboring nodes share similar features or labels often fails in real-world networks [7]. This has motivated the development of more sophisticated aggregation mechanisms that can adaptively handle diverse graph topologies.
Several recent approaches have attempted to address these limitations through architectural innovations. GraphSAINT [16] introduced sampling techniques to improve scalability and robustness, while Graph Isomorphism Networks (GINs) [17] focused on maximizing the representational power through careful design of aggregation functions. However, these methods still primarily rely on local neighborhood structures and may not effectively capture the global structural patterns that are crucial for heterophilic graphs.
2.2. Handling Heterophily in Graph Neural Networks
The challenge of heterophily has received increasing attention in recent years, with several pioneering works proposing novel architectures specifically designed for graphs where connected nodes have dissimilar characteristics.
H2GCN [7] introduced ego- and neighbor-embedding separation along with higher-order neighborhood exploration to better handle heterophilic graphs. The key insight was that in heterophilic settings, a node’s own features may be more informative than its immediate neighbors’ features. GEOM-GCN [18] addressed the limitations of standard MP by incorporating geometric relationships in the latent space.
Higher-order approaches have shown particular promise for heterophilic graphs. MixHop [8] demonstrated the effectiveness of aggregating features from nodes at different hop distances using powers of the transition matrix. Similarly, FSGNN [19] incorporated regularization techniques such as softmax and L2-normalization to improve multi-hop aggregation. These approaches recognize that useful information for heterophilic graphs may reside beyond immediate neighborhoods.
Recent work has also explored adaptive mechanisms for handling diverse graph structures. GPR-GNN [9] integrated generalized PageRank with GNNs to provide adaptive feature smoothing. FAGCN [20] introduced learnable filters that can capture both low-frequency and high-frequency signals in graphs, making it suitable for both homophilic and heterophilic settings.
Community-aware approaches have emerged as another promising direction. The Community-HOP method [10] leveraged spectral clustering to identify graph communities and modified information flow within and between communities. This approach recognizes that structural communities may provide important signals for node classification, even when immediate neighbors are not informative.
2.3. Spectral Methods in Graph Learning
Spectral graph theory has a rich history in analyzing graph structures through eigendecomposition of graph matrices [11,12]. Classical spectral clustering algorithms have demonstrated the power of eigenvector-based representations for understanding graph structure and identifying communities.
In the context of GNNs, spectral approaches have primarily focused on defining convolution operations in the spectral domain. ChebNet [21] used Chebyshev polynomials to approximate spectral filters, providing a localized approach to spectral convolution. However, these methods typically use spectral information to define the convolution operation rather than incorporating spectral properties directly into the MP mechanism.
More recent work has begun to explore the integration of spectral information with modern GNN architectures. Some approaches have used graph spectral properties for regularization or as auxiliary features, but few have directly incorporated eigenvector distances into the MP mechanism as we propose.
The concept of using eigenvector distances to measure structural similarity has been explored in various graph analysis contexts [22]. However, the specific application to modulating MP in GNNs, particularly the ratio-based weighting scheme we introduce, represents a novel contribution to the field.
2.4. Limitations of Existing Approaches
While existing methods have made significant progress in addressing heterophily and incorporating structural information, several limitations remain [23]. First, many approaches rely on predefined heuristics or require prior knowledge about the graph’s homophily characteristics. Second, methods that use higher-order neighborhoods often suffer from computational complexity issues or may introduce noise from distant, irrelevant nodes [19].
Our proposed EDM-GNN addresses these limitations by introducing a novel spectral modulation mechanism that adaptively weights MP based on both feature similarity and structural alignment, as measured by eigenvector distances. This approach provides a unified framework that can handle both homophilic and heterophilic graphs without requiring prior knowledge of graph characteristics.
3. Preliminaries
In this section, we introduce the essential mathematical concepts and notations that form the foundation of our proposed method. We begin with basic graph representations and the node classification problem, followed by detailed exposition of SGT elements, and conclude with the MP mechanism in GNNs including attention-based approaches.
3.1. Graph Representation and Node Classification
Let denote an undirected graph, where represents the set of n nodes and represents the set of edges. We use the adjacency matrix to encode the graph structure, where if there exists an edge between nodes and , and otherwise.
Each node is associated with a feature vector , where d is the dimensionality of the feature space. These features are collectively represented as a matrix , where the i-th row corresponds to the feature vector of node . For supervised node classification, a subset of nodes have associated labels , where C is the number of classes.
The node classification problem aims to predict the labels of unlabeled nodes by learning a function that maps node features to class labels. This learning process typically leverages both the node features and the graph structure to make predictions.
For analytical purposes, we define the diagonal degree matrix , where represents the degree of node . To account for self-loops in the graph, we define the augmented adjacency matrix , where is the identity matrix.
3.1.1. Homophily and Heterophily
A fundamental characteristic of graphs that significantly impacts node classification performance is the concept of homophily versus heterophily. Homophily refers to the tendency of connected nodes to share similar characteristics or labels. Conversely, heterophily describes scenarios where connected nodes tend to have different characteristics or labels.
To quantify the level of homophily in a graph [7], we use the edge homophily ratio, defined as:
where denotes the label of node . This metric ranges from 0 (complete heterophily) to 1 (complete homophily). Graphs with are typically considered homophilic, while those with are considered heterophilic [24].
The degree of homophily significantly affects the performance of traditional GNNs, which often assume that neighboring nodes share similar characteristics. This assumption breaks down in heterophilic graphs, motivating the need for more sophisticated approaches that can adaptively handle both scenarios.
3.2. Spectral Graph Theory
Spectral graph theory provides a powerful mathematical framework for analyzing the structural properties of graphs through the lens of linear algebra. The cornerstone of this theory is the normalized graph Laplacian, defined as:
The normalized Laplacian matrix is symmetric and positive semi-definite, with several important mathematical properties. Its eigenvalues provide crucial information about the graph’s connectivity and structure.
3.2.1. Eigendecomposition and Spectral Properties
The spectral decomposition of yields a set of eigenvalues with corresponding orthonormal eigenvectors . These eigenvectors form an orthonormal basis for and can be organized into a matrix .
For a connected graph, the smallest eigenvalue with its corresponding eigenvector being the constant vector. The second smallest eigenvalue is known as the algebraic connectivity or Fiedler value, and its corresponding eigenvector (the Fiedler vector) provides insights into the graph’s cut structure.
The eigenvalues of the normalized Laplacian are bounded as , where always, with multiplicity equal to the number of connected components, for connected graphs, indicating the strength of connectivity and , with equality achieved when the graph contains a bipartite component [25].
The eigenvectors corresponding to smaller eigenvalues capture global, low-frequency patterns in the graph, while those corresponding to larger eigenvalues capture local, high-frequency variations. This spectral hierarchy allows us to analyze the graph at different scales of resolution.
3.2.2. Eigenvector Distance and Structural Similarity
When we represent each node using the components of the first k eigenvectors (typically excluding ), we obtain a spectral embedding that captures the node’s position within the global structure of the graph. For any two nodes and , we can compute their eigenvector distance as:
where represents the spectral embedding of node using the first k eigenvectors. This distance measure provides a principled way to assess structural similarity between nodes, even when they are located in distant parts of the graph.
The eigenvector distance encodes rich information about the relative positions of nodes within the graph’s global structure that local measures like shortest path distance cannot capture. Nodes with small eigenvector distances tend to play similar structural roles in the graph, regardless of their proximity in the original topology [11].
3.3. Graph Neural Networks and Message Passing
GNNs operate through a MP framework, which consists of three fundamental steps: message construction, aggregation, and update [2]. For the l-th layer of a GNN, this process can be expressed generically as:
where is the feature vector of node at layer l, denotes the set of neighboring nodes of , and represents potential edge features or weights.
3.3.1. Graph Convolutional Networks
A fundamental instantiation of this framework is the Graph Convolutional Network (GCN) [6], which implements a simplified and efficient MP scheme. The GCN layer is defined as:
where is the adjacency matrix with self-loops, is the corresponding degree matrix, is a learnable weight matrix, and is a non-linear activation function.
The key insight of GCN is the use of the normalized adjacency matrix , which provides a principled way to weight the contribution of neighboring nodes based on their degrees. This normalization ensures that nodes with high degrees do not dominate the aggregation process, while nodes with low degrees still receive sufficient influence from their neighbors.
3.3.2. Graph Attention Networks
While GCNs use predefined normalization to weight node contributions, Graph Attention Networks (GATs) [15] introduce learnable attention mechanisms to dynamically determine the importance of different neighbors. In GAT, the attention coefficient between nodes i and j is computed as:
where is a learnable attention vector, is a weight matrix, and ∥ denotes concatenation. The final node representation is then computed as:
The attention mechanism in GAT allows the model to focus on the most relevant neighbors for each node, providing more flexibility than the fixed normalization used in GCN. This adaptive weighting scheme bears conceptual similarity to our proposed eigenvector distance-based modulation, although our approach incorporates structural information from the graph’s spectral domain rather than relying solely on feature-based attention.
3.3.3. Multi-Order Neighborhood Aggregation
Higher-order GNN approaches extend the basic MP framework by considering information from multi-hop neighborhoods [8,17]. This can be achieved by computing various powers of the normalized adjacency matrix:
where encodes k-hop relationships between nodes. The element represents the strength of connection between nodes and through paths of length k.
Multi-order approaches aggregate information from different neighborhood scales and combine them through learnable attention weights:
where are learnable attention weights satisfying , and are layer-specific weight matrices for each order k.
This multi-order aggregation is particularly valuable for heterophilic graphs, where useful information may reside beyond immediate neighborhoods. Our approach builds upon this foundation by introducing spectral-based edge weighting that enhances the quality of multi-hop connections through eigenvector distance modulation.
4. Methodology
In this section, we present EDM-GNN, a novel approach that enhances MP by incorporating spectral information through eigenvector distances. Our method addresses the fundamental limitation of conventional GNNs by introducing a principled framework that adaptively weights edges based on both structural similarity and feature similarity, enabling effective learning across diverse graph topologies.
The key insight underlying our approach is that traditional MP mechanisms fail to capture the rich structural information encoded in the graph’s spectral domain. While existing methods either treat all neighbors equally or rely primarily on feature-based attention, they overlook the global structural relationships that eigenvectors naturally encode. By incorporating eigenvector distances into the edge weighting scheme, we create a more discriminative aggregation process that adapts to the underlying graph topology without requiring prior knowledge of homophily characteristics.
Figure 1 illustrates the overall architecture of our proposed EDM-GNN framework. The methodology proceeds through several interconnected stages: spectral preprocessing to extract structural similarities, feature-based similarity computation, adaptive edge reweighting through combined similarity measures, and multi-order neighborhood aggregation with learnable attention mechanisms.
4.1. Spectral Preprocessing and Structural Similarity
Our approach begins with the spectral analysis of the input graph to extract structural information through eigendecomposition of the normalized Laplacian matrix. Given a graph with feature matrix , we compute the normalized Laplacian , where includes self-loops. The eigendecomposition provides us with eigenvectors and corresponding eigenvalues in ascending order.
We select the first k non-trivial eigenvectors (excluding the constant eigenvector ) to form the spectral embedding matrix . Each node is then represented by its spectral coordinates , capturing its position within the global structure of the graph. The structural similarity between nodes is computed using the eigenvector distance defined in the preliminaries, which is then normalized to the range to obtain . This spectral similarity effectively captures structural relationships between nodes, with higher values indicating nodes that play similar roles in the graph’s global organization.
4.2. Adaptive Edge Reweighting
Complementing the structural information, we compute feature-based similarity using the node attribute matrix . Similarly to the spectral case, feature similarity is computed using Euclidean distance and normalized to obtain .
The core innovation of our approach lies in the adaptive combination of structural and feature similarities. We introduce a spectral weight parameter that controls the relative importance of structural versus feature information:
This combined similarity measure serves as the foundation for our edge reweighting mechanism, allowing the model to dynamically balance between local feature similarities and global structural patterns. An important observation is that in highly heterophilic datasets, optimal values of tend to be low, as structural information becomes less reliable when neighboring nodes frequently have different labels. Conversely, in homophilic settings, higher values effectively leverage the structural coherence of the graph.
4.3. Multi-Order Graph Construction and Architecture
To capture multi-scale neighborhood information, we construct multi-order adjacency matrices by computing powers of the normalized adjacency matrix . For each order , we compute and extract edges where . This process creates increasingly sparse but longer-range connectivity patterns, as shown in Figure 1 where different hop levels exhibit distinct edge patterns.
The edge reweighting process applies our combined similarity measure to filter and weight the multi-order connections. For each order k, we retain edges where the combined similarity exceeds a threshold, typically set to the mean similarity value for that order. To maintain computational efficiency and prevent excessive graph densification, we limit the number of retained edges to the original edge count. The final edge weights are set directly to the combined similarity values:
Our complete EDM-GNN architecture integrates the reweighted multi-order graphs through parallel processing streams, each handling a different connectivity scale. The model begins with an MLP-based transformation of the input features to capture node-specific information. For each order k, we apply MP using the reweighted edges:
where represents the k-hop neighborhood of node i, and are the combined similarity weights that modulate the information flow between nodes.
To enhance the model’s expressiveness, we include additional processing streams: a pure MLP branch that processes node features without graph structure, and an original graph branch that uses the unmodified connectivity. These parallel streams are visible in Figure 1 as separate pathways that converge at the attention-based fusion stage.
The fusion of all processing streams employs learnable attention weights where are trainable parameters. The final node representations combine all streams through weighted summation:
Classification is performed through a final MLP layer with dropout regularization:
Training employs standard cross-entropy loss with L2 regularization:
where represents the training node set, and controls the strength of weight decay regularization.
4.4. Computational Complexity Analysis
The computational complexity of EDM-GNN consists of preprocessing and model execution phases. The preprocessing phase dominates the computational cost, primarily due to the eigendecomposition of the normalized Laplacian matrix. For a graph with n nodes, computing the full eigendecomposition requires operations. However, since we only need the first k eigenvectors where , efficient algorithms like the Lanczos method reduce this to for sparse graphs.
Similarity computations contribute for feature similarity and for spectral similarity, where d is the feature dimension. The multi-order graph construction requires K matrix multiplications, each with complexity where m is the edge count and is the average degree, resulting in total complexity for this phase.
During model execution, each forward pass processes K different graph orders through GCN layers, contributing where L is the number of layers per order and h is the hidden dimension. The attention mechanism and additional MLP operations add , which is typically dominated by the GCN computations.
Memory requirements include storing multi-order graphs , intermediate embeddings , and model parameters . For large graphs, the preprocessing bottleneck can be addressed through approximate eigendecomposition methods or sampling-based similarity computation, reducing complexity while maintaining the quality of structural information extraction.
The overall preprocessing complexity is , while the per-forward-pass complexity during training and inference is . This computational profile makes EDM-GNN practical for moderately large graphs while providing significant improvements in classification accuracy through principled integration of structural and feature information.
5. Experiments and Results
In this section, we present comprehensive experimental evaluations of our proposed EDM-GNN framework across diverse benchmark datasets. We begin by describing the experimental setup, including dataset characteristics and implementation details, followed by comparative analysis against SOTA baselines and thorough ablation studies to validate our design choices.
5.1. Experimental Setup
We evaluate EDM-GNN on nine widely-used benchmark datasets that span different domains and exhibit varying degrees of homophily, as summarized in Table 1. The datasets include citation networks (Cora, Citeseer, Pubmed), web page networks (Texas, Wisconsin, Cornell), and social networks (Actor, Squirrel, Chameleon). This diverse collection allows us to assess our method’s performance across both homophilic (h > 0.5) and heterophilic (h < 0.5) graphs, providing a comprehensive evaluation of the proposed approach.
The homophily level, defined as the fraction of edges connecting nodes with the same labels, serves as a crucial indicator of graph characteristics. Homophilic datasets like Cora (h = 0.81) and Pubmed (h = 0.80) follow the traditional assumption that connected nodes tend to share similar properties, while heterophilic datasets such as Texas (h = 0.11) and Wisconsin (h = 0.21) present challenging scenarios where neighboring nodes often have different labels.
We compare EDM-GNN against a comprehensive set of baseline methods representing different paradigms in GNNs. Traditional GNNs including GCN [6], GAT [15], and GraphSAGE [1] represent fundamental approaches that assume homophily. Heterophily-aware methods such as H2GCN [7], Geom-GCN [18], and GGCN [24] are specifically designed to handle heterophilic graphs through various architectural innovations. Higher-order approaches including MixHop [8], FSGNN [19], and GPRGNN [9] leverage multi-hop neighborhoods to capture longer-range dependencies. Hybrid methods like LINKX [26] and CGNN represent approaches that combine graph structure with feature-based learning. Additionally, MLP serves as a feature-only baseline to assess the contribution of graph structure.
We implement EDM-GNN using PyTorch and PyTorch Geometric [27], following best practices for reproducible research. All experiments are conducted on NVIDIA RTX4090 GPUs with CUDA acceleration. We employ a standardized data splitting strategy using 60% of nodes for training, 20% for validation, and 20% for testing, with 10 different random splits to ensure statistical significance of results [18].
The hyperparameter optimization follows a systematic grid search approach. For each dataset, we explore hidden dimensions , number of hops , learning rates , dropout rates , and weight decay values . The spectral weight parameter and number of eigenvectors are tuned separately based on validation performance. Training is performed for a maximum of 1000 epochs with early stopping based on validation accuracy to prevent overfitting.
For spectral preprocessing, we compute the first 20 eigenvectors of the normalized Laplacian matrix using efficient eigendecomposition algorithms. The edge reweighting mechanism applies the combined similarity measure with adaptive thresholding, maintaining computational efficiency while preserving the most informative connections in multi-hop neighborhoods.
5.2. Main Results
Table 2 presents the comprehensive comparison of EDM-GNN against all baseline methods across the nine benchmark datasets. The results demonstrate the effectiveness and versatility of our approach across diverse graph characteristics.
EDM-GNN achieves first or second best performance on eight out of nine datasets, with particularly strong results on both homophilic and heterophilic graphs. Notably, our method achieves the best performance on Texas (89.17%), Wisconsin (87.91%), Pubmed (90.21%) and Cora (88.33%), while maintaining competitive results on other datasets. This consistent performance across diverse graph types validates the effectiveness of our spectral modulation approach.
On strongly heterophilic datasets (Texas, Wisconsin, Chameleon), EDM-GNN significantly outperforms traditional GNN approaches that assume homophily. For instance, on Texas, our method achieves 89.17% accuracy compared to 55.14% for GCN and 52.16% for GAT, representing improvements of over 30 percentage points. This substantial gain demonstrates that our eigenvector distance-based edge reweighting effectively adapts to heterophilic structures where standard MP fails.
Compared to specialized heterophily-aware methods, EDM-GNN shows consistent improvements. On Wisconsin, we achieve 87.91% compared to 87.65% for H2GCN and 86.86% for GGCN, while on Texas, our 89.17% substantially exceeds the 84.86% achieved by both H2GCN and GGCN. These results indicate that our spectral approach provides a more principled solution to heterophily than existing architectural modifications.
On homophilic datasets, EDM-GNN maintains competitive performance while avoiding the degradation often observed in heterophily-specific methods. On Cora, we achieve 88.33% accuracy, outperforming most baselines including the recent FSGNN (87.93%). This demonstrates that our approach gracefully adapts to homophilic structures without sacrificing performance.
Against methods that explicitly use multi-hop information (MixHop, FSGNN, GPRGNN), EDM-GNN shows superior performance in most cases. The key advantage lies in our principled edge reweighting mechanism that selectively preserves informative long-range connections while filtering out noise, contrasting with methods that uniformly aggregate multi-hop neighborhoods.
5.3. Ablation Studies
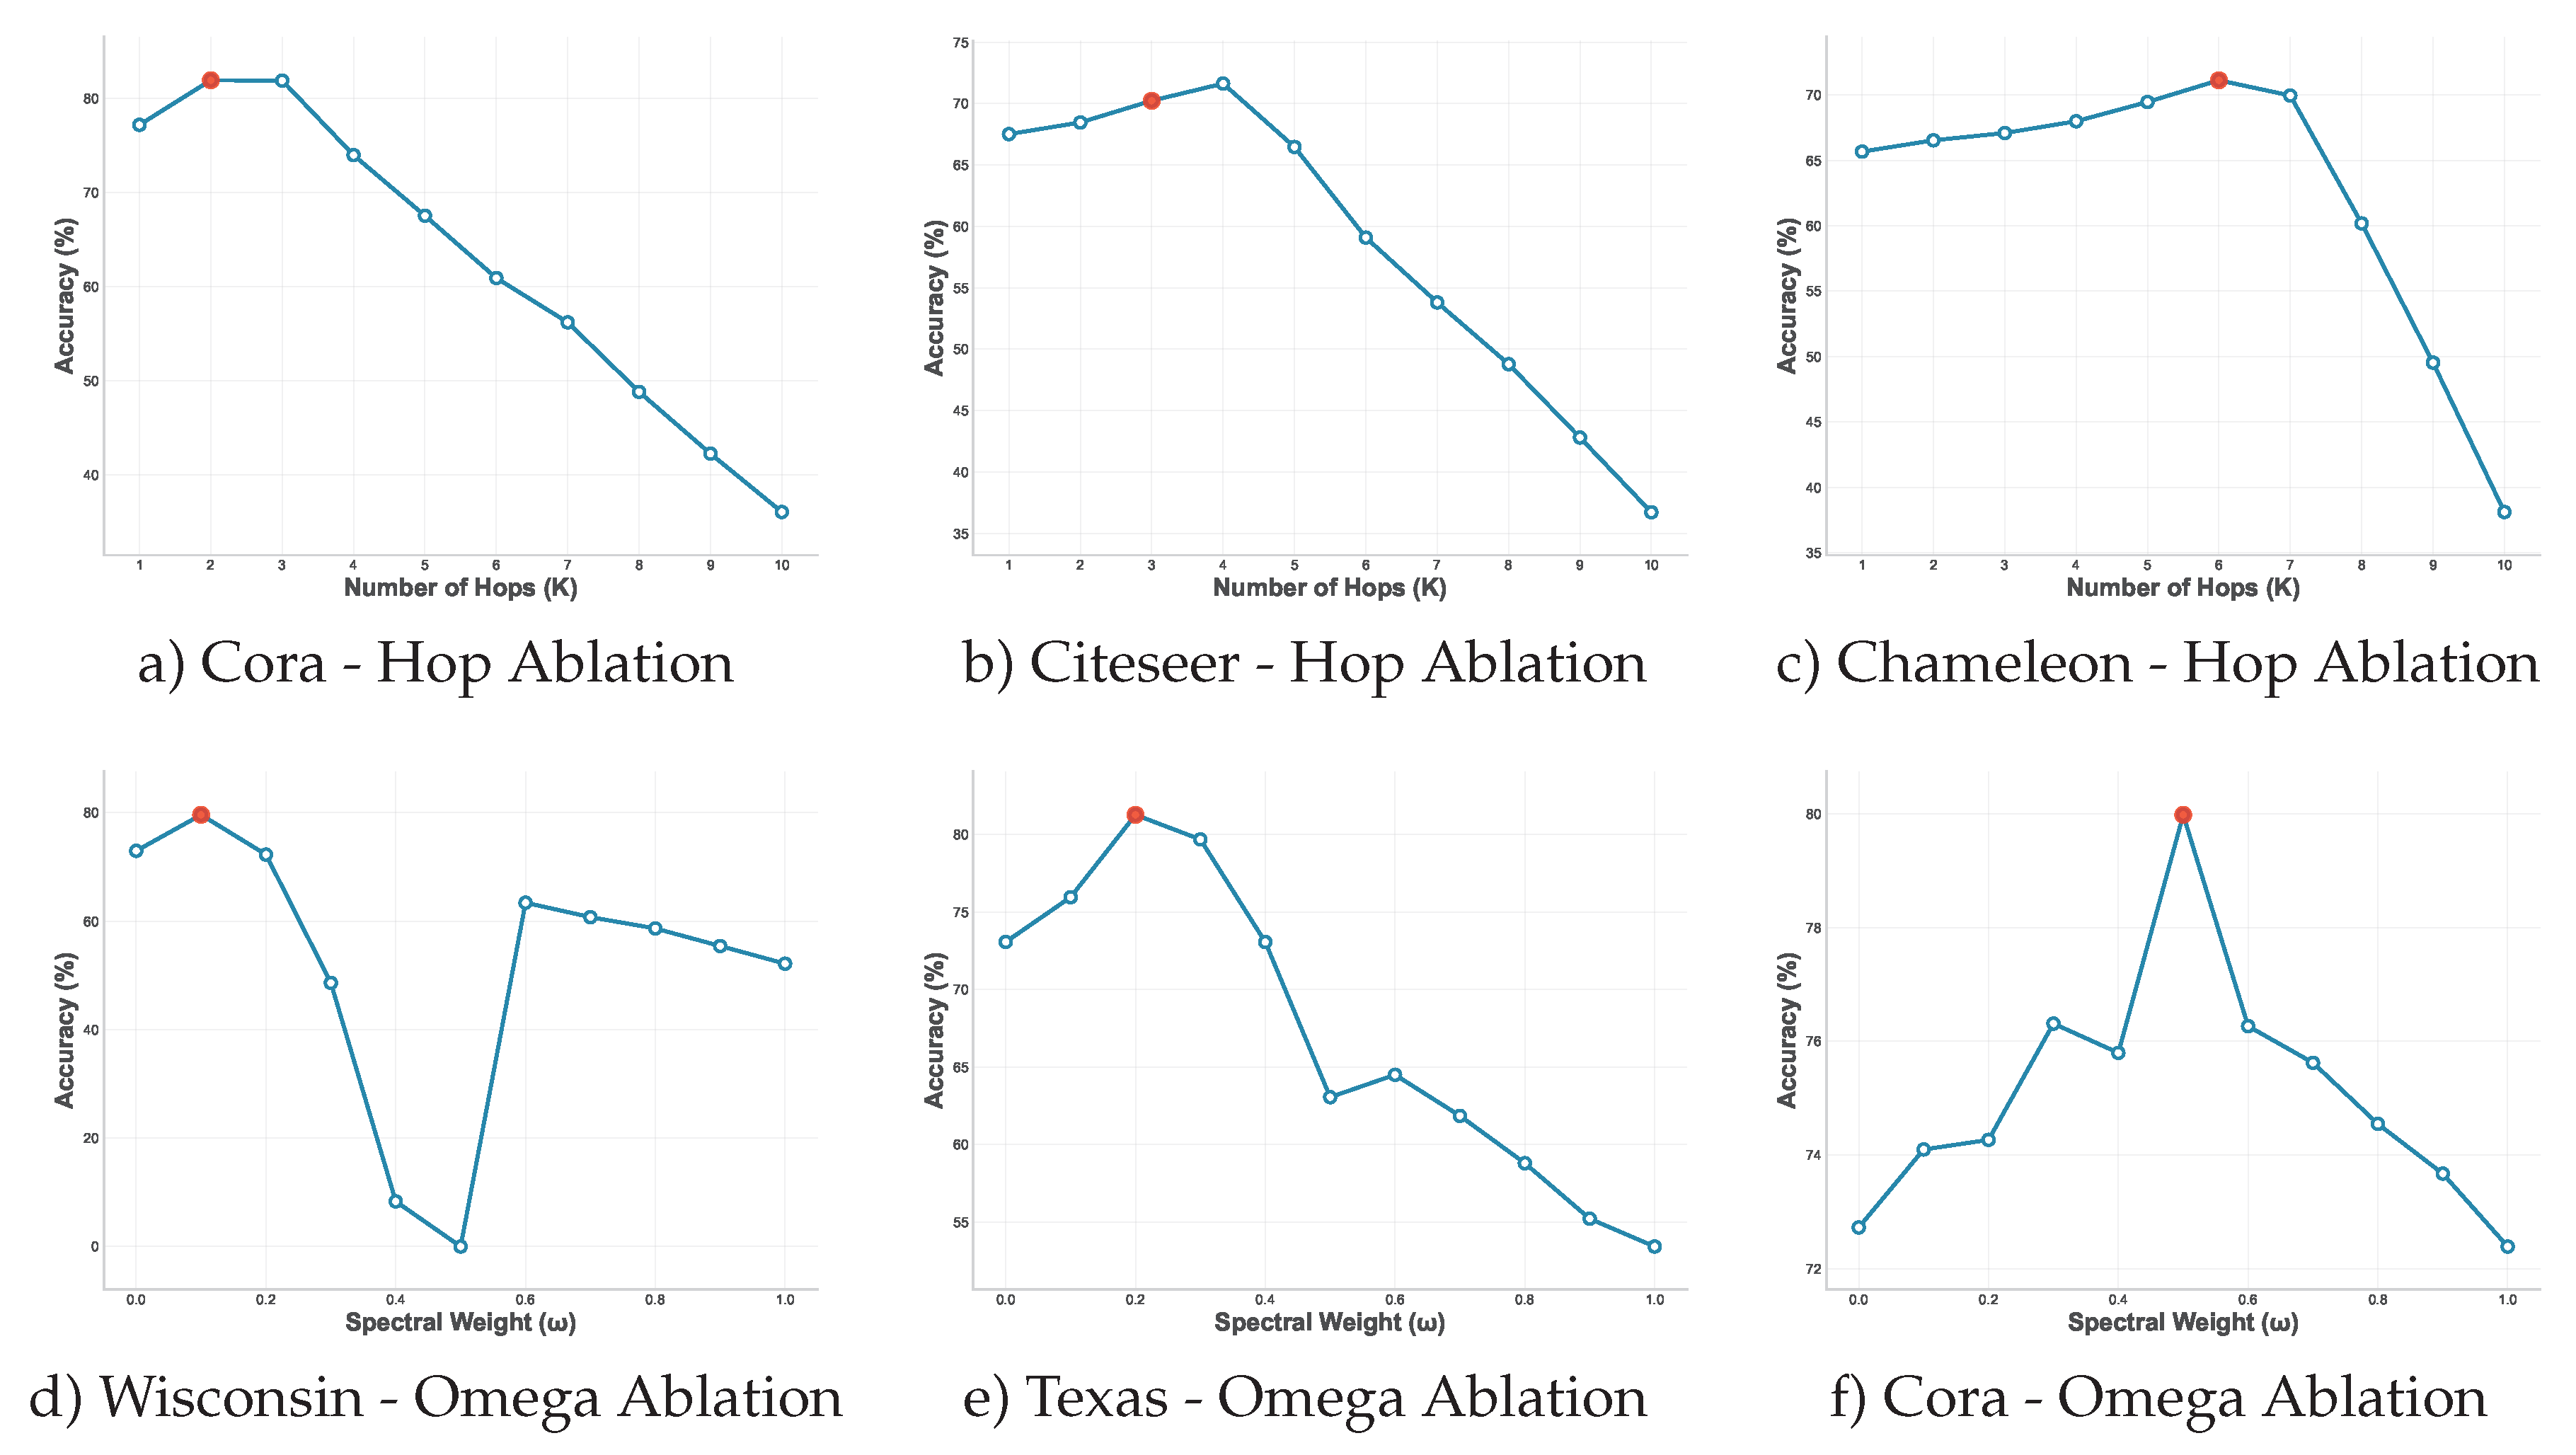
To validate our design choices and understand the contribution of different components, we conduct comprehensive ablation studies focusing on the two key hyperparameters: the number of hops K and the spectral weight . Figure 2 presents the results of these ablation experiments across representative datasets.
The impact of varying the number of hops K reveals distinct patterns based on graph characteristics. For homophilic graphs like Cora (Figure 2a)), optimal performance is achieved with K = 2, suggesting that information from immediate neighbors is most valuable when connectivity aligns with label similarity. Citeseer (Figure 2b)) benefits from slightly longer-range connections with optimal K = 3, while the heterophilic Chameleon dataset (Figure 2c)) requires K = 6 to capture meaningful patterns beyond immediate neighborhoods.
The sensitivity to the number of hops varies significantly between homophilic and heterophilic graphs. Homophilic datasets show relatively stable performance across different hop values, with gradual degradation as K increases beyond the optimal point. In contrast, heterophilic datasets exhibit sharper performance curves, with substantial improvements as K increases to the optimal value, followed by more pronounced degradation. This pattern confirms our hypothesis that heterophilic graphs require longer-range information to identify useful patterns, but are also more sensitive to noise from excessive hop distances.
The spectral weight parameter plays a crucial role in balancing structural and feature information, as demonstrated in the bottom row of Figure 2. The results strongly support our theoretical analysis regarding the relationship between graph homophily and optimal spectral weighting.
For homophilic datasets such as Cora (Figure 2f)), optimal performance occurs at , indicating that both structural and feature information contribute equally to effective edge weighting. The performance curve shows relatively smooth degradation as deviates from the optimal value, reflecting the robustness of homophilic graphs to different weighting schemes.
In stark contrast, heterophilic datasets including Texas (Figure 2e)) and Wisconsin (Figure 2d)) achieve optimal performance with low spectral weights ( to ), confirming that structural information becomes less reliable when neighboring nodes frequently have different labels. The performance degradation is particularly sharp for high values, with substantial accuracy drops when . This validates our key insight that heterophilic graphs benefit primarily from feature-based similarity, with structural information playing a supporting role.
The ablation studies reveal that optimal hyperparameter combinations vary systematically with graph properties. Heterophilic graphs require both longer-range connectivity (higher K) and reduced reliance on structural similarity (lower ), while homophilic graphs perform well with shorter-range connections and balanced similarity weighting. This pattern provides practical guidance for applying EDM-GNN to new datasets and validates the theoretical foundations of our approach.
5.4. Computational Analysis
We analyze the computational efficiency of EDM-GNN compared to baseline methods. The preprocessing phase, dominated by eigendecomposition, requires approximately 0.5-2 seconds for small to medium graphs (< 10,000 nodes), while training time per epoch remains comparable to standard GCN implementations. The multi-hop graph construction adds modest overhead, but the adaptive edge filtering ensures that memory requirements scale reasonably with graph size.
For larger graphs, the spectral preprocessing can be accelerated using approximate eigendecomposition methods or sampling strategies. Our experiments indicate that using 10-20 eigenvectors provides an effective balance between computational cost and performance benefits across different dataset sizes.
6. Conclusion and Future Work
In this paper, we introduced EDM-GNN, a novel approach that leverages spectral information to enhance MP in GNNs. Our method addresses fundamental limitations of existing GNNs by adaptively weighting edges based on both structural similarity, measured through eigenvector distances, and feature similarity.
The key insight of our work is the relationship between graph homophily and optimal spectral weighting. We demonstrate that heterophilic graphs benefit from reduced reliance on structural information (low values), while homophilic graphs achieve optimal performance with balanced integration (). This finding provides both theoretical understanding and practical guidance for applying GNNs across diverse graph topologies.
Experimental evaluation across nine benchmark datasets confirms the effectiveness of our approach. EDM-GNN achieves SOTA performance on most datasets, with particularly notable improvements on heterophilic graphs such as Texas (89.17% vs. 55.14% for GCN) and Wisconsin (87.91% vs. 51.76% for GCN). The comprehensive ablation studies reveal that heterophilic graphs require longer-range connectivity combined with reduced structural dependence, while homophilic graphs perform optimally with shorter-range connections and balanced similarity weighting.
Several directions remain for future investigation. The current approach relies on global eigendecomposition, which may become computationally expensive for very large graphs. Future work could explore localized spectral analysis or approximate eigendecomposition methods to improve scalability. Additionally, extending the framework to directed graphs, dynamic networks, and multi-relational scenarios could broaden its applicability.
The integration of edge features and the development of automatic hyperparameter selection strategies represent other promising directions. Furthermore, deeper theoretical analysis of why eigenvector distances provide effective structural similarity measures could strengthen the foundation of spectral approaches in GNNs.
EDM-GNN represents a significant step toward more adaptive and theoretically grounded GNNs. By leveraging spectral information for adaptive edge weighting, our approach provides a unified solution that excels across diverse graph topologies while offering interpretable insights into the relationship between graph characteristics and optimal learning strategies.
Author Contributions
Conceptualization, F.E.; Methodology, F.E. and A.B.; Software, A.B. and M.Á.L.; Validation, A.B., F.E., and M.Á.L.; Formal analysis, F.E.; Investigation, A.B. and F.E.; Resources, M.Á.L.; Data curation, A.B.; Writing—original draft, A.B.; Writing—review & editing, F.E. and M.Á.L.; Visualization, A.B.; Supervision, F.E. and M.Á.L.; Project administration, F.E.; Funding acquisition, F.E. All authors have read and agreed to the published version of the manuscript.
Funding
The authors are funded by the project PID2022-142516OB-I00 of the Spanish government.
Institutional Review Board Statement
Not applicable.
Informed Consent Statement
Not applicable.
Data Availability Statement
The raw data supporting the conclusions of this article will be made available by the authors on request.
Acknowledgments
The authors are indebted to Edwin R. Hancock from the University of York, who recently passed away.
Conflicts of Interest
The authors declare no conflicts of interest. The funders had no role in the design of the study; in the collection, analyses, or interpretation of the data; in the writing of the manuscript; or in the decision to publish the results
Abbreviations
The following abbreviations are used in this manuscript:
| EDM-GNN | Eigenvector Distance-Modulated Graph Neural Network |
| SOTA | State-of-the-art |
| MP | Message passing |
| GNN | Graph Neural Network |
| GCN | Graph Convolutional Network |
| GAT | Graph Attention Network |
| MLP | Multi-Layer Perceptron |
| Geom-GCN | Geometric Graph Convolutional Network |
| MixHop | Higher-order Graph Convolutional Architectures |
| GraphSAGE | Graph Sample and Aggregate |
References
- Hamilton, W.L.; Ying, Z.; Leskovec, J. Inductive Representation Learning on Large Graphs. In Proceedings of the Advances in Neural Information Processing Systems 30: Annual Conference on Neural Information Processing Systems 2017, 2017, pp. 1024–1034.
- Gilmer, J.; Schoenholz, S.S.; Riley, P.F.; Vinyals, O.; Dahl, G.E. Neural Message Passing for Quantum Chemistry. Paper presented at ICML 2017, 6–11 August 2017.
- Sharma, K.; Lee, Y.C.; Nambi, S.; Salian, A.; Shah, S.; Kim, S.W.; Kumar, S. A Survey of Graph Neural Networks for Social Recommender Systems. ACM Computing Surveys 2024, 56, 1–34. [Google Scholar] [CrossRef]
- Luan, S.; Hua, C.; Lu, Q.; Zhu, J.; Zhao, M.; Zhang, S.; Chang, X.; Precup, D. Revisiting Heterophily For Graph Neural Networks. In Proceedings of the Advances in Neural Information Processing Systems 35: Annual Conference on Neural Information Processing Systems 2022, NeurIPS 2022, New Orleans, LA, USA, November 28 - December 9, 2022; Koyejo, S.; Mohamed, S.; Agarwal, A.; Belgrave, D.; Cho, K.; Oh, A., Eds., 2022.
- Scarselli, F.; Gori, M.; Tsoi, A.C.; Hagenbuchner, M.; Monfardini, G. The Graph Neural Network Model. IEEE Transactions on Neural Networks 2009, 20, 61–80. [Google Scholar] [CrossRef] [PubMed]
- Kipf, T.N.; Welling, M. Semi-Supervised Classification with Graph Convolutional Networks. Paper presented at ICLR 2017, Toulon, France, 24–26 April 2017.
- Zhu, J.; Yan, Y.; Zhao, L.; Heimann, M.; Akoglu, L.; Koutra, D. Generalizing Graph Neural Networks Beyond Homophily. CoRR 2020, abs/2006.11468, [2006.11468].
- Abu-El-Haija, S.; Perozzi, B.; Kapoor, A.; Alipourfard, N.; Lerman, K.; Harutyunyan, H.; Steeg, G.V.; Galstyan, A. MixHop: Higher-Order Graph Convolutional Architectures via Sparsified Neighborhood Mixing. In Proceedings of the Proceedings of the 36th International Conference on Machine Learning, ICML. PMLR, 2019, Vol. 97, Proceedings of Machine Learning Research, pp. 21–29.
- Chien, E.; Peng, J.; Li, P.; Milenkovic, O. Joint Adaptive Feature Smoothing and Topology Extraction via Generalized PageRank GNNs. CoRR 2020, abs/2006.07988, [2006.07988].
- Begga, A.; Escolano, F.; Lozano, M.A. Node classification in the heterophilic regime via diffusion-jump GNNs. Neural Networks 2025, 181, 106830. [Google Scholar] [CrossRef] [PubMed]
- Chung, F. Spectral Graph Theory; American Mathematical Society: Providence, 1997. [Google Scholar]
- von Luxburg, U. A tutorial on spectral clustering. Stat. Comput. 2007, 17, 395–416. [Google Scholar] [CrossRef]
- Bo, D.; Wang, X.; Liu, Y.; Fang, Y.; Li, Y.; Shi, C. A Survey on Spectral Graph Neural Networks. CoRR 2023, abs/2302.05631, [2302.05631]. [CrossRef]
- Wang, X.; Zhang, M. How Powerful are Spectral Graph Neural Networks. In Proceedings of the International Conference on Machine Learning, ICML 2022, 17-23 July 2022, Baltimore, Maryland, USA; Chaudhuri, K.; Jegelka, S.; Song, L.; Szepesvári, C.; Niu, G.; Sabato, S., Eds. PMLR, 2022, Vol. 162, Proceedings of Machine Learning Research, pp. 23341–23362.
- Veličković, P.; Cucurull, G.; Casanova, A.; Romero, A.; Liò, P.; Bengio, Y. Graph Attention Networks. International Conference on Learning Representations 2018.
- Zhang, M.; Cui, Z.; Neumann, M.; Chen, Y. An End-to-End Deep Learning Architecture for Graph Classification. In Proceedings of the Proceedings of the Thirty-Second AAAI Conference on Artificial Intelligence. AAAI Press, 2018, pp. 4438–4445. [CrossRef]
- Xu, K.; Hu, W.; Leskovec, J.; Jegelka, S. How Powerful are Graph Neural Networks? In Proceedings of the 7th International Conference on Learning Representations, ICLR 2019. OpenReview.net, 2019.
- Pei, H.; Wei, B.; Chang, K.C.; Lei, Y.; Yang, B. Geom-GCN: Geometric Graph Convolutional Networks. CoRR 2020, abs/2002.05287s, [2002.05287].
- Feng, J.; Chen, Y.; Li, F.; Sarkar, A.; Zhang, M. How Powerful are K-hop Message Passing Graph Neural Networks. In Proceedings of the Advances in Neural Information Processing Systems 35: Annual Conference on Neural Information Processing Systems 2022, NeurIPS 2022, 2022.
- Bo, D.; Wang, X.; Shi, C.; Shen, H. Beyond Low-frequency Information in Graph Convolutional Networks. In Proceedings of the AAAI 2021,February 2-9, 2021. AAAI Press, 2021, pp. 3950–3957. [CrossRef]
- Defferrard, M.; Bresson, X.; Vandergheynst, P. Convolutional neural networks on graphs with fast localized spectral filtering. In Proceedings of the Proceedings of the 30th International Conference on Neural Information Processing Systems, Red Hook, NY, USA, 2016; NIPS’16, p. 3844–3852.
- Gutiérrez, C.; Gancio, J.; Cabeza, C.; Rubido, N. Finding the resistance distance and eigenvector centrality from the network’s eigenvalues. Physica A: Statistical Mechanics and its Applications 2021, 569, 125751. [Google Scholar] [CrossRef]
- Xiao, S.; Wang, S.; Dai, Y.; Guo, W. Graph neural networks in node classification: survey and evaluation. Mach. Vis. Appl. 2022, 33, 4. [Google Scholar] [CrossRef]
- Yan, Y.; Hashemi, M.; Swersky, K.; Yang, Y.; Koutra, D. Two Sides of the Same Coin: Heterophily and Oversmoothing in Graph Convolutional Neural Networks. In Proceedings of the 2022 IEEE International Conference on Data Mining (ICDM), 2022, pp. 1287–1292. [CrossRef]
- Biggs, N. Algebraic graph theory; Number 67, Cambridge university press, 1993.
- Li, Q.; Han, Z.; Wu, X. Deeper Insights into Graph Convolutional Networks for Semi-Supervised Learning. CoRR 2018, abs/1801.07606, [1801.07606].
- Fey, M.; Lenssen, J.E. Fast Graph Representation Learning with PyTorch Geometric. In Proceedings of the ICLR Workshop on Representation Learning on Graphs and Manifolds, 2019.
Figure 1.
Architecture overview of the proposed EDM-GNN framework. The input graph undergoes multi-order transformation to create different hop neighborhoods. Each hop level is processed by dedicated GNN modules (, , ) where represent trainable parameters. The edges exhibit varying resistance-like properties based on eigenvector distance-modulated weights (shown as different line styles and colors), controlling the amount of information flow and relevance assigned to each connection. The resulting embeddings are combined through learnable attention weights and passed to an MLP for final classification.
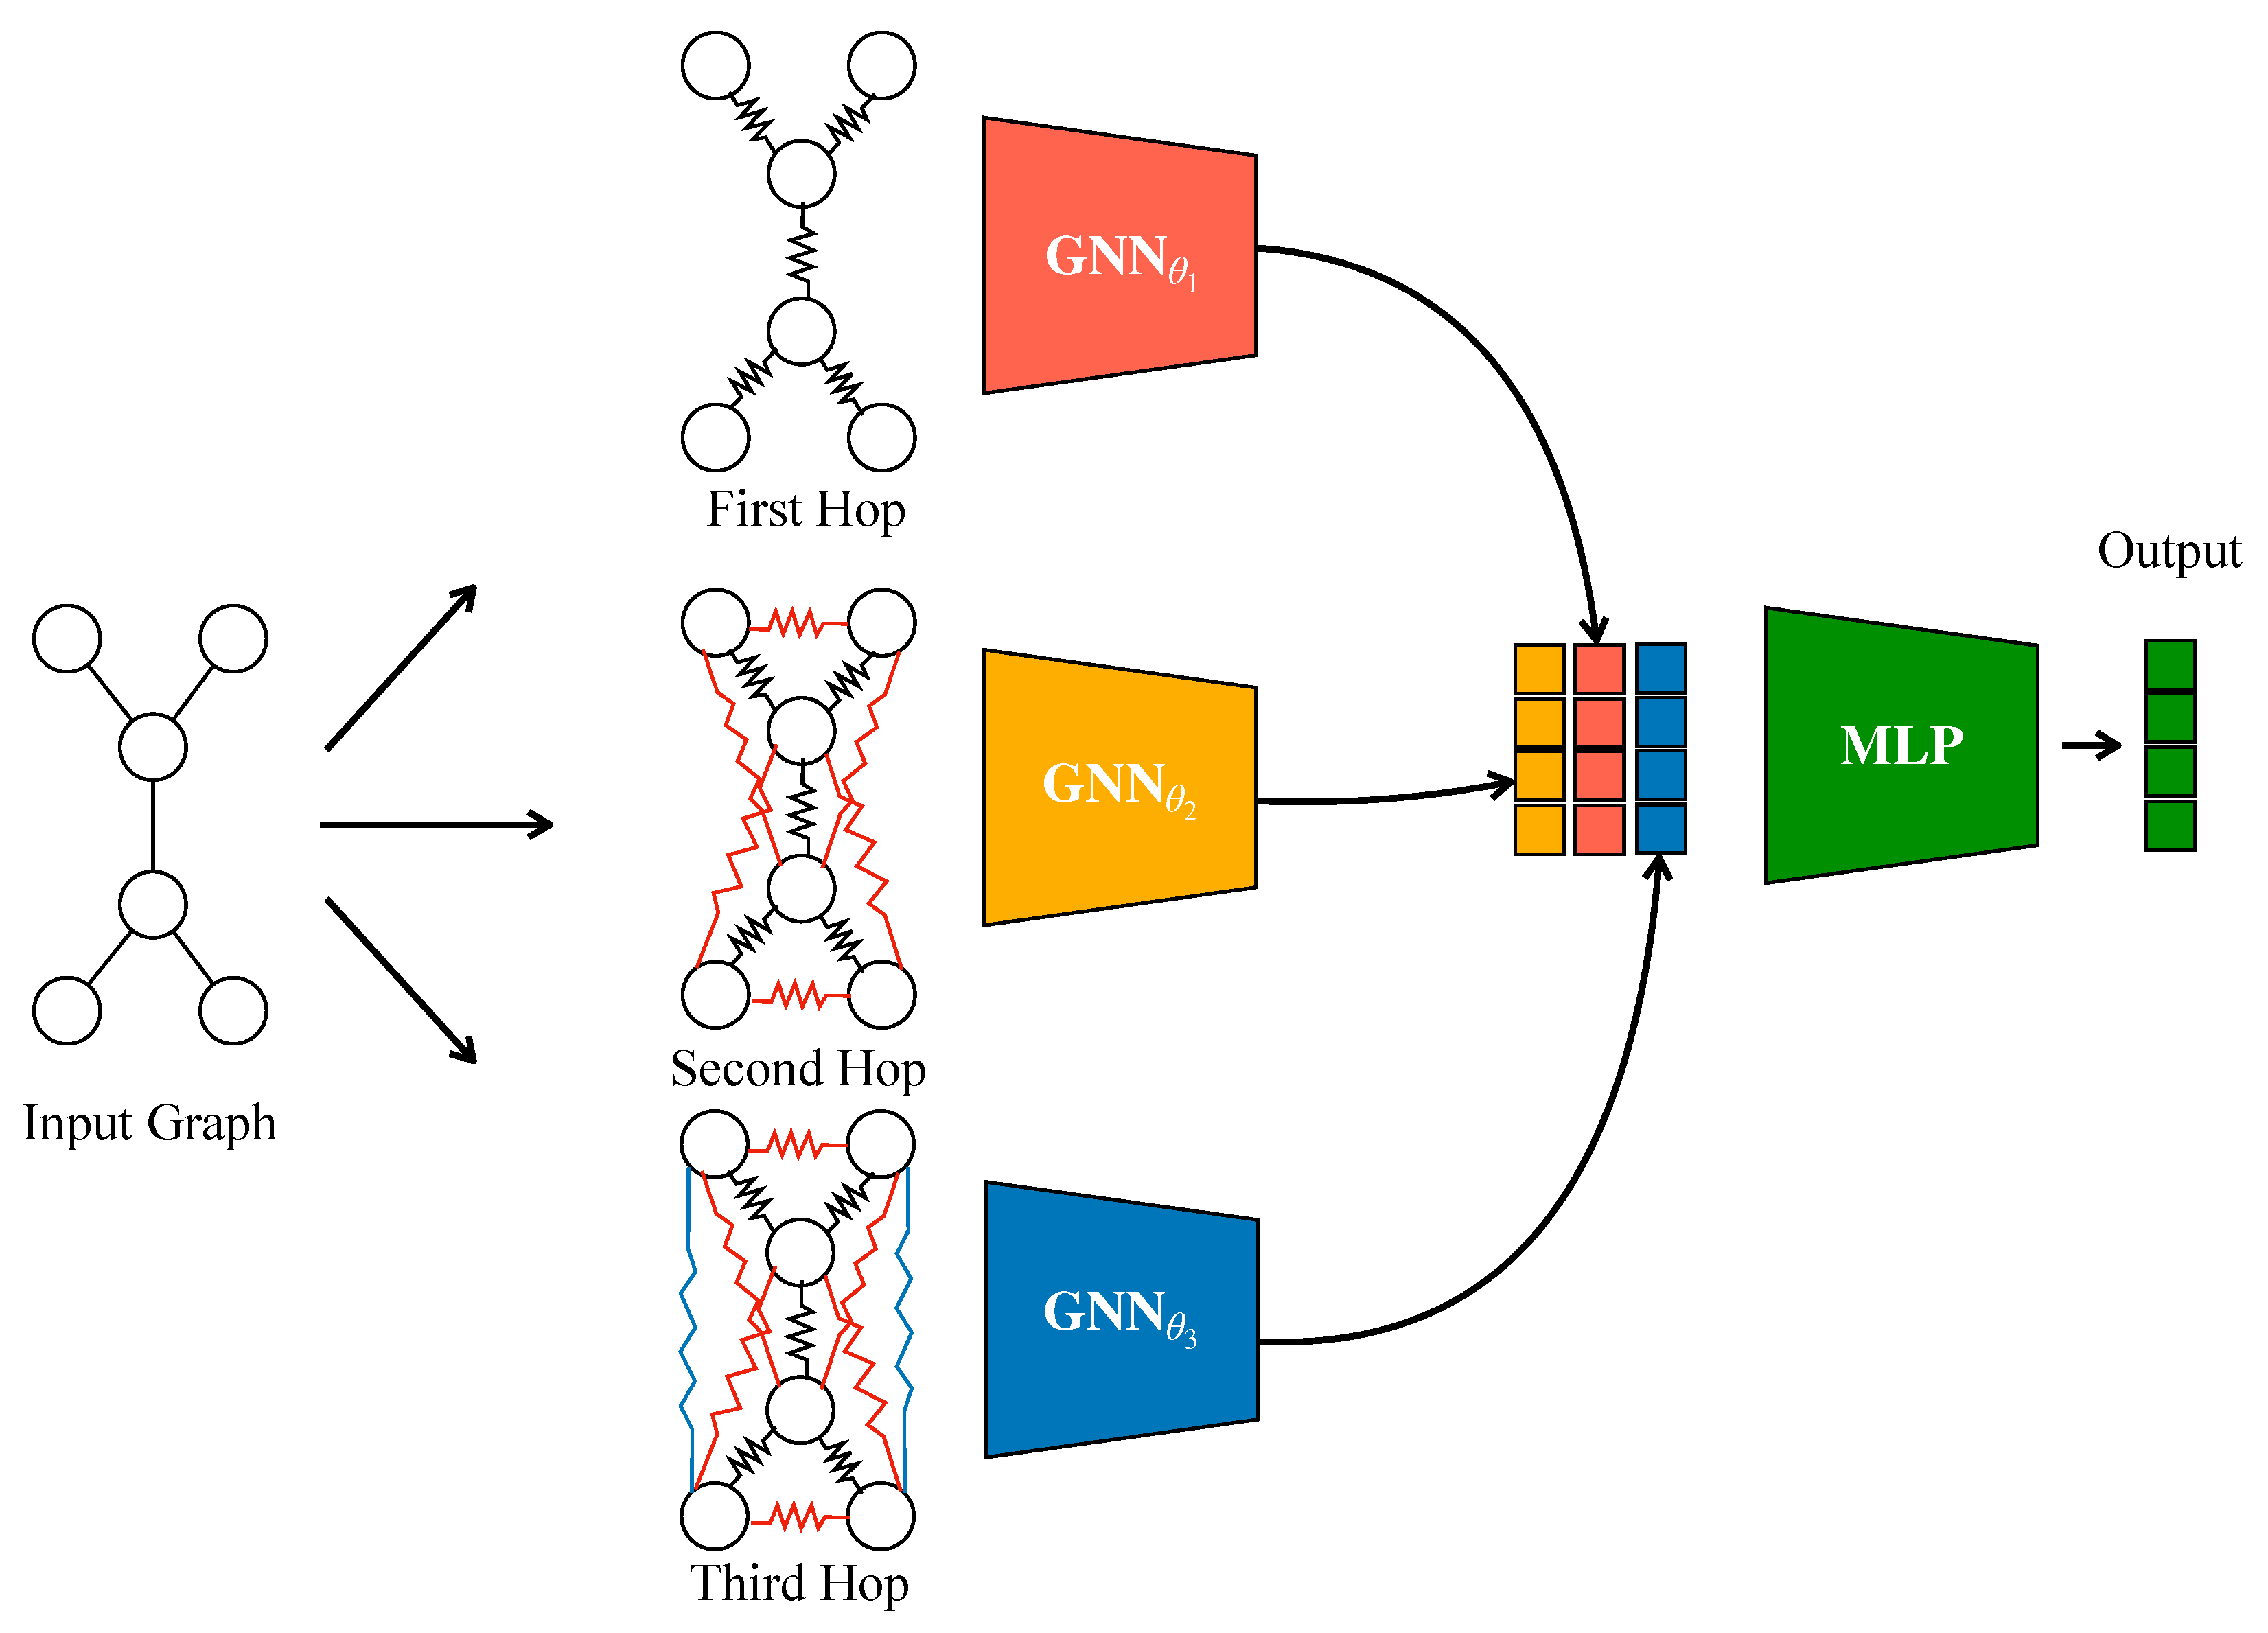
Figure 2.
Ablation studies examining the impact of number of hops K (top row) and spectral weight (bottom row) across representative datasets. The red points indicate optimal hyperparameter values for each dataset.
Figure 2.
Ablation studies examining the impact of number of hops K (top row) and spectral weight (bottom row) across representative datasets. The red points indicate optimal hyperparameter values for each dataset.
| a) Cora - Hop Ablation | b) Citeseer - Hop Ablation | c) Chameleon - Hop Ablation |
| d) Wisconsin - Omega Ablation | e) Texas - Omega Ablation | f) Cora - Omega Ablation |

Table 1.
General information about the datasets.
| Dataset | Texas | Wisconsin | Cornell | Actor | Squirrel | Chameleon | Citeseer | Pubmed | Cora |
|---|---|---|---|---|---|---|---|---|---|
| Hom level | 0.11 | 0.21 | 0.30 | 0.22 | 0.22 | 0.23 | 0.74 | 0.80 | 0.81 |
| # Nodes | 183 | 251 | 183 | 7,600 | 5,201 | 2,277 | 3,327 | 19,717 | 2,708 |
| # Edges | 295 | 466 | 280 | 26,752 | 198,493 | 31,421 | 4,676 | 44,324 | 5,278 |
| # Classes | 5 | 5 | 5 | 5 | 5 | 5 | 7 | 3 | 6 |
Table 2.
Node-classification accuracies on all datasets. Top two models are highlighted: First, Second.
Table 2.
Node-classification accuracies on all datasets. Top two models are highlighted: First, Second.
| Texas | Wisconsin | Cornell | Actor | Squirrel | Chameleon | Citeseer | Pubmed | Cora | |
|---|---|---|---|---|---|---|---|---|---|
| MLP | |||||||||
| GCN | |||||||||
| GAT | |||||||||
| GraphSAGE | |||||||||
| H2GCN | |||||||||
| Geom-GCN | |||||||||
| LINKX | |||||||||
| GGCN | |||||||||
| CGNN | |||||||||
| MixHop | |||||||||
| FSGNN | |||||||||
| GPRGNN | |||||||||
| EDM-GNN |
Disclaimer/Publisher’s Note: The statements, opinions and data contained in all publications are solely those of the individual author(s) and contributor(s) and not of MDPI and/or the editor(s). MDPI and/or the editor(s) disclaim responsibility for any injury to people or property resulting from any ideas, methods, instructions or products referred to in the content. |
© 2025 by the authors. Licensee MDPI, Basel, Switzerland. This article is an open access article distributed under the terms and conditions of the Creative Commons Attribution (CC BY) license (http://creativecommons.org/licenses/by/4.0/).
Copyright: This open access article is published under a Creative Commons CC BY 4.0 license, which permit the free download, distribution, and reuse, provided that the author and preprint are cited in any reuse.


