
Submitted:
31 July 2025
Posted:
01 August 2025
You are already at the latest version
Abstract
The rubber industry is evolving by incorporating innovative tools to improve production processes. A proper manufacturing process determines the behavior and service life of the resulting products. In this research, molecular dynamics simulations were used to study the effect of temperature in the cured structure on the resulting mechanical properties of EPDM. The results of the simulations at different temperatures of the crosslinked EPDM were then compared in terms of the radius of gyration, free volume, root mean square displacement, stress curves, viscosity, and gel point. Then, using the superposition principle, viscosity and tensile stress were evaluated. The molecular dynamics superposition results could reasonably predict the mechanical behavior of EPDM during and after the injection process. The results provide new insights into the molecular level crosslinking mechanisms of amorphous polymers and their influence on mechanical behavior, which facilitates the design of the injection process for rubber component applications. The results show an increase in viscosity and a decrease in the critical gel point with increasing temperature. The hardness tests performed on an automotive component demonstrate that this has an impact on the resulting properties.
Keywords:
EPDM
; crosslinking mechanisms
; molecular dynamics simulations
1. Introduction
Elastomers are widely used in industry for their properties, which include elasticity and durability. Synthetic rubber components are essential for sealing systems. Ethylene-propylene-diene monomer (EPDM) rubber is chemically stable; this type of elastomeric polymer is highly resilient and resistant to chemical agents. The fatigue strength, and therefore the service life, of EPDM components is affected by the temperature conditions and the number of load cycles [1,2,3].
The industry is undergoing a revolution (Industry 4.0) driven by the need to rapidly develop products that integrate automated, efficient, and sustainable technologies. In recent years, the rubber component manufacturing industry has implemented sustainability and carbon footprint reduction policies; to achieve these goals, sustainable practices have been implemented in design and manufacturing, using virtual prototyping testing to develop high-quality, environmentally friendly products [4,5,6].
The validity of the numerical simulations implemented depends on the accuracy of the correlation between the results obtained and the mechanical properties of the rubber material. Numerous theoretical models have been developed in an attempt to describe the mechanical behavior of rubber. The molecular structure of elastomers enables these materials to sustain large elastic deformations under tensile loading, exhibiting characteristic nonlinear stress-strain behaviour. The effect of cross-linking and temperature during the curing process is considered one of the main challenges when studying the complex mechanical behavior of cross-linked rubbery materials [7,8].
Different theories have been proposed to understand the influence of temperature on the cross-linking and viscoelastic relationship, ranging from chain breaking in the amorphous structure to the sliding of molecules to the formation of more complex composite structures. Most experimental techniques have to infer molecular mechanisms from measurements. Theoretical tools, including molecular information, could complement these interpretations. Trying to understand the stability of molecular structures at an atomistic level is something that theoretical and experimental scientists are working on. The intention is to develop models capable of reproducing experimental observations from molecular dynamics simulation results. Advances in computing power have made it possible to develop simulation models that come closer and closer to reality and help to understand what is happening at the molecular level [9].
For the cross-linking process during curing, because of the degree of complexity, it is evident that no existing model can accurately and effectively capture the dependence of cross-link density and temperature on the characteristic viscoelastic behavior of an elastomer in a thermodynamically consistent and numerically robust manner due to the strong non-linearity [10].
Cross-link density is an important parameter affecting the mechanical properties of rubbery materials. Viscoelastic properties change significantly with increasing cross-linking concentration. The temperature gradient during vulcanization influences the density and distribution of the cross-links and, therefore, the mechanical properties that result from the curing process [11].
The viscoelasticity of cross-linked polymers depends on the morphology and length of the chains. Therefore, it is important to determine the dynamics of the system. Theoretically, in the amorphous structure, the dynamics are locally constrained by cross-linking and entanglement of the chains. The configurational freedom of mobility is influenced by friction and intermolecular coordination [12]. The viscoelasticity of rubber is directly related to the formation of chemical and physical cross-links during the curing process, where chain length, cross-link density, and entanglements define the dynamics and stored elastic entropy [13].
Several studies have been conducted using molecular dynamics simulations of polymer properties to investigate the kinetic properties of EPDM in terms of free volume and cross-link density. The cross-link density is an important parameter influencing mechanical behavior. The viscoelasticity parameters are related to intrinsic material properties such as network structures and intermolecular forces [14].
Molecular dynamics simulation is a computational tool that allows us to analyze the behavior or evolution of a system over time. This technique provides a robust method for the generation of non-equilibrium ensembles and the analysis of dynamical events at atomistic scales by generating the trajectories of a system composed of N particles, resolved for very short times, with specifications of an interatomic interaction potential, initial and boundary conditions [15].
Wang Y. et al. [16], utilized molecular dynamics simulations to envision that the cross-linking produced in the side chains influences the stiffness and enhances the inhibitory effect on the diffusion properties. These results provide a better understanding of the microscopic aspects underlying the mechanical behavior of EPDM. While Wang Ao et al. [17] use time-temperature superposition and varying strain rates in molecular dynamics simulations, the data obtained allow modeling of the rheological properties of EPDM.
A significant advance in the modeling of cross-linked polymers emerged with the development of the multistep methodology; Varshey et al. [18] simulated the cross-linking reaction by proposing a step-by-step method by constantly increasing the cut-off reaction radius in a relatively large cross-linked model. In general, to simulate the EPDM cross-linking process by implementing some step-by-step or multistep algorithm, the cut-off reaction radius should be modified periodically, as this is the key to simulate the EPDM cross-linking process, the most prominent works in this regard, to mention a few are: Papanikolaou et al., Wang et al. and van Duin et al. [16,19,20].
This research approaches the study of the conformation of a cross-linked polymeric system, considering the cross-link density in the amorphous structure of EPDM through molecular dynamics modeling. The methodology proposed in this work considers the dynamics of the polymeric chains in the amorphous structure for the viscoelastic characterization of EPDM using trajectory analysis.
2. Materials and Methods
2.1. Topology of the System Subsection
The molecular dynamics (MD) simulations assume a non-overlapping configuration of all the chains of the amorphous EPDM polymer. The procedure to define the topology of the system was to generate the repeating unit (monomer) and then build the polymer chain with the monomers (Figure 1(a)). The resulting topology was optimized (pre-equilibrium) in 10,000 steps at each stage. The simulation box consists of 10 chains with 500 monomers each, randomly distributed (Figure 1(b)). Three-dimensional periodic boundary conditions are applied to eliminate surface effects.
2.2. Interatomic potential parameterization
The interatomic potential implemented in this research was calculated using the condensed phase optimized molecular potentials for atomistic simulation studies (COMPASS). The COMPASS force field uses a simplified model of the Coulomb and van der Waals force interactions [21,22]. The van der Waals interactions keep atoms of opposite charge at a certain distance from each other. The summation methods for the electrostatic (Coulomb) and van der Waals interactions have been calculated using the atom-based and Ewald algorithms, respectively [21,23].
The interaction potential function governing a system of polymer chains incorporates parameters associated with valence terms that represent internal bond coordinates (), angle (), torsion angle (), and out-of-plane angle (). The vibrational frequencies and the structural variations associated with the changes in their conformation are related to each other in terms of cross-coupling. These terms include combinations of two or three internal coordinates considering the bond angle potential (), the in-plane dihedral rotation potential (), the out-of-plane vibrational potential (), and the cross term (). Non-bonding interactions are described by Lennard-Jones 9-6 potential for the van der Walls term () and a Coulomb function for an electrostatic interaction (). The functional terms in COMPASS are given by the equation ( 1).
where is the total potential energy of the system, is the potential energy due to intermolecular forces, is the Coulomb electrostatic potential, is the bond angle potential, is the dihedral rotation potential within the molecule, is the off-plane vibrational potential, and the is the cross term.
The potential energy due to the intermolecular forces can be calculated by the equation ( 2);
where the subscripts in the summations represent the potential energy interactions, represents the potential energy parameter; represents the finite distance when the potential energy between molecules becomes zero; denotes cut-off distance between atoms and .
is the Coulomb electrostatic potential can be expressed by below Eq. ( 3)
and are the fixed partial charges between atom and within the same molecule.
In the next equation ( 4), where ; is the bond angle potential, represents the energy associated with the angle, and the value represents equilibrium, and , , , are force constants.
The intermolecular dihedral rotation potential is defined by the next equation ( 5), where represent the torsional angle.
The out-of-plane vibrational potential is represented by the equation ( 6), where Wilson out-of-plane internal coordinates;
Equation (7) , includes the cross-coupling terms to calculate the vibrational frequencies and structural variations associated with conformational changes.
2.3. Cross-Linking Characteristics
The chemical cross-linking process of EPDM is explained by taking reference in the investigations of Wang et al. [16,23] to model the process with a third 5-ethylidene-2-norbornene (ENB) monomer, van Duin et al. [20] and Papanikolaou et al. [19] showed that peroxide free radicals capture mainly the tertiary hydrogen (C2x) of the main chain and the hydrogens at the C3 and C9 positions of ENB, similar to Papanikolaou et al. The positions are shown schematically in Figure 2(a). In EPDM, the main-chain-to-side-chain ratio is approximately 9:1. Zachary et al. [24] demonstrated that the monomer reaction rates were highly selective, with C3 exhibiting 90% reactivity compared to just 10% for C9. Cross-linking predominantly occurs between the C2x carbon of the main chain and the C3 carbon of side chains. Chemical cross-linking with the C9 atom was omitted because its reaction rate is quite low compared to the previous ones.
Physical cross-linking also occurs through weak interactions. These interactions are due to electrostatic interactions and van Der Waals forces, which influence the gelation of the polymer. Physical cross-linking in elastomers largely determines the mechanical properties of the elastomer and confers stability to the material. Figure 2(b) shows physical cross-linking.
2.4. Procedure for Molecular Dynamics Simulation
Equilibration protocols are not fully standardized; there is no general methodology for equilibrating MD systems, but there are guidelines to follow. In this study, the proposed methodology consists of equilibrating the system into two stages with four frames (replicas) where each frame’s topology is individually optimized during pre-equilibration (Figure 3).
The simulation box employs three-dimensional periodic boundary conditions to mitigate surface effects on dynamic cross-linking.
The motion equations were solved with the algorithm of Verlet velocity, and the integration time interval was set at 1 fs, in all cases, for smaller time steps tested, no significant difference in the properties of interest was found [21]. The initial velocities were designated randomly from the Boltzmann distribution [25,26]. The simulation temperatures were set in the range of 428 to 478 K with increments of 10; control was carried out using the Andersen method [27]. The shape change was obtained by applying a linear change to the positions of the atoms.
The generated frames are equilibrated by varying the conditions to bring them to a stable energy state, defining scenarios with variables such as energy, pressure, volume, and temperature.
In the first equilibrium step, simulated annealing is performed with a constant energy and volume NVE assembly in a temperature range of 350 to 500 K with 100 cycles and 10 ramps per cycle, time step 1 fs, with 200,000 steps.
In the second step, the system was relaxed at constant volume and temperature controlled with the NVT assembly, using the Andersen thermostat. On the obtained trajectories, to equilibrate the pressure variation, simulations were performed with the NPT assembly (100 MPa) to equilibrate the size of the simulation box and to obtain the correct system density for production, both simulations with 20 ns with a time step of 1 fs, the process was repeated in the temperature range from 428 K to 478 K with 10 K steps.
2.5. Cross-Linking Procedure
The methodology for modeling the cross-links is based on the work of Papanikolaou et al. and adopted by Wang Y et al. [16,19]. The simulation was based on calculating all cross-links and the distances between the reactive atoms within a preset cut-off range between 0.4 nm and 1 nm and a cross-linking limit of 90%. The cross-linking kinetics were formulated as random and periodic, creating covalent terms for cross-linking. New bonds are activated by alternating equilibrium distances and force coefficients to avoid missing atoms in the simulation box. The lower boundary distance increases by 0.025 nm at each iteration and the distance between the reactive atoms is checked. This process continues until the reactive pairs are exhausted within the predetermined cut-off distance and the cross-linking limit is reached.
After the initial models were sufficiently equilibrated to simulate the EPDM curing process, a stepwise algorithm or multi-step subroutine was implemented to simulate the EPDM curing process described in the previous paragraph as follows (illustrated in Figure 4): Step 1: All distances between reactive atoms are calculated, and cross-links are created between pairs that are within a predetermined cut-off distance. Step 2: The covalent terms of the formed bonds were continuously created, and the hydrogen atoms were removed from the newly formed pairs. Step 3: The new bonds were progressively activated by alternating bond equilibrium distances and force coefficients to avoid missing atoms in the simulation box due to large atomic forces. Step 4: Next, an NPT simulation was performed, and the simulation box was further equilibrated before the distances between the reactive atoms were checked again. Step 5: The procedure continues until the reactive pairs are exhausted within the pre-assigned cut-off distance, and the cross-linking limit is reached.
3. Results
3.1. Mean Square Displacement (MSD)
The mean square displacement (MSD) is the parameter associated with the diffusion or mobility of molecules and is related to the viscosity and relaxation of the polymer. To compare the kinetic properties of EPDM composed of different cross-link densities, the MSD of the particles is calculated during the MD simulation.
where and are the positions of particle at the initial time and time , respectively; the angle brackets ⟨...⟩ indicate the average over all possible.
At the molecular level, vulcanization is characterized by chain cross-linking and polymer entanglement, resulting in significant mechanical property changes observed macroscopically as gel point transitions. At higher temperatures, the polymer network becomes saturated with cross-links. This affects the resulting viscoelastic properties of the elastomer. Analysis of the Mean Square Displacement (MSD) trajectories shows a clear trend of decreasing movement of the EPDM molecules with increasing temperature. However, this is due to the combined effect of two key factors: the restrictions on chain movement due to cross-linking and the strong interactions at the bond interface.
The increase in cross-linking, as well as the appearance of electrostatic interaction forces, and the longer chains begin to intertwine with each other, leading to the rigidity of the network, which constrains it geometrically, in Figure 5(a); this can be seen in the mean square displacement (MSD) trajectories, as the slope changes, the movement (diffusion) of the polymer chains is constricted. The confinement (Figure 5(b)) results in the coexistence of a cross-linked amorphous structure that forms a gel phase. The formation of cross-links is associated with the system’s rigidity, manifested by a progressive increase in viscosity.
3.2. Radius of Gyration (Rg)
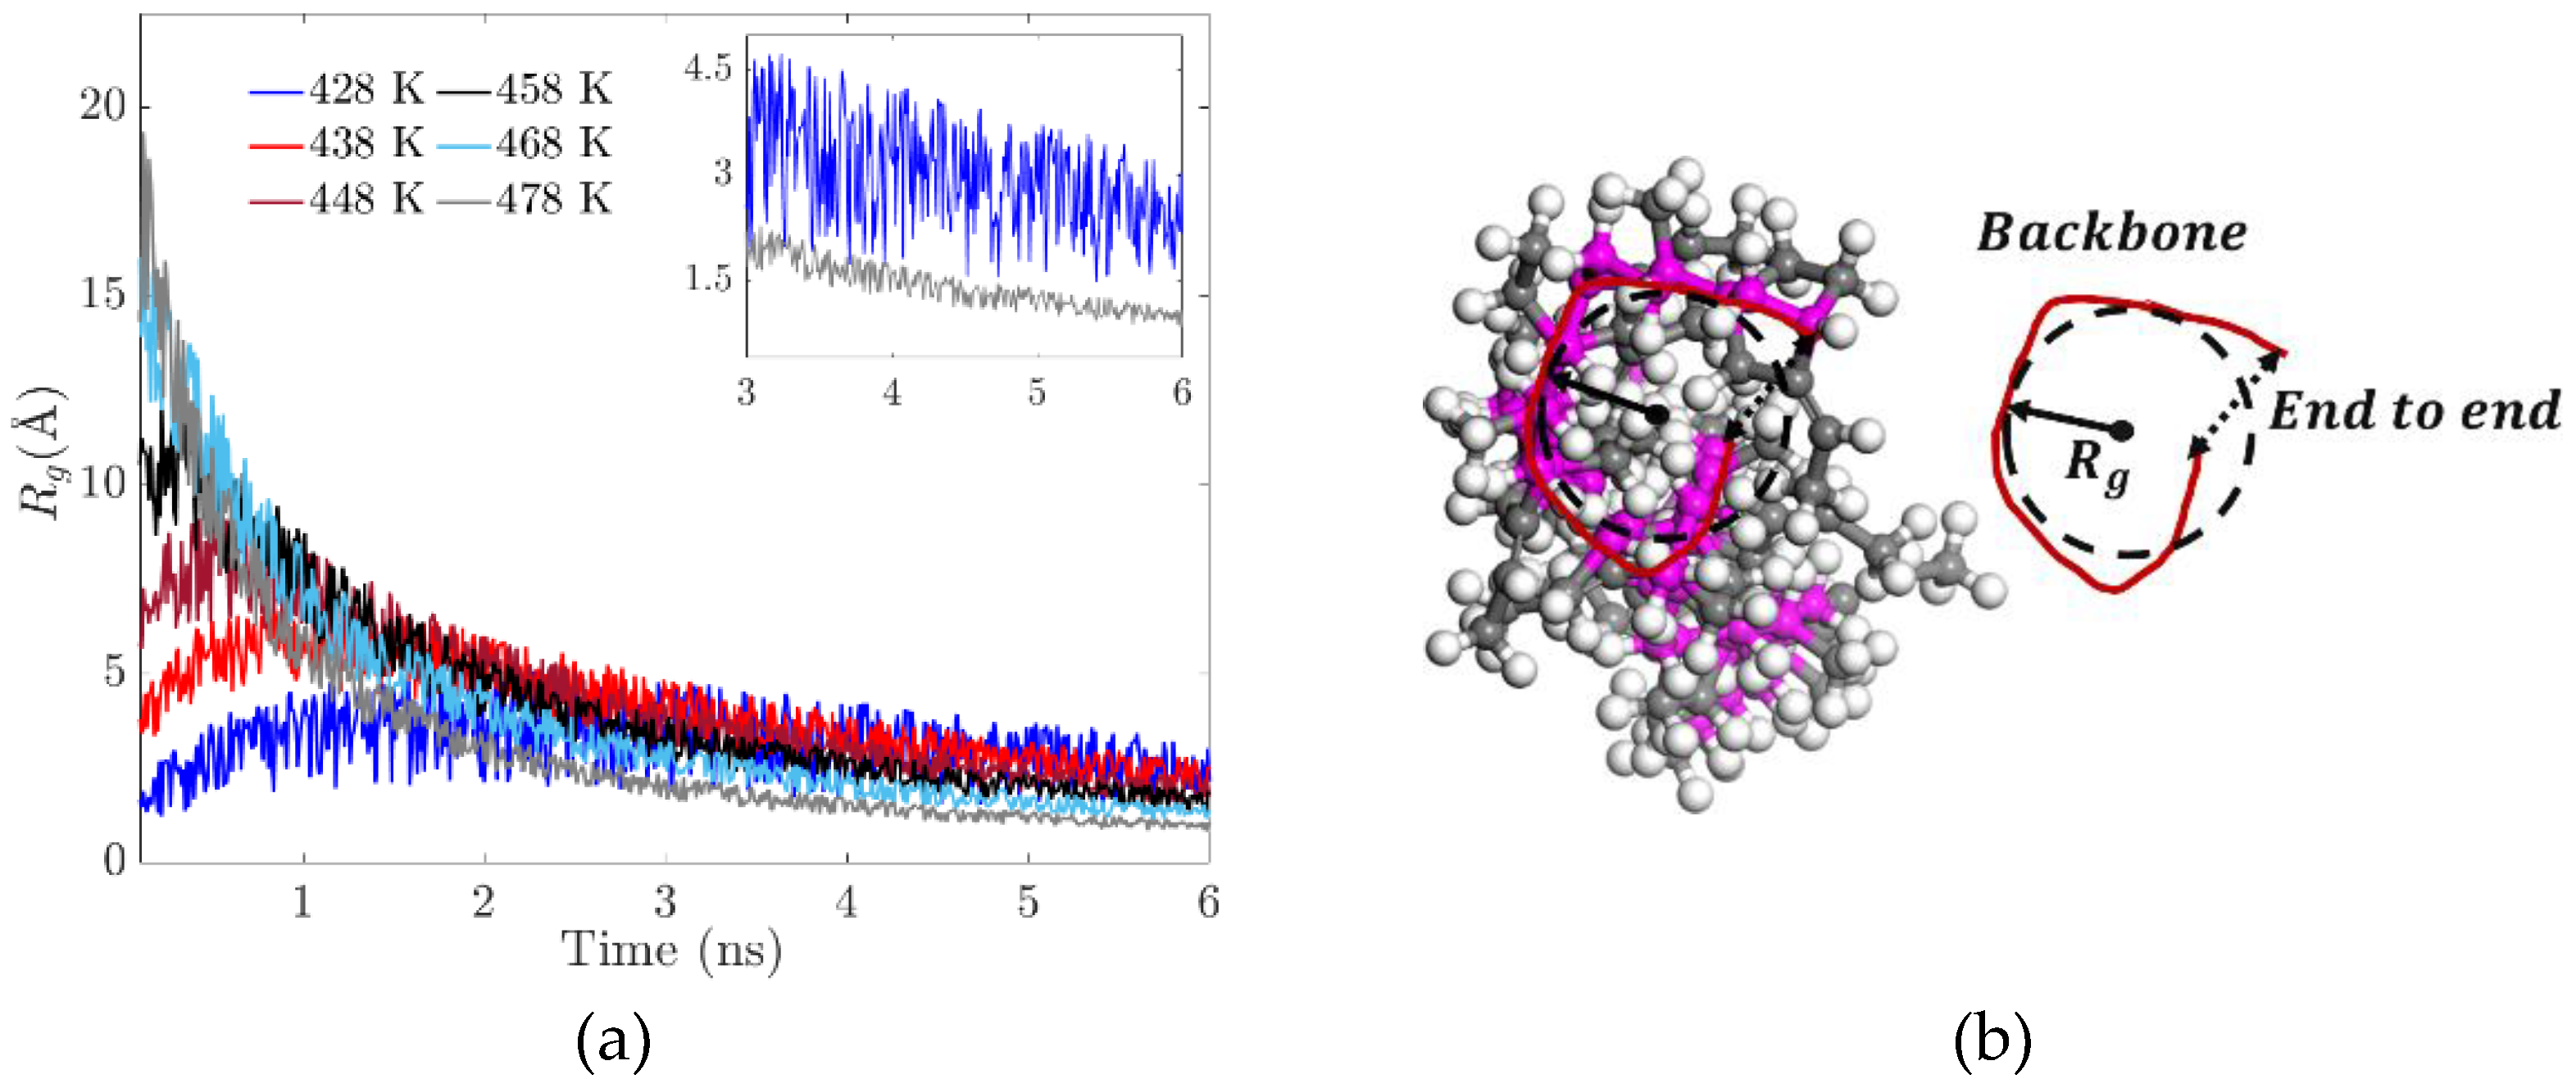
The radius of gyration measures the average effective size of a polymer’s chains; in this case, it’s used to quantify the degree of temperature-induced folding. Flexibility in molecular dynamic systems is characterized by the radius of gyration; a small value indicates that the polymer is relatively compact, meaning that along the path the polymer is folded most of the time. Thus, we can measure the radius of the gyration distribution of a polymer to characterize the folding patterns and analyze the conformational behavior (see Figure 6(b)).
Where is the quadratic modulus of the vector defined between the center of mass of the chain and the position occupied by backbone in an instantaneous conformation of the polymer. The evolution of the radius of gyration in the polymer chains is associated with the elasticity (flexibility) of the resulting system, manifested by the progressive increase in stiffness. At the temperature of 428 K, there is greater flexibility in the main chain, which is expected to promote the formation of cross-links. At 478 K, an agglomeration of side chains is formed (see Figure 6(a)). There are no significant conformational changes in the main chain due to the low availability of free volume.
Figure 6.
(a) Radius of gyration for different temperatures. (b) Diagram of the radius of gyration and mass distribution in the backbone.
Figure 6.
(a) Radius of gyration for different temperatures. (b) Diagram of the radius of gyration and mass distribution in the backbone.
3.3. The End-to-End Vector
In the study of polymers, the end-to-end vector is the vector pointing from one end of a polymer to the other. For a discrete representation where monomer units are mapped as points in space, their relative positions are described by translation vectors . The end-to-end vector is then computed as the vector sum.
The measure of the distance end-to-end of the main chain indicates its degree of flexibility. The more flexible it is, the greater the probability of branching increases. This measurement also shows a possible conformational change in the backbone or an aggregation of the side chains.
The end-to-end distance decreases by about 25% for the system at 428 K; this decrease occurs in the first 5 ns (Figure 7 (a)). After that, the system does not show more than 9% variation. This shows the great flexibility of the main chain during the first 5 ns. In addition, when the system exceeds 5 ns, the flexibility tends to decrease by 46% concerning the initial configuration. In the case of the system with a temperature of 478 K, the distance end-to-end during the first 2.5 ns decreases drastically by 42 % subsequently, the fluctuations stabilize in a range of 8 %. The final ratio concerning the initial conformation is 68 % lower, which indicates higher rigidity than the systems with lower temperatures (Figure 7 (b)).
3.4. Radial Distribution Function (g(r))
The radial distribution function describes the density variation as a function of distance measured from a reference particle. It measures the probability of finding a particle at a distance from another marked particle. The density depends on the conformational structure of the polymer chains.
Where is bulk density, is a function that computes the number of particles within a shell of thickness , and is the spherical shell volume, with the approximation holding for small shell thicknesses. The radial distribution function denoted by g(r) (Figure 8 (a)) defines the probability of finding a certain distance between two atoms of different polymeric chains where there is a physical connection by electrostatic forces. Figure 8 (b) represents the radial distribution function where the electrostatic equilibrium distance (physical cross-link) is 1.1 Angstrom. The value of the radial function increases with temperature.
3.5. Free Volume
The free volume was calculated by creating an atomic volume surface (Connolly surface). The periodic box was meshed with square cells of 0.11 Å spacing, and all grids were scanned with a probe of radius 1.1 Å. If more than half of the grid space was occupied by a probe, it was marked as accessible. If more than half of the grid space was occupied by atoms, it was marked as occupied. The free volume in polymeric systems is formed when adjacent grids remain unoccupied, therefore the fractional free volume (FFV) is defined as the ratio of this unoccupied volume (free volume) to the total system volume.
Figure 9a,b show the morphology of the Connolly volume in the simulation cell; the blue color indicates the accessible volume. The FFV obtained is strongly dependent on the proximity and entanglement between the polymer chains, and it can be seen that the FFV decreases with increasing temperature.
The FFV results obtained for each probe molecule show that the FFV decreases as the interaction attractive force increases. This shortens the distance between the polymer chains, creating cross-links and entanglement. Consequently, the cross-linking density increases and the FFV decreases with increasing temperature.
4. Discussion
The influence of molecular structures on the dynamics of polymers is a central aspect in determining rheological behavior, and properties are known to scale macroscopically. For example, the chain self-diffusion coefficient, , is mainly determined by the average size and shape of the polymer chain, and the analysis of trajectories such as mean square displacement and radius of gyration allow elucidating the complex mechanisms of molecular dynamics of rubbery polymers. The diffusion of cross-linked polymers is often described by theories that emphasize the topology of the polymer chains and their assumed motion through a fixed background representing adjacent chains. However, the complex mechanics of diffusion and cross-linking in amorphous systems can be studied in depth by using molecular dynamics simulations to generate trajectories of the polymer system for more accurate estimation of rheological properties.
In this context, initial studies, such as the one developed by Antonietti and coworkers in 1995 [28], performed a series of experiments to understand the large-scale viscosity behavior for fluidized polymers in entangled and non-entangled regimes and found a close relationship of viscosity with the topology of the molecular structure. A significant contribution was the phenomenology of entangled polymers, with the discovery of microgel structures, which confine molecular chains that could not possibly reptate.
Given the inherent difficulty in establishing an accurate model for viscosity in fluidized polymers in a wide range of topologies where, in addition, the influence of temperature favors gelling. Years later, Chremos et al. 2017 [29] established models to calculate and quantify the size and molecular shapes of fluidized polymers to determine their possible relationship with diffusion and radius of gyration as a complementary measure of the anisotropy of the molecular topology.
The results of Wang et al. 2021 [17] establish a physicochemical-specific molecular simulation approach to understand the constitutive behavior of elastomers and establish a methodology for multiscale analysis relating composition and microstructure to the mechanical performance of rubbery polymers. Wang and coworkers 2022 [x] used MD simulations to determine the trajectories, mean square displacement, radius of gyration, and free volume, as well as the self-diffusion behavior and molecular conformation of EPDM rubber, and correlated them with the mechanical behavior.
The results of the molecular dynamics study presented in this paper show that the amount of energy required to induce a conformational change depends on the temperature of the system. According to Saleesung et al. [30], Xie et al. [31], Papanikolaou et al. [19], and Bandyopadhyay et al. [32], as the cross-linking increases and the free volume decreases, the elastic modulus and thus the tensile strength of the elastomer increases. This effect is manifested macroscopically as an increase in stiffness or a change in the slope of the stress curve. See Figure 7.
Wang et al. [23] reported that the effect of cross-linking between backbones and physical cross-linking increases the stiffness modulus and decreases the free volume fraction. The results obtained in this study confirm that at higher temperatures, the interactions of the molecules are weakened by the accelerated motion of the radius of gyration in the segments, causing the physical cross-links to break at some point (see Figure 4).
The dependence of EPDM’s gel point on temperature has been studied from the behavior of the mean squared displacement. As the gel point is approached, the MSD decreases dramatically to confine the polymer’s molecular network (see Figure 4). EPDM’s intermolecular sliding is restricted as the amount of cross-linking increases, which is manifested by a drastic increase in viscosity. Figure 10a,b show the results of the calculation of stress and viscosity regarding the evolution of the trajectories generated in the molecular dynamics simulations at two different temperatures, 428 and 478 K. The critical gel point decreases with increasing temperature, and the magnitude of the stress gradient increases significantly as temperature increases, while the viscosity at time zero is inversely proportional to temperature.
The physical cross-linking and entanglement of the polymer chains change dynamically, mainly due to temperature. The influence of increased cross-linking and conformational changes is evident in the variation of the resulting viscoelastic properties.
The viscoelastic properties of the rubbery polymer are strongly affected by temperature and depend on the nature of the interactions between the chains, which can be cross-linking or entanglement. In such a dense set of chains, the strong bonds along the polymer backbone, coupled with the repulsive interaction between unconnected beads, prevent the chains from crossing each other. The result is an entangled system with motion constraints for each chain imposed by entanglement with neighboring chains. Because of the entanglement, the polymers are restricted to repulsive motion. The length, temperature, and stiffness of the chains strongly influence their motion. Figure 11(a) illustrates the increase in occupied volume referred to in the previous paragraph.
Figure 11(b) shows the time-temperature window for “moving” the polymer, specifically for the injection process. The intrinsic time of atomistic simulations is infinitesimally short compared to macroscopic time scales. Viscoelastic materials are affected by the size of the system, so the time-temperature superposition principle (TTSP) is proposed to scale the models. According to TTSP, the mechanical behavior of viscoelastic materials at different temperatures could be related by changing the time domain.
Where is the target property and is the transformation factor.
Six moulding tests were performed on an automotive door grommet (see Figure 12) using reference temperatures in molecular dynamics (MD) simulations. Four hardness specimens and tests were obtained using a PCE-DX-AS rubber and elastomer hardness tester (Shore A hardness 0–100+). ASTM D1415-18 and ASTM D2240-15 standards have been used as a point of reference.
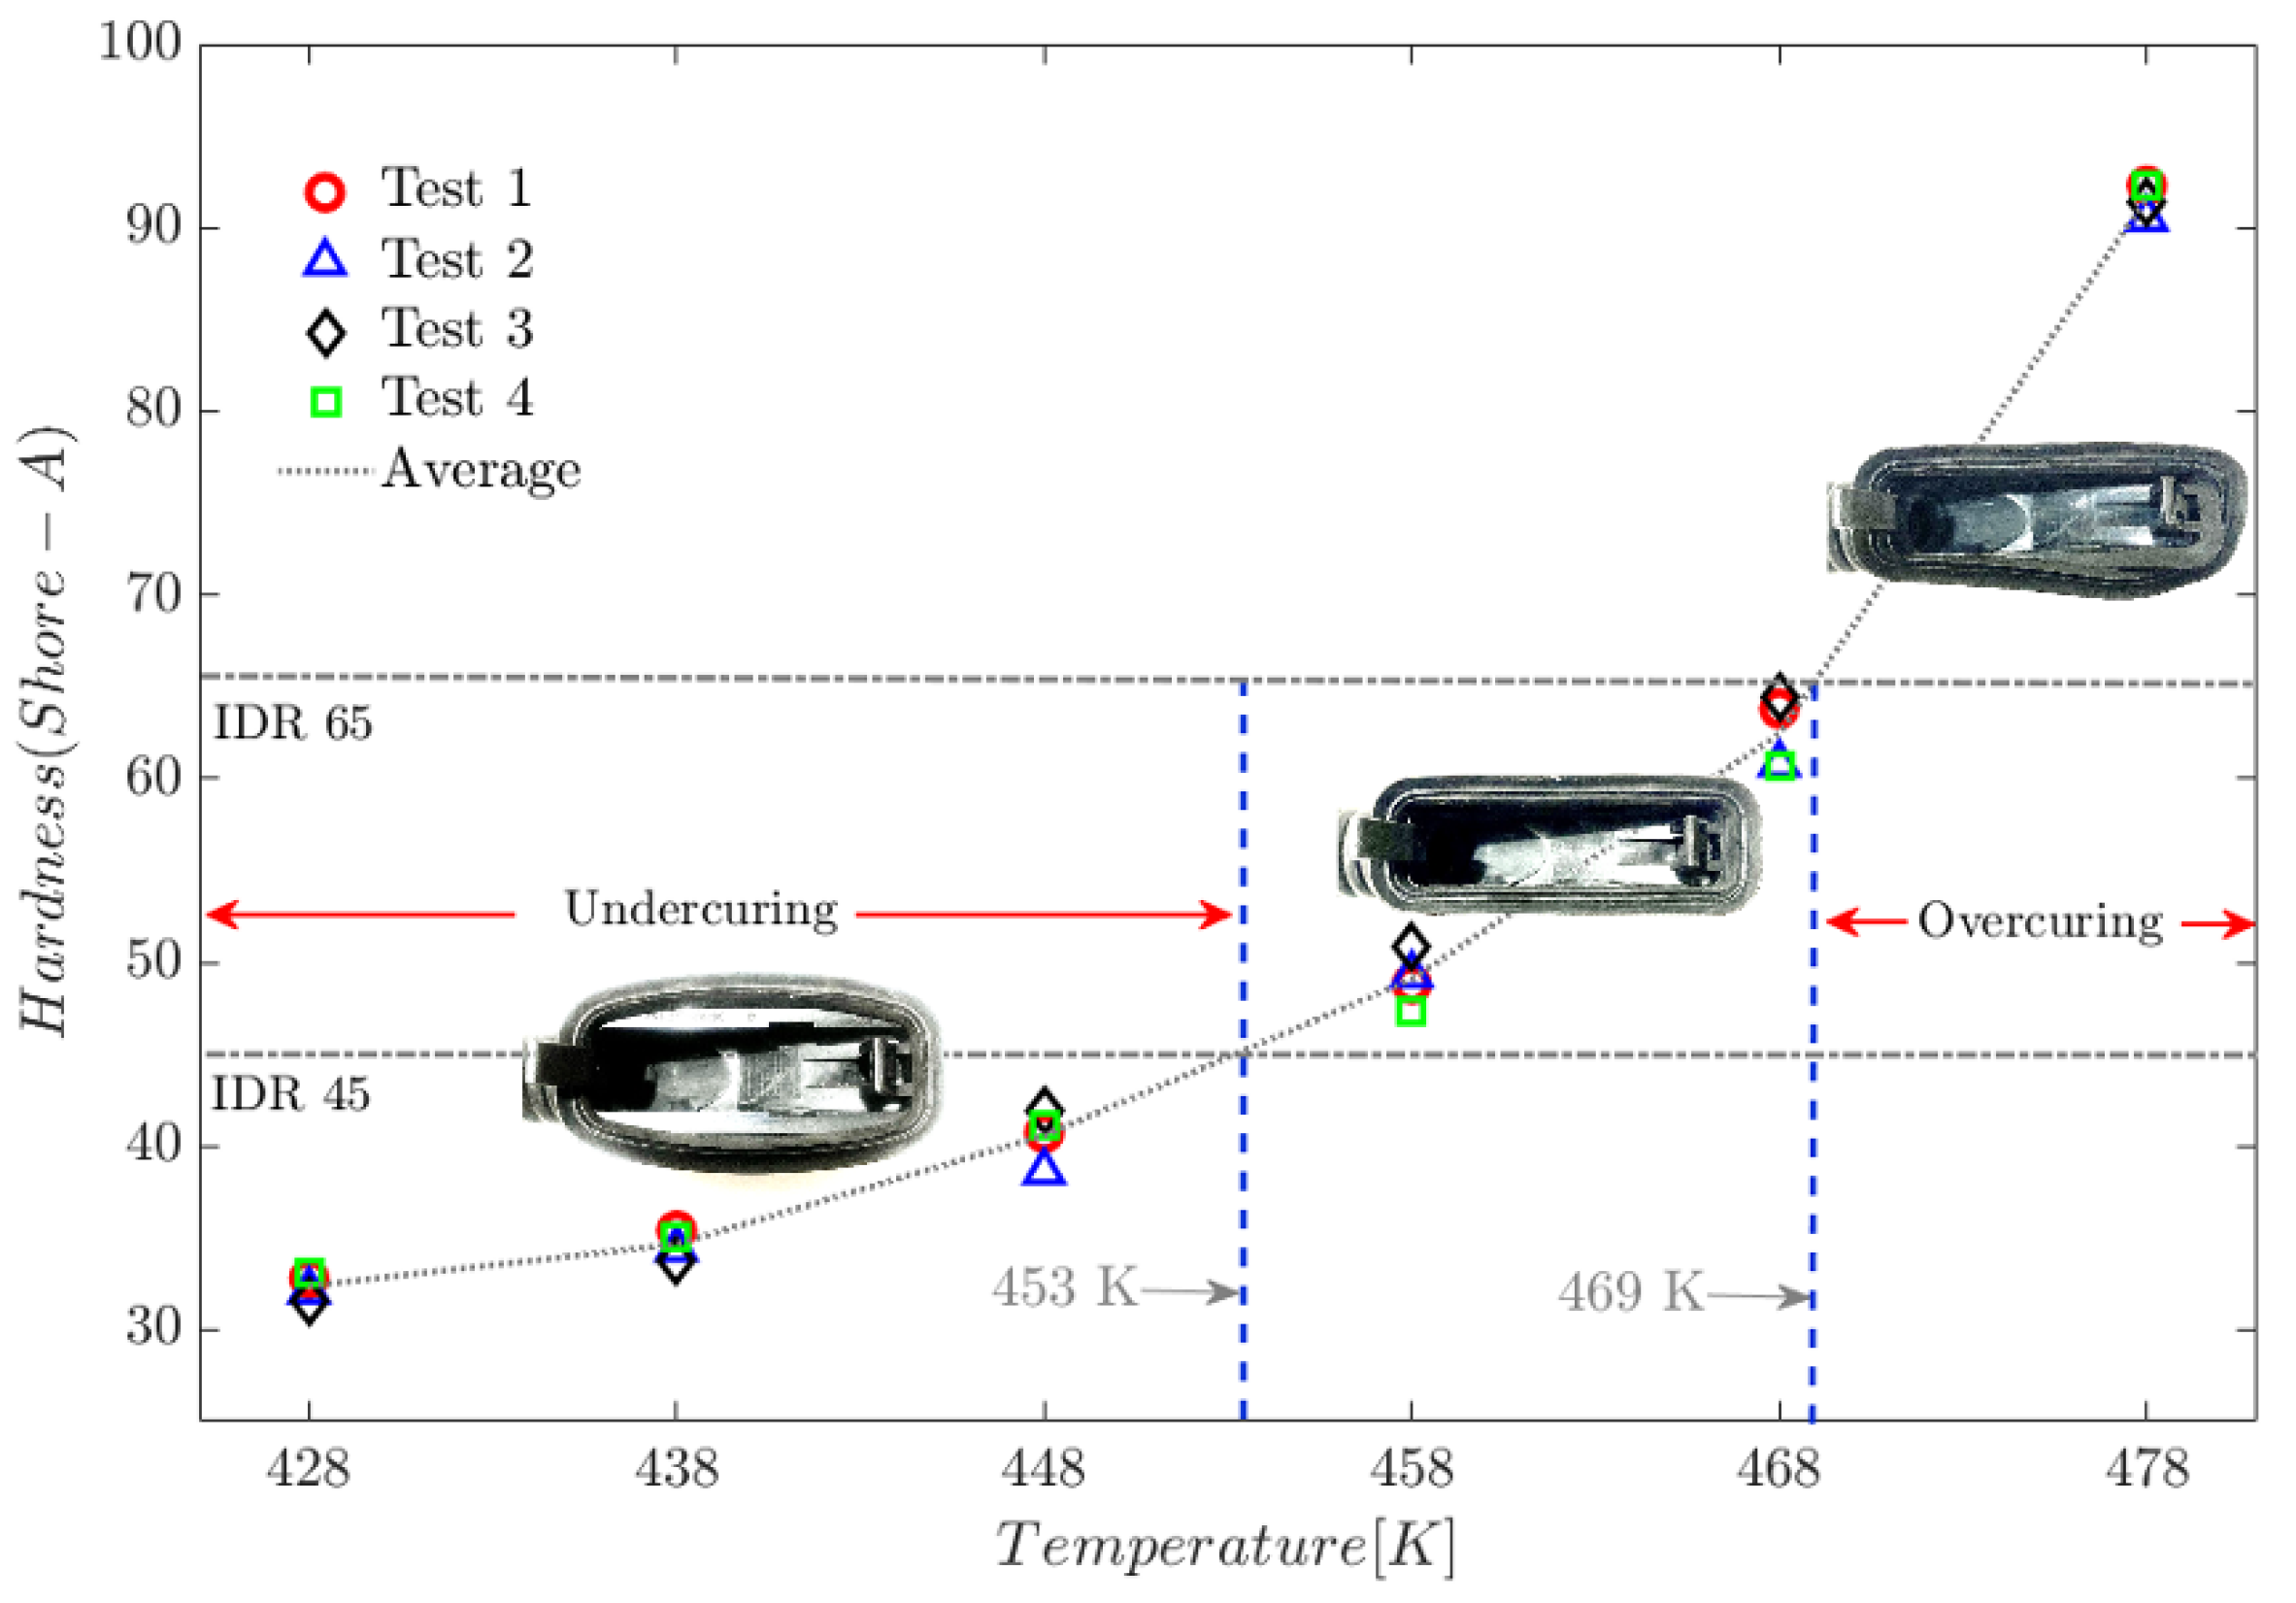
The results of the hardness tests are consistent with the MD simulation findings. At temperatures below 453 K, the injected parts exhibit rubbery behaviour that tends towards viscosity. In contrast, at temperatures above 469 K, the polymer exhibits rigid properties with minimal elasticity. Figure 13 shows the hardness test results for a door grommet application.
The International Rubber Hardness Degree (IRHD) test relates to the elasticity of the material [33]. Under this standard, a value between 45 and 65 is considered suitable for door grommet applications.
As discussed in the following paragraphs, the effects of temperature on the macroscopic mechanical properties observed during hardness tests on the door grommet component originate in the conformational structure of the elastomeric polymer at the molecular level.
The density of chemical crosslinking between chains can be considered constant (although the amount of crosslinking depends on the formula of the compound). The time it takes for a compound to reach the limit of this type of crosslinking depends on the catalyzing agents, such as sulfur, and on the temperature during the molding process. Considering only a limited amount of chemical crosslinking, the properties of the elastomers would be similar. The research results of Pradeep Kumar et al. [34] on the effect of sulphur and carbon black fillers on crosslink density evolution, physical crosslinking, chain mobility, and entanglement evolution are in agreement with the results presented here, corroborating the aforementioned authors’ findings on the intricate interplay between filler-polymer interactions and physical crosslinking dynamics.
The formation of physical crosslinks significantly alters the structural properties. The entanglement of the chains reduces the space available for the backbone to reorganise through reptation, generating greater stiffness. The density of physical crosslinking primarily depends on the curing temperature during the injection process, In their research, Smejda-Krzewicka and Mrozowski [35], confirm the significant effect of crosslinking temperature on the resulting rheological properties.
During the hardness test, the elastomer material undergoes volumetric compaction by the indenter. The extent to which the elastomer can be compacted depends on the void spaces in the polymer matrix, i.e., the free volume fraction.
The above is in line with reports from several researchers that the mechanical properties of elastomeric polymers are significantly affected by the conformational rearrangement of the molecular chains due to crosslinking by weak interactions, entanglements, and the volume fraction occupied by the polymeric networks [34,35,36,37,38].
5. Conclusions
Molecular simulation is an effective method for studying and predicting the rheological properties of rubbery polymers and the conformational behavior of molecular chains.
The diffusion phenomenon is highly dependent on the free volume, which is known to be associated with the conformational changes of the backbone and the cross-linking density of the polymer chains.
The evolution of the conformational structure and the internal forces that allow the cohesion of the molecular chains is strongly linked to the temperature; the main conformational changes occur in short periods, so it can be said that the temperature variation is the one that determines the rheological properties for processing and post-processing performance.
The next near-term challenge is multiscale modelling for designing elastomeric components. The development of new modelling tools, including finite element models, is expected to be stimulated by the increasing use of molecular dynamics simulations to determine mechanical properties from a nanoscopic approach.
In summary, understanding the processes intrinsic to the dynamics of crosslinking and entanglement of elastomeric polymer chains enables the optimal degree of crosslinking, which in turn allows for improved mechanical properties by designing an efficient curing process during injection molding.
Author Contributions
Conceptualization, S.G-J, D.N-S and A.R-G; methodology S.G-J, A.R.C.R and D.L-B; software, A.R-G and A.L-B; validation, A.R.C.R and D.L-B; investigation, A.R.C.R and A.R-G.; resources, S-G-J and L.S-A; data curation, C.G-M and J.O-L; writing—original draft preparation, S.G-J, A.R.C.R and A.R-G.; writing—review and editing, D.N-S, L.S-A, C.G-M and J.O-L; visualization, D.L-B and A.L-B; supervision, A.R.C.R and S.G-J; project administration, S.G-J. All authors have read and agreed to the published version of the manuscript.
Acknowledgments
Elastomer Solutions Mexico, Condensed Soft Matter Network, CONACyT and COZCyT for their support in this study.
Conflicts of Interest
The authors declare no conflicts of interest.
References
- S. Li, H. Tian, H. Wu, N. Ning, M. Tian, and L. Zhang, “Coupling effect of molecular weight and crosslinking kinetics on the formation of rubber nanoparticles and their agglomerates in EPDM/PP TPVs during dynamic vulcanization,” Soft Matter, 10.1039/C9SM02059D vol. 16, no. 9, pp. 2185- 2198, 2020. [CrossRef]
- D. Bouguedad et al., “Physico-chemical study of thermally aged EPDM used in power cables insulation,” IEEE Transactions on Dielectrics and Electrical Insulation, vol. 22, no. 6, pp. 3207- 3215, 2015. [CrossRef]
- P. Ravishankar, “Treatise on EPDM,” Rubber chemistry and technology, vol. 85, no. 3, pp. 327-349, 2012.
- R. Shaji and N. N. Kumar, “Simulation of Room Temperature Vulcanized Gasket Failure at Engine T-Joints,” ARAI Journal of Mobility Technology, vol. 2, no. 1, pp. 108-111, 2022.
- N. C. Restrepo-Zapata, B. Eagleburger, T. Saari, T. A. Osswald, and J. P. Hernández-Ortiz, “Chemorheological time-temperature-transformation-viscosity diagram: Foamed EPDM rubber compound,” Journal of Applied Polymer Science, vol. 133, no. 38, ppn/a-n/a. 2016. [CrossRef]
- G. Milani and F. Milani, “EPDM accelerated sulfur vulcanization: a kinetic model based on a genetic algorithm,” Journal of mathematical chemistry, vol. 49, no. 7, pp. 1357-1383, 2011.
- W. Niu, Y. Li, Y. Ma, and G. Zhao, “Determination and Prediction of Time-Varying Parameters of Mooney–Rivlin Model of Rubber Material Used in Natural Rubber Bearing under Alternating of Aging and Seawater Erosion,” Materials, vol. 16, no. 13, p. 4696, 2023. [Online]. Available: https://www.mdpi.com/1996-1944/16/13/4696.
- J. Jiang, J.-s. Xu, Z.-s. Zhang, and X. Chen, “Rate-dependent compressive behavior of EPDM insulation: Experimental and constitutive analysis,” Mechanics of Materials, vol. 96, pp. 30-38, 2016/05/01/ 2016. 2016. [CrossRef]
- B. Habieb, F. Milani, G. Milani, G. Pianese, and D. Torrini, “Vulcanization degree influence on the mechanical properties of Fiber Reinforced Elastomeric Isolators made with reactivated EPDM,” Polymer Testing, vol. 108, p. 107496, 2022/04/01/ 2022. [CrossRef]
- Shi, C. Cao, M. Lei, L. Peng, and J. Shen, “Time-dependent performance and constitutive model of EPDM rubber gasket used for tunnel segment joints,” Tunnelling and Underground Space Technology, vol. 50, pp. 490-498, 2015/08/01/ 2015. 2015. [Google Scholar] [CrossRef]
- R. Z. A. Rashid et al., “Temperature Dependent on Mechanical and Rheological Properties of EPDM-Based Magnetorheological Elastomers Using Silica Nanoparticles,” Materials, vol. 15, no. 7, p. 2556, 2022. [Online]. Available: https://www.mdpi.com/1996-1944/15/7/2556.
- C. T. Hiranobe et al., “Cross-linked density determination of natural rubber compounds by different analytical techniques,” Materials Research, vol. 24, p. e20210041, 2021.
- V. Morovati, A. Bahrololoumi, and R. Dargazany, “Fatigue-induced stress-softening in cross-linked multi-network elastomers: Effect of damage accumulation,” International Journal of Plasticity, vol. 142, p. 102993, 45 2021/07/01/ 2021. [CrossRef]
- J. Shen, X. Lin, J. Liu, and X. Li, “Effects of Cross-Link Density and Distribution on Static and Dynamic Properties of Chemically Cross-Linked Polymers,” Macromolecules, vol. 52, no. 1, pp. 121-134, 2019/01/08. [CrossRef]
- M. Cheng, W. Chen, and B. Song, “Phenomenological Modeling of the Stress-Stretch Behavior of EPDM Rubber with Loading-rate and Damage Effects,” International Journal of Damage Mechanics, vol. 13, no. 4, pp. 371-381, 2004/10/01 2004. [CrossRef]
- Y. Wang, H. Liu, P. Li, and L. Wang, “The Effect of Cross-Linking Type on EPDM Elastomer Dynamics and Mechanical Properties: A Molecular Dynamics Simulation Study,” Polymers, vol. 14, no. 7, p. 1308, 2022. [Online]. Available: https://www.mdpi.com/2073-4360/14/7/1308.
- A. Wang, F. Vargas-Lara, J. M. Younker, K. A. Iyer, K. R. Shull, and S. Keten, “Quantifying Chemical Composition and Cross-link Effects on EPDM Elastomer Viscoelasticity with Molecular Dynamics,” Macromolecules, vol. 54, no. 14, pp. 6780-6789, 2021/07/27 2021. [CrossRef]
- V. Varshney, S. S. Patnaik, A. K. Roy, and B. L. Farmer, “A Molecular Dynamics Study of Epoxy-Based Networks: Cross-Linking Procedure and Prediction of Molecular and Material Properties,” Macromolecules, vol. 41, no. 18, pp. 6837-6842, 2008/09/23 2008. [CrossRef]
- M. Papanikolaou, D. Drikakis, and N. Asproulis, “Molecular dynamics modelling of mechanical properties of polymers for adaptive aerospace structures,” AIP Conference Proceedings, vol. 1646, no. 1, pp. 66-71, 2015. [CrossRef]
- M. van Duin, R. Orza, R. Peters, and V. Chechik, “Mechanism of Peroxide Cross-Linking of EPDM Rubber,” Macromolecular Symposia, vol. 291-292, no. 1, pp. 66-74, 2010. [CrossRef]
- H. Sun, “COMPASS: An ab Initio Force-Field Optimized for Condensed-Phase ApplicationsOverview with Details on Alkane and Benzene Compounds,” The Journal of Physical Chemistry B, vol. 102, no. 38, pp. 7364, 1998/09/01 1998. [CrossRef]
- M. J. McQuaid, H. Sun, and D. Rigby, “Development and validation of COMPASS force field parameters for molecules with aliphatic azide chains,” Journal of Computational Chemistry, vol. 25, no. 1, pp. 61-71, 2004. [CrossRef]
- Y. Wang, Y. Yang, and M. Tao, “Understanding Free Volume Characteristics of Ethylene-Propylene-Diene Monomer (EPDM) through Molecular Dynamics Simulations,” Materials, vol. 12, no. 4, p. 612, 2019. [Online]. Available: https://www.mdpi.com/1996-1944/12/4/612.
- M. Zachary et al., “EPR study of persistent free radicals in cross-linked EPDM rubbers,” European Polymer Journal, vol. 44, no. 7, pp. 2099-2107, 2008/07/01/ 2008. [CrossRef]
- M. G. Paterlini and D. M. Ferguson, “Constant temperature simulations using the Langevin equation with velocity Verlet integration,” Chemical Physics, vol. 236, no. 1, pp. 243-252, 1998/09/15/ 1998. [CrossRef]
- K. Yin, H. Xiao, J. Zhong, and D. Xu, “A new method for Calculation of Elastic Properties of Anisotropic material by constant pressure molecular dynamics,” in International Conference of Computational Methods in Sciences and Engineering 2004 (ICCMSE 2004), 2019: CRC Press, pp. 586-588.
- P. R. Varadwaj, “Combined Molecular Dynamics and DFT Simulation Study of the Molecular and Polymer Properties of a Catechol-Based Cyclic Oligomer of Polyether Ether Ketone,” Polymers, vol. 12, no. 5, p. 1054, 2020. [Online]. Available: https://www.mdpi.com/2073-4360/12/5/1054.
- M. Antonietti, T. M. Antonietti, T. Pakula, and W. Bremser, “Rheology of Small Spherical Polystyrene Microgels: A Direct Proof for a New Transport Mechanism in Bulk Polymers besides Reptation,” Macromolecules, vol. 28, no. 12, pp. 4227-4233, 1995/06/01 1995. [CrossRef]
- A. Chremos, C. Jeong, and J. F. Douglas, “Influence of polymer architectures on diffusion in unentangled polymer melts,” Soft Matter, 10.1039/C7SM01018D vol. 13, no. 34, pp. 5778- 5784, 2017. [Google Scholar] [CrossRef]
- T. Saleesung, D. Reichert, K. Saalwächter, and C. Sirisinha, “Correlation of crosslink densities using solid state NMR and conventional techniques in peroxide-crosslinked EPDM rubber,” Polymer, vol. 56, pp. 309-317, 2015/01/15/ 2015. [CrossRef]
- B.-G. Xie et al., “A combined simulation and experiment study on polyisoprene rubber composites,” Composites Science and Technology, vol. 200, p. 108398, 2020/11/10/ 2020. [CrossRef]
- A. Bandyopadhyay, P. K. Valavala, T. C. Clancy, K. E. Wise, and G. M. Odegard, “Molecular modeling of crosslinked epoxy polymers: The effect of crosslink density on thermomechanical properties,” Polymer, vol. 52, no. 11, pp. 2445-2452, 2011/05/13/ 2011. [CrossRef]
- ASTM 1415-18; Standard Test Method for Rubber Property—International Hardness. American Standard Testing for Materials ASTM: West Conshohocken, PA, USA, 09.01, 2018.
- P. P, J. Neethirajan, K. M.I, R. R, and R. R, “Thermo-oxidative aging and its influence on the performance of silica, carbon black, and silica/carbon black hybrid fillers -filled tire tread compounds,” Journal of Polymer Research, vol. 32, no. 4, p. 117, 2025/04/01 2025. [CrossRef]
- A. Smejda-Krzewicka and, K. Mrozowski, “Chloroprene and Butadiene Rubber (CR/BR) Blends Cross-Linked with Metal Oxides: INFLUENCE of Vulcanization Temperature on Their Rheological, Mechanical, and Thermal Properties,” Molecules, vol. 30, no. 13, p. 2780, 2025. [Online]. Available: https://www.mdpi.com/1420-3049/30/13/2780.
- S. Gomez-Jimenez et al., “Mooney–Rivlin Parameter Determination Model as a Function of Temperature in Vulcanized Rubber Based on Molecular Dynamics Simulations,” Materials, vol. 17, no. 13, p. 3252, 2024. [Online]. Available: https://www.mdpi.com/1996-1944/17/13/3252.
- H. Shao, Q. Guo, and A. He, “Evolution of crosslinking networks structure and thermo-oxidative aging behavior of unfilled NR/BR blends with TBIR as extra functional compatibilizer,” Polymer Testing, vol. 115, p. 107715, 2022/11/01/ 2022. [CrossRef]
- S. Panyukov, “Theory of Flexible Polymer Networks: Elasticity and Heterogeneities,” Polymers, vol. 12, no. 4, p. 767, 2020. [Online]. Available: https://www.mdpi.com/2073-4360/12/4/767.
Figure 1.
(a) Polymer chain with 500 monomers. (b) Simulation box with 10 polymer chains.
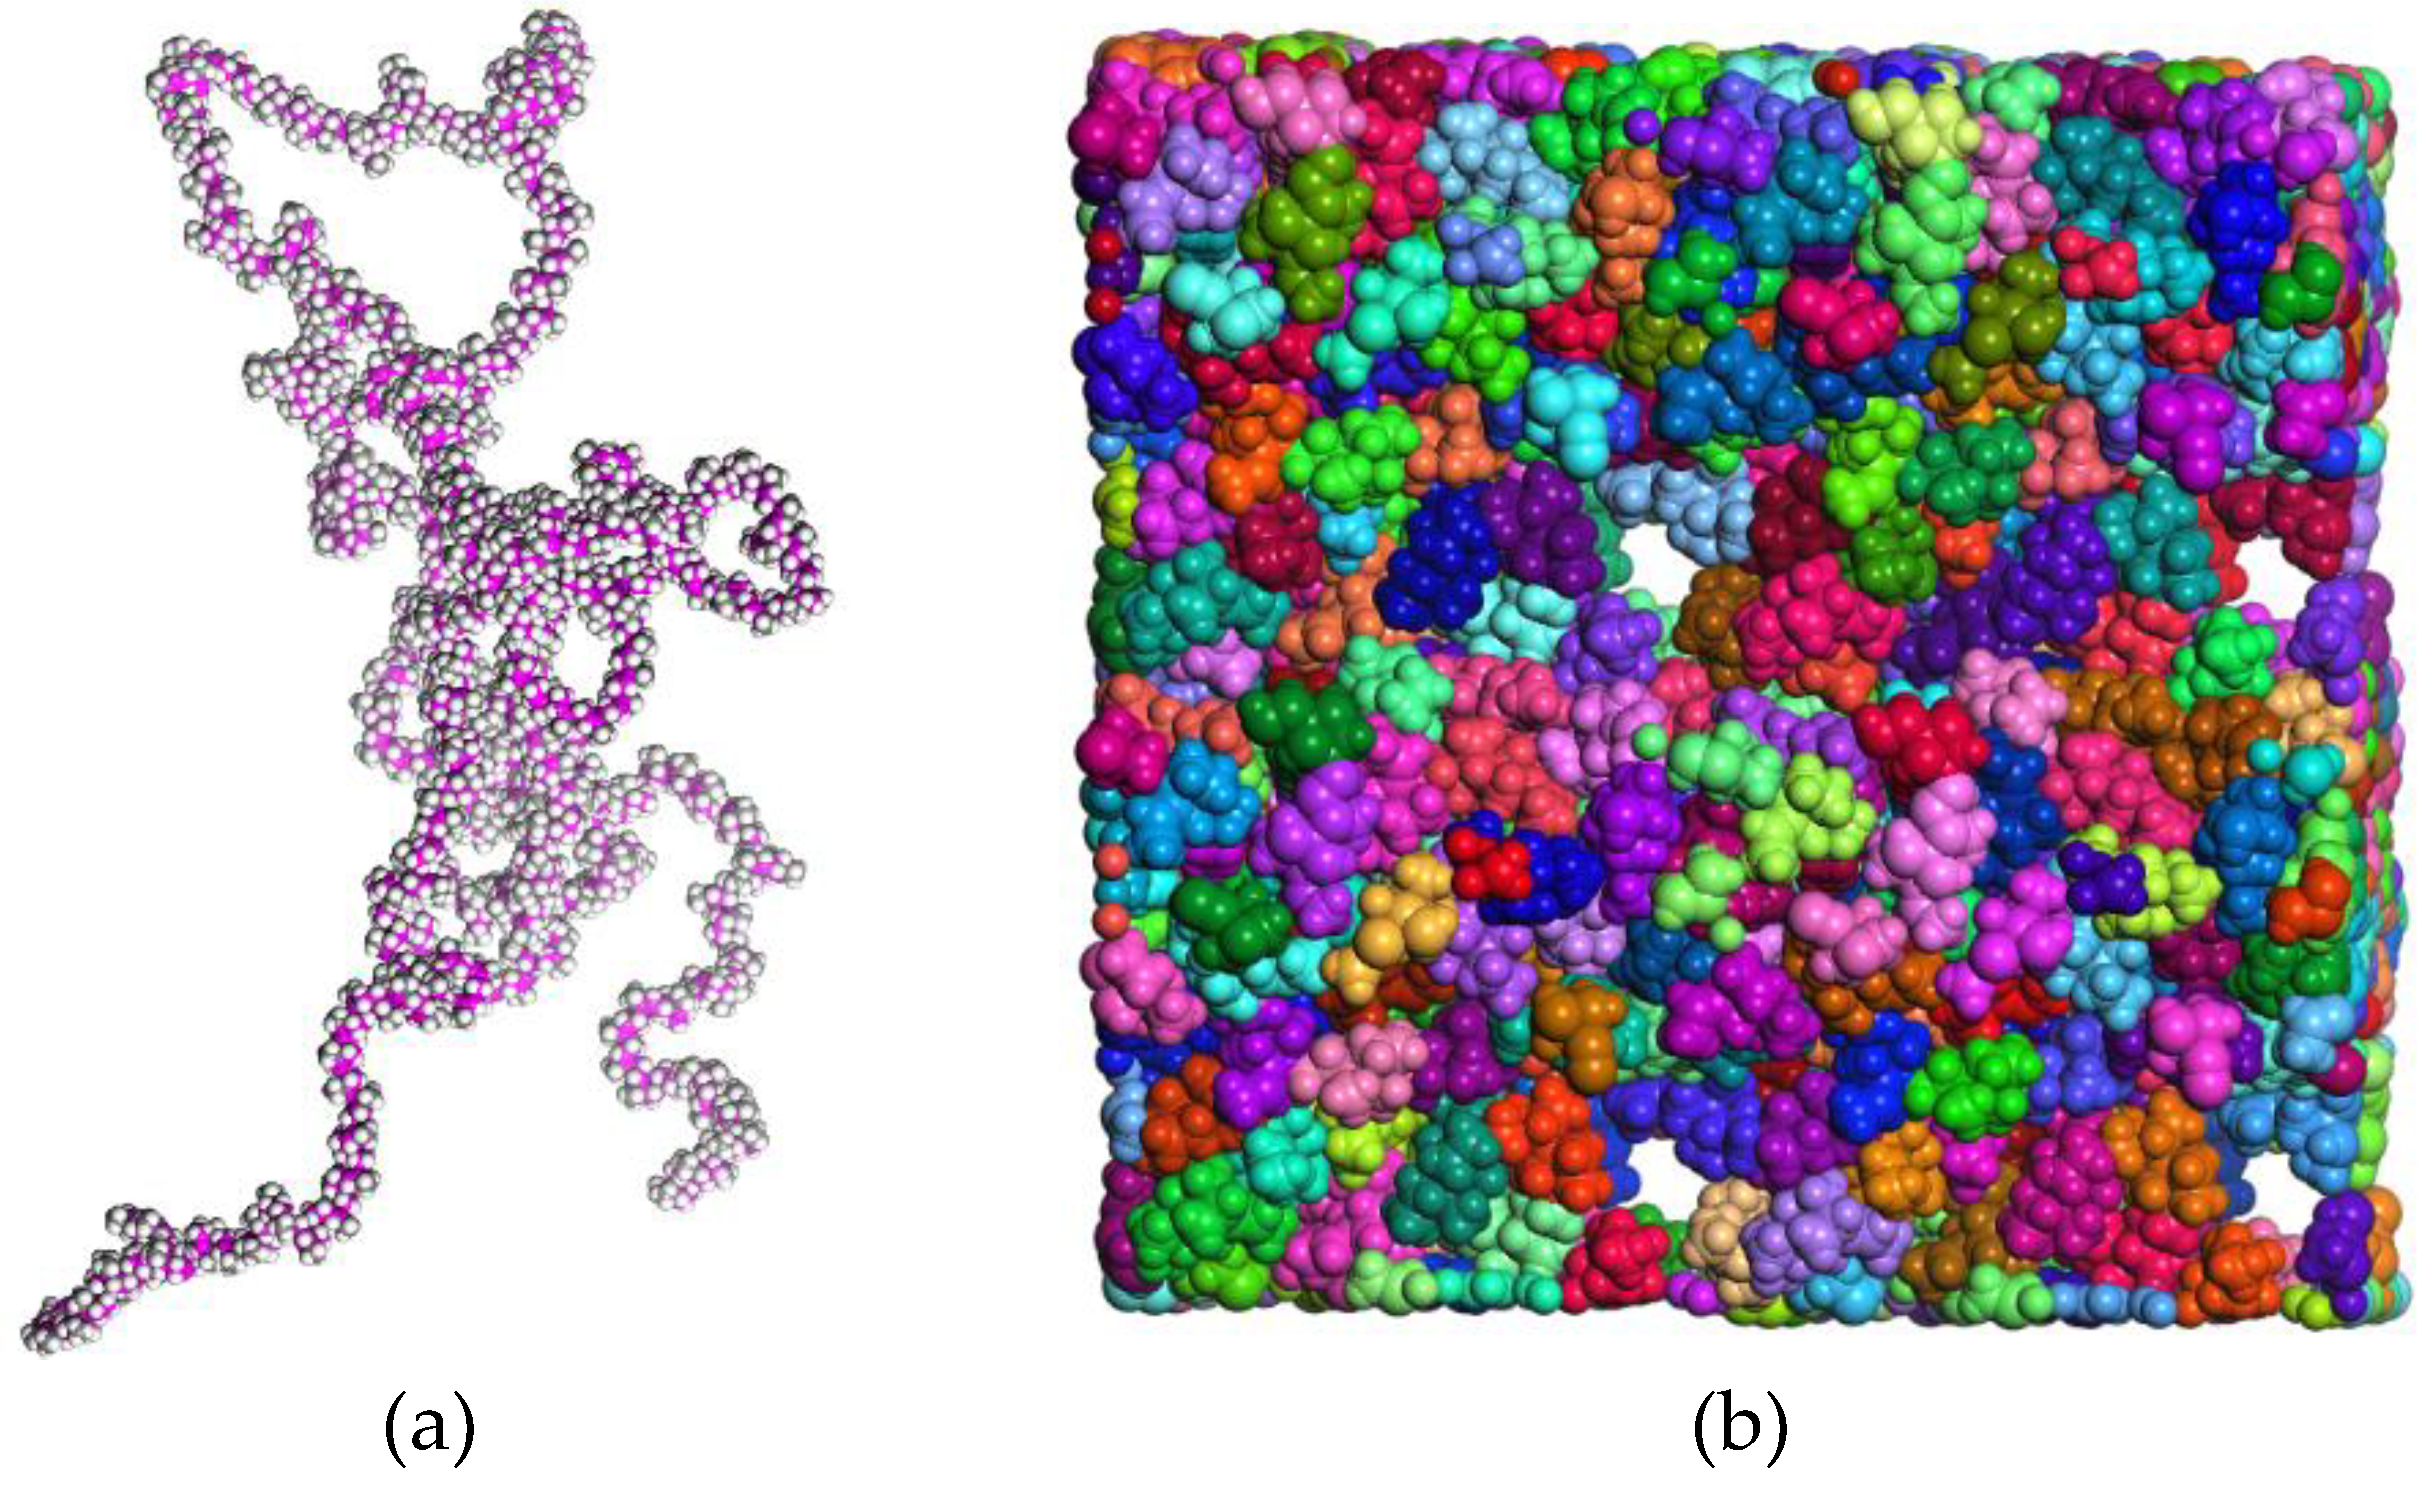
Figure 2.
(a) Types of cross-linking that are possible during the vulcanization of EPDM. (b) Schematic representation of the molecular structure of a cured elastomer.
Figure 2.
(a) Types of cross-linking that are possible during the vulcanization of EPDM. (b) Schematic representation of the molecular structure of a cured elastomer.
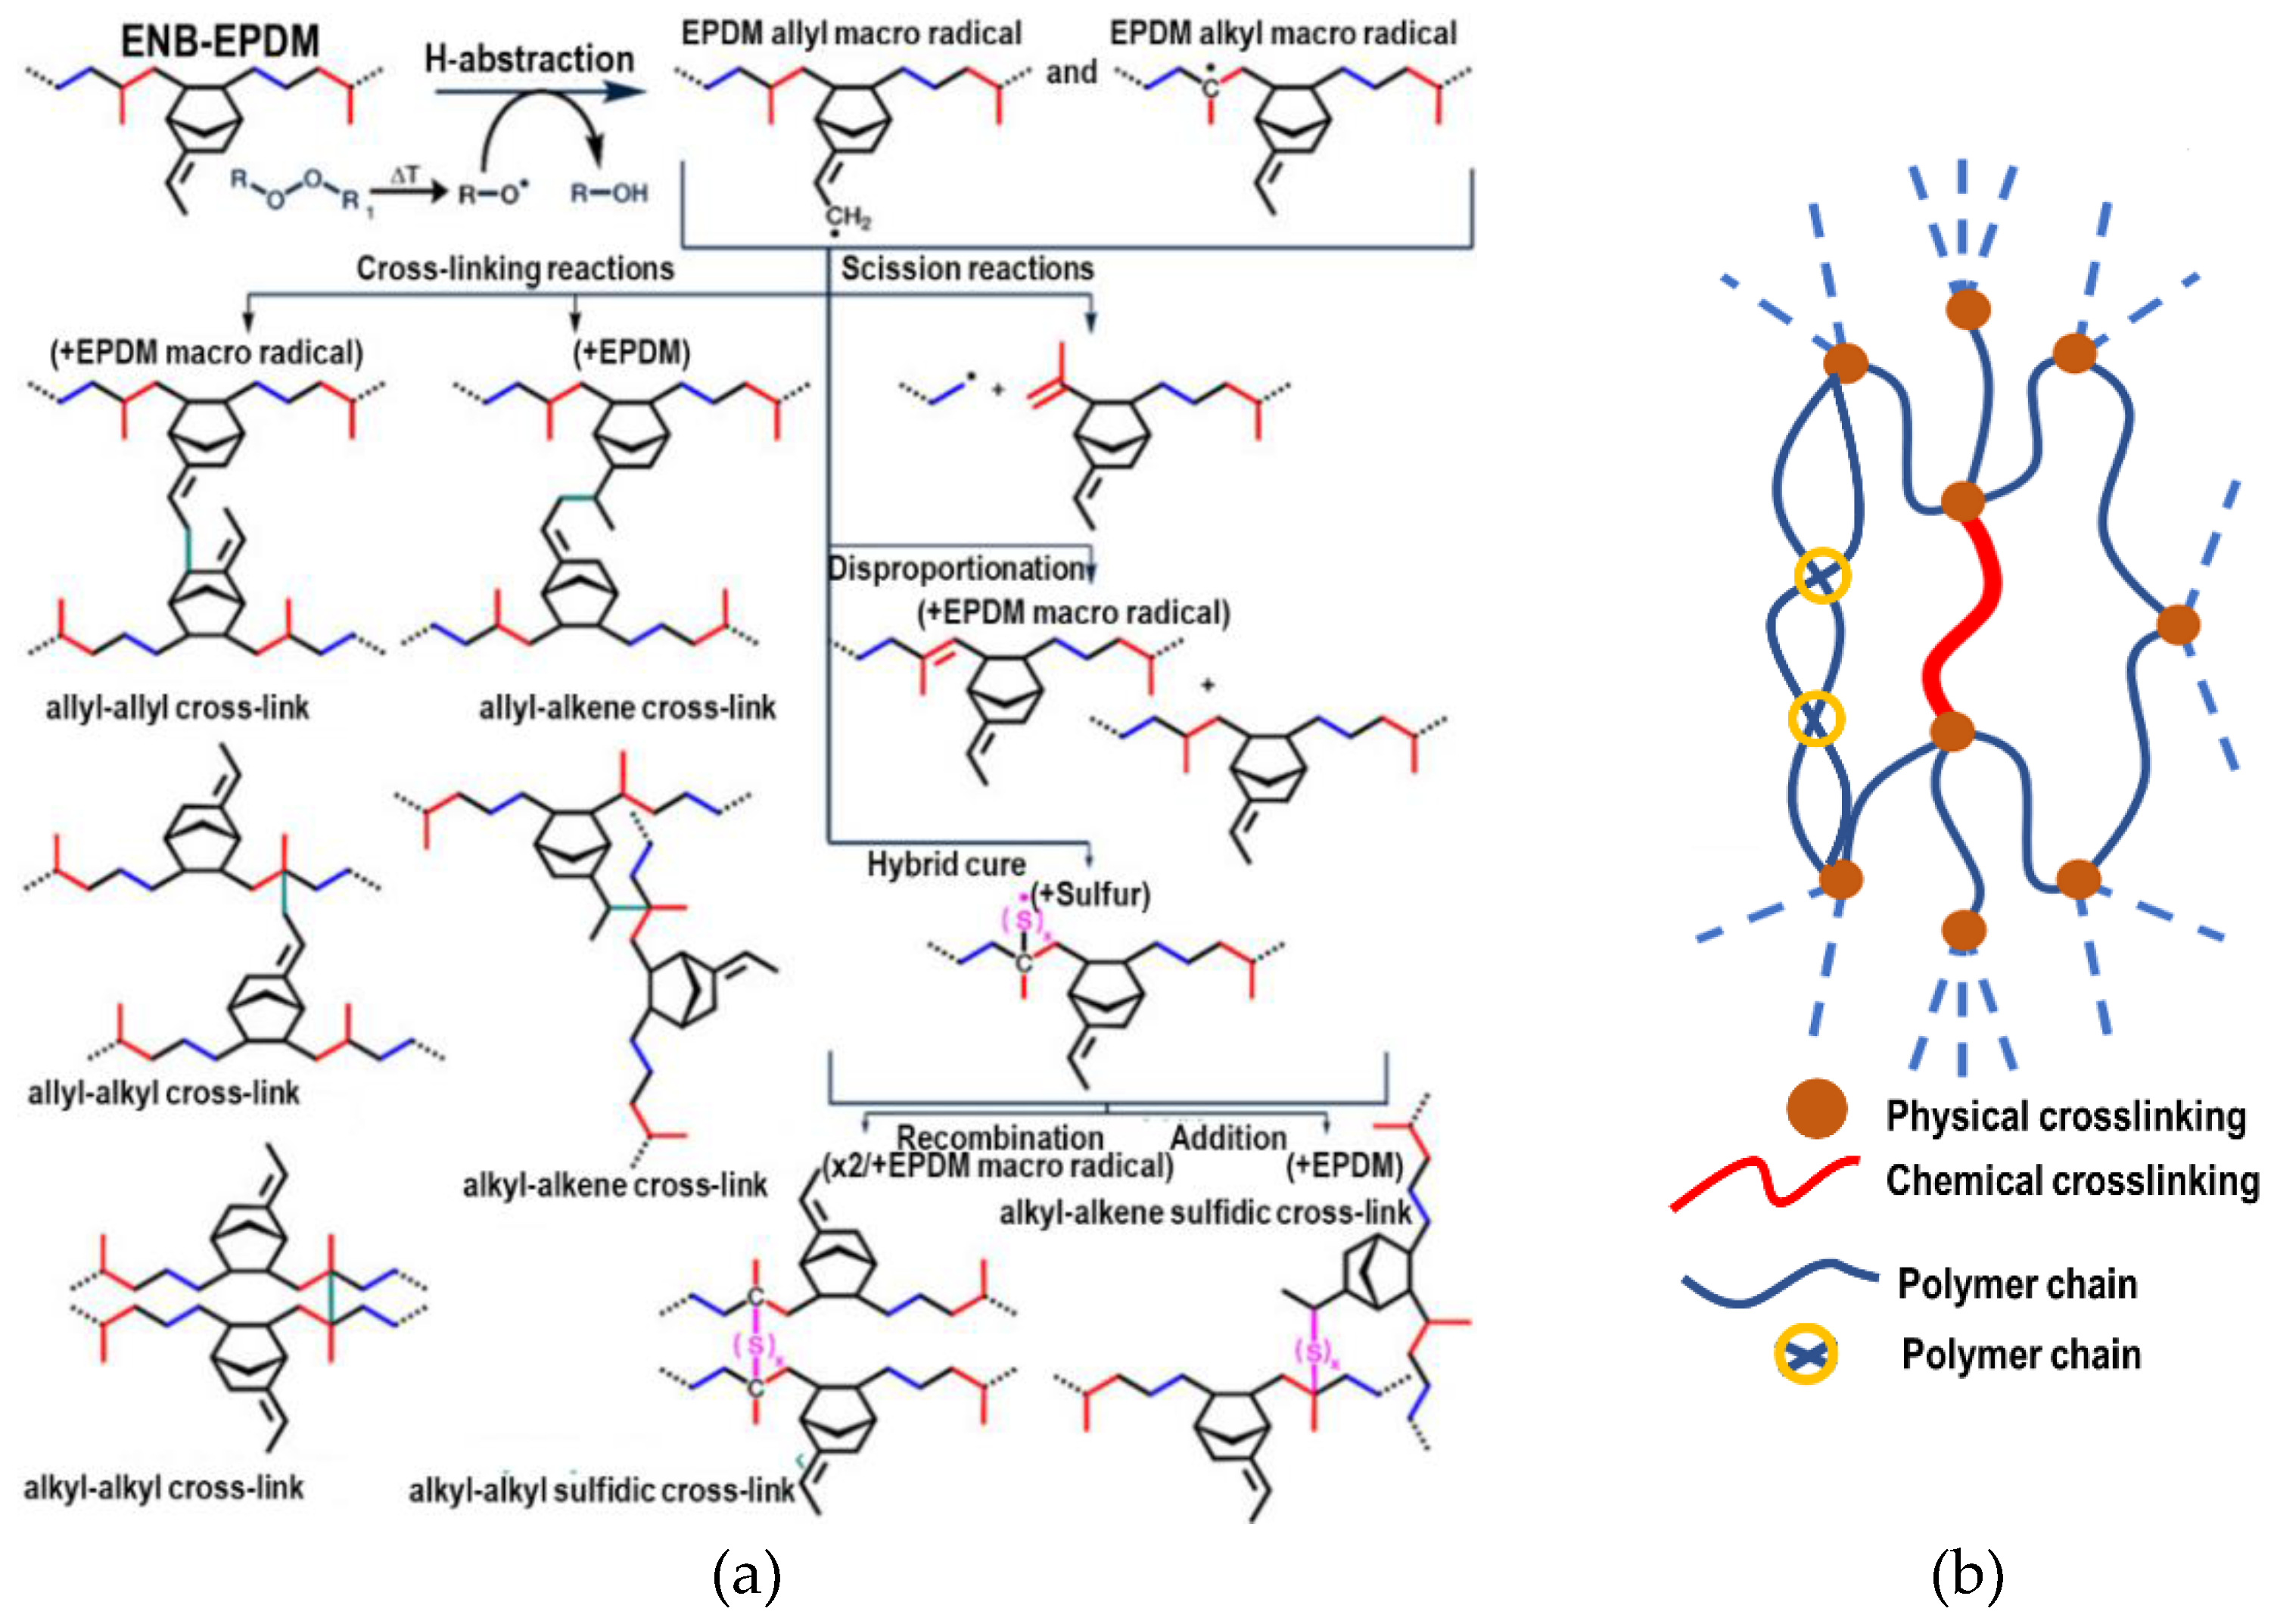
Figure 3.
Procedure for molecular dynamics simulation.
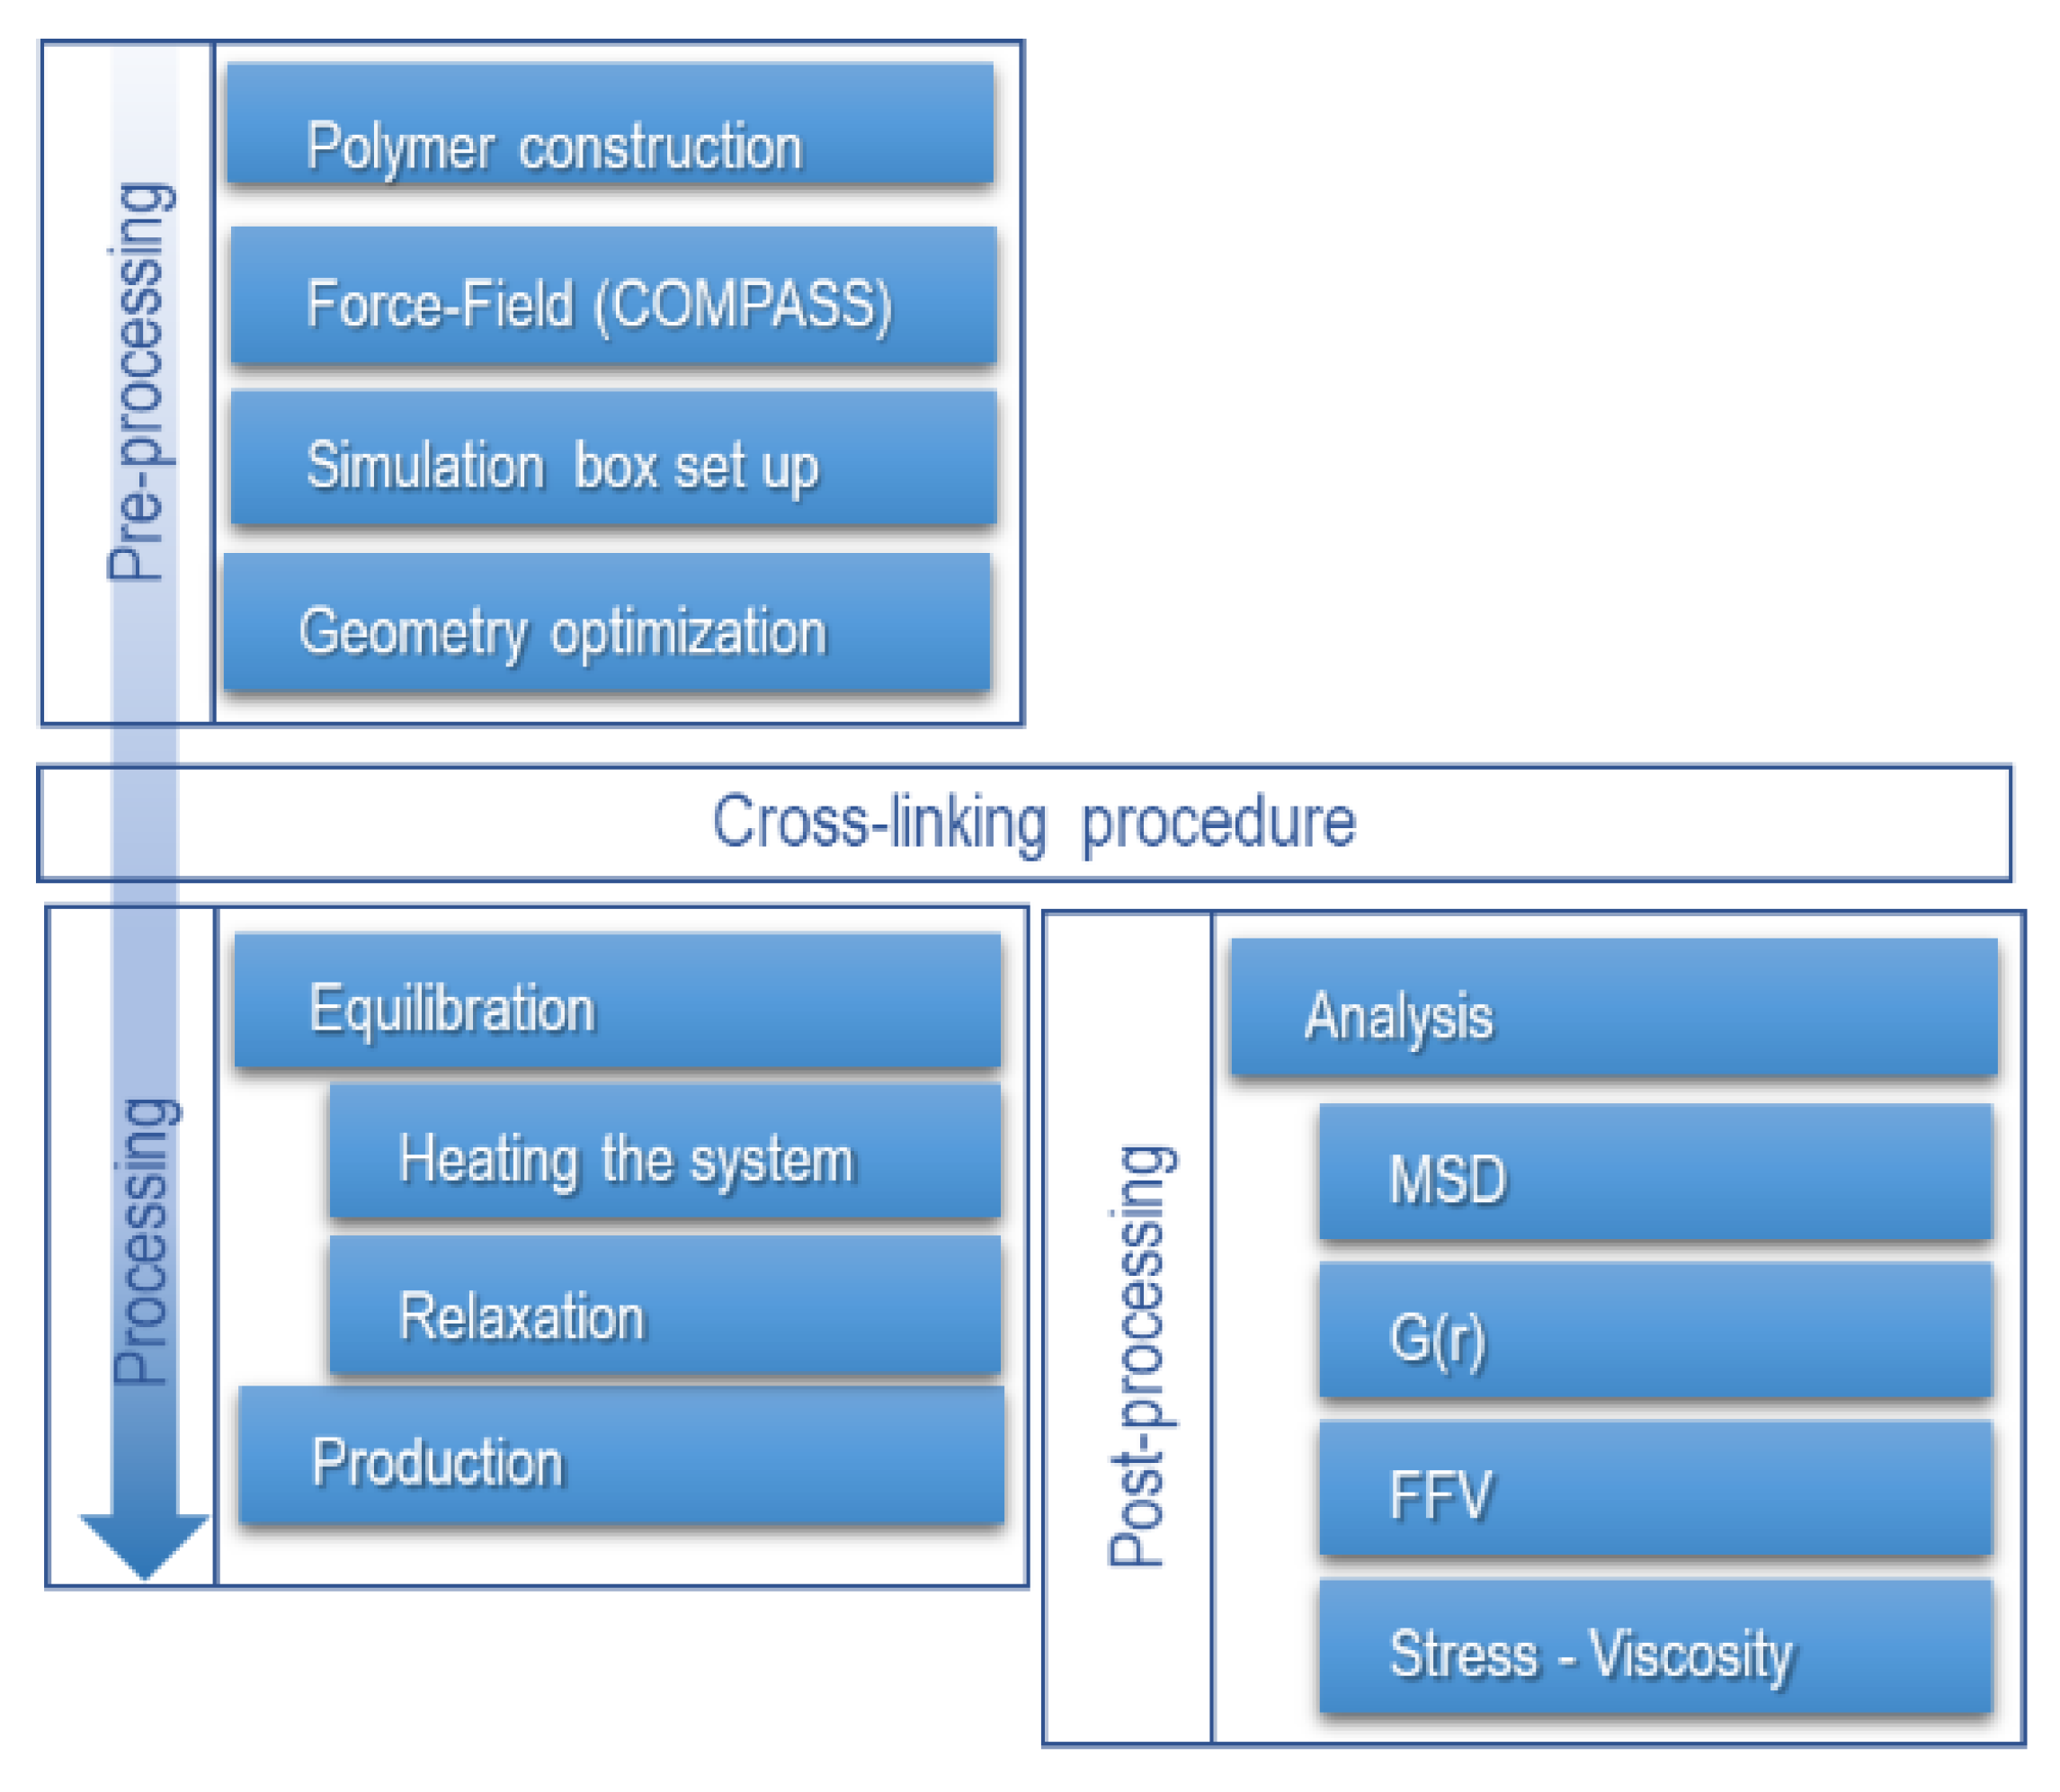
Figure 4.
Procedure for molecular dynamics simulation. (b) Flowchart of the cross-linking procedure.
Figure 4.
Procedure for molecular dynamics simulation. (b) Flowchart of the cross-linking procedure.
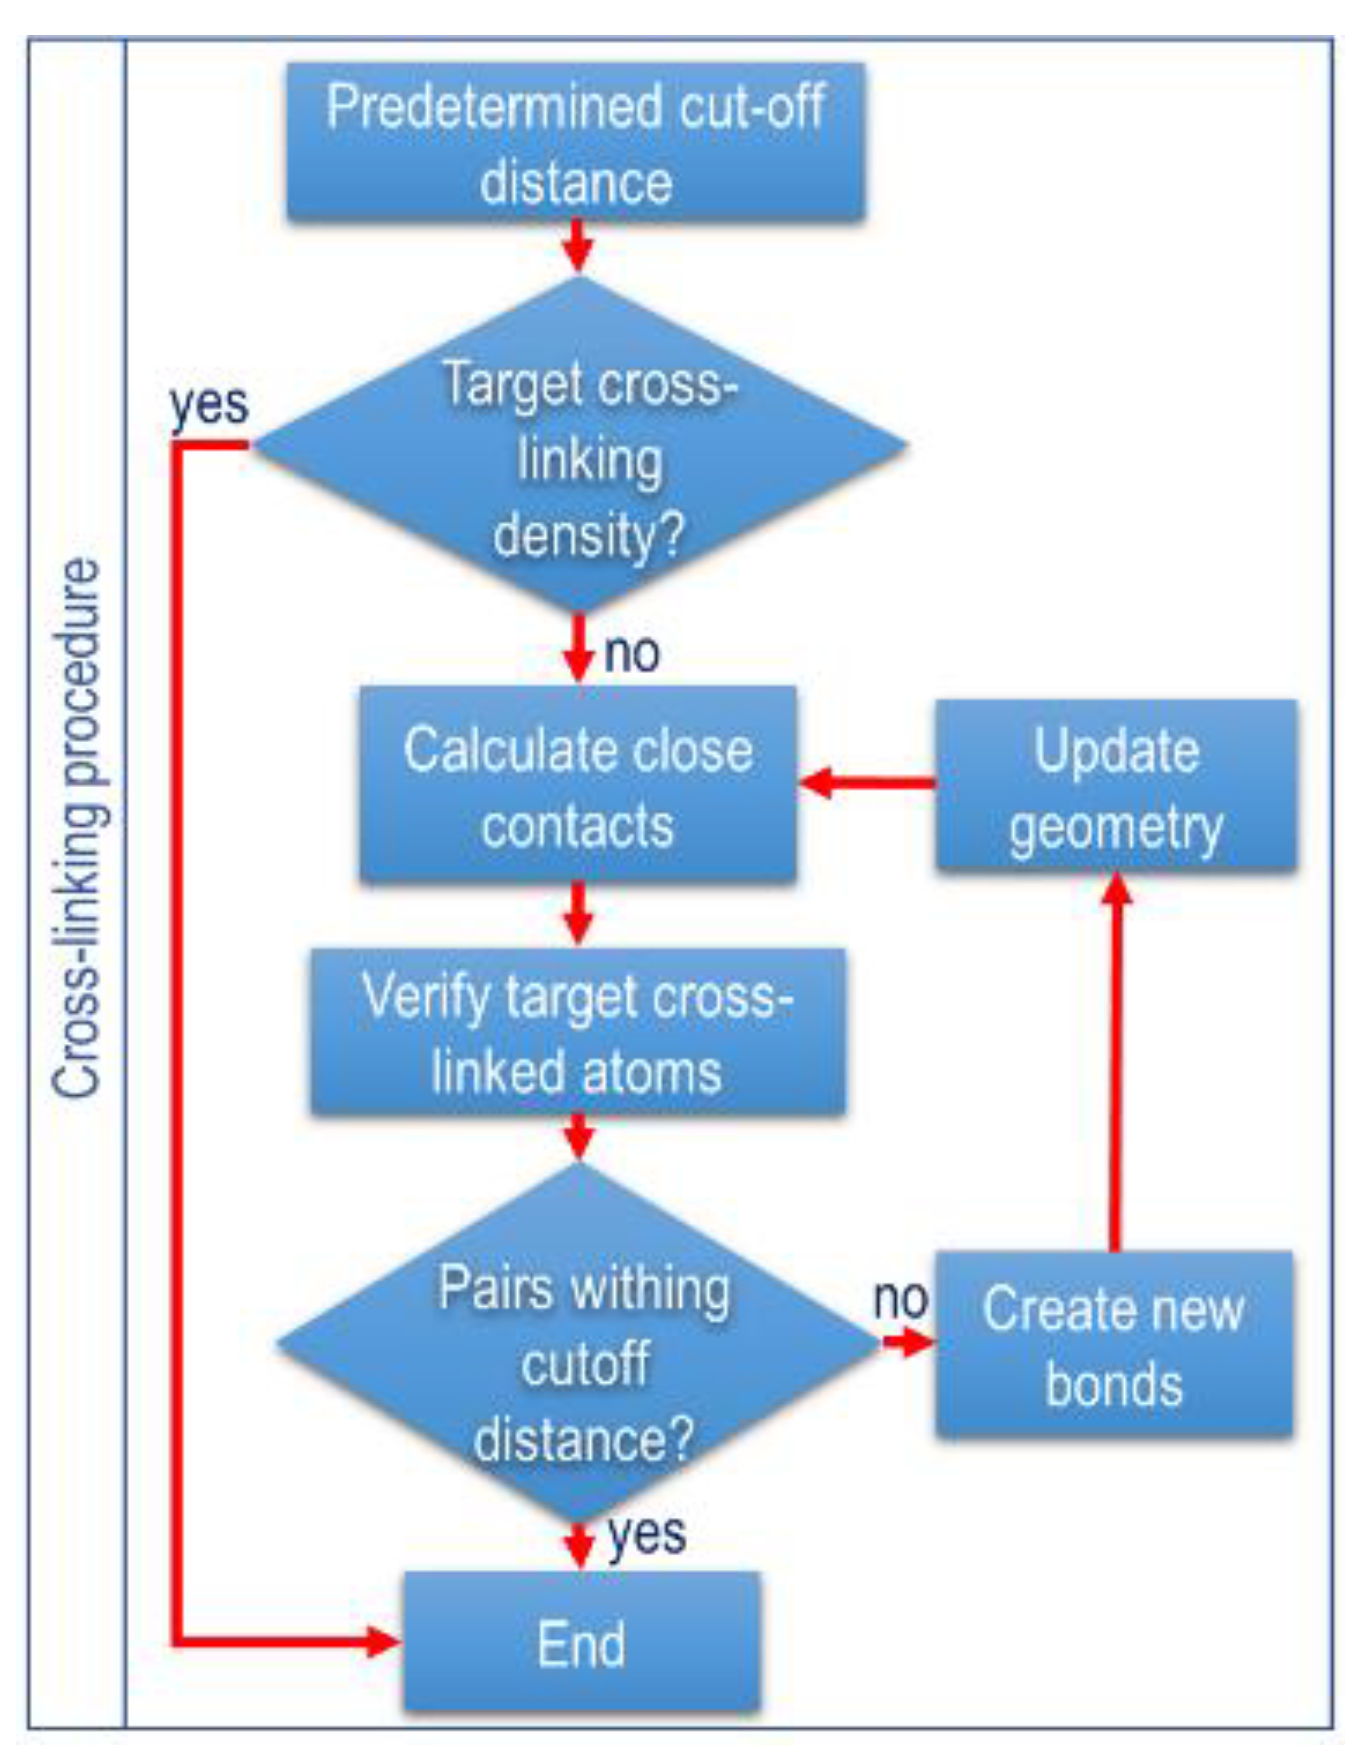
Figure 5.
(a) Mean square displacement results. (b) Slope for mean square displacement normalized.
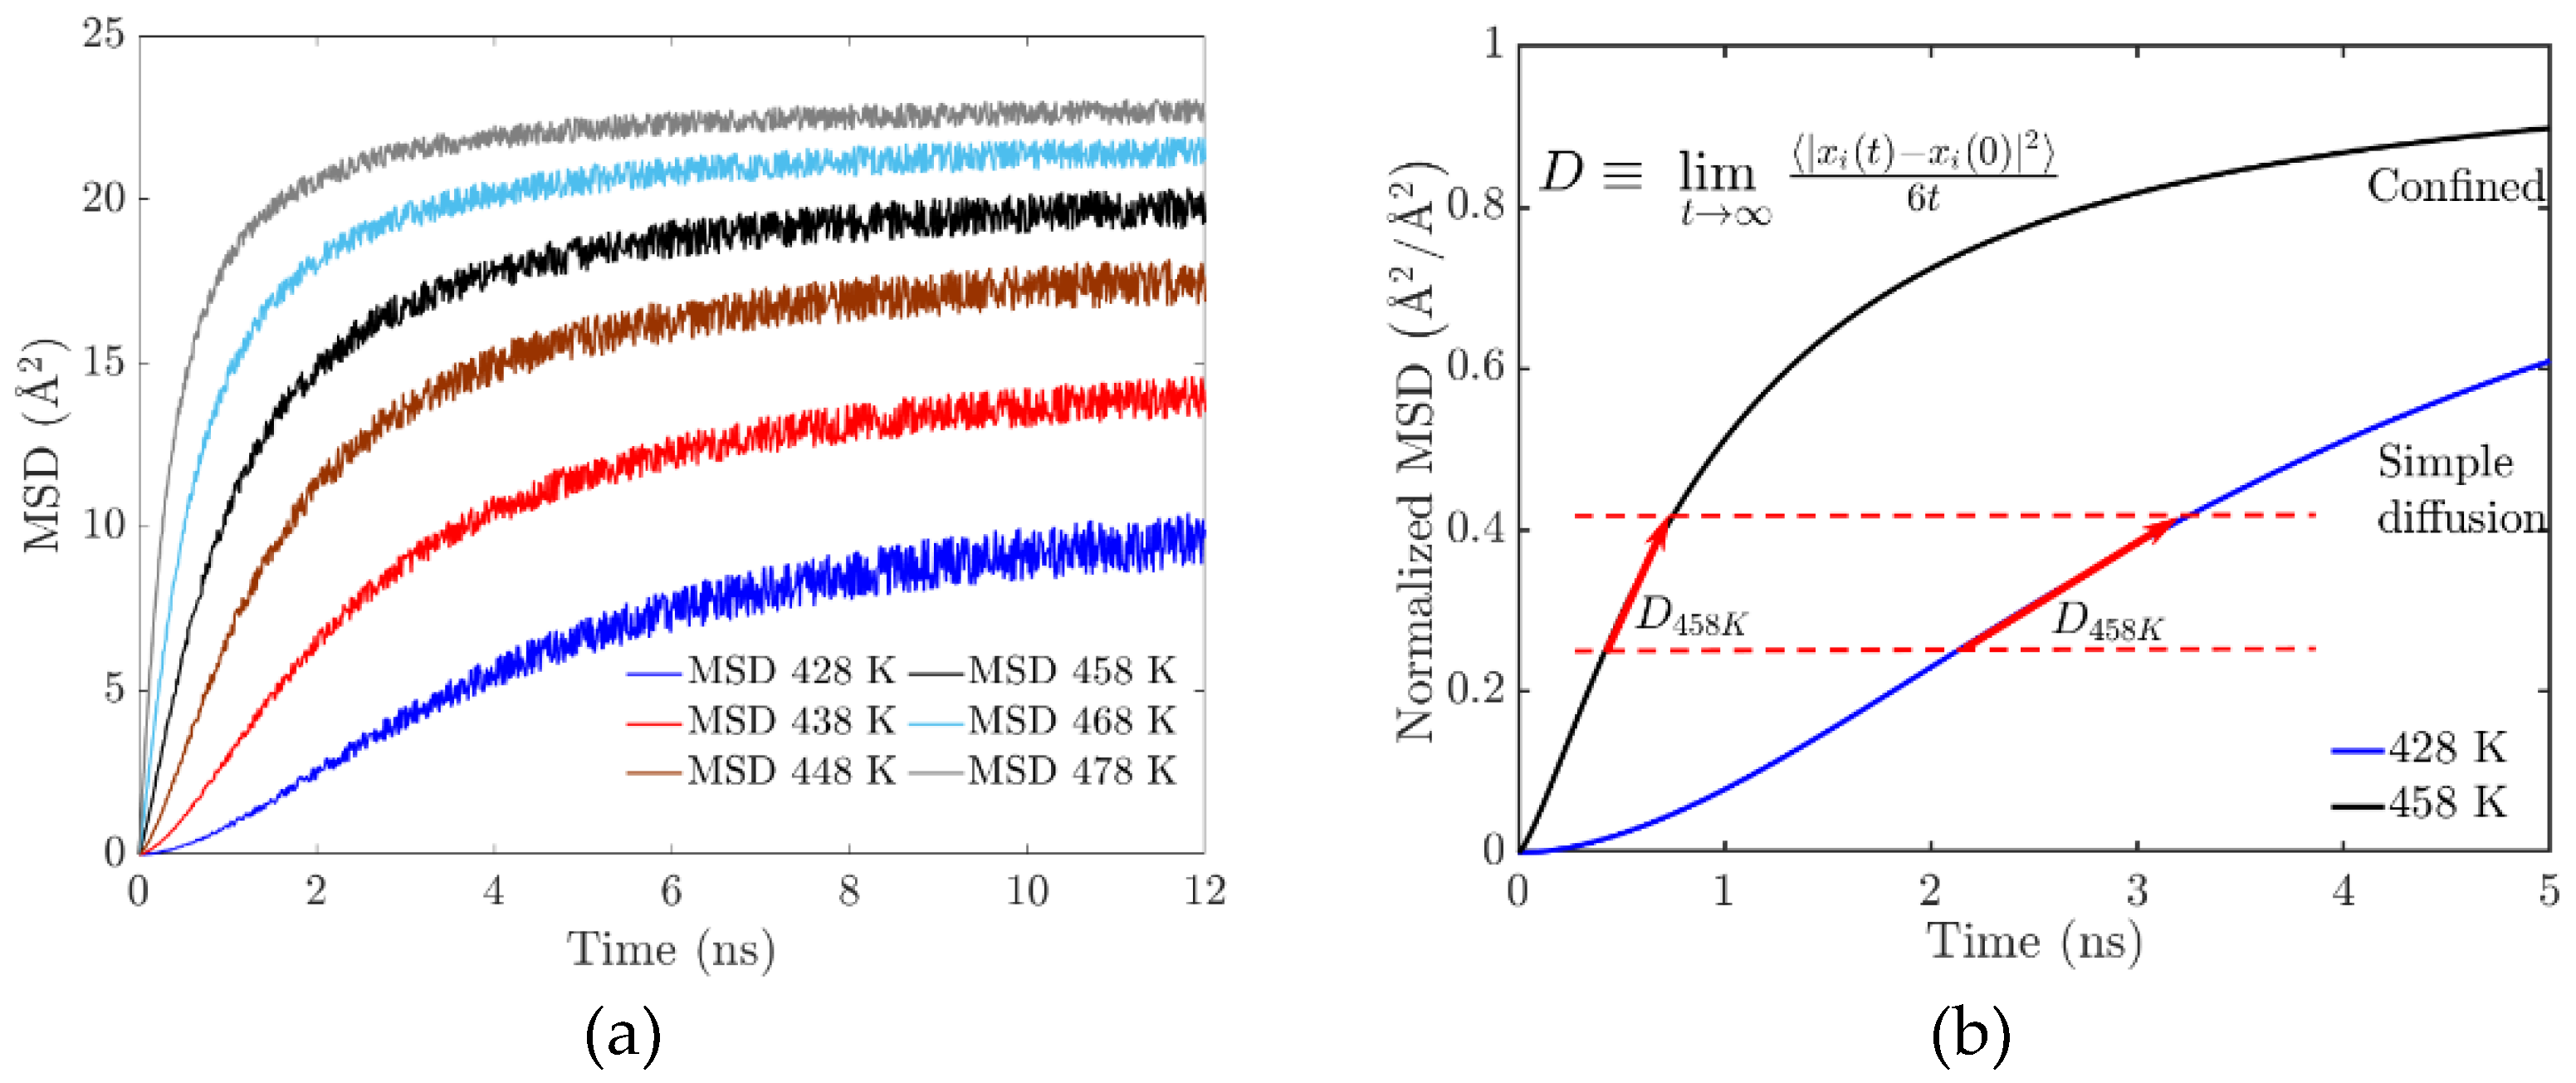
Figure 7.
– (a) End-to-end configuration at different temperatures. (b). Evolution of main chain end-to-end distance with maximum and minimum temperatures.
Figure 7.
– (a) End-to-end configuration at different temperatures. (b). Evolution of main chain end-to-end distance with maximum and minimum temperatures.
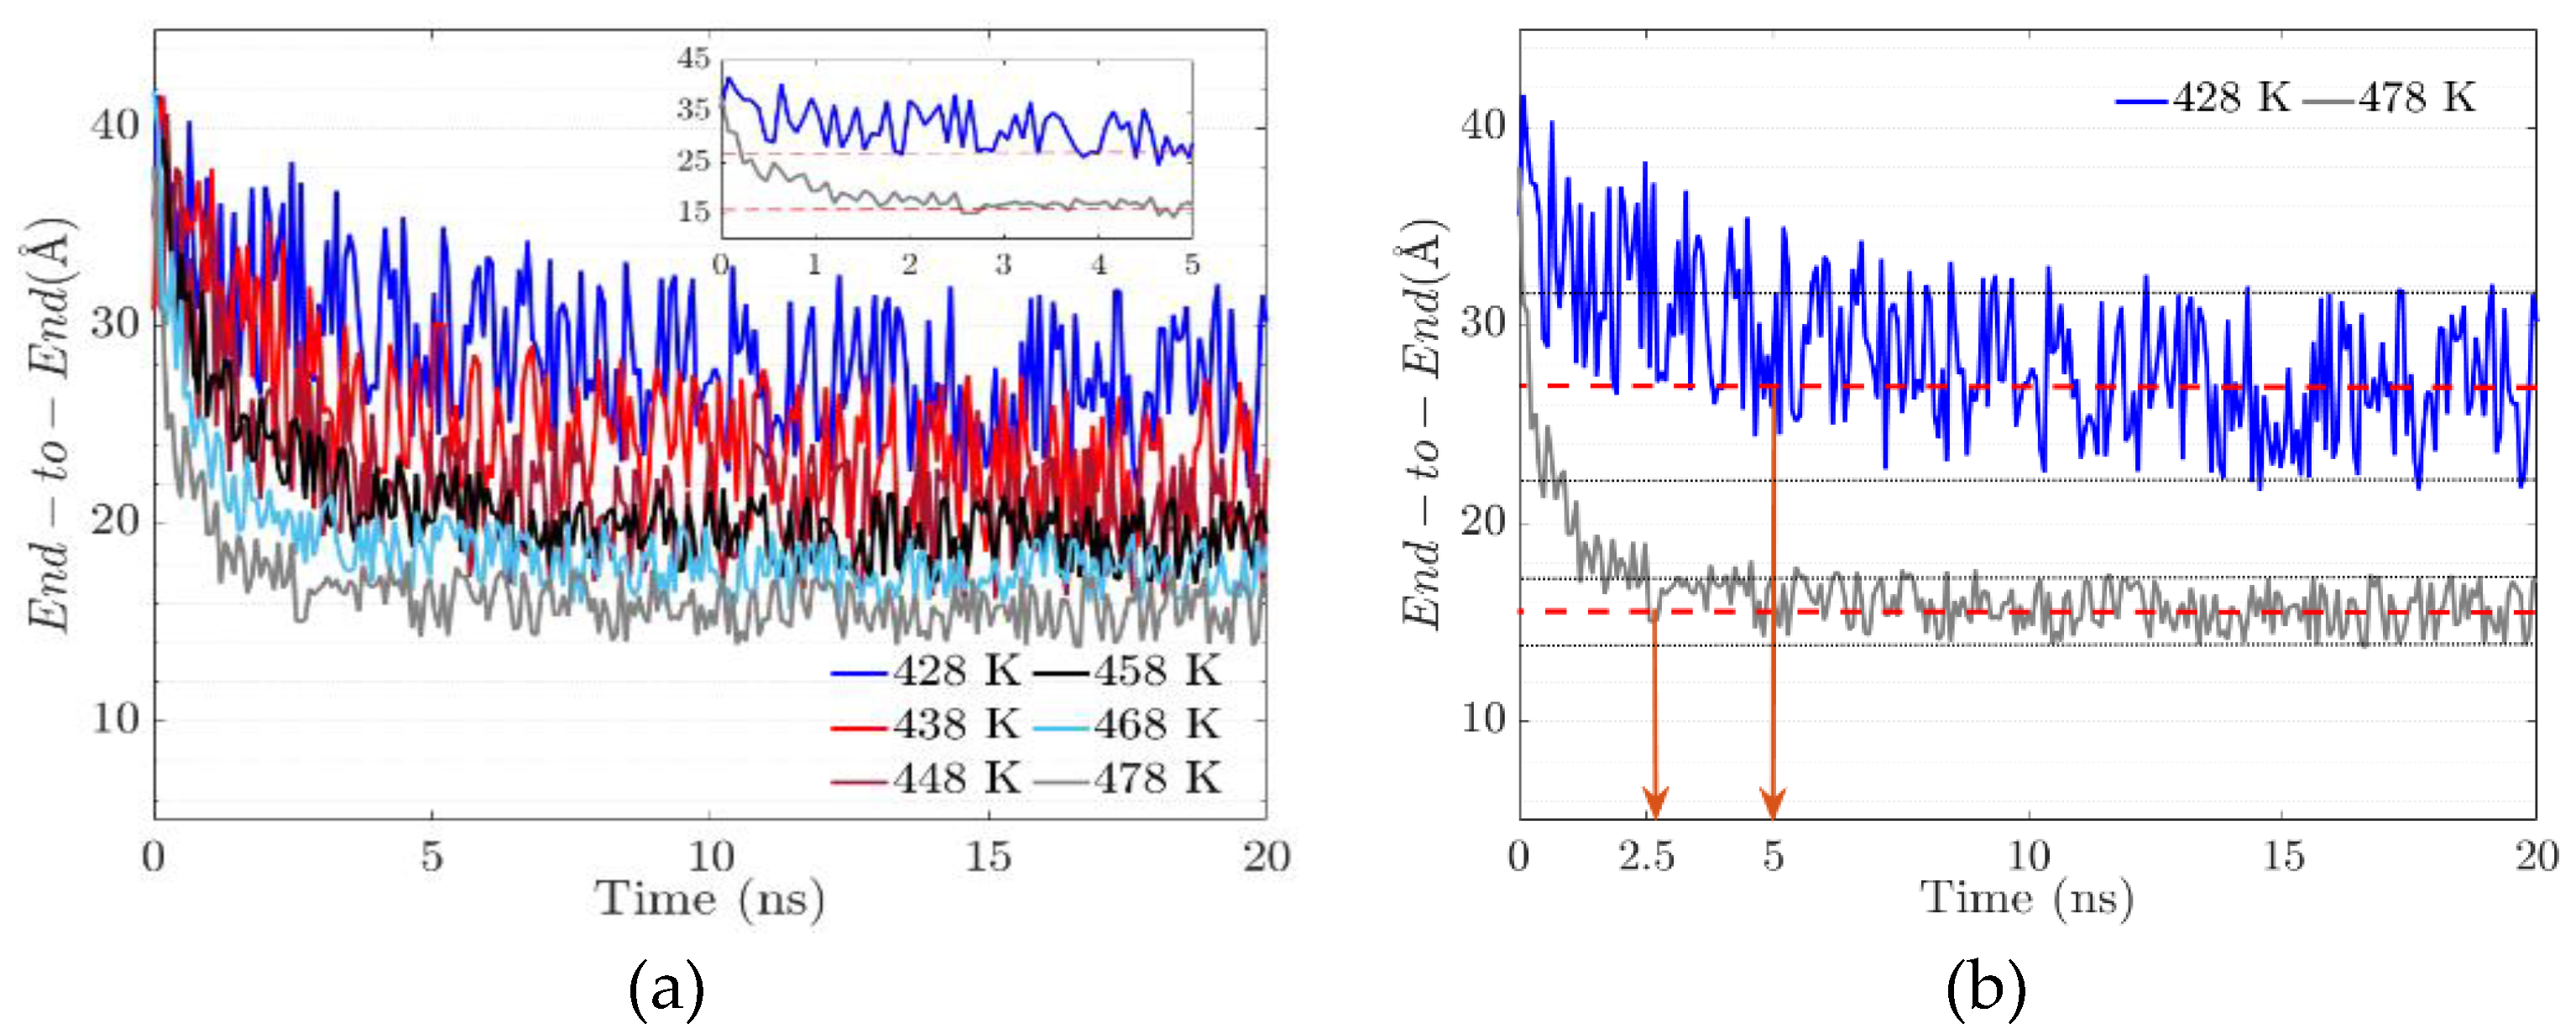
Figure 8.
– (a) Radial Distribution Schematic (b) Radial distribution function (or pair correlation function).
Figure 8.
– (a) Radial Distribution Schematic (b) Radial distribution function (or pair correlation function).
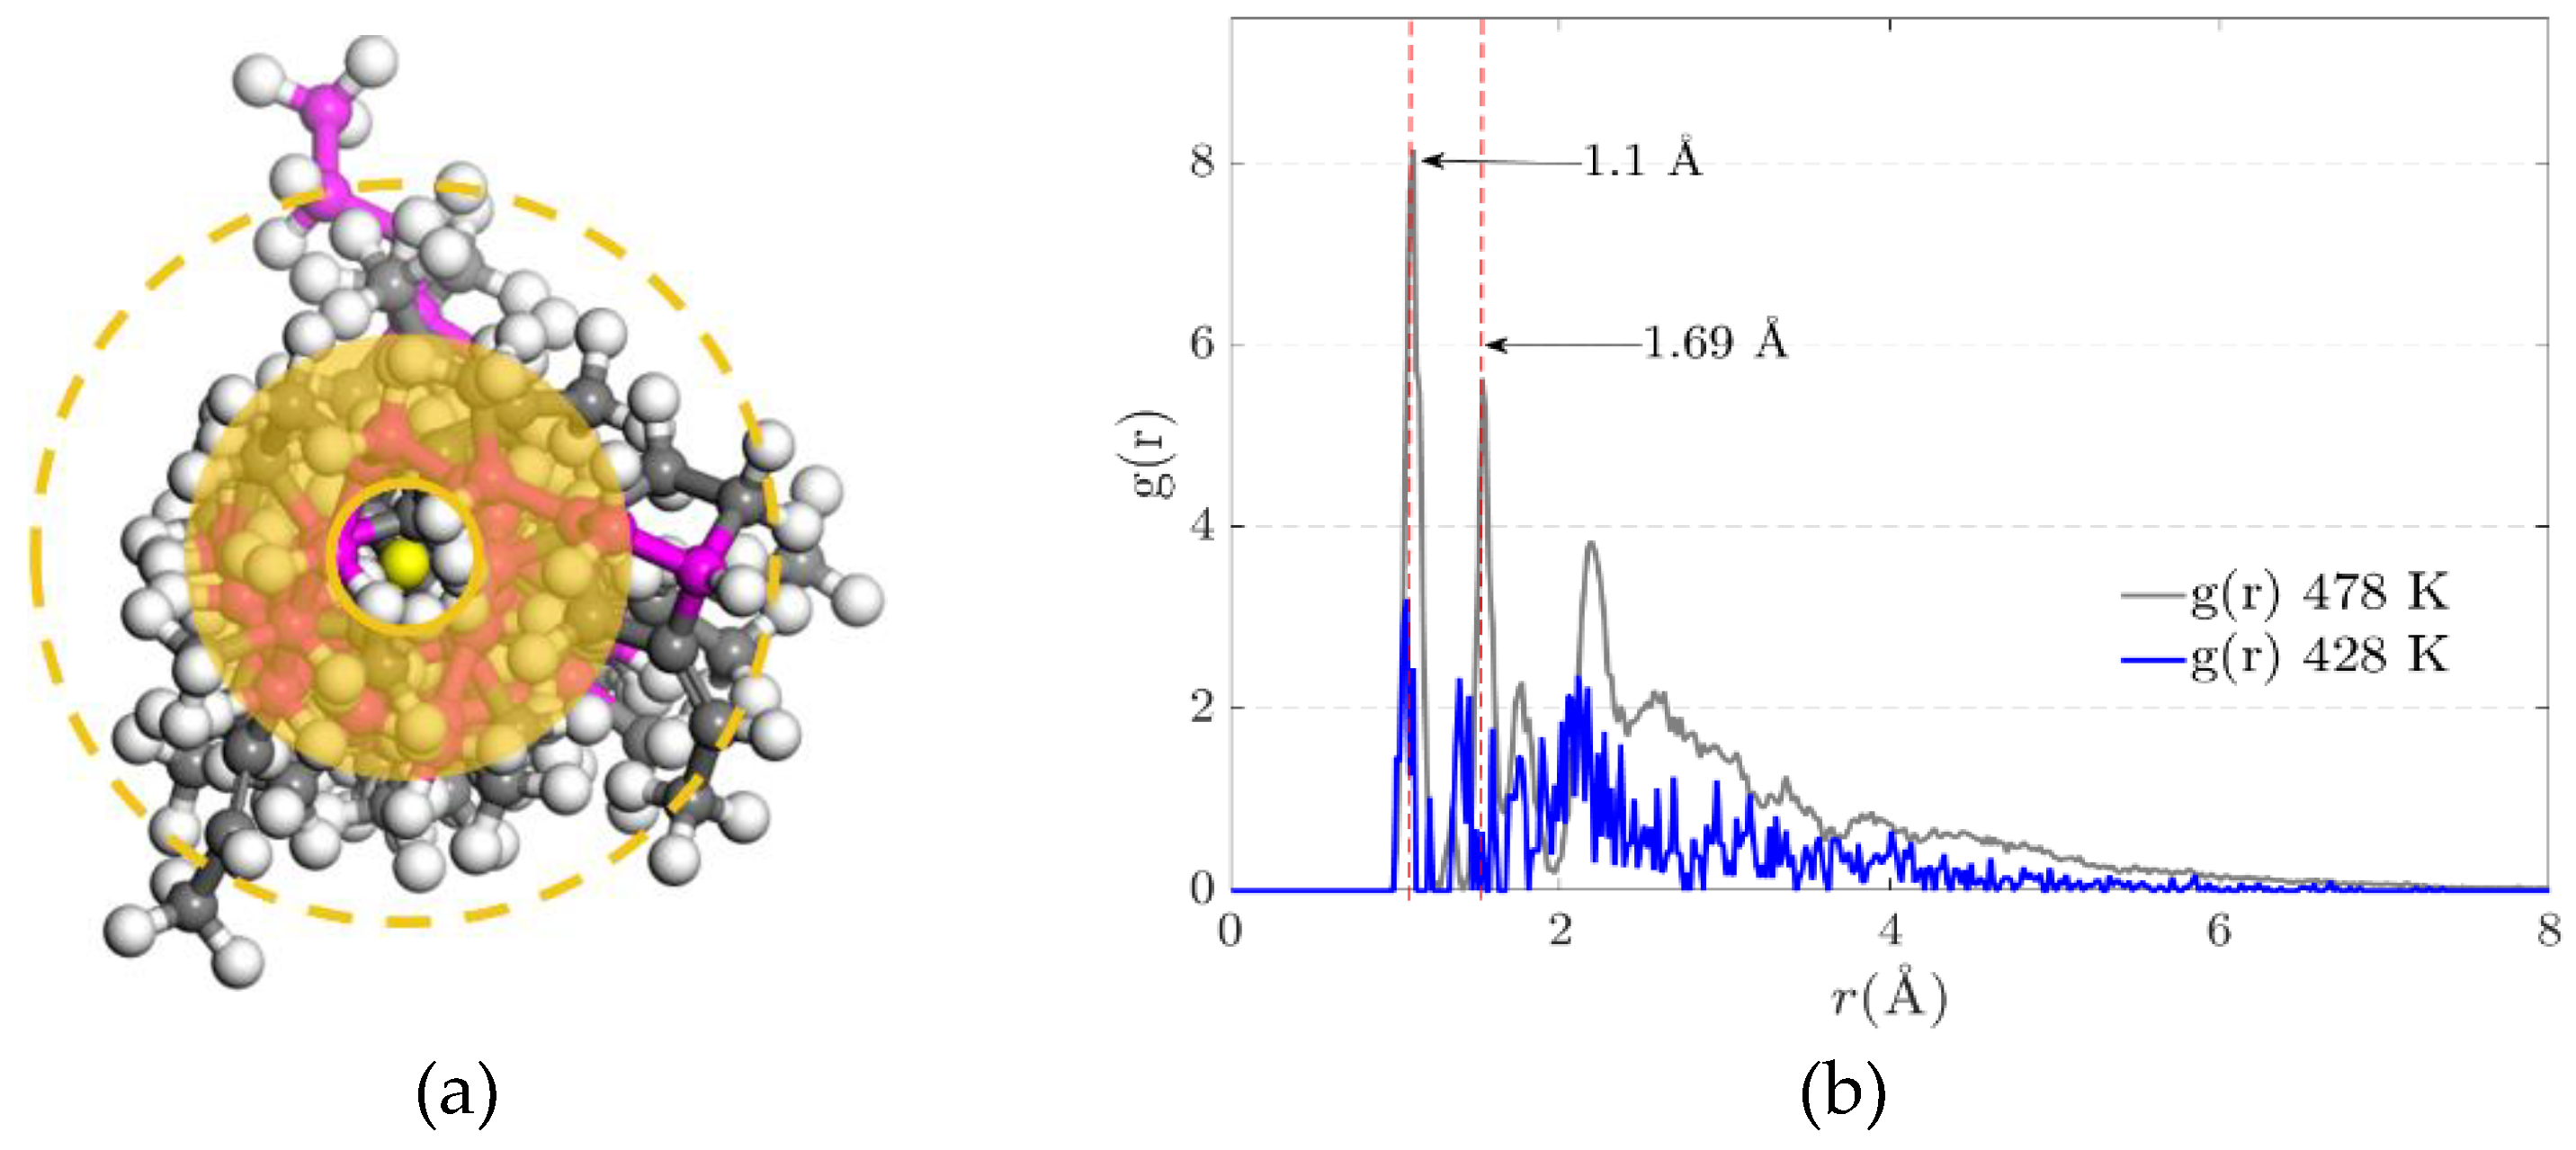
Figure 9.
– (a) Free volume morphology of EPDM at 428 K and (b) FFV morphology of EPDM at 478 K.
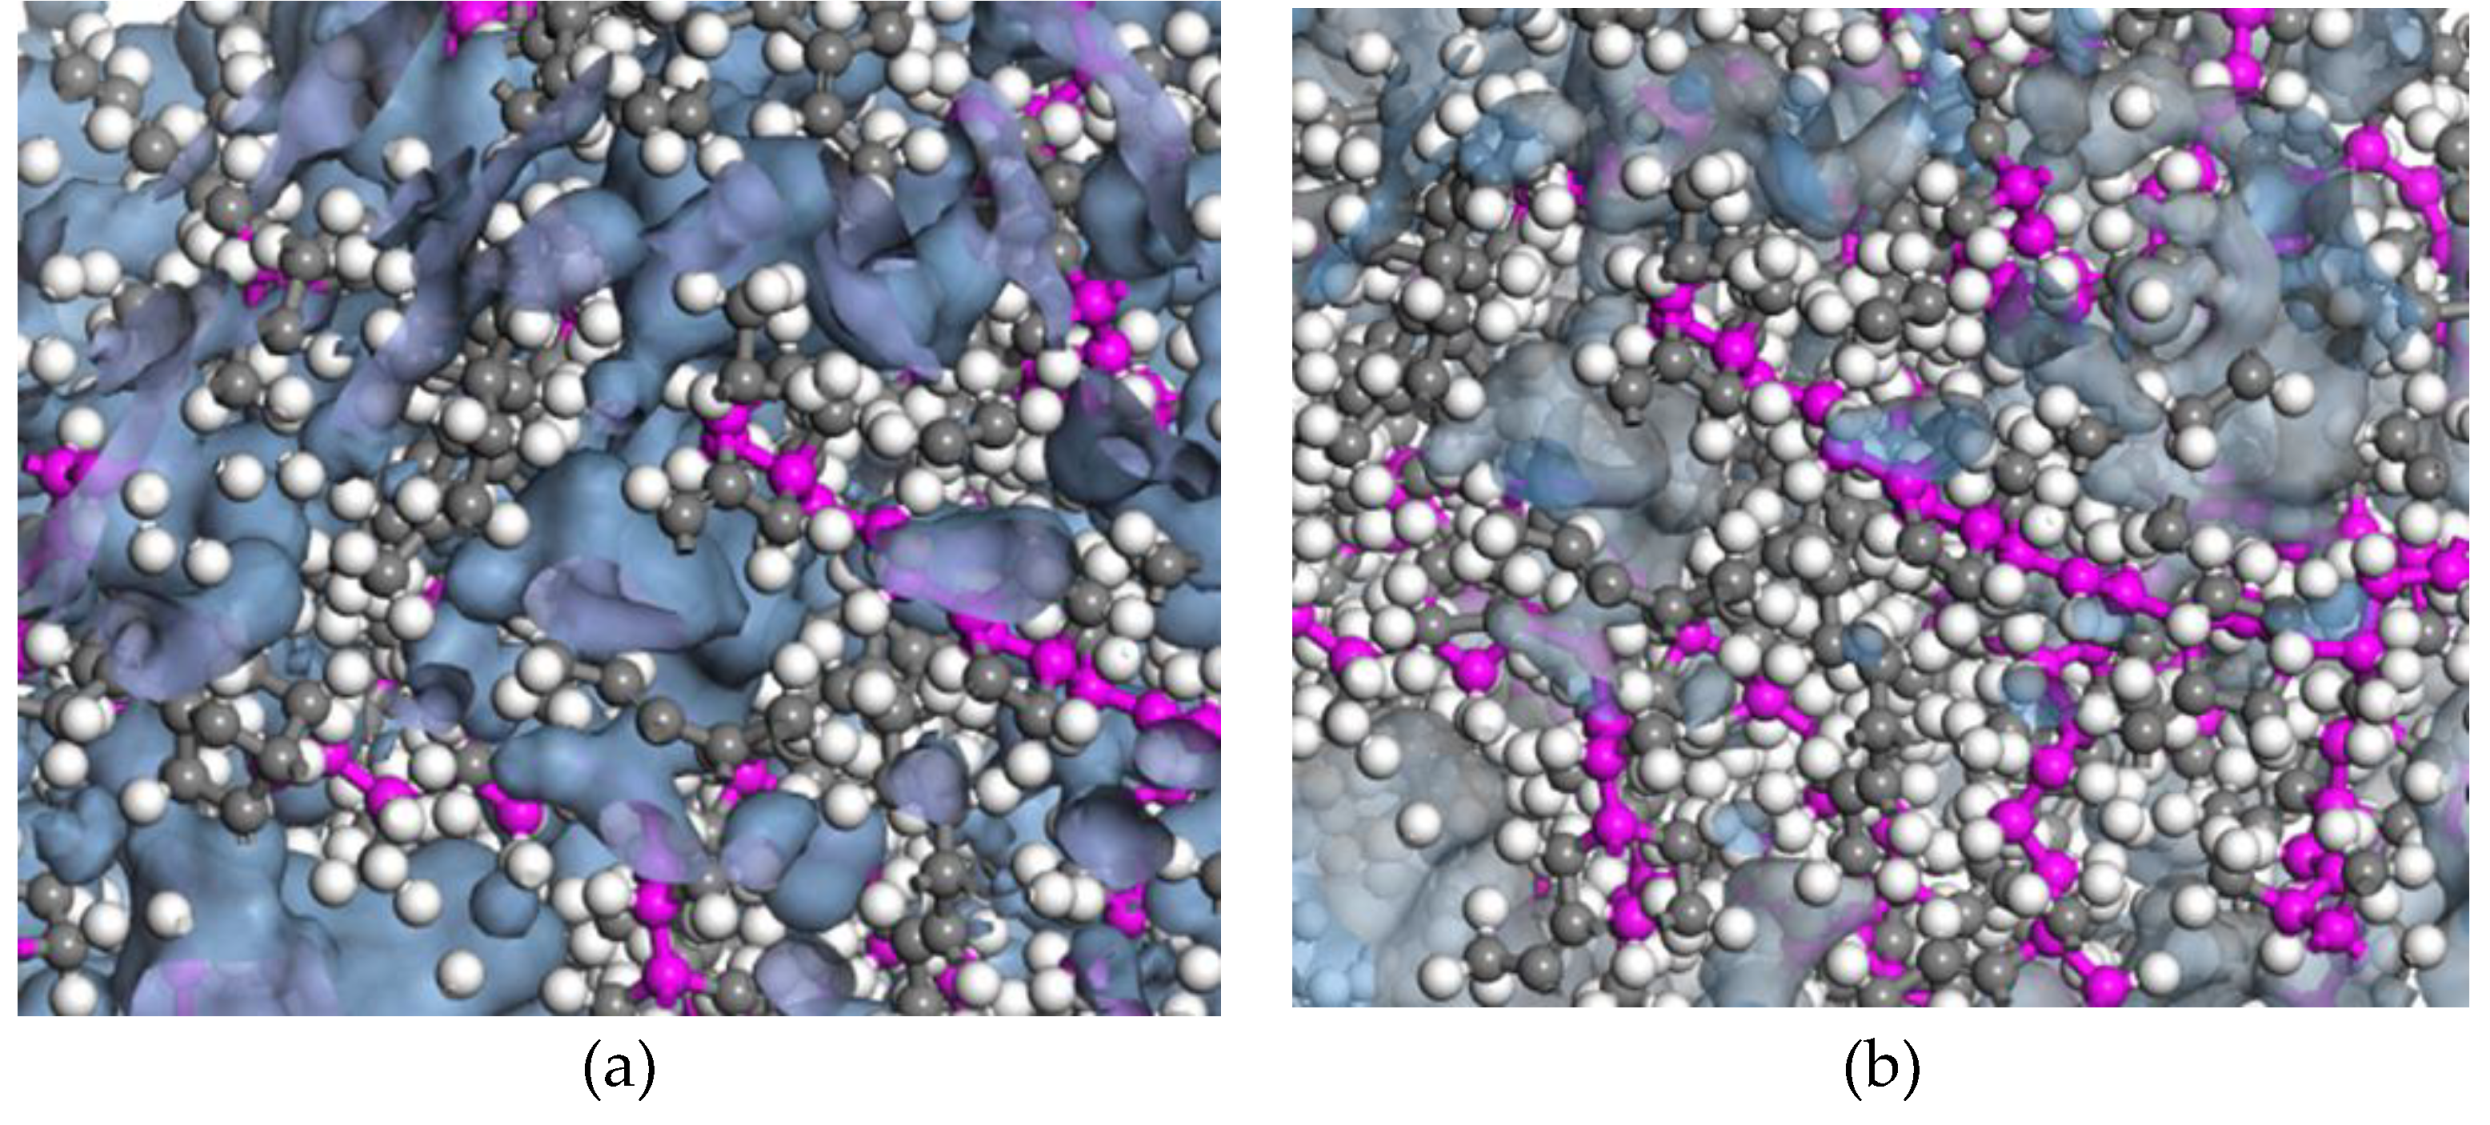
Figure 10.
– Simulation time dependence on viscosity and stress. (a) at 428 K. (b): (a) at 428 K and (b) at 478 K.
Figure 10.
– Simulation time dependence on viscosity and stress. (a) at 428 K. (b): (a) at 428 K and (b) at 478 K.
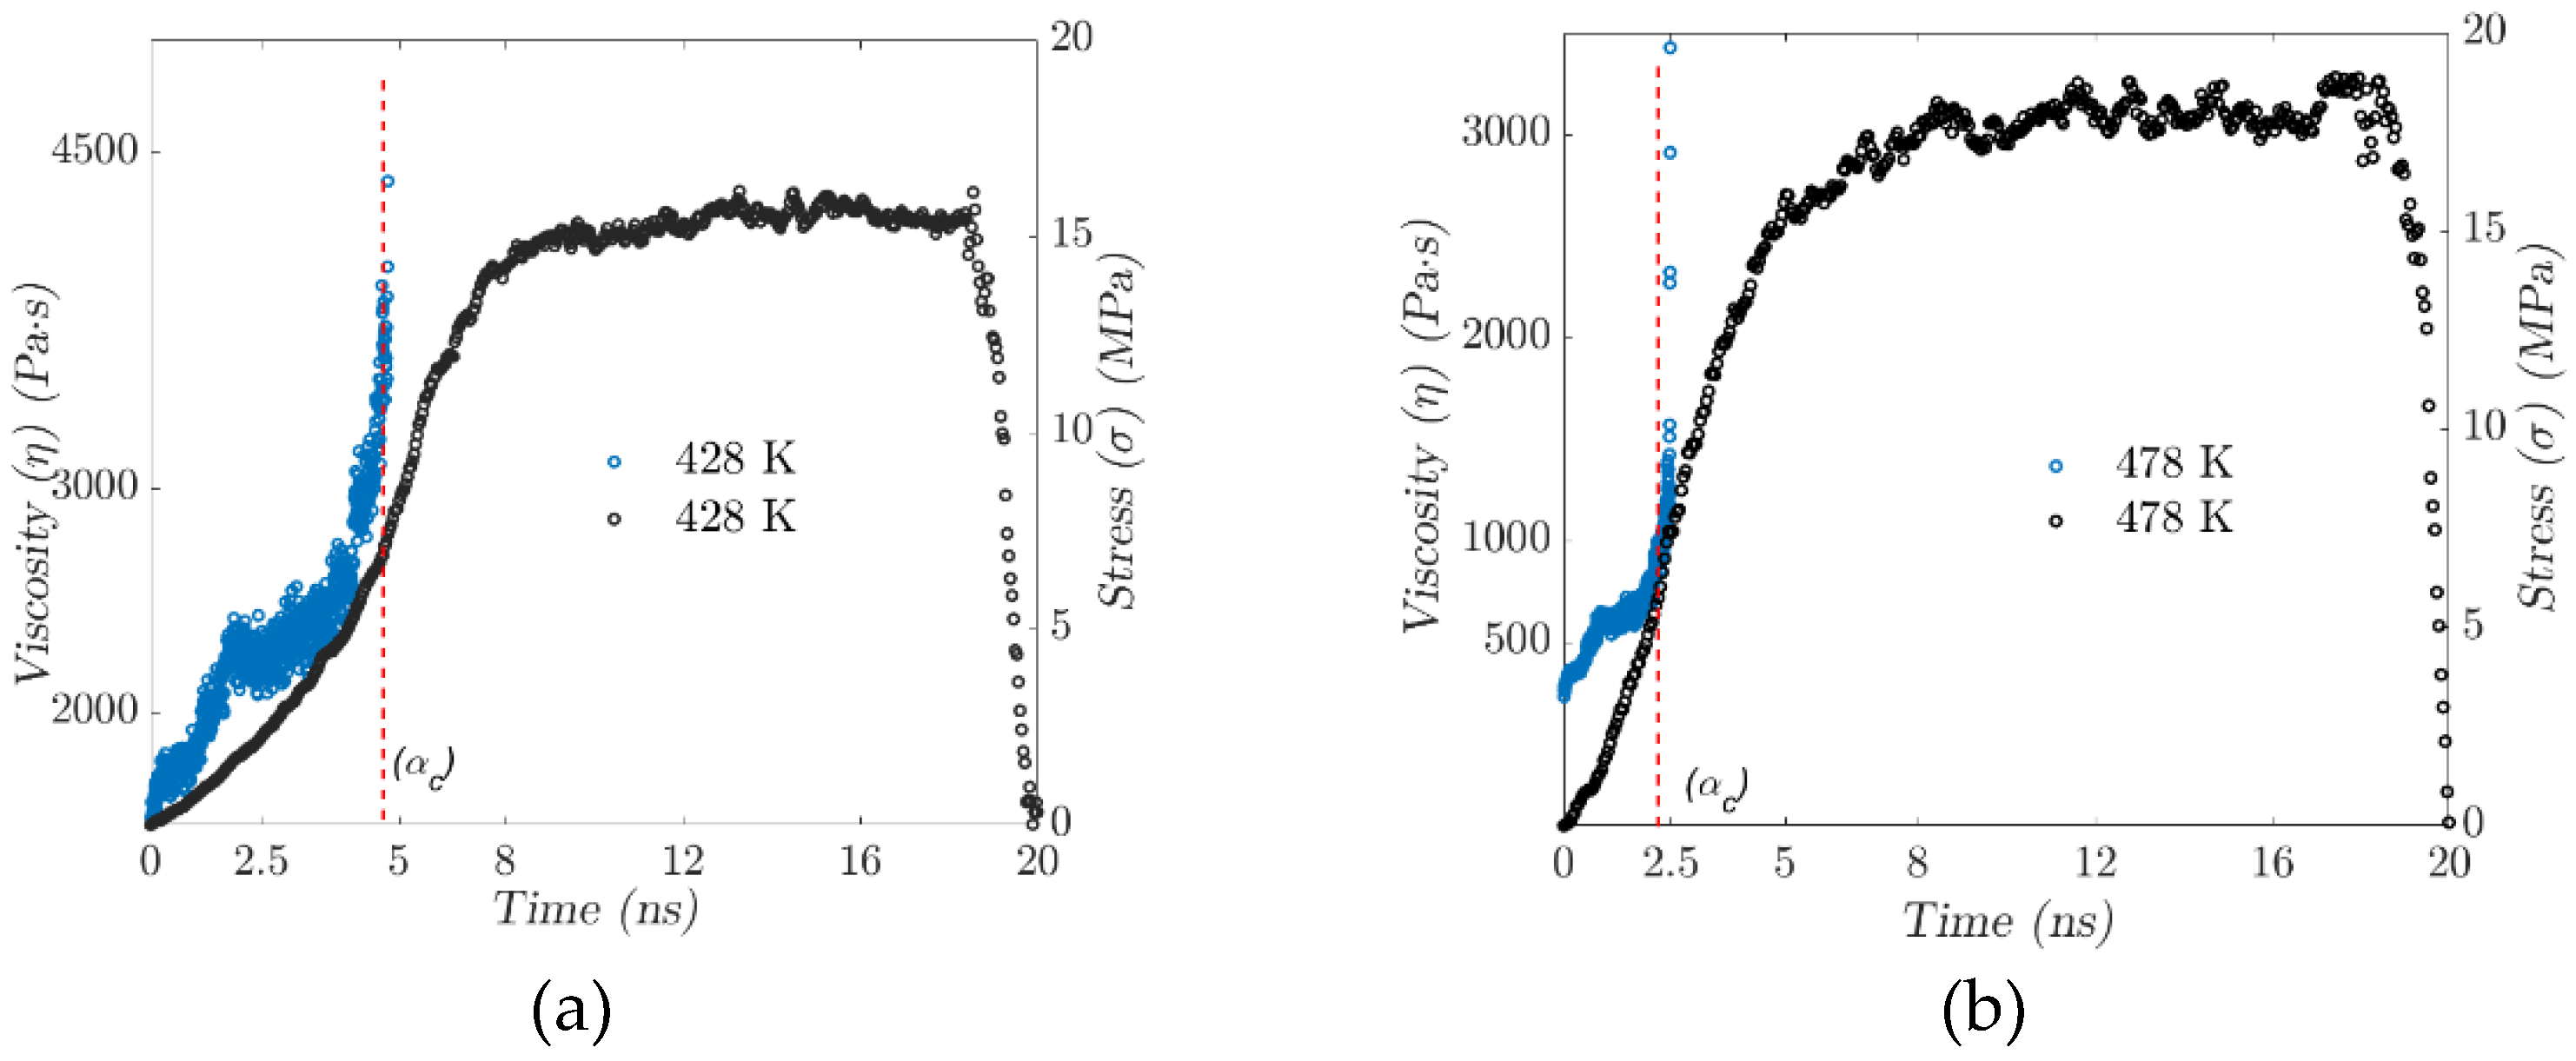
Figure 11.
– (a) Volume fraction distribution versus temperature. (b) Critical phase transition behavior window.
Figure 11.
– (a) Volume fraction distribution versus temperature. (b) Critical phase transition behavior window.
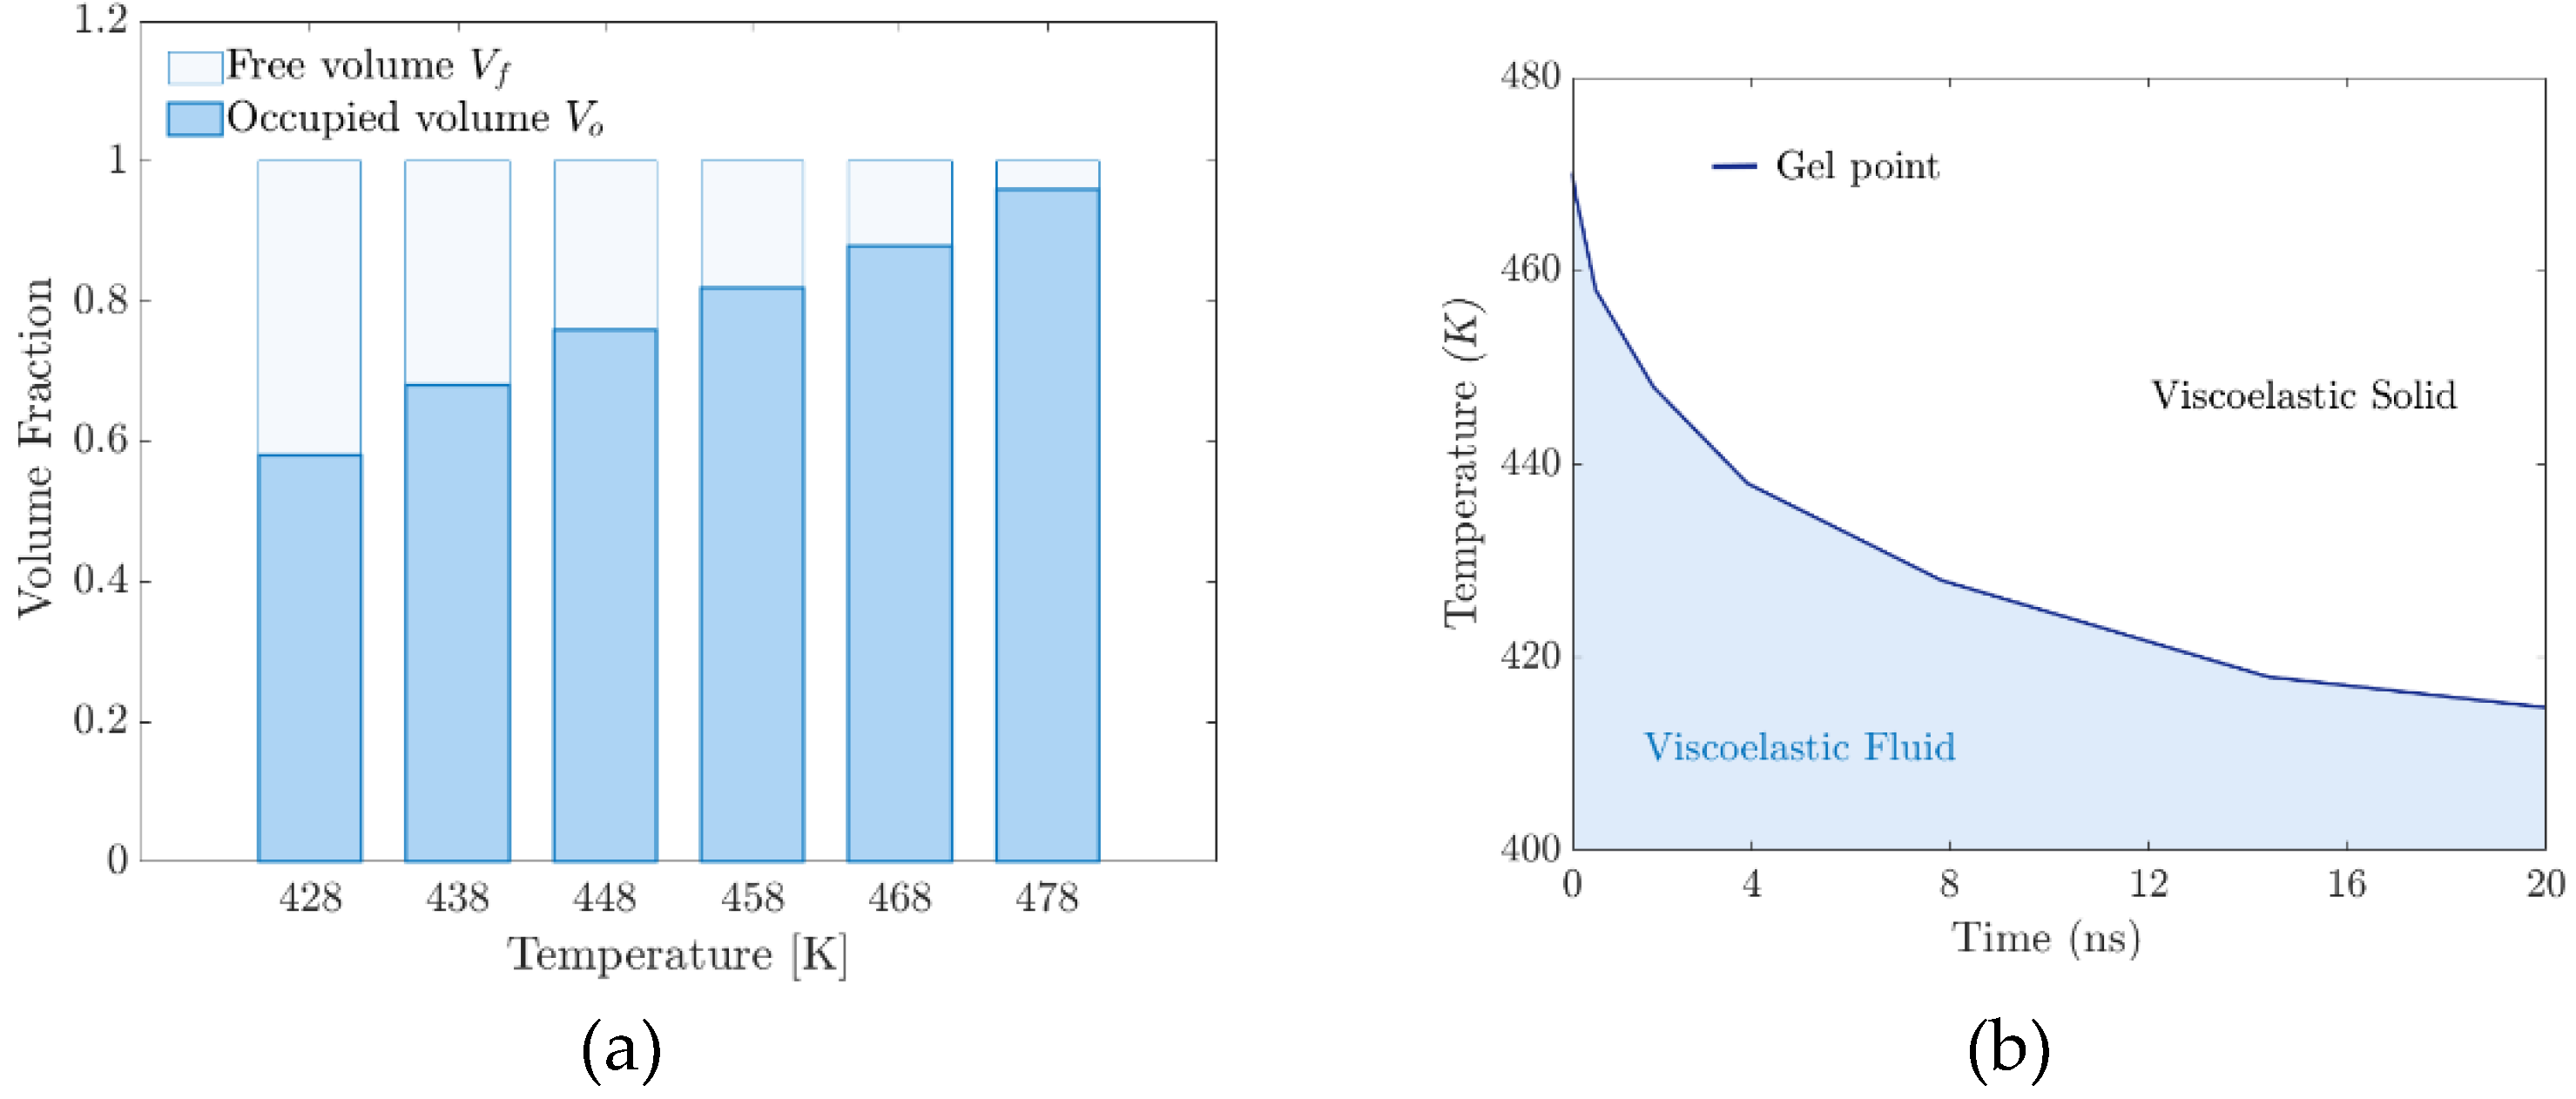
Figure 12.
– Testing of an injection-moulded door grommet for automotive applications.
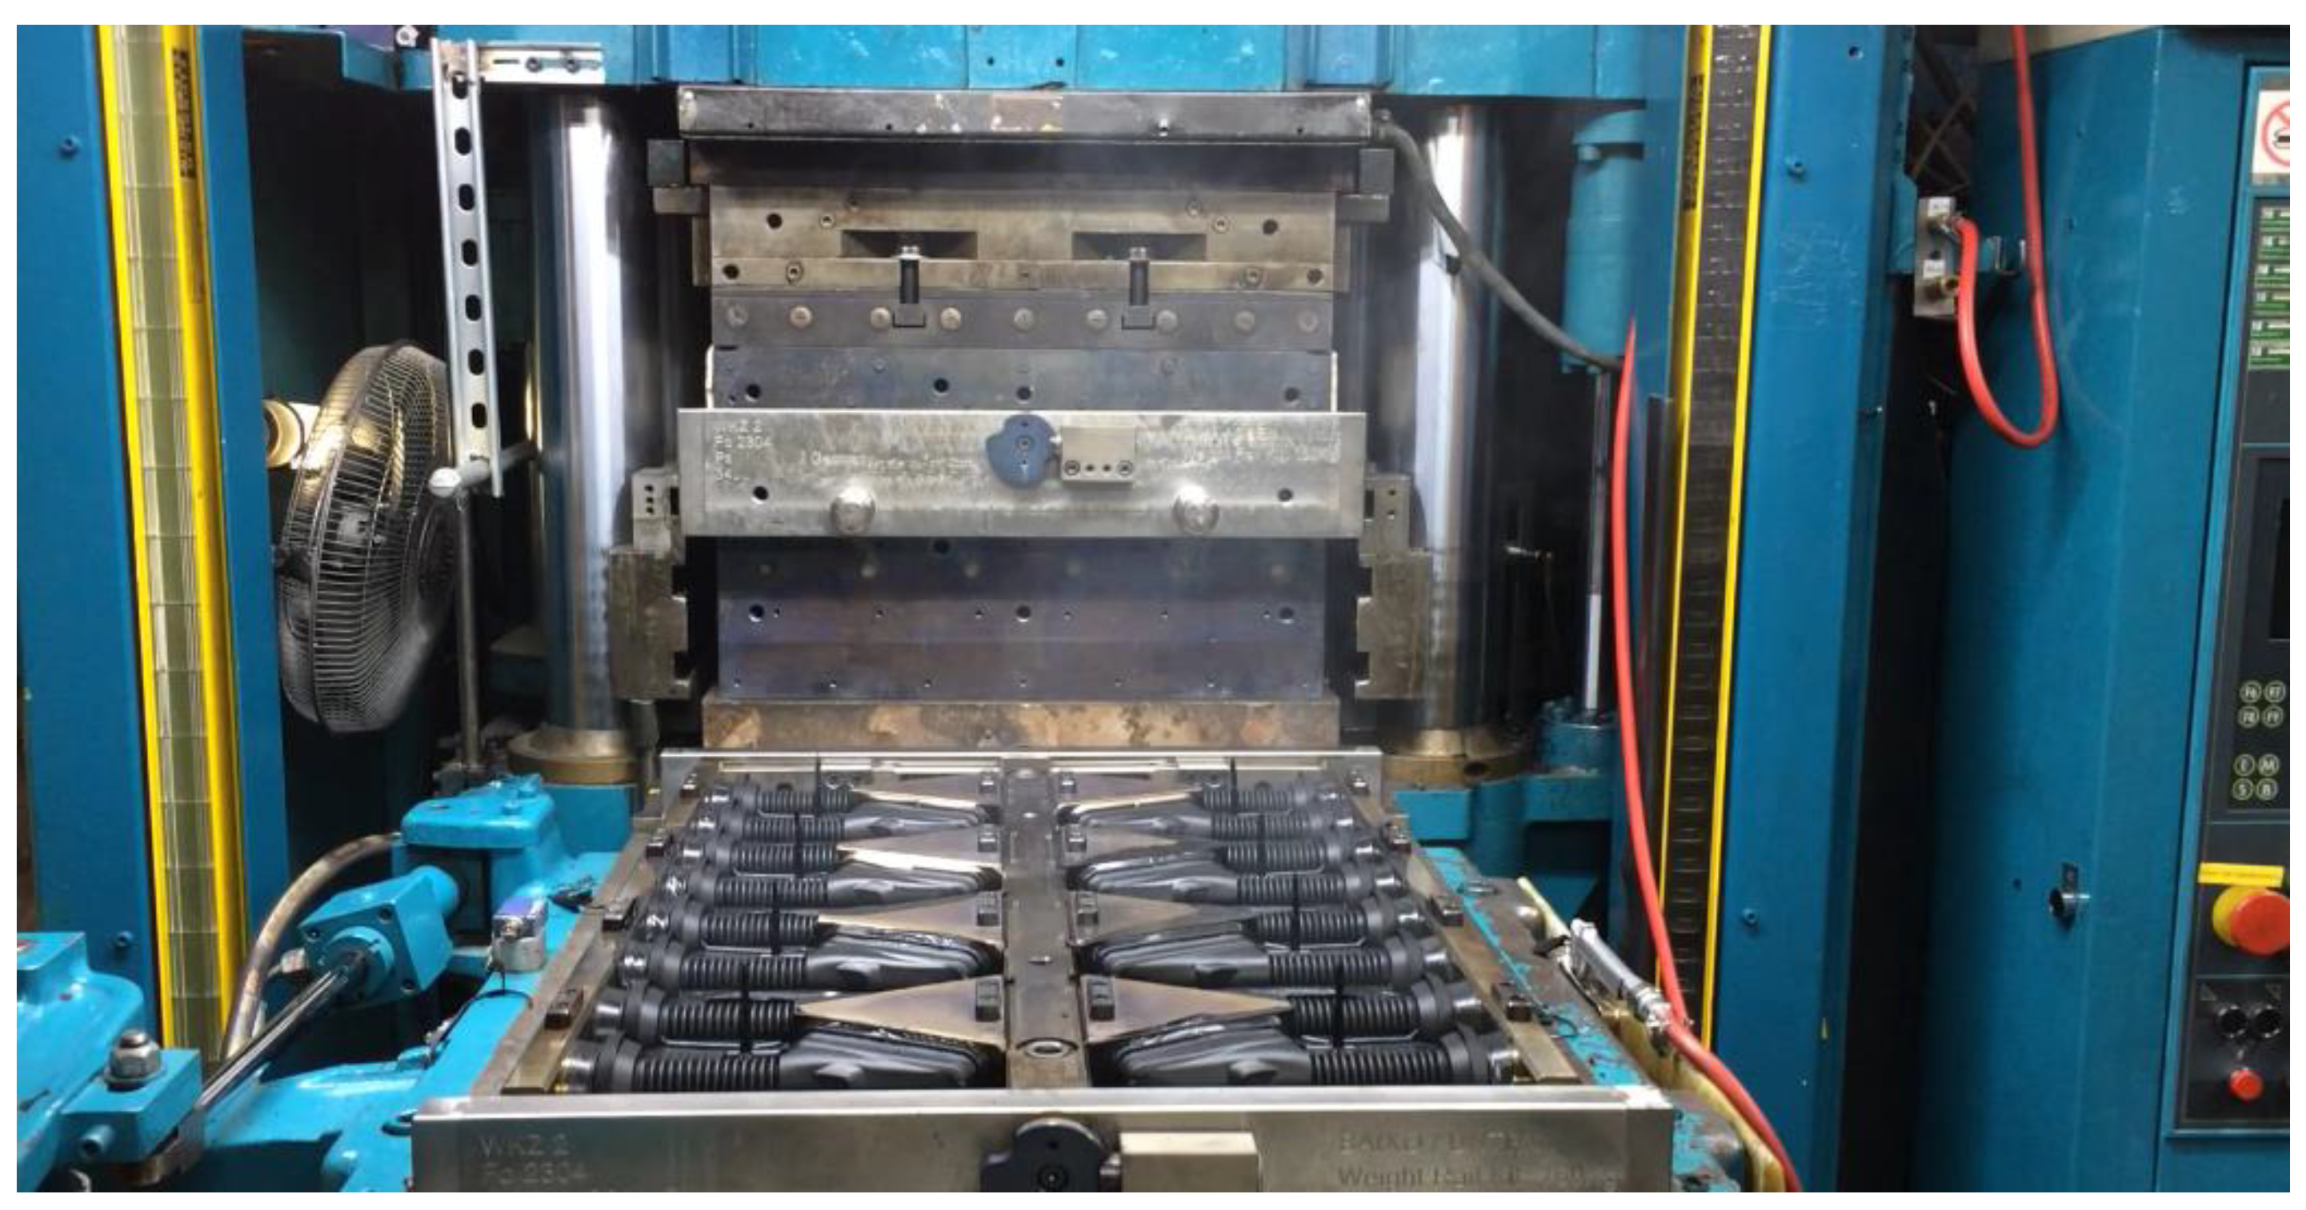
Figure 13.
– Hardness test on a door grommet application.
Disclaimer/Publisher’s Note: The statements, opinions and data contained in all publications are solely those of the individual author(s) and contributor(s) and not of MDPI and/or the editor(s). MDPI and/or the editor(s) disclaim responsibility for any injury to people or property resulting from any ideas, methods, instructions or products referred to in the content. |
© 2025 by the authors. Licensee MDPI, Basel, Switzerland. This article is an open access article distributed under the terms and conditions of the Creative Commons Attribution (CC BY) license (http://creativecommons.org/licenses/by/4.0/).
Copyright: This open access article is published under a Creative Commons CC BY 4.0 license, which permit the free download, distribution, and reuse, provided that the author and preprint are cited in any reuse.


