
Submitted:
31 July 2025
Posted:
31 July 2025
You are already at the latest version
Abstract
This study investigates how preferences for sad or happy music influence the network structures linking depressive symptoms and meaning in life. Analyzing data from 1,681 college students, results indicate that individuals who listen to sad music display a denser network structure with stronger connections between depressive symptoms and meaning in life, while those favoring happy music exhibit a more dispersed network with weaker connections. The Sad Music Group showed higher global strength, suggesting a tight-ly-knit network, whereas the Happy Music Group had lower global strength, implying greater flexibility among nodes. These findings highlight distinct network configurations between the two groups, offering insights into the interplay between music engagement and psychological well-being. By identifying key nodes and connectivity, we can develop more targeted therapy interventions. However, it is crucial to consider individual dif-ferences and contextual factors that influence how music affects psychological well-being.
Keywords:
Network analysis
; Music preference
; Depressive symptoms
; Meaning in life
; Mental health
; Sad music
; Happy music
; Music therapy
1. Introduction
The impact of daily listening to music, whether sad or happy, on depressive moods and the sense of meaning in life is an intricate subject that has garnered interest within the fields of psychology and music therapy. Research indicates that daily engagement with different types of music can yield varied emotional responses and implications for mental health. Listening to sad music is often a topic of considerable debate due to its paradoxical nature. It is known that many individuals report deriving comfort and emotional relief from sad music, a phenomenon frequently linked to a process called emotional contagion, where listeners experience parallel emotions to those expressed in the music. This process can enhance feelings of empathy and communal understanding, potentially allowing listeners to feel less isolated during moments of sadness. In essence, sad music can provide a reflective space for individuals, helping them to process grief and melancholy, which may contribute to an enhanced sense of meaning by validating their emotional experiences and fostering a deeper connection with one’s inner self (Eerola et al., 2016).
Conversely, while listening to sad music can be therapeutic for some, it also poses risks for individuals with tendencies toward rumination or severe depression. In certain contexts, repeated engagement with sad music can intensify depressive symptoms, particularly if it leads to a cycle of negative emotional reinforcement. This can exacerbate feelings of hopelessness or despair, ultimately detracting from one’s sense of purpose or meaning in life. Research has shown that individuals who ruminate while engaging with music might experience this amplification effect, suffering from increased negative feelings instead of the comfort that sad music might otherwise provide (Eerola et al., 2016; Garrido et al., 2017). In contrast, happy music typically induces positive mood changes and promotes feelings of joy and excitement. Positive music listening is associated with various beneficial outcomes, including improved mood regulation, enhanced social connections, and increased motivation. In the context of depressive mood, listening to upbeat, happy music can act as a counterbalance to negative emotions, fostering a sense of light-heartedness that can encourage individuals to engage more fully with their surroundings and potentially discover new meanings in their daily lives (Blasco-Magraner et al., 2023; Palmiero et al., 2023). Happy music has also been linked to a broadened scope of attention, allowing individuals to engage more flexibly with their thoughts and environments, thus contributing positively to their overall well-being (Putkinen et al., 2017).
The relationship between music engagement, depression, and meaning in life may also be linked through the construct of meaningfulness. Studies have indicated that individuals who actively engage with meaningful music—whether it be upbeat genres that foster joy or poignant pieces that resonate with personal experiences—tend to report greater levels of life satisfaction and meaning (Eerola & Peltola, 2016; Saarikallio et al., 2015). The key to this relationship appears to be not just the type of music but also the listener’s psychological state and the context in which the music is consumed. For instance, the hedonic value gained from upbeat music may be more pronounced in individuals seeking joy and escape from their mundane routines, thereby providing an effective counterbalance to depressive tendencies. Network analysis has begun to illuminate these dynamics quantitatively, showcasing the interconnectedness of daily music listening habits, emotional responses, and mental health metrics. By analyzing daily music engagement patterns, researchers can identify whether an individual’s listening habits are more dominantly associated with depressive symptomatology or with enhanced feelings of purpose and meaning in life (Chao et al., 2020; Eerola & Peltola, 2016).
Network analysis can be a powerful tool in studying these interactions, as it can illustrate complex relationships between variables like mood states, music types, and personal well-being. By mapping out daily music listening habits in relation to mood fluctuations and perceived meaning in life, researchers can gain insights into the dynamics of music as both a coping mechanism and a potential risk factor for mental health issues. This approach could clarify why some individuals thrive emotionally through sad music while others find it detrimental, thus emphasizing the subjective nature of music’s impact on personal psychology (Saarikallio et al., 2015). In summary, while sad music can serve as a means for emotional connection and reflection, its effects may not be universally positive, especially for those with tendency towards depression. Conversely, happy music tends to bolster mood and inspire a sense of connection and purpose. Understanding these nuances through network analysis could pave the way for more effective interventions using music therapy and personalized listening strategies in mental health contexts.
Network analysis has emerged as a powerful tool in psychological research, offering a novel perspective on the interrelationships between psychological constructs. This approach models psychological phenomena as networks of nodes (representing variables) connected by edges (indicating statistical relationships). Prior research has utilized network analysis to explore various psychological domains, yet limited attention has been given to how individual differences, such as music preference, may shape these networks. Music is known to have a profound impact on emotions and cognition, with different genres potentially influencing psychological states in distinct ways. This study aims to address this gap by comparing the network structures of meaning in life and depressive symptoms between two groups: individuals who regularly listen to sad music and those who regularly listen to happy music. We employed a network analysis framework, incorporating bootstrapping procedures and stability assessments, to ensure the accuracy and reliability of our findings.
2. Materials and Methods
2.1. Participants and Data Collection
The data used in this study were collected from a sample of participants who completed a set of questionnaires measuring meaning in life (via the life meaning scale), depressive symptoms (via the PHQ-9 depression scale), and music preference. The dataset was divided into two groups based on participants’ self-reported music preference: those who regularly listen to sad music (Sad Music Group) and those who regularly listen to happy music (Happy Music Group). The data were imported into R using the readxl package, and relevant variables were extracted for analysis.
This study has been formally approved by the Ethics Committee. The research strictly adhered to the guidelines and relevant ethical standards set by the approving committee to ensure the protection of participants’ rights and anonymity.
2.2. Scales
2.2.1. The Meaning in Life Questionnaire (MLQ)
The MLQ is a self-assessment scale consisting of 10 items, encompassing two dimensions: presence of meaning and search for meaning, with 5 items each. It employs a Likert 7-point scoring system (1 = “strongly disagree”; 7 = “strongly agree”). Among the 10 items of this scale, except for item 9 which is reverse-scored, all other items are positively scored. The presence of meaning (MLQ-P) includes items 1, 4, 5, 6, and 9; the search for meaning (MLQ-S) includes items 2, 3, 7, 8, and 10. The measurement indicator is the average score of each dimension. Higher scores indicate higher levels of meaning presence or meaning seeking (Steger et al., 2006). Life1: purpose-seeking; Life2: purpose absence; Life3: meaning exploration; Life4: meaning awareness; Life5: meaning stimulus seeking; Life6: purpose continuous exploration; Life7: direction clarity; Life8: meaning source awareness; Life9: purpose satisfaction; Life10: importance pursuit.
2.2.2. The Patient Health Questionnaire (PHQ-9)
The Patient Health Questionnaire (PHQ-9), a self-assessment tool for depression, was jointly developed by Kroenke et al. (2001). In this study, we employed the PHQ-9 to evaluate participants’ depressive symptoms. The PHQ-9 is a widely used self-rating scale designed for screening and assessing the severity of depressive symptoms. This scale consists of 9 items corresponding to the diagnostic criteria for depression, with each item scored from 0 (“not at all”) to 3 (“nearly every day”) based on symptom frequency. The total score ranges from 0 to 27, with higher scores indicating more severe depressive symptoms. According to the PHQ-9 scoring criteria, participants’ depressive symptoms were categorized into the following five levels: 0-4 points: no depressive symptoms; 5-9 points: mild depression; 10-14 points: moderate depression; 15-19 points: moderately severe depression; 20-27 points: severe depression. Due to its brevity and effectiveness, the PHQ-9 scale has been extensively utilized in clinical and research settings, providing robust support for the preliminary screening and assessment of depression. In this study, participants were instructed to rate each item based on their experiences over the past two weeks. All ratings were independently completed by participants at the outset of the study to ensure objectivity and reliability of the results. PHQ-9 symptoms: PHQ1: anhedonia; PHQ2: sad mood; PHQ3: sleep; PHQ4: fatigue; PHQ5: appetite; PHQ6: Guilty; PHQ7: concentration; PHQ8: motor; PHO9: Suicide.
2.3. Network Construction
The network analysis was performed using the R programming language with several packages, including qgraph, bootnet, and NetworkComparisonTest. The steps involved in network construction were as follows:
Data Preparation: The variables measuring meaning in life and depressive symptoms were organized into separate data frames for each group. The variables were categorized into two groups: Life (meaning in life measures) and PHQ (depressive symptoms).
Network Estimation: The Gaussian graphical model (GGM) was employed to estimate the network structures for both groups using the graphical LASSO method in combination with Extended Bayesian Information Criterion (EBIC) model selection (Epskamp et al., 2018). This approach allowed for the estimation of partial correlation coefficients between variables while controlling for other variables in the dataset. The network models were estimated using the R-package qgraph version 1.9.8 (Epskamp et al., 2012).
Network Visualization: The qgraph package was used to visualize the estimated networks for both groups, with nodes representing the variables and edges representing the partial correlation coefficients. Different colors and layouts were applied to distinguish between the two groups and enhance the interpretability of the network structures.
2.4. Accuracy and Stability Assessment
To assess the accuracy and stability of the estimated networks, the following methods were employed:
Bootstrapping Procedures: Non-parametric bootstrapping was used to estimate confidence intervals (CIs) for edge weights and centrality indices. This involved resampling the data with replacement to create multiple bootstrap samples, estimating the network parameters for each sample, and calculating the CIs based on the distribution of the bootstrap estimates. The bootnet package facilitated this process, allowing for the estimation of bootstrapped CIs and the visualization of the results.
Correlation Stability Coefficient (CS-coefficient): This measure was used to quantify the stability of centrality indices under case-dropping subset bootstrap. It indicates the maximum proportion of cases that can be dropped while maintaining a certain correlation (default 0.7) between the original centrality indices and those obtained from the subsetted data. A higher CS-coefficient value suggests greater stability of the centrality indices.
Bridge Statistics: Bridge strength and bridge expected influence were calculated to assess the connectivity between different communities within the networks. This helped to identify potential bridge nodes that may play a significant role in connecting different aspects of meaning in life and depressive symptoms.
Network Comparison: The NetworkComparisonTest package was used to compare the network structures of the two music preference groups. This involved estimating the networks for each group separately and then performing statistical tests to determine if there were significant differences in edge weights and centrality indices between the groups.
3. Results
3.1. Descriptive Statistical Results of Major Demographic Characteristics
A total of 1,681 valid questionnaires were collected from different genders, age groups and music preferences of college students. In terms of gender distribution, there were 1,121 male students, accounting for 66.7% of the total sample, while 560 female students accounted for 33.3%. Regarding music preferences, 320 students indicated that the most frequently listened to type of music in the past month was sad music, making up 19.0% of the total sample; whereas 1,361 students indicated that the most frequently listened to type of music was happy music, accounting for 81.0%.
3.2. Exploratory Network Analysis of Meaning in Life and Depressive Symptoms
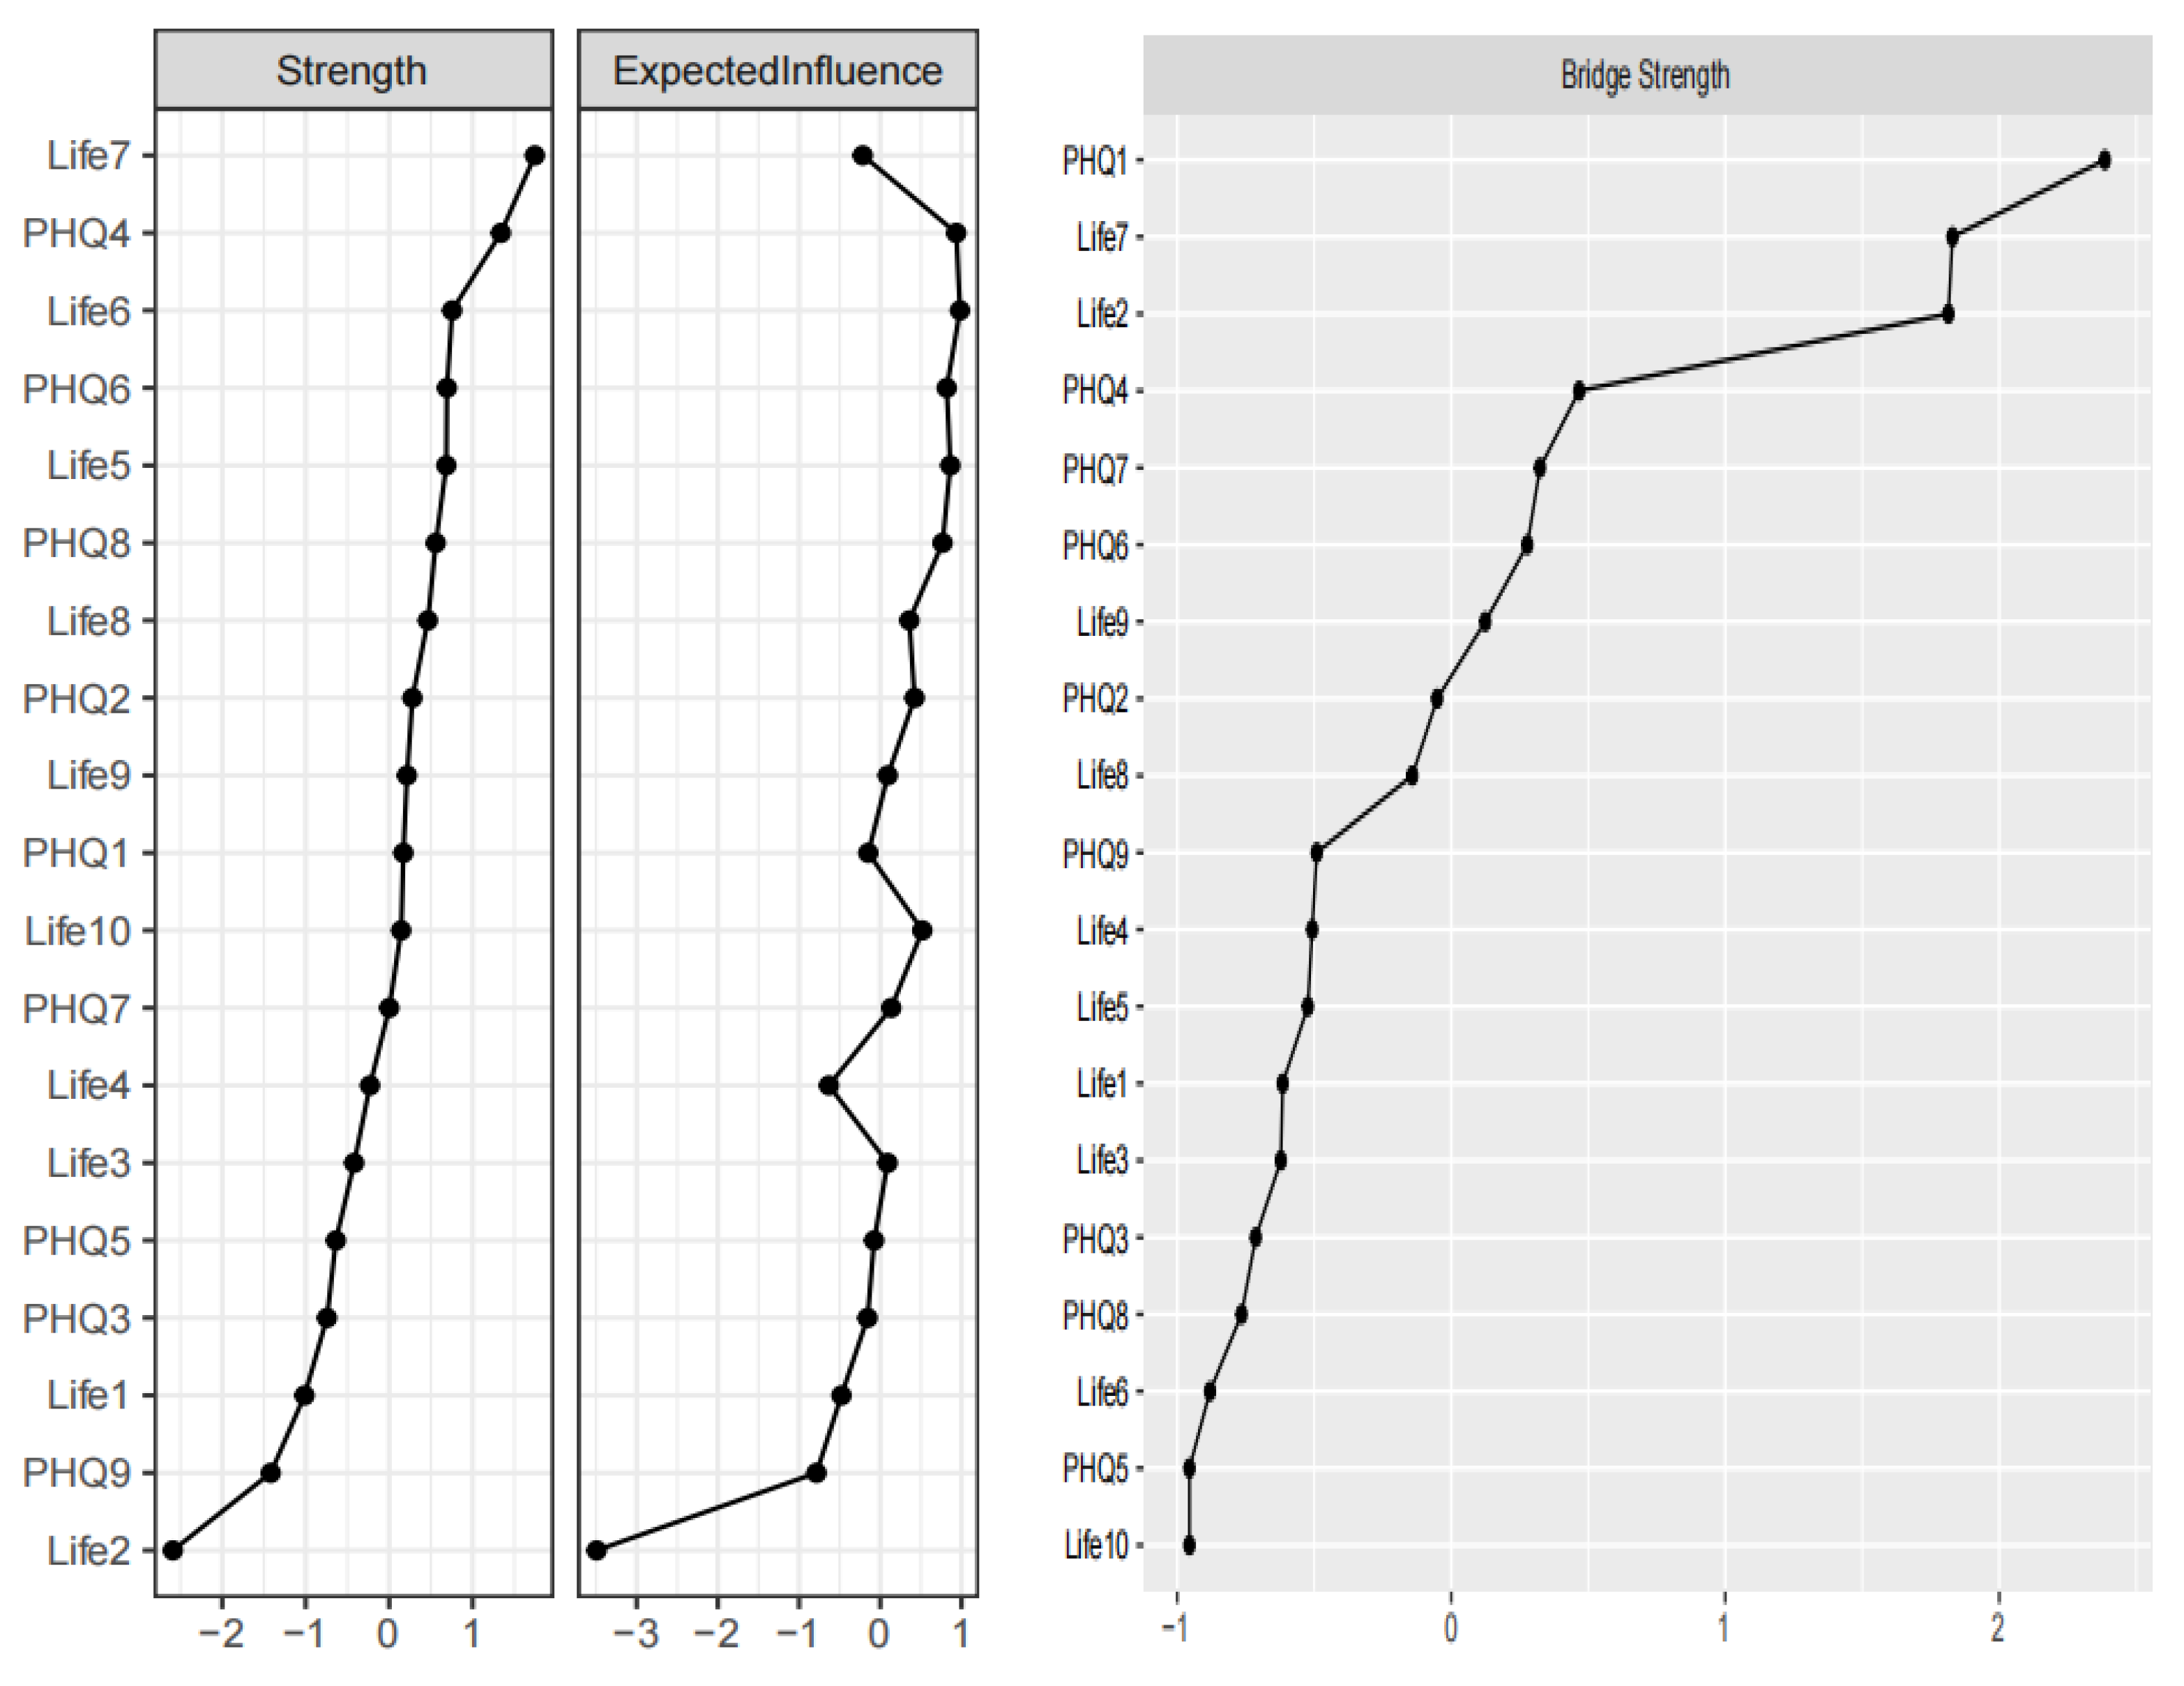
This study calculated and visualized the relational network between life meaning and depressive symptoms (see Figure 1). Blue lines represent positive correlations, while red lines indicate negative correlations and purple lines represent the higher bridge strength. Thicker edges denote stronger associations between two nodes, whereas thinner edges reflect weaker associations. The network structure revealed complex interconnections between various aspects of life meaning and depressive symptoms. Notably, certain nodes, such as “I understand the meaning of my life” (Life7) and “I have discovered a satisfying life purpose” (Life9), exhibited strong connections to multiple other nodes, suggesting their potential central roles in the network. For example, the node “I understand the meaning of my life” (Life7) was positively correlated with several items on the life meaning scale and negatively correlated with “anhedonia” (PHQ1) and “sad mood” (PHQ2). This pattern implies that individuals who report a greater sense of life meaning may experience fewer depressive symptoms. The network analysis also revealed that some nodes, such as “appetite change” (PHQ5) and “concentration” (PHQ7), had relatively weaker connections to the rest of the network, indicating that these symptoms might be less influential in the overall structure. The node “anhedonia” (PHQ1) exhibited the highest bridge strength, signifying its role as a “bridge” connecting different nodes. Other, the nodes of Life7, Life 2, and PHQ4 exhibited the higher bridge strength (see Figure 2).
Figure 1.
Network of relationships between meaning in life and depressive symptoms. Red nodes represent meaning in life, cyan nodes represent depressive symptoms, and purple nodes represent bridge nodes.
Figure 1.
Network of relationships between meaning in life and depressive symptoms. Red nodes represent meaning in life, cyan nodes represent depressive symptoms, and purple nodes represent bridge nodes.
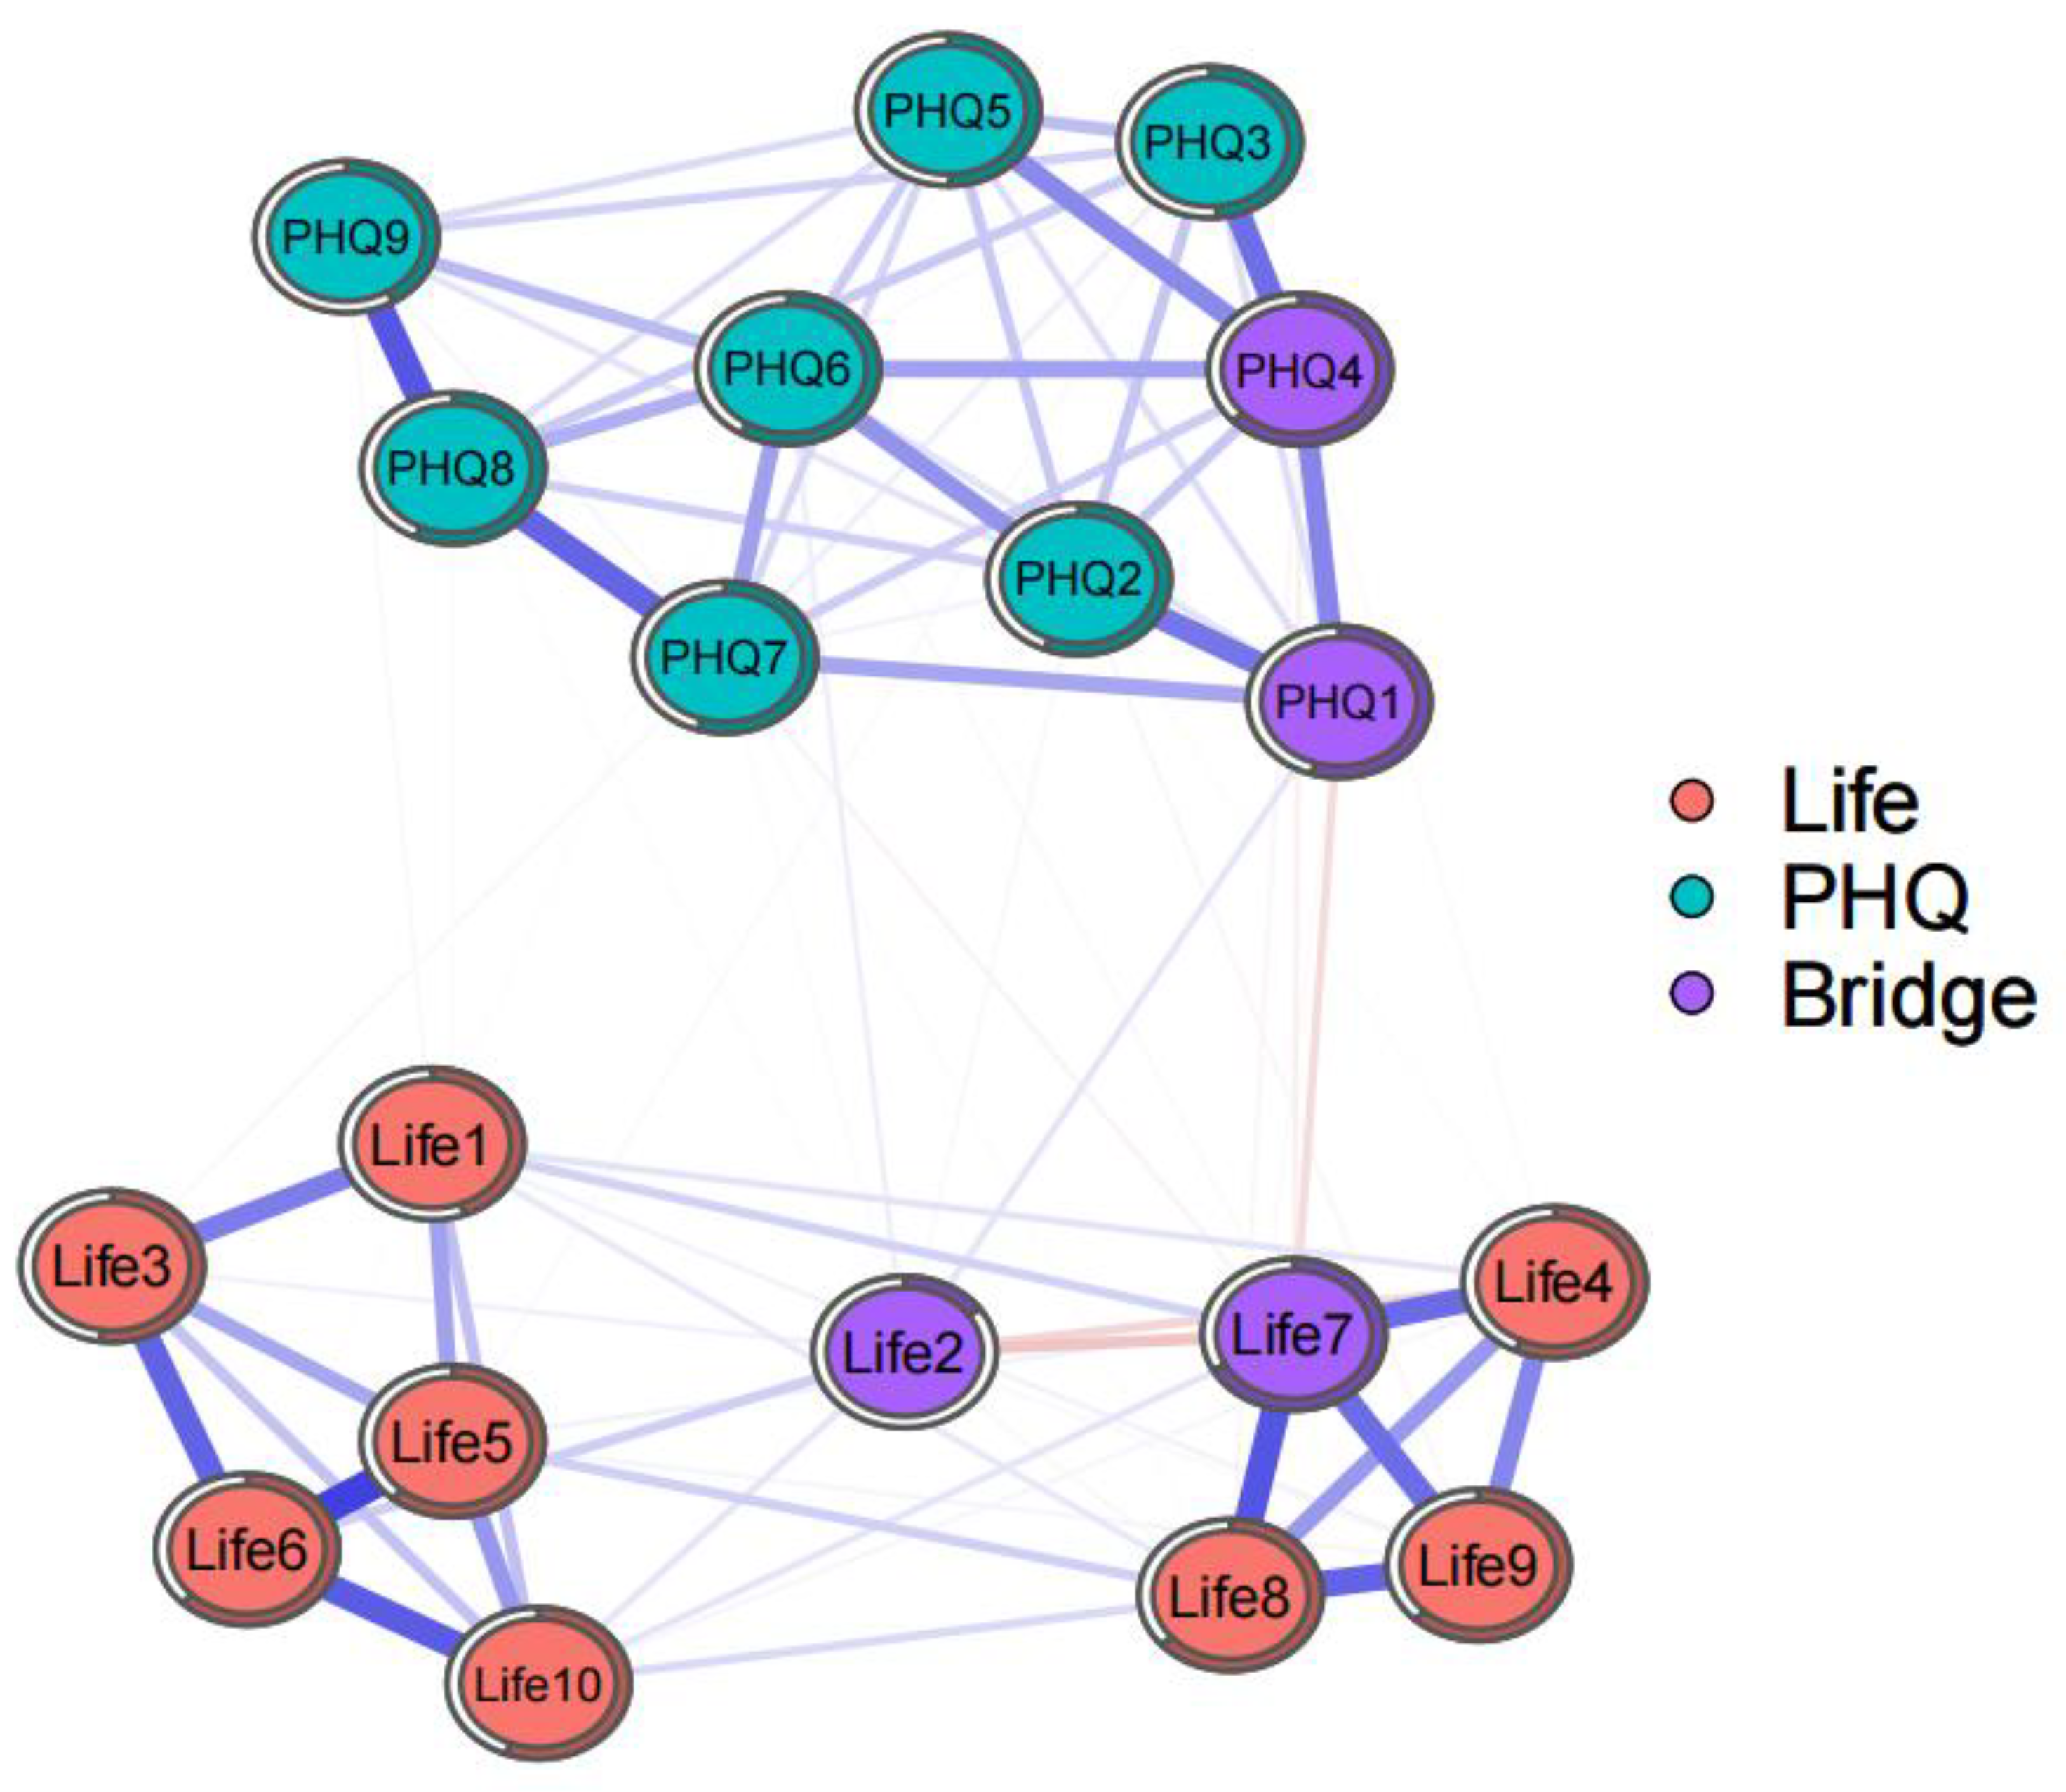
Figure 2.
Centrality indices and bridge strength of nodes in the network.
3.3. Centrality Analysis Results
The computational analysis of strength centrality and bridge strength for each node revealed the following: In the generated network, the life meaning item “I understand the meaning of my life” (Life7) exhibited the highest strength centrality (1.746) (see Table 1). This indicates that Life7 is the most significant node in the network, suggesting it has the strongest connections with other nodes and may play a central role in the relationship between life meaning and depressive symptoms. “Feeling tired or having little energy” (PHQ4) and “purpose continuous exploration” (Life6) also demonstrated relatively high strength centrality (1.339 and 0.755 respectively), suggesting their importance within the network.

Table 1.
Centrality indices of nodes in the network of meaning in life and depressive symptoms.
| Node | Strength | Expected Influence | Node | Strength | Expected Influence |
|---|---|---|---|---|---|
| Life1 | -1.013 | -0.478 | PHQ1 | 0.171 | -0.148 |
| Life2 | -2.591 | -3.493 | PHQ2 | 0.279 | 0.423 |
| Life3 | -0.419 | 0.090 | PHQ3 | -0.745 | -0.157 |
| Life4 | -0.229 | -0.633 | PHQ4 | 1.339 | 0.936 |
| Life5 | 0.685 | 0.863 | PHQ5 | -0.637 | -0.075 |
| Life6 | 0.755 | 0.982 | PHQ6 | 0.693 | 0.819 |
| Life7 | 1.746 | -0.216 | PHQ7 | 0.002 | 0.135 |
| Life8 | 0.464 | 0.358 | PHQ8 | 0.559 | 0.767 |
| Life9 | 0.214 | 0.093 | PHQ9 | -1.418 | -0.785 |
| Life10 | 0.144 | 0.518 |
3.4. Network Stability and Accuracy Test Results
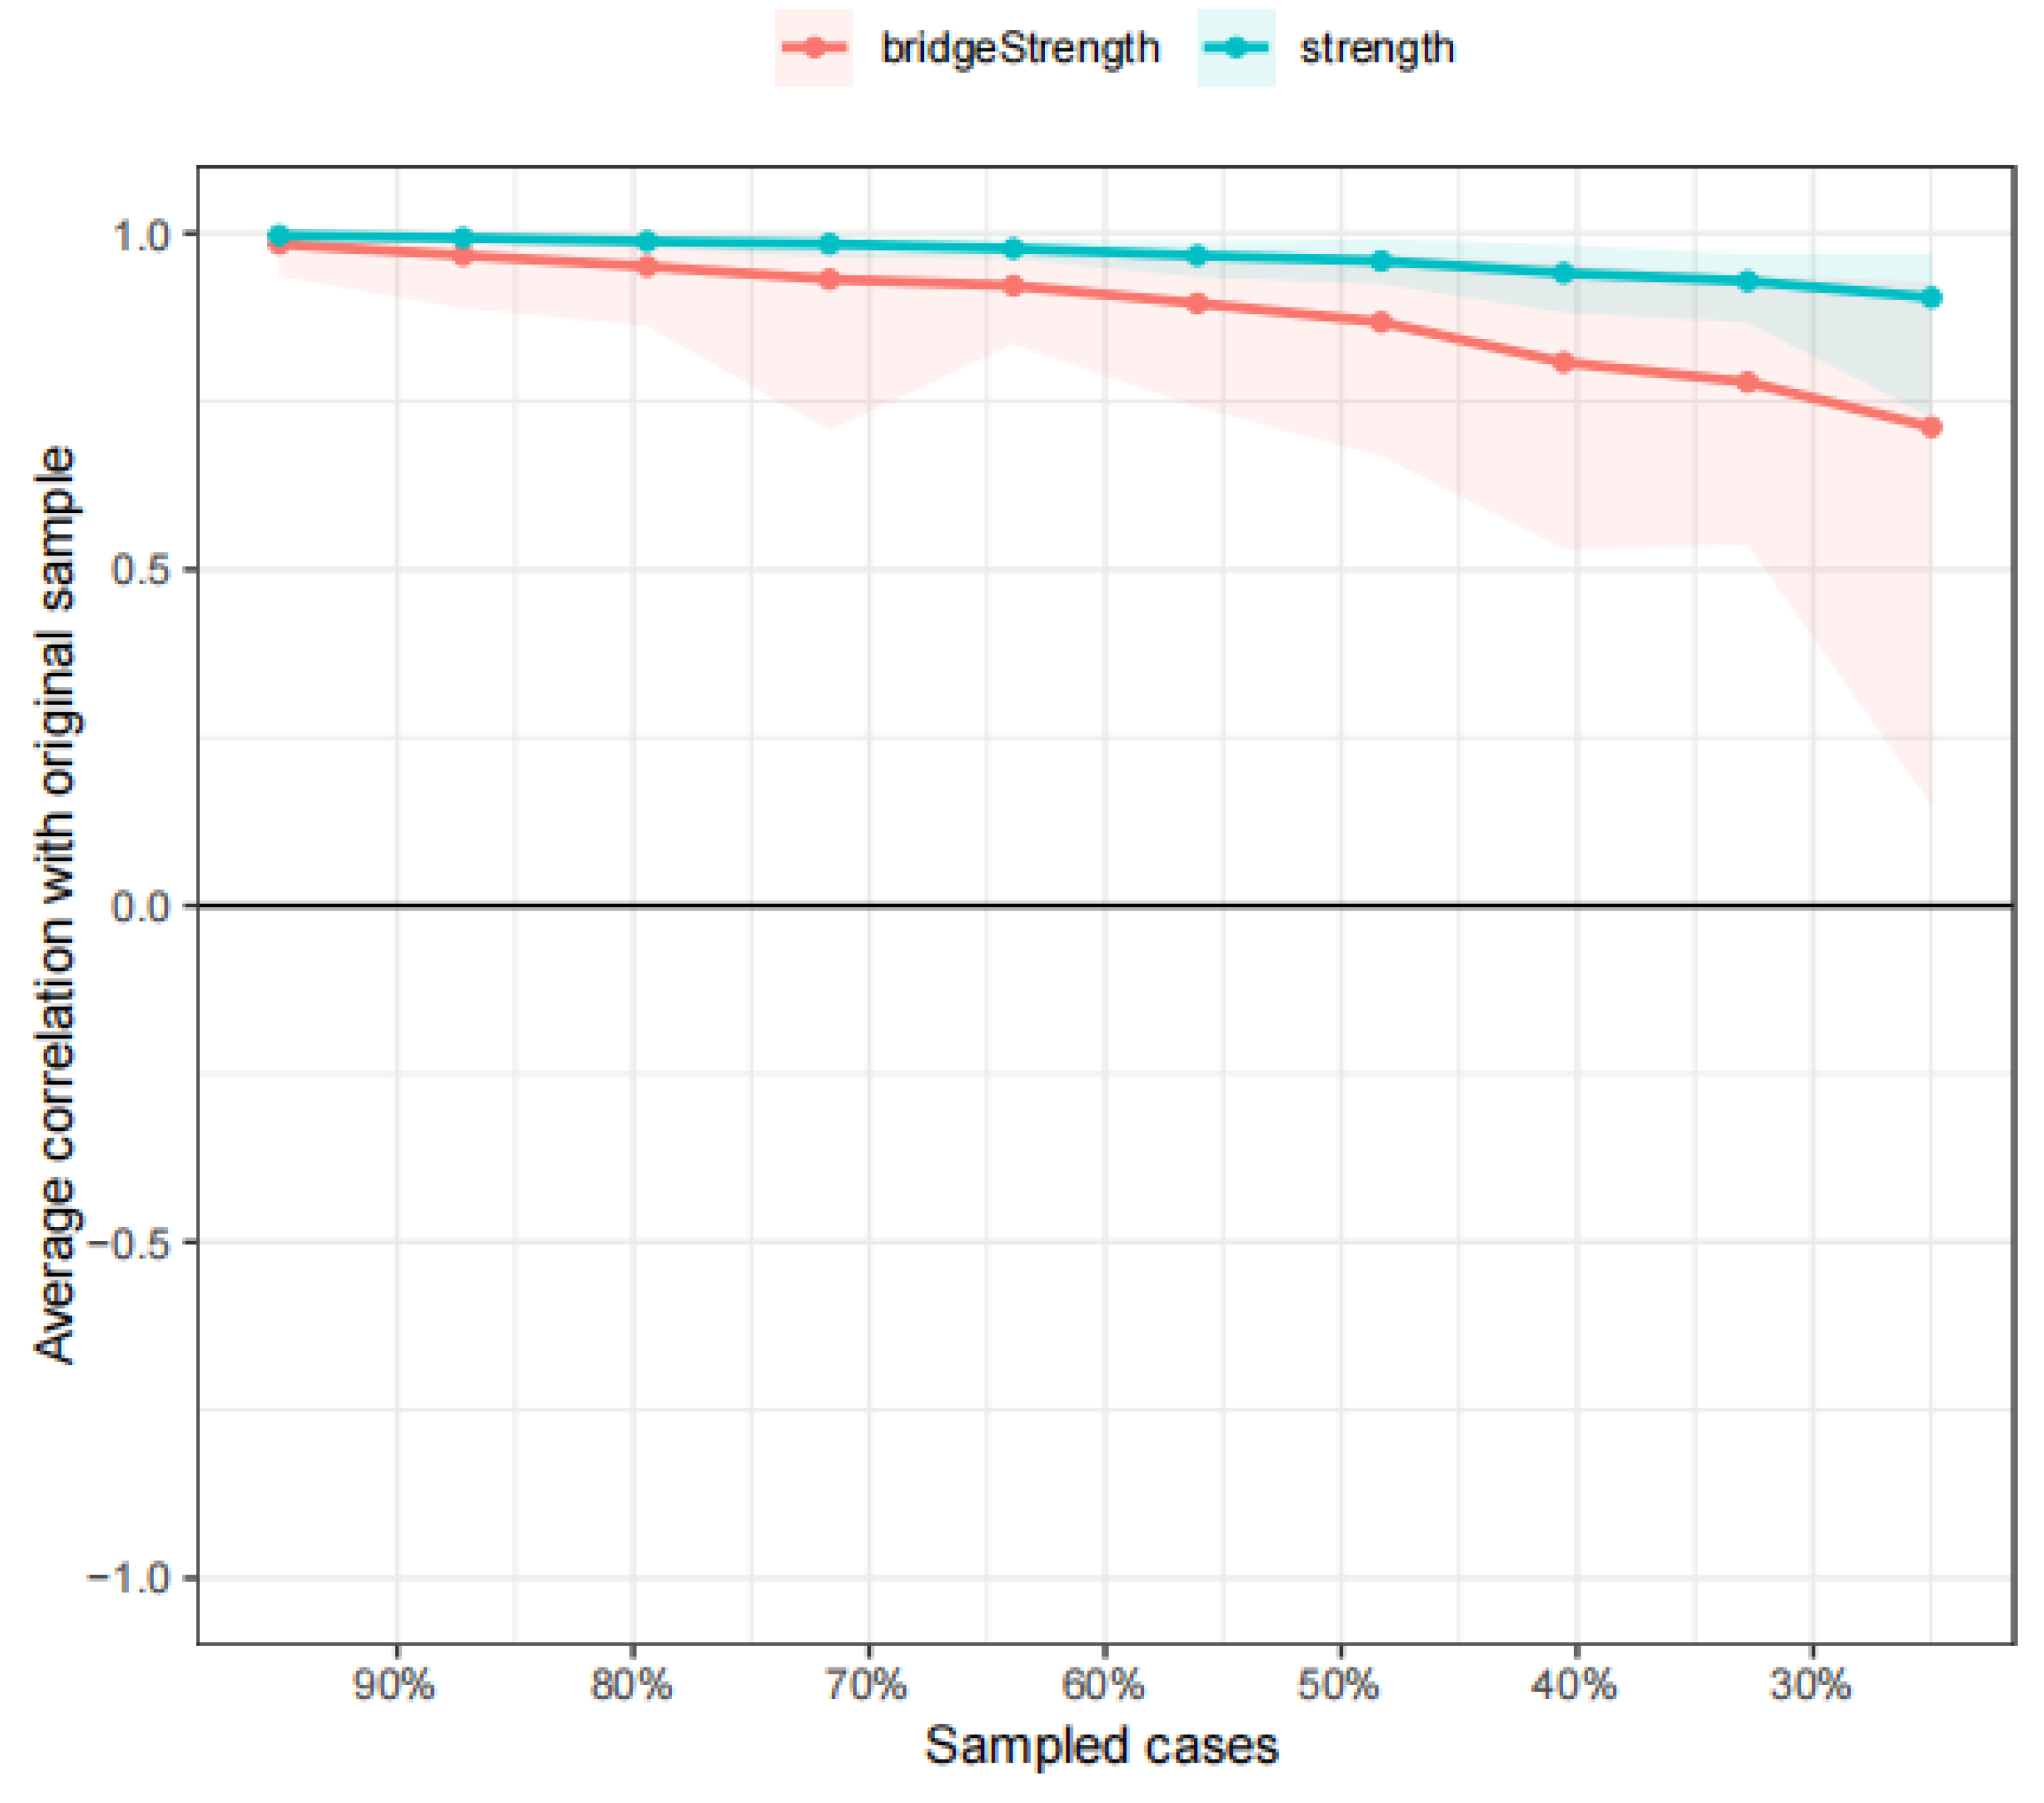
The bootstrap method was employed to calculate stability coefficients for strength centrality and bridge strength, thereby estimating the reliability of exploratory inferences. Results showed that the centrality stability coefficients for both strength centrality and bridge strength exceeded 0.25, confirming sufficient stability for these measures (see Table 2). Specifically, the correlation stability coefficient (CS-coefficient) for strength centrality was 0.75, and for bridge strength, it was 0.517. These values indicate that the network structures estimated in this study possess a reasonable level of stability, and the central nodes identified are likely to maintain their relative importance across different samples. However, it should be noted that some centrality indices exhibited lower stability coefficients, suggesting that interpretations of these indices should be made with caution (see Figure 3).
Table 2.
Correlation stability coefficients.
| Measure | CS-coefficient* |
|---|---|
| Betweenness | 0.283 |
| Bridge Strength | 0.517 |
| Closeness | 0.283 |
| Edge | 0.75 |
| Strength | 0.75 |
* CS-coefficient values above 0.25 are considered acceptable for stability. Values above 0.5 are preferred.
Figure 3.
Stability of centrality indices and bridge strength. This figure displays the correlation stability of centrality indices (strength and bridge strength) across different percentages of sampled cases. It shows the stability of these indices, with higher correlations indicating greater stability.
3.5. Comparative Network Analysis of Meaning in Life and Depressive Symptoms Between the Sad Music and Happy Music Groups
3.5.1. Analysis of Network Invariance Test Results
The network invariance test examines whether the overall network structures of the two groups are equivalent. A test statistic M of 0.219 and a p-value of 0.465 indicate that there is no statistically significant difference in the network structures between the Sad Music Group and the Happy Music Group. In other words, the basic topological properties of the networks, such as the overall connectivity patterns and the relationships between nodes, are largely similar across the two groups. This suggests that the fundamental framework of the relationship between meaning in life and depressive symptoms remains consistent regardless of whether individuals prefer sad or happy music (see Table 3; Figure 4).
Table 3.
Network comparison between sad music and happy music groups.
| Test Type | Parameter | Value (SMG) | Value (HMG) | T | P |
|---|---|---|---|---|---|
| Network Invariance | Test Statistic M | - | - | 0.212 | 0.465 |
| Global Strength Invariance | Global Strength | 8.816 | 7.981 | - | - |
| Test Statistic S | - | - | 0.836 | 0.019 |
* Sad Music Groups (SMG); Happy Music Groups (HMG).
Figure 4.
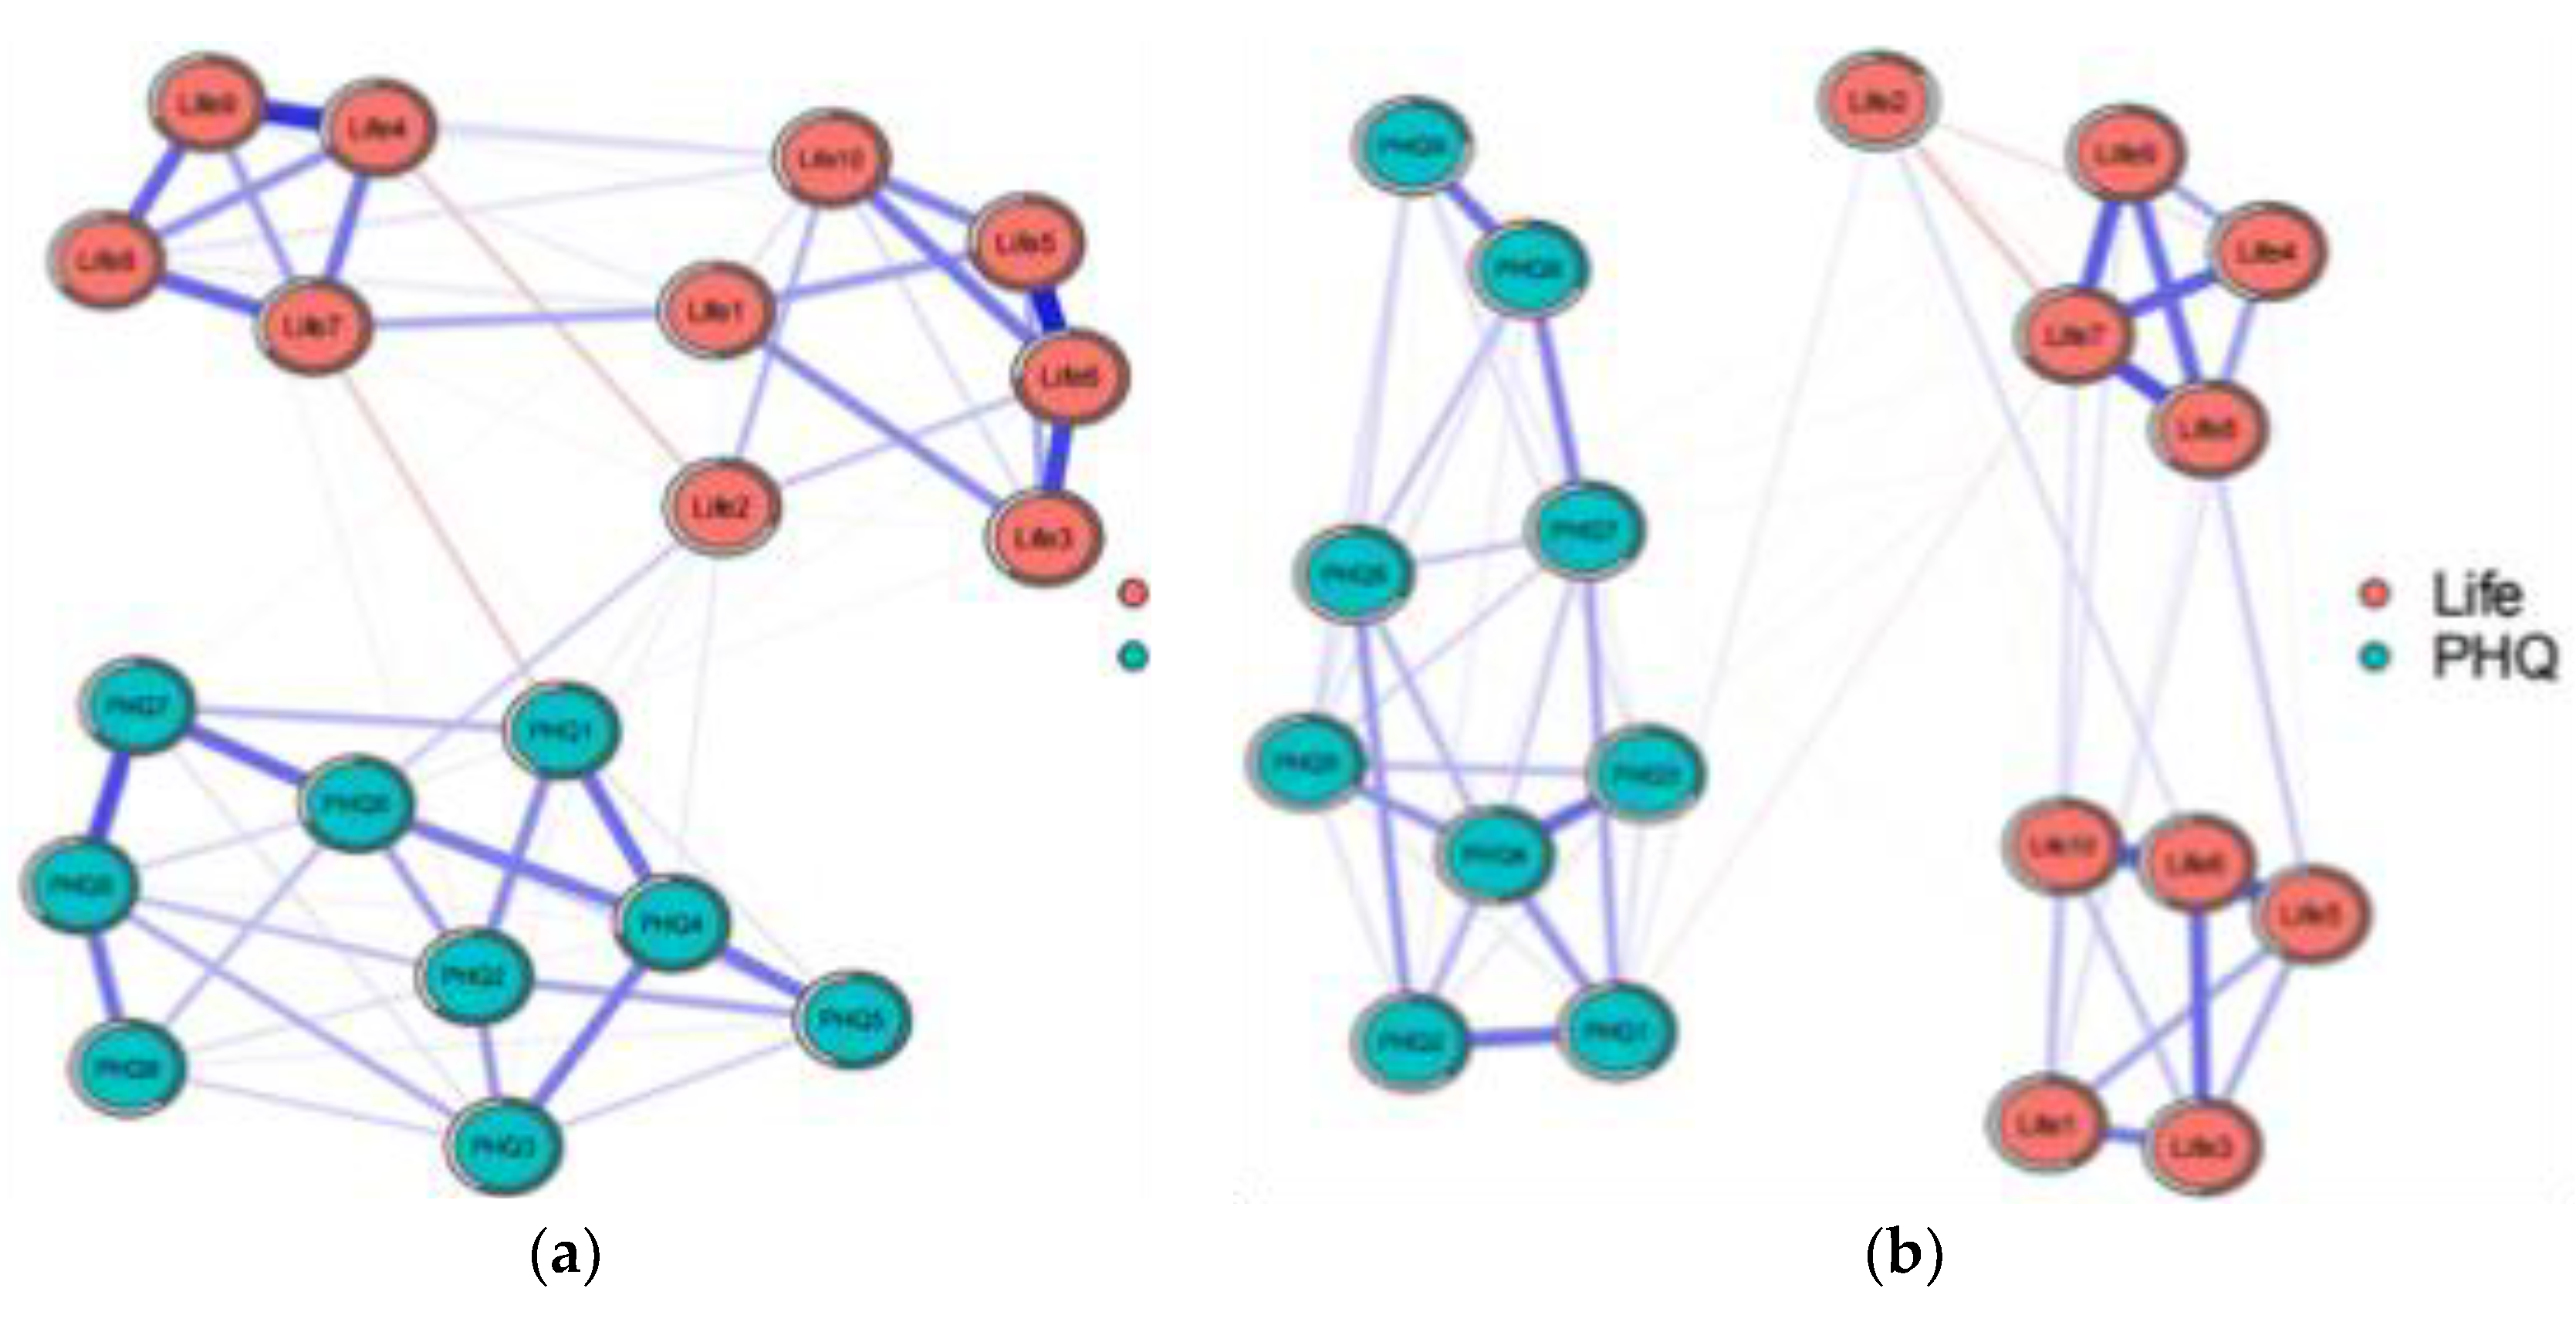
Network structure of the sad music listening group and happy music listening group: (a) Sad Music Listening Group; (b) Happy Music Listening Group.
Figure 4.
Network structure of the sad music listening group and happy music listening group: (a) Sad Music Listening Group; (b) Happy Music Listening Group.
3.5.2. Analysis of Global Strength Invariance Test Results
The global strength invariance test focuses on the overall connection strength within the networks of each group. The global strength values are 8.816 for the Sad Music Group and 7.981 for the Happy Music Group. The test statistic S is 0.836, and the p-value is 0.019. This indicates that there is a statistically significant difference in the overall connection strength between the two groups. The Sad Music Group has a higher global strength, implying stronger overall connections between the nodes in their network. This could mean that in the Sad Music Group, the various aspects of meaning in life and depressive symptoms are more strongly interconnected, potentially leading to a more tightly-knit network where changes in one node may have more substantial ripple effects on other nodes. In contrast, the Happy Music Group has a relatively lower global strength, suggesting weaker overall connections. This might imply a more loosely-connected network, where the relationships between different aspects of meaning in life and depressive symptoms are less intense, possibly allowing for more flexibility and independence among the nodes (see Table 3; Figure 4).
4. Discussion
The present study set out to explore how music preferences—specifically for sad or happy music—influence the network structures connecting meaning in life and depressive symptoms, using a dataset of 1,681 college students. Our results indicated that individuals who regularly listen to sad music exhibit a denser network structure with stronger connections between depressive symptoms, while those who prefer happy music show a more dispersed network with weaker connections. Additionally, certain nodes were found to have higher centrality in the happy music group, suggesting they may play a more significant role in alleviating depressive symptoms. These findings provide novel insights into the interplay between music engagement and psychological well-being, and have implications for both theoretical understanding and applied interventions in mental health.
4.1. Interpretation of the Results in the Context of Music Preferences
For the Sad Music Group, the higher global strength may reflect the fact that listening to sad music can evoke and reinforce certain emotional states and cognitive processes related to depressive symptoms and the search for meaning in life. This aligns with the idea that sad music might lead to rumination and negative emotional reinforcement in some individuals, thereby strengthening the connections between depressive symptoms in the network. However, it is also important to note that sad music can provide comfort and emotional relief for some listeners (Eerola et al., 2016; Garrido et al., 2017). The strong connections observed in the sad music group’s network could also indicate that these individuals are deeply engaged in processing their emotions through music, which may have both positive and negative implications depending on their personal context and psychological state. The strong connections between nodes might indicate that individuals who regularly listen to sad music tend to have more intertwined experiences of depressive symptoms and the exploration of life meaning. This could be both a risk factor, where negative emotions may more easily propagate through the network and exacerbate depressive symptoms, and a potential opportunity for intervention. If therapeutic strategies can target key nodes within this tightly-connected network, they may have broader effects on improving mental health (Arens et al., 2020). Moreover, evidence suggests that listeners of sad music sometimes report a greater frequency of self-reflective experiences, which can contribute to their search for meaning in life amid depressive symptoms. This duality—seeking comfort in sad music while navigating depressive feelings—can lead to a complex relationship between these listeners and their understanding of life. Such listeners might find solace in the emotional narratives offered by sad music, leading to introspection and a quest for understanding their life’s meaning within the context of their experiences (Eerola et al., 2016). For those struggling with depression, having a sense of meaning in life can enhance resilience against emotional distress. Studies indicate that individuals who report higher levels of meaning are more likely to experience positive emotions, which correlates with lower levels of negative emotions such as depression (Zhang et al., 2019). Additionally, therapeutic interventions that focus on enhancing a person’s meaning in life can lead to substantial improvements in mental health, reducing the severity of depressive symptoms and corresponding risks of suicide (Błażek et al., 2015; Raji Lahiji et al., 2022).
For the Happy Music Group, the lower global strength suggests that the relationships between meaning in life and depressive symptoms are less intense and more dispersed. This might be due to the positive emotional impact of happy music, which can disrupt the negative connections and create more positive or neutral pathways within the network. This supports the notion that happy music can induce positive mood changes and promote a sense of light-heartedness, which may counterbalance negative emotions and reduce the impact of depressive symptoms. The higher centrality of certain nodes in the happy music group further implies that specific aspects of meaning in life or depressive symptoms may be more influential in mediating the relationship between music listening and mental health outcomes. For example, nodes related to a positive outlook on life or social connectedness might serve as protective factors against depressive symptoms when individuals listen to happy music (Blasco-Magraner et al., 2023; Palmiero et al., 2023). The weaker connections could imply that depressive symptoms are less likely to reinforce each other and may be more easily influenced by positive factors related to meaning in life. This could make individuals in the Happy Music Group more responsive to interventions that aim to strengthen positive aspects of life meaning and weaken depressive symptoms.
4.2. Implications for Music-Therapy Interventions
For the Sad Music Group, given the dense network structure and strong connections between depressive symptoms, music-therapy interventions should focus on carefully identifying and targeting specific nodes that are central to the network. For example, if rumination is identified as a key node that strengthens the connections between depressive symptoms, interventions could incorporate strategies to redirect attention away from negative thought patterns while allowing individuals to still engage with sad music in a healthy way. This might involve guided reflection or cognitive-behavioral techniques that help individuals process their emotions without becoming entrenched in negative cycles. Research indicates that meaning in life serves as a protective factor against depressive symptoms. For instance, individuals who report a greater presence of meaning in their lives often experience better psychological functioning, leading to higher levels of well-being and lower levels of depression (Bamonti et al., 2016). This relationship can be explained through the mechanism of meaning-making, wherein individuals who construct meaning around their experiences, particularly in the face of adversity or chronic illness, are better equipped to cope with stress and are less likely to succumb to depressive states (Dezutter et al., 2015). The sense of purpose derived from meaning in life can instill resilience, promoting positive affect and psychological flexibility, which protect individuals from the onset of depressive symptoms. Additionally, the presence of meaning in life appears to moderate the impact of various stressors on the experience of depressive symptoms. For example, in adolescents facing stress, a strong sense of meaning in life can buffer the relationship between stress exposure and depressive symptoms, highlighting the importance of fostering meaning in life as part of mental health interventions (Dulaney et al., 2018). Similarly, older adults who maintain a sense of purpose are less likely to experience depression, particularly in the context of loneliness, which is prevalent in aging populations (Szcześniak et al., 2020).
For the Happy Music Group, the more dispersed network structure with weaker connections suggests that interventions can leverage the existing positive connections and further strengthen the positive aspects of meaning in life. Music-therapy in this case could focus on enhancing the positive emotions and social connections associated with happy music. Activities such as group music-listening sessions, creative music-making workshops, or using happy music as a backdrop for positive psychological exercises could be beneficial. These interventions aim to build on the existing network structure to foster a greater sense of meaning and well - being while reducing depressive symptoms. Moreover, studies have shown that the search for meaning can have variable effects on mental health outcomes. While actively searching for meaning has been linked to improvement in life satisfaction and decreased depression in individuals who have established a substantial sense of meaning, for those still struggling to find that meaning, it can sometimes exacerbate feelings of distress or dissatisfaction (Szcześniak et al., 2020). Thus, the dynamics of seeking and the presence of meaning interact in complex ways that require careful consideration in therapeutic contexts.
In summary, the findings of this study contribute to our understanding of how music preferences shape the relationships between meaning in life and depressive symptoms. By identifying key nodes and connectivity patterns within these networks, we can develop more targeted and effective music-therapy interventions. However, it is crucial to consider the complex interplay of individual differences and contextual factors that influence how music affects psychological well-being. Future research should further investigate these factors and their implications for both psychological theory and practice.
4.3. Limitations and Future Research Directions
While the results provide valuable insights into the differences between the two music - listening groups, there are some limitations to consider. The p-value correction method used (BH) helps control for false discovery rates, but the specific interpretation of the results should still be approached with caution. The sample consists of college students, which may limit the generalizability of the findings to other age groups or populations with different cultural backgrounds. Future research could explore how these network structures vary across different demographics and whether other individual difference variables, such as personality traits or emotional regulation strategies, interact with music preferences to influence the network relationships between meaning in life and depressive symptoms. Additionally, longitudinal studies could help establish the directionality of these relationships and determine how changes in music-listening habits over time affect the network structures of psychological constructs.
5. Conclusions
This study presents a comprehensive comparison of the network structures of meaning in life and depressive symptoms between individuals who regularly listen to sad music and those who regularly listen to happy music. By applying network analysis techniques and accuracy assessment methods, we demonstrated that music preference may influence the relationships between these psychological constructs. Our findings emphasize the importance of considering individual differences in network analysis and highlight the need for researchers to routinely evaluate the accuracy and stability of their network estimates to ensure the validity and replicability of their results. Future research should continue to explore the factors that influence network structures and the implications of these structures for psychological theory and practice.
Author Contributions
Conceptualization, Q.Z.Y. and Y.Q.L.; methodology, B.Y.; software, B.Y.; validation, Q.Z.Y., B.Y.; formal analysis, Q.Z.Y.; investigation, Y.Q.L.; resources, Y.Q.L.; data curation, Y.Q.L.; writing—original draft preparation, Q.Z.Y.; writing—review and editing, M.P.Z.; visualization, B.Y.; supervision, M.P.Z.; project administration, M.P.Z. All authors have read and agreed to the published version of the manuscript.
Funding
This research received no external funding.
Institutional Review Board Statement
The study was conducted in accordance with the Declaration of Helsinki, and approved by the Human Research Ethics Committee) Ethics Committee of the Department of Psychology at Southwest University (H24188, 08-11-2024).
Informed Consent Statement
Informed consent was obtained from all subjects involved in the study.
Conflicts of Interest
The authors declare no conflicts of interest.
Abbreviations
The following abbreviations are used in this manuscript:
| SMG | Sad Music Groups |
| HMG | Happy Music Groups |
| MLQ | Meaning in Life Questionnaire |
| PHQ | Patient Health Questionnaire |
| GGM | Gaussian Graphical Model |
| EBIC | Extended Bayesian Information Criterion |
| CI | Confidence Interval |
| CS-coefficient | Correlation Stability Coefficient |
| BH | Benjamini–Hochberg |
References
- (Arens; Stangier, 2020) Arens, E.A.; Stangier, U. Sad as a Matter of Evidence: The Desire for Self-Verification Motivates the Pursuit of Sadness in Clinical Depression. Frontiers in Psychology 2020, 11, 238. [CrossRef] [PubMed]
- (Bamonti et al., 2016) Bamonti, P.; Lombardi, S.; Duberstein, P.R.; King, D.A.; Van Orden, K.A. Spirituality attenuates the association between depression symptom severity and meaning in life. Aging & Mental Health 2016, 20, 494–499. [CrossRef]
- (Blasco-Magraner et al., 2023) Blasco-Magraner, J.S.; Bernabé-Valero, G.; Marín-Liébana, P.; Botella-Nicolás, A.M. Changing positive and negative affects through music experiences: A study with university students. BMC Psychology 2023, 11, 76. [CrossRef]
- (Błażek et al., 2015) Błażek, M.; Kaźmierczak, M.; Besta, T. Sense of purpose in life and escape from self as the predictors of quality of life in clinical samples. Journal of Religion and Health 2015, 54, 517–523. [CrossRef]
- (Chao et al., 2020) Chao, M.; Chen, X.; Liu, T.; Yang, H.; Hall, B.J. Psychological distress and state boredom during the COVID-19 outbreak in China: The role of meaning in life and media use. European Journal of Psychotraumatology 2020, 11, 1769379. [CrossRef]
- (Dezutter et al., 2015) Dezutter, J.; Luyckx, K.; Wachholtz, A. Meaning in life in chronic pain patients over time: Associations with pain experience and psychological well-being. Journal of Behavioral Medicine 2015, 38, 384–396. [CrossRef]
- (Dulaney et al., 2018) Dulaney, E.S, Graupmann, V.; Grant, K.E, Adam, E.K, & Chen, E. Taking on the stress-depression link: Meaning as a resource in adolescence. Journal of Adolescence 2018, 65, 39–49. [CrossRef]
- (Eerola; Peltola, 2016) Eerola, T.; Peltola, H.R. Memorable Experiences with Sad Music-Reasons, Reactions and Mechanisms of Three Types of Experiences. PLoS ONE 2016, 11, e0157444. [CrossRef]
- (Eerola et al., 2016) Eerola, T.; Vuoskoski, J.K.; Kautiainen, H. Being Moved by Unfamiliar Sad Music Is Associated with High Empathy. Frontiers in Psychology 2016, 7, 1176. [CrossRef]
- (Epskamp et al., 2018) Epskamp, S.; Borsboom, D.; Fried, E.I. Estimating psychological networks and their accuracy: A tutorial paper. Behavior Research Methods 2018, 50, 195–212. [CrossRef]
- (Epskamp et al., 2012) Epskamp, S.; Cramer, A.O.J.; Waldorp, L.J.; Schmittmann, V.D.; Borsboom, D. qgraph: Network visualizations of relationships in psychometric data. Journal of Statistical Software 2012, 48, 1–18.
- (Fried et al., 2016) Fried, E.I.; Epskamp, S.; Nesse, R.M.; Tuerlinckx, F.; Borsboom, D. What are “good” depression symptoms? Comparing the centrality of DSM and non-DSM symptoms of depression in a network analysis. Journal of Affective Disorders 2016, 189, 314–320. [CrossRef] [PubMed]
- (Garrido et al., 2017) Garrido, S.; Eerola, T.; McFerran, K. Group Rumination: Social Interactions Around Music in People with Depression. Frontiers in Psychology 2017, 8, 490. [CrossRef]
- (Kroenke et al., 2001) Kroenke, K.; Spitzer, R.L.; Williams, J.B. The PHQ-9: Validity of a brief depression severity measure. Journal of General Internal Medicine 2001, 16, 606–613. [CrossRef]
- (Palmiero et al., 2023) Palmiero, M.; Piccardi, L.; Giancola, M.;Nori, R.; Guariglia, P. The Effect of Sadness on Visual Artistic Creativity in Non-Artists. Brain Sciences. [CrossRef]
- (Putkinen et al., 2017) Putkinen, V.; Makkonen, T.; Eerola, T. Music-induced positive mood broadens the scope of auditory attention. Social Cognitive and Affective Neuroscience 2017, 12, 1159–1168. [CrossRef]
- (Raji, Lahiji; et al. , 2022) Raji Lahiji, M.; Sajadian, A.; Haghighat, S.; Zarrati, M.; Dareini, H.; Raji Lahiji, M.; Razmpoosh, E. Effectiveness of logotherapy and nutrition counseling on psychological status, quality of life, and dietary intake among breast cancer survivors with depressive disorder: A randomized clinical trial. Supportive Care in Cancer 2022, 30, 7997–8009. [Google Scholar] [CrossRef]
- (Saarikallio et al., 2015) Saarikallio, S.;Gold, C.; McFerran, K. Development and validation of the Healthy-Unhealthy Music Scale. Child and Adolescent Mental Health 2015, 20, 210–217. [CrossRef]
- (Steger et al., 2006) Steger, M.F.; Frazier, P.; Oishi, S.; Kaler, M. The Meaning in Life Questionnaire: Assessing the Presence of and Search for Meaning in Life. Journal of Counseling Psychology 2006, 53, 80. [CrossRef]
- (Szcześniak et al., 2020) Szcześniak, M.; Świątek, A.H, Cieślak, M.; Świdurska, D. Disease Acceptance and Eudemonic Well-Being Among Adults with Physical Disabilities: The Mediator Effect of Meaning in Life. Frontiers in Psychology 2020, 11, 525560. [CrossRef]
- (van, Borkulo; et al., 2014) van Borkulo, C.D.; Borsboom, D.; Epskamp, S.; Blanken, T.F.; Boschloo, L.; Schoevers, R.A.; Waldorp, L.J. A new method for constructing networks from binary data. Scientific Reports 2014, 4, 5918. [CrossRef]
- (Zhang et al., 2019) Zhang, J.; Peng, J.; Gao, P.; Huang, H.; Cao, Y.; Zheng, L.; Miao, D. Relationship between meaning in life and death anxiety in the elderly: Self-esteem as a mediator. BMC Geriatrics 2019, 19, 308. [CrossRef]
Disclaimer/Publisher’s Note: The statements, opinions and data contained in all publications are solely those of the individual author(s) and contributor(s) and not of MDPI and/or the editor(s). MDPI and/or the editor(s) disclaim responsibility for any injury to people or property resulting from any ideas, methods, instructions or products referred to in the content. |
© 2025 by the authors. Licensee MDPI, Basel, Switzerland. This article is an open access article distributed under the terms and conditions of the Creative Commons Attribution (CC BY) license (https://creativecommons.org/licenses/by/4.0/).
Copyright: This open access article is published under a Creative Commons CC BY 4.0 license, which permit the free download, distribution, and reuse, provided that the author and preprint are cited in any reuse.


