
Submitted:
15 August 2024
Posted:
16 August 2024
You are already at the latest version
Abstract
Anxiety in older adults is a prevalent yet under-recognized condition associated with significant societal and individual burdens. This study used a machine learning approach to compare the relative importance of 57 risk and protective factors for anxiety symptoms in a population-representative sample of middle-aged and older European adults (N = 65,684; ages 45–103 years; 55.7% women; 15 countries represented). Results revealed loneliness and self-rated poor health as primary risk factors (Nagelkerke R2 = .272), with additional predictive contributions from country of residence, functional limitations, financial distress, and family care burden. Notably, follow-up analysis showed that none of 16 social network variables were associated with loneliness; rather, cohabitating with a partner/spouse was most strongly associated with reduced loneliness. Further research is needed to elucidate directional associations between loneliness and anxiety (both general and sub-types). These findings underscore the imperative of addressing loneliness for mitigating anxiety and related mental health conditions among aging populations.
Keywords:
generalized anxiety
; loneliness
; social isolation
; social network
; cognition
; population
; aging
1. Introduction
Approximately 14% of older adults live with a mental health condition, of which anxiety-related disorders are the most common [1,2]. Prevalence estimates of clinically relevant anxiety symptoms in community-dwelling older adults reliably range between 5–6%. However, anxiety prevalence may be substantially higher (e.g. > 20%) when taking into consideration adults living in assisted care facilities and the general tendency within this age demographic to underreport anxiety symptoms [3,4,5]. Anxiety and depression together account for 11% of years lived with disability in later life, with a corresponding cost to the world economy currently estimated at over US $1 trillion per year. This amount is projected to increase dramatically by 2030, concomitant with a growing global population of older adults [6].
Anxiety in later life is associated with decreased social and occupational functioning, disruption of daily activities, reduced quality of life, and increased risks for dementia and death [7,8,9] Although anxiety is a treatable condition, it remains under-diagnosed and under-treated relative to other mood disorders, such as depression [10,11]. Primary care visits, which occur with increasing frequency as people age, provide an opportunity to correct these shortfalls through enhanced screening and timely intervention. A clearer understanding of the differential importance of risk and protective factors implicated in later-life anxiety can facilitate these aims [12].
Systematic reviews have shown that anxiety in adulthood is linked with general poor health (e.g., as indicated by number of chronic disease conditions) and functional disability. There is also evidence that women, non-married persons, and individuals reporting higher occurrences of adverse childhood experiences and stressful life events are at elevated risk [13]. In contrast to research on late-life depression [14], there have so far been few meta-analyses of anxiety-related risk and protective factors as manifest in community-dwelling older adults. Extant meta-analyses of anxiety in adulthood have more often focused on prevalence rates [15].
In recent years, there has been a growing trend toward using machine learning (ML) approaches to compare risk/protective factors in large-sample behavioral epidemiology studies of older adults [16,17,18,19,20]. An advantage of ML over conventional parametric techniques is that ML can capture nonlinear and moderating effects in an exploratory way, i.e., without requiring the explicit specification of all possible interactions between variables. Additionally, ML methods may employ data and variable sub-selection routines as ‘built-in’ cross-validation checks to mitigate problems related to multicollinearity and spurious variable selection (model overfit) in determining relative predictive importance [21].
Although ML has seen increasing use in applications to detect and differentially diagnose anxiety in both adolescents and adults, there have to date been few ML comparative studies of biological, psychological, and social predictors of anxiety in population-representative samples of middle-aged and older adults. Li et al. used ML to compare 2,599 variables as predictive of anxiety onset in a cohort of 24,388 Canadian adults. Results showed that variables related to prior history of a mood disorder and frailty were top predictors (a comprehensive list of predictive associations was not provided) [22]. Byeon used ML to compare demographic, social network and communication, neighborhood environment, and select mental health indices as predictive of anxiety disorders in a sample of 1,558 South Korean older adults, with results implicating loneliness, low self-esteem, and reduced communication with family members as key risk factors [23]. Other ML studies with anxiety as a target outcome have focused more on comparing predictive accuracy across different ML algorithms than on substantive anxiety associations and so are not summarized here.
The current work is a companion study to Handing et al. [21], in which we used a split-sample methodology combining random forest machine learning (RFML) and generalized linear models to compare socio-relational, health, lifestyle, cognitive, and functional limitations variables as predictive of depression risk in participants from the Survey of Health, Ageing, and Retirement in Europe (SHARE). The current analyses were applied to data from SHARE Wave 5 (N = 65,684; ages 45-103y; 55.7% women; 15 countries represented). Anxiety symptoms were assessed using items from the Beck Anxiety Inventory (BAI)[24]. Fifty-seven risk/protective factors were compared. It was anticipated that chronic health conditions, functional limitations, and variables indicative of social isolation would stand out as the most salient risk factors for elevation of anxiety symptoms.
2. Materials and Methods
2.1. Study Design and Population
Data came from Wave 5 of SHARE, a multi-national longitudinal study of middle-aged and older adults representing, at this wave, 14 European countries and Israel (N = 65,684; ages 45-103y, 55.7% women). Study design, sampling, and data resources for SHARE are described in Börsch-Supan [25] and SHARE-ERIC [26]. Surveys were administered by Computer Assisted Personal Interview (CAPI), supplemented by paper and pencil questionnaires. Survey questions spanned demographic, socio-relational, and health-related (including functional ability and mental health) measures. Interviews were conducted in respondents’ homes and took approximately 90 minutes. SHARE used probabilistic sampling based on household (and other) demographic information to ensure that participant selection was nationally representative.
Across countries, household response rates for SHARE Wave 5 ranged from 32.7% (Luxembourg) to 67.5% (Israel)[27]. Identified households included at least one person aged 50 years or older selected as a primary respondent. Partners of primary respondents were also selected to participate, regardless of age. Here, respondents as young as 45 years were included to capture a broader age range of middle-aged persons, an underrepresented demographic in adult development and aging research. Wave 5 was selected as a focus because both anxiety and self-reported loneliness using a harmonized measure (see below) were only available at that wave.
2.2. Measures
2.2.1. Anxiety
Anxiety was measured by five items from the Beck Anxiety Inventory [24]. The BAI was developed to assess anxiety symptoms independently of depression. Its psychometric properties are well established, showing high internal consistency in its original form and also as the brief 5-item assessment used in SHARE (Cronbach’s alpha = 0.71)[28,29]. The items, which assessed anxiety symptoms experienced during the past week, were: ‘I had fear of the worst happening.’, ‘I was nervous.’, ‘I felt my hands trembling.’, ‘I had a fear of dying.’, and ‘I felt faint.’ Items were answered on a 4-point Likert scale: 1 = ‘never’, 2 = ‘hardly ever’, 3 = ‘some of the time’, and 4 = ‘most of the time.’ Individual composite scores for anxiety were calculated as the average response across these items, multiplied by 5 (for consistency with summation score scaling when based on complete data).
2.2.2. Risk/Protective Factors
Data for these analyses were primarily obtained from easySHARE, a curated subset of SHARE variables that have been thoroughly screened. These measures were augmented with other Wave 5 variables related to behavioral risk factors, interpersonal transactions, and health. Additionally, social network variables which were only available at Waves 4 and 6 were included (as the average response across waves) for consistency with our prior SHARE study on depression [21]. These variables have been carefully documented by SHARE (https://share-eric.eu/data/data-documentation).
2.2.3. Demographics, Home Environment, and Personal Finance
Analyses included 6 sociodemographic variables: biological sex, chronological age, education level (based on the International Standard Classification of Education; Schneider [30]), employment status, marital status, and country of residence. Home and finance variables included number of people in the household, household annual income (in Euros), self-rated financial distress, and neighborhood disorder. Self-rated financial distress was based on the question, “Thinking of your household’s monthly income, would you say that your household is able to make ends meet?” Neighborhood disorder was calculated as the average response to four items: “I really feel part of this area,” “Vandalism/crime is a big problem here,” “The area is kept very clean,” and “If I were in trouble, there are people in this area who would help me,” reverse-coded as applicable such that higher scores represented more neighborhood disorder.
2.2.4. Family Configuration, Social Network, and Care-Related Transfers
In addition to marital status (categorized with general demographics), analyses included 9 variables related to family configuration and responsibilities: cohabitation with spouse/partner; numbers of children and grandchildren; residential proximity to children; mortality statuses of parents and siblings; and a question regarding whether family responsibilities prevented the respondent from pursuing personal interests (i.e., family care burden). There were 16 social network variables, which assessed numbers of persons in the network by physical proximity, by frequency of contact, by biological sex, by family member type, and by emotional closeness—as well as summary measures of emotional closeness, frequency of contact, physical distance to network members, and overall (composite) social connectedness [31]. Care-related transfers were assessed by questions as to whether respondents had given and/or received financial support (> 250 Euro in the past year), provided and/or received care from others living outside the home, provided regular personal care inside the home, and/or looked after grandchildren in the absence of the child’s parents.
2.2.5. Health and Functional Limitations
There were 13 measures of health (including lifestyle and functional ability) included here: number of chronic diseases, self-rated poor health, hypertension diagnosis, diabetes diagnosis, body-mass index, (lack of) physical inactivity, daily tobacco smoking (past or present), and frequency of alcohol consumption (e.g., daily, days/week, etc.). The following medical conditions were included in the calculation of chronic diseases: heart attack, hypertension, high blood cholesterol, stroke and/or cerebrovascular disease, diabetes, chronic lung disease, cancer, stomach or duodenal ulcer, Parkinson’s disease, cataracts, hip and/or femoral fracture. Functional health measures included maximum grip strength and four composite scores: difficulties in activities of daily living (ADL; dressing oneself, bathing/showering, eating/cutting up food, walking across a room, and getting out of bed), difficulties in instrumental activities of daily living (IADL; making telephone calls, taking medications, and managing money), difficulties with fine motor skills (picking up a small coin, eating/cutting up food, and dressing), and difficulties with mobility (walking 100m, walking across a room, climbing several flights of stairs, and climbing one flight of stairs).
2.2.6. Cognition and Mental Health
Cognitive measures included numerical ability (the ability to solve serial subtraction problems) and delayed verbal recall memory (ability to remember a 10-item word list after answering additional survey questions). Additionally, loneliness was assessed as a composite of items from the UCLA-3 Loneliness Scale [32]: “lack of companionship”, “feel left out”, “feel isolated from others”—and one additional item, “feel lonely”. Depressive symptoms were not included due to potential overlap with anxiety symptoms (the dependent measure for the study).
2.3. Data Analysis
All analyses were conducted within the R statistical computing environment [33]. The data were split into analysis groups (A1 = random forest machine learning, or RFML; A2 = generalized linear regression, or GLR) using R’s built-in random sampling function, with two-thirds of observations assigned to A1 and one-third to A2. A1 observations were further subdivided such that two-thirds were used for machine learning parameter tuning and one-third were used for testing. This resulted in two sub-samples for the RFML analysis, A1.tune (n = 29,193) and A1.test (n = 14,596), and one sub-sample for the GLR analysis: A2 (n = 21,895). Missing values were imputed using the R software package mice (multiple imputation by chained equations)[34]. A single complete data set was imputed for RFML analyses (which simply provide a rank ordering of variables by predictive importance), whereas 20 complete data sets were imputed for generalized linear regression analysis (with estimates pooled across analyses of the data sets).
2.3.1. Random Forest Machine Learning (RFML)
RFML is a machine learning approach related to classification and regression trees [35]. Regression trees recursively partition observations into sub-groups by predictor selection criteria that maximally discriminate differences in an outcome variable (e.g., anxiety symptoms). Trees are able to account for complex interactions between predictors in rankings of predictive importance, and they are also able to approximate both linear and nonlinear effects by means of several splits within a given predictor. RFML extends this single tree approach, providing built-in cross-validation by generating multiple trees where each tree is derived from randomly sampled subsets of observations and predictors. Thus, RFML has distinct advantages over standard regression-based approaches for comparing risk factors: Variable importance measures implicitly capture linear, nonlinear, and higher-order interaction effects, and problems related to multicollinearity and spurious variable selection are mitigated.
RFML was applied to the A1 sub-samples using the function cforest() from the R package party, with the ‘cforest_unbiased’ option for predictors of mixed types and with variable importance based on the permutation importance [36,37]. Tuning for cforest was applied to the parameters ntree (number of trees) and mtry (number of variables pre-sampled per node). Recommended default values for these parameters, with p = number of predictors, are 2p (ntree) and √p (mtry), which here would give ntree=114 and mtry=8, respectively. Tuning values for ntree were thus selected as ranging from 100–600 (in increments of 100) and for mtry as 8–13. Predictive accuracy (mean absolute error) for each combination of tuning parameters was calculated using the out-of-bag observations (OOB; unsampled observations during tree/forest construction). The ‘test’ RFML was then run using the identified optimal tuning parameter values to obtain variable importance (VIMP) estimates and predictor rankings.
2.3.2. Generalized Linear Regression (GLR)
Stepwise GLR was applied to the A2 data, with a gamma distribution selected for the outcome (given the positive skew in anxiety symptoms). Predictors were entered in decreasing order of VIMP, as determined from the RFML. Nagelkerke’s pseudo-R-square (R2Nk)[38] was used to approximate explained variation in anxiety accounted for by each predictor. An a priori sensitivity analysis (α = .05, β = .80, N = 20,000) showed that a stepwise change in R2 (ΔR2) < .0005 could be reliably determined. As this was exceedingly small in terms of explained variation, a threshold of ΔR2Nk = .005 (one magnitude larger) was selected as the minimum criterion for predictor retention. Regression coefficients (point estimates and standard errors) were pooled across analyses of the imputed data sets using Rubin’s rule as implemented in R package mice [34]. These were exponentiated to further aid interpretation. Point estimates for ΔR2Nk and cumulative R2Nk were obtained by averaging across analyses of the imputed data sets.
3. Results
3.1. Summary Statistics
Figure 1 shows the distribution of anxiety symptoms scores. Anxiety data were missing for only 2.0% of participants. Approximately 10% of SHARE participants showed severe (≥ 12) symptoms counts, as previously reported [29]. Summary statistics for all risk/protective factors in the current analyses are provided in Table 1. Response rates (non-missingness) for all wave 5 variables have previously been provided by SHARE [26] and so are not presented here to conserve space. As noted above, social network variables were only assessed at waves 4 and 6, scores for which were averaged here for wave 5 participants (86.2% of whom were present at wave 4 and/or wave 6).
3.2. Random Forest Machine Learning
RFML parameter tuning results showed diminishing returns (reductions in mean absolute error < .001) beyond ntree=300 and mtry=11, so those parameter values were selected for the RFML test run. Results from the latter (variable importance rankings) are shown in Figure 2. The top predictors were loneliness, self-reported poor health, and country of residence. Additional predictors of note were related to functional health (mobility problems, difficulties in ADL, grip strength), financial distress, family care burden, frequency of alcohol consumption, numerical ability, and neighborhood disorder.
3.3. Generalized Linear Regression
Parameter estimates and R2Nk values for the GLR are presented in Table 2. Predictors for the GLR were entered stepwise in decreasing order of VIMP, with predictor retention determined by ΔR2Nk ≥ .005. Only 7 predictors met this threshold. Although difficulties in ADL was ranked 6th in terms of VIMP, the corresponding ΔR2Nk in the GLR was only .002, so it was removed from the model. Loneliness and self-rated poor health accounted for most of the explained variation in anxiety symptoms (cumulative ΔR2Nk = .272). Country of residence, mobility difficulties, financial distress, family burden, and grip strength accounted for an additional ΔR2Nk = .092, for a total ΔR2Nk = .364 (moderately strong prediction). Directions of effects were as anticipated, with loneliness, self-rated poor health, mobility problems, financial distress, and family burden all predicting increased anxiety symptoms and better grip strength predicting reduced anxiety symptoms. Countries with the highest levels of anxiety were Luxembourg, Israel, and the Czech Republic. Countries with the lowest levels of average were Estonia, the Netherlands, and Sweden.
3.4. Follow-Up Analyses: Predictors of Loneliness
To aid interpretation of the above results, follow-up analyses (employing the same methodology) were applied to self-reported loneliness as an outcome. Results showed that the strongest predictive effects were living with one’s spouse/partner (B = -.185, S.E. = .005, stepwise ΔR2Nk = .110), self-rated poor health (B = .048, S.E. = .002, ΔR2Nk = .081), and family care burden (B = .043, S.E. = .002, ΔR2Nk = .026). Additional analyses that included age and biological sex as moderators of loneliness and self-rated health effects showed that these interaction terms were very weakly associated with anxiety (ΔR2Nk < .001).
4. Discussion
Fifty-seven risk and protective factors were compared as predictors of anxiety symptoms in a population-representative sample of middle-aged and older European adults. Combined results from random forest machine learning (RFML) and generalized linear regression (GLR) analyses showed that loneliness and self-rated poor health were top predictors of anxiety symptoms, with a cumulative R2Nk = .272. Additional notable contributors were country of residence (anxiety was highest in Luxembourg, the Czech Republic, and Israel; anxiety was lowest in Estonia, the Netherlands, and Sweden), functional limitations (more mobility problems and lower grip strength predicted increased anxiety), and financial distress and family care burden (both predicted increased anxiety). With inclusion of these latter predictors, cumulative R2Nk = .364. Biological sex and age were not predictive of differences in anxiety, nor did they moderate associations between the most salient risk/protective factors and anxiety.
These outcomes are consistent with prior summary reports of research on anxiety in later adulthood, which identified poor health and functional limitations as key risk factors [12,13]. They are also consistent with one of very few prior machine learning studies of anxiety predictors in community-dwelling older adults, which similarly identified loneliness as a primary risk factor [23]. Additionally, the most salient risk/protective factors observed in the current study are nearly identical to those observed in our prior machine learning study that focused on depression in SHARE participants. While other large-sample studies have similarly shown that loneliness is linked both with depression and anxiety [39,40], the current results more clearly emphasize the comparative importance (i.e., relative strength of association) of loneliness for predicting anxiety in later adulthood.
Loneliness levels in many countries have been increasing over the past decades, with especially high levels observed in the United States [41]. In a National Academies of Sciences report [42], over 25% of community-dwelling Americans aged 65 and older were found to be socially isolated, with 43% reporting feeling lonely. Summarizing topical research on loneliness, a recent Scientific American article recommended “reaching out to friends that you’ve left behind, doing volunteer work, taking up that hobby that you’ve been putting off, reading books or exercising in group settings” as ways to mitigate loneliness [43]. Here, follow-up analyses showed that none of the 16 social network variables were predictive of differences in loneliness; rather, living with one’s partner/spouse was the single most important predictor of loneliness. This suggests that, for European adults, having a ‘significant other’ living in close proximity may be more important than other socio-relational features in shaping mental health following middle age.
Anxiety may also precede loneliness. In addition to established associations between social anxiety and loneliness [44,45], the current results implicating personal financial pressures, functional limitations, and poor health suggest various possible ways that anxiety may lead to loneliness; E.g., prioritizing work over relational engagements due to financial anxiety, remaining isolated at home due to fear of falling or fear of disease transmission [5,46]. As this was a cross-sectional study, temporal directionality could not be tested. However, there is evidence that loneliness-anxiety associations are bidirectional, with stronger effects for loneliness as the origin [39]. Differences across countries in social resources and norms may also underlie differences both in loneliness and in anxiety [41,47].
Beyond limitations related to directionality of associations, the anxiety measure used for the current study lacked specificity that could have allowed for more nuanced interpretation (i.e., risk factors corresponding to specific anxiety sub-types). Cognitive measures were constrained to those that could be administered via brief screening, which may be why stronger anxiety-cognition associations were not observed (e.g., measures of executive function, such as response inhibition, were lacking)[48]. Strengths of the study are its large, population-representative participant sample, inclusion of a broad range of risk/protective factors, and the machine learning methodology that allowed for comprehensive comparison of predictive effects.
5. Conclusions
Comparative studies of risk and protective factors for generalized anxiety in later adulthood remain lacking in the empirical literature, especially when contrasted with research on late-life depression. The current comparative analyses show that loneliness and self-rated health strongly eclipse other risk and protective factors for predicting anxiety in middle-aged and older European adults.
References
- Kessler, R.C.; Angermeyer, M.; Anthony, J. C.; De Graaf, R. O. N.; Demyttenaere, K.; Gasquet, I.; Üstün, T. B.; et al. Lifetime prevalence and age-of-onset distributions of mental disorders in the World Health Organization's World Mental Health Survey Initiative. World Psychiatry 2007, 6, 168. [Google Scholar]
- Mental Health of Older Adults. Available online: https://www.who.int/news-room/fact-sheets/detail/mental-health-of-older-adults (accessed on 24 March 2021).
- Curran, E.; Rosato, M.; Ferry, F.; Leavey, G. Prevalence and factors associated with anxiety and depression in older adults: Gender differences in psychosocial indicators. J. Affect. Disord. 2020, 267, 114–122. [Google Scholar] [CrossRef]
- Volkert, J.; Schulz, H.; Härter, M.; Wlodarczyk, O.; Andreas, S. The prevalence of mental disorders in older people in Western countries—A meta-analysis. Ageing Res. Rev. 2013, 12, 339–353. [Google Scholar] [CrossRef]
- Witlox, M.; Garnefski, N.; Kraaij, V.; Simou, M.; Dusseldorp, E.; Bohlmeijer, E.; Spinhoven, P. Prevalence of Anxiety Disorders and Subthreshold Anxiety Throughout Later Life: Systematic Review and Meta-Analysis. Psychol. Aging 2021, 36, 268–287. [Google Scholar] [CrossRef]
- Lancet Global Health. Mental health matters. The Lancet. Global Health 2020, 8, e1352. [Google Scholar]
- de Beurs, E.; Beekman, A.T.F.; van Balkom, A.J.L.M.; Deeg, D.J.H.; van Dyck, R.; van Tilburg, W. Consequences of anxiety in older persons: its effect on disability, well-being and use of health services. Psychol. Med. 1999, 29, 583–593. [Google Scholar] [CrossRef]
- de Lijster, J.M.; Dierckx, B.; Utens, E.M.; Verhulst, F.C.; Zieldorff, C.; Dieleman, G.C.; Legerstee, J.S. The Age of Onset of Anxiety Disorders. Can. J. Psychiatry 2017, 62, 237–246. [Google Scholar] [CrossRef]
- Santabárbara, J.; Lipnicki, D.M.; Olaya, B.; Villagrasa, B.; Bueno-Notivol, J.; Nuez, L.; López-Antón, R.; Gracia-García, P. Does Anxiety Increase the Risk of all-Cause Dementia? An Updated Meta-Analysis of Prospective Cohort Studies. J. Clin. Med. 2020, 9, 1791. [Google Scholar] [CrossRef]
- Weisberg, R.B. Overview of generalized anxiety disorder: epidemiology, presentation, and course. J Clin Psychiatry 2009, 70, 4–9. [Google Scholar]
- Weisberg, R.B.; Beard, C.; Moitra, E.; Dyck, I.; Keller, M.B. ADEQUACY OF TREATMENT RECEIVED BY PRIMARY CARE PATIENTS WITH ANXIETY DISORDERS. Depression Anxiety 2014, 31, 443–450. [Google Scholar] [CrossRef]
- Vink, D.; Aartsen, M.J.; Schoevers, R.A. Risk factors for anxiety and depression in the elderly: A review. J. Affect. Disord. 2008, 106, 29–44. [Google Scholar] [CrossRef]
- Wolitzky-Taylor, K.B.; Castriotta, N.; Lenze, E.J.; Stanley, M.A.; Craske, M.G. Anxiety disorders in older adults: a comprehensive review. Depression Anxiety 2010, 27, 190–211. [Google Scholar] [CrossRef]
- Cole, M.G.; Dendukuri, N. Risk Factors for Depression Among Elderly Community Subjects: A Systematic Review and Meta-Analysis. Am. J. Psychiatry 2003, 160, 1147–1156. [Google Scholar] [CrossRef]
- Grenier, S.; Payette, M.; Gunther, B.; Askari, S.; Desjardins, F.F.; Raymond, B.; Berbiche, D. Association of age and gender with anxiety disorders in older adults: A systematic review and meta-analysis. Int. J. Geriatr. Psychiatry 2019, 34, 397–407. [Google Scholar] [CrossRef]
- Aichele, S.; Rabbitt, P.; Ghisletta, P. Think Fast, Feel Fine, Live Long. Psychol. Sci. 2016, 27, 518–529. [Google Scholar] [CrossRef]
- Aichele, S.; Rabbitt, P.; Ghisletta, P. Illness and intelligence are comparatively strong predictors of individual differences in depressive symptoms following middle age. Aging Ment. Heal. 2017, 23, 122–131. [Google Scholar] [CrossRef]
- Aschwanden, D.; Aichele, S.; Ghisletta, P.; Terracciano, A.; Kliegel, M.; Sutin, A.R.; Brown, J.; Allemand, M. Predicting Cognitive Impairment and Dementia: A Machine Learning Approach. J. Alzheimer's Dis. 2020, 75, 717–728. [Google Scholar] [CrossRef]
- Choi, K.W.; Stein, M.B.; Nishimi, K.M.; Ge, T.; Coleman, J.R.; Chen, C.-Y.; Ratanatharathorn, A.; Zheutlin, A.B.; Dunn, E.C.; 23andMe Research Team; et al. An Exposure-Wide and Mendelian Randomization Approach to Identifying Modifiable Factors for the Prevention of Depression. Am. J. Psychiatry 2020, 177, 944–954. [Google Scholar] [CrossRef]
- Puterman, E.; Weiss, J.; Hives, B. A.; Gemmill, A.; Karasek, D.; Mendes, W. B.; Rehkopf, D. H. Predicting mortality from 57 economic, behavioral, social, and psychological factors. Proceedings of the National Academy of Sciences 2020, 117(28), 16273–16282. [Google Scholar]
- Handing, E.P.; Strobl, C.; Jiao, Y.; Feliciano, L.; Aichele, S. Predictors of depression among middle-aged and older men and women in Europe: A machine learning approach. Lancet Reg. Heal. - Eur. 2022, 18, 100391. [Google Scholar] [CrossRef]
- Li, Y.; Song, Y.; Sui, J.; Greiner, R.; Li, X.-M.; Greenshaw, A.J.; Liu, Y.S.; Cao, B. Prospective prediction of anxiety onset in the Canadian longitudinal study on aging (CLSA): A machine learning study. J. Affect. Disord. 2024, 357, 148–155. [Google Scholar] [CrossRef]
- Byeon, H. Exploring Factors for Predicting Anxiety Disorders of the Elderly Living Alone in South Korea Using Interpretable Machine Learning: A Population-Based Study. Int. J. Environ. Res. Public Heal. 2021, 18, 7625. [Google Scholar] [CrossRef]
- Beck, A. T., Epstein. An inventory for measuring clinical anxiety: psychometric properties. Journal of Consulting and Clinical Psychology 1988, 56, 893. [Google Scholar]
- Börsch-Supan, A.; Brandt, M.; Hunkler, C.; Kneip, T.; Korbmacher, J.; Malter, F.; Schaan, B.; Stuck, S.; Zuber, S. Data Resource Profile: The Survey of Health, Ageing and Retirement in Europe (SHARE). Leuk. Res. 2013, 42, 992–1001. [Google Scholar] [CrossRef]
- SHARE-ERIC. Survey of Health, Ageing and Retirement in Europe (SHARE) Wave 5. Release version: 9.0.0. SHARE-ERIC. Data set. 2024. [Google Scholar] [CrossRef]
- Bergmann, M., Kneip. Survey participation in the survey of health, ageing and retirement in Europe (SHARE), Wave 1-6. Munich: Munich Center for the Economics of Aging. 2017. [Google Scholar]
- Bardhoshi, G.; Duncan, K.; Erford, B.T. Psychometric Meta-Analysis of the English Version of the Beck Anxiety Inventory. J. Couns. Dev. 2016, 94, 356–373. [Google Scholar] [CrossRef]
- Chlapecka, A.; Wolfová, K.; Fryčová, B.; Cermakova, P. Educational attainment and anxiety in middle-aged and older Europeans. Sci. Rep. 2023, 13, 1–11. [Google Scholar] [CrossRef]
- Schneider, S.L. The international standard classification of education 2011. In Class and stratification analysis; Emerald Group Publishing Limited, 2013; Volume 30, pp. 365–379. [Google Scholar]
- Litwin, H.; Stoeckel, K.J. Social network, activity participation, and cognition: A complex relationship. Research on Aging 2015, 38, 76–97. [Google Scholar]
- Hughes, M.E.; Waite, L.J.; Hawkley, L.C.; Cacioppo, J.T. A Short Scale for Measuring Loneliness in Large Surveys. Res. Aging 2004, 26, 655–672. [Google Scholar] [CrossRef]
- R Core Team. R: A Language and Environment for Statistical Computing; R Foundation for Statistical Computing: Vienna, Austria, 2024; Available online: https://www.R-project.org/ (accessed on 14 January 2024).
- van Buuren, S.; Groothuis-Oudshoorn, K. mice: Multivariate Imputation by Chained Equations inR. J. Stat. Softw. 2011, 45, 1–67. [Google Scholar] [CrossRef]
- Breiman, L. Random forests. Mach. Learn. 2001, 45, 5–32. [Google Scholar] [CrossRef]
- Strobl, C.; Boulesteix, A.-L.; Zeileis, A.; Hothorn, T. Bias in random forest variable importance measures: Illustrations, sources and a solution. BMC Bioinform. 2007, 8, 25–25. [Google Scholar] [CrossRef]
- Strobl, C.; Malley, J.; Tutz, G. An introduction to recursive partitioning: Rationale, application, and characteristics of classification and regression trees, bagging, and random forests. Psychol. Methods 2009, 14, 323–348. [Google Scholar] [CrossRef]
- Nagelkerke, N. J. A note on a general definition of the coefficient of determination. Biometrika 1991, 78, 691–692. [Google Scholar]
- Domènech-Abella, J.; Mundó, J.; Haro, J.M.; Rubio-Valera, M. Anxiety, depression, loneliness and social network in the elderly: Longitudinal associations from The Irish Longitudinal Study on Ageing (TILDA). J. Affect. Disord. 2019, 246, 82–88. [Google Scholar] [CrossRef]
- Steen, O.D.; Ori, A.P.S.; Wardenaar, K.J.; van Loo, H.M. Loneliness associates strongly with anxiety and depression during the COVID pandemic, especially in men and younger adults. Sci. Rep. 2022, 12, 1–11. [Google Scholar] [CrossRef]
- Infurna, F.J.; Dey, N.E.Y.; Avilés, T.G.; Grimm, K.J.; Lachman, M.E.; Gerstorf, D. Loneliness in midlife: Historical increases and elevated levels in the United States compared with Europe. Am. Psychol. 2024. [Google Scholar] [CrossRef]
- National Academies of Sciences, Division of Behavioral, Medicine Division, Board on Behavioral, Sensory Sciences, Board on Health Sciences Policy,... & Loneliness in Older Adults. (2020). Social isolation and loneliness in older adults: Opportunities for the health care system. National Academies Press.
- Novak, S. Americans are lonelier than Europeans in middle age. Scientific American. 2024. Available online: https://www.scientificamerican.com/article/americans-are-lonelier-than-europeans-in-middle-age/.
- Eres, R.; Lim, M.H.; Lanham, S.; Jillard, C.; Bates, G. Loneliness and emotion regulation: implications of having social anxiety disorder. Aust. J. Psychol. 2021, 73, 46–56. [Google Scholar] [CrossRef]
- Lim, M.H.; Rodebaugh, T.L.; Zyphur, M.J.; Gleeson, J.F.M. Loneliness over time: The crucial role of social anxiety. J. Abnorm. Psychol. 2016, 125, 620–630. [Google Scholar] [CrossRef]
- Gaeta, L.; Brydges, C.R. Coronavirus-related anxiety, social isolation, and loneliness in older adults in Northern California during the stay-at-home order. In The COVID-19 Pandemic and Older Adults; Routledge, 2022; pp. 21–32. [Google Scholar]
- Ridley, M.; Rao, G.; Schilbach, F.; Patel, V. Poverty, depression, and anxiety: Causal evidence and mechanisms. Science 2020, 370, 1289. [Google Scholar] [CrossRef]
- Beaudreau, S.A.; O'Hara, R. The association of anxiety and depressive symptoms with cognitive performance in community-dwelling older adults. Psychol. Aging 2009, 24, 507–512. [Google Scholar] [CrossRef]
Figure 1.
Distribution of composite anxiety scores (based on 5 items, each scaled from 1 to 4; higher levels = greater severity). The dotted vertical line shows the threshold for severe anxiety symptoms (≥12).
Figure 1.
Distribution of composite anxiety scores (based on 5 items, each scaled from 1 to 4; higher levels = greater severity). The dotted vertical line shows the threshold for severe anxiety symptoms (≥12).
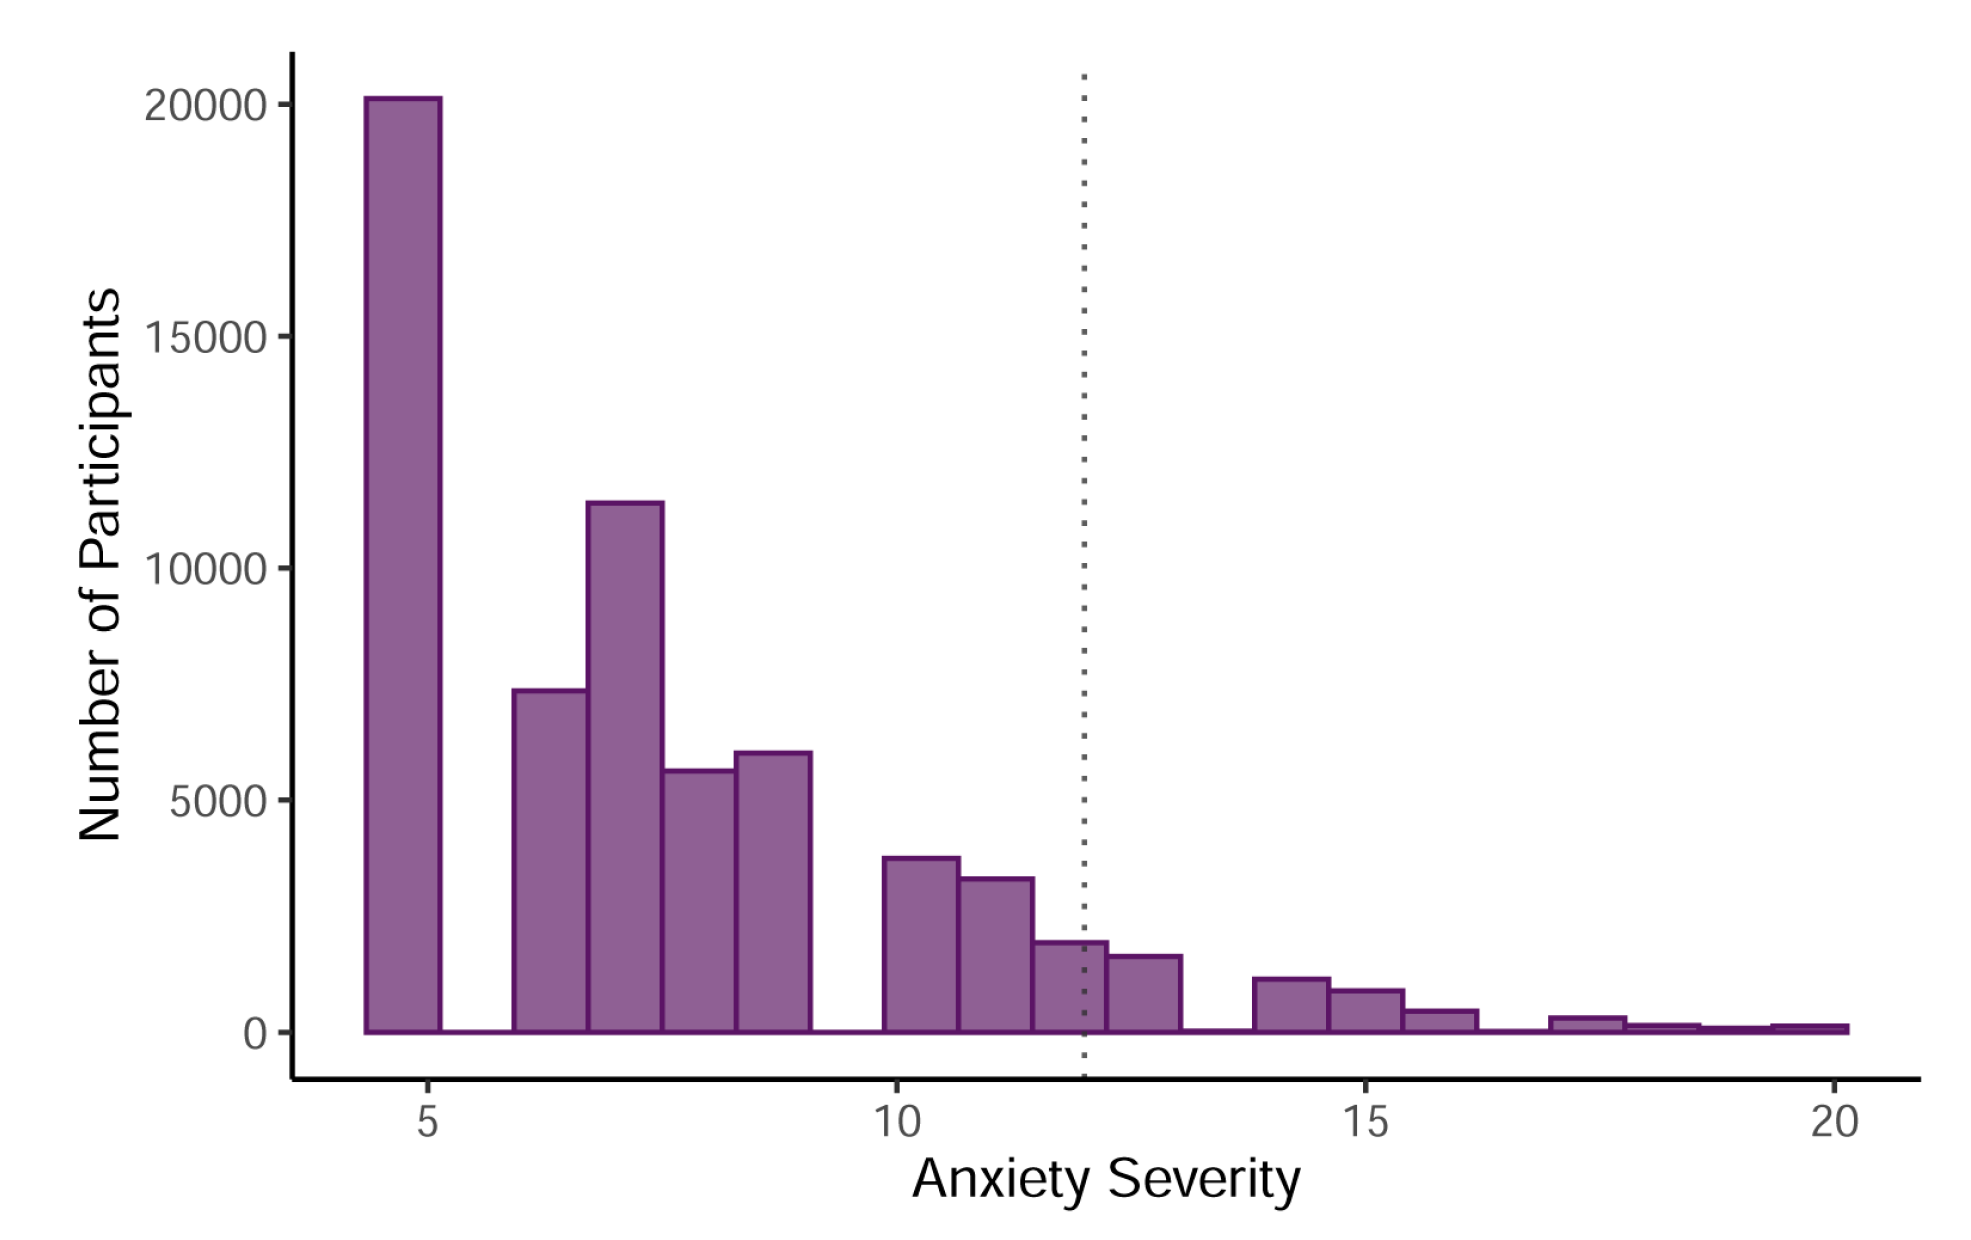
Figure 2.
RFML results of predictors’ variable importance (VIMP) in decreasing order. SN = social network (members). The dotted horizontal line marks the point below which all remaining predictors contributed < 0.5% to explained variation in anxiety symptoms.
Figure 2.
RFML results of predictors’ variable importance (VIMP) in decreasing order. SN = social network (members). The dotted horizontal line marks the point below which all remaining predictors contributed < 0.5% to explained variation in anxiety symptoms.
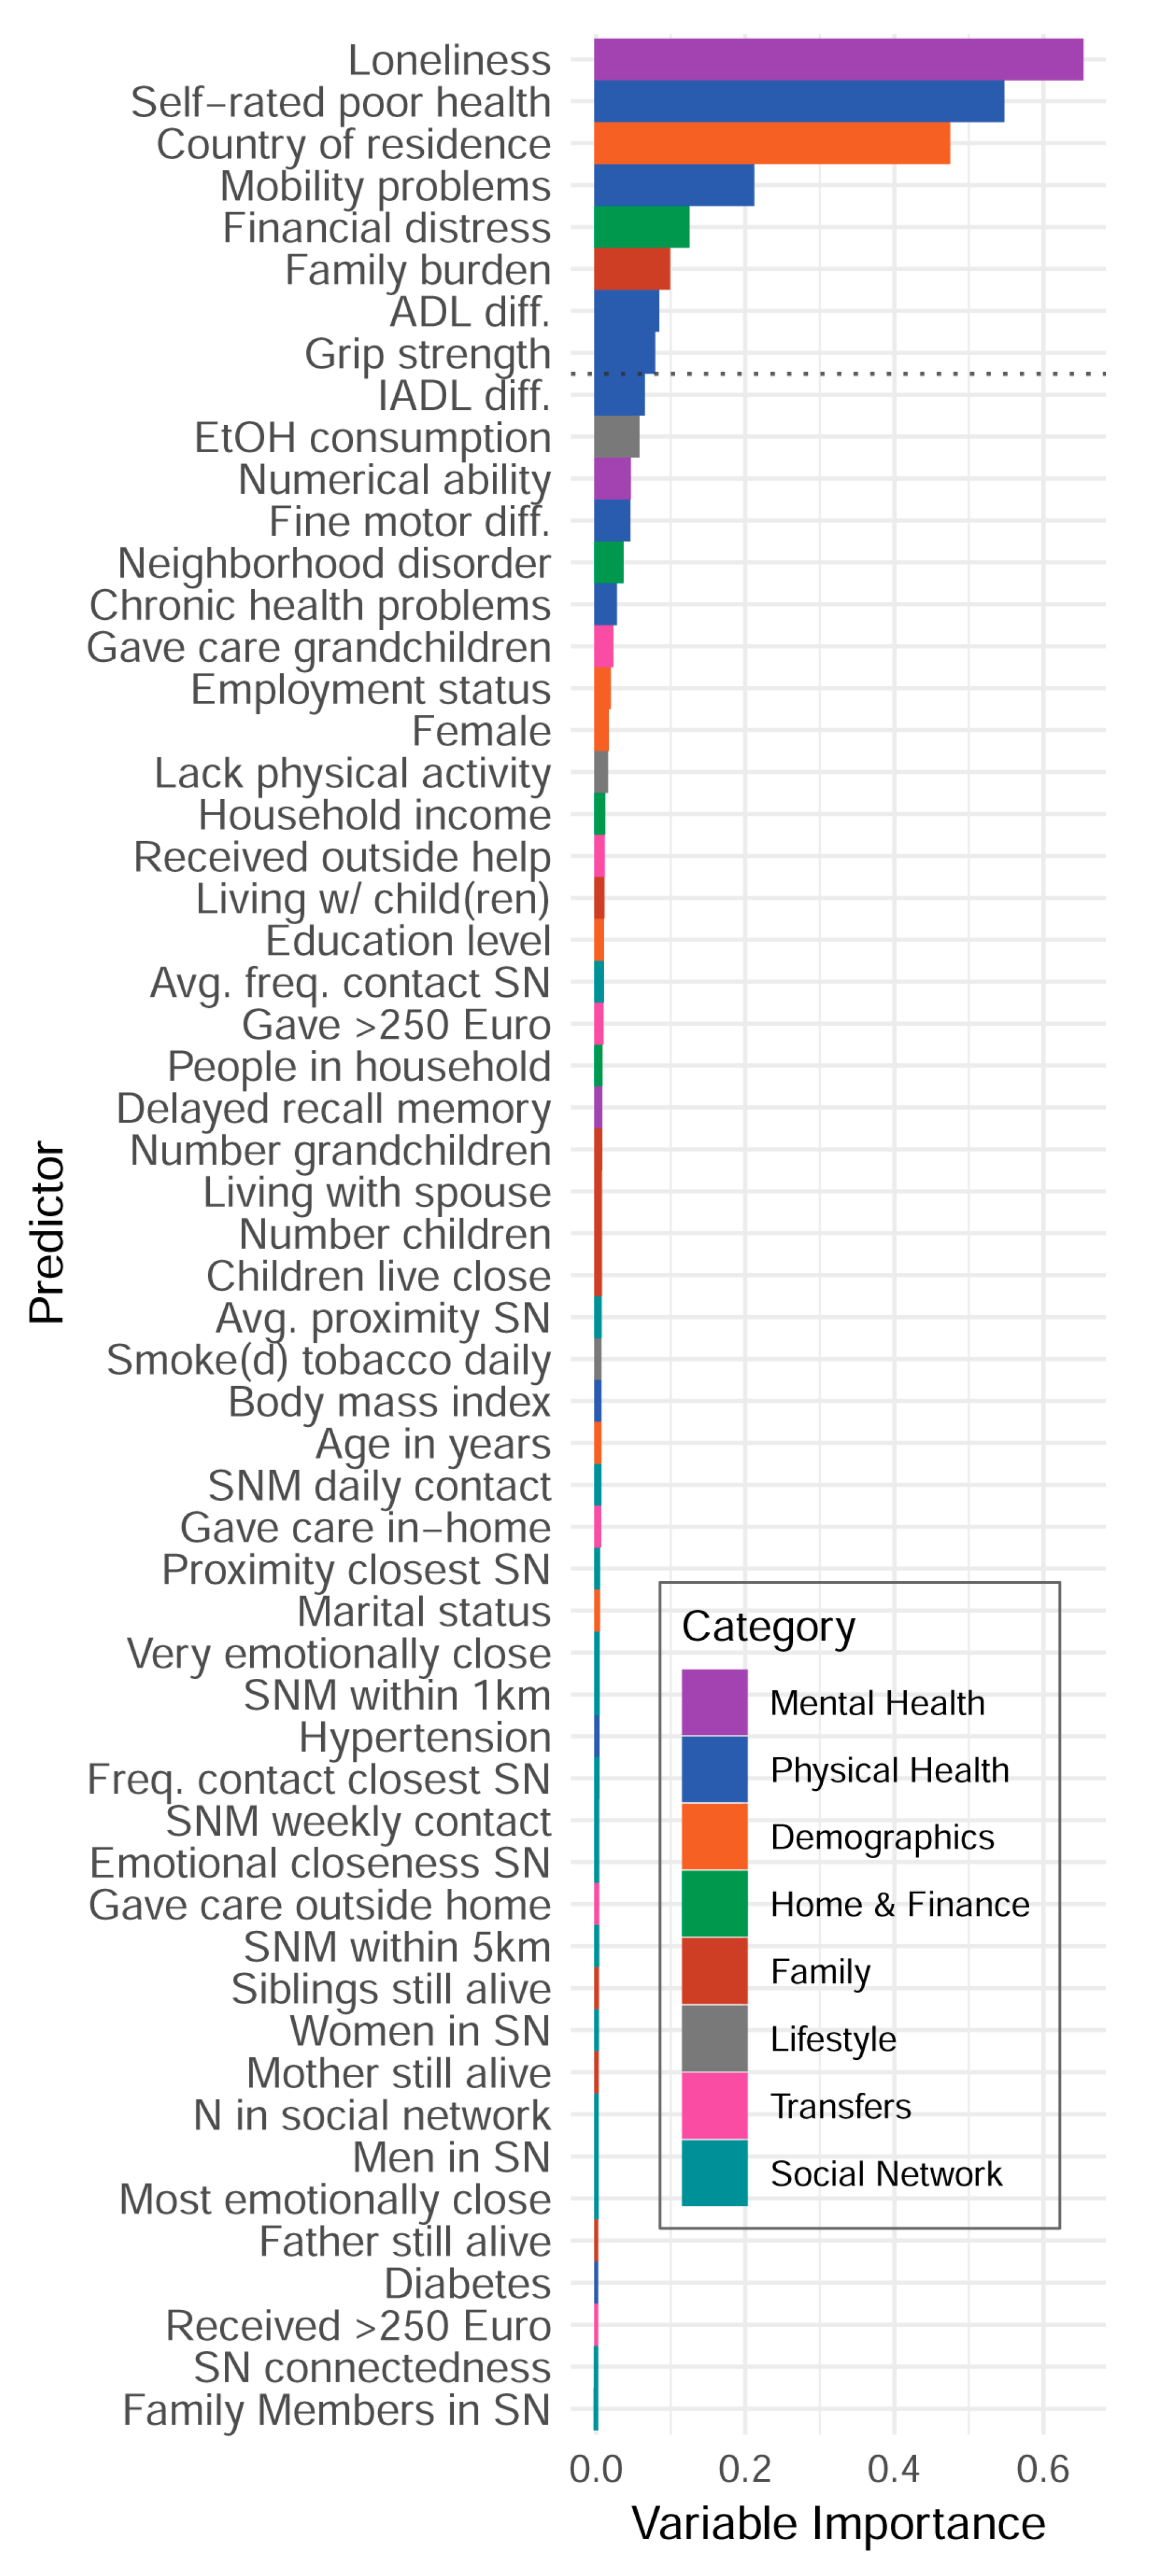

Table 1.
Sample descriptive statistics of variables included in analyses.
| Demographics (N = 65,684) | Summary Statistic |
|---|---|
| 1. Women | n=36,563 (55.7%) |
| 2. Age in years | Mdn=65.9, Range=(45.0, 103.5) |
| 3. Education level None Primary Lower secondary Upper secondary Post-secondary First stage tertiary Second stage tertiary |
n=3,026 ( 4.6%) n=10,683 (16.3%) n=11,889 (18.1%) n=21,163 (32.2%) n=2,945 (4.5%) n=14,231 (21.7%) n=590 (0.9%) |
| 4. Employment status Retired Employed or self-employed Unemployed Permanently sick /disabled Homemaker |
n=36,590 (55.7%) n=18,023 (27.4%) n=1,868 (2.8%) n=2,313 (3.5%) n=5,244 (8.0%) |
| 5. Marital status Married & living w/spouse Registered partnership Separated Never married Divorced Widowed |
n=44,825 (68.2%) n=964 (1.5%) n=769 (1.2%) n=3,615 (5.5%) n=5,673 (8.6%) n=9,403 (14.3%) |
| 6. Country or residence (15 countries; ns not reported to preserve space) | |
| Home and personal finance | |
| 7. # People in household | Mdn=2.0, IQR=(2.0, 2.0) |
| 8. Household income in Euro (*1k) | Mdn=24,877, IQR=(14.5; 42.4) |
| 9. Financial distress1 | Mdn=2.0, IQR=(1.0, 3.0) |
| 10. Neighborhood disorder | Mdn=3.2, IQR=(3.0, 3.8) |
| Family | |
| 11. Living with partner/spouse | n=48,072 (73.2%) |
| 12. # Children | Mdn=2.0, IQR=(1.0, 3.0) |
| 13. # Grandchildren | Mdn=2.0, IQR=(1.0, 4.0) |
| 14. ≥ 1 child in same household | n=15,915 (24.2%) |
| 15. ≥ 1 child lives < 1km away | n=22,184 (33.8%) |
| 16. Mother still alive | n=14,408 (21.9%) |
| 17. Father still alive | n=5,898 (9%) |
| 18. # siblings still alive | Mdn=2.0, IQR=(1.0, 3.0) |
| 19. Burden of family responsibilities1 | M=1.8, SD=1 |
| Table 1. (cont.’d) | |
| Social network | |
| 20. Size social network | Mdn=2.5, IQR=(1.5, 3.5) |
| 21. # SNM in daily contact | Mdn=1.0, IQR=(1.0, 1.5) |
| 22. # SNM in weekly contact | Mdn=2.0, IQR=(1.0, 3.0) |
| 23. # Family members in SNM | Mdn=2.0, IQR=(1.0, 3.0) |
| 24. # Women in SNM | Mdn=1.0, IQR=(1.0, 2.0) |
| 25. # Men in SNM | Mdn=1.0, IQR=(0.0, 1.5) |
| 26. Avg. proximity of SNM | M=3.2, SD=1.5 |
| 27. Proximity, closest SNM | M=1.9, SD=1.4 |
| 28. # SNM within 1km | M=1.2, SD=0.9 |
| 29. # SNM within 5km | M=1.6, SD=1 |
| 30. Avg. freq. of contact from SNM | M=1.9, SD=0.9 |
| 31. Freq. contact, closest SNM | M=1.3, SD=0.7 |
| 32. Avg. emotional closeness in SNM | M=3.3, SD=0.6 |
| 33. Emotional closeness, closest SNM | M=3.6, SD=0.6 |
| 34. # Very emotionally close SNM | Mdn=2.0, IQR=(1.0, 3.0) |
| 35. Social connectedness | M=2, SD=0.9 |
| Care-related transfers (past year) | |
| 36. Received support >250 Euro | n=3,558 (5.4%) |
| 37. Received outside help | n=12,314 (18.7%) |
| 38. Gave support >250 Euro | n=13,104 (20%) |
| 39. Gave regular care in-home | n=4,425 (6.7%) |
| 40. Gave help outside home | n=12,917 (19.7%) |
| 41. Gave care for grandchildren | n=14,322 (21.8%) |
| Health and functional limitations | |
| 42. # Chronic diseases | M=1.2, SD=1.2 |
| 43. Self-rated poor health | M=3.1, SD=1.1 |
| 44. Hypertension diagnosis | n=25,800 (39.3%) |
| 45. Diabetes diagnosis | n=8,400 (12.8%) |
| 46. Body mass index | M=26.8, SD=4.7 |
| 47. Lack of physical activity | M=2.6, SD=1.3 |
| 48. Ever smoked daily | n=29,661 (45.2%) |
| 49. Alcohol consumption frequency | M=3.4, SD=2.2 |
| 50. Maximum grip strength | M=33.7, SD=11.8 |
| 51–54. Difficulties in: | |
| Activities of daily living (ADL) | M=0.2, SD=0.8 |
| Instrumental activities (IADL) | M=0.1, SD=0.5 |
| Fine motor skills | M=0.2, SD=0.5 |
| Mobility | M=0.5, SD=1.0 |
| Table 1. (cont.’d) | |
| Cognition and mental health | |
| 55. Numerical ability | M=4.1, SD=1.5 |
| 56. Delayed recall memory | M=3.9, SD=2.2 |
| 57. Loneliness | M=1.3, SD=0.4 |
| OC. Anxiety symptoms | M=7.6, SD=2.9 |
Note: Predictors are numbered. OC = “outcome”. IQR = interquartile range. 1 Items were reverse-coded from their original SHARE scaling to aid interpretation.
Table 2.
Estimates from the generalized linear regression model.
| Estimates (unstandardized) |
Estimates (standardized) |
R2Nk | |||||
|---|---|---|---|---|---|---|---|
| Predictor | B | S.E. | B.exp | β | β.exp | stepwise | cumulative |
| (Intercept) | 1.560 | 0.028 | 4.761 | 2.019 | 7.530 | ||
| Loneliness | 0.172 | 0.005 | 1.187 | 0.077 | 1.081 | 0.169 | 0.169 |
| Self-rated poor health | 0.069 | 0.002 | 1.071 | 0.075 | 1.078 | 0.103 | 0.272 |
| Country of residencea | 0.044 | 0.316 | |||||
| Austria | -0.004 | 0.010 | 0.996 | -0.001 | 0.999 | ||
| Sweden | -0.105 | 0.010 | 0.901 | -0.027 | 0.973 | ||
| Netherlands | -0.111 | 0.010 | 0.895 | -0.028 | 0.973 | ||
| Spain | 0.048 | 0.010 | 1.050 | 0.014 | 1.015 | ||
| Italy | -0.033 | 0.010 | 0.967 | -0.009 | 0.992 | ||
| France | -0.038 | 0.010 | 0.963 | -0.010 | 0.991 | ||
| Denmark | -0.068 | 0.011 | 0.935 | -0.016 | 0.984 | ||
| Switzerland | -0.023 | 0.012 | 0.977 | -0.005 | 0.995 | ||
| Belgium | 0.018 | 0.010 | 1.018 | 0.005 | 1.005 | ||
| Israel | 0.050 | 0.013 | 1.052 | 0.010 | 1.010 | ||
| Czech Republic | 0.050 | 0.010 | 1.051 | 0.014 | 1.014 | ||
| Luxembourg | 0.092 | 0.014 | 1.096 | 0.014 | 1.015 | ||
| Slovenia | -0.033 | 0.012 | 0.967 | -0.007 | 0.993 | ||
| Estonia | -0.112 | 0.010 | 0.894 | -0.031 | 0.970 | ||
| Mobility problems | 0.049 | 0.003 | 1.050 | 0.048 | 1.049 | 0.019 | 0.335 |
| Financial distress | 0.036 | 0.002 | 1.037 | 0.036 | 1.036 | 0.010 | 0.345 |
| Family burden | 0.038 | 0.002 | 1.039 | 0.036 | 1.037 | 0.011 | 0.356 |
| Grip strength | -0.003 | 0.000 | 0.997 | -0.037 | 0.963 | 0.009 | 0.364 |
| Biological sex (Female) | -0.003 | 0.006 | 0.997 | -0.001 | 0.999 | 0.000 | 0.364 |
| Age in years | 0.000 | 0.000 | 1.000 | -0.004 | 0.996 | 0.000 | 0.364 |
Note: The model assumed a gamma-distributed outcome with log link. Only variables that contributed greater than .005 in stepwise change in Nagelkerke’s pseudo-R2 (ΔR2Nk) were included in the final model. Estimates (standardized) = predictors were standardized but the dependent variable was not. Non-significant estimates (p < .005) are shown italicized. a Germany was the reference (intercept) country
Disclaimer/Publisher’s Note: The statements, opinions and data contained in all publications are solely those of the individual author(s) and contributor(s) and not of MDPI and/or the editor(s). MDPI and/or the editor(s) disclaim responsibility for any injury to people or property resulting from any ideas, methods, instructions or products referred to in the content. |
© 2024 by the authors. Licensee MDPI, Basel, Switzerland. This article is an open access article distributed under the terms and conditions of the Creative Commons Attribution (CC BY) license (http://creativecommons.org/licenses/by/4.0/).
Copyright: This open access article is published under a Creative Commons CC BY 4.0 license, which permit the free download, distribution, and reuse, provided that the author and preprint are cited in any reuse.


