Submitted:
14 July 2025
Posted:
31 July 2025
You are already at the latest version
Abstract
In the present study, a comprehensive framework for visualizing and analyzing long-term (1979-2023) temperature and precipitation from the Indian Monsoon Data Assimilation and Analysis reanalysis (IMDAA) data across India is developed. The IMDAA is a regional atmospheric reanalysis that uses high-resolution regional models and helps study the regional/local synoptic and mesoscale processes over the Indian subcontinent with a better grid resolution than the global reanalysis products. Key components of the study include data processing of the vast amount of data, comprising over 8000 NetCDF files representing temperature / Precipitation data at different times, which is addressed through Python scripts to transform and aggregate the data into a usable format. Utilizing open-source modern web development technologies, including React.js and Mongo DB, the project delivers a user- friendly interface for visualizing Temperature and precipitation data on an interactive map. Integrating React Leaflet Map and Chart.js enables users to explore historical temperature trends at specific coordinates, facilitating informed analysis and decision-making. The project's significance lies in its potential to empower users, including scientists and researchers, with the tools to explore and understand long-term trends at a granular level (e.g., Temperature and precipitation were found to be increasing at the rate of 0.01 0 c yr -1 and 0.11 Kg/m 2 yr -1 at Jaipur). Users can check long-term Temperature and precipitation trends at any location and use graphs for further analysis. A similar framework can be used to display other climate variables present in IMDAA to users.
Keywords:
temperature
; precipitation
; climate
; IMDAA
; open source tools
1. Introduction
Climate variability and change pose significant challenges to environmental sustainability, agricultural planning, water resource management, and public health—particularly in countries like India, where the effects are often spatially and temporally diverse. Accurate monitoring and visualization of key climate variables such as temperature and precipitation are critical for understanding regional trends, informing policy decisions, and enhancing climate resilience.
Advances in remote sensing and reanalysis models have led to the availability of high-resolution, satellite-derived climate datasets, such as 2-meter temperature and precipitation estimates, which represent near-surface conditions relevant to human and ecological systems. However, accessing and interpreting these large, multidimensional datasets remains a technical barrier for non-specialist users, including researchers, students, policymakers, and the general public.
To bridge this gap, the current project presents the development of an interactive web application for the visual exploration and analysis of satellite-derived climate datasets over India. The application focuses on near-surface parameters (e.g., 2-meter air temperature and precipitation) and enables users to interactively navigate, query, and visualize spatial and temporal patterns at regional scales.
By leveraging modern web technologies and geospatial data visualization libraries, this tool provides a user-friendly interface for viewing trends, downloading data, and generating location-specific time series. The application is designed to promote accessibility, transparency, and broader engagement with climate data, making it a valuable resource for education, research, and policy support.
The increasing availability of satellite and model-based climate datasets has spurred interest in developing tools that simplify data access and visualization. Numerous studies and platforms have explored web-based approaches for climate monitoring. For instance, the NASA POWER and Giovanni portals provide access to gridded climate data but are often complex for non-expert users. Tools like Google Earth Engine offer powerful data analysis capabilities but require coding skills.
Several previous projects have demonstrated the use of web technologies for geospatial visualization. Interactive dashboards using tools like Leaflet, D3.js, and Plotly have proven effective in communicating environmental trends. However, many existing platforms are either global in scope or lack fine spatial resolution and customization for a specific region such as India.
Furthermore, despite the growing interest in climate services, there remains a need for localized, user-friendly interfaces that can visualize near-surface parameters (like 2-meter temperature) with intuitive navigation, time filtering, and export capabilities. This project addresses that gap by tailoring a climate data visualization tool specifically for India, with emphasis on accessibility, interactivity, and relevance.
2. Data and Methodology:
Data Collection and Pre-processing:
The IMDAA (Indian Monsoon Data Assimilation and Analysis) dataset provided hourly meteorological data (https://rds.ncmrwf.gov.in/datasets) for the Indian region. This dataset, compiled by the Indian Meteorological Department (IMD), includes parameters such as temperature, humidity, wind speed, and precipitation. The dataset is derived from a combination of satellite observations, ground-based measurements, and numerical weather prediction models, providing comprehensive coverage of weather conditions across India. Python scripts were developed to convert raw NetCDF files into a more accessible JSON (JavaScript Object Notation) format. These scripts utilized libraries such as NetCDF4 and h5py to read NetCDF files and extract temperature and precipitation data arrays. The extracted data was then processed and aggregated to calculate yearly average temperatures for each geographical coordinate. Finally, the processed data was formatted into JSON objects for storage and visualization in the web application. Data aggregation techniques were employed to condense hourly temperature and precipitation measurements into yearly averages. The aggregated data was then used to generate visualizations depicting temperature and precipitation trends and variations across different regions of India.
2.1. Database Design and Implementation
MongoDB Overview
MongoDB, a document-oriented NoSQL database, was chosen for its scalability, flexibility, and support for geospatial queries. MongoDB stores data in JSON-like documents, making it well-suited for storing heterogeneous datasets with varying data types. Its geospatial indexing feature enables efficient storage and retrieval of spatial data, facilitating spatial queries based on coordinates. The database was designed to store temperature and precipitation data alongside corresponding geographical coordinates, enabling spatial analysis and visualization in the web application.
Geospatial Queries in MongoDB
MongoDB's geospatial querying capabilities were leveraged to retrieve temperature and precipitation data based on geographical coordinates. Geospatial indexes were created on the database to optimize spatial queries, ensuring fast and efficient retrieval of temperature and precipitation data for specific locations. Queries such as nearest neighbor search and polygon containment were used to identify temperature and precipitation data points within a given radius or geographical area. These queries enabled users to visualize temperature and precipitation data at specific locations on the map and analyze temperature and precipitation trends across different regions of India.
2.2. Web Application Development
Frontend Development with React
The frontend of the web application was developed using React.js, a popular JavaScript library for building user interfaces. React components were used to create interactive UI elements such as maps, charts, and data filters. State management techniques such as Redux or Context API were employed to manage application state and handle user interactions. React Router was used for client-side routing, allowing for seamless navigation between different views of the application.
Backend Development with Node.js
Node.js was utilized for backend development, providing a runtime environment for executing server-side JavaScript code. Node.js offers non-blocking, event-driven architecture, making it well-suited for building scalable and high-performance web applications. Express.js, a minimal and flexible Node.js web application framework, was used to handle server-side logic, routing, and middleware integration. APIs were developed using Express.js to facilitate communication between the frontend and backend components of the application.
Middleware such as body-parser and cors were employed for request parsing and handling cross-origin resource sharing (CORS) issues, respectively.
Styling with Tailwind CSS
Tailwind CSS, a utility-first CSS framework, was used for styling the frontend components of the web application. Tailwind's utility classes allowed for rapid prototyping and customization of UI elements, without the need for writing custom CSS. Responsive design principles were applied to ensure that the application was accessible and functional across a range of devices and screen sizes.
Interactive Map with React Leaflet
React Leaflet, a React wrapper for the Leaflet.js library, was integrated into the web application to provide interactive map functionality. React Leaflet components such as Map, TileLayer, and Marker were used to render maps, overlay geographical data, and display interactive markers. Event handling mechanisms provided by React Leaflet allowed for user interactions such as zooming, panning, and clicking on map elements.
Data Visualization with Chart.js
Chart.js, a JavaScript library for creating interactive charts and graphs, was used to visualize temperature and precipitation data in the web application. Chart.js provides a range of chart types, including line charts, bar charts, and scatter plots, which were used to represent temperature and precipitation trends and variations. Customization options such as colors, labels, and tooltips were applied to enhance the visual appeal and usability of the charts.
2.3. Implementation
The implementation phase of the project encompasses the detailed steps taken to build and deploy the system. This includes the architecture design, data flow processes, module development, code implementation, and testing. Each component of the system is explained thoroughly to give a comprehensive understanding of the project execution.
2.3.1. System Architecture
The system architecture forms the backbone of the project, integrating various components to ensure seamless operation. The architecture is designed to be modular, scalable, and maintainable, accommodating future enhancements and additional data parameters.
High-Level System Architecture:
- 1.
- Data Acquisition Layer:
- Data Sources: The primary source is the IMDAA dataset, providing hourly temperature and precipitation data in NetCDF format.
- Data Extraction: Python scripts are used to read and process the NetCDF files.
- 2.
- Data Processing Layer:
- Data Aggregation: Hourly data is aggregated into yearly averages using Python and its libraries (NetCDF4 and Pandas).
- Data Transformation: Aggregated data is converted into JSON format for ease of storage and retrieval.
- 1.
- Data Storage Layer:
- Database Selection: MongoDB is chosen for its flexibility and support for geospatial queries.
- Data Ingestion: JSON files are imported into MongoDB, ensuring efficient indexing and query capabilities.
- 2.
- Web Application Layer:
- Frontend: Built using React.js, with Tailwind CSS for styling.
- Map Integration: React Leaflet is used for interactive map functionalities.
- Data Visualization: Chart.js is employed to render temperature and precipitation trends and other visual representations.
2.3.2. User Interaction Layer:
- User Interface: Provides tools for users to interact with the map, select coordinates, and view historical temperature and precipitation data.
- APIs: Backend APIs are implemented to handle data requests from the frontend, ensuring smooth data flow.
2.3.4. Data Flow
A data flow (DF) provides a flow of data through the system. It helps in understanding how data moves from one process to another, highlighting key operations.
Key Components of the DF:
- 1.
- Data Input:
- -
- NetCDF Files: Source data files containing hourly temperature and precipitation measurements.
- -
- Python Scripts: Extract and process data from NetCDF files.
- 2.
- Data Processing:
- -
- Aggregation Module: Converts hourly data into yearly averages.
- -
- Transformation Module: Converts aggregated data into JSON format.
- 2.
- Data Storage:
- -
- Database: MongoDB stores the processed data with geospatial indexing for efficient queries.
- 3.
- Frontend Application:
- -
- React Components: Handle user inputs and display data.
- -
- Map Interface: React Leaflet for interactive map functionalities.
- 4.
- Data Visualization:
- -
- Chart.js: Renders charts to display historical temperature and precipitation data.
DFD Diagram:
A detailed diagram showing the data flow between components, illustrating processes, data stores, and data movements.
3. Results and Discussion
In the present study a comprehensive framework for visualizing and analyzing long term (1979-2023) temperature and precipitation from The Indian Monsoon Data Assimilation and Analysis reanalysis (IMDAA) data across India is developed. The IMDAA is a regional atmospheric reanalysis which uses high resolution regional models and useful to study the regional/local synoptic and meso-scale processes over the Indian subcontinent with a better grid resolution compared to the global reanalyses products.
Key components of the study include data processing of the vast amount of data, comprising over 8000 NetCDF files representing temperature / Precipitation data at different times, is addressed through Python scripts to transform and aggregate the data into a usable format.
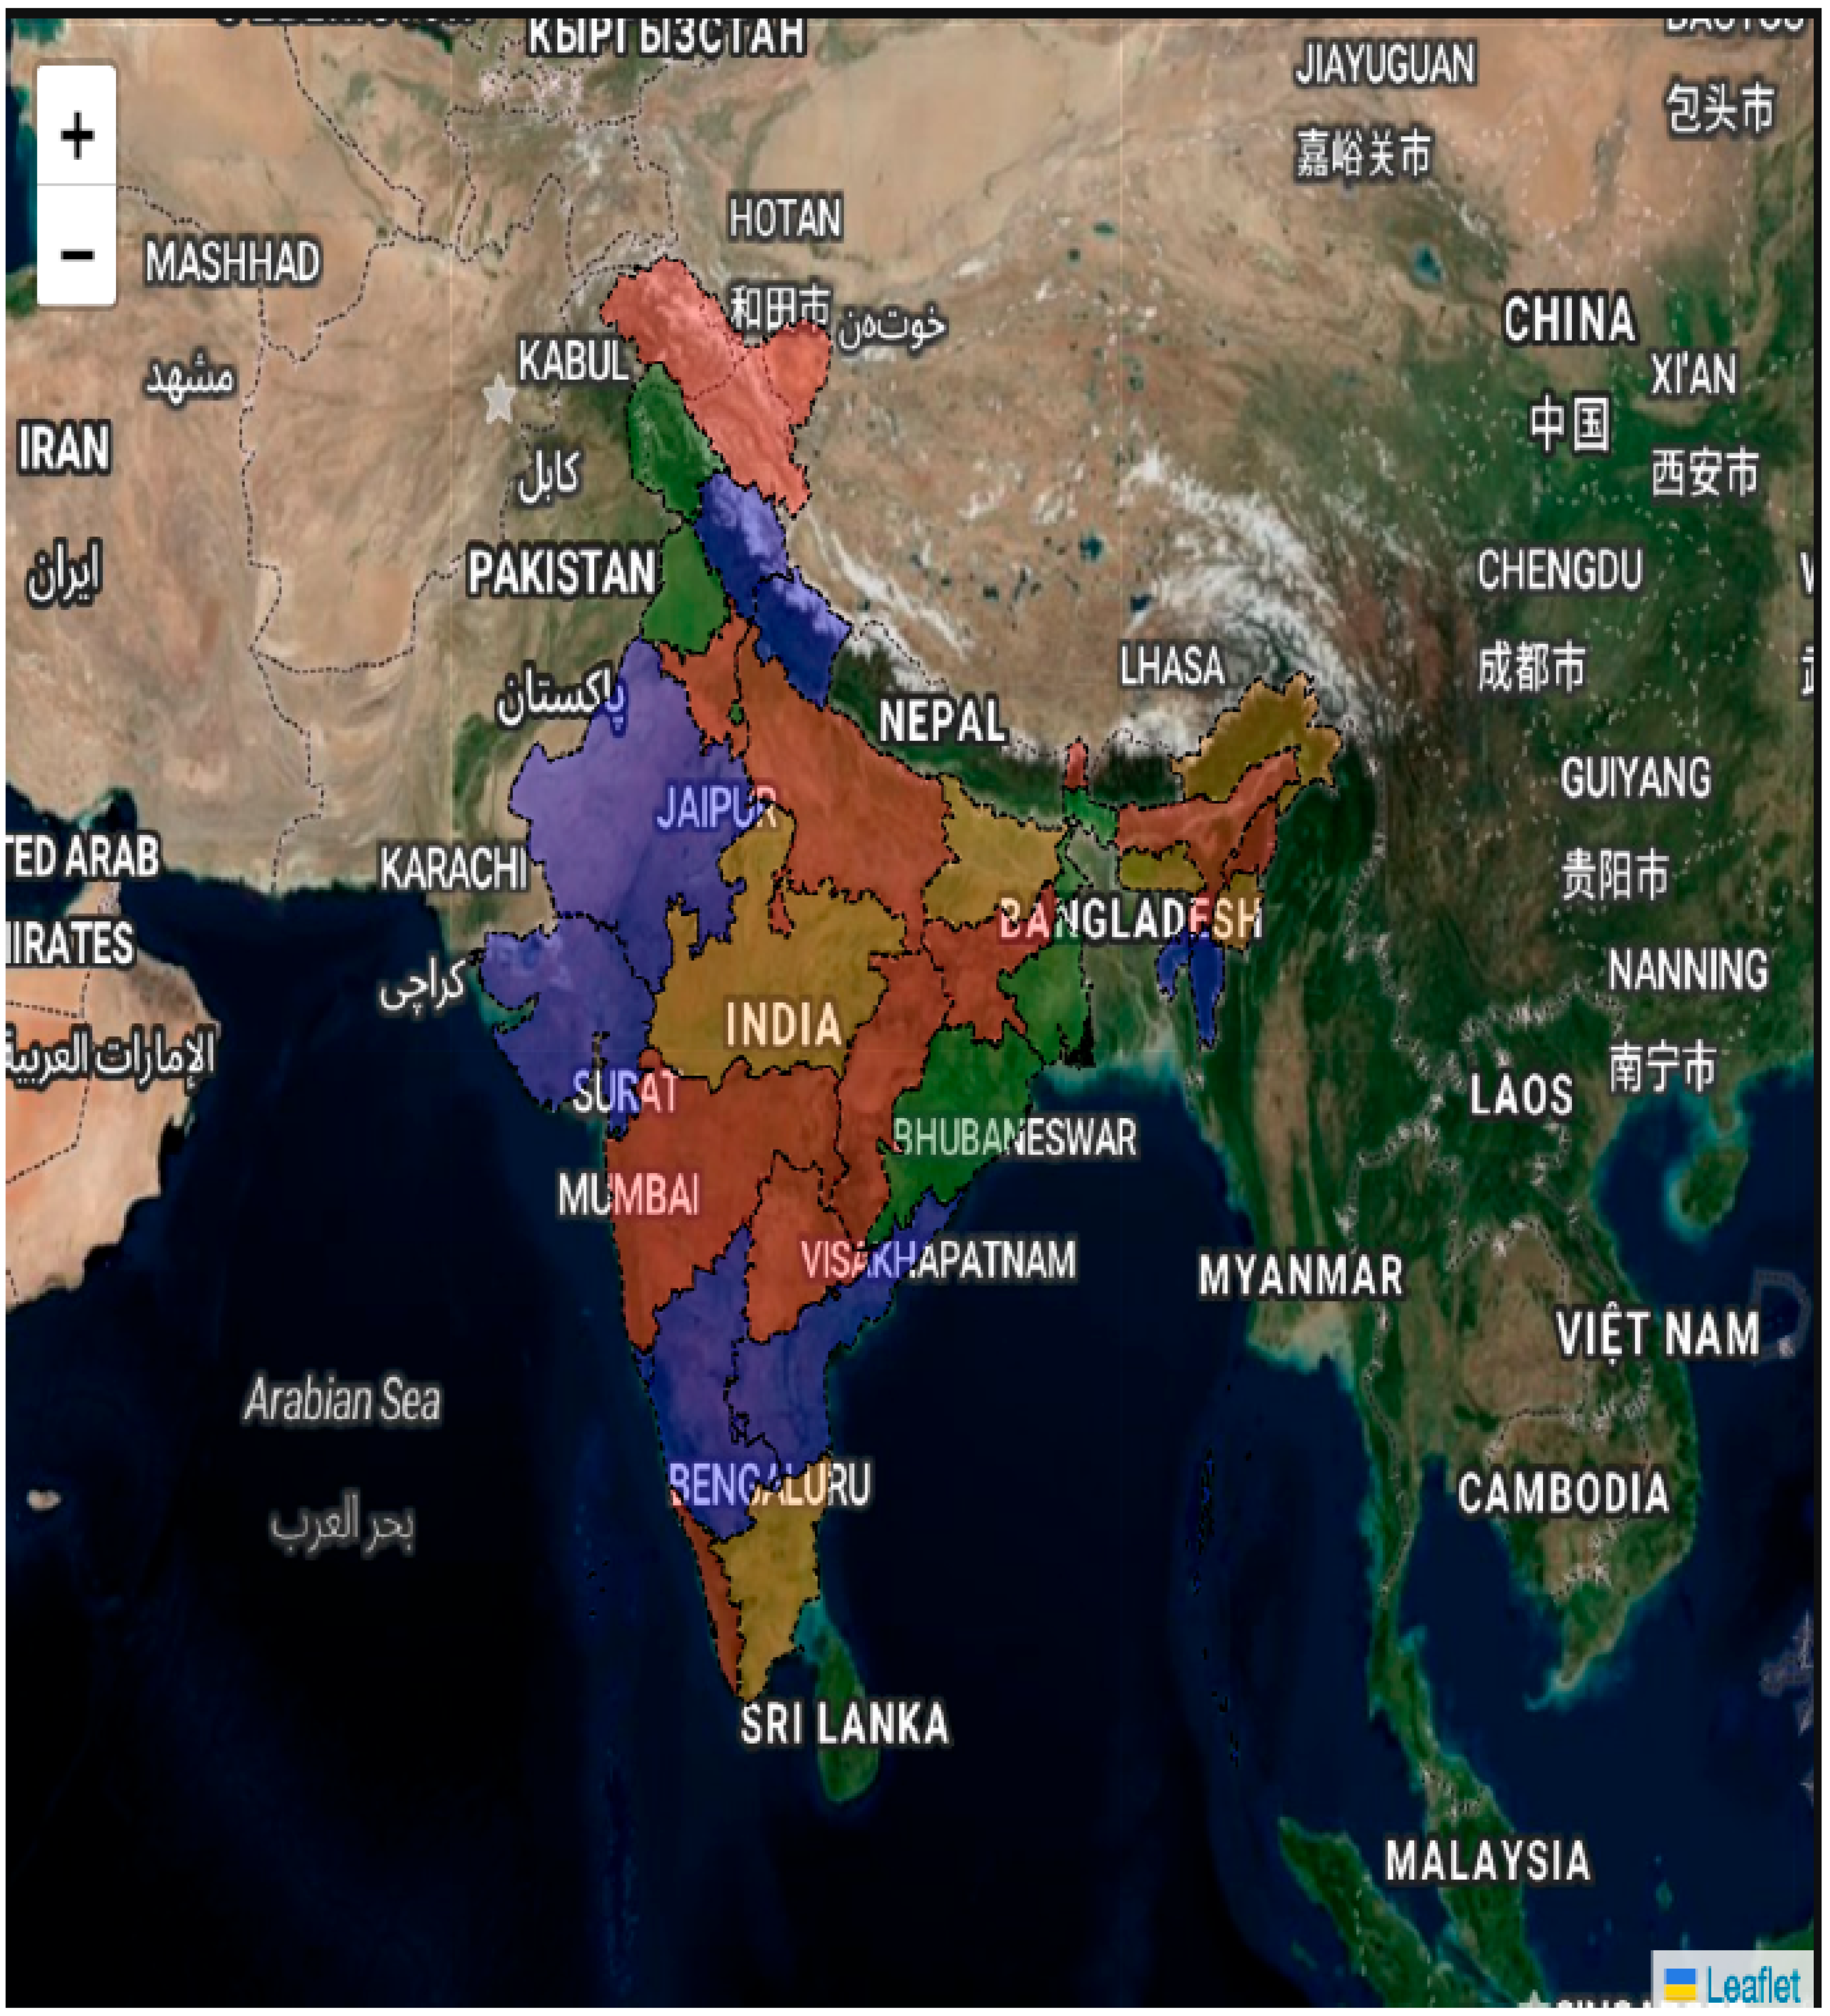
Figure 1.
Map GIS layer with Indian state boundaries.
Utilizing the open source modern web development technologies, including React.js and Mongo DB, the project delivers a user-friendly interface for visualizing temperature and precipitation data on an interactive map. The integration of React Leaflet Map and Chart.js enables users to explore historical temperature trends at specific coordinates, facilitating informed analysis and decision-making.
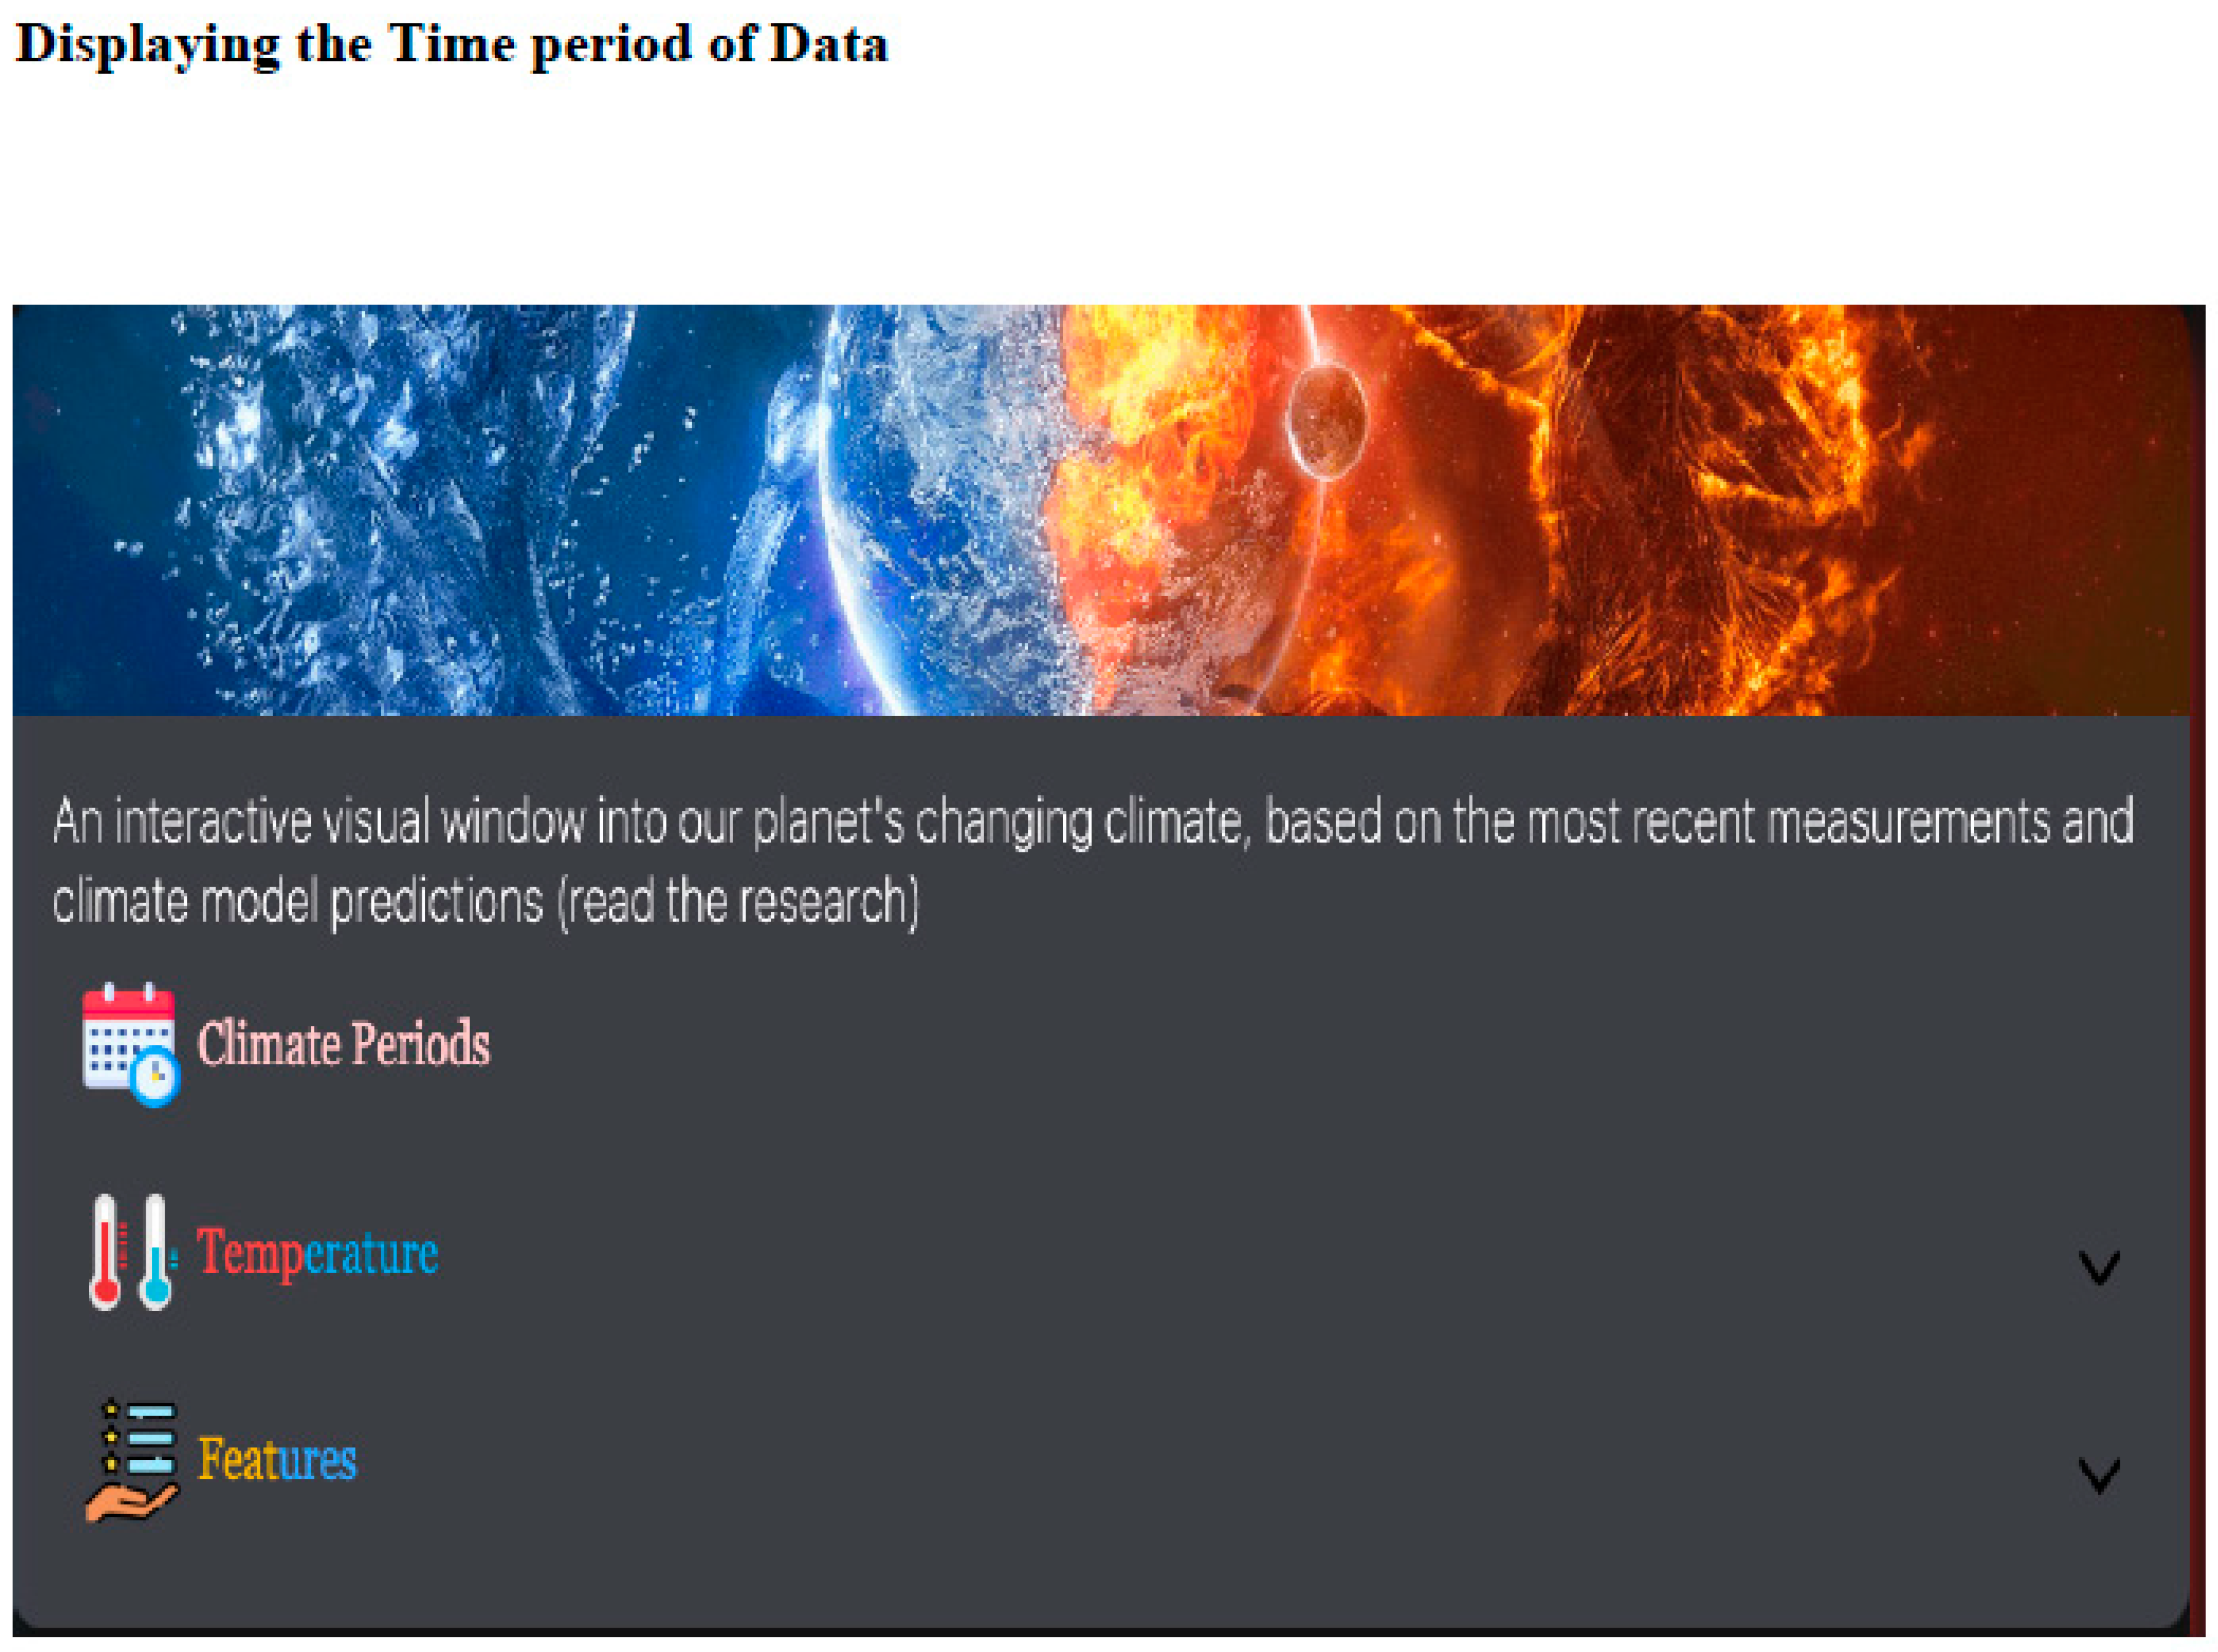
Figure 2.
Interactive window with variables menu.
The project's significance lies in its potential to empower users, including scientists and researchers, with the tools to explore and understand long term trends at a granular level (for e.g. Temperature and precipitation were found to be increasing at the rate of 0.01 0c yr -1and 0.11 Kg/m2 at Jaipur). The users can check the long term temperature and precipitation trends at any location and can use the graphs for further analysis. Similar framework can be used to display other climate variables present in IMDAA to users.
Figure 3.
display of temperature and Precipitation trend at user selected location with downloading option.
Figure 3.
display of temperature and Precipitation trend at user selected location with downloading option.
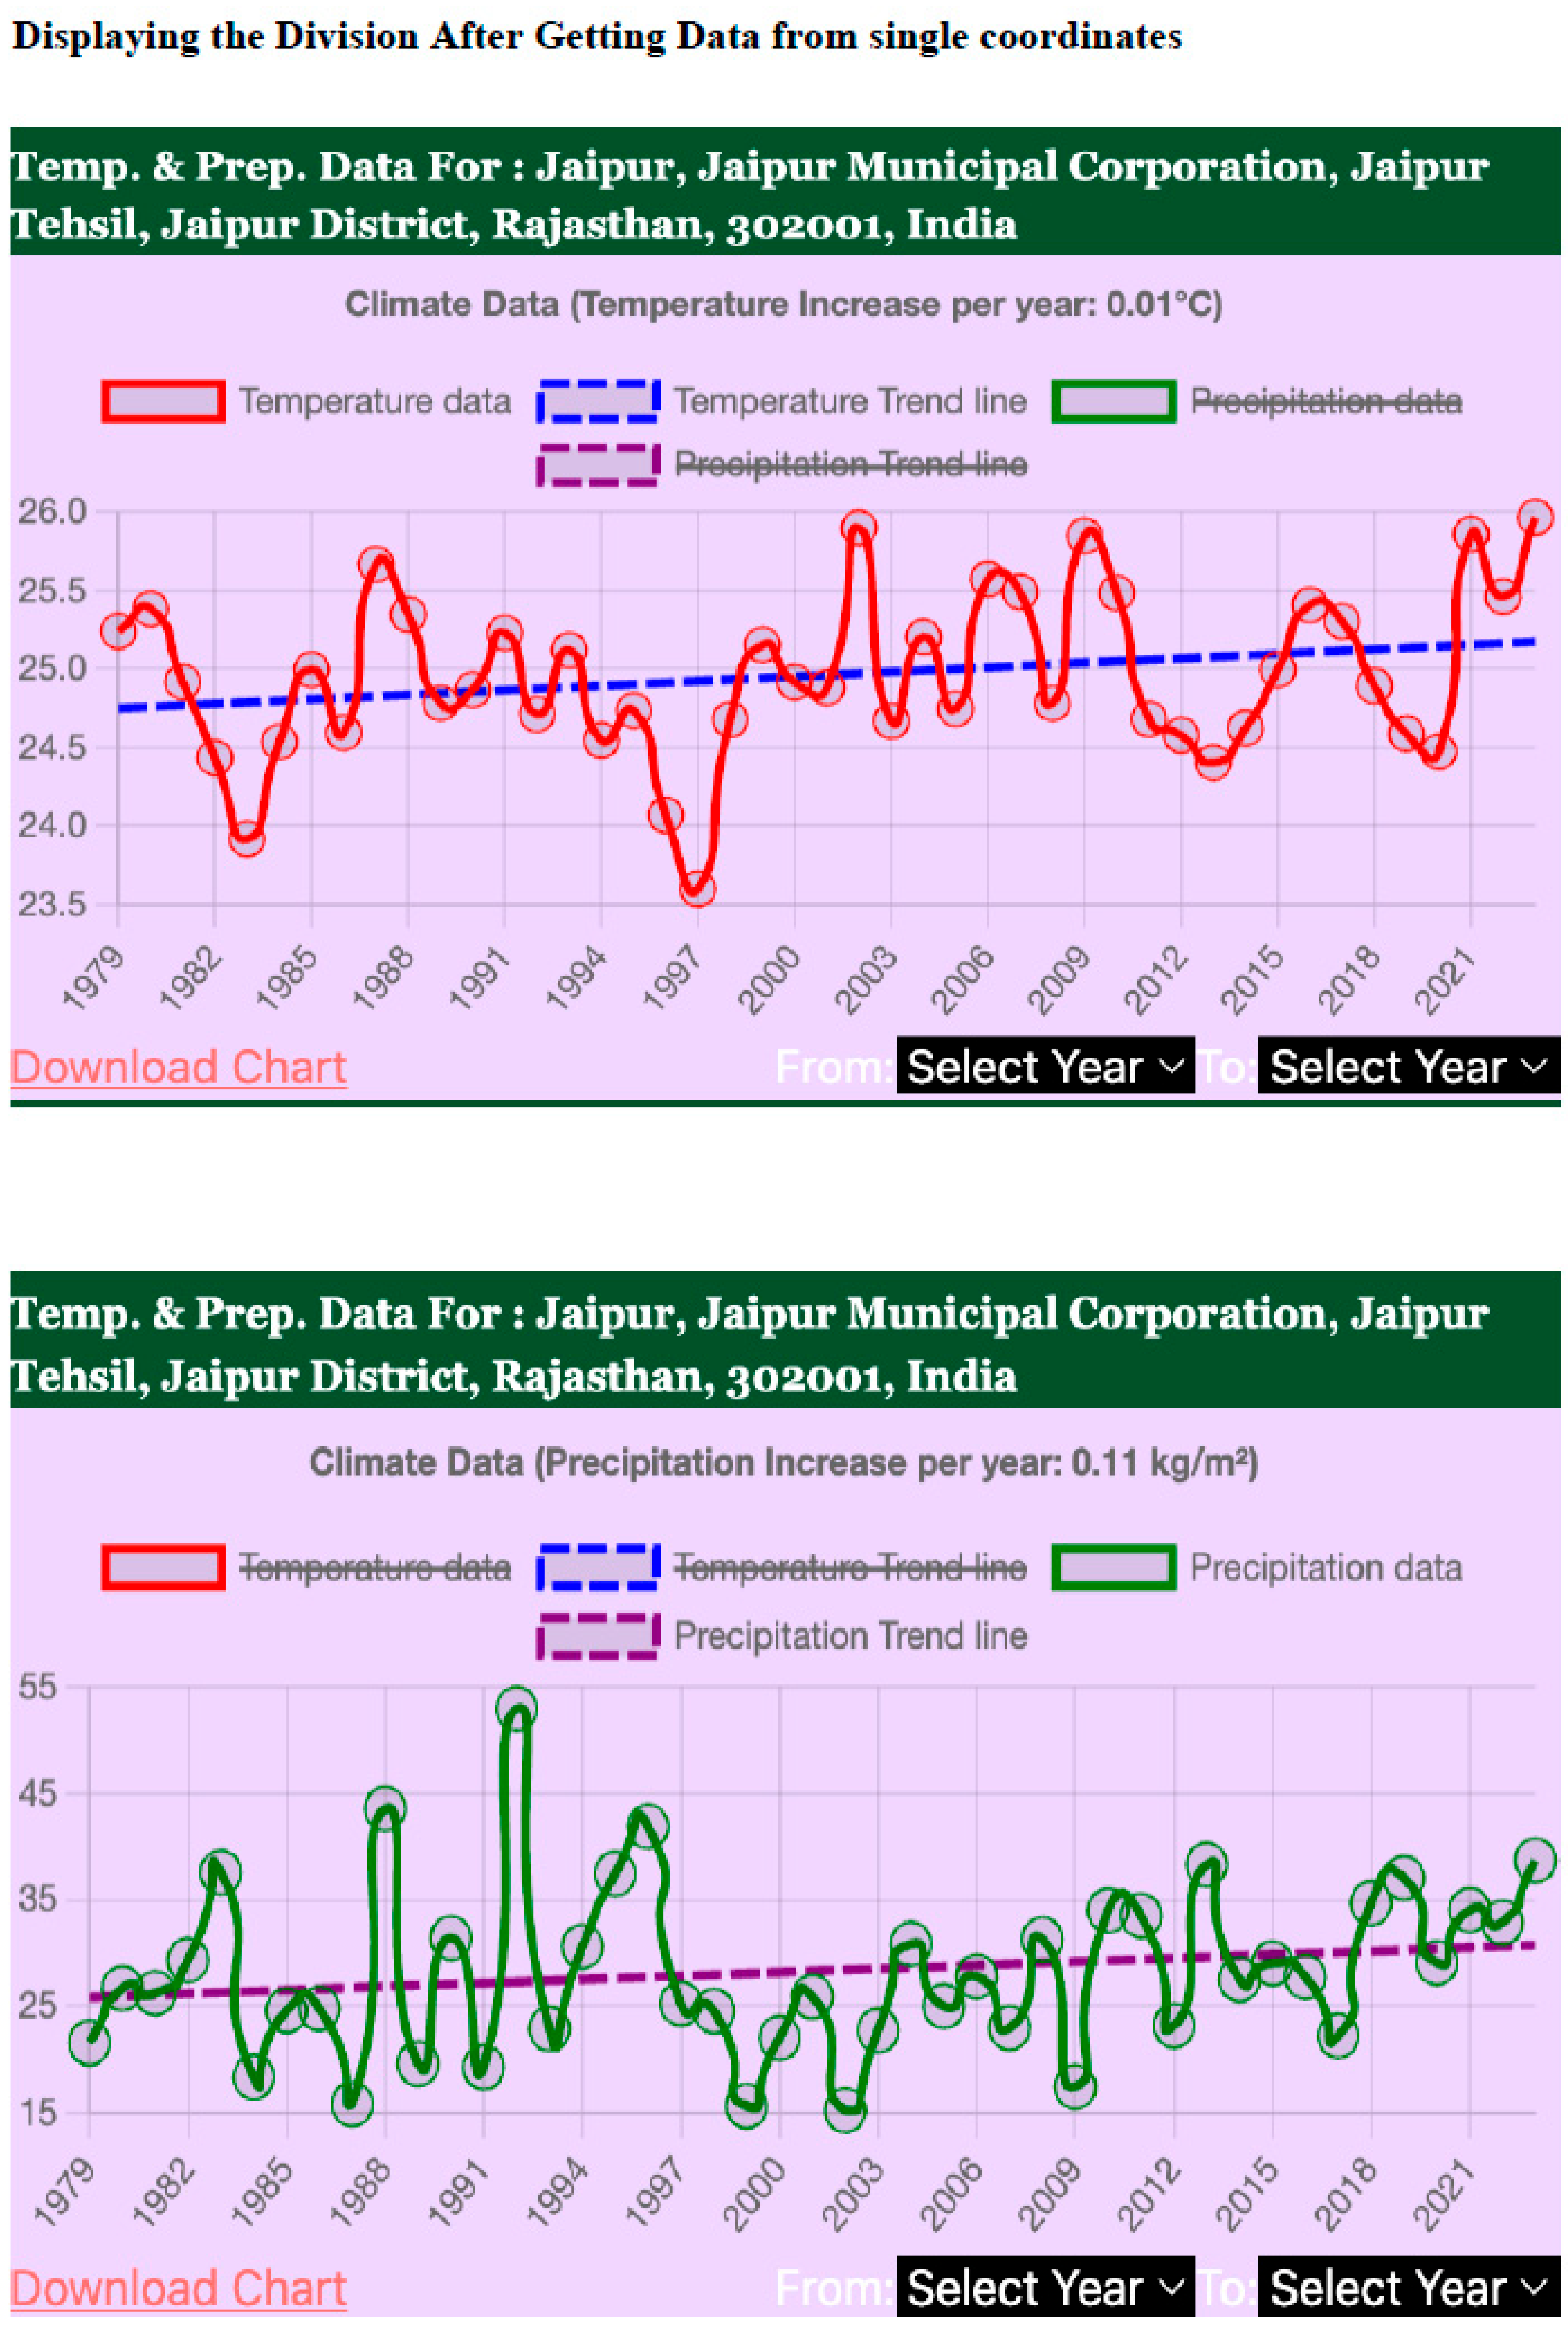
Figure 4.
display of temperature and Precipitation trend for the selected state with downloading option.
Figure 4.
display of temperature and Precipitation trend for the selected state with downloading option.
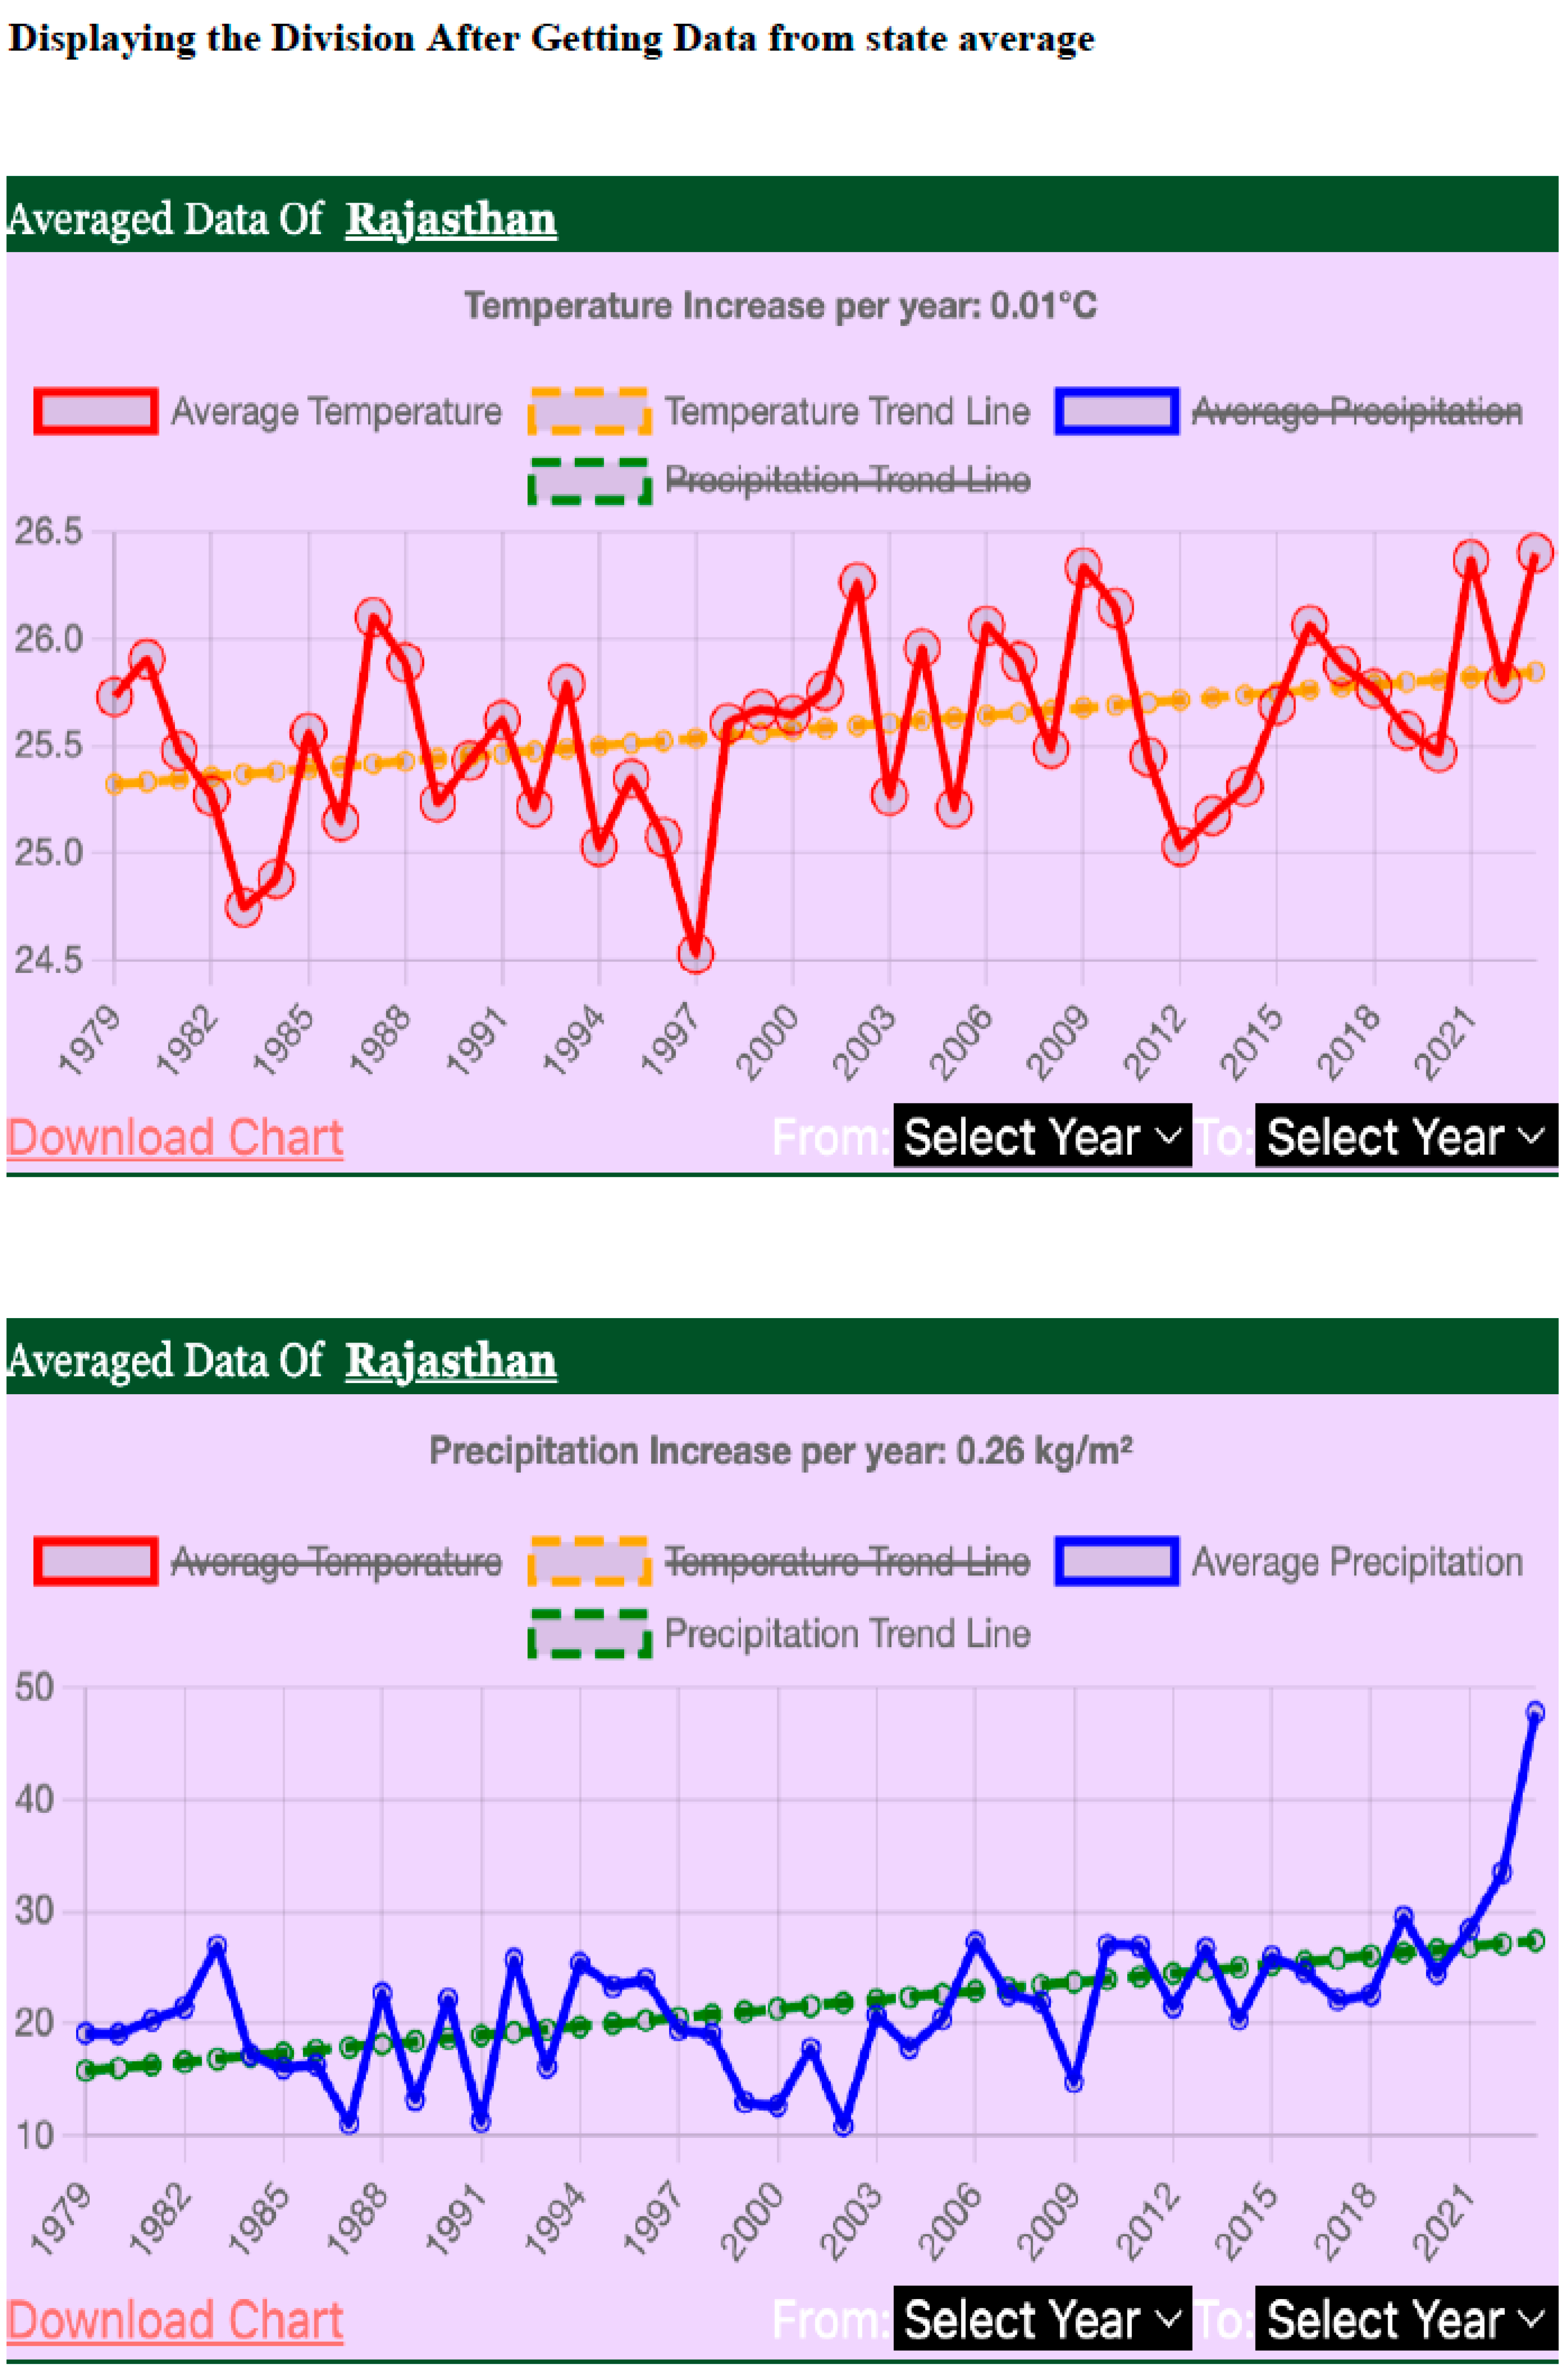
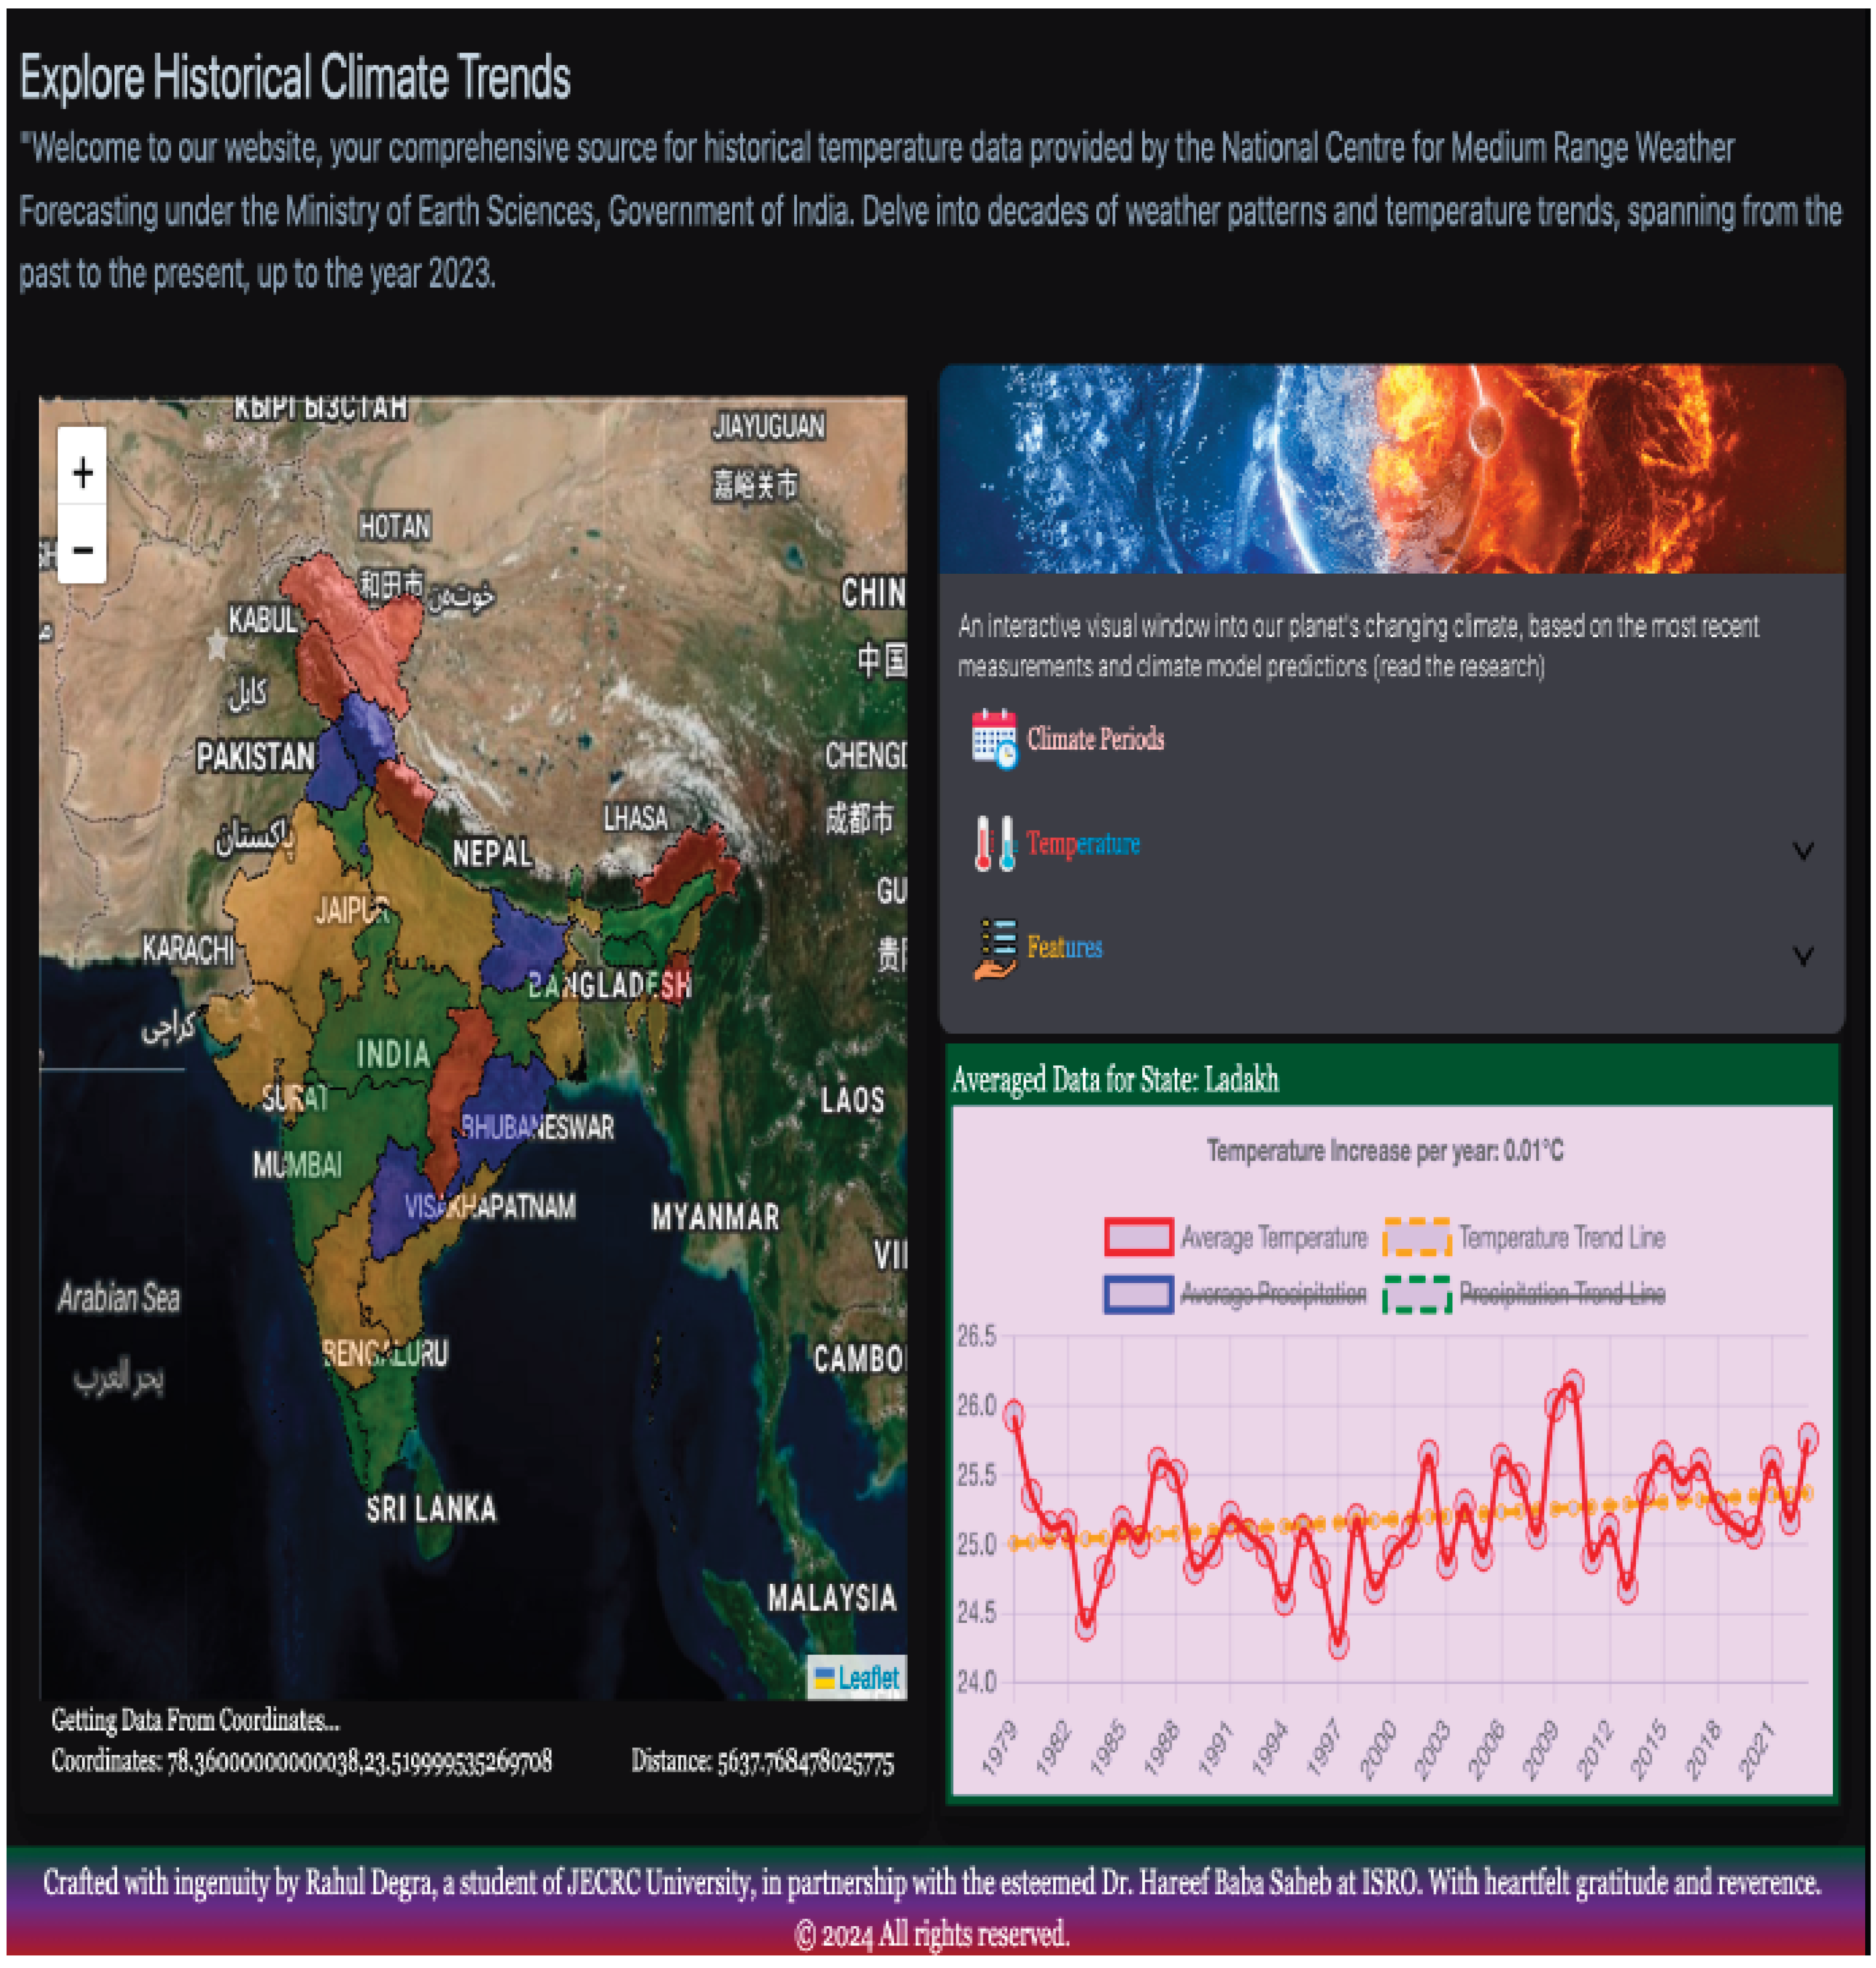
Figure 5.
Look of complete webpage displaying all the features.
4. Conclusions
The culmination of efforts in developing a robust web-based platform for visualizing satellite-derived temperature and precipitation data stands as a testament to the dedication and collaboration of the project team. Beginning with a meticulous analysis of requirements and objectives, the project journeyed through various phases of planning, implementation, and testing. The architecture of the platform was meticulously designed to ensure scalability, flexibility, and performance. Each module, from data to visualization, was crafted with attention to detail, leveraging cutting-edge technologies and best practices in software engineering. The seamless integration of React.js, Tailwind CSS, Leaflet.js, MongoDB, and Python libraries enabled the creation of an intuitive and feature-rich platform. One of the key highlights of the project lies in its multidisciplinary approach, bringing together expertise from diverse domains to tackle complex challenges. The collaboration between developers, researchers, and domain experts fostered innovation and problem-solving, driving the project towards success.
The analysis of temperature and precipitation data unearthed valuable insights into climatic patterns, trends, and anomalies across different regions of India. Visualizations generated from the data provide researchers with actionable information for further analysis and interpretation. The integration of geospatial queries in MongoDB proved instrumental in facilitating efficient data retrieval and analysis. Users can now access historical temperature and precipitation data with ease, enabling informed decision-making and research initiatives. Furthermore, the platform's user-friendly interface and interactive features empower users to explore temperature and precipitation trends and patterns intuitively. From policymakers to researchers, the platform caters to a diverse audience, offering valuable insights and tools for addressing pressing environmental challenges.
Acknowledgements
Authors gratefully acknowledge NCMRWF, Ministry of Earth Sciences, Government of India, for IMDAA reanalysis. IMDAA reanalysis was produced under the collaboration between UK Met Office, NCMRWF, and IMD with financial support from the Ministry of Earth Sciences, under the National Monsoon Mission programme. First author thanks NRSC for the student internship project opportunity during which the present study is undertaken.
References
- Rani, S. Indira; Arulalan, T.; George, John P.; Rajagopal, E. N.; Renshaw, Richard; Maycock, Adam; Barker, Dale; Rajeevan, M. 2021: IMDAA: High Resolution Satellite-era Reanalysis for the Indian Monsoon Region. Journal of Climate. [CrossRef]
- Hersbach, H. The ERA5 global reanalysis. Quarterly Journal of the Royal Meteorological Society 2020, 146(730), 1999–2049. [Google Scholar] [CrossRef]
- NASA POWER Project. NASA Prediction Of Worldwide Energy Resources (POWER) Data Access Viewer. 2023. Available online: https://power.larc.nasa.gov.
- Indian Meteorological Department (IMD). Gridded Daily Temperature and Rainfall Data Sets over India. 2021. Available online: https://www.imdpune.gov.in/Clim_Pred_LRF_New/Grided_Data_Download.html.
- Gorelick, N. Google Earth Engine: Planetary-scale geospatial analysis for everyone. Remote Sensing of Environment 2017, 202, 18–27. [Google Scholar] [CrossRef]
- Bostock, M. D3.js-Data-Driven Documents. 2012. Available online: https://d3js.org.
- Peterson, T.C. Monitoring and understanding changes in heat waves, cold waves, floods and droughts in the United States: State of knowledge. Bulletin of the American Meteorological Society 2011, 92(6), 821–834. [Google Scholar] [CrossRef]
- Open Street Map Contributors OpenStreetMap Base Maps for Web Visualization. 2024. Available online: https://www.openstreetmap.org.
- Hunter, J. D. Matplotlib: A 2D graphics environment. Computing in Science & Engineering 2007, 9(3), 90–95. [Google Scholar] [CrossRef]
- Developers, Folium. Folium–Python Data. Leaflet.js Maps. 2024. Available online: https://python-visualization.github.io/folium/.
- React Documentation. React–A JavaScript library for building user interfaces. 2024. Available online: https://reactjs.org.
Disclaimer/Publisher’s Note: The statements, opinions and data contained in all publications are solely those of the individual author(s) and contributor(s) and not of MDPI and/or the editor(s). MDPI and/or the editor(s) disclaim responsibility for any injury to people or property resulting from any ideas, methods, instructions or products referred to in the content. |
© 2025 by the authors. Licensee MDPI, Basel, Switzerland. This article is an open access article distributed under the terms and conditions of the Creative Commons Attribution (CC BY) license (http://creativecommons.org/licenses/by/4.0/).
Copyright: This open access article is published under a Creative Commons CC BY 4.0 license, which permit the free download, distribution, and reuse, provided that the author and preprint are cited in any reuse.


