Submitted:
30 July 2025
Posted:
31 July 2025
You are already at the latest version
Abstract
Eph receptor B2 (EphB2) overexpression is associated with poor clinical outcomes in various tumors. EphB2 is involved in tumor malignant progression through the promotion of invasiveness and metastasis. Genetic and transcriptome analyses implicated that EphB2 is a therapeutic target for specific tumor types. A monoclonal antibody (mAb) is one of the essential therapeutic strategies for the EphB2-positive tumors. We previously developed an anti-EphB2 mAb, Eb2Mab-12 (IgG1, kappa), by immunizing mice with EphB2-overexpressed glioblastoma. Eb2Mab-12 specifically reacted with the EphB2-overexpressed Chinese hamster ovary-K1 (CHO/EphB2) and some cancer cell lines in flow cytometry. In this study, we engineered Eb2Mab-12 into a mouse IgG2a type (Eb2Mab-12-mG2a) and a human IgG1-type (Eb2Mab-12-hG1) mAb. Eb2Mab-12-mG2a and Eb2Mab-12-hG1 retained the reactivity to EphB2-positive cells and exerted antibody-dependent cellular cytotoxicity and complement-dependent cytotoxicity in the presence of effector cells and complements, respectively. In CHO/EphB2, triple-negative breast cancer, and lung mesothelioma xenograft models, both Eb2Mab-12-mG2a and Eb2Mab-12-hG1 exhibited potent antitumor efficacy. These results indicated that Eb2Mab-12-derived mAbs could be applied to mAb-based therapy against EphB2-positive tumors.
Keywords:
EphB2
; monoclonal antibody
; antibody-dependent cellular cytotoxicity
; complementdependent cytotoxicity
; triple-negative breast cancer
Abstract
Eph receptor B2 (EphB2) overexpression is associated with poor clinical outcomes in various tumors. EphB2 is involved in tumor malignant progression through the promotion of invasiveness and metastasis. Genetic and transcriptome analyses implicated that EphB2 is a therapeutic target for specific tumor types. A monoclonal antibody (mAb) is one of the essential therapeutic strategies for the EphB2-positive tumors. We previously developed an anti-EphB2 mAb, Eb2Mab-12 (IgG1, kappa), by immunizing mice with EphB2-overexpressed glioblastoma. Eb2Mab-12 specifically reacted with the EphB2-overexpressed Chinese hamster ovary-K1 (CHO/EphB2) and some cancer cell lines in flow cytometry. In this study, we engineered Eb2Mab-12 into a mouse IgG2a type (Eb2Mab-12-mG2a) and a human IgG1-type (Eb2Mab-12-hG1) mAb. Eb2Mab-12-mG2a and Eb2Mab-12-hG1 retained the reactivity to EphB2-positive cells and exerted antibody-dependent cellular cytotoxicity and complement-dependent cytotoxicity in the presence of effector cells and complements, respectively. In CHO/EphB2, triple-negative breast cancer, and lung mesothelioma xenograft models, both Eb2Mab-12-mG2a and Eb2Mab-12-hG1 exhibited potent antitumor efficacy. These results indicated that Eb2Mab-12-derived mAbs could be applied to mAb-based therapy against EphB2-positive tumors.
1. Introduction
The mammalian ephrin–Eph system comprises eight membrane-bound ephrin ligands, including five glycosylphosphatidylinositol (GPI)-anchored ephrin-As and three transmembrane ephrin-Bs, and 14 receptor tyrosine kinases (RTKs), including nine EphA and five EphB receptors [1,2,3,4,5,6]. Upon ligand binding, Eph receptors undergo dimerization or oligomerization, resulting in the autophosphorylation of specific tyrosine residues within the cytoplasmic domains of both the Eph receptors and ephrin-B ligands [7]. These phosphorylated tyrosine residues serve as docking sites for downstream cytoplasmic signaling molecules containing Src homology 2 (SH2), PDZ, or phosphotyrosine-binding (PTB) domains [8]. Consequently, Eph–ephrin interactions initiate bidirectional signaling: forward signaling through Eph receptors and reverse signaling through ephrin-Bs, which is critical for intercellular communication between identical or distinct cell types [2,6,9]. The bidirectional signaling by the Eph–ephrin axis regulates various biological processes, including tissue morphogenesis, regeneration, and homeostasis. Dysregulation of the system has been implicated in multiple diseases such as cancer [3,4].
The Eph system exerts context-dependent functions in tumorigenesis, acting either as a tumor promoter or suppressor depending on the cellular context [10]. Among Eph receptors, EphB2 is overexpressed in a variety of malignancies, including breast cancer [11], glioblastoma [12], mesothelioma [13], and hepatocellular carcinoma [14], which correlates with poor clinical prognosis. EphB2 has been shown to facilitate tumor cell migration and invasion through forward signaling [15,16]. Given their roles in tumor progression, EphB2 has emerged as a promising target for monoclonal antibody (mAb)-based therapeutic strategies [17,18,19,20,21,22,23,24]. An anti-EphB2 mAb (clone 2H9) effectively blocked the interaction of EphB2 with ephrin-B2 and inhibited the EphB2 autophosphorylation [25]. However, 2H9 did not affect the proliferation of EphB2-positive tumors [25]. Therefore, 2H9 was further developed into an antibody-drug conjugate (ADC) to monomethylauristatin E and showed the antitumor efficacy to EphB2-overexpressed fibrosarcoma HT1080 and colorectal cancer xenografts [25]. However, the 2H9-ADC was not further developed in the clinic [26].
Triple-negative breast cancer (TNBC) is defined by the lack of expression of estrogen receptor (ER), progesterone receptor (PR), and human epidermal growth factor receptor 2 (HER2)—key molecular markers that are routinely utilized for breast cancer classification and therapeutic decision-making [27]. Compared to other breast cancer subtypes, TNBC is characterized by a more aggressive clinical course, including higher rates of recurrence and distant metastasis, resulting in a poor overall survival [28]. Due to the intertumoral heterogeneity, TNBC is further subclassified into distinct molecular subtypes, which facilitates the development of more targeted therapeutic strategies. Bioinformatics and transcriptomic profiling have enabled the stratification of TNBC into four intrinsic molecular subtypes: basal-like 1 (BL1), basal-like 2 (BL2), mesenchymal (M), and luminal androgen receptor (LAR). Each of these subtypes exhibits unique molecular signatures, biological behaviors, and clinical outcomes [29,30]. Among the intrinsic TNBC subtypes, the BL2 subtype is associated with the highest risk of disease progression and the poorest clinical outcomes. Patients with BL2 tumors exhibit the shortest median overall survival [31], and demonstrate minimal responsiveness to neoadjuvant chemotherapy. EphB2 was identified as one of the signature tyrosine kinases of the BL2 subtype, which could lead to novel approaches for tumor diagnosis and targeted therapy [29,32].
Ependymoma is a common type of brain tumor in children and arises in the supratentorial region, spinal cord, or posterior fossa [33]. Extensive molecular analyses of ependymoma have clarified distinct molecular profiles despite similar histology. A pioneering study analyzed the alterations of DNA copy number and revealed the EphB2 amplification and INK4A/ARF deletion in supratentorial ependymoma [34]. Recently, supratentorial ependymoma has been further categorized into EPN-ZFTA, EPN-YAP1, and subependymoma based on their genetic profile [35]. A fusion protein EPN-ZFTA binds to the proximal enhancers of EphB2, which leads to aberrant expression of EphB2 and tumor progression [36]. Therefore, EphB2 is a potential therapeutic target for treating the supratentorial ependymoma.
For targeting Eph receptors, we have developed mAbs against Eph receptors, including EphA2 (clone Ea2Mab-7) [37], EphA3 (clone Ea3Mab-20) [38], EphB2 (clone Eb2Mab-12) [39], EphB4 (clone B4Mab-7) [40], and EphB6 (clone Eb6Mab-3) [41] using the Cell-Based Immunization and Screening (CBIS) method. Among them, Eb2Mab-12 (mouse IgG1, kappa) recognized EphB2-positive cells with high affinity. Furthermore, Eb2Mab-12 did not show the cross-reactivity to other EphA and EphB receptors. Therefore, Eb2Mab-12 has potential to the application for tumor therapy.
In this study, we engineered Eb2Mab-12 into a mouse IgG2a type (Eb2Mab-12-mG2a) and a human IgG1-type (Eb2Mab-12-hG1) mAbs, and evaluated antibody-dependent cellular cytotoxicity (ADCC), complement-dependent cytotoxicity (CDC), and antitumor efficacy in EphB2-positive tumor xenograft models.
2. Results
2.1. Production of mouse IgG2a-type and human IgG1-type anti-EphB2 mAbs from Eb2Mab-12
We previously generated a mAb against EphB2, designated Eb2Mab-12 (mouse IgG1, κ), by immunizing mice with EphB2-overexpressed glioblastoma LN229. Eb2Mab-12 showed a high binding affinity and specificity among 14 Eph receptors [39]. In this study, we first determined the complementarity-determining regions (CDRs) of Eb2Mab-12 and produced a recombinant Eb2Mab-12 (mouse IgG1) (Figure 1A). To evaluate the antitumor activity, a mouse IgG2a-type Eb2Mab-12 (Eb2Mab-12-mG2a) was generated by fusing the VH and VL CDRs of Eb2Mab-12 with the CH and CL chains of mouse IgG2a (Figure 1A). Furthermore, a human IgG1-type Eb2Mab-12 (Eb2Mab-12-hG1) was generated by fusing the VH and VL CDRs of Eb2Mab-12 with the CH and CL chains of human IgG1 (Figure 1A). As a control mouse IgG2a (mIgG2a) and a human IgG1 (hIgG1) mAb, we previously produced PMab-231 (an anti-tiger podoplanin mAb, mouse IgG2a) [42] and humCvMab-62 (an anti-SARS-CoV-2 spike protein S2 subunit mAb, human IgG1) [43], respectively. We confirmed the purity of the recombinant mAbs by SDS-PAGE under reduced conditions (Figure 1B).
2.2. Flow Cytometry using Eb2Mab-12-mG2a and Eb2Mab-12-hG1.
We next confirmed the reactivity of Eb2Mab-12-mG2a and Eb2Mab-12-hG1 to CHO/EphB2 and endogenous EphB2-positive cancer cell lines. As shown in Figure 2A, Eb2Mab-12-mG2a and Eb2Mab-12-hG1 showed the comparable reactivity to CHO/EphB2 with Eb2Mab-12. Control mIgG2a and hIgG1 did not recognize CHO/EphB2 (Figure 2A). In contrast, Eb2Mab-12-mG2a, Eb2Mab-12-hG1, and Eb2Mab-12 did not react with parental CHO-K1 (Figure 2B). We previously tested the expression of EphB2 in more than 100 cell lines using flow cytometry and found that breast cancer MDA-MB-231, lung mesothelioma NCI-H226, and colorectal cancer LS174T showed the EphB2 expression [39]. Eb2Mab-12-mG2a and Eb2Mab-12-hG1 exhibited the comparable reactivity to MDA-MB-231(Figure 2C) and NCI-H226 (Figure 2D) with Eb2Mab-12. Control mIgG2a and hIgG1 did not recognize MDA-MB-231 (Figure 2C) and NCI-H226 (Figure 2D). We also confirmed the expression of EphB2 in LS174T (supplementary Figure 1). We next used EphB2-knockout LS174T (BINDS-58). Eb2Mab-12-mG2a and Eb2Mab-12-hG1 reacted with LS174T compared to each isotype control, but did not react with BINDS-58 (supplementary Figure 2). These results indicated that Eb2Mab-12-mG2a and Eb2Mab-12-hG1 retain the reactivity to EphB2-positive cells.
2.3. ADCC and CDC by Eb2Mab-12-mG2a and Eb2Mab-12-hG1 against CHO/EphB2.
We next examined the ADCC caused by Eb2Mab-12-mG2a and Eb2Mab-12-hG1 against CHO/EphB2. We used the splenocytes derived from BALB/c nude mice as an effector since human IgG1 can bind to all four mouse FcγRs and exert ADCC in the presence of mouse effector cells [44]. Eb2Mab-12-mG2a showed ADCC against CHO/EphB2 (30.4% vs. 8.3% cytotoxicity of control mIgG2a, p < 0.05, Figure 3A left). Eb2Mab-12-hG1 also exerted ADCC against CHO/EphB2 (45.5% vs. 16.1% cytotoxicity of control hIgG1, p < 0.05, Figure 3A right). Next, we examined CDC caused by Eb2Mab-12-mG2a and Eb2Mab-12-hG1 against CHO/EphB2 in the presence of complements. Eb2Mab-12-mG2a elicited CDC against CHO/EphB2 (45.1% vs. 15.8% cytotoxicity of control mIgG2a, p < 0.05, Figure 3B left). Eb2Mab-12-hG1 elicited similar CDC against CHO/EphB2 (40.6% vs. 17.9% cytotoxicity of control hIgG1, p < 0.05, Figure 3B right). These results showed that Eb2Mab-12-mG2a and Eb2Mab-12-hG1 exhibited potent ADCC and CDC against CHO/EphB2.
2.4. Antitumor effect by Eb2Mab-12-mG2a and Eb2Mab-12-hG1 against CHO/EphB2 xenografts.
We next investigated the antitumor effect of Eb2Mab-12-mG2a and Eb2Mab-12-hG1 against CHO/EphB2 xenografts. Following the inoculation of CHO/EphB2, Eb2Mab-12-mG2a or control mIgG2a was intraperitoneally injected into CHO/EphB2 xenograft-bearing mice on days 8 and 14. Eb2Mab-12-hG1 or control hIgG1 was also injected as described above. The tumor volume was measured on days 8, 10, 14, 16, and 21 after the inoculation. The Eb2Mab-12-mG2a administration resulted in a potent and significant reduction in CHO/EphB2 xenografts on days 16 (p < 0.01) and 21 (p < 0.01) compared with that of mIgG2a (Figure 4A). The Eb2Mab-12-hG1 administration also showed a significant reduction in CHO/EphB2 xenografts on day 21 (p < 0.01) compared with that of hIgG1 (Figure 4B). Significant decreases in xenograft weight caused by Eb2Mab-12-mG2a and Eb2Mab-12-hG1 were observed in CHO/EphB2 xenografts (87% reduction; p < 0.01; Figure 4C and 77% reduction; p < 0.01; Figure 4D, respectively). Body weight loss was not observed in the xenograft-bearing mice treated with Eb2Mab-12-mG2a (Figure 4E) and Eb2Mab-12-hG1 (Figure 4F).
2.5. ADCC and CDC by Eb2Mab-12-mG2a and Eb2Mab-12-hG1 against endogenous EphB2-positive cancer cell lines.
We next investigated ADCC caused by Eb2Mab-12-mG2a and Eb2Mab-12-hG1 against the endogenous EphB2-positive cancer cell lines in the presence of splenocytes derived from BALB/c nude mice. Eb2Mab-12-mG2a showed ADCC against MDA-MB-231 (9.2% vs. 3.2% cytotoxicity of control mIgG2a, p < 0.05, Figure 5A left). Eb2Mab-12-hG1 also exerted ADCC against MDA-MB-231 (11.0% vs. 3.0% cytotoxicity of control hIgG1, p < 0.05, Figure 5A right). We then examined CDC caused by Eb2Mab-12-mG2a and Eb2Mab-12-hG1 against MDA-MB-231 in the presence of complements. Eb2Mab-12-mG2a elicited CDC against MDA-MB-231 (3.2% vs. 0.80% cytotoxicity of control mIgG2a, p < 0.05, Figure 5B left). Eb2Mab-12-hG1 also elicited CDC against MDA-MB-231 (3.8% vs. 1.3% cytotoxicity of control hIgG1, p < 0.05, Figure 5B right).
Eb2Mab-12-mG2a showed ADCC against NCI-H226 (16.8% vs. 6.5% cytotoxicity of control mIgG2a, p < 0.05, Figure 5C left). Eb2Mab-12-hG1 also exerted ADCC against NCI-H226 (12.5% vs. 4.6% cytotoxicity of control hIgG1, p < 0.05, Figure 5C right). We then examined CDC caused by Eb2Mab-12-mG2a and Eb2Mab-12-hG1 against NCI-H226 in the presence of complements. Eb2Mab-12-mG2a elicited CDC against NCI-H226 (12.1% vs. 5.4% cytotoxicity of control mIgG2a, p < 0.05, Figure 5D left). Eb2Mab-12-hG1 also elicited CDC against NCI-H226 (7.4% vs. 1.6% cytotoxicity of control hIgG1, p < 0.05, Figure 5D right).
We also assessed ADCC and CDC caused by Eb2Mab-12-mG2a and Eb2Mab-12-hG1 against LS174T. However, we could not observe the significant ADCC by both mAbs and CDC by Eb2Mab-12-mG2a. Only a significant CDC by Eb2Mab-12-hG1 was observed (Supplementary Figure 3). These results showed that Eb2Mab-12-mG2a and Eb2Mab-12-hG1 exhibited significant ADCC and CDC against MDA-MB-231 and NCI-H226.
2.6. Antitumor effect by Eb2Mab-12-mG2a and Eb2Mab-12-hG1 against endogenous EphB2-positive cancer xenografts.
The antitumor activity of Eb2Mab-12-mG2a and Eb2Mab-12-hG1 against MDA-MB-231 xenograft was investigated. Following the inoculation of the MDA-MB-231, Eb2Mab-12-mG2a or control mIgG2a was intraperitoneally injected into MDA-MB-231 xenograft-bearing mice on days 8 and 14. Eb2Mab-12-hG1 or control hIgG1 was also injected as described above. The tumor volume was measured on days 8, 10, 14, 16, 21, and 24 after the inoculation. The Eb2Mab-12-mG2a administration resulted in a significant reduction in MDA-MB-231 xenografts on days 21 (p < 0.01) and 24 (p < 0.01) compared with that of mIgG2a (Figure 6A). The Eb2Mab-12-hG1 administration also showed a significant reduction in MDA-MB-231 xenografts on days 21 (p < 0.01) and 24 (p < 0.01) compared with that of hIgG1 (Figure 6B). Significant reductions in xenograft weight caused by Eb2Mab-12-mG2a and Eb2Mab-12-hG1 were observed in MDA-MB-231 xenografts (33% reduction; p < 0.05; Figure 6C and 23% reduction; p < 0.05; Figure 6D, respectively). Body weight loss was not observed in the xenograft-bearing mice treated with Eb2Mab-12-mG2a (Figure 6E) and Eb2Mab-12-hG1 (Figure 6F).
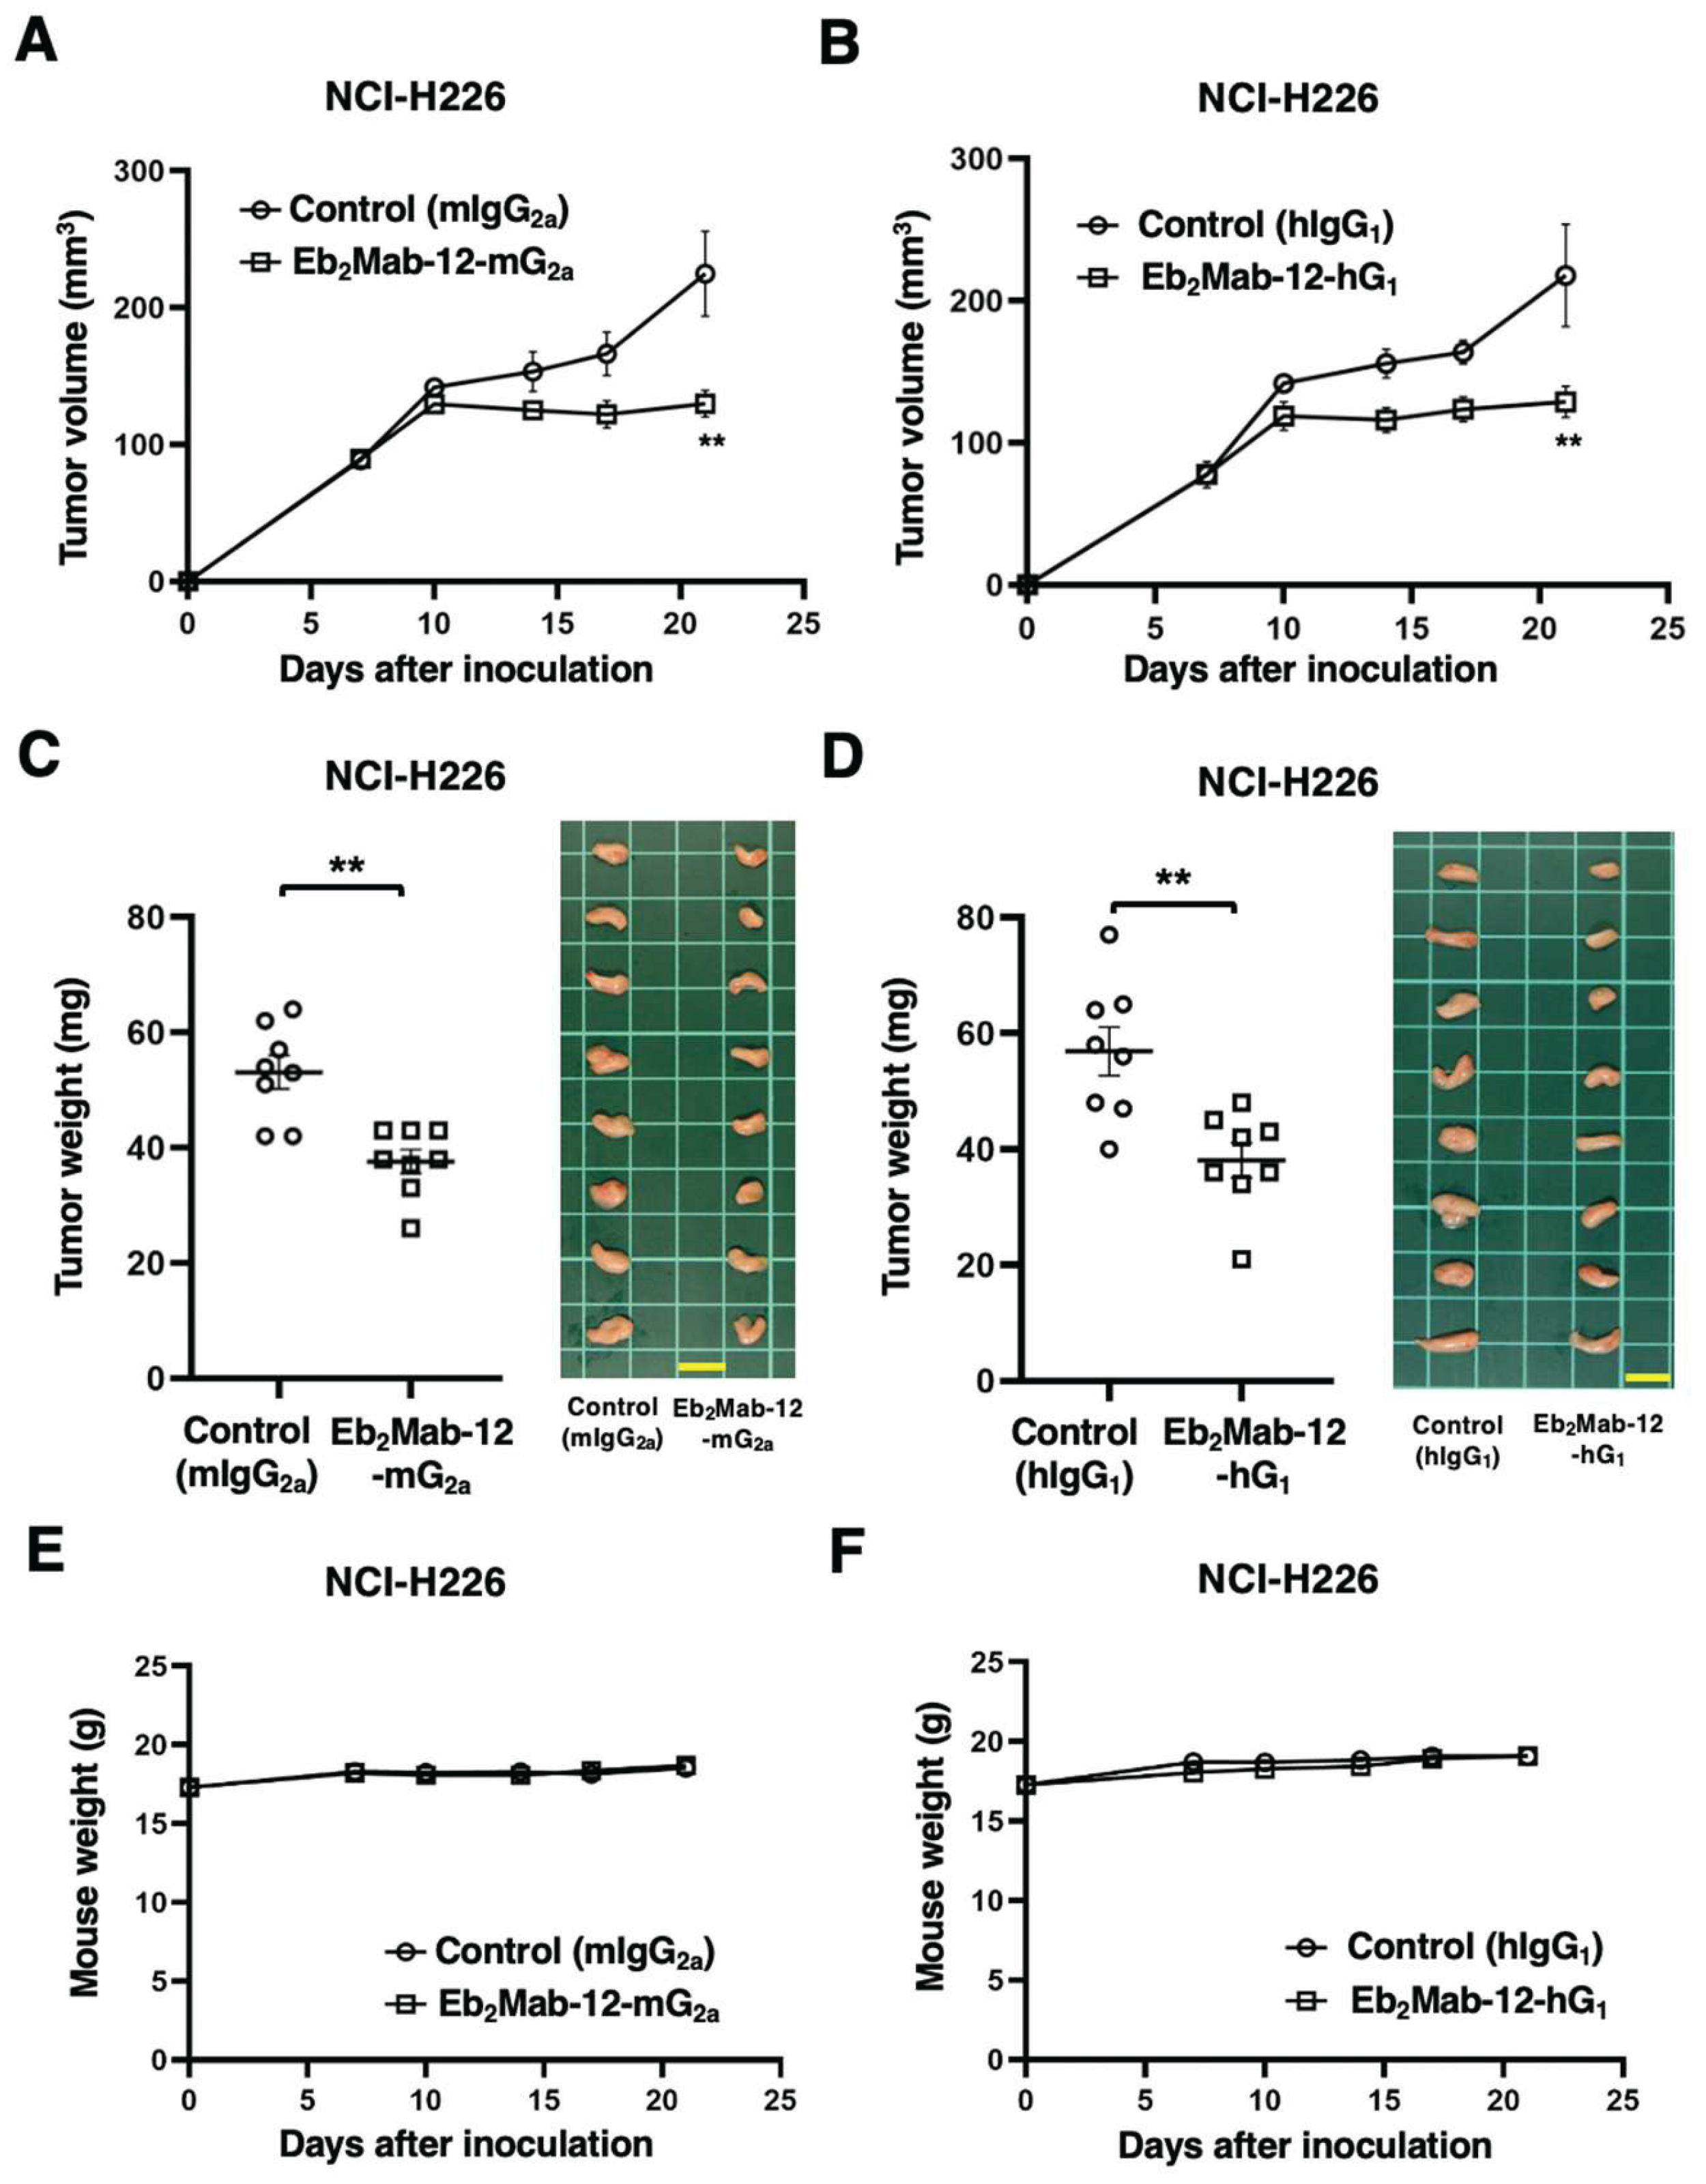
The antitumor activity of Eb2Mab-12-mG2a and Eb2Mab-12-hG1 against NCI-H226 xenograft was investigated. Following the inoculation of the NCI-H226, Eb2Mab-12-mG2a or control mIgG2a was intraperitoneally injected into NCI-H226 xenograft-bearing mice on days 7 and 14. Eb2Mab-12-hG1 or control hIgG1 was also injected as described above. The tumor volume was measured on days 7, 10, 14, 17, and 21 after the inoculation. The Eb2Mab-12-mG2a administration resulted in a significant reduction in NCI-H226 xenografts on days 21 (p < 0.01) compared with that of mIgG2a (Figure 7A). The Eb2Mab-12-hG1 administration also showed a significant reduction in NCI-H226 xenografts on days 21 (p < 0.01) compared with that of hIgG1 (Figure 7B). Significant reductions in xenograft weight caused by Eb2Mab-12-mG2a and Eb2Mab-12-hG1 were observed in NCI-H226 xenografts (29% reduction; p < 0.01; Figure 7C and 33% reduction; p < 0.01; Figure 7D, respectively). Body weight loss was not observed in the xenograft-bearing mice treated with Eb2Mab-12-mG2a (Figure 7E) and Eb2Mab-12-hG1 (Figure 7F).
In the same way of ADCC and CDC, the obvious antitumor activity of Eb2Mab-12-mG2a and Eb2Mab-12-hG1 against LS174T xenograft was not observed (Supplementary Figure 4).
3. Discussion
A growing body of evidence has suggested that EphB2 mediates malignant progression in various types of tumors and is a candidate for therapeutic targets and diagnostic biomarkers. Genetic and transcriptome analyses revealed that EphB2 is amplified [34] or upregulated by EPN-ZFTA in supratentorial ependymoma [36], and EphB2 is a signature tyrosine kinase of the BL2 subtype in TNBC [29,32]. In this study, we demonstrated that Eb2Mab-12-mG2a and Eb2Mab-12-hG1 retain the reactivity to EphB2-positive cells (Figure 2) and exert ADCC and CDC in the presence of mouse splenocytes and complements, respectively (Figure 3 and Figure 5). Eb2Mab-12-mG2a and Eb2Mab-12-hG1 showed the antitumor effect against xenograft tumors of CHO/EphB2 (Figure 4), TNBC breast cancer MDA-MB-231 (Figure 6), and lung mesothelioma NCI-H226 (Figure 7). These results indicated that Eb2Mab-12-derived mAbs could be applied to antibody-based therapy against EphB2-positive tumors.
The BL2 subtype of TNBC is characterized by the enrichment in growth factor signaling and myoepithelial markers [27]. EphB2 is identified as a potential differentiator of BL2 with EphA4, receptor tyrosine kinase-like orphan receptor 1, platelet-derived growth factor receptor (PDGFR)A, PDGFRB, and epidermal growth factor receptor (EGFR) [29,32]. MDA-MB-231 cells exhibited the highest sensitivity to the multikinase inhibitor dasatinib [27], which inhibits PDGFRA, PDGFRB, and EphB2 with IC₅₀ values below 1 nM [45]. These results suggest that MDA-MB-231 growth depends on these signaling. Therefore, the targeting of EphB2 is an essential strategy for EphB2-positive TNBC therapy. Since Eb2Mab-12 is not suitable for immunohistochemistry [39], a reliable mAb should be developed for the detection of EphB2 in immunohistochemistry. For TNBC treatment, anti-trophoblast cell-surface antigen 2 (TROP2) ADCs (sacituzumab govitecan-hziy and datopotamab deruxtecan) are currently approved by the U.S. Food and Drug Administration [46]. TROP2 expression is highest in TNBC compared to other types of breast cancer. The high TROP2 expression was associated with higher androgen receptor expression, ductal carcinoma in situ, apocrine histology, lymphovascular invasion, and lymph node involvement [47]. Further studies are essential to clarify the relationship between TROP2 and EphB2 expression in TNBC subtypes.
As shown in Supplementary Figure 1 and Figure 2, Eb2Mab-12-mG2a and Eb2Mab-12-hG1 showed superior reactivity to LS174T compared to that of MDA-MB-231 and NCI-H226 in flow cytometry. However, Eb2Mab-12-mG2a and Eb2Mab-12-hG1 did not exhibit the ADCC (Supplementary Figure 3) and antitumor efficacy against the LS174T xenograft. The mice harboring LS174T xenograft were euthanized on day 17 after 2 times treatments of mAbs because tumors approached the limits of acceptable tumor burden (Supplementary Figure 4). Previously, antitumor effects against LS174T xenograft were evaluated using T cell-engaging anti-EGFR bispecific antibody (anti-EGFR BiTE) compared to anti-EGFR mAb, cetuximab [48]. Although the anti-EGFR BiTE showed a potent antitumor effect against pancreatic adenocarcinoma COLO 356/FG, it was not effective for LS174T xenograft growth compared to cetuximab [48]. Since cetuximab possesses the neutralized ability to EGFR [49], the neutralization effect may be superior to rapid-growing LS174T xenograft compared to antitumor immunity by anti-EGFR BiTE. In our experimental method, the antitumor immunity by Eb2Mab-12-mG2a and Eb2Mab-12-hG1 could not keep up with the rapid growth of LS174T xenograft.
In ependymomas, surgery and irradiation are still the main treatment because chemotherapy is ineffective in most patients. Consequently, ependymoma is incurable in up to 40% of cases [50] Therefore, the development of targeted therapy is essential to cure the patients. Induction of EphB2 signaling in cerebral neural stem cells lacking the Ink4a/Arf locus led to the development of supratentorial ependymoma in mouse brain [34]. The EphB2-driven model exhibits high penetrance and recapitulates the histology and transcriptomic features of the corresponding human supratentorial ependymoma [34]. In preclinical study, a genetically engineered mouse model driven by Ephb2 has been used to evaluate the potential therapeutic targets [51]. The multikinase inhibitor dasatinib suppressed the growth of ependymoma through inhibition of EphB2 signaling. Dasatinib treatment also remodeled the ependymoma immune microenvironment by promoting the polarization of tumor-associated macrophages toward an M1-like phenotype and enhancing the activation of CD8⁺ T cells [51]. The evaluation anti-EphB2 mAbs in the preclinical model is essential to obtain the proof of concept for clinical study.
4. Materials and Methods
4.1. Cell Lines
CHO-K1, MDA-MB-231 (TNBC), NCI-H226 (lung mesothelioma), and LS174T (colorectal cancer) cell lines were obtained from the American Type Culture Collection (Manassas, VA, USA). CHO/EphB2 was established previously [39]. EphB2-knockout LS174T (BINDS-58) was generated using the CRISPR/Cas9 system with EphB2-specific guide RNA (ACTACAGCGACTGCTGAGCT). Knockout cell lines were isolated using the SH800S cell sorter based on the loss of reactivity to OptiBuild™ RB545 mouse anti-human EphB2 mAb (clone 2H9, BD Bioscience, Franklin Lakes, NJ).
MDA-MB-231, NCI-H226, LS174T, and BINDS-58 were maintained in Dulbecco’s Modified Eagle’s Medium (DMEM; Nacalai Tesque, Inc., Kyoto, Japan). CHO-K1 and CHO/EphB2 were cultured in Roswell Park Memorial Institute (RPMI) 1640 medium (Nacalai Tesque, Inc.). All culture media were supplemented with 10% heat-inactivated fetal bovine serum (FBS; Thermo Fisher Scientific Inc., Waltham, MA, USA), 100 U/mL penicillin, 100 μg/mL streptomycin, and 0.25 μg/mL amphotericin B (Nacalai Tesque, Inc.). Cells were incubated at 37 °C in a humidified atmosphere containing 5% CO₂ and 95% air.
4.2. Recombinant mAb production
An anti-EphB2 mAb, Eb2Mab-12 (mouse IgG1, κ) [39] was established previously. To construct the mouse IgG2a version (Eb2Mab-12-mG2a), the VH cDNA of Eb2Mab-12 and the CH of mouse IgG2a were cloned into the pCAG-Neo vector [FUJIFILM Wako Pure Chemical Corporation (Wako), Osaka, Japan]. Similarly, VL cDNA of Eb2Mab-12 and the CL of the mouse kappa chain were cloned into the pCAG-Ble vector (Wako). To construct the mouse-human IgG1 chimeric version (Eb2Mab-12-hG1), the VH cDNA of Eb2Mab-12 and the CH of human IgG1 were cloned into the pCAG-Neo vector (Wako). Similarly, VL cDNA of Eb2Mab-12 and the CL of the human kappa chain were cloned into the pCAG-Ble vector (Wako). To construct the mouse IgG1 version (Eb2Mab-12), the VH cDNA of Eb2Mab-12 and the CH of mouse IgG1 were cloned into the pCAG-Neo vector (Wako). Similarly, VL cDNA of Eb2Mab-12 and the CL of the mouse kappa chain were cloned into the pCAG-Ble vector (Wako). Antibody expression vectors were transfected into ExpiCHO-S cells using the ExpiCHO Expression System to produce Eb2Mab-12-mG2a, Eb2Mab-12-hG1, and Eb2Mab-12. As a control hIgG1 mAb, humCvMab-62 was generated from CvMab-62 (mouse IgG1, κ, an anti-SARS-CoV-2 spike protein S2 subunit mAb) using the same procedure [43]. As a control mIgG2a mAb, PMab-231 (mouse IgG2a, κ, an anti-tiger podoplanin mAb) was previously produced [42]. All antibodies were purified using Ab-Capcher (ProteNova Co., Ltd., Kagawa, Japan).
4.3. Flow Cytometry
Cell lines were harvested via brief exposure to 1 mM ethylenediaminetetraacetic acid (EDTA; Nacalai Tesque, Inc.)/0.25% trypsin. After washing with 0.1% BSA in PBS (blocking buffer), the cells were treated with primary mAbs for 30 min at 4 ◦C, followed by treatment with anti-mouse IgG conjugated with Alexa Fluor 488 (1:2000, Cell Signaling Technology, Inc., Danvers, MA) or anti-human IgG conjugated with fluorescein isothiocyanate (FITC) (1:2000, Sigma-Aldrich Corp., St. Louis, MO, USA). Fluorescence data were collected using an SA3800 Cell Analyzer (Sony Corp., Tokyo, Japan).
4.4. ADCC by Eb2Mab-12-mG2a and Eb2Mab-12-hG1
Five-week-old female BALB/c nude mice were purchased from Japan SLC Inc. (Shizuoka, Japan). The splenocytes (designated as effector cells) were prepared as described previously [43]. The ADCC activity of Eb2Mab-12-mG2a and Eb2Mab-12-hG1 was investigated as follows. Calcein AM-labeled target cells (CHO/EphB2, MDA-MB-231, and LS174T) were co-incubated with the effector cells at an effector-to-target (E:T) ratio of 50:1 in the presence of 100 μg/mL of either control mIgG2a, Eb2Mab-12-mG2a, control hIgG1, or Eb2Mab-12-hG1. Following a 4.5-hour incubation, the Calcein release into the medium was measured using a microplate reader (Power Scan HT; BioTek Instruments, Inc., Winooski, VT, USA).
Cytotoxicity was calculated as a percentage of lysis using the following formula: % lysis = (E − S)/(M − S) × 100, where E represents the fluorescence intensity from co-cultures of effector and target cells, S denotes the spontaneous fluorescence from target cells alone, and M corresponds to the maximum fluorescence obtained after complete lysis using a buffer containing 10 mM Tris-HCl (pH 7.4), 10 mM EDTA, and 0.5% Triton X-100. Data are presented as mean ± standard error of the mean (SEM). Statistical significance was evaluated using a two-tailed unpaired t-test.
4.5. CDC by Eb2Mab-12-mG2a and Eb2Mab-12-hG1
The Calcein AM-labeled target cells (CHO/EphB2, MDA-MB-231, and LS174T) were plated and mixed with rabbit complement (final dilution 10%, Low-Tox-M Rabbit Complement; Cedarlane Laboratories, Hornby, ON, Canada) and 100 μg/mL of control mIgG2a, Eb2Mab-12-mG2a, control hIgG1, or Eb2Mab-12-hG1. Following incubation for 4.5 h at 37 °C, the Calcein release into the medium was measured, as described above.
4.6. Antitumor Activity of Eb2Mab-12-mG2a and Eb2Mab-12-hG1
All animal experiments were approved and performed following regulations and guidelines to minimize animal distress and suffering in the laboratory by the Institutional Committee for Animal Experiments of the Institute of Microbial Chemistry (Numazu, Japan; approval number: 2025-021 and 2025-029). Mice were maintained on an 11 h light/13 h dark cycle in a specific pathogen-free environment across the experimental period. Food and water were supplied ad libitum. Mice weights were monitored two times per week and health were monitored three times per week. Humane endpoints for euthanasia were defined as a body weight loss exceeding 25% of the original weight and/or a maximum tumor volume greater than 3,000 mm³.
Female BALB/c nude mice (4-weeks old) were obtained from Japan SLC, Inc.. Tumor cells (0.3 mL of a 1.33 × 10⁸ cells/mL suspension in DMEM) were mixed with 0.5 mL of BD Matrigel Matrix Growth Factor Reduced (BD Biosciences, San Jose, CA, USA). A 100 μL aliquot of the mixture, containing 5 × 10⁶ cells, was subcutaneously injected into the left flank of each mouse. To evaluate the antitumor activity of Eb2Mab-12-mG2a and Eb2Mab-12-hG1, 100 μg of control mIgG2a (n=8), Eb2Mab-12-mG2a (n=8), control hIgG1 (n=8), or Eb2Mab-12-hG1 (n=8) diluted in 100 μL of PBS was administered intraperitoneally to tumor-bearing mice on day 8 post-inoculation. A second dose was administered on day 14. Mice were euthanized on day 21 following tumor cell implantation.
Tumor size was measured, and volume was calculated using the formula: volume = W² × L / 2, where W represents the short diameter and L the long diameter. Data are presented as the mean ± standard error of the mean (SEM). Statistical analysis was performed using one-way ANOVA followed by Sidak’s post hoc test. A p-value < 0.05 was considered statistically significant.
Supplementary Materials
The following supporting information can be downloaded at the website of this paper posted on Preprints.org. Figure S1: Flow cytometry analysis of Eb2Mab-12, Eb2Mab-12-mG2a, and Eb2Mab-12-hG1 to colorectal cancer (LS174T).; Figure S2: Flow cytometry analysis of Eb2Mab-12-mG2a and Eb2Mab-12-hG1 to LS174T and EphB2-knockout LS174T (BINDS-58).; Figure S3: ADCC and CDC by Eb2Mab-12-mG2a and Eb2Mab-12-hG1 against LS174T.; Figure S4, Antitumor activity of Eb2Mab-12-mG2a and Eb2Mab-12-hG1 against LS174T xenograft.
Author Contributions
R.U., T.O., and H.S. performed the experiments. M.K.K. and Y.K. designed the experiments. H.S. and Y.K. analyzed the data. R.U., H.S., and Y.K. wrote the manuscript. All authors have read and agreed to the published version of the manuscript.
Funding
This research was supported in part by Japan Agency for Medical Research and Development (AMED) under Grant Numbers: JP25am0521010 (to Y.K.), JP25ama121008 (to Y.K.), JP25ama221339 (to Y.K.), and JP25bm1123027 (to Y.K.), and by the Japan Society for the Promotion of Science (JSPS) Grants-in-Aid for Scientific Research (KAKENHI) grant no. 25K10553 (to Y.K.).
Institutional Review Board Statement
Animal experiments were approved by the Institutional Committee for Experiments of the Institute of Microbial Chemistry (approval no. 2025-021, approval date 22 April, 2025, 2025-029, approval date 12 June, 2025).
Informed Consent Statement
Not applicable.
Data Availability Statement
The data presented in this study are available in the article and Supplementary Material.
Conflicts of Interest
The authors declare no conflict of interest.
References
- Zhu, Y.; Su, S.A.; Shen, J.; et al. Recent advances of the Ephrin and Eph family in cardiovascular development and pathologies. iScience 2024, 27, 110556. [Google Scholar] [CrossRef]
- Pasquale, E.B. Eph receptor signaling complexes in the plasma membrane. Trends Biochem Sci 2024, 49, 1079–1096. [Google Scholar] [CrossRef]
- Pasquale, E.B. Eph receptors and ephrins in cancer progression. Nat Rev Cancer 2024, 24, 5–27. [Google Scholar] [CrossRef] [PubMed]
- Anderton, M.; van der Meulen, E.; Blumenthal, M.J.; Schäfer, G. The Role of the Eph Receptor Family in Tumorigenesis. Cancers 2021, 13, 206. [Google Scholar] [CrossRef] [PubMed]
- Liang, L.Y.; Patel, O.; Janes, P.W.; Murphy, J.M.; Lucet, I.S. Eph receptor signalling: from catalytic to non-catalytic functions. Oncogene 2019, 38, 6567–6584. [Google Scholar] [CrossRef] [PubMed]
- Pasquale, E.B. Eph receptors and ephrins in cancer: bidirectional signalling and beyond. Nat Rev Cancer 2010, 10, 165–180. [Google Scholar] [CrossRef]
- Pasquale, E.B. Eph receptor signalling casts a wide net on cell behaviour. Nat Rev Mol Cell Biol 2005, 6, 462–475. [Google Scholar] [CrossRef]
- Arora, S.; Scott, A.M.; Janes, P.W. Eph Receptors in Cancer. Biomedicines 2023, 11, 315. [Google Scholar] [CrossRef]
- Lau, A.; Le, N.; Nguyen, C.; Kandpal, R.P. Signals transduced by Eph receptors and ephrin ligands converge on MAP kinase and AKT pathways in human cancers. Cell Signal 2023, 104, 110579. [Google Scholar] [CrossRef]
- Liu, W.; Yu, C.; Li, J.; Fang, J. The Roles of EphB2 in Cancer. Front Cell Dev Biol 2022, 10, 788587. [Google Scholar] [CrossRef]
- Lam, S.; Wiercinska, E.; Teunisse, A.F.; et al. Wild-type p53 inhibits pro-invasive properties of TGF-β3 in breast cancer, in part through regulation of EPHB2, a new TGF-β target gene. Breast Cancer Res Treat 2014, 148, 7–18. [Google Scholar] [CrossRef]
- Zhou, F.; Wang, B.; Wang, H.; et al. circMELK promotes glioblastoma multiforme cell tumorigenesis through the miR-593/EphB2 axis. Mol Ther Nucleic Acids 2021, 25, 25–36. [Google Scholar] [CrossRef] [PubMed]
- Goparaju, C.; Donington, J.S.; Hsu, T.; et al. Overexpression of EPH receptor B2 in malignant mesothelioma correlates with oncogenic behavior. J Thorac Oncol 2013, 8, 1203–1211. [Google Scholar] [CrossRef]
- Leung, H.W.; Leung, C.O.N.; Lau, E.Y.; et al. EPHB2 Activates β-Catenin to Enhance Cancer Stem Cell Properties and Drive Sorafenib Resistance in Hepatocellular Carcinoma. Cancer Res 2021, 81, 3229–3240. [Google Scholar] [CrossRef]
- Nakada, M.; Niska, J.A.; Miyamori, H.; et al. The phosphorylation of EphB2 receptor regulates migration and invasion of human glioma cells. Cancer Res 2004, 64, 3179–3185. [Google Scholar] [CrossRef] [PubMed]
- Nakada, M.; Niska, J.A.; Tran, N.L.; McDonough, W.S.; Berens, M.E. EphB2/R-Ras signaling regulates glioma cell adhesion, growth, and invasion. Am J Pathol 2005, 167, 565–576. [Google Scholar] [CrossRef]
- Toracchio, L.; Carrabotta, M.; Mancarella, C.; Morrione, A.; Scotlandi, K. EphA2 in Cancer: Molecular Complexity and Therapeutic Opportunities. Int J Mol Sci 2024, 25, 12191. [Google Scholar] [CrossRef]
- Cha, J.H.; Chan, L.C.; Wang, Y.N.; et al. Ephrin receptor A10 monoclonal antibodies and the derived chimeric antigen receptor T cells exert an antitumor response in mouse models of triple-negative breast cancer. J Biol Chem 2022, 298, 101817. [Google Scholar] [CrossRef]
- Xiao, T.; Xiao, Y.; Wang, W.; et al. Targeting EphA2 in cancer. J Hematol Oncol 2020, 13, 114. [Google Scholar] [CrossRef]
- Tang, F.H.F.; Davis, D.; Arap, W.; Pasqualini, R.; Staquicini, F.I. Eph receptors as cancer targets for antibody-based therapy. Adv Cancer Res 2020, 147, 303–317. [Google Scholar] [PubMed]
- London, M.; Gallo, E. Critical role of EphA3 in cancer and current state of EphA3 drug therapeutics. Mol Biol Rep 2020, 47, 5523–5533. [Google Scholar] [CrossRef]
- Buckens, O.J.; El Hassouni, B.; Giovannetti, E.; Peters, G.J. The role of Eph receptors in cancer and how to target them: novel approaches in cancer treatment. Expert Opin Investig Drugs 2020, 29, 567–582. [Google Scholar] [CrossRef]
- Saha, N.; Robev, D.; Mason, E.O.; Himanen, J.P.; Nikolov, D.B. Therapeutic potential of targeting the Eph/ephrin signaling complex. Int J Biochem Cell Biol 2018, 105, 123–133. [Google Scholar] [CrossRef] [PubMed]
- Taki, S.; Kamada, H.; Inoue, M.; et al. A Novel Bispecific Antibody against Human CD3 and Ephrin Receptor A10 for Breast Cancer Therapy. PLoS One 2015, 10, e0144712. [Google Scholar] [CrossRef] [PubMed]
- Mao, W.; Luis, E.; Ross, S.; et al. EphB2 as a therapeutic antibody drug target for the treatment of colorectal cancer. Cancer Res 2004, 64, 781–788. [Google Scholar] [CrossRef] [PubMed]
- Janes, P.W.; Vail, M.E.; Gan, H.K.; Scott, A.M. Antibody Targeting of Eph Receptors in Cancer. Pharmaceuticals 2020, 13, 88. [Google Scholar] [CrossRef]
- Lehmann, B.D.; Bauer, J.A.; Chen, X.; et al. Identification of human triple-negative breast cancer subtypes and preclinical models for selection of targeted therapies. J Clin Invest 2011, 121, 2750–2767. [Google Scholar] [CrossRef]
- Yin, L.; Duan, J.J.; Bian, X.W.; Yu, S.C. Triple-negative breast cancer molecular subtyping and treatment progress. Breast Cancer Res 2020, 22, 61. [Google Scholar] [CrossRef]
- Lehmann, B.D.; Colaprico, A.; Silva, T.C.; et al. Multi-omics analysis identifies therapeutic vulnerabilities in triple-negative breast cancer subtypes. Nat Commun 2021, 12, 6276. [Google Scholar] [CrossRef]
- Lehmann, B.D.; Jovanović, B.; Chen, X.; et al. Refinement of Triple-Negative Breast Cancer Molecular Subtypes: Implications for Neoadjuvant Chemotherapy Selection. PLoS One 2016, 11, e0157368. [Google Scholar] [CrossRef]
- Hubalek, M.; Czech, T.; Müller, H. Biological Subtypes of Triple-Negative Breast Cancer. Breast Care (Basel) 2017, 12, 8–14. [Google Scholar] [CrossRef]
- Limsakul, P.; Choochuen, P.; Jungrungrueang, T.; Charupanit, K. Prognostic Markers in Tyrosine Kinases Specific to Basal-like 2 Subtype of Triple-Negative Breast Cancer. Int J Mol Sci 2024, 25, 1405. [Google Scholar] [CrossRef]
- Horbinski, C.; Berger, T.; Packer, R.J.; Wen, P.Y. Clinical implications of the 2021 edition of the WHO classification of central nervous system tumours. Nat Rev Neurol 2022, 18, 515–529. [Google Scholar] [CrossRef]
- Johnson, R.A.; Wright, K.D.; Poppleton, H.; et al. Cross-species genomics matches driver mutations and cell compartments to model ependymoma. Nature 2010, 466, 632–636. [Google Scholar] [CrossRef]
- Pajtler, K.W.; Witt, H.; Sill, M.; et al. Molecular Classification of Ependymal Tumors across All CNS Compartments, Histopathological Grades, and Age Groups. Cancer Cell 2015, 27, 728–743. [Google Scholar] [CrossRef] [PubMed]
- Arabzade, A.; Zhao, Y.; Varadharajan, S.; et al. ZFTA-RELA Dictates Oncogenic Transcriptional Programs to Drive Aggressive Supratentorial Ependymoma. Cancer Discov 2021, 11, 2200–2215. [Google Scholar] [CrossRef] [PubMed]
- Satofuka, H.; Suzuki, H.; Tanaka, T.; et al. Development of an anti-human EphA2 monoclonal antibody Ea2Mab-7 for multiple applications. Biochemistry and Biophysics Reports 2025, 42. [Google Scholar] [CrossRef]
- Satofuka, H.; Suzuki, H.; Hirose, M.; et al. Development of a specific anti-human EphA3 monoclonal antibody, Ea3Mab-20, for flow cytometry. Biochemistry and Biophysics Reports 2025, 43, 102130. [Google Scholar] [CrossRef]
- Ubukata, R.; Suzuki, H.; Hirose, M.; et al. Establishment of a highly sensitive and specific anti-EphB2 monoclonal antibody (Eb2Mab-12) for flow cytometry. Microbes & Immunity.
- Nanamiya, R.; Suzuki, H.; Kaneko, M.K.; Kato, Y. Development of an Anti-EphB4 Monoclonal Antibody for Multiple Applications Against Breast Cancers. Monoclon Antib Immunodiagn Immunother 2023, 42, 166–177. [Google Scholar] [CrossRef] [PubMed]
- Tanaka, T.; Kaneko, Y.; Yamamoto, H.; et al. Development of a novel anti-erythropoietin-producing hepatocellular receptor B6 monoclonal antibody Eb6Mab-3 for flow cytometry. Biochemistry and Biophysics Reports 2025, 41, 101960. [Google Scholar] [CrossRef]
- Kaneko, M.K.; Suzuki, H.; Ohishi, T.; et al. A Cancer-Specific Monoclonal Antibody against HER2 Exerts Antitumor Activities in Human Breast Cancer Xenograft Models. Int J Mol Sci 2024, 25, 1941. [Google Scholar] [CrossRef]
- Kaneko, M.K.; Suzuki, H.; Ohishi, T.; et al. Antitumor Activities of a Humanized Cancer-Specific Anti-HER2 Monoclonal Antibody, humH(2)Mab-250 in Human Breast Cancer Xenografts. Int J Mol Sci 2025, 26, 1079. [Google Scholar] [CrossRef]
- Overdijk, M.B.; Verploegen, S.; Ortiz Buijsse, A.; et al. Crosstalk between human IgG isotypes and murine effector cells. J Immunol 2012, 189, 3430–3438. [Google Scholar] [CrossRef] [PubMed]
- Montero, J.C.; Seoane, S.; Ocaña, A.; Pandiella, A. Inhibition of SRC family kinases and receptor tyrosine kinases by dasatinib: possible combinations in solid tumors. Clin Cancer Res 2011, 17, 5546–5552. [Google Scholar] [CrossRef] [PubMed]
- Tong, Y.; Fan, X.; Liu, H.; Liang, T. Advances in Trop-2 targeted antibody-drug conjugates for breast cancer: mechanisms, clinical applications, and future directions. Front Immunol 2024, 15, 1495675. [Google Scholar] [CrossRef] [PubMed]
- Izci, H.; Punie, K.; Waumans, L.; et al. Correlation of TROP-2 expression with clinical-pathological characteristics and outcome in triple-negative breast cancer. Sci Rep 2022, 12, 22498. [Google Scholar] [CrossRef]
- Reusch, U.; Sundaram, M.; Davol, P.A.; et al. Anti-CD3 x anti-epidermal growth factor receptor (EGFR) bispecific antibody redirects T-cell cytolytic activity to EGFR-positive cancers in vitro and in an animal model. Clin Cancer Res 2006, 12, 183–190. [Google Scholar] [CrossRef] [PubMed]
- Hynes, N.E.; Lane, H.A. ERBB receptors and cancer: the complexity of targeted inhibitors. Nat Rev Cancer 2005, 5, 341–354. [Google Scholar] [CrossRef]
- Merchant, T.E.; Li, C.; Xiong, X.; et al. Conformal radiotherapy after surgery for paediatric ependymoma: a prospective study. Lancet Oncol 2009, 10, 258–266. [Google Scholar] [CrossRef]
- Ren, J.; Amoozgar, Z.; Uccello, T.P.; et al. Targeting EPHB2/ABL1 restores antitumor immunity in preclinical models of ependymoma. Proc Natl Acad Sci U S A 2025, 122, e2319474122. [Google Scholar] [CrossRef]
Figure 1.
Production of recombinant Eb2Mab-12, Eb2Mab-12-mG2a, and Eb2Mab-12-hG1. (A) After determination of CDRs of Eb2Mab-12, recombinant Eb2Mab-12 (mouse IgG1), Eb2Mab-12-mG2a (mouse IgG2a), and Eb2Mab-12-hG1 (human IgG1) were produced and purified. (B) Eb2Mab-12, Eb2Mab-12-mG2a, Eb2Mab-12-hG1, PMab-231 (control mIgG2a), and humCvMab-62 (control hIgG1) were treated with sodium dodecyl sulfate sample buffer containing 2-mercaptoethanol. Proteins were separated on a polyacrylamide gel. The gel was stained with Bio-Safe CBB G-250 Stain.
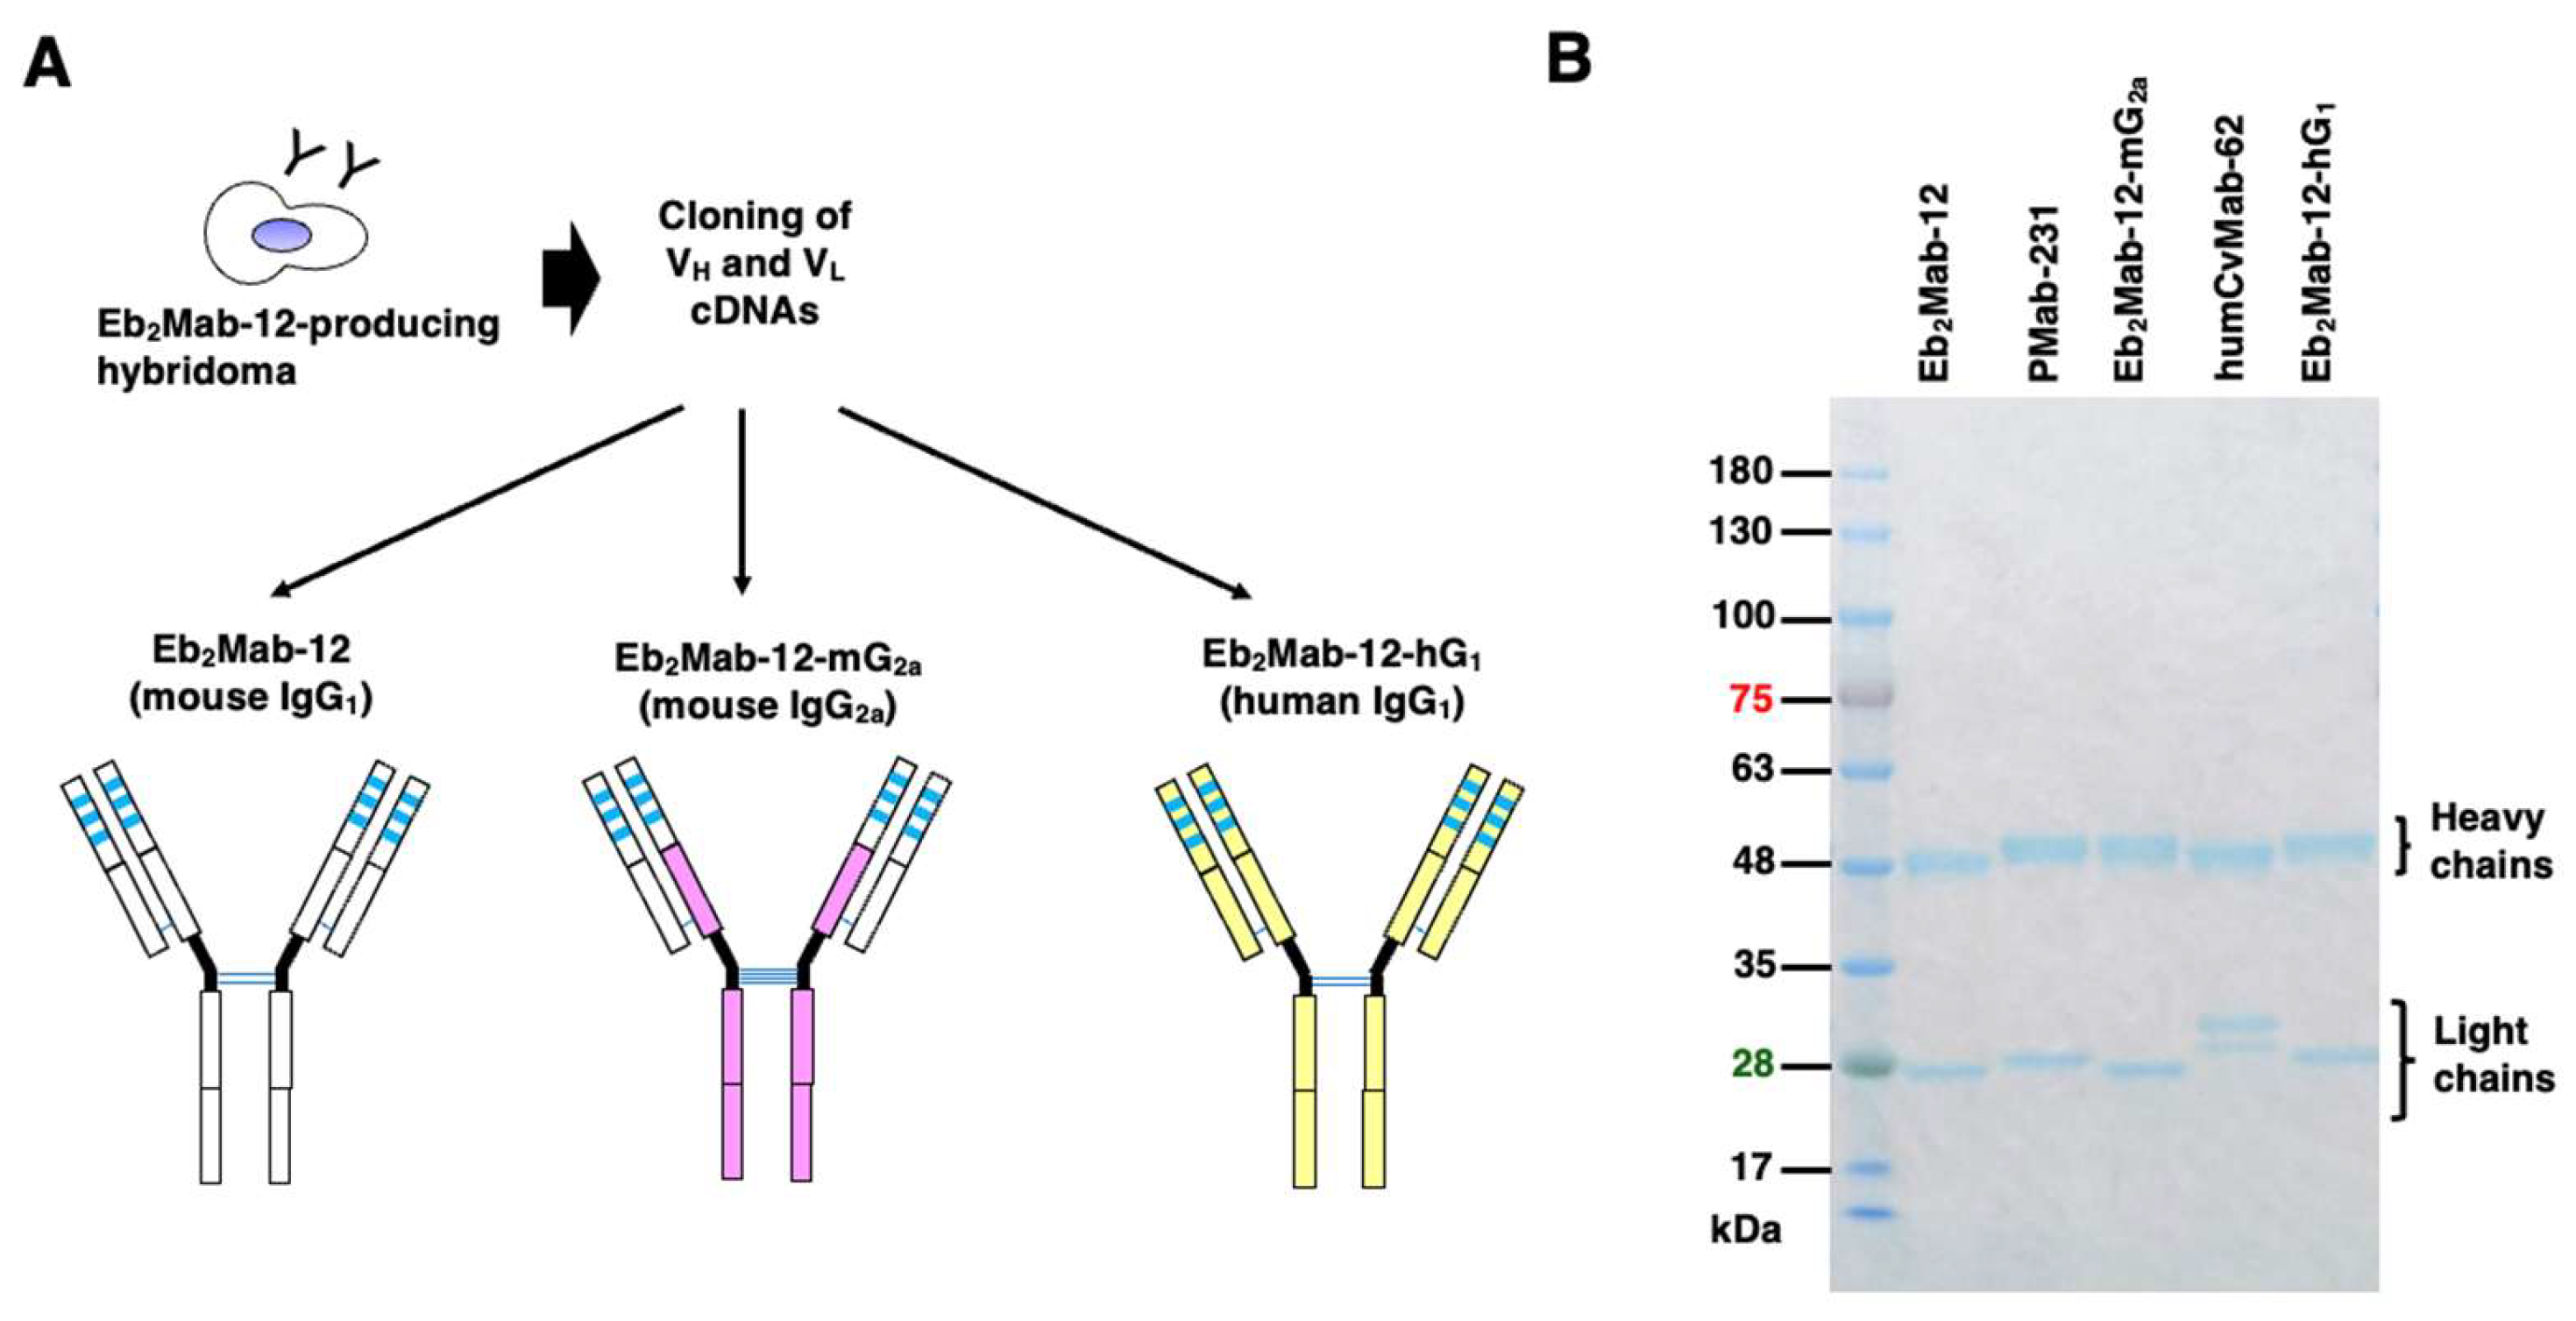
Figure 2.
Flow cytometry analysis of Eb2Mab-12, Eb2Mab-12-mG2a, and Eb2Mab-12-hG1 to CHO/EphB2 and EphB2-positive cancer cell lines. CHO/EphB2 (A), CHO-K1 (B), TNBC (MDA-MB-231) (C), and lung mesothelioma (NCI-H226) (D) were treated with 0.01, 0.1, and 1 µg/mL of indicated mAbs. Then, the cells were treated with Alexa Fluor 488-conjugated anti-mouse IgG or FITC-conjugated anti-human IgG. Fluorescence data were analyzed using the SA3800 Cell Analyzer.
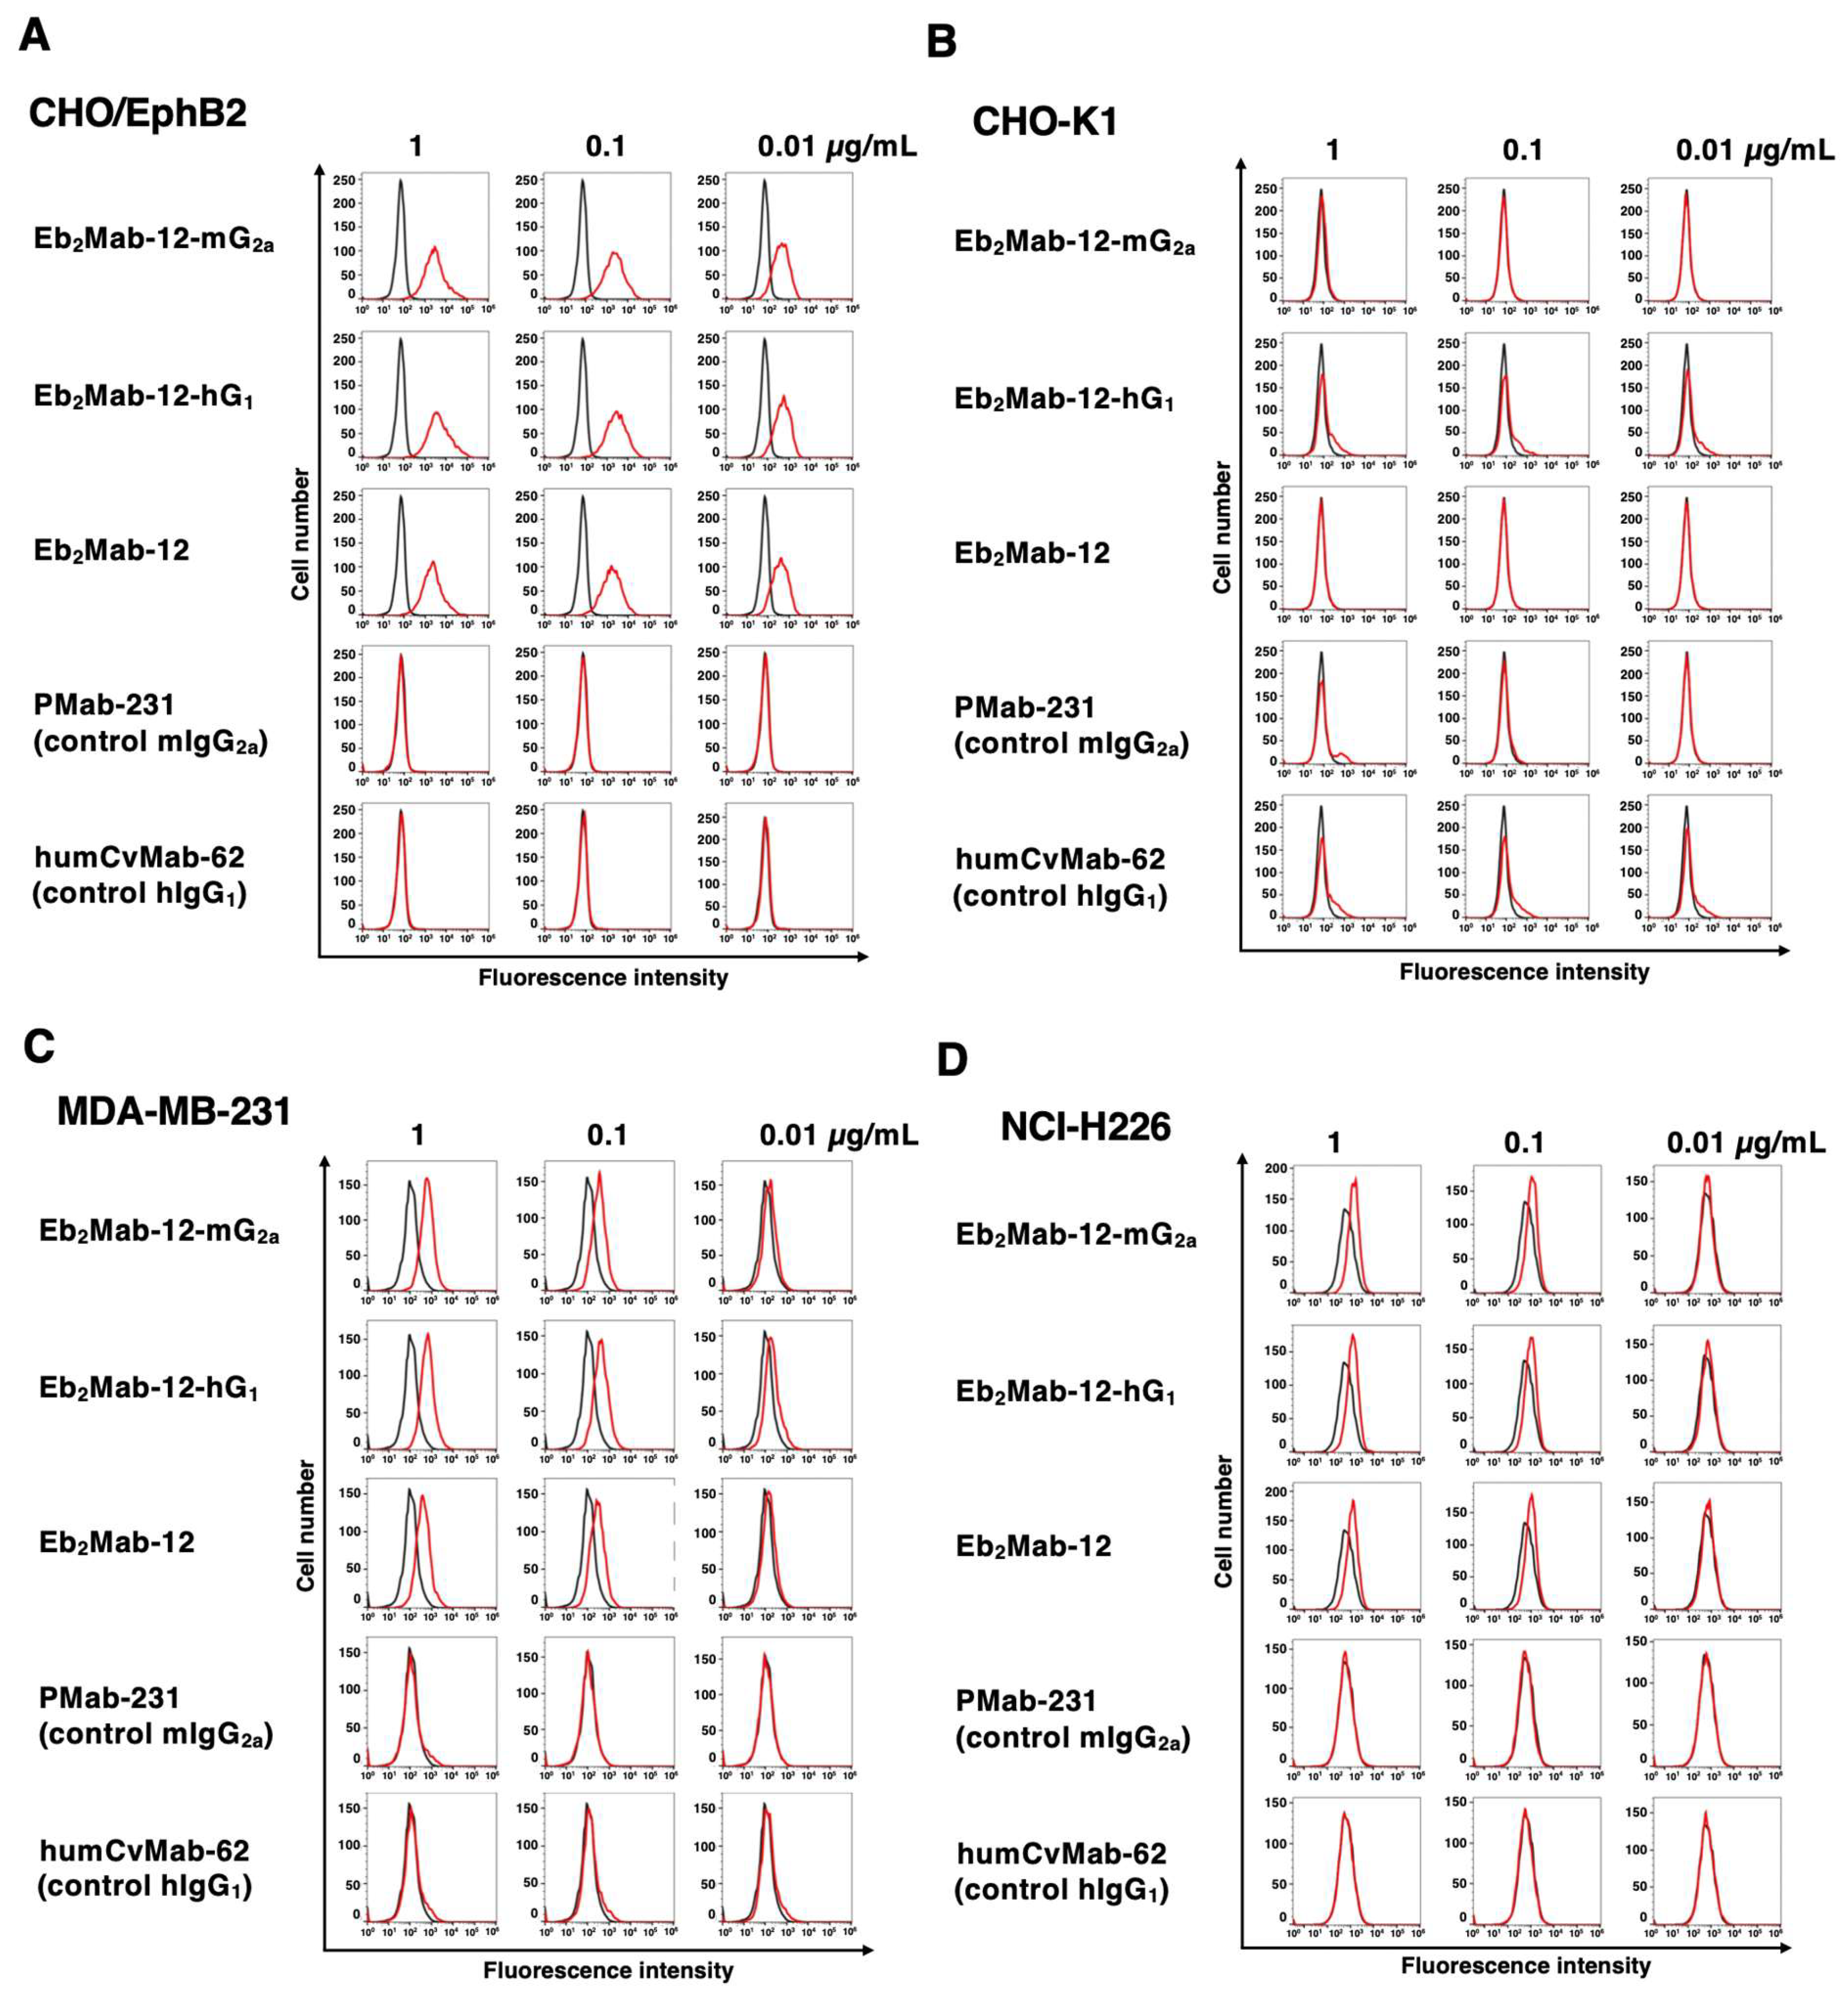
Figure 3.
ADCC and CDC by Eb2Mab-12-mG2a and Eb2Mab-12-hG1 against CHO/EphB2. (A) ADCC induced by Eb2Mab-12-mG2a or control mouse IgG2a (mIgG2a) against CHO/EphB2 (left). ADCC induced by Eb2Mab-12-hG1 or control human IgG1 (hIgG1) against CHO/EphB2 (right). (B) CDC induced by Eb2Mab-12-mG2a or mIgG2a against CHO/EphB2 (left). CDC induced by Eb2Mab-12-hG1 or hIgG1 against CHO/EphB2 (right). Values are shown as mean ± SEM. Asterisks indicate statistical significance (* p < 0.05; Two-tailed unpaired t test).
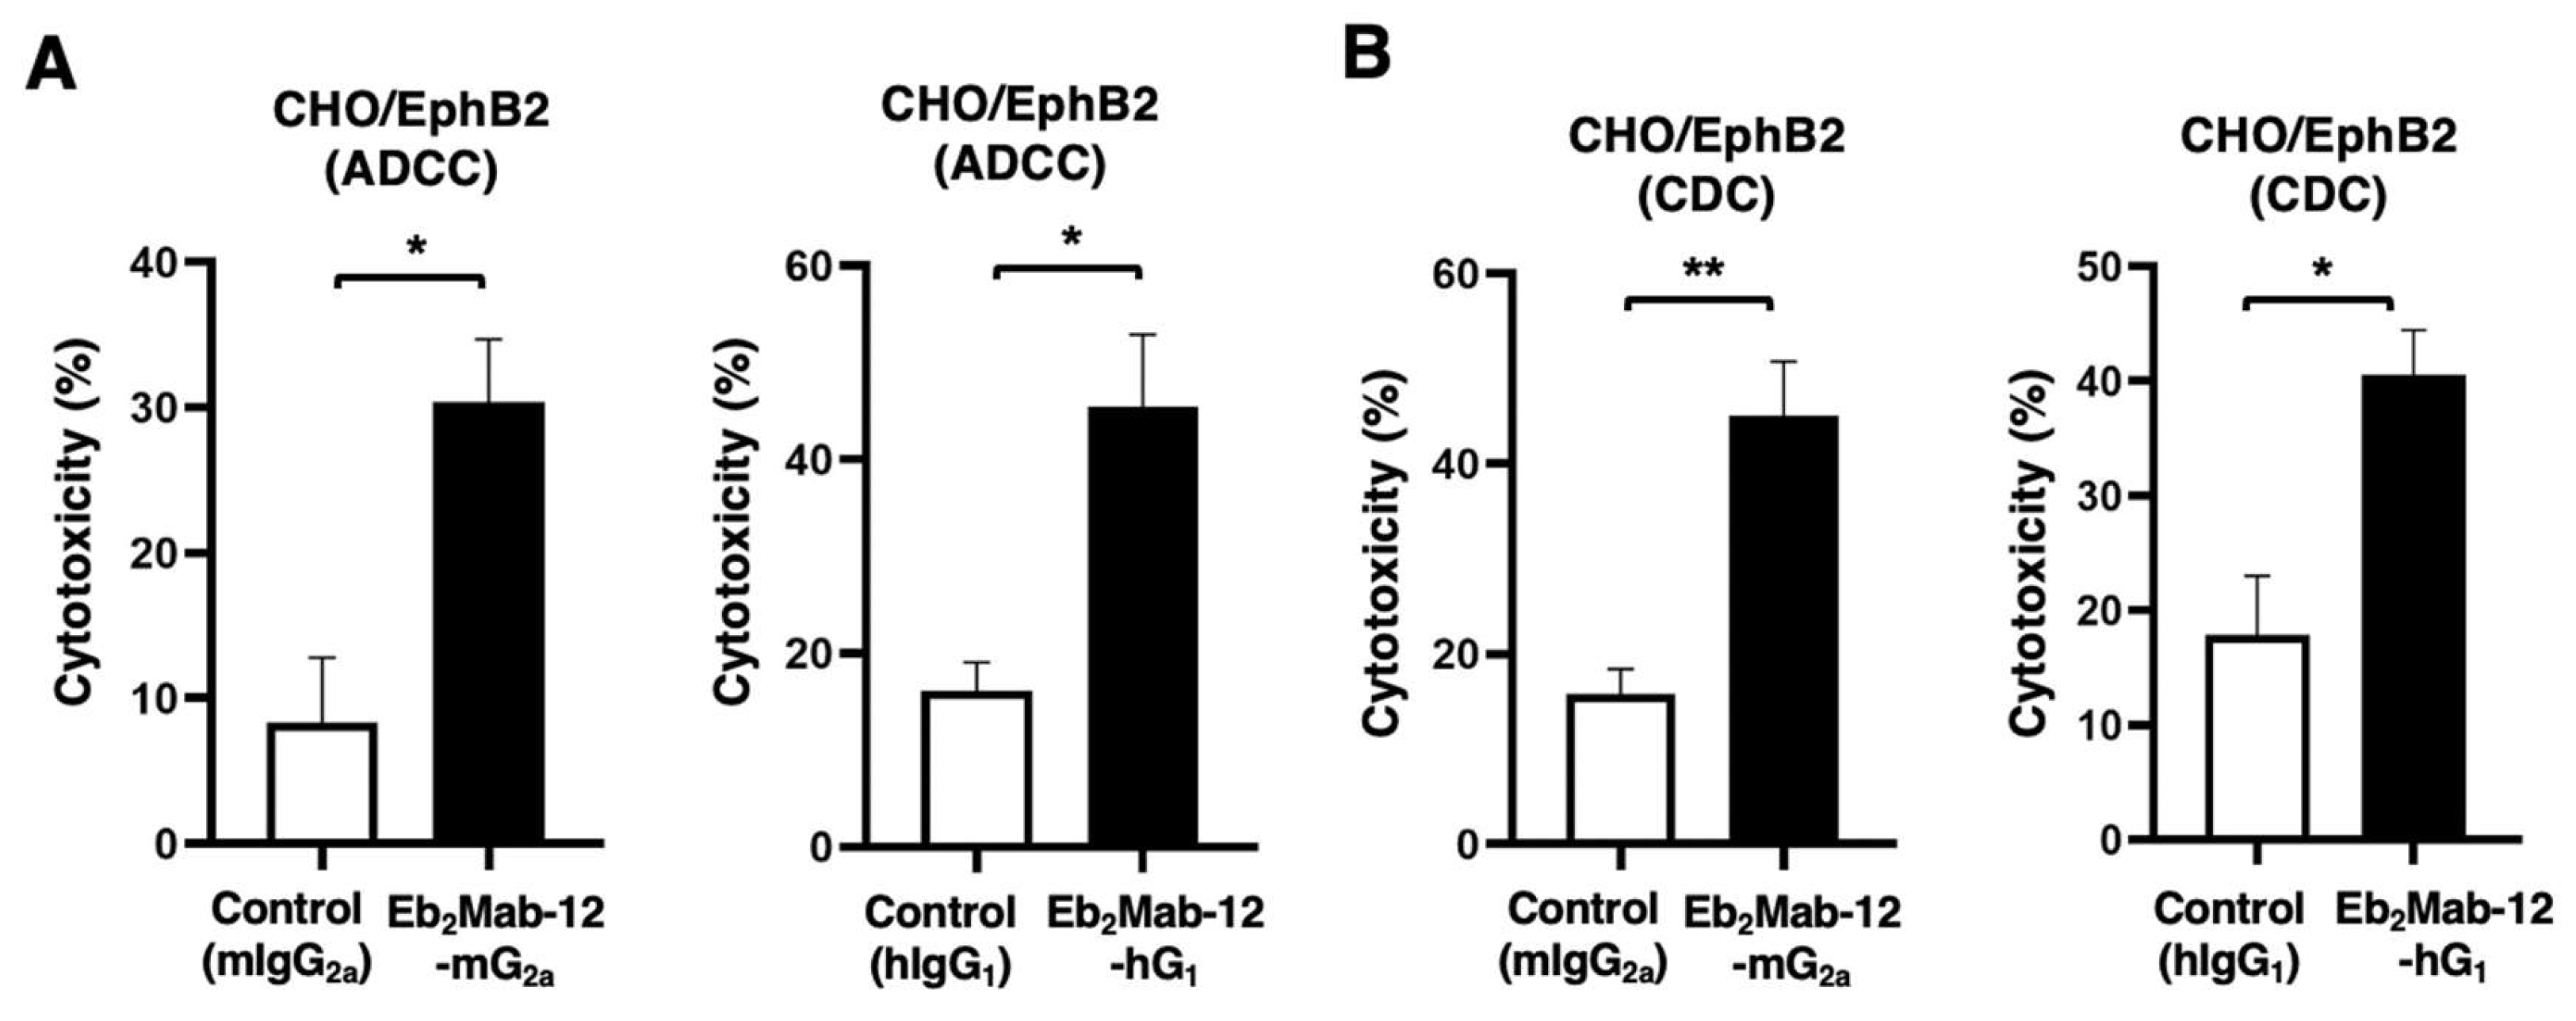
Figure 4.
Antitumor activity of Eb2Mab-12-mG2a and Eb2Mab-12-hG1 against CHO/EphB2 xenograft. CHO/EphB2 were subcutaneously injected into BALB/c nude mice (day 0). (A) In total, 100 μg of Eb2Mab-12-mG2a or control mouse IgG2a (mIgG2a) were intraperitoneally injected into each mouse on day 8. Additional antibodies were injected on day 14. (B) In total, 100 μg of Eb2Mab-12-hG1 or control human IgG1 (hIgG1) were intraperitoneally injected into each mouse on day 8. Additional antibodies were injected on day 14. The tumor volume is represented as the mean ± SEM. ** p < 0.01 (ANOVA with Sidak’s multiple comparisons test). (C,D) The mice treated with the mAbs mentioned above were euthanized on day 21. The CHO/EphB2 xenograft weights were measured. Values are presented as the mean ± SEM. ** p < 0.01 (Two-tailed unpaired t test). (E,F) Body weights of CHO/EphB2 xenograft-bearing mice treated with the mAbs mentioned above. There is no statistical difference.
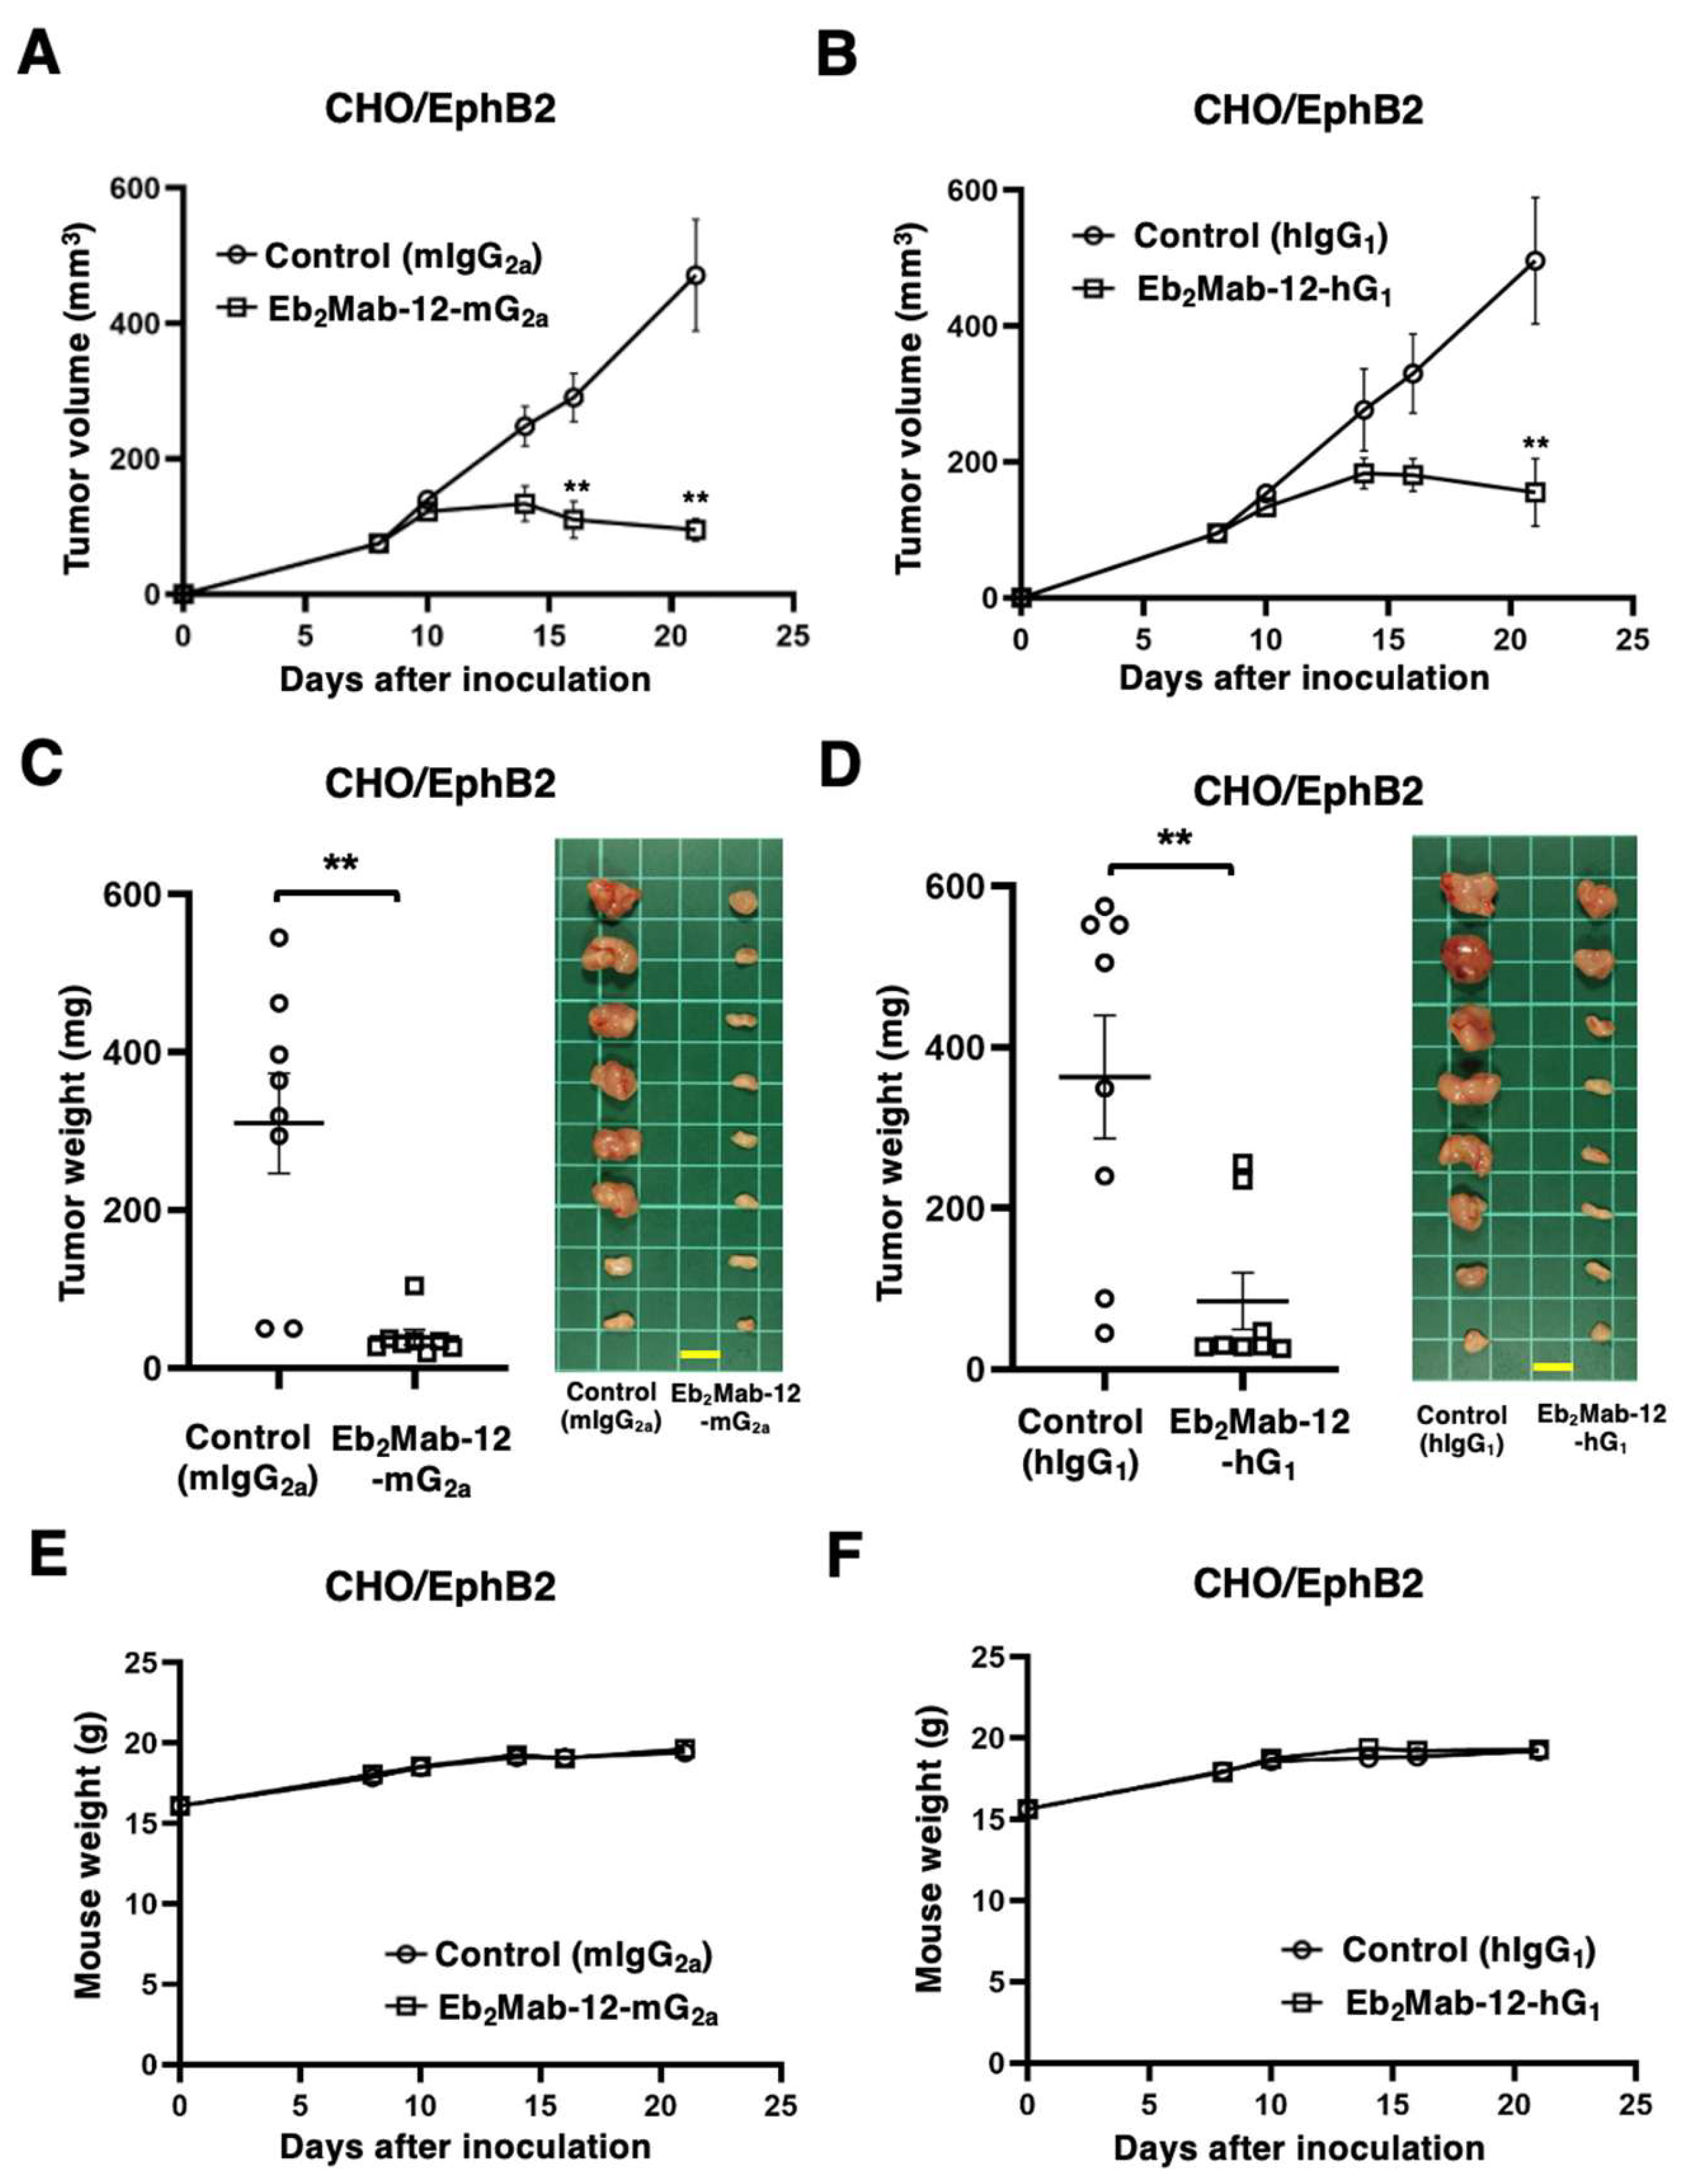
Figure 5.
ADCC and CDC by Eb2Mab-12-mG2a and Eb2Mab-12-hG1 against MDA-MB-231 and NCI-H226. (A) ADCC induced by Eb2Mab-12-mG2a or control mouse IgG2a (mIgG2a) against MDA-MB-231 (left). ADCC induced by Eb2Mab-12-hG1 or control human IgG1 (hIgG1) against MDA-MB-231 (right). (B) CDC induced by Eb2Mab-12-mG2a or mIgG2a against MDA-MB-231 (left). CDC induced by Eb2Mab-12-hG1 or hIgG1 against MDA-MB-231 (right). (C) ADCC induced by Eb2Mab-12-mG2a or control mouse IgG2a (mIgG2a) against NCI-H226 (left). ADCC induced by Eb2Mab-12-hG1 or control human IgG1 (hIgG1) against NCI-H226 (right). (D) CDC induced by Eb2Mab-12-mG2a or mIgG2a against NCI-H226 (left). CDC induced by Eb2Mab-12-hG1 or hIgG1 against NCI-H226 (right). Values are shown as mean ± SEM. Asterisks indicate statistical significance (* p < 0.05; Two-tailed unpaired t test).
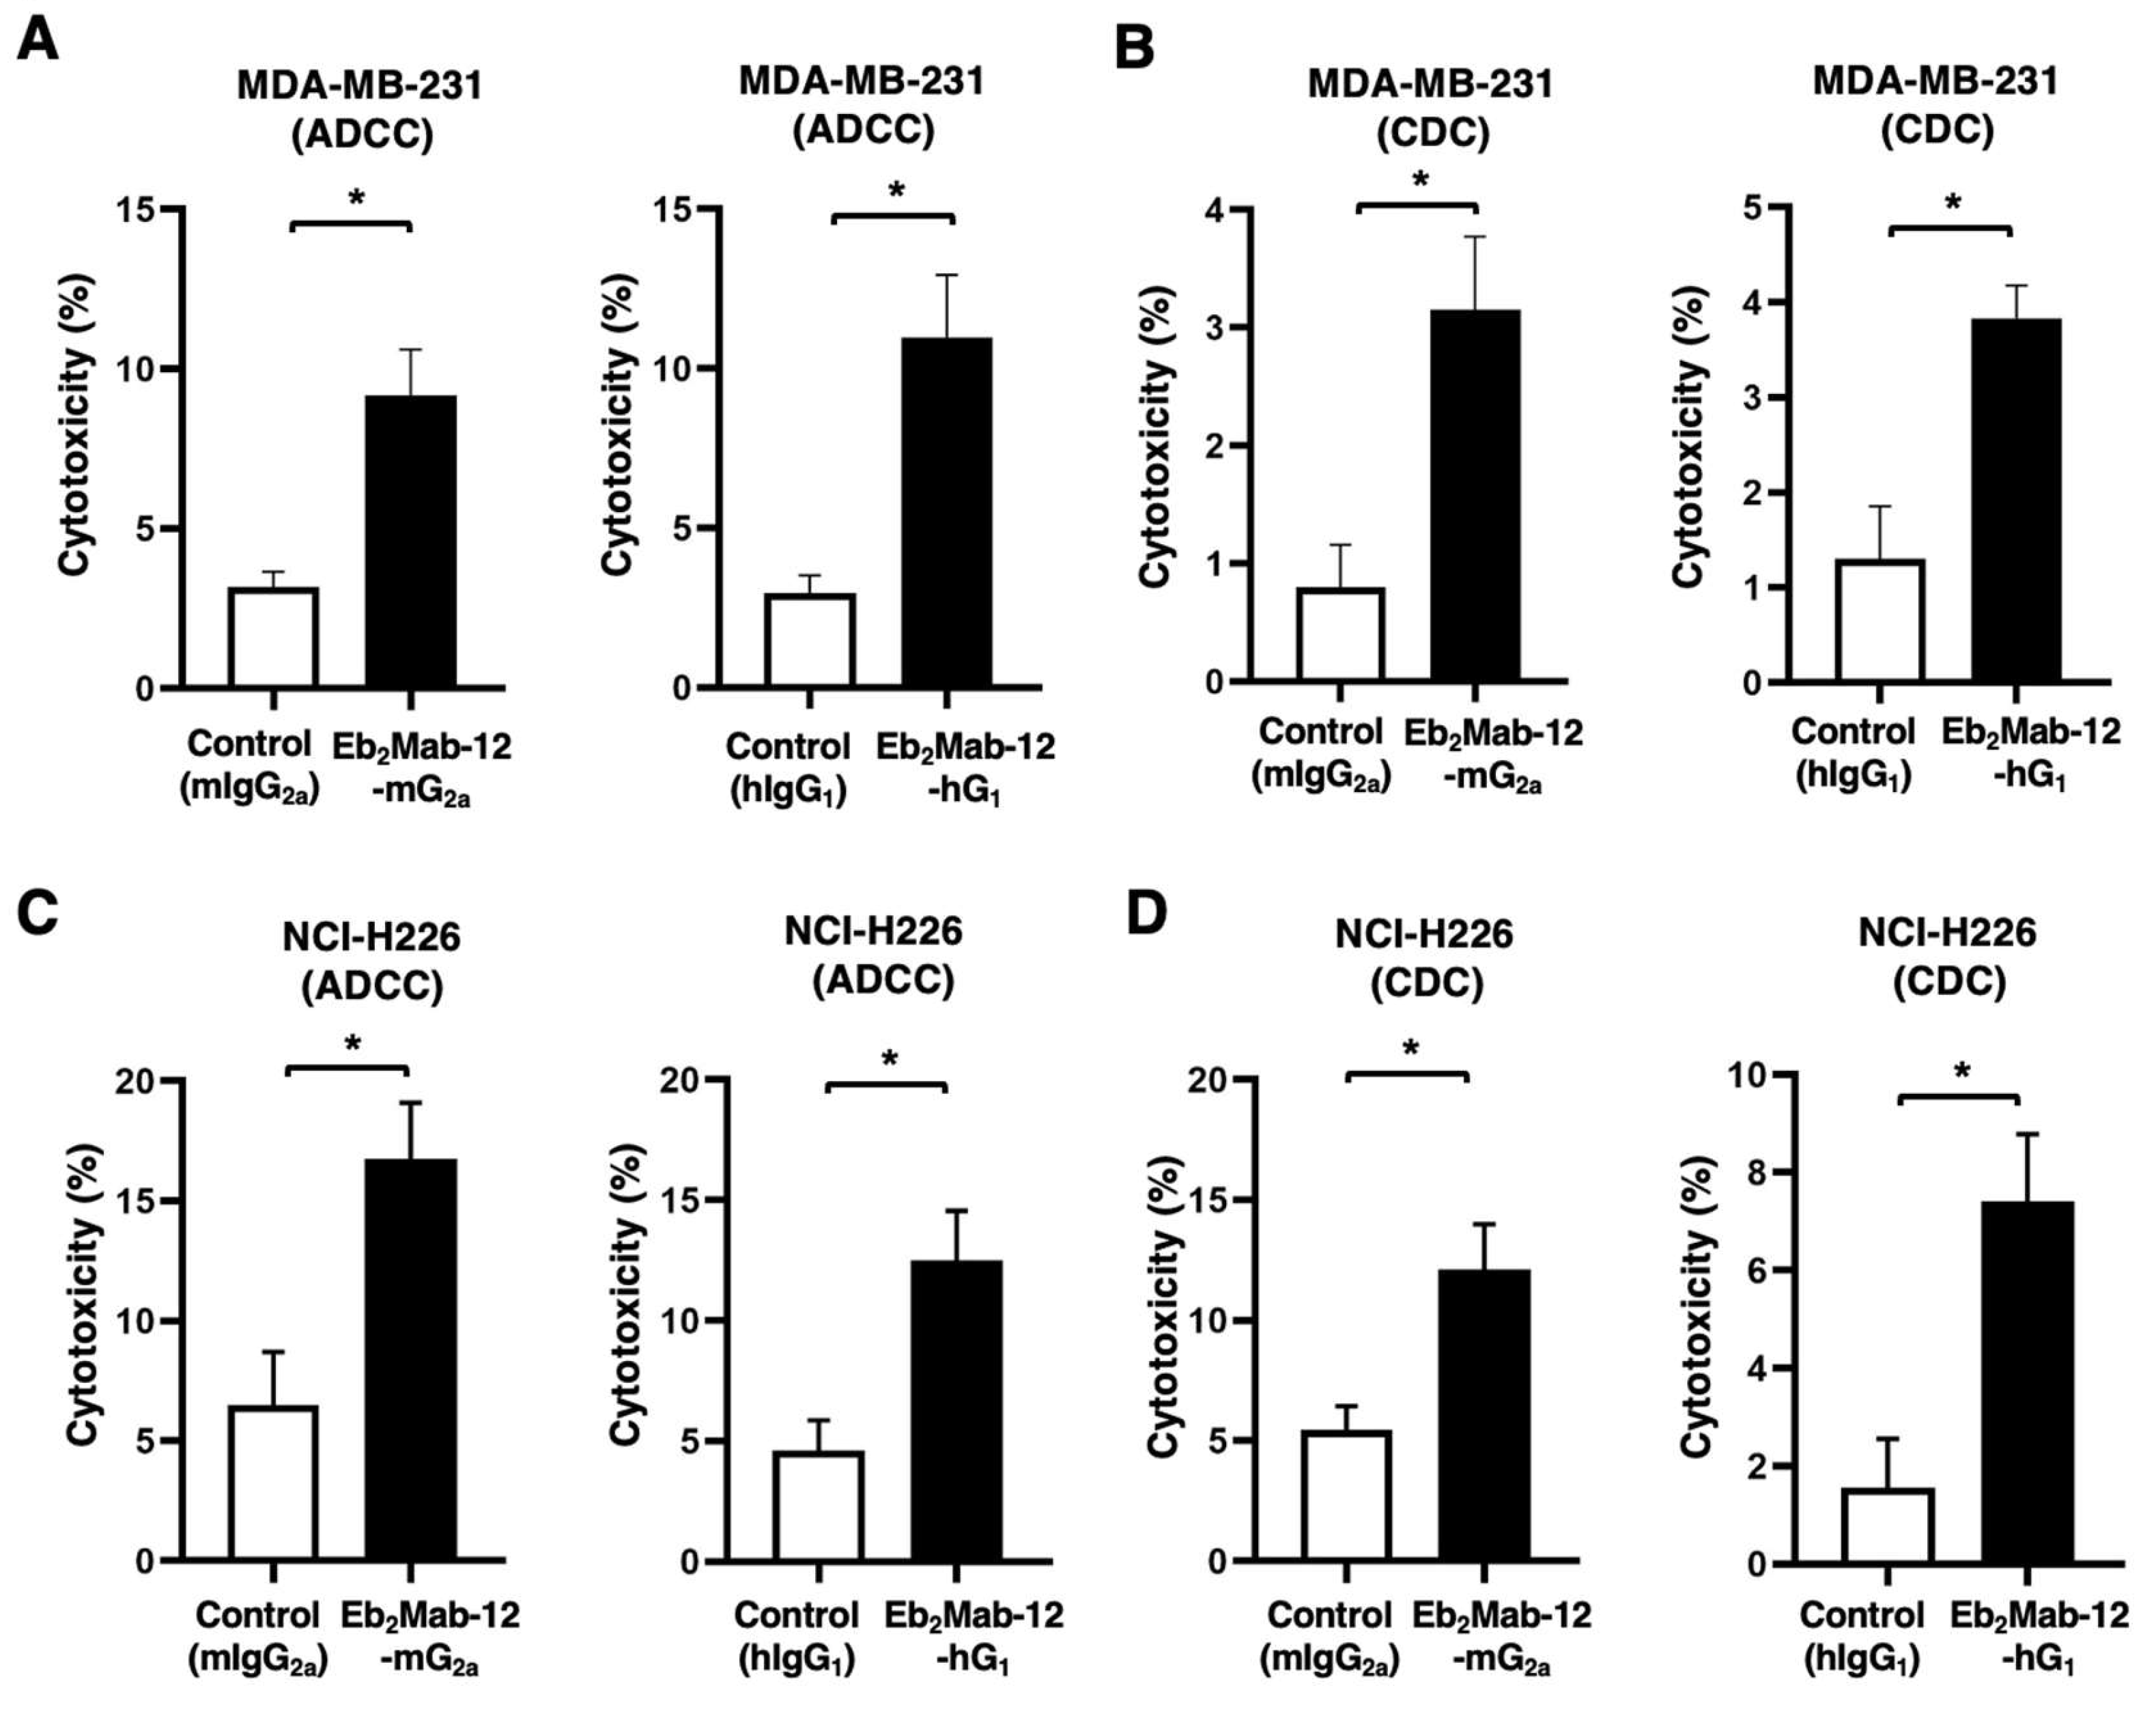
Figure 6.
Antitumor activity of Eb2Mab-12-mG2a and Eb2Mab-12-hG1 against MDA-MB-231 xenograft. MDA-MB-231 were subcutaneously injected into BALB/c nude mice (day 0). (A) In total, 100 μg of Eb2Mab-12-mG2a or control mouse IgG2a (mIgG2a) were intraperitoneally injected into each mouse on day 8. Additional antibodies were injected on day 14. (B) In total, 100 μg of Eb2Mab-12-hG1 or control human IgG1 (hIgG1) were intraperitoneally injected into each mouse on day 8. Additional antibodies were injected on day 14. The tumor volume is represented as the mean ± SEM. ** p < 0.01 (ANOVA with Sidak’s multiple comparisons test). (C,D) The mice treated with above-mentioned mAbs were euthanized on day 24. The MDA-MB-231 xenograft weights were measured. Values are presented as the mean ± SEM. * p < 0.05 (Two-tailed unpaired t test). (E,F) Body weights of MDA-MB-231 xenograft-bearing mice treated with above-mentioned mAbs. There is no statistical difference.
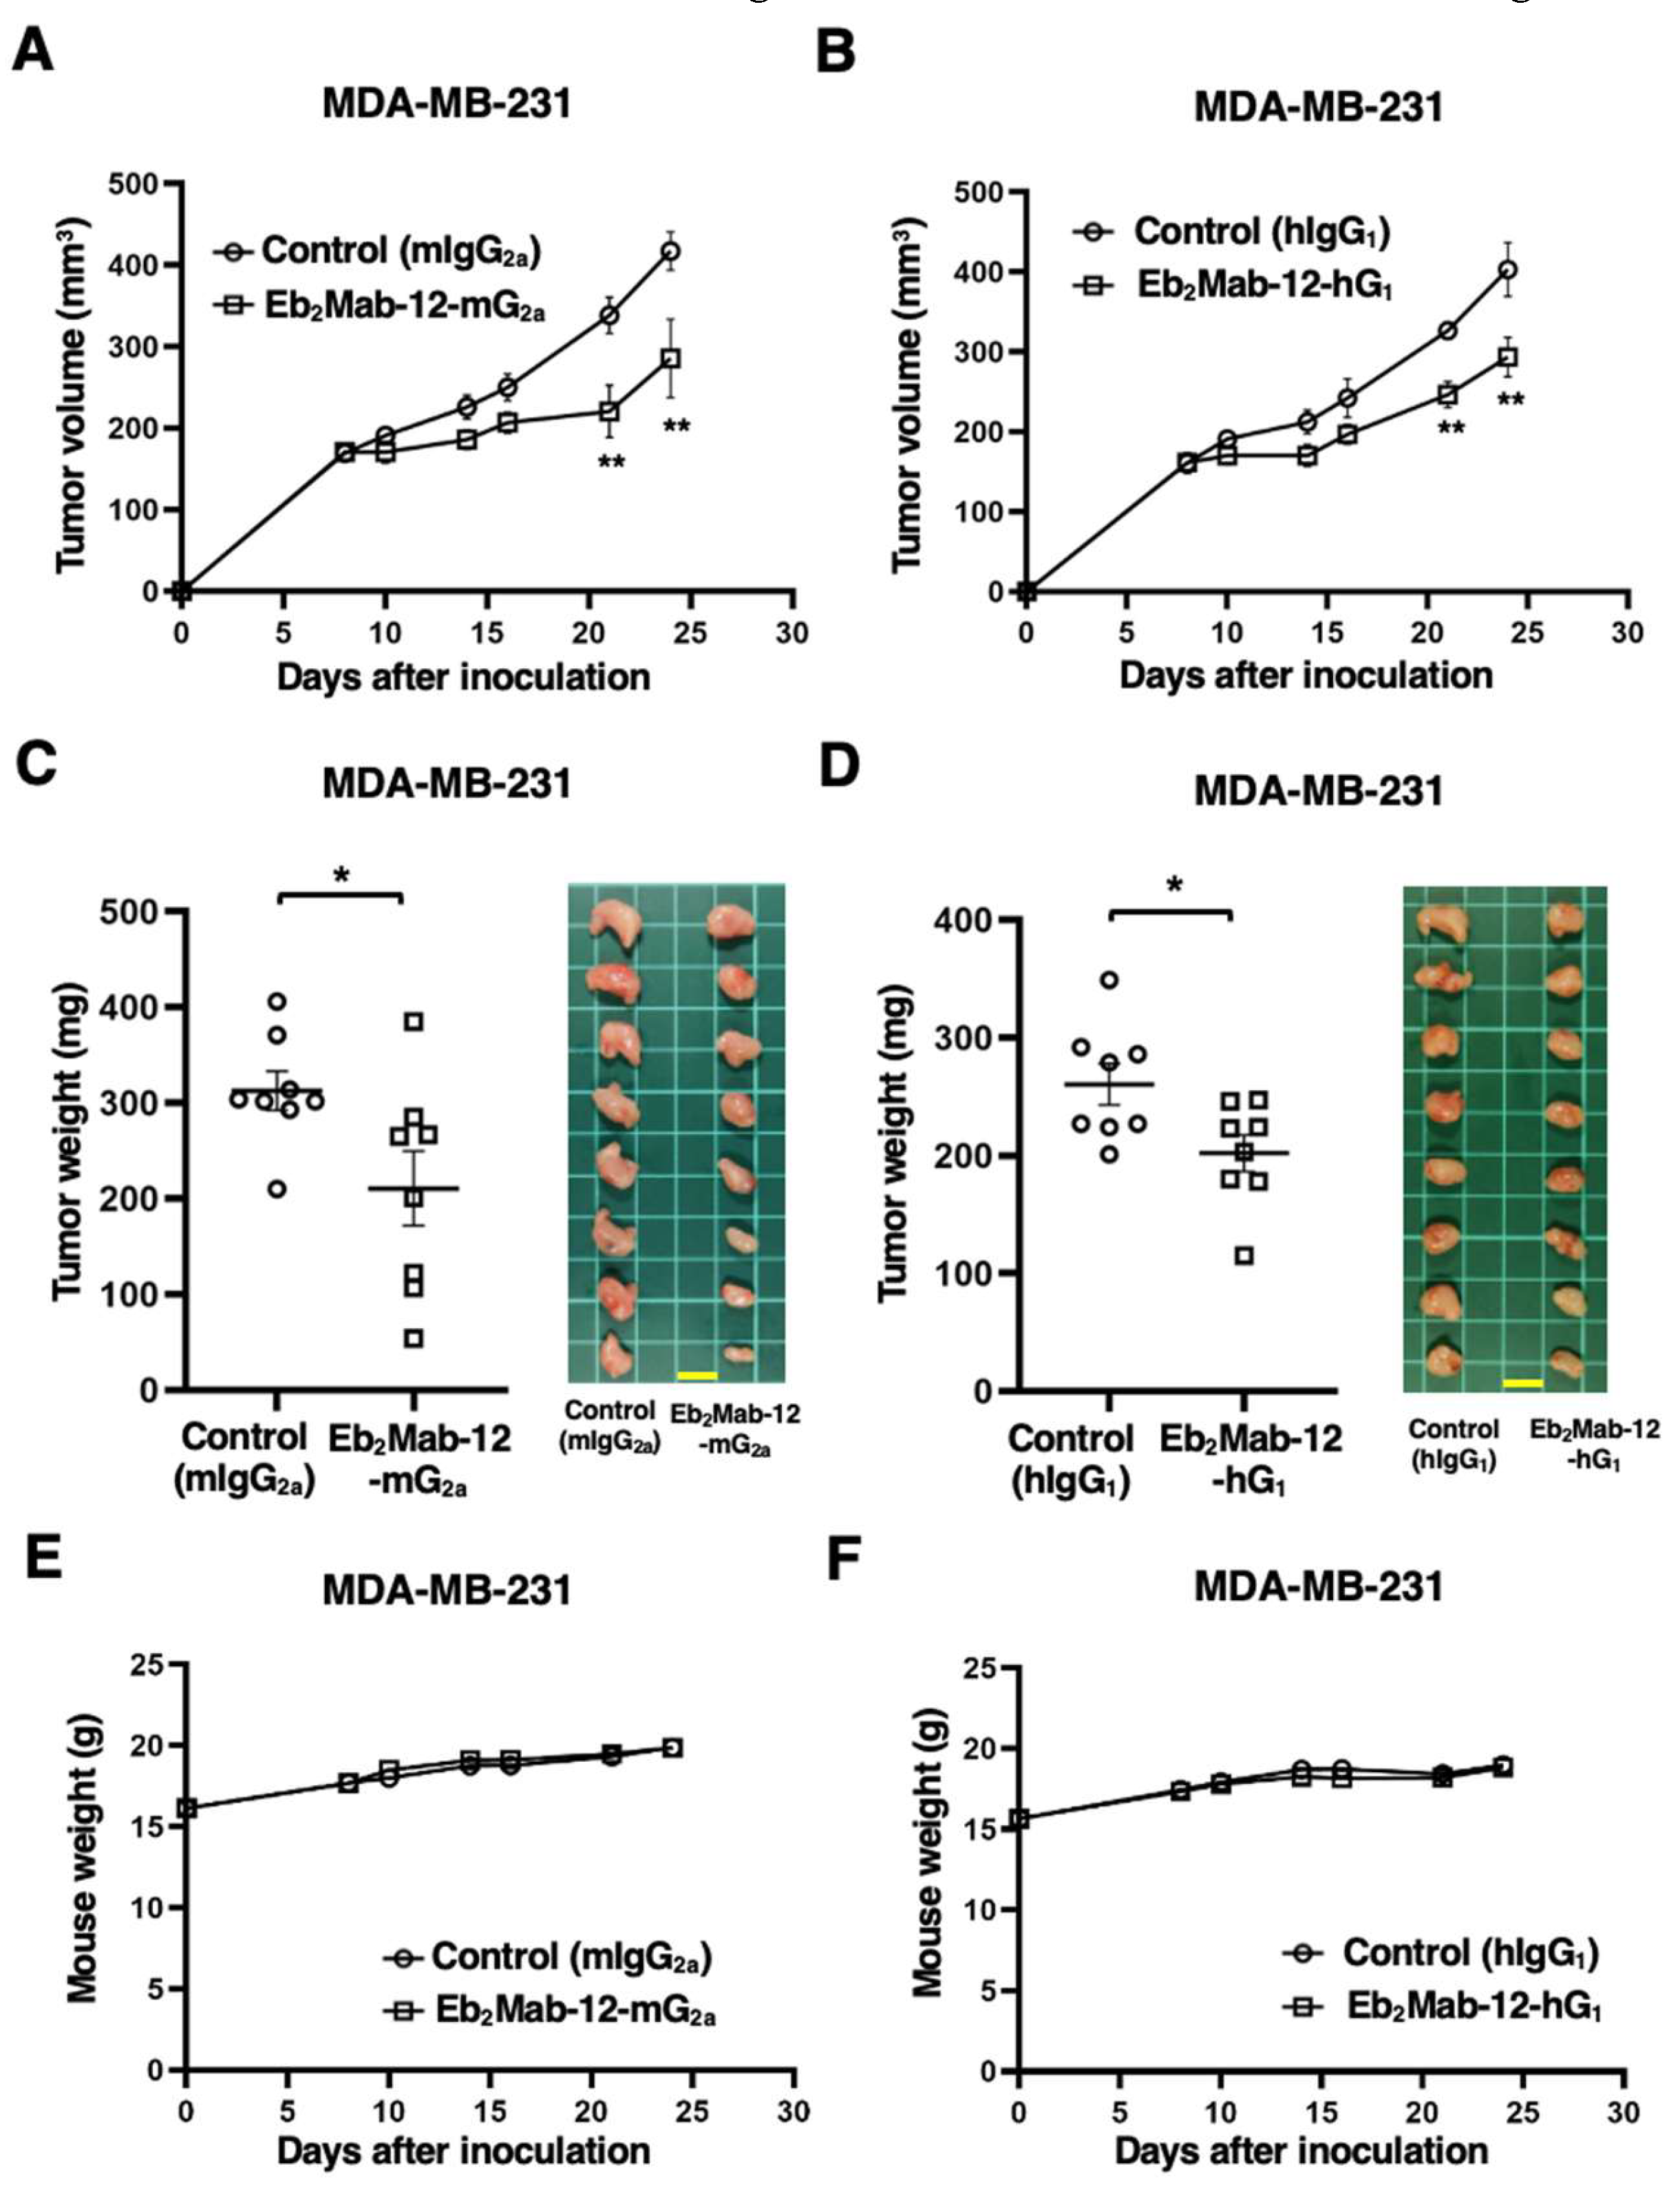
Figure 7.
Antitumor activity of Eb2Mab-12-mG2a and Eb2Mab-12-hG1 against NCI-H226 xenograft. NCI-H226 were subcutaneously injected into BALB/c nude mice (day 0). (A) In total, 100 μg of Eb2Mab-12-mG2a or control mouse IgG2a (mIgG2a) were intraperitoneally injected into each mouse on day 7. Additional antibodies were injected on day 14. (B) In total, 100 μg of Eb2Mab-12-hG1 or control human IgG1 (hIgG1) were intraperitoneally injected into each mouse on day 8. Additional antibodies were injected on day 14. The tumor volume is represented as the mean ± SEM. ** p < 0.01 (ANOVA with Sidak’s multiple comparisons test). (C,D) The mice treated with above-mentioned mAbs were euthanized on day 21. The NCI-H226 xenograft weights were measured. Values are presented as the mean ± SEM. ** p < 0.01 (Two-tailed unpaired t test). (E,F) Body weights of NCI-H226 xenograft-bearing mice treated with above-mentioned mAbs. There is no statistical difference.
Disclaimer/Publisher’s Note: The statements, opinions and data contained in all publications are solely those of the individual author(s) and contributor(s) and not of MDPI and/or the editor(s). MDPI and/or the editor(s) disclaim responsibility for any injury to people or property resulting from any ideas, methods, instructions or products referred to in the content. |
© 2025 by the authors. Licensee MDPI, Basel, Switzerland. This article is an open access article distributed under the terms and conditions of the Creative Commons Attribution (CC BY) license (http://creativecommons.org/licenses/by/4.0/).
Copyright: This open access article is published under a Creative Commons CC BY 4.0 license, which permit the free download, distribution, and reuse, provided that the author and preprint are cited in any reuse.


