
Submitted:
30 July 2025
Posted:
31 July 2025
You are already at the latest version
Abstract
The bridge deck is more vulnerable to deterioration than other structural components due to its direct exposure to environmental factors such as vehicular loads, chloride ingress, and freeze–thaw cycles. This accelerated degradation often results in a serviceability life that is shorter than the intended design life. However, the absence of standardized condition assessment methods and clear definitions of residual service life has limited the establishment of rational guidelines for repair and strengthening. This study focuses on PSC-I type bridges in South Korea, utilizing long-term field inspection data to analyze environmental, structural, and material factors—including reinforcement corrosion, chloride diffusion, and freeze–thaw actions. Environmental zoning was applied based on regional conditions, while structural zoning was per-formed according to load characteristics, allowing classification of deck regions into moment zones and cantilever sections. Machine learning models were employed to identify dominant deterioration mechanisms, and the validity of the zoning classification was evaluated through model accuracy and SHAP value analysis. Additionally, a regression-based approach was proposed to estimate the residual service life of the bridge deck for each corrosion phase, providing a quantitative framework for durability assessment and maintenance planning.
Keywords:
data-driven
; bridge slab
; deterioration
; machine learning
; remaining service life
1. Introduction
The rapid aging of infrastructure systems has emerged as a critical issue worldwide, raising serious concerns both in terms of asset management and structural safety. Many reinforced concrete bridges, constructed during the 1970s and 1980s, are now reaching, or have exceeded, their intended design life. This is prompting growing attention to their structural durability and long-term maintenance needs. Of the various bridge components, the deck is particularly vulnerable to structural failure, given its direct exposure to various external factors such as vehicular loads, environmental conditions, and chloride ingress from de-icing agents. These factors significantly impact both maintenance costs and the structural integrity of the overall bridge system [1]. Maintenance expenditures tend to increase over time and are closely associated with performance degradation. While early-stage deterioration can often be mitigated through routine maintenance, neglect at this stage can lead to cumulative damage and eventually cause structural failure, resulting in substantial repair costs.
In fact, in South Korea, bridge A collapsed in 2023 due to the loss of bond between cantilever tensile reinforcement and the concrete. The deterioration, prior to collapse, was triggered by the penetration of moisture and aggressive agents through cracks at the end of the anchorage bars. In another case, bridge B in Korea suffered a partial collapse in 2018. In this case, extreme heat caused asphalt cracking, which subsequently led to structural failure in the cantilever section. Similarly, bridge C in Taiwan experienced the sudden collapse of its central arch span in 2019. This collapse was attributed to a combination of cable corrosion due to marine climate exposure, extreme loads, and fatigue failure. These cases, in bridges with service lives ranging from 21 to 30 years, highlight the urgent need for deterioration and environment-sensitive maintenance strategies for aging bridge infrastructure.
The typical deterioration process of concrete bridge decks is illustrated in Figure 1, where the initial stage of degradation is generally characterized by the formation of cracks. Cracking in bridge deck concrete can be caused by various factors, including stress due to loading, spontaneous or shrinkage-induced cracking, freeze–thaw cycles, and alkali–silica reaction (ASR), each of which generates distinct crack patterns. In general, cracks caused by loading are not considered critical unless there are design deficiencies. However, if early-stage cracking reduces the structural stiffness below the design threshold, applied loads may accelerate the propagation of these cracks. Under repeated live loads—such as those from heavy vehicles—unidirectional cracks may gradually propagate and evolve into map cracking patterns [2]. Surface efflorescence may occur as a result of moisture ingress into cracks and friction among the internal aggregates of the concrete. This indicates the development of an internal environment conducive to reinforcement corrosion. This is particularly the case in regions where de-icing agents are applied or where structures are exposed to marine environments. In such circumstances chloride ions can infiltrate the concrete and significantly accelerate the corrosion of embedded steel reinforcement [3].
Meanwhile, carbonation involves the diffusion of atmospheric carbon dioxide into the concrete. This results in a lowering of the pH of the pore solution, which in turn creates conditions that promote corrosion of the reinforcement. This corrosion reduces the cross-sectional area of the steel, leading to a decline in the ultimate strength and ductility of the structure. In addition, corrosion products weaken the bond between the steel and concrete, thereby degrading the structural integrity of reinforced concrete. Furthermore, the expansive pressure of corrosion products serves to induce additional cracking in the concrete, which eventually results in cover delamination and spalling. Consequently, this reinforcement corrosion significantly diminishes the load-carrying capacity of the deck, negatively affecting both its serviceability and structural safety.
The primary factors contributing to the deterioration of bridge decks can be classified into external and internal parameters. External parameters include traffic loading, environmental conditions, and service life. Meanwhile, internal parameters include concrete strength, reinforcement detailing, and deck thickness. All of these are known to accelerate the deterioration process [4]. In particular, repeated wheel loads induce microcracking at the center of the slab. As the number of load cycles increases, these cracks propagate and may ultimately lead to punching shear failure [5]. Moreover, previous studies have reported that for every increase in daily axle count, the deck lifespan is shortened by approximately 1.2 years. This finding highlights the significant impact of single and tandem axle loads, as well as the frequency of overloaded vehicles, on deck deterioration, necessitating that these variables must be carefully considered in the development of service life prediction models [6]. The deterioration of bridge decks cannot be sufficiently explained using condition information from a single point in time. Instead, it is significantly influenced by the cumulative effects of environmental exposure and structural fatigue accumulated over years of service. This indicates that deterioration processes exhibit time-dependent, sequential characteristics. Therefore, rather than relying on conventional models based on single timepoint data, it is necessary to adopt time-series-based models that can capture the continuous evolution of deck condition over time. Therefore this study targets 52 PSC-I type bridges that possess at least three consecutive rounds of detailed inspection data. The PSC-I bridge type refers to multi-girder bridges constructed with prestressed concrete (PSC) girders featuring an I-shaped cross-section. The girders are typically spaced approximately 1.5 to 2.5 meters apart, and this configuration has been widely adopted as a standard design for small- to medium-span bridges. For each bridge, a comprehensive dataset was collected and analyzed, including deck deterioration states, structural characteristics, chloride content, precipitation levels, regional freeze–thaw cycles, and annual traffic volume by route. Based on this data, the bridge decks were zoned according to load characteristics—namely, dead and live load effects—into regions such as positive moment zones, negative moment zones, alternating load zones, and cantilever sections. The deterioration characteristics of each zone were then analyzed using Machine learning(ML) based classification models. Feature importance analysis was conducted to validate the rationality of the damage zoning, and for cantilever and moment regions, with AutoML and Gaussian process regression (GPR) being utilized to predict the remaining service life. These findings emphasize the necessity of establishing refined and zone-specific maintenance strategies that consider the heterogeneous deterioration mechanisms across different deck regions when formulating bridge maintenance policies.
2. Literature Review
2.1. National Frameworks for Assessing Bridge Deck Deterioration
The bridge deck condition rating systems in South Korea (Table 1), India (Table 2), and the United States (Table 3) adopt different structural evaluation criteria, reflecting variations in how the severity of deterioration is interpreted and represented [7,8,9]. South Korea emphasizes the importance of structural components and the need for maintenance by assigning condition grades to individual spans, which are then aggregated to determine the overall bridge rating. India focuses on a more detailed classification of damage types, while the United States employs a quantitatively driven condition assessment framework centered on structural safety.
In South Korea’s condition rating system, a grade D indicates a condition that poses a serious threat to bridge safety, while grade E represents the end of the service life, signifying that the structure is no longer usable. India’s Urban Bridge Management System (UBMS) classifies deck conditions such that Grade 4 indicates the onset of spalling, Grade 3 refers to damage affecting structural stability, and Grade 1 corresponds to severe dam-age to major structural components. Grade 0 denotes a complete loss of structural function and termination of service. In the United States, the Condition Rating system defines Grade 3 as indicating severe structural deterioration, Grade 2 as requiring immediate re-pair, and Grade 1 as a near-collapse state necessitating urgent intervention. Similar to In-dia, Grade 0 represents total loss of structural functionality and closure of the facility.
These differences reflect how each country interprets structural deterioration from distinct perspectives. However, most condition rating systems are based on qualitative assessments at specific points in time, which fail to adequately account for the time-dependent progression and cumulative effects of deterioration. Furthermore, the lack of clearly defined quantitative thresholds between grades combined with the potential for subjective interpretation by evaluators pose challenges to ensuring consistency and reliability in assessments. For accurate remaining life prediction and proactive maintenance planning, it is essential to establish a more quantitative and forward-looking evaluation framework.
2.2. Concrete Bridge Deck Damage Mechanism
2.2.1. Corrosion Initiation Due to Chloride Ingress and Carbonation
Bridge decks are typically exposed to a variety of external environmental conditions over long periods, resulting in the simultaneous action of multiple deterioration mechanisms. In particular, bridge decks located near coastal areas are directly affected by marine-specific exposure zones such as the splash zone and the tidal zone. For example, in the splash zone, seawater repeatedly splashes onto the concrete surface due to wind and waves, even in the absence of direct submersion. This leads to the accumulation of salts on the surface, which when sufficient oxygen is present, becomes a major cause of reinforcement corrosion[13]. The tidal zone, characterized by cyclic wetting and drying due to tidal fluctuations, promotes active chloride ingress into the concrete[14]. Time-dependent surface chloride models have been proposed to account for these conditions. However, most of these models assume static and homogeneous exposure conditions, making it difficult to accurately describe the complex deterioration behavior resulting from actual climate, rainfall, wind direction, and temperature variations.
Against this backdrop, previous studies on the deterioration prediction of bridge decks have primarily focused on individual mechanisms in isolation, such as chloride ion diffusion, carbonation, freeze–thaw cycles, and fatigue damage caused by repeated loading, using theoretical modeling or experimental analysis. For instance, the assessment of concrete cover thickness and carbonation depth has been commonly applied to predict deck service life using Fick’s Second Law of Diffusion or empirical linear regression models. In the case of chloride ingress, analyses typically adopt effective diffusion coefficients and threshold concentrations based on standards such as NT Build 443[2,10,11]. Furthermore, the time from the initiation of reinforcement corrosion to the occurrence of cracking has been estimated using empirical equations that consider rust formation and cover conditions[12]. However, these conventional models face limitations in capturing the complexity, irregularity, and heterogeneous exposure conditions of real-world service environments. To achieve more accurate and effective predictions, a data-driven approach that integrates various environmental conditions and structural characteristics is required.
where,
Cd = Design chloride concentration at depth x and time t
Ci = Initial chloride concentration (maximum value)
Cs = Surface chloride concentration determined from measurements
Erf = Error function (
Dd = Effective diffusion coefficient of chloride ions
x = Concrete cover depth to reinforcing steel
t = service years
where,
Tcr = Time to crack initiation
Wcrit = Critical mass of corrosion products
The critical mass of corrosion products was calculated using Equation (3).
where,
ρrust = Density of corrosion products
ρsteel = Density of steel
α = Ratio of molecular weight between steel and corrosion products
D = Diameter of the reinforcing bar
Cs = Chloride concentration measured at the concrete surface
c = Thickness of the concrete cover
ft = Tensile strength of concrete
E = Elastic modulus of concrete
a = Distance from the center of the reinforcing bar to the boundary of the void region between the rebar and the concrete
b = Distance from the center of the reinforcing bar to the concrete surface
υc = Poisson’s ratio of concrete at the service limit state
d0 = Thickness of the porous zone
2.2.2. Machine Learning-Based Studies on Bridge Deck Deterioration
Kwon, T-H et al. proposed a Long Short-Term Memory (LSTM)-based model to predict carbonation depth by integrating bridge inspection reports with regional environmental data. The model was structured by inputting deterioration information and environmental variables extracted from the reports into the LSTM network. Application to three regions in South Korea demonstrated that the model achieved higher predictive accuracy (R²) than conventional regression models [15]. Similarly, Liu et al. developed a hybrid BP-LSTM model using data from bridge health monitoring systems. This approach captured the complex interactions among structural, environmental, and temporal features and outperformed standalone neural networks in terms of predictive performance [16]. Jeon, C-H. et al. trained a time series-based model, using historical deterioration data, in order to forecast condition changes. The Health Index (HI) which resulted from this model was then used to support maintenance decision-making. However, all of these studies faced limitations regarding data availability and quality, expert subjectivity, and insufficient case diversity, which constrain the generalizability and long-term predictive capability of their models [17].
In attempt to overcome these limitations, recent research has increasingly employed machine learning (ML) techniques that utilize long-term inspection and environmental data. ML models, which can learn nonlinear interactions between structural and environmental factors, have shown effectiveness in predicting the deterioration status of bridge decks. Algorithms such as Gradient Boosting, Random Forest, and Artificial Neural Networks have been used to predict condition ratings and classify degradation stages with improved accuracy. Some studies have demonstrated that incorporating multivariate input data significantly enhances prediction performance over traditional methods [18]. For example, Rashidi Nasab and El-Zarka (2023) applied Xgboost, Random forest, and SVM models to predict bridge deck condition ratings using data from Ohio, USA. Their ensemble model combining Xgboost and Random forest achieved a high performance with an AUC-PR exceeding 0.92 [19]. Likewise, Fariba Fard et al. combined U.S. NBI data with climate and traffic information and compared the performance of Random Forest, Xgboost, and ANN models. Of these, Random forest, with five-year accumulated data input,1 showed the best performance, achieving an accuracy of 83.4% and an F1-score of 79.7%. These results indicate that long-term cumulative data significantly contribute to improving deterioration prediction precision.
In recent years, deep learning–based approaches have been actively applied to large-scale bridge assessments, particularly in tasks involving automated defect detection. For instance, Ruggieri et al. proposed a model that effectively captures the nonlinear stress–strain behavior of concrete under compressive loading, providing reliable damage predictions without relying on traditional constitutive assumptions [20]. Additionally, Li et al. and Alessandro Nettis introduced a robust deep learning framework for identifying and clustering crack-related features using acoustic emission (AE) data, enabling the prediction of deterioration in prestressed and reinforced concrete structures subjected to complex loading scenarios [21,22]. Furthermore, Niu et al. developed a deep learning model capable of accurately predicting the plastic damage of concrete under compression, without depending on conventional constitutive modeling [23].
These studies collectively support the validity and effectiveness of the proposed approach in this study, which integrates Gaussian Process Regression (GPR) for remaining service life prediction and SHAP (SHapley Additive exPlanations) for model interpretation. SHAP has been widely adopted as a model-agnostic interpretability tool, as it enables quantitative analysis of how each input feature contributes to the prediction, while also providing visualizations of the relative importance and directional influence of each variable. [24]. In parallel, GPR, a probabilistic supervised learning technique, is well-suited for modeling complex physical phenomena such as structural deterioration, as it quantifies both the predicted values and their associated uncertainty through kernel-based similarity functions. This makes it especially advantageous in maintenance decision-making under uncertainty[25].
Nonetheless, most existing studies tend to treat the bridge deck as a single homogeneous component, failing to account for the spatial distribution of structural loads or varying environmental exposures across deck zones. Therefore, it is necessary to model the deck as a complex system with structural and environmental heterogeneity by incorporating spatial zoning or condition-based subdivision. This approach could enhance both the explanatory power and predictive accuracy of ML models and provide more practical insights for real world maintenance planning.
3. Methodology
3.1. Definition of Deterioration for Bridge Deck
The performance degradation of concrete bridge decks has both direct and indirect impacts on structural stability and service functionality. Therefore, establishing a quanti-tative evaluation framework is essential for developing long-term maintenance strategies. Structural performance is generally assessed along two axes, namely durability and serviceability. The first of these, durability, refers to the ability of a structure to maintain its material integrity and functional capacity over time, even under environmental exposure. It is typically evaluated based on the corrosion resistance of the reinforcing steel and the protective performance of the concrete cover. In contrast, serviceability refers to the condition in which the structure can be used without functional problems or discomfort during operation. It is assessed through observable or perceptible symptoms such as crack width, leakage, delamination or spalling, and deflection. Based on these concepts, this study introduces a dual classification system for assessing the deterioration state of concrete bridge decks: State levels (1–8), based on surface-visible damage, and Phase levels (1–3), based on the extent of internal reinforcement corrosion. These two indicators are integrated to systematically define the remaining serviceability life of the deck. The classification of deterioration stages in Figure 2 was developed with reference to the Tuutti chart(1982), a widely accepted conceptual model for reinforcement corrosion. In this study, the deck slabs were constructed using prestressed concrete girders with mild steel reinforcement in the slab. Each state level is defined based on visual inspection maps, focusing on observable signs such as crack width, crack pattern, corrosion stains, efflorescence, and spalling. The phase levels, on the other hand, represent the actual internal deterioration stages of the structure, categorized by the initiation and progression of reinforcement corrosion. This classification is summarized in Table 4 and Figure 2.
State 1 corresponds to the initial service condition, where crack widths are less than 0.1 mm. This typically caused by drying shrinkage or early-age shrinkage. This is considered a stable state with negligible impact on both durability and serviceability.
State 2 is defined by crack widths ranging from 0.1 mm to 0.3 mm, where existing cracks may propagate or new cracks may develop due to environmental exposure. In this state, functional serviceability is maintained, but there is a potential risk of durability degradation. State 3 is characterized by intersecting longitudinal and transverse cracks that evolve into map cracking, or by the termination of crack stabilization patterns. Surface damage becomes evident, and physical pathways for the ingress of aggressive agents begin to form. State 4 involves the appearance of efflorescence around cracks, indicating active moisture ingress and chemical reactions, and is interpreted as an early sign of durability degradation. These State levels, 1-4, occur prior to the onset of steel reinforcement corrosion and are collectively classified as phase 1, representing the early-stage deterioration phase focused on surface cracking. During this phase, durability and serviceability are generally maintained, but the potential for corrosion initiation necessitates preventive maintenance. State 5 corresponds to the condition in which a corrosive environment has developed, either due to chloride concentrations exceeding 0.3% or carbonation depth surpassing the concrete cover thickness. State 6 indicates the onset of visible steel corrosion, where rust stains or discoloration are observable. At this stage, repropagation of cracks and bond degradation begin to reduce both durability and serviceability. These two states are classified as phase 2 (corrosion initiation phase), representing a transitional stage in which physical deterioration becomes significant and functional abnormalities begin to appear. Maintenance and performance rehabilitation are typically required.
State 7 is characterized by delamination of the concrete cover due to the expansive pressure of corrosion products. State 8 refers to a condition in which spalling has oc-curred, exposing the reinforcing steel or indicating that corrosion has progressed to a structurally critical level. These two states represent the final deterioration stage in which durability has severely declined and serviceability is completely lost. Stage 7 and Stage 8 are classified as Phase 3 (end-of-serviceability phase). At this stage, the structure is generally considered to have reached the end of its functional service life, and urgent repair or complete re-placement is required. By integrating this dual state–phase classification system from the perspectives of durability and serviceability, the deterioration condition of concrete bridge decks can be interpreted not simply as a surface rating, but as a progressive accumulation of material and structural damage. This approach overcomes the limitations of traditional qualitative assessment methods and provides a critical basis for quantitative service life prediction and maintenance timing by accounting for both internal and external deterioration processes.
3.2. Data Zoninig
3.2.1. Zoning for Dataset
The deterioration of bridge decks is influenced not only by structural factors but also significantly by regional environmental conditions. Due to its geographical location, South Korea experiences four distinct seasons with considerable monthly temperature variation. In addition, temperature distribution, precipitation, and snowfall levels vary greatly across regions. As a peninsula, the country is also heavily affected by a maritime climate. Moreover, due to the industrial structure and export-oriented economy, heavy vehicle traffic is concentrated along routes that connect coastal ports with inland indus-trial complexes. This logistics pattern results in significant regional variations in the volume and frequency of heavy axle loads. Consequently, even for bridge decks with iden-tical structural designs and similar service years, deterioration levels and the timing of serviceability loss may differ depending on the surrounding environmental and traffic conditions. Therefore, when defining the service life of bridge decks, it is essential to con-sider the influence of these region-specific and route-specific factors. This highlights the need for a systematic framework for collecting and managing deterioration-related data, tailored to the agency responsible for infrastructure maintenance and data governance.
In South Korea, data on precipitation, snowfall, and temperature are systematically collected and managed at the levels of province, city, county, and district, as illustrated in Figure 3a. Road infrastructure is categorized by administrative hierarchy into ex-press-ways, national routes, provincial routes, municipal roads, rural roads, boulevards, and local roads. Additionally, bridges are classified into Types 1 to 3 based on their length, and management responsibilities are assigned accordingly to the appropriate authorities. A simplified schematic of the road classification system is presented in Figure 3b. How-ever, data obtained directly from bridge inspections are often irregular in terms of collec-tion timing and spatial position, which poses challenges for systematic organization. To address this, long-term bridge data have been continuously collected by ad-ministrative units at the provincial and municipal levels for several decades, and are used within the national bridge maintenance system for evaluation and management. In this study, the analysis utilizes data structured according to the regional zoning system shown in Figure 3c, incorporating spatial zoning of bridge-related data obtained through field inspection.
3.2.2. Zoning for Load Conditions in the Bridge Span
The bending behavior of bridge decks varies depending on whether the bridge is continuous or simply supported, resulting in different moment distributions. In particular, in negative moment zones above the substructure, tensile stress occurs on the top surface of the deck, leading to the formation of flexural cracks. These top-surface cracks are highly likely to propagate through to the bottom surface over time, allowing rainwater and chlorides to penetrate the cracks and thereby increasing the potential for deterioration. During visual inspections of the top surface, Ground penetrating radar(GPR_scan) is commonly used to assess damage conditions within the deck slab beneath the pavement. However, it is difficult to accurately inspect cantilever sections using GPR_scan, making it challenging to obtain high-quality data in those areas. Therefore, in this study, cracks observed from the bottom surface of the deck—representing early stages of deterioration—were assumed to have penetrated from the top to the bottom surface, and data collection was conducted based on this assumption.
In addition, due to the application of horizontal curvature and cross slopes for drainage, snow, rainwater, de-icing agents, and other debris tend to accumulate near the drainage areas located on the cantilever section. As a result, the chloride concentration in the cantilever zones typically appears higher than in the central deck areas. This leads to a different deterioration progression pattern in the cantilever compared to areas subjected to regular live loads. Considering these characteristics, this study separately classified the cantilever zone for data collection. During the data collection process, the bridge deck was divided into zones based on the static loads (such as self-weight) that generate positive moment zones, negative moment zones, and alternating load zones. Taking into account the live loads and their positions, the area above the girders, where vehicles travel, was defined as the moment zone, while the outer edge near the barrier was defined as the cantilever zone. The deterioration data used in this study were based on visual inspections of the underside concrete surfaces of bridge decks, conducted in accordance with the Korean Bridge Safety Inspection Guidelines. The study targeted continuous bridges, and for localized analysis, each deck was divided into five zones (Zone A–E), as illustrated in Figure 4 and Table 5.
Zone A corresponds to the cantilever negative moment region, where material deterioration—such as chloride ingress, carbonation, and freeze–thaw damage—is expected to progress rapidly. In addition, structural influences from the adjacent negative moment region (Zone B) are presumed to act in combination. Zone B represents the typical negative moment zone, where repetitive live loads frequently induce cracks on the upper surface of the deck. These cracks are likely to penetrate to the bottom, leading to localized rebar corrosion and spalling damage. Zone C is the alternating moment region, where positive and negative moments alternate due to moving live loads. It is defined as a transition zone that simultaneously exhibits the characteristics of both positive and negative moment regions. Zone D refers to the cantilever area within the positive moment zone.
Although it shares similar environmental exposure with Zone A, it exhibits different structural behavior and is therefore defined as a separate zone. It covers the largest surface area among all defined zones. Zone E is the positive moment zone located at the central span of the bridge. Data from the end portions of the deck where expansion joints are located were excluded from the scope of this study.
3.3. Machine Leaning Model
In this study, Pycaret, a python-based Auto machine learning (AutoML) library, was adopted to automate and optimize the construction of machine learning models. The analysis focused on decision tree-based algorithms supported by Pycaret, particularly those algorithms having strong capabilities in handling nonlinear characteristics and variable interactions. Tree-based models are structurally intuitive and offer flexibility for both classification and regression tasks. In these models, internal nodes represent variables, while branches denote decision rules, with terminal nodes indicating predicted outcomes; the splitting criteria at each node are determined based on information gain or variance reduction.
Among the six tree-based models provided by Pycaret, performance comparison and analysis were conducted on the top five models, namely Catboost, Xgboost, Random forest, Lightgbm, and Extra trees, with the basic decision tree model being excluded. Additionally, to enhance prediction accuracy, a voting ensemble method was applied.
For the classification models, a multi-class classification approach was designed to predict the deterioration state grades of the bridge deck. The model performance was evaluated based on accuracy, area under the ROC curve (AUC), and recall metrics.
where,
TP: Number of positive samples correctly predicted
TN: Number of negative samples correctly predicted
FP: Number of negative samples incorrectly predicted as positive
FN: Number of positive samples incorrectly predicted as negative
The performance of the regression models was evaluated using metrics such as mean absolute error (MAE), mean squared error (MSE), root mean squared error (RMSE) and the coefficient of determination (R²).
where,
: Actual observed value
: Predicted value
n : Number of data points
Due to the inherent limitations of bridge inspection data, such as bias and data quality issues, this study also employed the gaussian process regression (GPR) model, which enables probabilistic expression of prediction uncertainty. GPR demonstrates strong predictive performance, even with small datasets, and provides not only predicted values but also confidence intervals. These characteristics make it well-suited for applications that require uncertainty quantification. In addition, its flexibility in kernel selection allows for model customization based on the characteristics of the data, making GPR particularly appropriate for analyzing the remaining service life of bridge decks using the collected data.
3.4. Feature Importance (SHAP - SHapley Additive exPlanations)
The SHAP model explains how each variable contributes to the predictions made by a machine learning (ML) model. It evaluates the importance of each feature individually and, based on the principles of shapley values, accounts for interactions among features. As a result, it not only ranks the contribution of features but also indicates whether their impact on the target variable is positive or negative. SHAP enhances the interpretability of black-box ML models and provides a comprehensive overview of feature importance across the entire dataset. This helps in understanding the model’s behavior and serves as a key tool for implementing explainable AI.
where,
| = | The Shapley value for the "I" feature data | |
| = | The entire set | |
| = | All subsets of the entire set with the i-th data removed | |
| = | The overall contribution, including the i-th data | |
| = | The contribution of the remaining subset without the i-th data |
4. Data Collection for Machine Learning
4.1. Data Composition
Bridge decks are influenced by a wide range of factors from the design stage through to the service period. These include not only the type of superstructure but also, in the case of girder bridges, the number and spacing of girders, pavement type, initial quality control during concrete curing for cast-in-place decks, the detailed placement of reinforcement, and the thickness of the concrete cover. While various factors must be simultaneously considered to define the service life of the deck, two major challenges arise. The first of these is the difficulty in securing high-quality data, with the second concerning the reliability of the data obtained. Therefore, the following assumptions were made to facilitate the progress of this study.
- The occurrence time of deterioration visible in the visual inspection map is defined as the inspection year recorded in the map.
- Initial transverse cracks in the deck are assumed to occur at the time of bridge completion.
- The progression from map cracking to efflorescence is assumed to result from water penetration through full-depth cracks from the surface, which initiates corrosion of the internal reinforcement and gradually accelerates its spread.
- Since the characteristics of deck data extracted from bridges vary depending on location, the deck is divided into five zones according to load characteristics. Each zone is assumed to have uniform loading and environmental conditions.
- The onset of delamination and spalling is assumed to coincide with the initiation of surface cracking caused by corrosion-induced expansion of reinforcement.
- Initial material defects in concrete are assumed to be absent, and the compressive strength is taken as the design strength.
- Chemical data obtained from the deck are represented by the median value of the dataset, regardless of the sampling location.
- Although negative moments may also occur in the direction perpendicular to the bridge axis, this study considers only the longitudinal (bridge axis) moment.
In addition, considering that deterioration levels may vary across zones due to differences in inspection accessibility and environmental conditions, the following data preprocessing procedures were implemented to ensure consistency and reliability of the dataset:.
- Only zones with three or more consecutive inspection records were included in the analysis, while zones with insufficient data were excluded.
- Time-series records showing abnormal reversals or improvements in deterioration states (e.g., from State 5 to State 2) were deemed logically inconsistent and removed.
- To prevent distortion of deterioration trends and maintain the predictive accuracy of the model, no interpolation was applied to missing segments in the time series.
4.2. Bridge Structural Information
In the quantitative analysis for bridge maintenance and performance prediction, the accurate acquisition of structural information defined at the initial design stage is essential. The collected data includes general specifications such as bridge type, administrative location, design live load classification, and associated road route name. Additionally, structural geometry information, such as span configuration and length, girder spacing and number, deck dimensions, and concrete strength, is considered, as these parameters are directly utilized in bridge design.
Bridge deck parameters, such as width, thickness, and the type and thickness of the upper pavement, are key design variables that directly influence the progression of deterioration. These parameters serve as fundamental data for establishing deterioration prediction models and conducting factor analyses. For deck thickness, where available, the values from design drawings were used directly. For bridges lacking this information, representative values were applied based on the year of completion. Specifically, bridges completed before 1996 were typically assigned a thickness of 180 mm, which was the standard at the time. For bridges constructed after 1996, the deck thickness was set to either 200 mm or 250 mm, based on prevailing design standards and common construction practices during that period. This correction approach helps maintain consistency across the dataset and provides reliable substitute values for missing entries, thereby enhancing the overall stability and prediction accuracy of the deterioration models. Such design information is defined as a key input variable in the development of machine learning-based service life prediction models for bridge decks, where it contributes to improved accuracy in deterioration pattern analysis and performance forecasting. Therefore, the acquisition and refinement of structural design data can be regarded as a critical element that provides a quantitative foundation throughout the entire decision-making process for maintenance planning.
4.3. Deterioration Data on the Bridge Inspection Map
The differences in environmental and structural characteristics across damage zones of the bridge deck can be identified through the visual inspection mapping results presented in Figure 5. Figure 5a illustrates a case from the negative moment region of a PSC-I girder bridge that has been in service for 41 years and corresponds to Zone B as defined in this study. In the 2010 inspection, State 2 (initial cracking) was observed for the first time. By 2014, the spread of cracks was confirmed, and in 2019, State 4 (efflorescence) appeared, suggesting active ingress of external moisture. The 2023 inspection revealed that the cracks had progressed from State 2 to State 3 (map cracking), clearly indicating ongoing deterioration across the entire deck.
In contrast, the red line in Figure 5b indicates the cantilever region (Zone D) of a PSC-I girder bridge that has been in service for 38 years. During the 2013 inspection, State 2 (initial cracking) was first identified on the left cantilever. In the 2015 inspection, widespread efflorescence, delamination, and spalling were observed throughout the same area. On the right cantilever, localized rebar exposure and spalling were also found. Unlike the gradual and progressive deterioration observed in the moment region, the cantilever region exhibited sudden and severe damage corresponding to States 7 and 8, occurring without prior warning signs. This highlights a clear distinction in deterioration behavior due to the differing structural and environmental characteristics of the zones.
To systematically quantify the deterioration progression, only the most severe state observed in each year and damage zone was recorded. For example, if States 4, 7, and 8 were all identified in the cantilever region during the 2015 inspection, only the most advanced state, State 8, was included in the dataset. This approach was adopted to prevent redundancy and to consistently track the deterioration over time.
The progression patterns analyzed in this manner demonstrate that bridge deck deterioration does not follow a simple linear timeline. Rather, it evolves nonlinearly depending on the structural and environmental conditions of each damage zone. In particular, an accelerated phase of deterioration was observed, during which damage rapidly spread across all zones after a certain point. This finding underscores the importance of early intervention to ensure the serviceability and durability of the structure.
4.4. Environmental Data(Accumalted Data over Time)
During the service life of a bridge, it is continuously subjected to live loads and various environmental factors. These influences accumulate over time and, as their magnitudes increase, they begin to significantly affect the structural performance. Variables exhibiting such characteristics are defined as key factors that directly influence the deterioration of concrete bridge decks. In this study, five such variables were identified: Traffic volume, Precipitation, Chloride contents, Carbonation, and Freeze–thaw cycles. Since the values of these variables vary, depending on region or route, the corresponding data were derived from regional field measurements or statistical datasets. Time-dependent trends for each variable were incorporated to reflect their cumulative effects on deterioration over time.
4.4.1. Traffic Volume
The analysis was conducted by classifying the roads on which bridges are located into four categories: Highway, Expressway, National road, and Provincial road. This classification was necessary because the institutions responsible for managing and collecting data differ by road type, and in many cases, data is not collected for national or provincial roads. Furthermore, differences in traffic volume, heavy vehicle ratio, travel speed, and frequency of vehicular loads according to road type lead to variations in cumulative loading conditions imposed on bridge decks. In particular, arterial roads such as expressways typically exhibit high daily traffic volumes and a greater proportion of heavy vehicles, whereas local roads have relatively low traffic volumes and irregular loading conditions. These traffic characteristics, differing according to road type, can significantly influence the rate and pattern of bridge deck deterioration. Therefore, to reflect the varying load environments across segments, the road classification standard was applied during the development of the service life prediction model.
To quantitatively analyze the impact of heavy vehicle traffic volume on the deterioration of the bridge decks under study, open data from the Traffic Volume Information System (www.road.re.kr) was utilized [22]. This system is a public data platform operated by the national road authority. Since 2014, it has provided detailed traffic information for each road segment based on data collected from automatic traffic counting stations. The data include vehicle classifications (Types 1–12), traffic direction, and daily and annual traffic volumes. Observation points are generally installed at intervals of several kilometers. For each bridge included in this study, traffic volume data were extracted from the observation point closest to the bridge. Using this data, the annual total traffic volume and heavy vehicle traffic volume from 2014 to 2023 were extracted and served as foundational input for analyzing load conditions by damage zone and predicting deterioration rates. In this study, heavy vehicles were defined as vehicle types ranging from Type 5 to Type 12 among the twelve categories specified in the “Road Traffic Survey Guidelines” by the Ministry of Land, Infrastructure and Transport (MOLIT), as these vehicle types are considered to have significant structural impacts based on pavement design standards. Figure 6 presents representative images and axle configurations for each vehicle type. For simplification and consistency in analysis, it was assumed that all vehicles exert identical and repeated unit loads on the structure.
For some bridges constructed prior to the 1980s, historical heavy vehicle traffic data were not available, making it impossible to directly obtain annual traffic volumes for those periods. Therefore, based on the observed data from 2014 to 2023, the slope of the annual growth trend was derived using linear regression, and this slope was then applied in reverse to interpolate estimated values for the years 1980 to 2013. This conservative interpolation approach reasonably reflects the cumulative impact of heavy vehicle loads on aging bridges by incorporating the trend of increasing traffic volume.
4.4.2. Precipitation
This dataset was organized based on the service life of each target bridge, with the cumulative precipitation distribution over the operational period being analyzed for each bridge model. To achieve this, data from the Korea Meteorological Administration's Open MET Data Portal [23] was utilized. Daily precipitation data were aggregated from the year of completion using the nearest weather observation station and corresponding road section as references. For bridges constructed prior to the 1980s, historical precipitation records were unavailable, making it difficult to directly obtain cumulative precipitation data for those periods. Therefore, based on observed data from 2014 to 2023, the slope of the annual precipitation trend was derived using linear regression, and this was used to extrapolate data backward from 1980 to 2013. This correction process aimed to supplement missing climate data and more accurately reflect environmental conditions over the entire service life.
Subsequently, three regression models, namely linear, exponential, and logarithmic, were applied to cumulative precipitation values by service year to compare their temporal distribution patterns. The analysis revealed a generally linear increase in most bridges; however, in some cases, non-linear logarithmic patterns were also observed. These findings suggest that cumulative precipitation does not increase strictly in proportion to time but can vary non-linearly depending on regional climate characteristics and seasonal factors.
4.4.3. Carbonation
Carbonation is one of the primary deterioration mechanisms that induces reinforcement corrosion and leads to the degradation of structural durability. The concrete cover plays a key role in delaying carbonation progression and is considered a critical factor for protecting reinforcement; therefore, it serves as an important parameter in predicting deterioration for service life assessment. For this study, the concrete cover thickness of the deck slab was primarily obtained from values recorded in inspection reports. In cases where such measurements were not available, design specifications were used as assumed values. If the first recorded inspection value exceeded the design value, that measurement was assumed to represent the as-built condition, and the minimum cover thickness was adopted.
For carbonation depth, inspection data presented in reports were used as a priority. Where direct measurements were not available, linear interpolation was applied using results from at least three precision safety inspections of the same bridge. If multiple values were reported, the maximum depth was used as a conservative estimate for maintenance and repair decisions. Carbonation depth was also surveyed by region, with the inspection data for each zone being quantitatively analyzed. The results showed that in most zones, the measured carbonation depth was less than the concrete cover, indicating that carbonation had not yet reached the reinforcement. This implies that the members were not currently at direct risk of steel corrosion due to carbonation. Particularly in cases where the cover thickness exceeded design standards or the measured values were sufficient, the likelihood of structural deterioration from carbonation was judged to be low. For this reason, this study considered carbonation to have a limited influence as a deterioration factor and excluded it from the set of key variables in the final predictive model.
4.4.4. Chloride Contents
The chloride content dataset used in this study was extracted from detailed safety inspection reports of 805 bridges located across five provinces in South Korea. However, since the data was collected from the underside of bridge decks at different locations and times, it does not represent a continuous dataset for a specific section. As a result, the chloride concentration exhibits irregular trends, with some sections showing high concentrations or non-increasing patterns over time. The regional distribution of chloride content is shown as blue dots in Figure 7, and the median value for each service year was used as the representative value. For sections where the chloride content decreases after an initial increase, the top three values in the corresponding year were averaged and used to replace the inconsistent data. Linear, logarithmic, and exponential interpolation models were applied to these segments, and the results are shown as light blue lines in Figure 7. For the early years of service where no measurements were available, an initial chloride content of 0.3 kg/m³ was assumed. The measured chloride concentrations represent the average values at a depth of 30–40 mm from the bottom surface of the deck, corresponding to the typical location of reinforcement, and were organized by service year range.
The chloride threshold for defining a deterioration limit state was set at concentrations exceeding 1.2 kg/m³. This threshold was based on the classification criteria presented in Table 6 of the Guidelines for the Safety and Maintenance of Infrastructure Facilities (MOLIT, 2021), where a chloride content above 1.2 kg/m³ corresponds to Class D or higher. This level is considered to approach or exceed the critical threshold for corrosion initiation in reinforcement and is therefore adopted in this study as the structural limit state. It also serves as a key reference point for maintenance decision making processes.
4.4.5. Freezing-Thaw
The number of freeze-thaw cycles was estimated based on data provided by the Korea Meteorological Administration’s open climate data portal [23]. For each bridge, daily temperature data over a 20-year period from the weather station nearest to the bridge location were used. To reflect regional temperature characteristics, one freeze-thaw cycle was defined as a day during which the temperature fell below 0°C and also rose above 0°C. Based on this criterion, the average annual number of freeze-thaw cycles was calculated for each region.
For some bridges constructed before the 1980s, historical freeze-thaw cycle data were unavailable, making it difficult to obtain yearly cumulative data for those periods. Therefore, linear regression was performed on the observed data from 2014 to 2023 to estimate the annual trend, with the resulting slope being used to interpolate freeze-thaw cycle data from 1980 to 2013 using a reverse estimation method. This approach enables the quantitative reflection of regional climate differences and allows the freeze-thaw cycle to serve as a more precise environmental variable in predicting bridge deck deterioration.
4.5. Dataset for ML

Table 7.
Definition of data for deteriorated slabs.
| Classification | Factor | Detail | Unit |
|---|---|---|---|
|
Basic Information |
Province and city | Do/ Si/ Gun | - |
| Number of bridge | Bridge Name (1 - 52) | - | |
| Girder type | PSC-I | - | |
| bridge line | Highway/Expressway/National road/Provincial road | - | |
| Operated years | - | yrs | |
|
Structural factors |
Span length | 25.0~35.0 | m |
| Girder spacing | 1.7~3.0 | m | |
| Number of girders | 3~25 | - | |
| Concrete strength | 24.0~27.0 | MPa | |
| Design load | DB18/DB24(Standard load for road bridge design (18 t/24 t)) | - | |
| Pavement type | Asphalt pavement | ||
| Pavement thickness | 50 - 80 | m | |
| Slab thickness | 180 – 250 | mm | |
| Mechanical factors | Total vehicle volume | Type 1~12 | - |
| Heavy vehicle traffic | Type 1~5 | - | |
|
Chemical factors |
Precipitation | Average annual precipitation per year | mm |
| Freezing thaw | Average number of freeze-thaw cycles per year | - | |
| Chloride contents | Annual De-icing chemicals application per km |
5. ML for Remaining Life of Bridge Deck
5.1. ML Classification
5.1.1. ML for Classification with all Integrated Data
The deterioration states (State) of bridge decks were predicted using classification models provided by Pycaret, based on the collected bridge deck data. A total of 1,244 data samples were used in training the model to classify States, with the classification pipeline being as illustrated in Figure 8. Of the 15 available variables, the target was set as the deterioration state, with the dataset being split into training and test sets according to an 8:2 ratio. During the splitting process, the stratify strategy was employed to maintain balanced distributions of each State across the training and test sets.
Of the various classification models applied, the five models that exhibited the highest performance, namely Gbc, Xgboost, Lightgbm, Catboost and Random forest(RF), underwent hyperparameter tuning. These tuned models were then combined, using a simple voting ensemble method, in order to evaluate the improvement in predictive accuracy.
Model performance was evaluated using three key metrics: Accuracy, AUC and Recall. The individual models showed moderate predictive performance with Accuracy and Recall around 0.57 and AUC values near 0.83. However, the ensemble model constructed
through simple voting achieved significantly improved performance: an Accuracy of 0.7, AUC of 0.9, and Recall of 0.7. These enhancements, approximately 15–20 percentage points higher than those of single models, indicate that the ensemble model possesses superior classification capability, enabling more accurate distinction between deterioration stages and fewer missed actual damage cases.
Furthermore, SHAP analysis was conducted to identify the key features influencing each model’s predictions, with the results shown in Figure 9. A class transformation was applied to the target variable: due to the absence of data for State 5, the six remaining States (State 2 to State 7, excluding State 5) were recoded into Class 0 to Class 5 for model training.
Across the top-performing models, the most influential features consistently identified were “Operated year,” “Zone D,” “Chloride contents,” and “Freeze thaw.” Meanwhile, in certain models, additional variables such as traffic volume, carbonation depth, and deck thickness also showed considerable influence. Among the damage zone variables, the dominance of zone D is reasonable given the larger volume of data associated with that zone. However, the fact that zone-related variables significantly affect the overall model outcomes indicates that deterioration stage predictions must account for spatial differences in deterioration characteristics across zones. Considering this, the dataset was segmented by damage zones (zone A to zone E), and separate classification models were trained for each zone to enhance the accuracy of deterioration stage prediction.
5.2.2. ML for Classification with Dataset for Each Zone A~E
The integrated dataset was divided into separate subsets for zones A through E, with classification training being reconducted for each zone. The number of data points for each zone was as follows: zone A – 186, zone B – 256, zone C – 141, zone D – 354 and zone E – 303. The same classification pipeline used in section 5.2.1 was once again applied for consistency. The accuracy and feature importance of each classification model are summarized in Table 8. For performance enhancement within each tree-based model, the top three variables with the highest SHAP contributions—representing the most influential features—were identified and listed.
The classification models for each damage zone demonstrated performance levels with Accuracy and Recall ranging from 0.6 to 0.8, while AUC values were generally close to 0.9. Of the variables influencing the model predictions, Operated years and Chloride contents consistently emerged as the most significant, which is a reasonable outcome given their direct correlation with deterioration states. Following these, the importance of traffic volume, slab thickness, and freeze–thaw cycles was observed in descending order. The significance of freeze–thaw cycles is considered justifiable, as this deterioration factor can occur in all zones where moisture is present. In particular, for zone B, which corresponds to the negative moment region, the strong influence of traffic volume is structurally reasonable. This zone is vulnerable to degradation due to direct live loads, and the high importance of traffic volume reflects a valid structural interpretation of deterioration driven by repeated loading.
5.2. Regression ML Model for Service Remained Life for Bridge Deck
A regression model was employed to predict the service life of bridge deck segments. This model employed the same input variables used in the previous classification models. Due to limitations in data availability, the damage zones were broadly categorized into two groups: cantilever regions (zones A and D) and moment regions (zones B, C, and E).
To ensure continuity in the deterioration progression, training data were selected from raw inspection records in which deterioration stages from state 1 to state 7 were continuously observed, including the final deterioration stage (state 7). Recognizing that the rate of deterioration in typical bridge decks is slow during early stages and accelerates once corrosion initiates, a function capable of reflecting this behavior was required. Thus, an exponential deterioration model was applied to capture the nonlinear progression of damage over time, effectively modeling the increasing rate of deterioration as bridge decks age.
Each deterioration state and the corresponding year of visual inspection were represented as a single point. Cases with three or more inspection data points at the same spot were extracted separately, and an exponential interpolation function was explored for each of these cases. The interpolation functions were investigated separately for the cantilever regions and the moment regions. The data for the cantilever regions and the corresponding interpolated exponential functions are presented in Figure 10a,b. The y-axis represents the deterioration states, which were evenly spaced to indicate sequential progression, while the x-axis shows the number of years in service at the time the deterioration was observed. Typically, the progression of deterioration is slow in the early years of service, and it accelerates significantly after the initiation of reinforcement corrosion, which is a well-accepted pattern of exponential deterioration.
However, the actual data from cantilever regions exhibited two contrasting patterns:
This suggests that while some cantilever zones follow the conventional time-dependent deterioration behavior, others may reflect the influence of localized environmental or structural factors that deviate from the typical pattern.
The data for the moment regions and the corresponding interpolated exponential functions are presented in Figure 11a,b. These figures were constructed using the same visualization method as applied to the cantilever regions. Compared to the cantilever zones, the deterioration progression patterns in the moment regions exhibited fewer cases of logarithmic behavior, with the majority of the cases following a clear exponential trend. The representative deterioration patterns are illustrated in Figure 11c,d, which highlights both the typical and atypical trends within the moment regions.
Exponential deterioration patterns typically begin with visually identifiable damage such as transverse cracks, map cracking, or efflorescence during the early stages. After these initial signs are observed, the rate of deterioration accelerates rapidly.
In contrast, logarithmic deterioration patterns often lack these clear early signs of damage, with sudden occurrences of reinforcement exposure or corrosion appearing without preceding cracking being observed. This trend is more frequently observed in cantilever regions, a finding which suggests that deterioration in these areas is more significantly influenced by various environmental factors rather than by structural ones. In other words, the conditions for corrosion initiation are not necessarily met through structurally induced cracking. That is, the conditions required for corrosion initiation are not necessarily fulfilled by structural cracking alone; rather, they appear to be more significantly influenced by environmental exposure. The formation of corrosion byproducts and the resulting expansion pressure are likely the primary causes of delamination, spalling, and the manifestation of advanced deterioration states such as state 7 and 8.
The data exhibiting exponential deterioration patterns were assumed to represent cases in which corrosion initiation occurred due to the progression of tensile cracking and stiffness degradation in the concrete deck, followed by chloride ingress reaching the reinforcement. For such cases, regression models were developed separately for each deterioration phase. In contrast, data showing logarithmic deterioration patterns were treated as a single-phase spanning from state 1 to states 7 and 8, with a remaining service life prediction regression model being developed accordingly. Logarithmic-type data observed in the moment regions were not used due to their limited quantity. The regression modeling pipeline is illustrated in Figure 12.
The regression modeling was conducted using the same dataset as the classification model. The data was split into training and test sets on a ratio of 8:2, and during the split, the target variable was set as the operated years. Bins were created, based on the operated years, to structure the dataset accordingly. The data were then normalized to adjust for scale.
For the exponential deterioration pattern in phase 1 of the moment regions, both Gaussian Process Regression (GPR) and AutoML regression models were developed. By contrast, for phases 2 and 3 of the moment regions and phases 1, 2, and 3 of the cantilever regions, GPR models were solely employed due to the limited amount of data available. Likewise, for the logarithmic deterioration pattern, GPR was also utilized to develop the regression model.
5.3.1. ML Regression Model for Exponential Trends in the Moment Zone
Before conducting model training, a correlation analysis was performed on the dataset. Since chloride content does not play a role in phase 1, it was excluded from the analysis. The deterioration of concrete bridge decks is influenced by various factors, and these factors differ depending on the region where the data were collected. Therefore, the correlation analysis aimed to identify the relative importance of variables in the output results. Among the seven regional datasets presented in Figure 11a, three regions have a relatively high proportion of data. Due to insufficient data in the remaining regions, it was difficult to analyze their correlations. The correlation matrix for the regions with sufficient data is presented in Figure 13.
Although "Operated years" refers to the actual service period, it is defined in the dataset based on the time difference between each phase. Therefore, a larger value indicates that the concrete deck is in better condition. In region A, excluding chloride content, variables such as freeze–thaw cycles and traffic volume were found to have little influence on deck deterioration. This suggests that these factors are not major contributors to deterioration up to phase 1.
In contrast, in regions B and C, both freeze–thaw cycles and traffic volume showed significant influence on deterioration, with higher traffic volume associated with shorter operated years. Across all three regions, precipitation exhibited an inverse relationship with operated years, indicating that increased precipitation may accelerate the deterioration process.
For phase 1 of the moment regions, a total of 99 data samples from six regions were used for training. To divide the data, the operated years, this being calculated as the duration from the bridge’s completion to the point of observed deterioration, was collected and categorized into six bins. Machine learning was then conducted by balancing the number of samples across each bin. Tree-based models, supported by Pycaret, were used for the training process. Of these, the top five models were selected, tuned, and then combined using an ensemble method. For the GPR model, a Radial Basis Function (RBF) kernel and White Kernel were employed. The test accuracy and remainings of the pycaret regression model are presented in Figure 14a,b, while the results of the GPR model are shown in Figure 14c.
In terms of R², the AutoML model demonstrated strong predictive performance, with both the training and test data yielding values close to 0.9. For the GPR model, a 95% confidence interval was evaluated under the assumption that the prediction follows a normal distribution with a ±1.96 sigma range around the mean. Overall, the regression performance for phase 1 in the moment regions showed high accuracy.
In addition to evaluating the accuracy of the machine learning models, an analysis was conducted to identify which variables played a decisive role in the model's predictions. The SHAP values of the four top-performing tree-based models from AutoML and the GPR model are presented in Figure 15.
Precipitation was consistently identified as the most influential variable across all models. Other variables showed varying levels of influence depending on the random state, which is likely due to the limited amount of data and regional variability within the dataset. One of the key strengths of SHAP analysis is its ability to determine whether a specific value of a variable has a positive or negative impact on the target value. As observed in the earlier correlation matrix analysis, similar relationships between variables and the target were confirmed through SHAP values.
This finding highlights the importance of regionalized learning that considers location-specific deterioration factors, as accounting for such factors can significantly improve the accuracy of remaining service life prediction for bridge decks. Variables that showed low SHAP impact may be attributed to the lack of stratification during train-test splitting, as well as minimal variation within the variable distributions during data collection.
The data for phase 2 and phase 3 in the moment regions were derived from previously collected datasets by extracting the operated years from the interpolated exponential functions. The target value for phase 2 was defined as the difference between phase 2 and phase 1, representing the time span from the onset of intermediate deterioration (state 3 or 4) to the initiation of corrosion (state 6). Similarly, the target value for phase 3 was set as the time from phase 2 to phase 3, indicating the progression of corrosion until delamination or spalling of the concrete cover. During model training, the dataset was stratified based on the target values for both training and test sets. From this phase onward, chloride content was included as a variable in the model. GPR was used for the prediction, and model performance and variable importance are illustrated in Figure 16. In phase 2, the wide distribution in the corrosion initiation timing within the dataset led to a high degree of uncertainty. However, the target values fell within the 95% confidence interval of the GPR model. Variable importance analysis revealed that chloride content, traffic volume, and span length were the most influential factors in determining model accuracy, in that order. For phase 3, the actual values were also confirmed to lie within the 95% confidence interval of the GPR predictions. Variable importance analysis indicated that chloride content, concrete strength, and heavy vehicle traffic volume had the greatest influence on model performance.
5.3.2. ML Regression Model in the Cantilever Zone
(1) Exponential trends
To develop a regression model for predicting the remaining service life of cantilever regions, the dataset was divided and trained based on observed deterioration patterns.
Training first focused on data that exhibited deterioration trends similar to those in the moment regions. Although the same phase structure was applied as in the moment regions, data showing map cracking or efflorescence were excluded from the training set. The reason behind this exclusion was due to the potential uncertainty in the deterioration pattern, which could resemble logarithmic or even linear behavior rather than a clear exponential trend.
The number of data samples used for training the prediction models was 48 for each of the three phases. In the cantilever regions, chloride content was included as one of the input variables, with the GPR model being used for training. During GPR training, a combination of the Radial Basis Function (RBF) kernel and the White Kernel was employed. For data splitting, the stratify method was applied based on the target variable.
The results of the model trained on the exponential deterioration patterns in the cantilever regions are presented in Figure 17. Figures 17a,c,e show the predicted values for each phase, including uncertainty. For phases 1 and 2, the target values were generally found to lie within the 95% confidence interval of the normal distribution. However, in Phase 3, some data points were observed to fall outside this range. This is attributed to discrepancies in the range of variable values within the split datasets, which likely caused predictions to deviate beyond the expected bounds. In terms of SHAP values, chloride content, heavy vehicle traffic volume, and chloride concentration emerged as the most influential variables. The differences compared to the moment region model are likely due to the inclusion of chloride-related variables and the presence of data bias. It is expected that as data quality improves and bias is mitigated, the regression model will demonstrate higher accuracy and enhanced predictive performance.
(2) Logarithmic trends
A remaining service life regression model was also proposed for the logarithmic deterioration pattern observed in the cantilever regions. In this case, since deterioration is not clearly visible until reinforcement exposure or similar damage is observed, the model was trained to predict the time at which phase 7 or 8 appears as the target variable. The dataset consisted of 20 samples, and the model development and data splitting followed the same procedure as the other models.
The model's prediction accuracy and variable correlations are presented in Figure 18. Overall, the model showed excellent predictive performance. In terms of variable importance, precipitation, chloride content, and heavy vehicle traffic volume were identified as the most influential factors, in that order.
6. Discussion
In this study, a machine learning-based remaining service life prediction model was developed for concrete bridge decks of PSC-I type bridges. This model took into account the distinct deterioration characteristics observed across different zones and regions. The performance of the model was evaluated not only in terms of prediction accuracy, but also in terms of model reliability by employing SHAP values, a representative method of explainable AI. This approach allowed for the incorporation of domain knowledge so as to allow the interpretability and trustworthiness of the developed model to be assessed.
However, this study has several limitations. The first issue concerns the homogeneity of the environmental data. The regional data used in the analysis were primarily concentrated in three regions, which limits the generalizability of the findings. In particular, the correlations between deterioration phases and states differed across regions, and the feature importance results derived from the models also showed inconsistent patterns. These inconsistencies are attributed not only to the quantity and quality of the collected data but also to inherent data bias. For zone-specific data, variables such as chloride content and carbonation depth were included. However, in many cases, the values were constructed using median values without considering the exact sampling locations. In reality, chloride content tends to be highest near the shoulders on the top surface of the deck and significantly lower on the underside or in the main traffic lanes. In other words, the dataset should be constructed to reflect meaningful differences by incorporating regional and zone-specific coefficients for environmental factors.
Secondly, a key limitation lies in the lack of detailed information regarding the timing of deterioration. In general, deterioration of concrete bridge decks begins with transverse shrinkage cracks caused by restraint from the girders during the initial curing stage of concrete. However, such early-stage deterioration is neither systematically documented nor managed as data or in deterioration maps. The lack of this data makes it difficult to clearly define its relationship to subsequent deterioration processes. A representative example of this issue is when different spans of the same bridge exhibit varying degrees of deterioration progression. The causes of such discrepancies include not only poor control of initial concrete quality but also construction errors such as reinforcement placement deviations in cast-in-place decks. Moreover, the deterioration data currently recorded on visual inspection maps reflect only the time of discovery, not the actual time of occurrence, thereby limiting the ability to accurately determine when deterioration began. Knowing the exact timing of deterioration is crucial for constructing more reliable predictive models. Additionally, the current maintenance systems primarily focus on implementing repairs or reinforcements when severe deterioration is observed, but the history of such interventions is often not recorded. The absence of repair and reinforcement records introduces uncertainty in assessing deterioration progression and presents significant challenges in accurately predicting the remaining service life of bridge decks.
Finally, a major limitation lies in the lack of sufficient time-series data related to crack propagation and internal reinforcement corrosion. The lack of this data hinders the ability to fully capture the dynamic progression of deterioration. The current remaining service life prediction method segments the deterioration process into phases whereupon each phase is modelled separately. However, in most cases, the onset of reinforcement corrosion does not manifest visibly on the concrete surface, thereby making it difficult to accurately predict the initiation point of corrosion. Furthermore, for corrosion to initiate, not only must chlorides reach the reinforcement, but sufficient moisture must also be present. Unless there is a through-crack, it is difficult to verify whether internal leakage is occurring within the deck. Future research should utilize GPR_scan(Ground Penetrating Radar) data to analyze the relationship between deterioration on the top and bottom surfaces of the deck. In addition, the introduction of time-series models such as Long Short-Term Memory (LSTM) could improve the precision of service life prediction. Integrating real-time monitoring data into predictive systems is also essential for enhancing the practical applicability of the proposed models.
7. Conclusion
The conclusions drawn from the data-driven machine learning-based remaining service life prediction model for concrete bridge decks developed in this study are as follows:
- Traditional chloride models are based on diffusion equations, which primarily account for the influence of diffusion coefficients while excluding the combined effects of multiple factors. These models attempt to predict the initiation and progression of corrosion under simplified assumptions. However, when considering the direct impact of additional environmental factors such as rainfall, de-icing salts, and freeze–thaw cycles, it becomes evident that deterioration prediction requires a model that reflects the actual progression of deterioration over time using real inspection data.
- Although the deterioration of bridge decks is caused by various factors such as precipitation, freeze–thaw cycles, and chloride content, the magnitude of these values differs by region and zone. Therefore, appropriate consideration of these differences is essential during evaluation. Sensitivity analysis of the data is necessary to accurately classify the factors influencing deterioration, and it is important to develop a prediction model by grouping data with similar patterns to estimate remaining service life effectively.
- In data-driven ML models, the application of explainable AI techniques is essential to obtain reliable results. Using SHAP values—a widely used method in ML—this study assessed both the accuracy of the model and the importance of variables influencing the learning process. When training was performed without considering zoning in the bridge deck, it was found that the zoning variable had the greatest influence on the results. This suggests the critical need for incorporating deck zoning into the model. Furthermore, when the data were divided by zone and the remaining service life was analyzed based on deterioration patterns, it was observed that in exponential deterioration patterns, factors such as precipitation, heavy traffic volume, and slab thickness appeared in varying combinations, indicating the influence of multiple interacting variables. On the other hand, in zones where logarithmic deterioration patterns were found—typically limited to cantilever regions—environmental factors emerged as the most influential variables.
- The deterioration patterns of the bridge deck vary depending on whether the zone is a cantilever region or a moment region. In moment regions, deterioration generally progresses due to environmental factors following typical structural cracking. However, in cantilever regions, many cases of reinforcement corrosion, delamination, or spalling were observed without the presence of visible structural cracks. This indicates that, in order to properly define the serviceability life cycle of bridge decks, separate evaluation and modeling for moment regions and cantilever regions are required.
- General deterioration patterns can be classified into structural damage and environmental degradation. Once structural damage occurs, environmental factors tend to accelerate the deterioration process, particularly from the stages of map cracking or efflorescence. Therefore, it is crucial to implement timely maintenance and rehabilitation at the transition point between structural and environmental deterioration stages. In addition, for cantilever regions where deterioration may progress without visible signs, continuous monitoring of drainage systems and appropriate maintenance strategies are necessary to prevent unseen damage.
Author Contributions
Conceptualization, G.-T.R.; methodology, G.-T.R. and H.-H.S.; validation, G.-T.R. C.-S.S.; investigation, G.-T.R. and H.-H.S.; resources, C.-S.S.; writing—original draft preparation, G.-T.R., C.-S.S. and H.-H.S.; writing—review and editing, G.-T.R. ,C.-S.S., and H.-H.S.; supervision C.-S.S.; project administration, H.-H.S.; funding acquisition, C.-S.S., H.-H.S.
Acknowledgments
Research for this paper was conducted with the support of the “National R&D Project for Smart Construction Technology (RS-2020-KA156007)” funded by the Korea Agency for Infrastructure Technology Advancement under the Ministry of Land, Infrastructure and Transport, and managed by the Korea Expressway Corporation. This research was supported by the Chung-Ang University Excellent student Scholarship in 2013.
Conflicts of Interest
The authors declare no conflicts of interest.
References
- Kim, K.H.; Nam, M.S.; Hwang, H.H.; Ann, K.Y. Prediction of Remaining Life for Bridge Decks Considering Deterioration Factors and Propose of Prioritization Process for Bridge Deck Maintenance. Sustainability 2020, 12(24), 10625. [Google Scholar] [CrossRef]
- Song, H.H.; Kim, K.Y.; Shin, J.H.; Roh, G.T.; Shim, C.S. A Digital Twin Framework for Bridge Slab Deterioration: From 2D Inspection Data to Predictive 3D Maintenance Modeling. Buildings 2025, 15(12), 1979. [Google Scholar] [CrossRef]
- Frosch, R.J.; Kreger, M.E.; Byl, E.A.; Lyrenmann, J.P.; Pollastrini, A.S. Development of a Cost-Effective Concrete Bridge Deck Preservation Program: Volume 1 – Development and Implementation of the Experimental Program. Joint Transportation Research Program Publication 2016, FHWA/IN/JTRP-2016/22, Purdue University, West Lafayette, IN, USA. [CrossRef]
- Guo, C.; Farzaneh, A. Fatigue Behavior of Reinforced Concrete Bridge Decks under Moving Wheel Loads: A State-of-the-Art Review. J. Bridge Eng. 2024, 29, 03124003. [Google Scholar] [CrossRef]
- Matsui, S.; Iizuka, A.; Yamada, K.; Kawamura, S. Evaluation for Fatigue Durability of RC Slab Subjected to Wheel Loading. J. Struct. Eng. (Japan Soc. Civ. Eng.) 2006, 62A, 1149–1160. [CrossRef]
- Yang, C.; Lou, P.; Nassif, H. Correlation of Bridge Deck Deterioration with Truckload Spectra Based on NBI Condition Rating and Weigh-In-Motion Data; FHWA-HRT-24-032; U.S. Department of Transportation, Federal Highway Administration: Washington, DC, USA, 2024. [Google Scholar] [CrossRef]
- Ministry of Land, Infrastructure and Transport (MOLIT). Facility Safety and Maintenance Implementation Guidelines: Inspection and Diagnosis Part; MOLIT: Sejong, Republic of Korea, 2021. (In Korean) [Google Scholar]
- AASHTO. The Manual for Bridge Evaluation, 3rd ed.; American Association of State Highway and Transportation Officials: Washington, DC, USA, 2018. [Google Scholar]
- Sachidanand, J.; Sitarama, R.S. Enhancement in Indian Bridge Management System Using Analytics within BIM Data Model. In Proceedings of the IABSE Symposium Prague 2022, Prague, Czech Republic, 25–27 May 2022; pp. 903–910. [Google Scholar]
- Liu, T.; Weyers, R.W. Modeling the Dynamic Corrosion Process in Chloride Contaminated Concrete Structures. Cem. Concr. Res. 1998, 28(3), 365–379. [Google Scholar] [CrossRef]
- Liu, Y. Modeling Time-to-Corrosion Cracking in Chloride Contaminated Reinforced Concrete Structures. ACI Mater. J. 1999, 96, 611–613. [Google Scholar]
- Ouzaa, K.; Oucif, C. Numerical Model for Prediction of Corrosion of Steel Reinforcements in Reinforced Concrete Structures. Underground Space 2019, 4(1), 72–77. [Google Scholar] [CrossRef]
- Kim, H.-S.; Shin, S.-W.; Lee, H.-S. Analysis on the Characteristics of Deterioration and Durability of Reinforced Concrete Deck in Railway Bridge. J. Korean Soc. Railw. 2019, 22(1), 48–56. [Google Scholar] [CrossRef]
- Broomfield, J.P. Corrosion of Steel in Concrete: Understanding, Investigation and Repair; CRC Press: London, UK, 2006. [Google Scholar]
- Kwon, T.H.; Kim, J.; Park, K.T.; Jung, K.S. Long Short Term Memory Based Methodology for Predicting Carbonation Models of Reinforced Concrete Slab Bridges: Case Study in South Korea. Appl. Sci. 2022, 12(23), 12470. [Google Scholar] [CrossRef]
- Liu, Y.; Xiang, S.; Wang, D. Real-Time Evaluation and Prediction of Spatial Temperature Field and Temperature Effect of Steel-Concrete Composite Bridge Deck System Based on BP-LSTM Hybrid Model. Tumu Gongcheng Xuebao/China Civ. Eng. J. 2021, 54(11), 57–70, 78.
- Jeon, C.-H.; Kwon, T.-H.; Kim, J.-H.; Jung, K.-S.; Park, K.-T. Quantitative Evaluation of Reinforced Concrete Slab Bridges Using a Novel Health Index and LSTM-Based Deterioration Models. Appl. Sci. 2024, 14(22), 10530. [Google Scholar] [CrossRef]
- Roh, G.T.; Vu, N.; Jeon, C.-H.; Shim, C.S. Augmented Data-Driven Machine Learning for Digital Twin of Stud Shear Connections. Buildings 2024, 14, 328. [Google Scholar] [CrossRef]
- Rashidi Nasab, H.; Elzarka, H. Optimizing Machine Learning Algorithms for Improving Prediction of Bridge Deck Deterioration: A Case Study of Ohio Bridges. Buildings 2023, 13(6), 1517. [Google Scholar] [CrossRef]
- Ruggieri, N.; Tran, V.; De Domenico, D. Physics-informed deep learning for modeling nonlinear stress–strain behavior of concrete under uniaxial compression. Engineering Structures 2023, 285, 116190. [Google Scholar] [CrossRef]
- Li, D.; Chen, Q.; Wang, H.; Shen, P.; Li, Z.; Nettis, A.; He, W. Deep learning-based acoustic emission data clustering for crack evaluation of welded joints in field bridges. Automation in Construction 2024, 165, 105540. [Google Scholar] [CrossRef]
- Nettis, A.; Nettis, A.; Ruggieri, S.; Uva, G. Corrosion-induced fragility of existing prestressed concrete girder bridges under traffic loads. Engineering Structures 2024, 314, 118302. [Google Scholar] [CrossRef]
- Niu, Y.; Wang, W.; Su, Y.; Jia, F.; Long, X. Plastic damage prediction of concrete under compression based on deep learning. Acta Mechanica 2024, 235(1), 255–266. [Google Scholar] [CrossRef]
- Fard, F.; Naieni Fard, F.S. Development and Utilization of Bridge Data of the United States for Predicting Deck Condition Rating Using Random Forest, XGBoost, and Artificial Neural Network. Remote Sens. 2024, 16, 367. [Google Scholar] [CrossRef]
- D.H, Kang, G.T, Roh, ., C.S, Shim, K,C,.L (2024), Fatigue Life Prediction for Stud Shear Connectors Based on a Machine Learning Model, Buildings 2024, 14(10), 3278. [CrossRef]
- Korea Agency for Infrastructure Technology Advancement (KAIA). Open Traffic Volume Data from the Traffic Information Service System. Available online: https://www.road.re.kr (accessed on 30 June 2025).
- Korea Meteorological Administration (KMA). Annual Statistics of Precipitation and Snowfall Days (1991–2024). Available online: https://data.kma.go.kr/stcs/grnd/grndRnList.do?pgmNo=69 (accessed on 30 June 2025).
Figure 1.
General mechanism of bridge concrete deck deterioration.
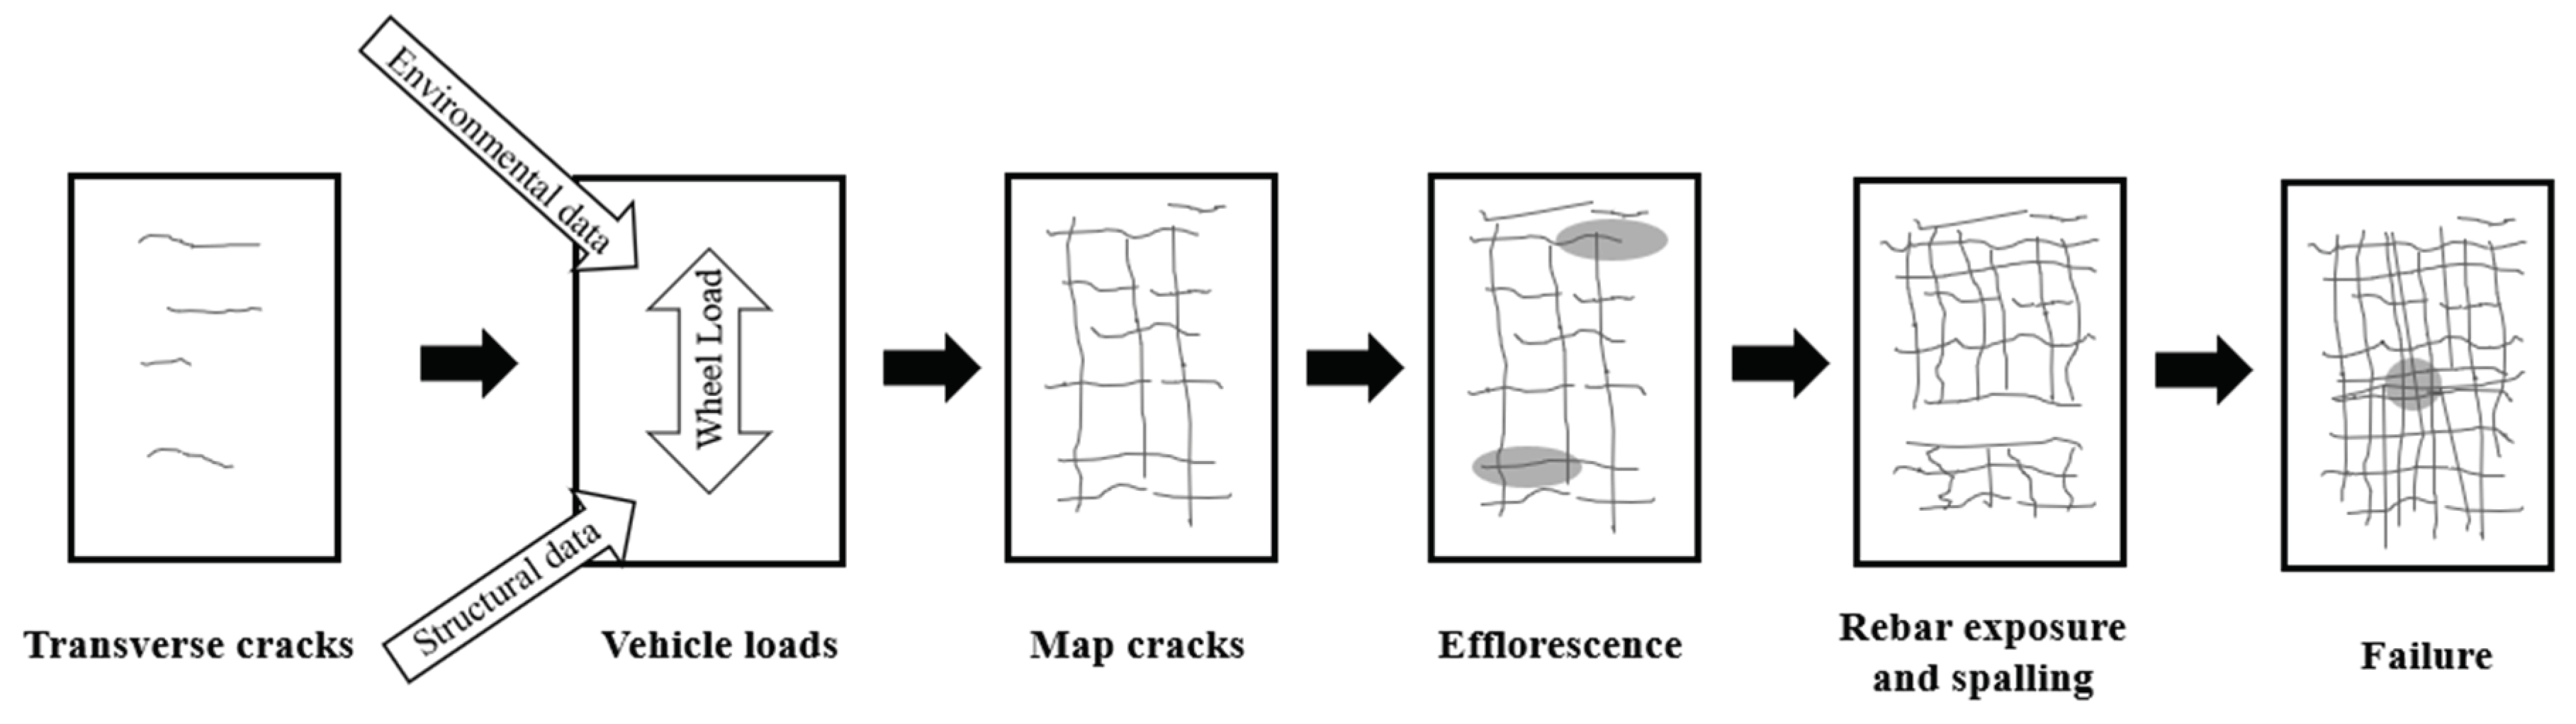
Figure 2.
Definitions of Phase 1 to Phase 3.
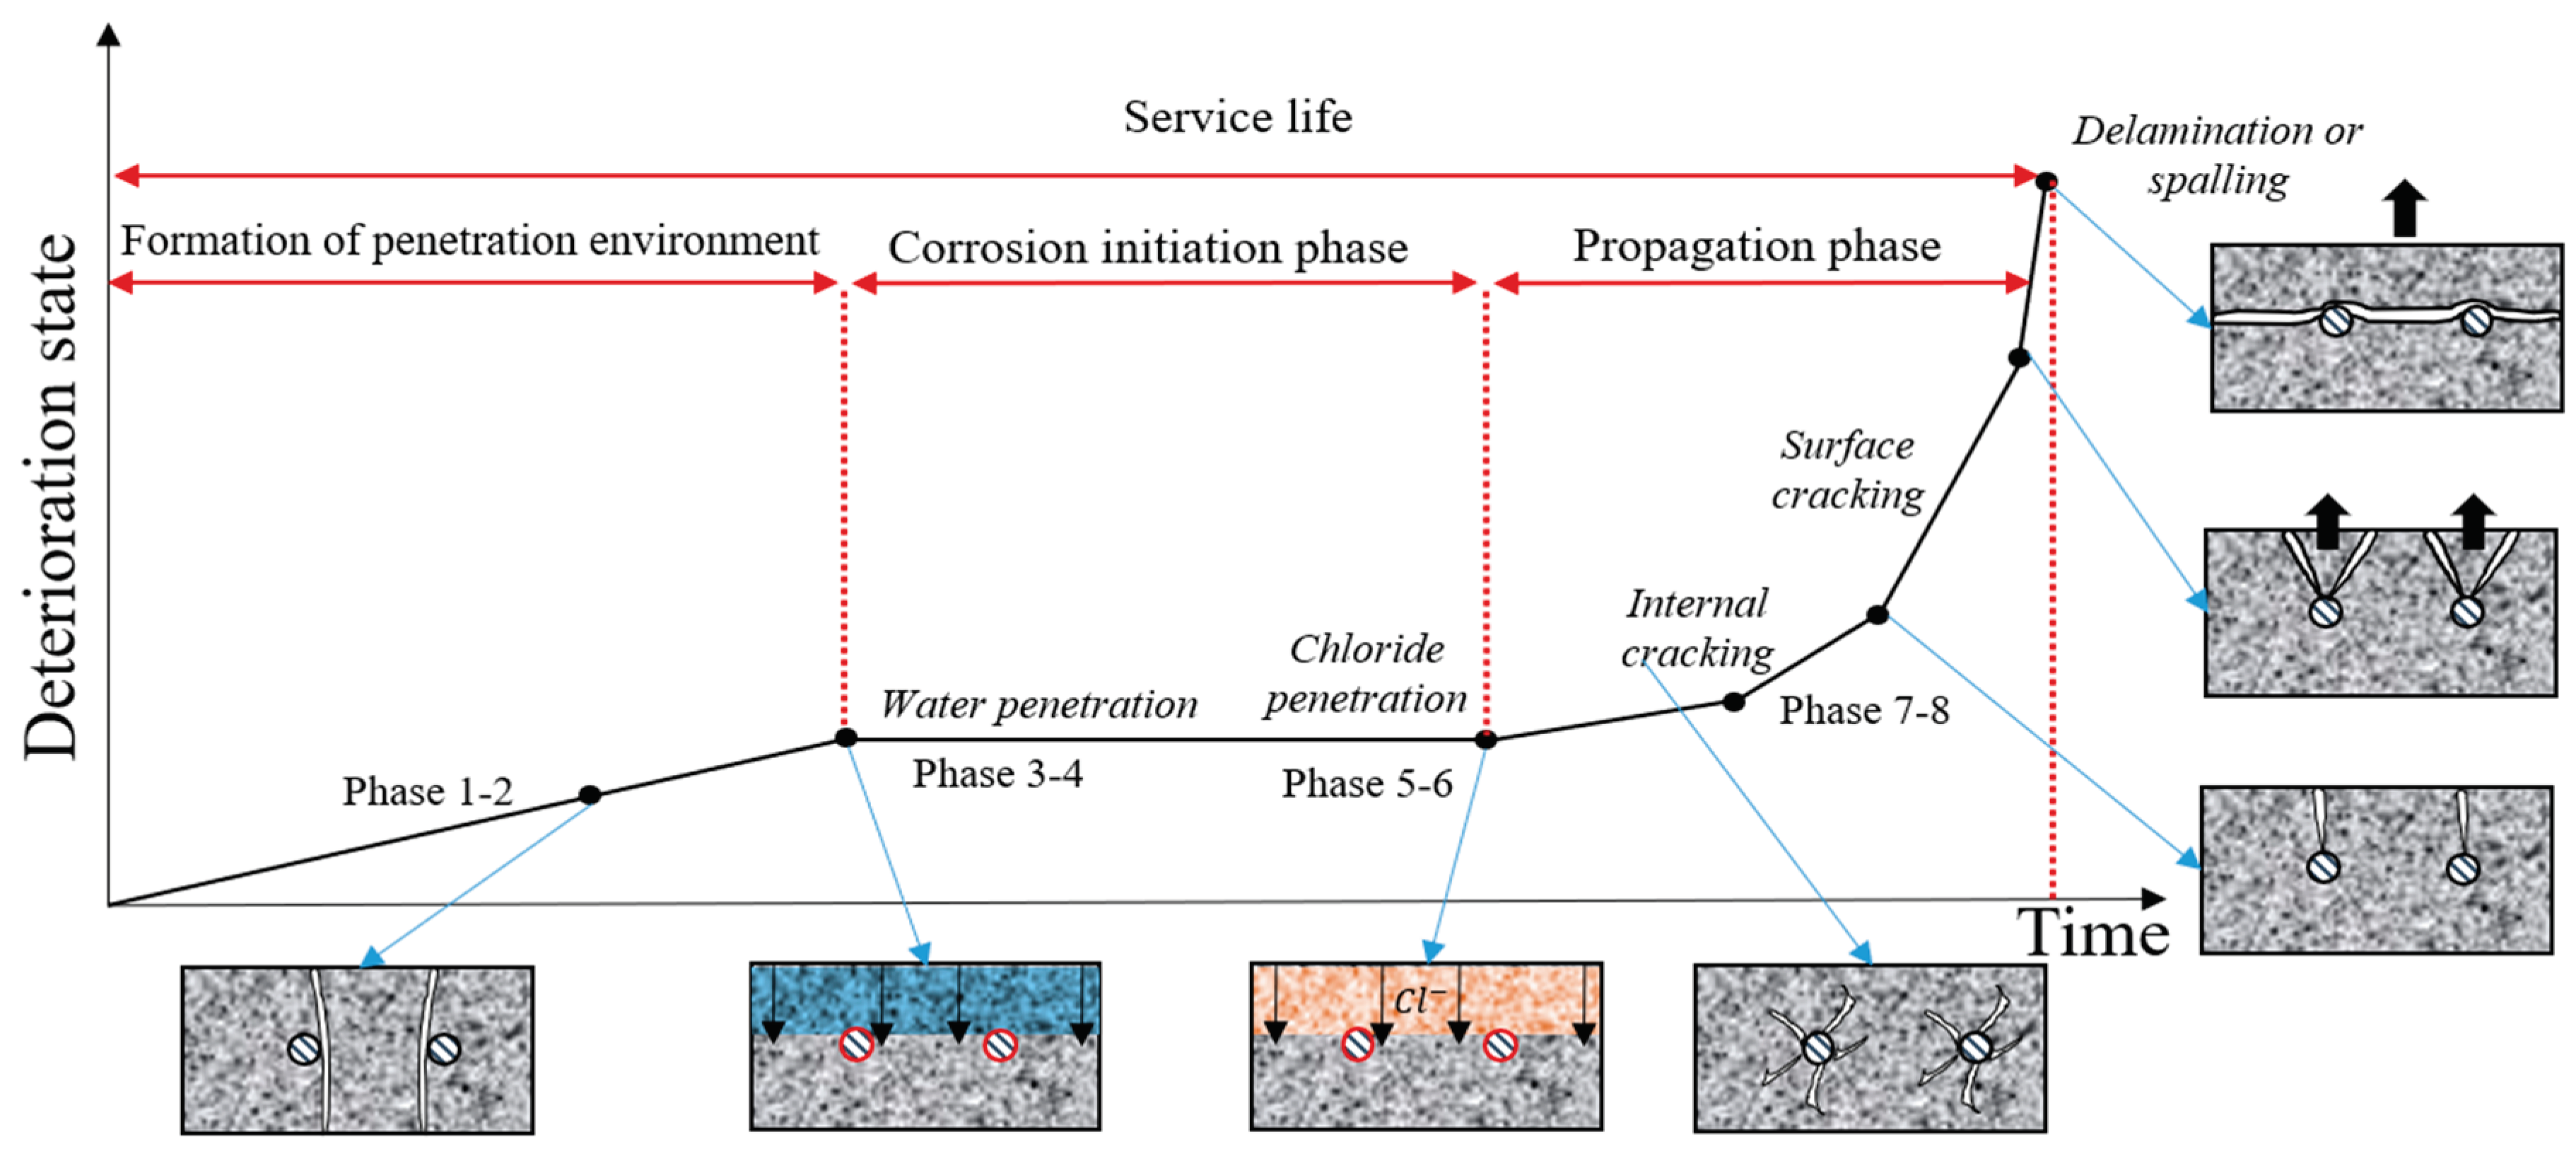
Figure 3.
Definition of local zones in Korea considering time-dependent contents, (a) Province level (b) Route level (c) City level.
Figure 3.
Definition of local zones in Korea considering time-dependent contents, (a) Province level (b) Route level (c) City level.

Figure 4.
Definition of damage zones considering design conditions.
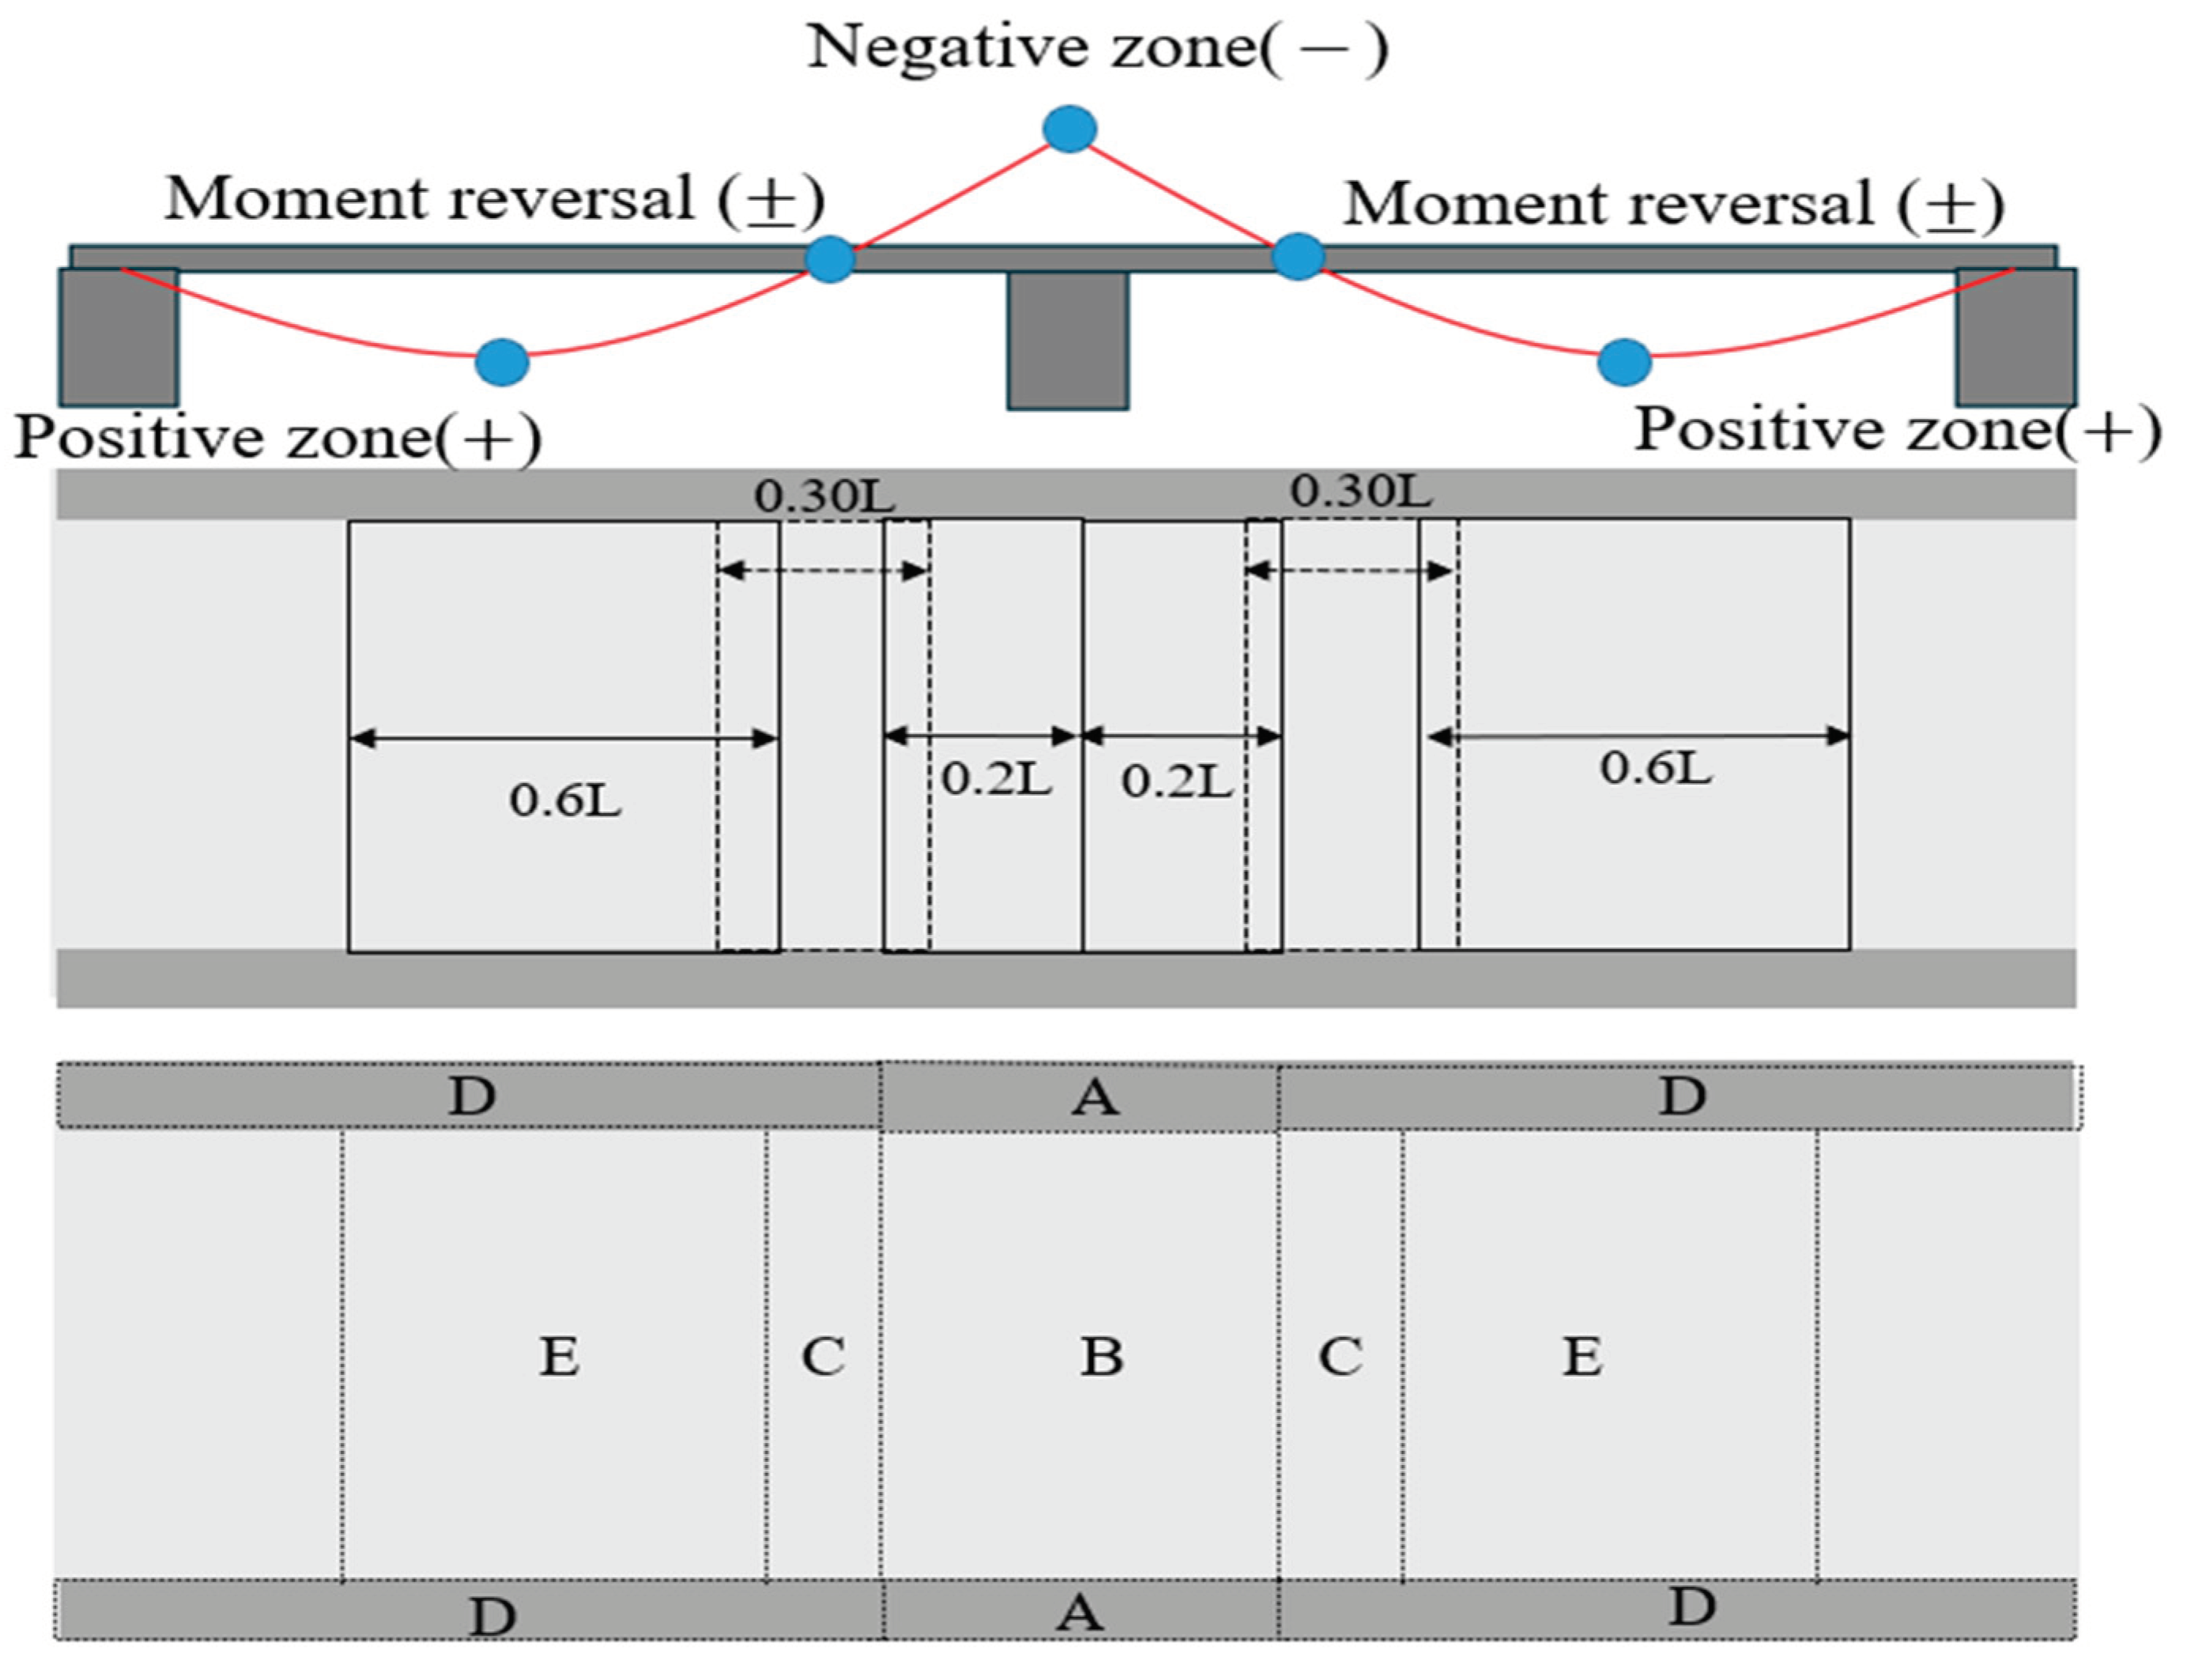
Figure 5.
Damage Progress of a bridge deck (a) negative moment section(Zone B) (b) cantilever section(Zone D).
Figure 5.
Damage Progress of a bridge deck (a) negative moment section(Zone B) (b) cantilever section(Zone D).
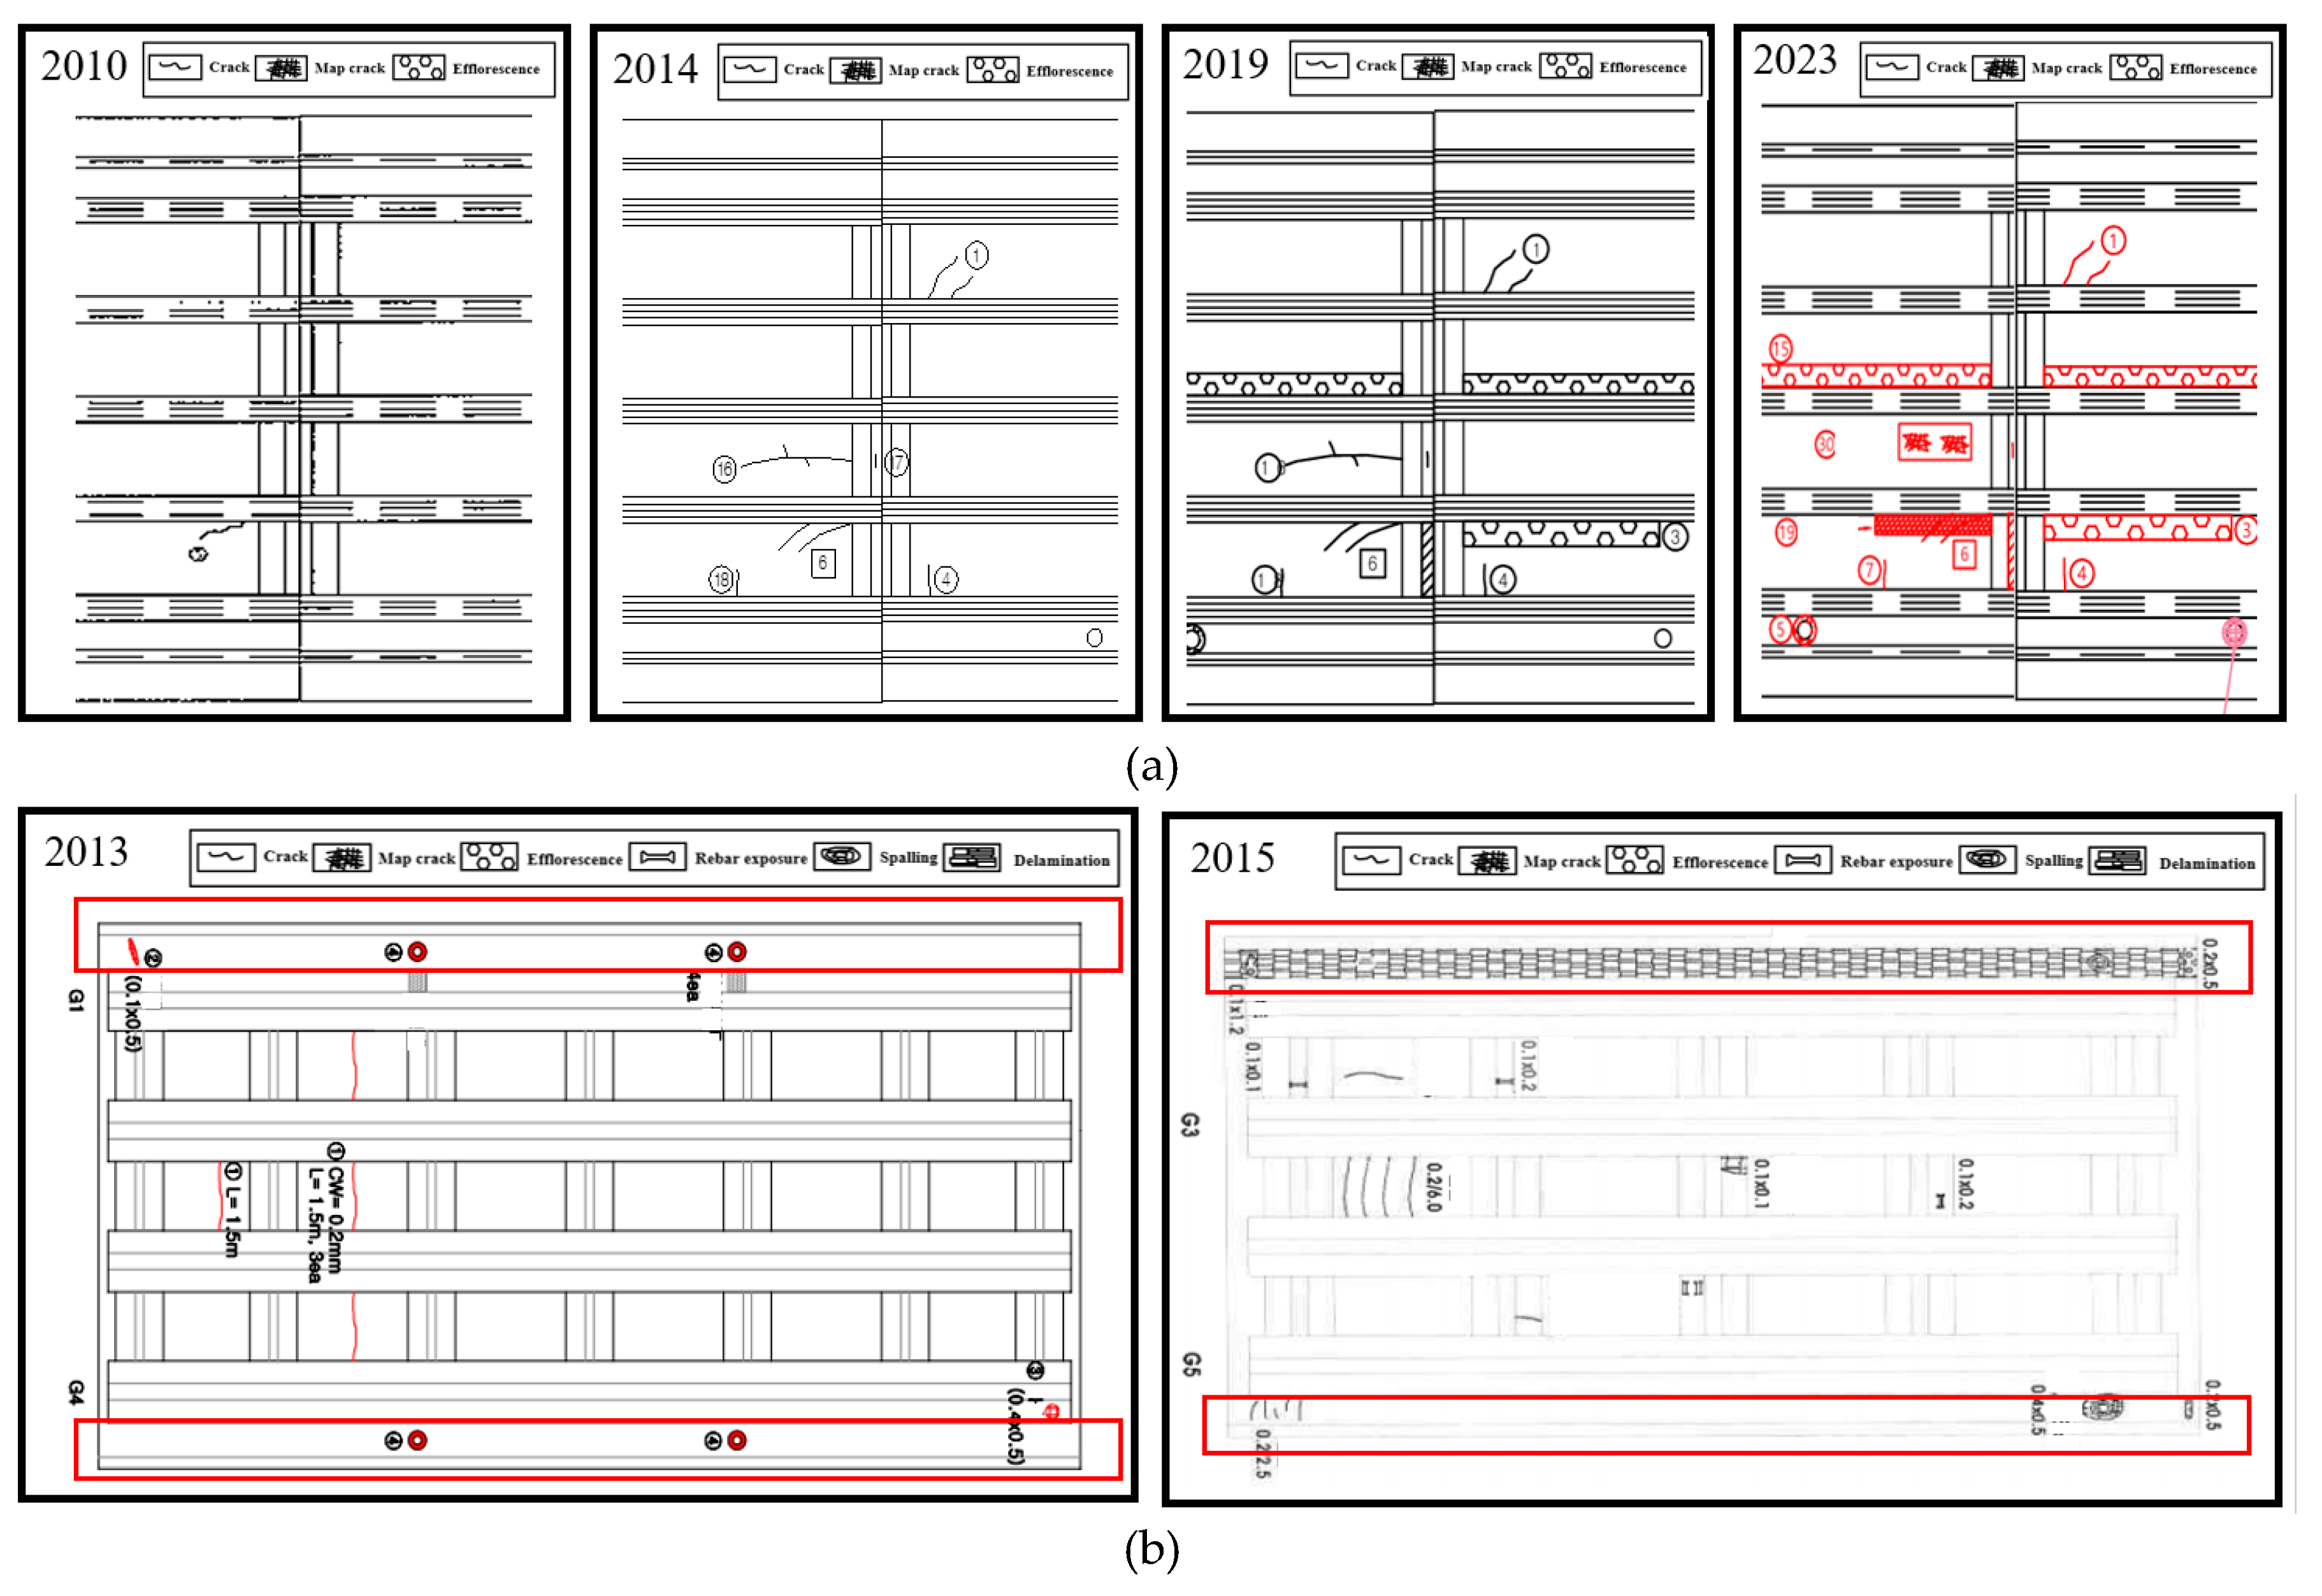
Figure 6.
12 types of vehicle classification system (MOLIT, 2020).
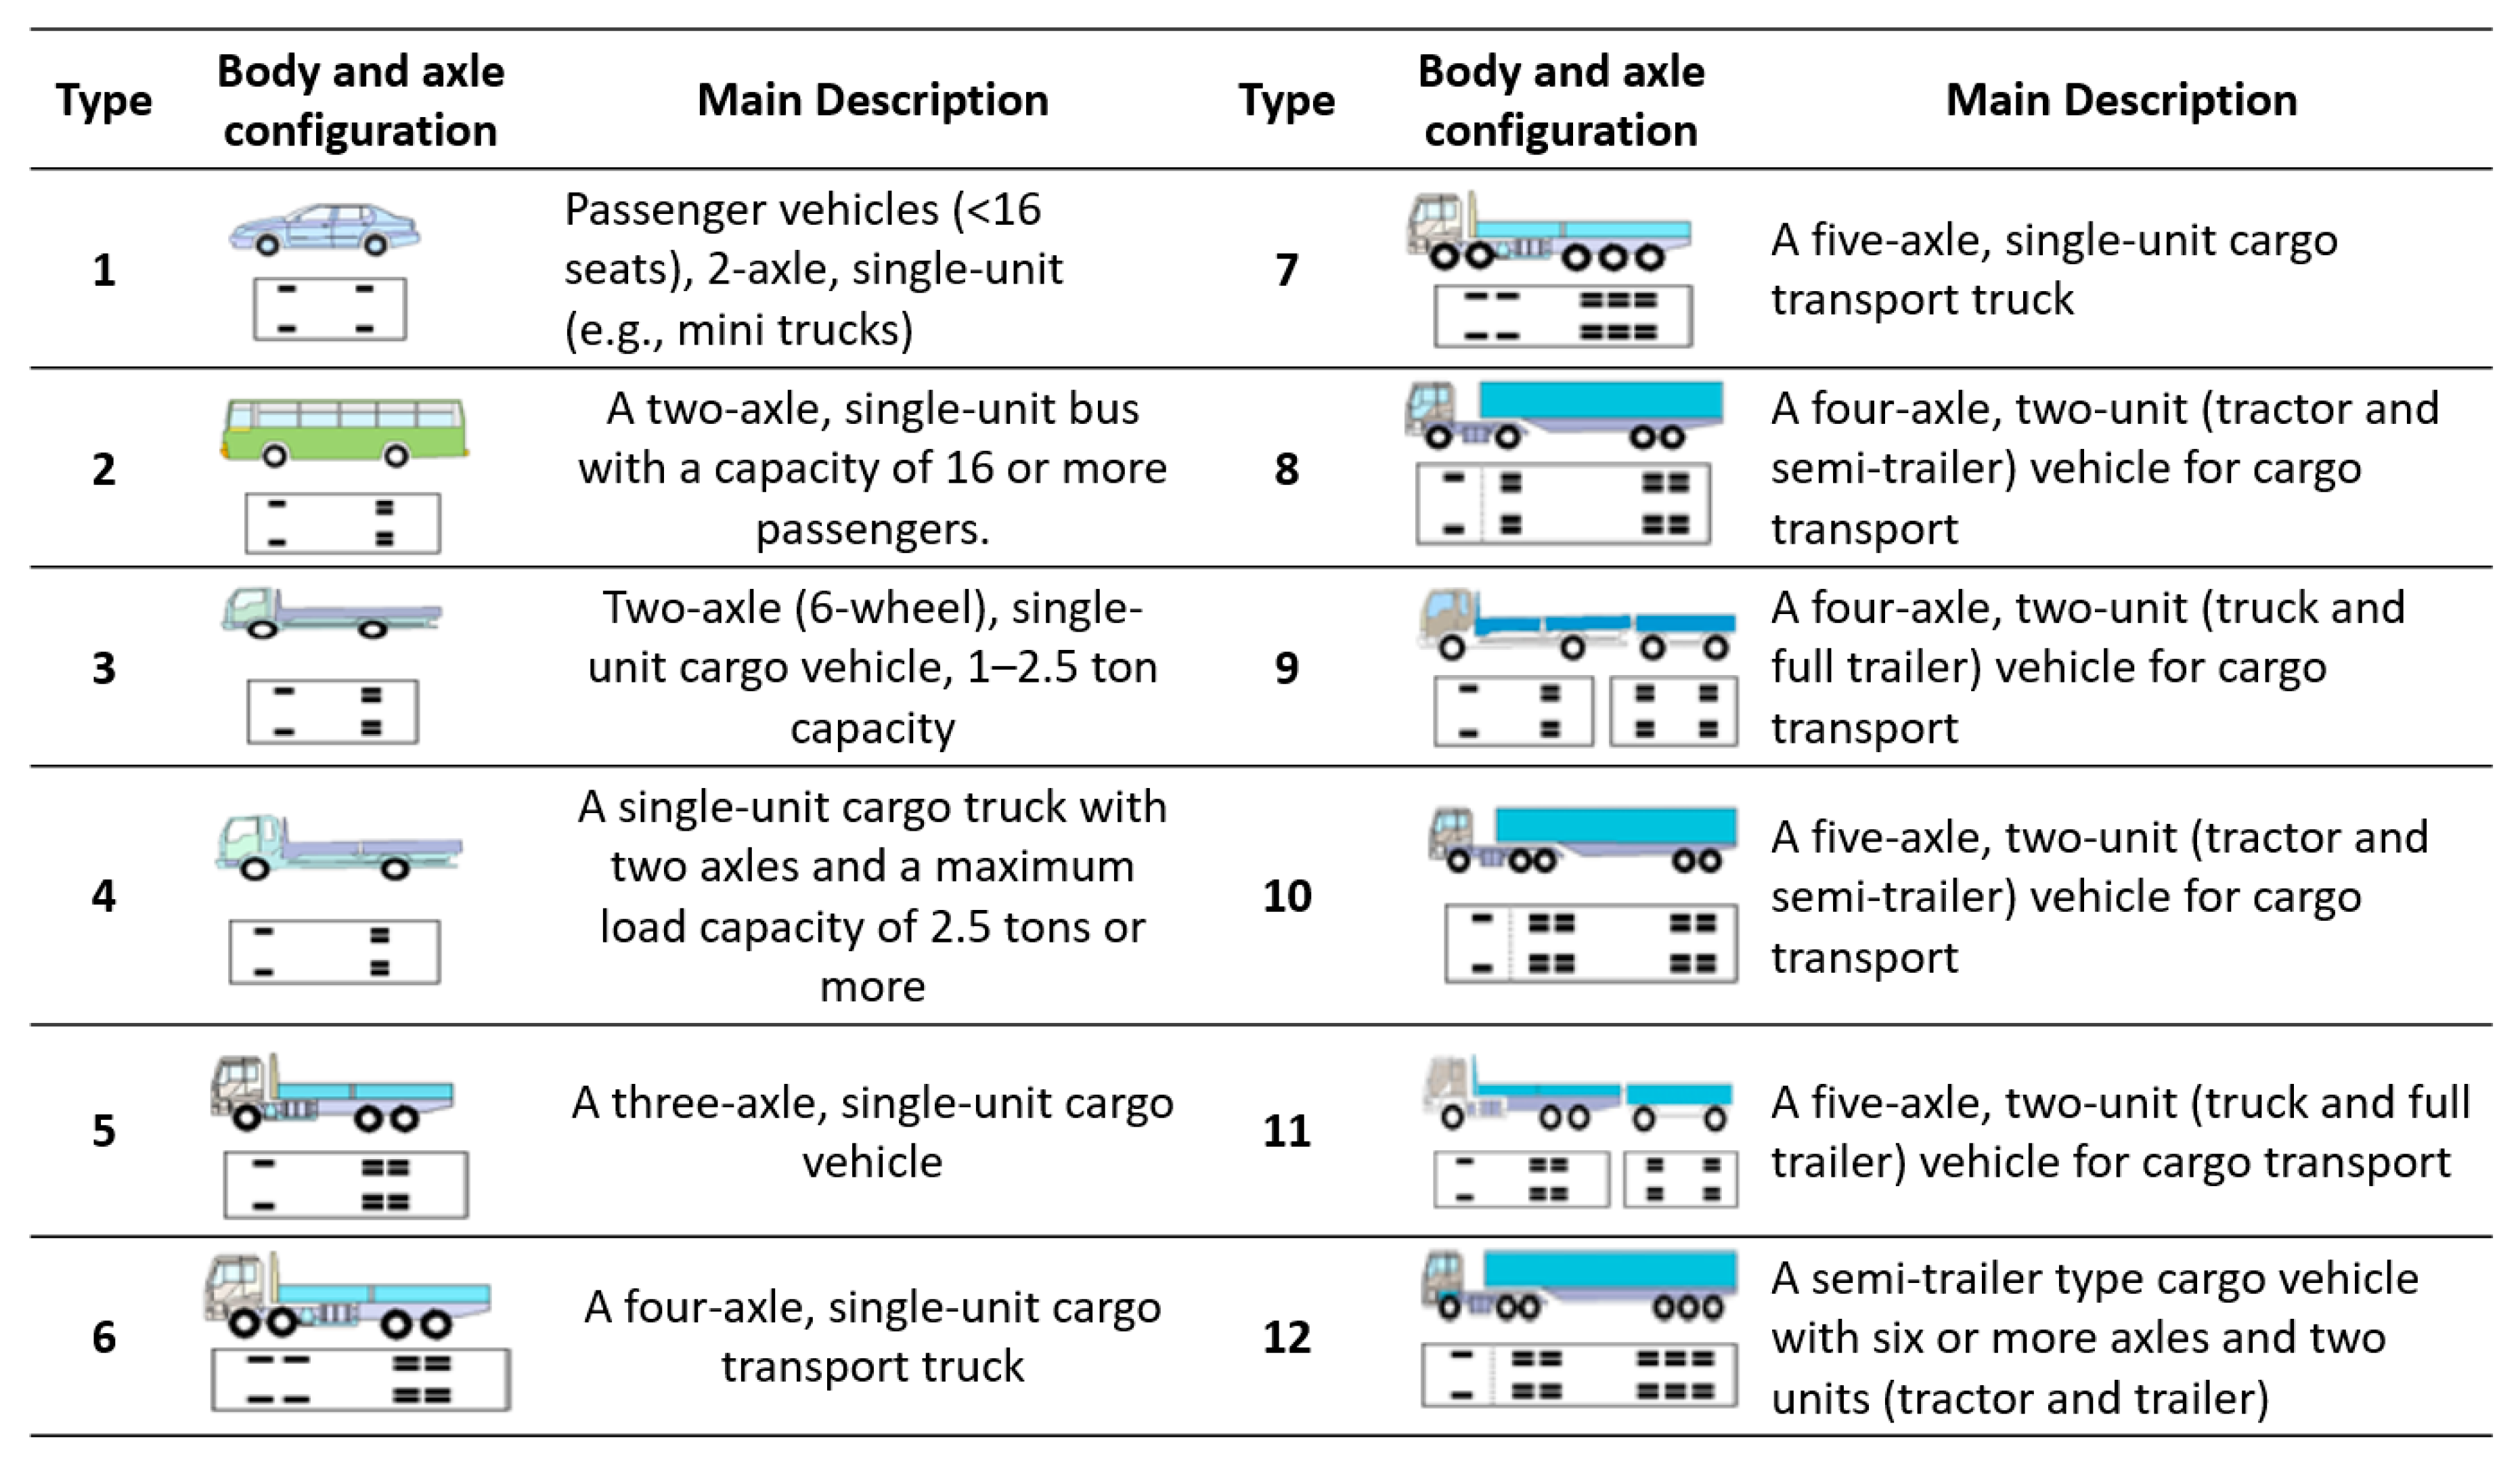
Figure 7.
Chloride contents of each local zone.
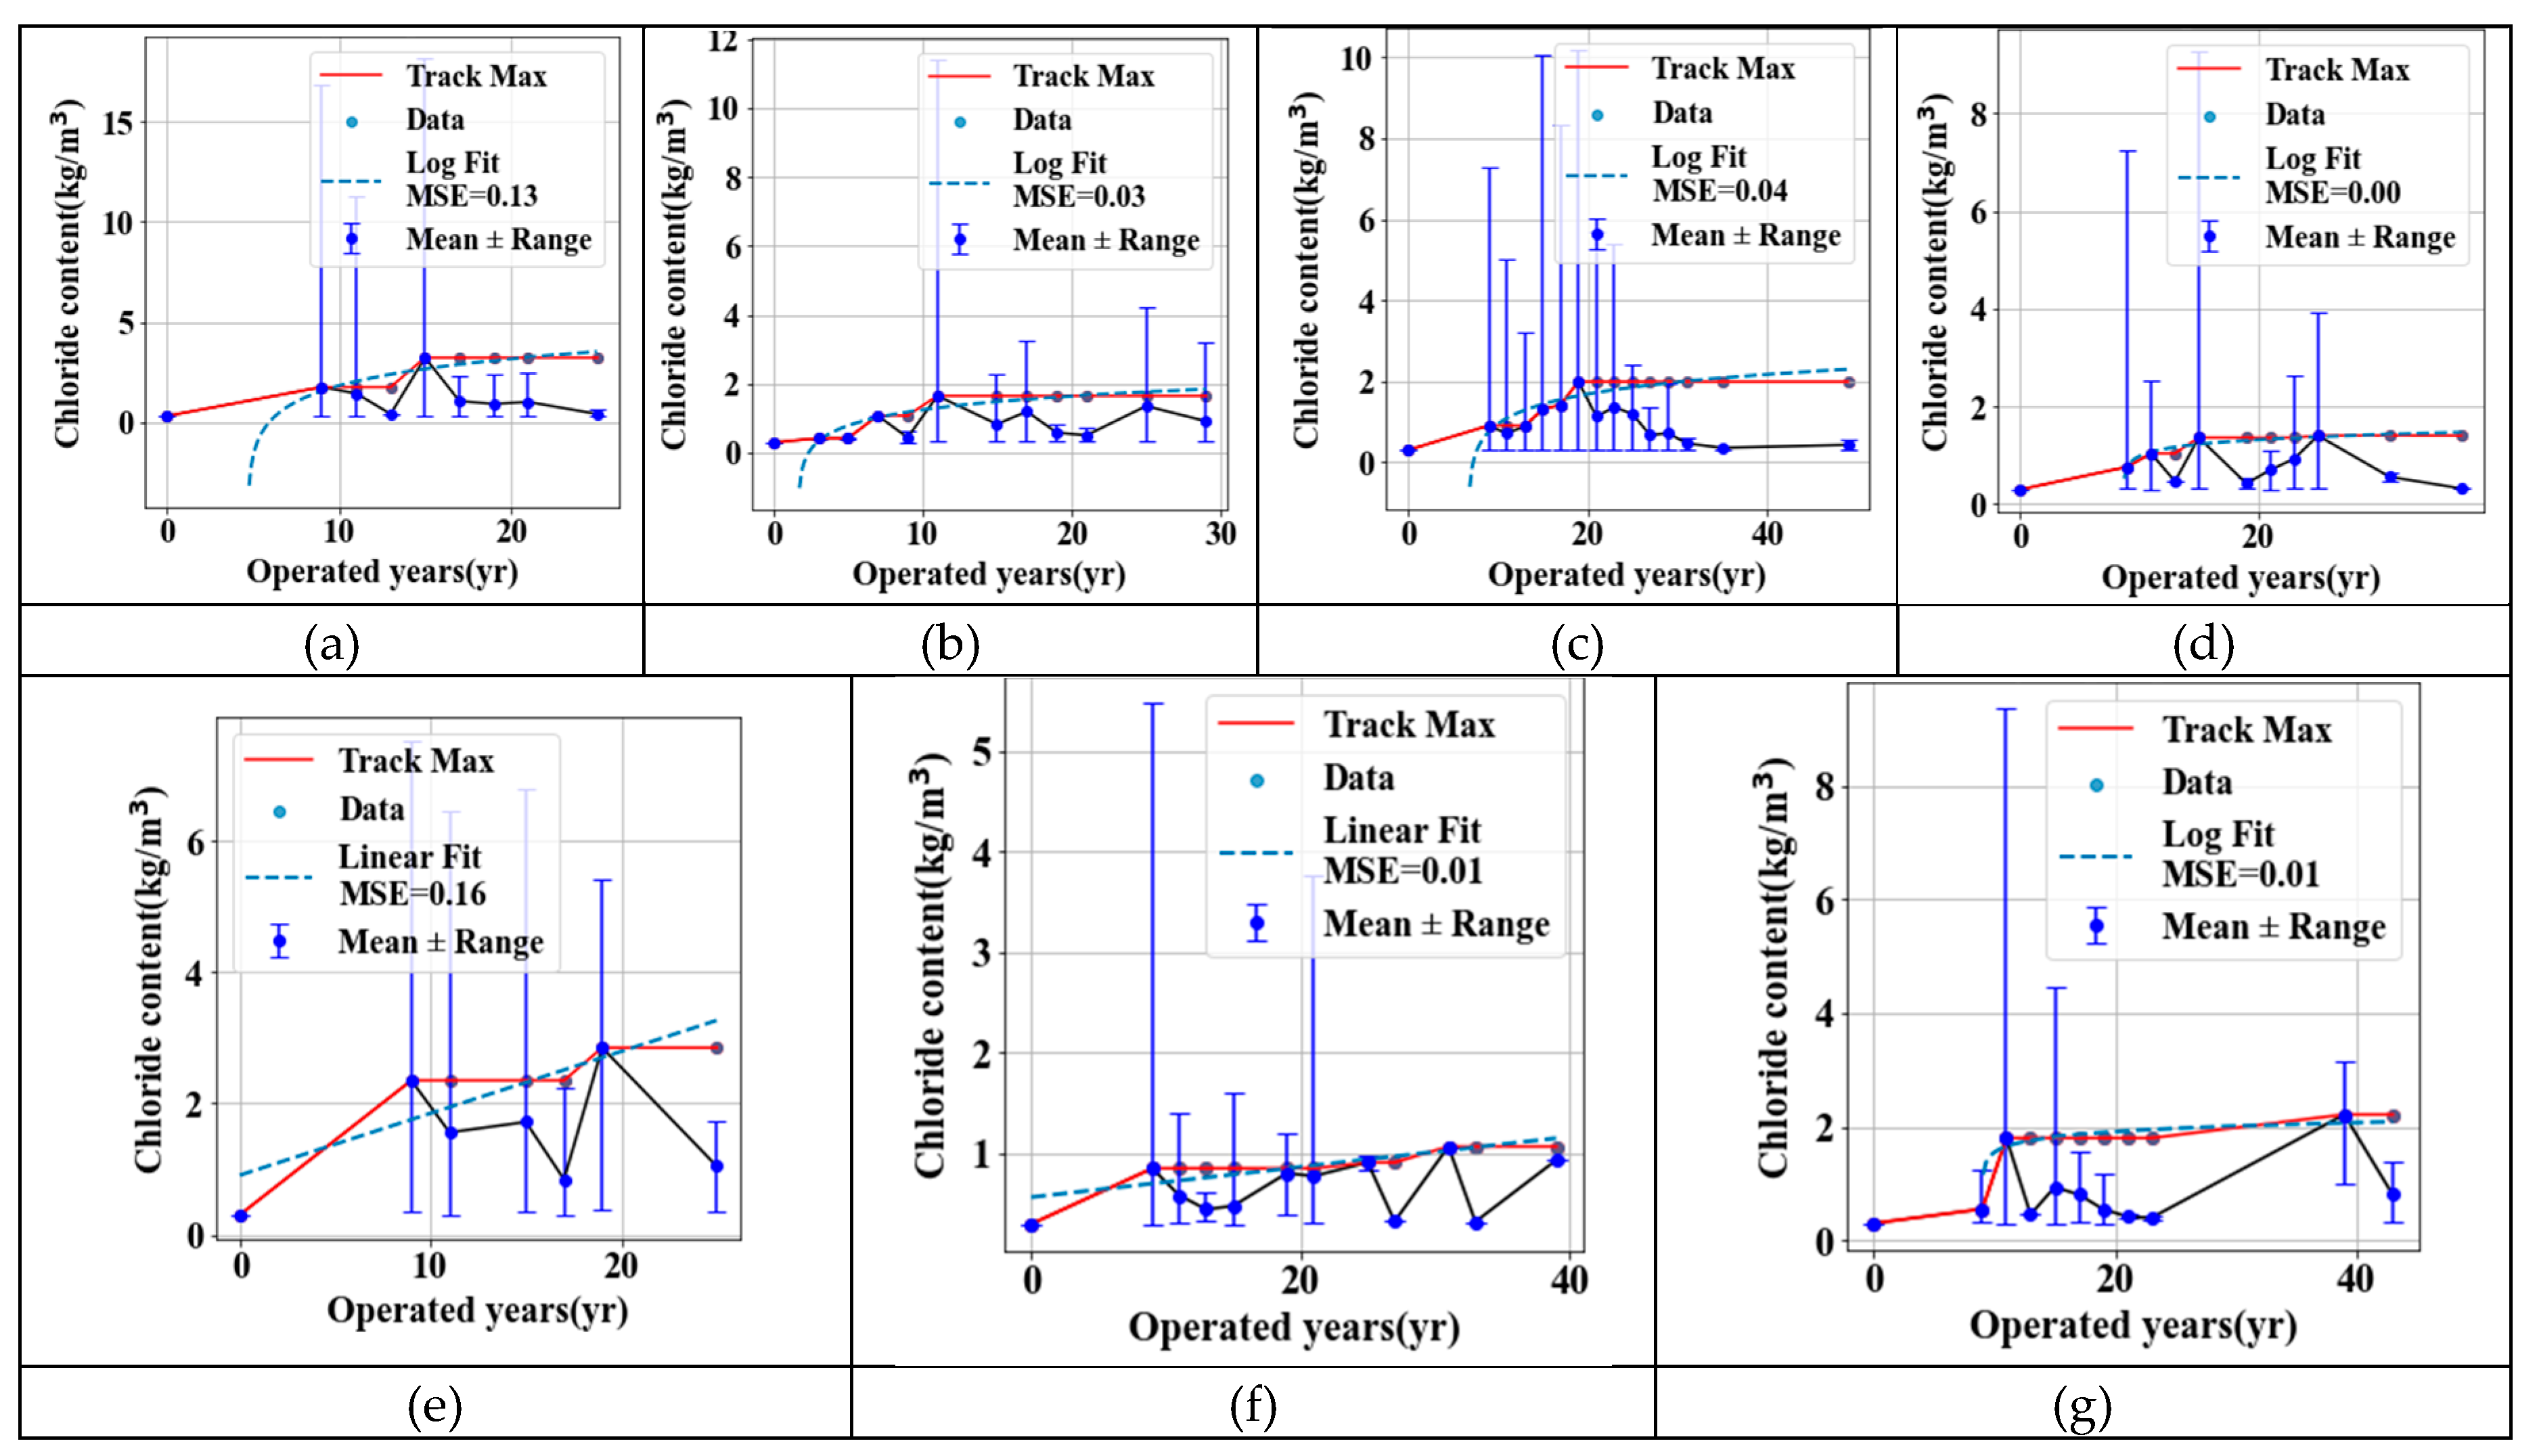
Figure 8.
Pipeline of classification ML model.
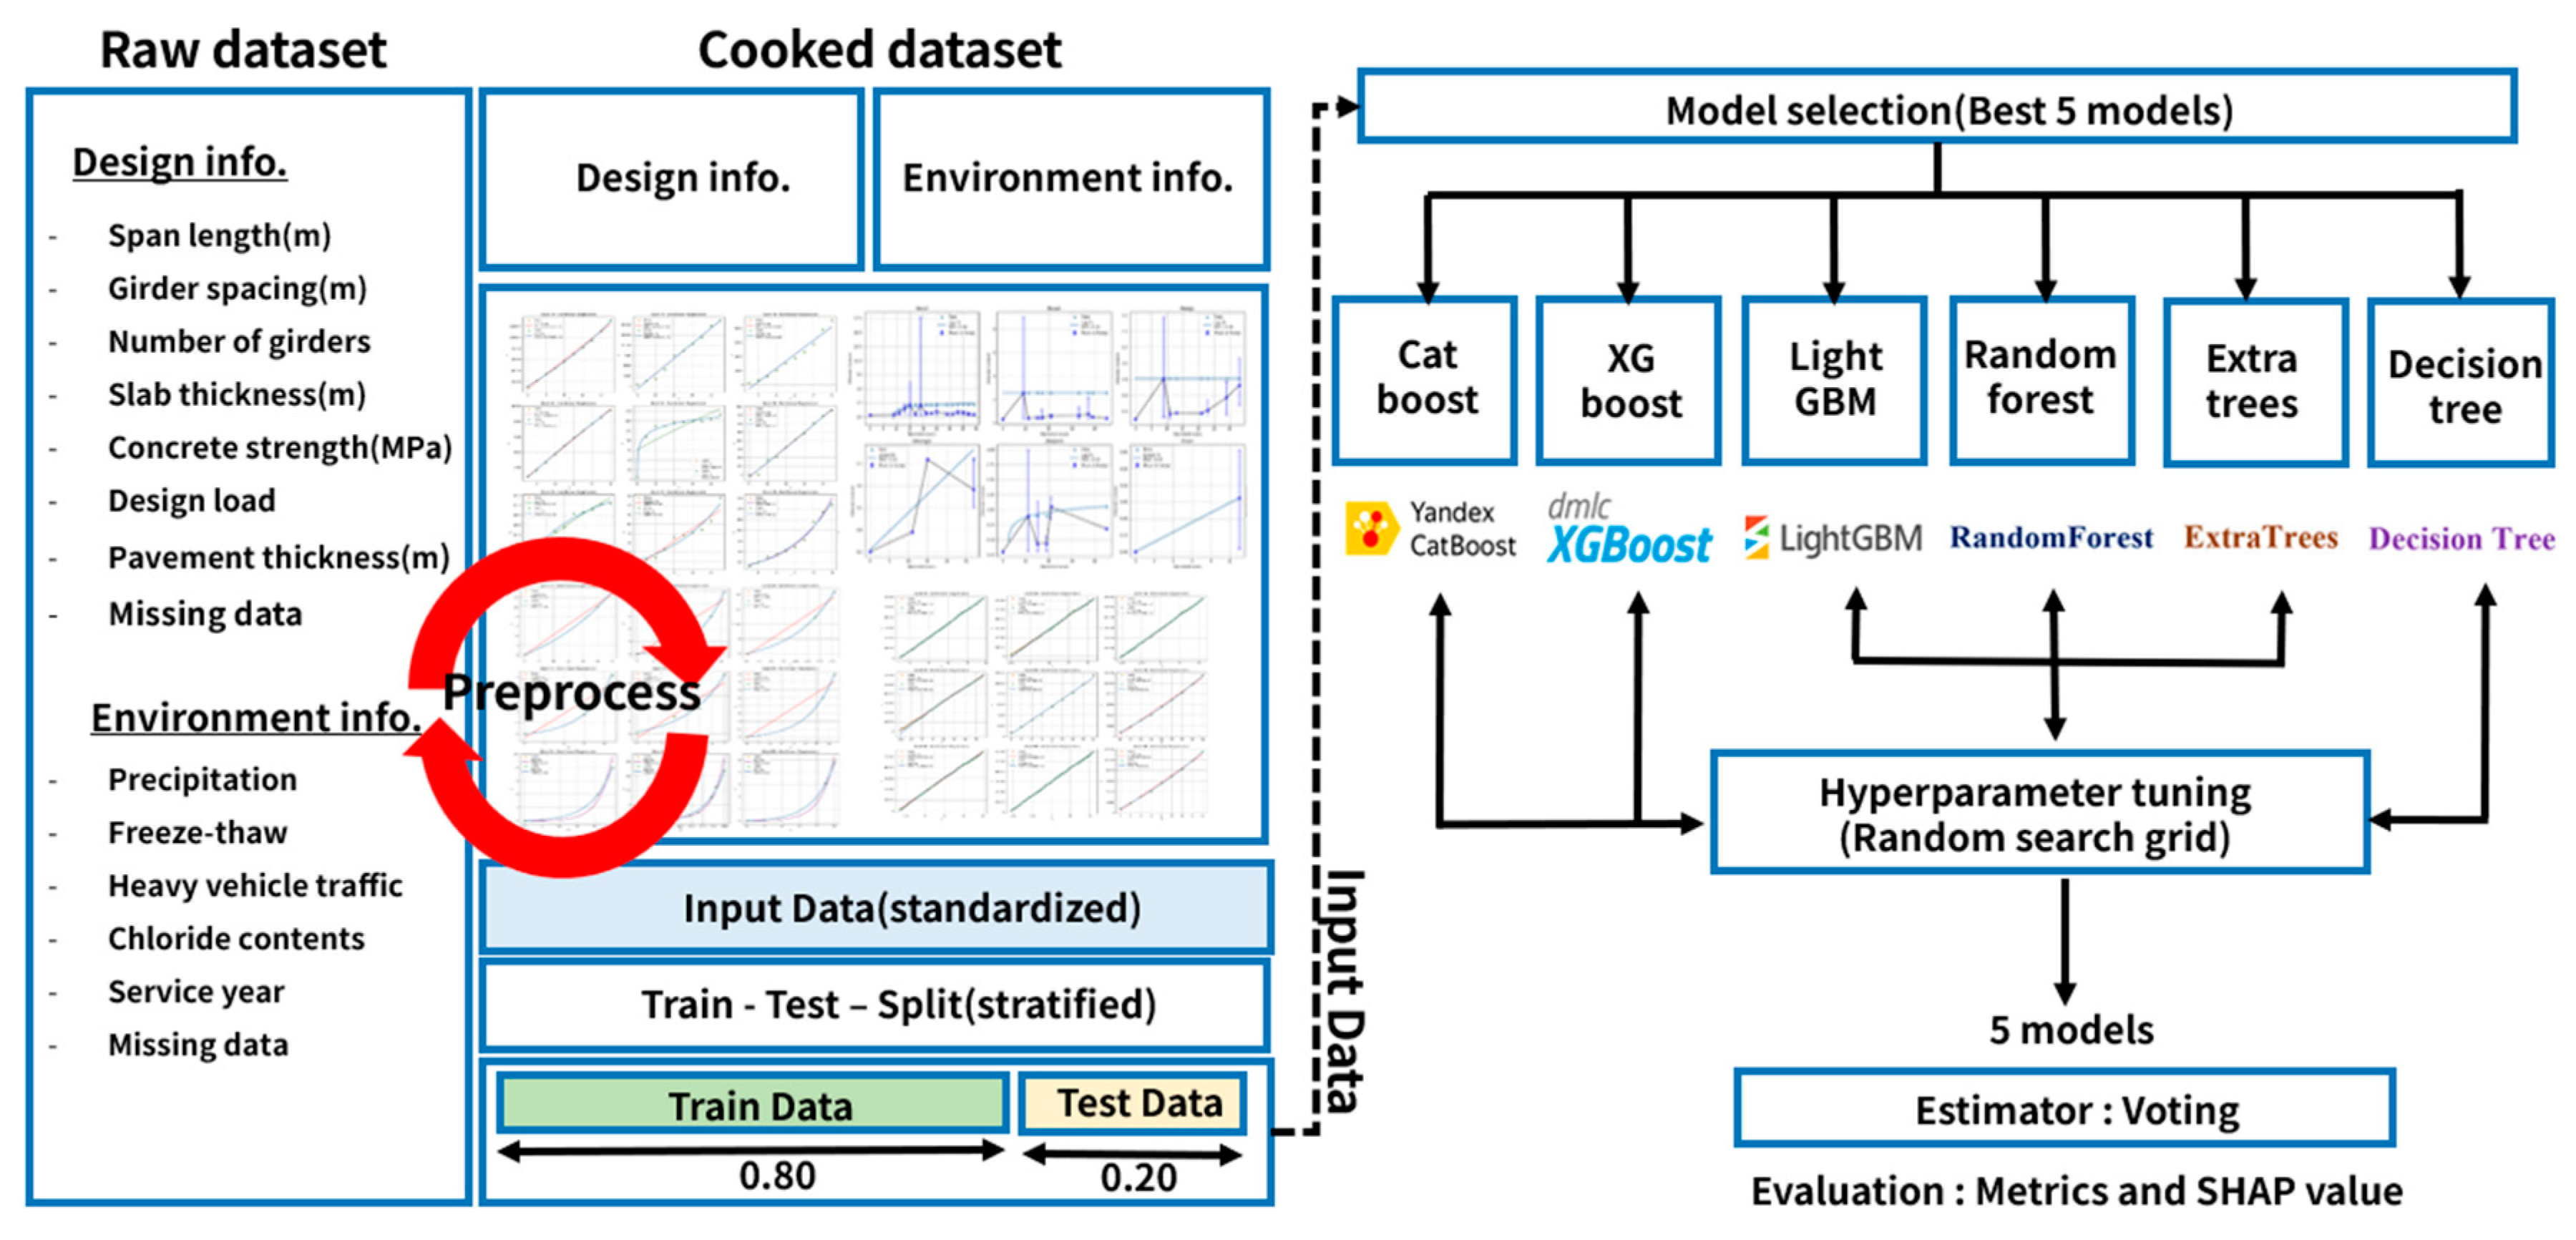
Figure 9.
SHAP value from AutoML classification (a) Xgboost (b) lightgbm (c) Catboost (d) Rf.
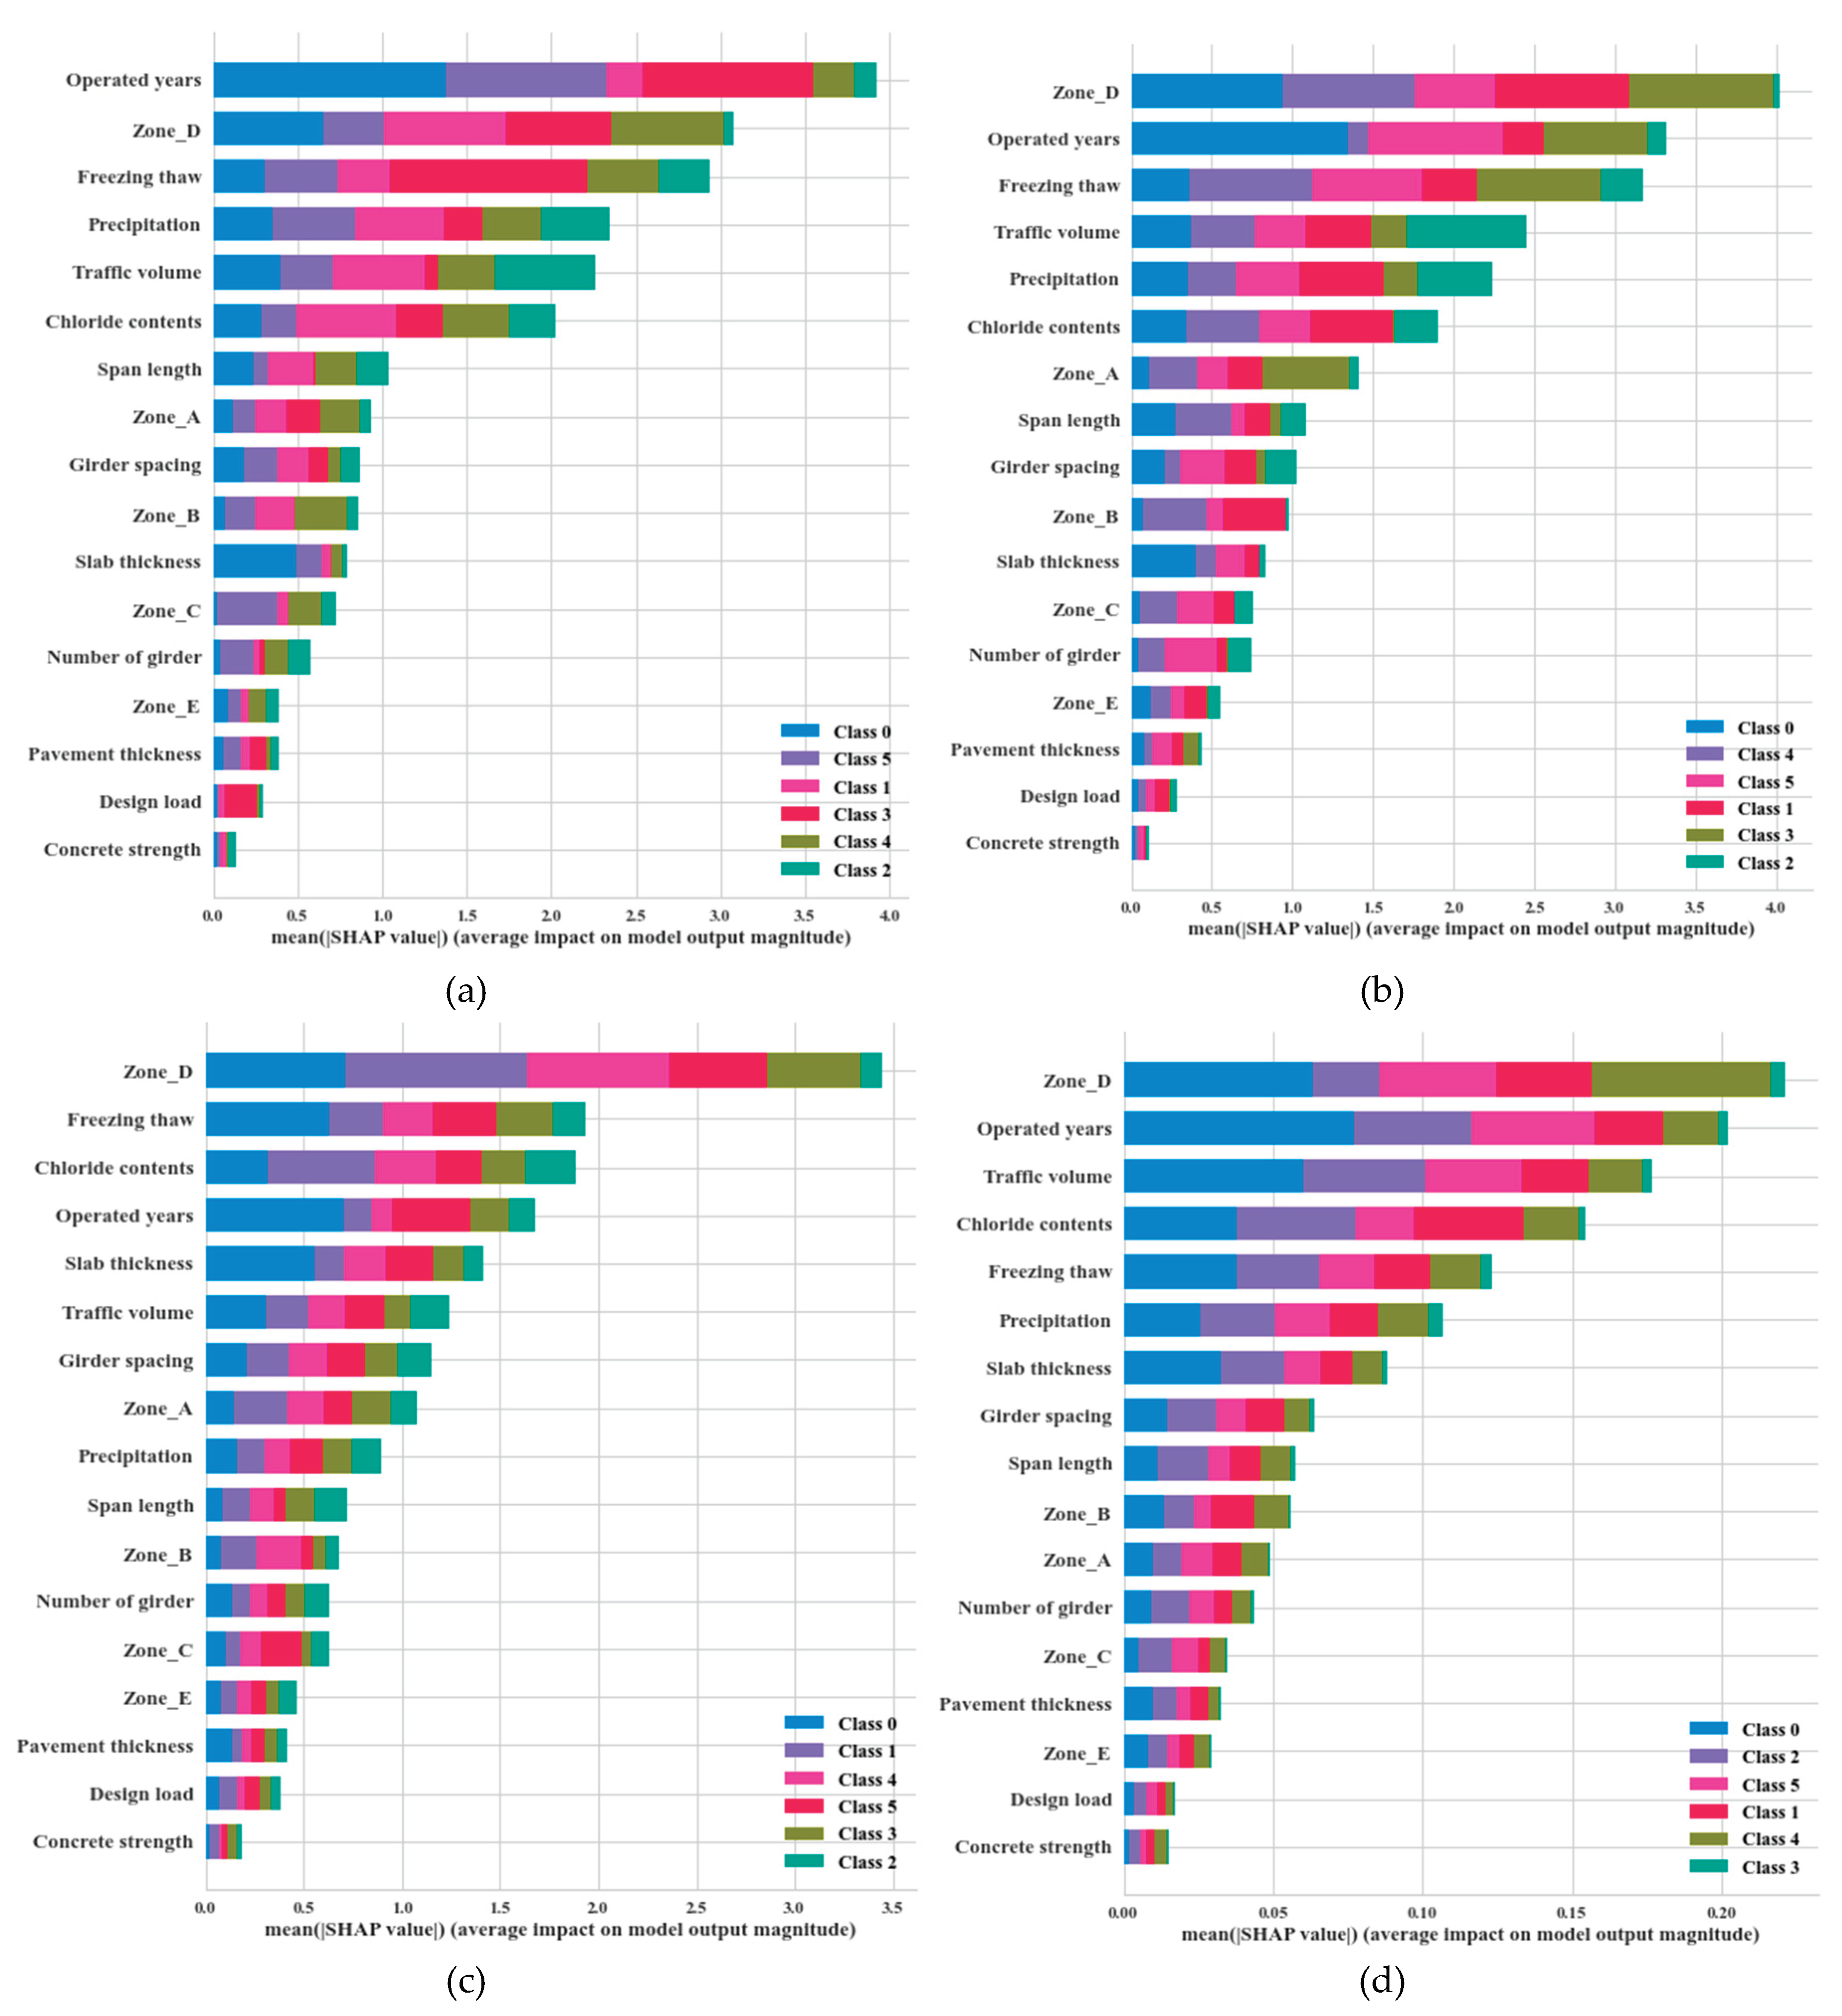
Figure 10.
Interpolated and extrapolated equations in cantilever zone (a) dataset (b) exponential graph (c) exponential trend (d) logarithmic trend.
Figure 10.
Interpolated and extrapolated equations in cantilever zone (a) dataset (b) exponential graph (c) exponential trend (d) logarithmic trend.
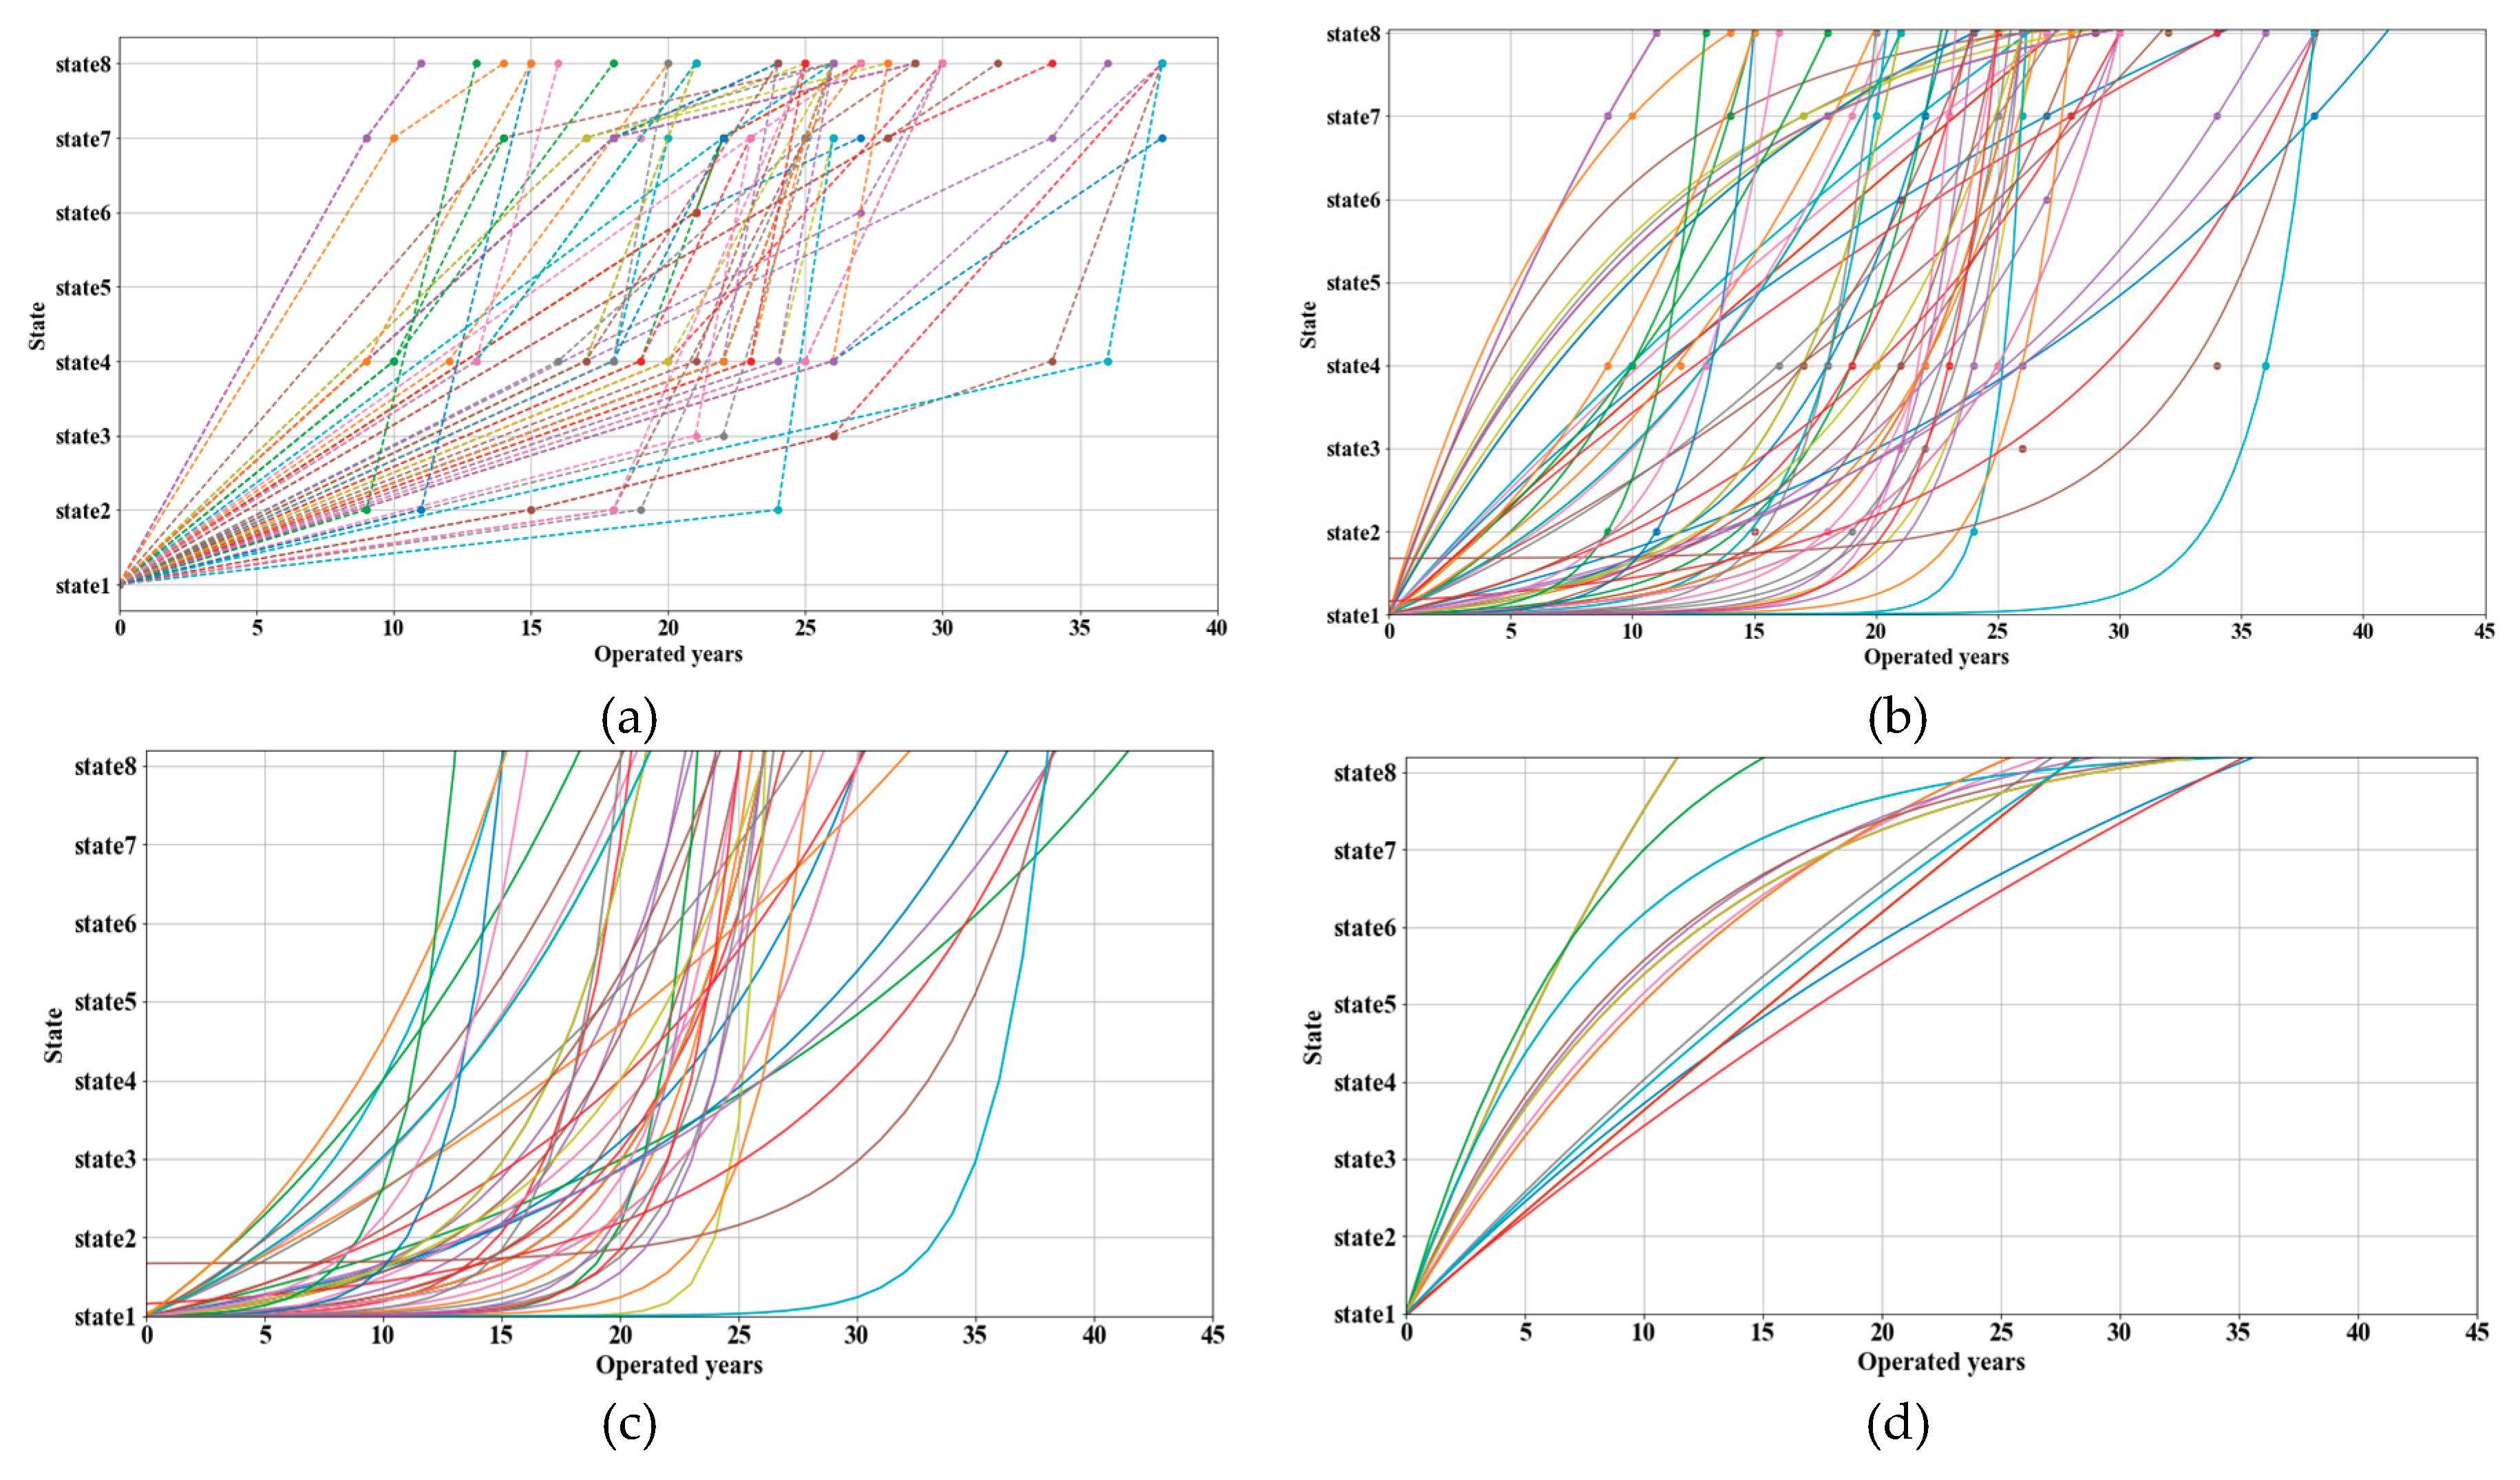
Figure 11.
Interpolated and extrapolated equations in moment zone (a) dataset (b) exponential graph (c) exponential trend (d) logarithmic trend.
Figure 11.
Interpolated and extrapolated equations in moment zone (a) dataset (b) exponential graph (c) exponential trend (d) logarithmic trend.
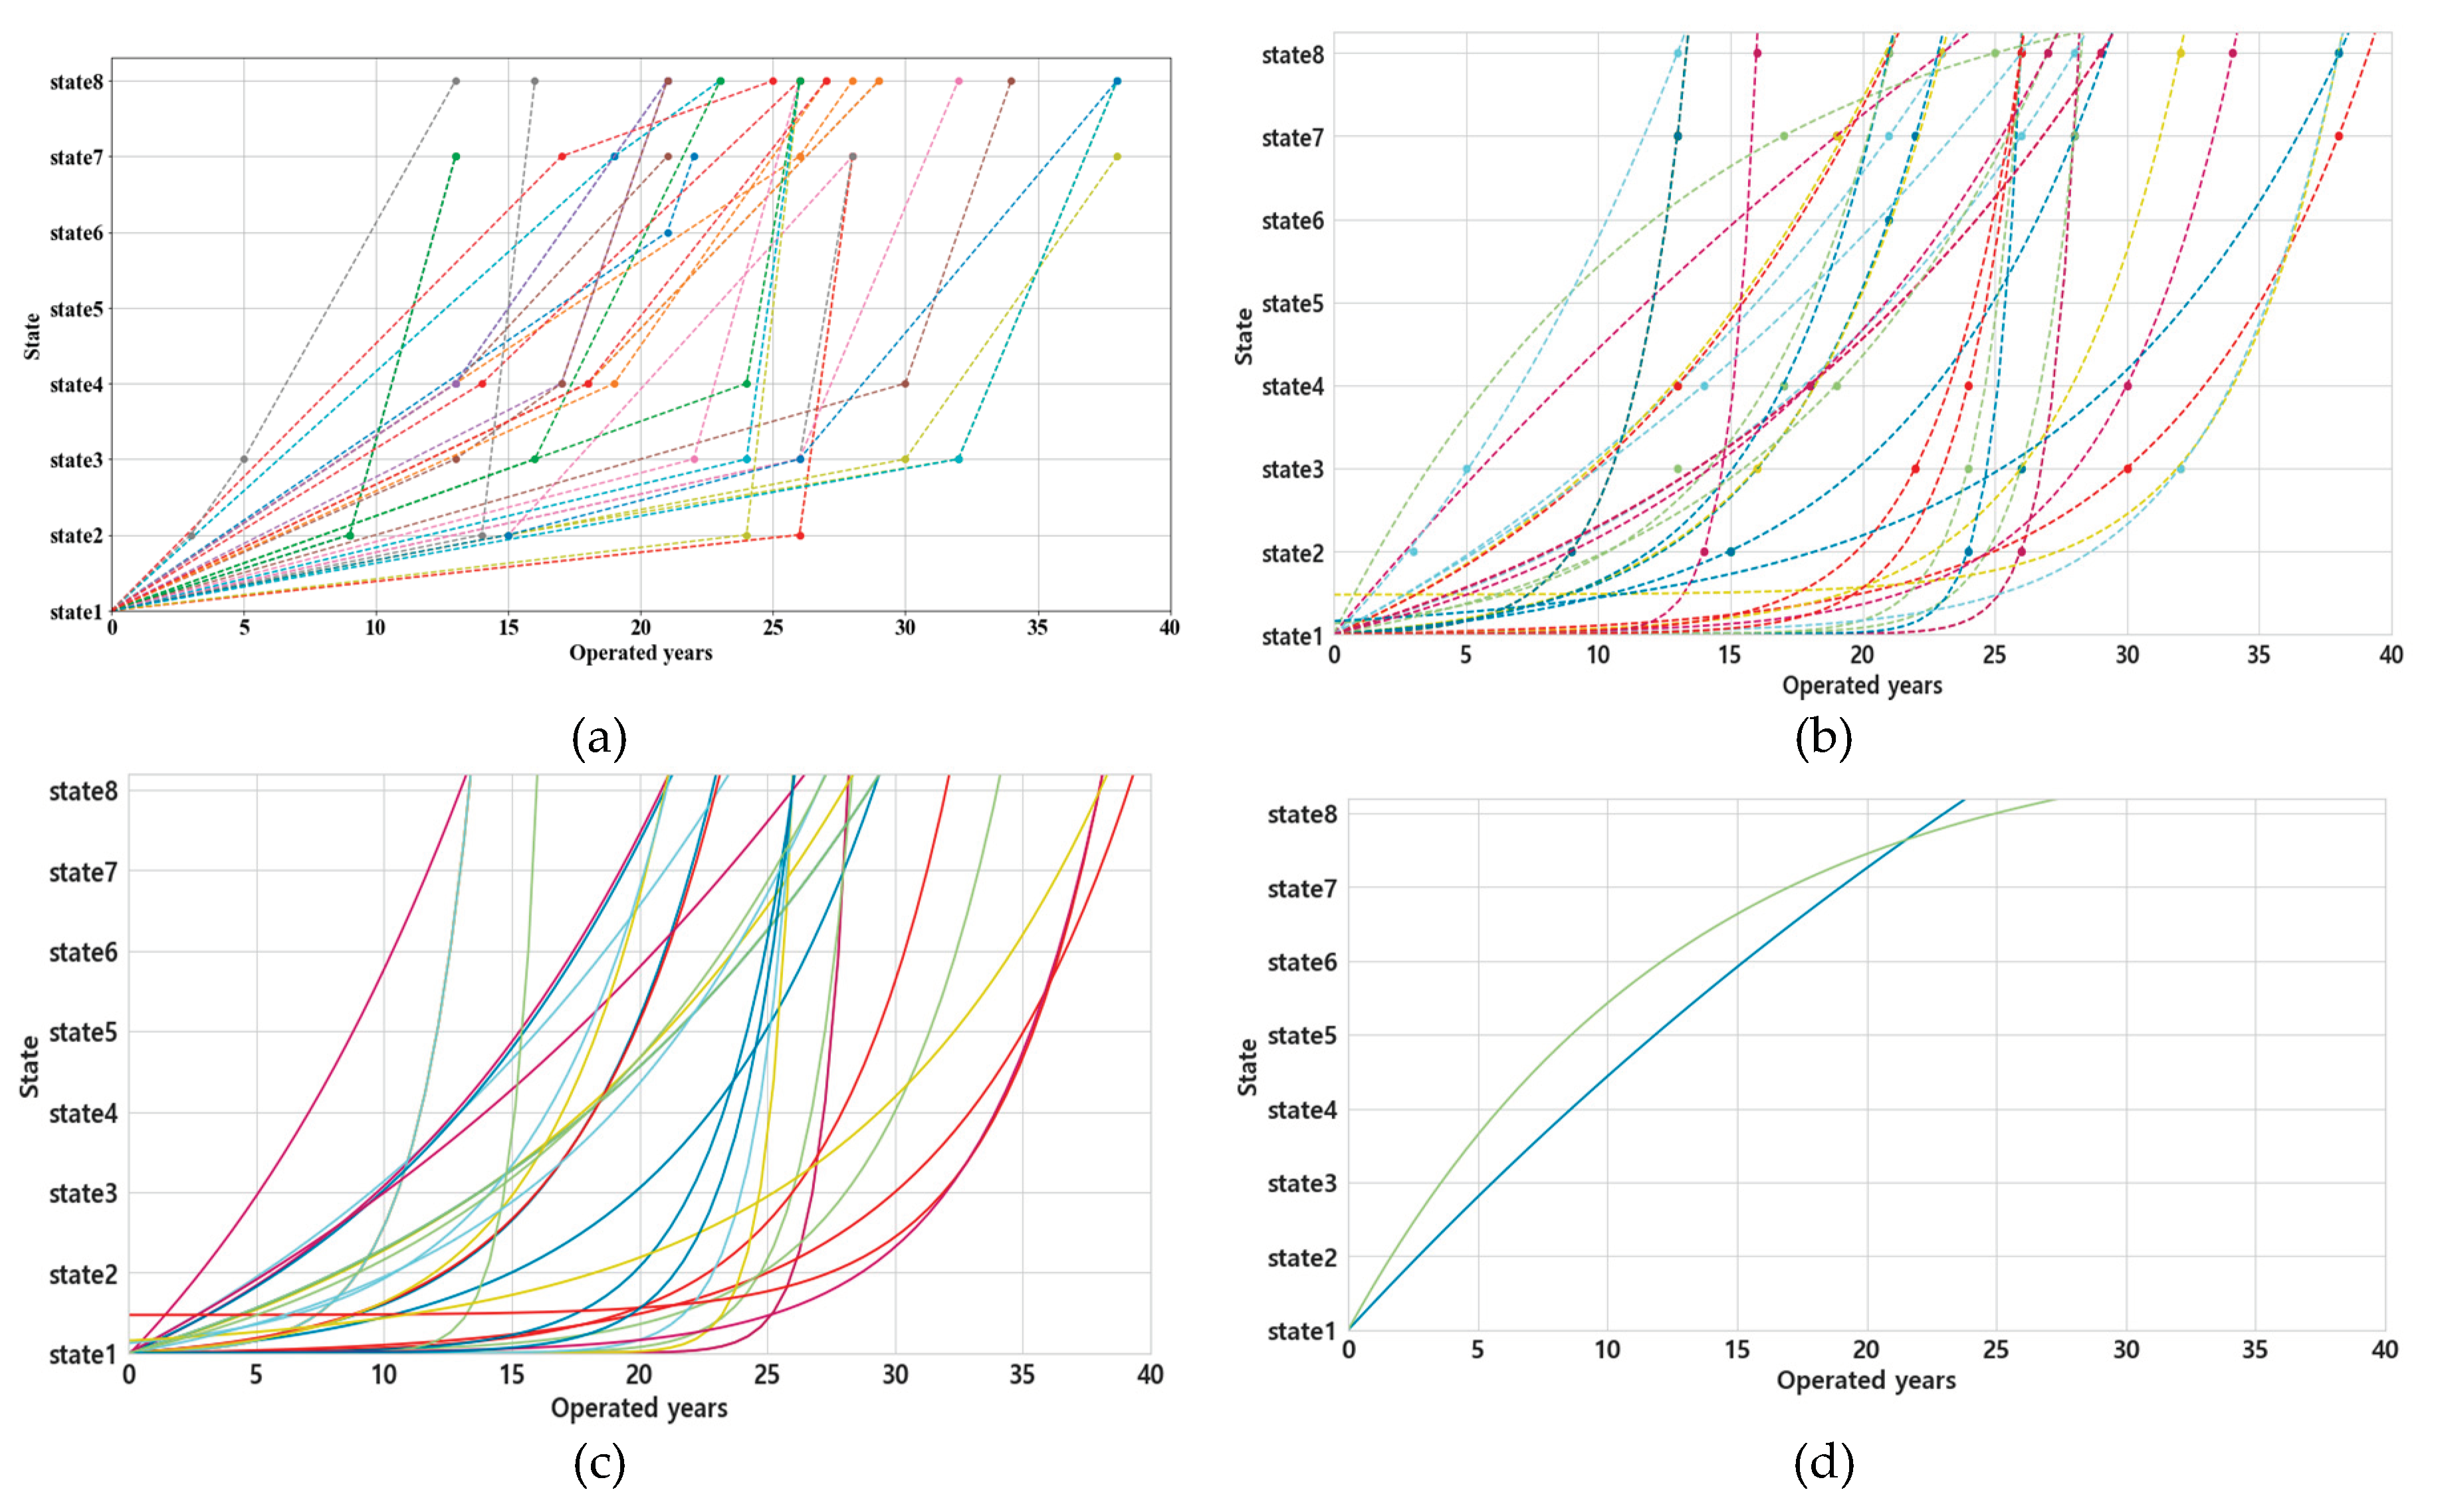
Figure 12.
Regression pipeline model.
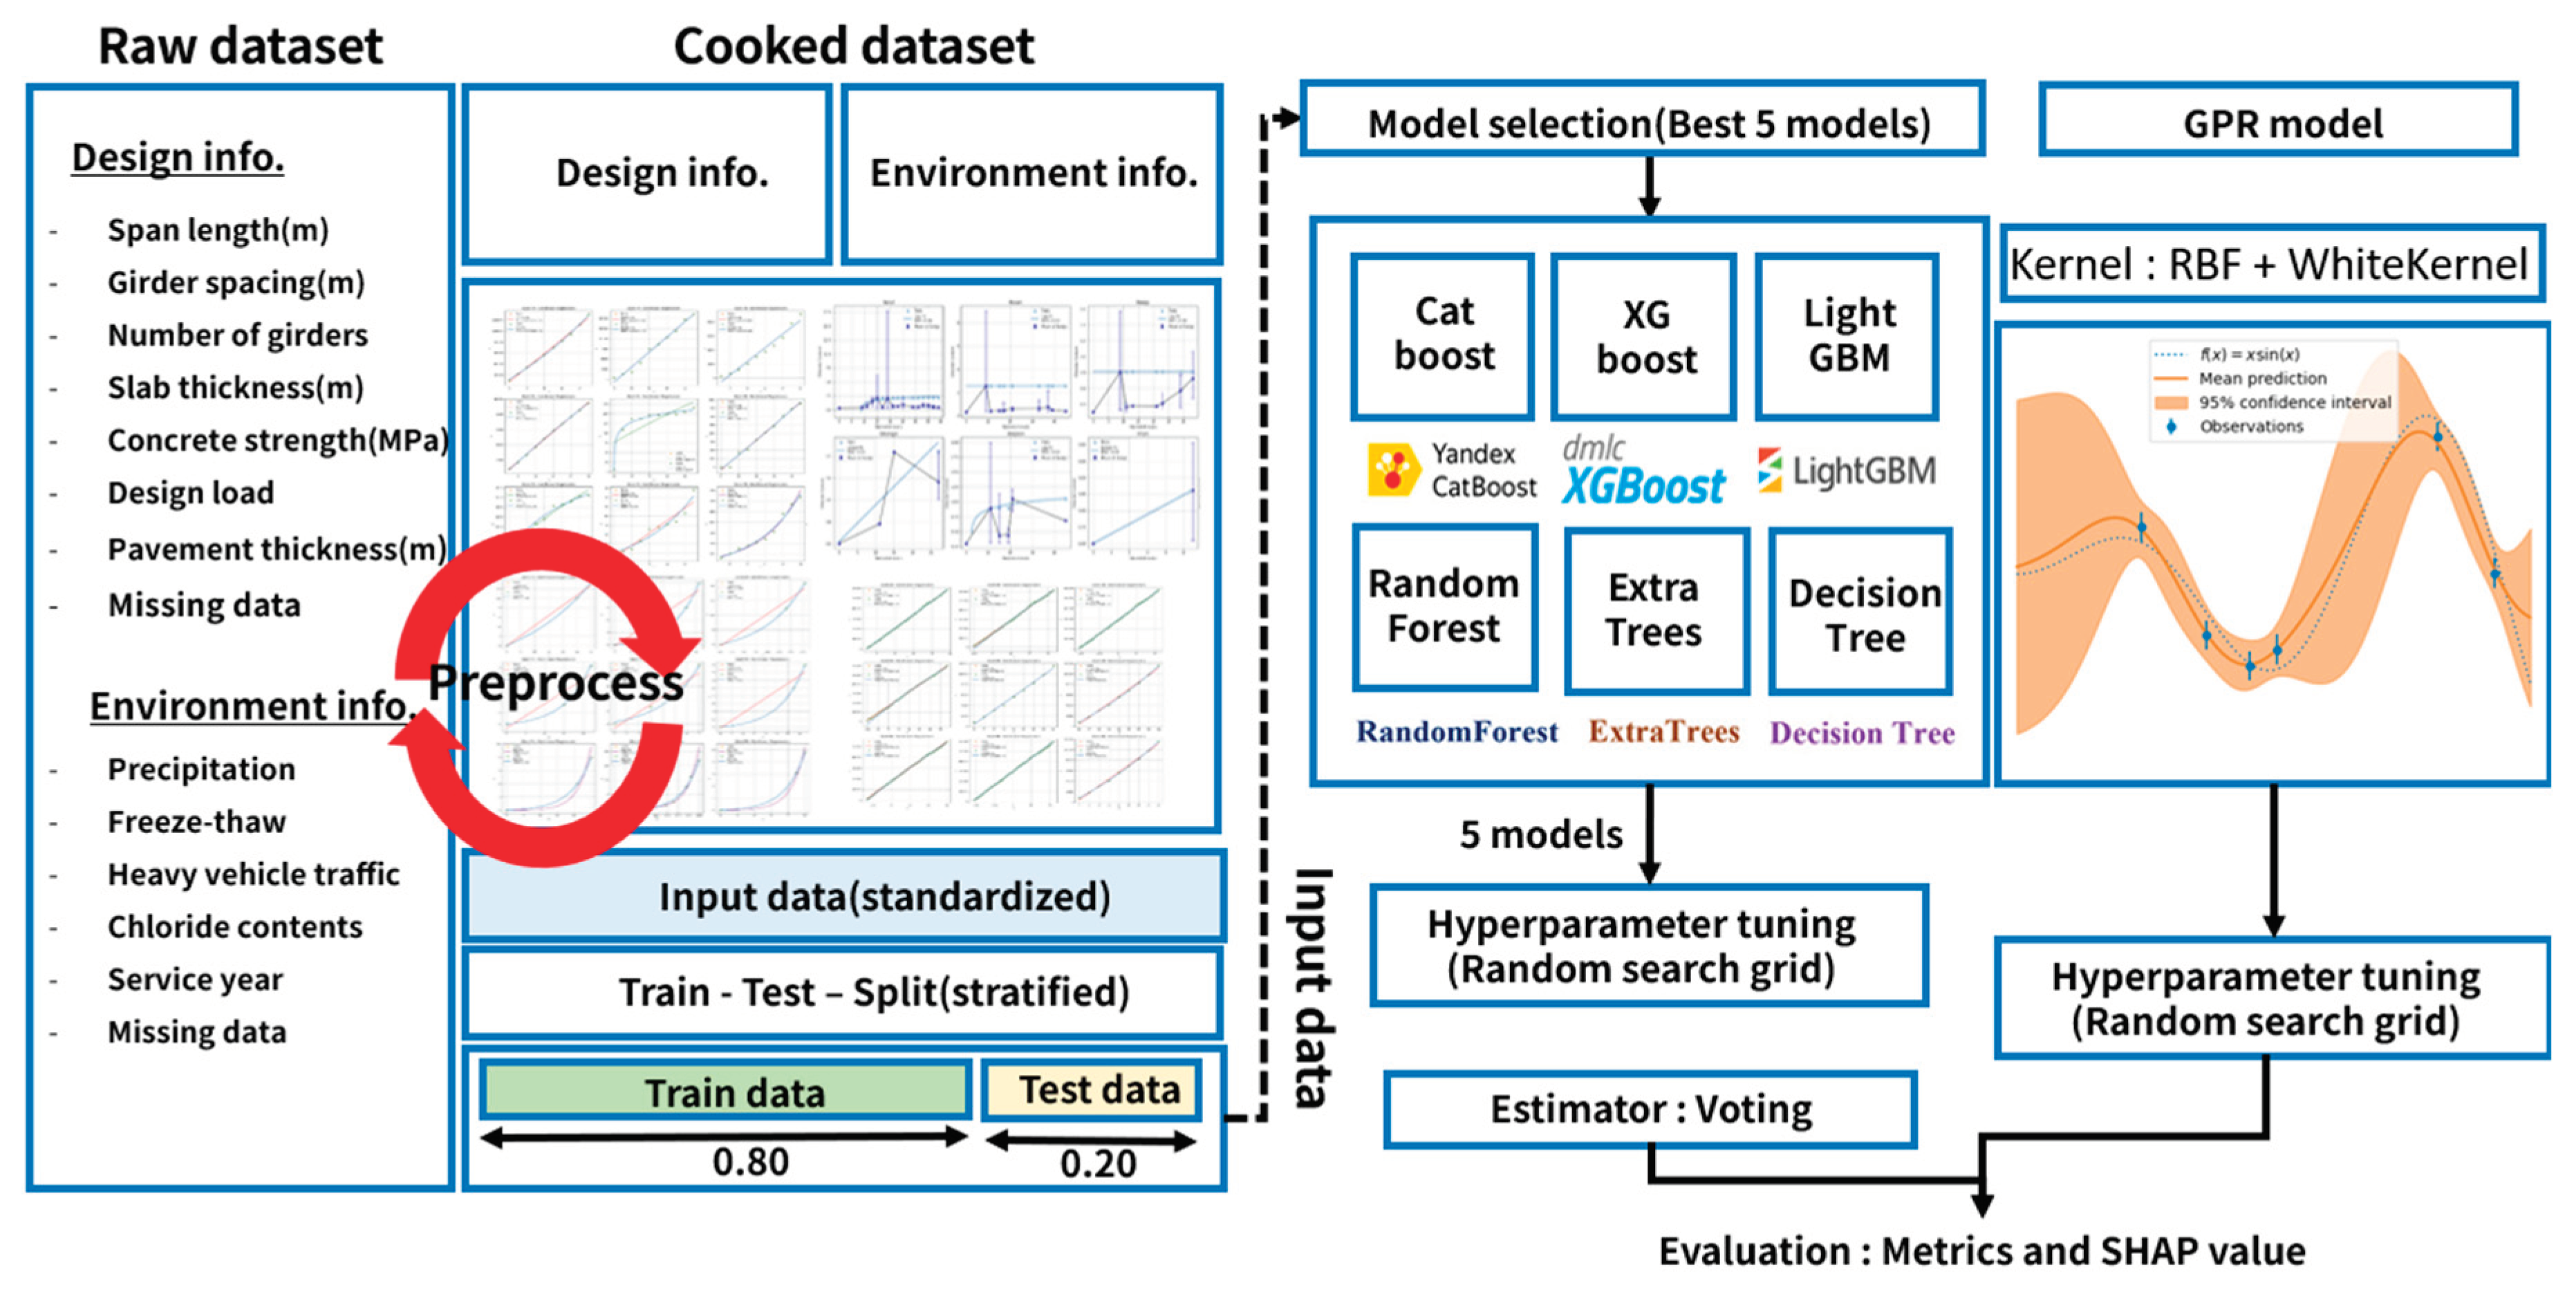
Figure 13.
Correlation matrix for dataset of each area (a) (b) (c).
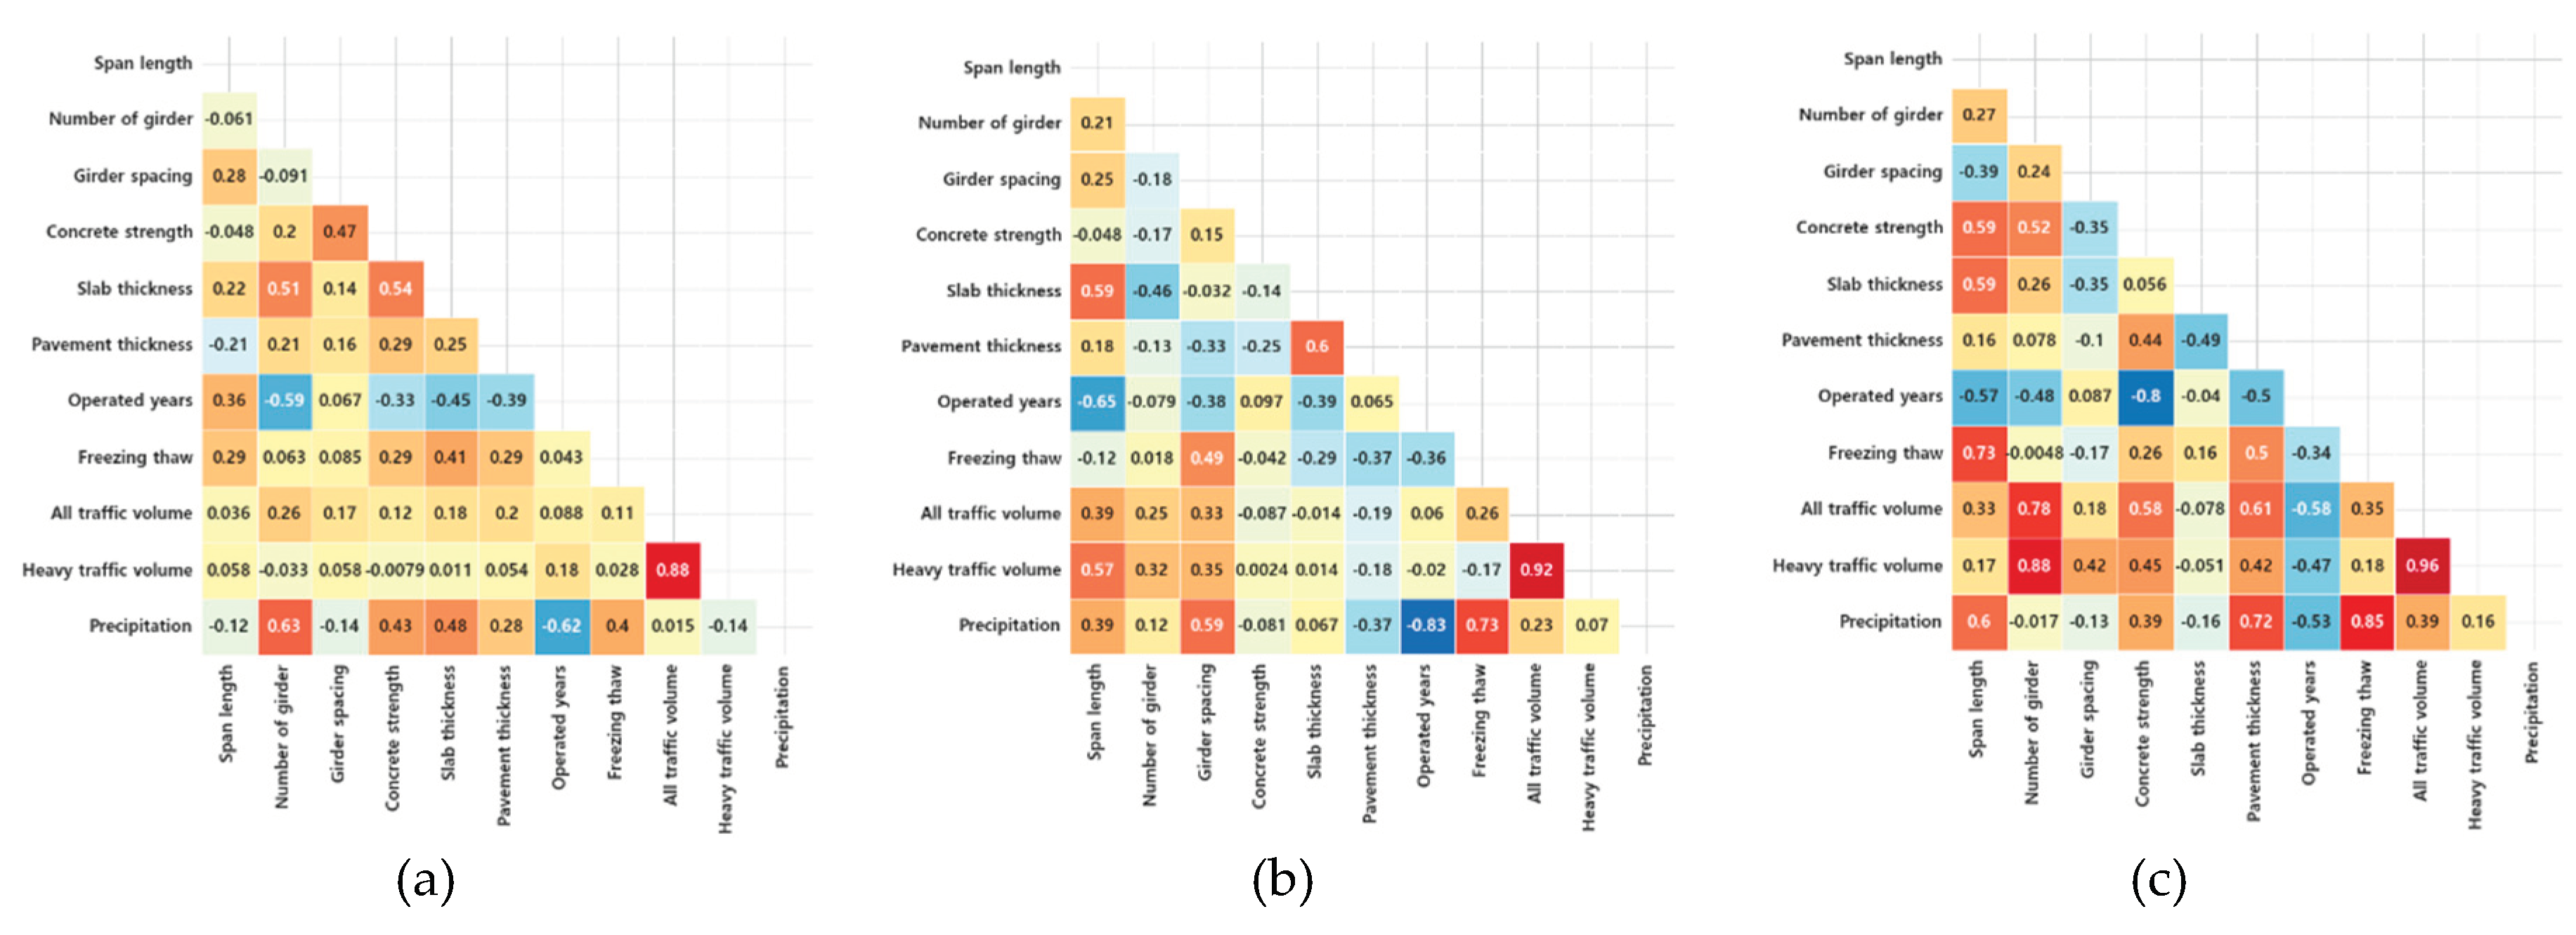
Figure 14.
Accuracy for phase 1 showing exponential trends in the moment zone (a) Comparison between target and predicted value of voting regressor (b) remainings for voting regressor (c) Comparison between target and predicted value of GPR.
Figure 14.
Accuracy for phase 1 showing exponential trends in the moment zone (a) Comparison between target and predicted value of voting regressor (b) remainings for voting regressor (c) Comparison between target and predicted value of GPR.
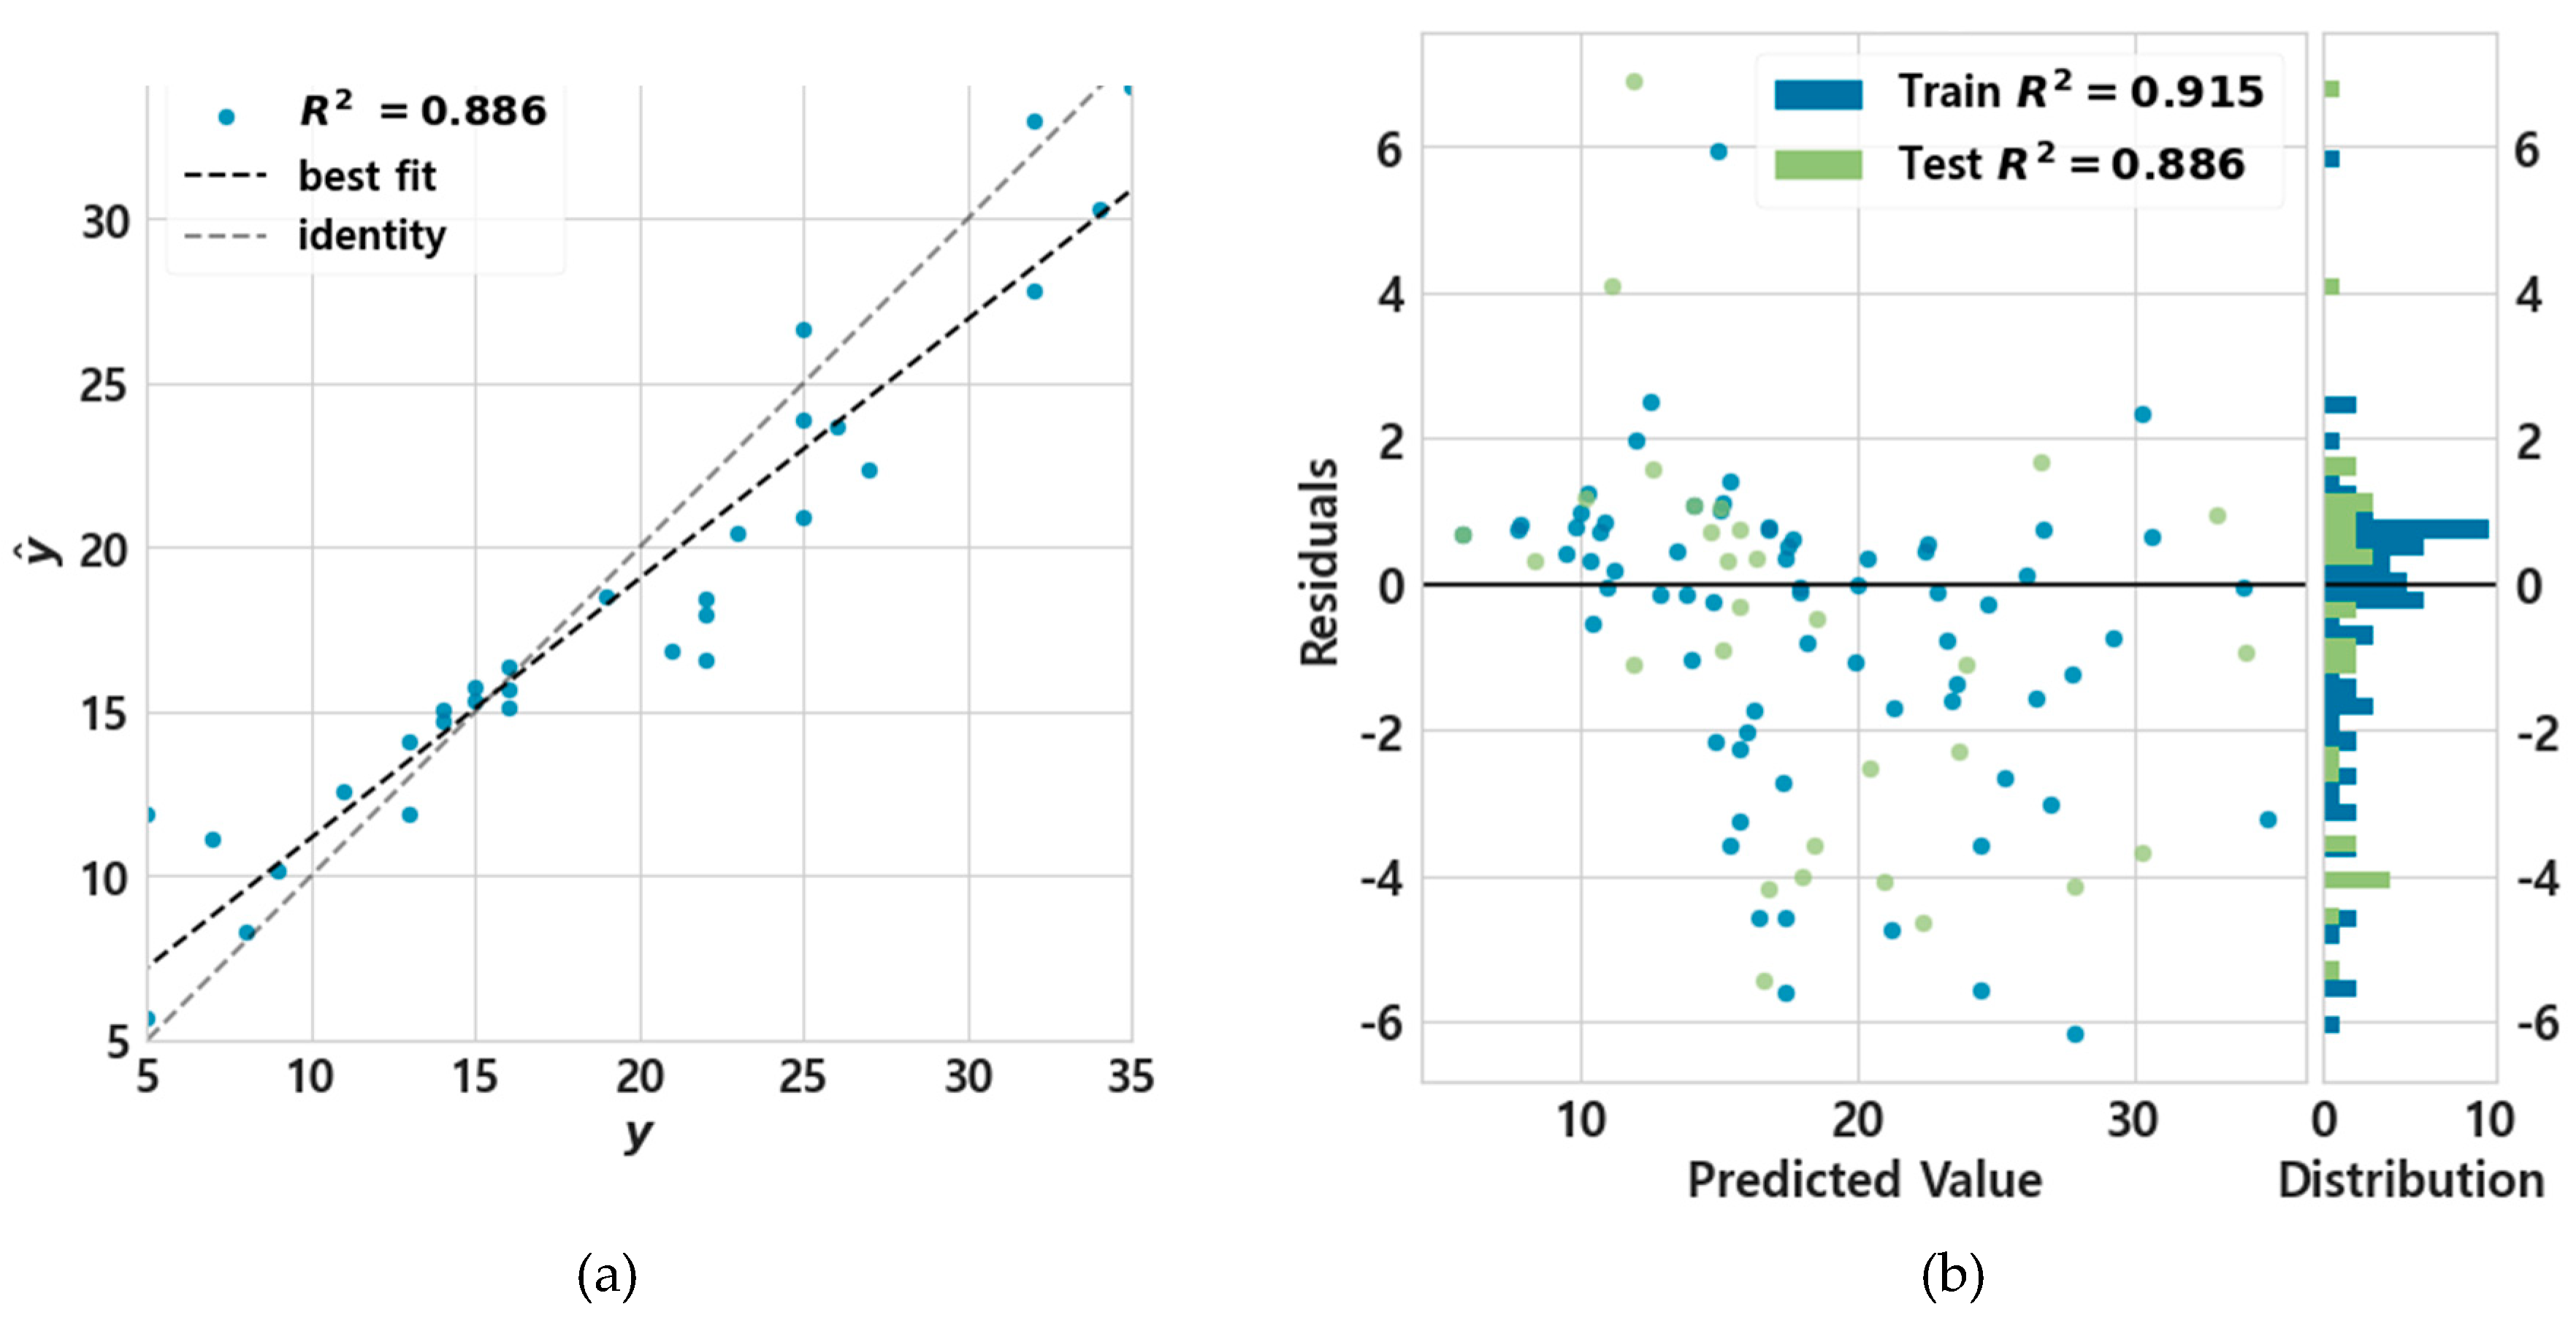
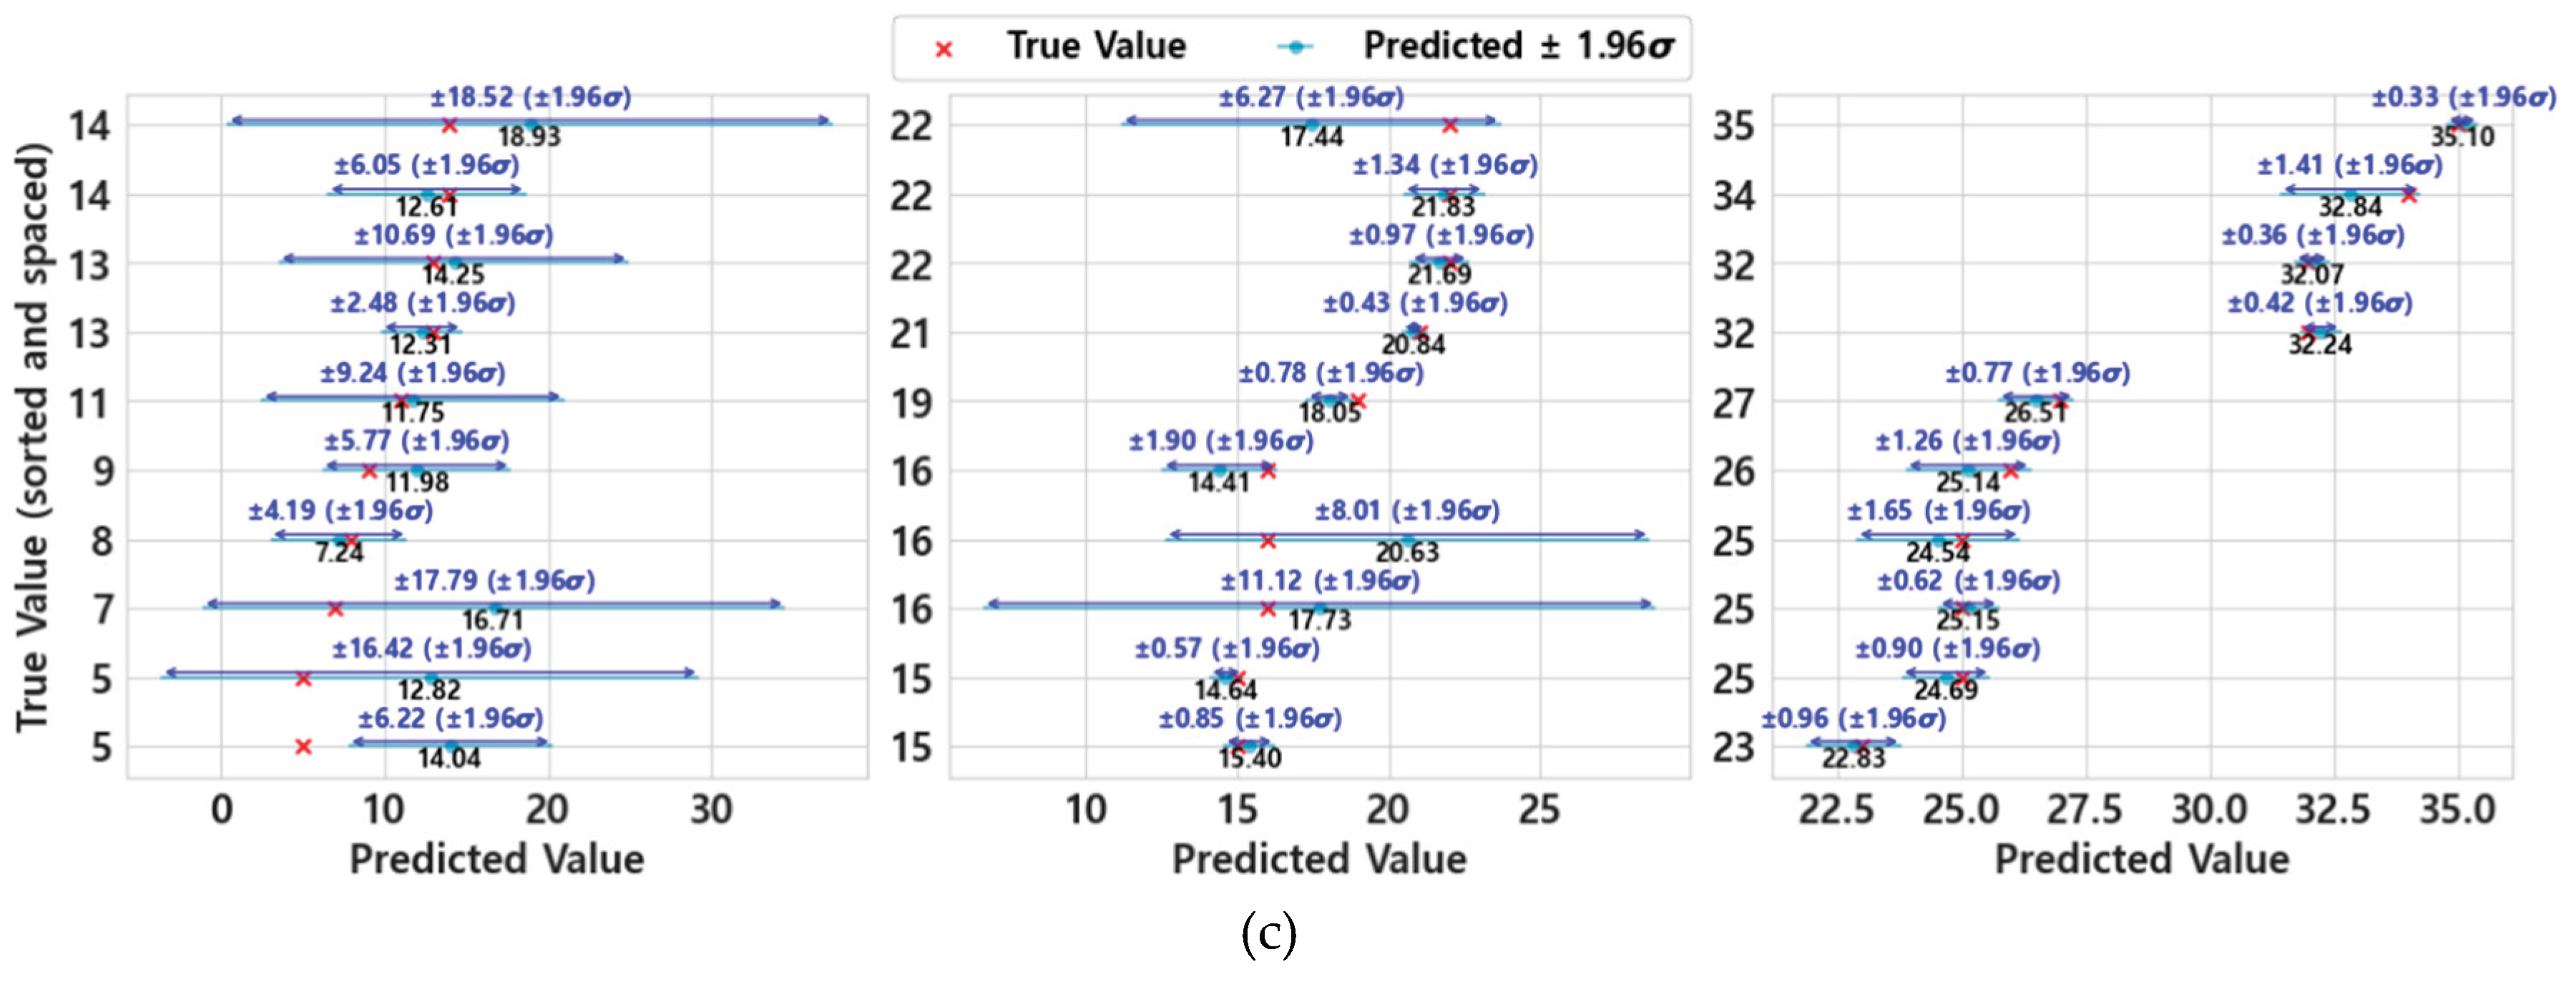
Figure 15.
SHAP value for phase 1 showing exponential trends in the moment zone (a) Catboost (b)Rf (c)Et (d)Xgboost (e) GPR.
Figure 15.
SHAP value for phase 1 showing exponential trends in the moment zone (a) Catboost (b)Rf (c)Et (d)Xgboost (e) GPR.
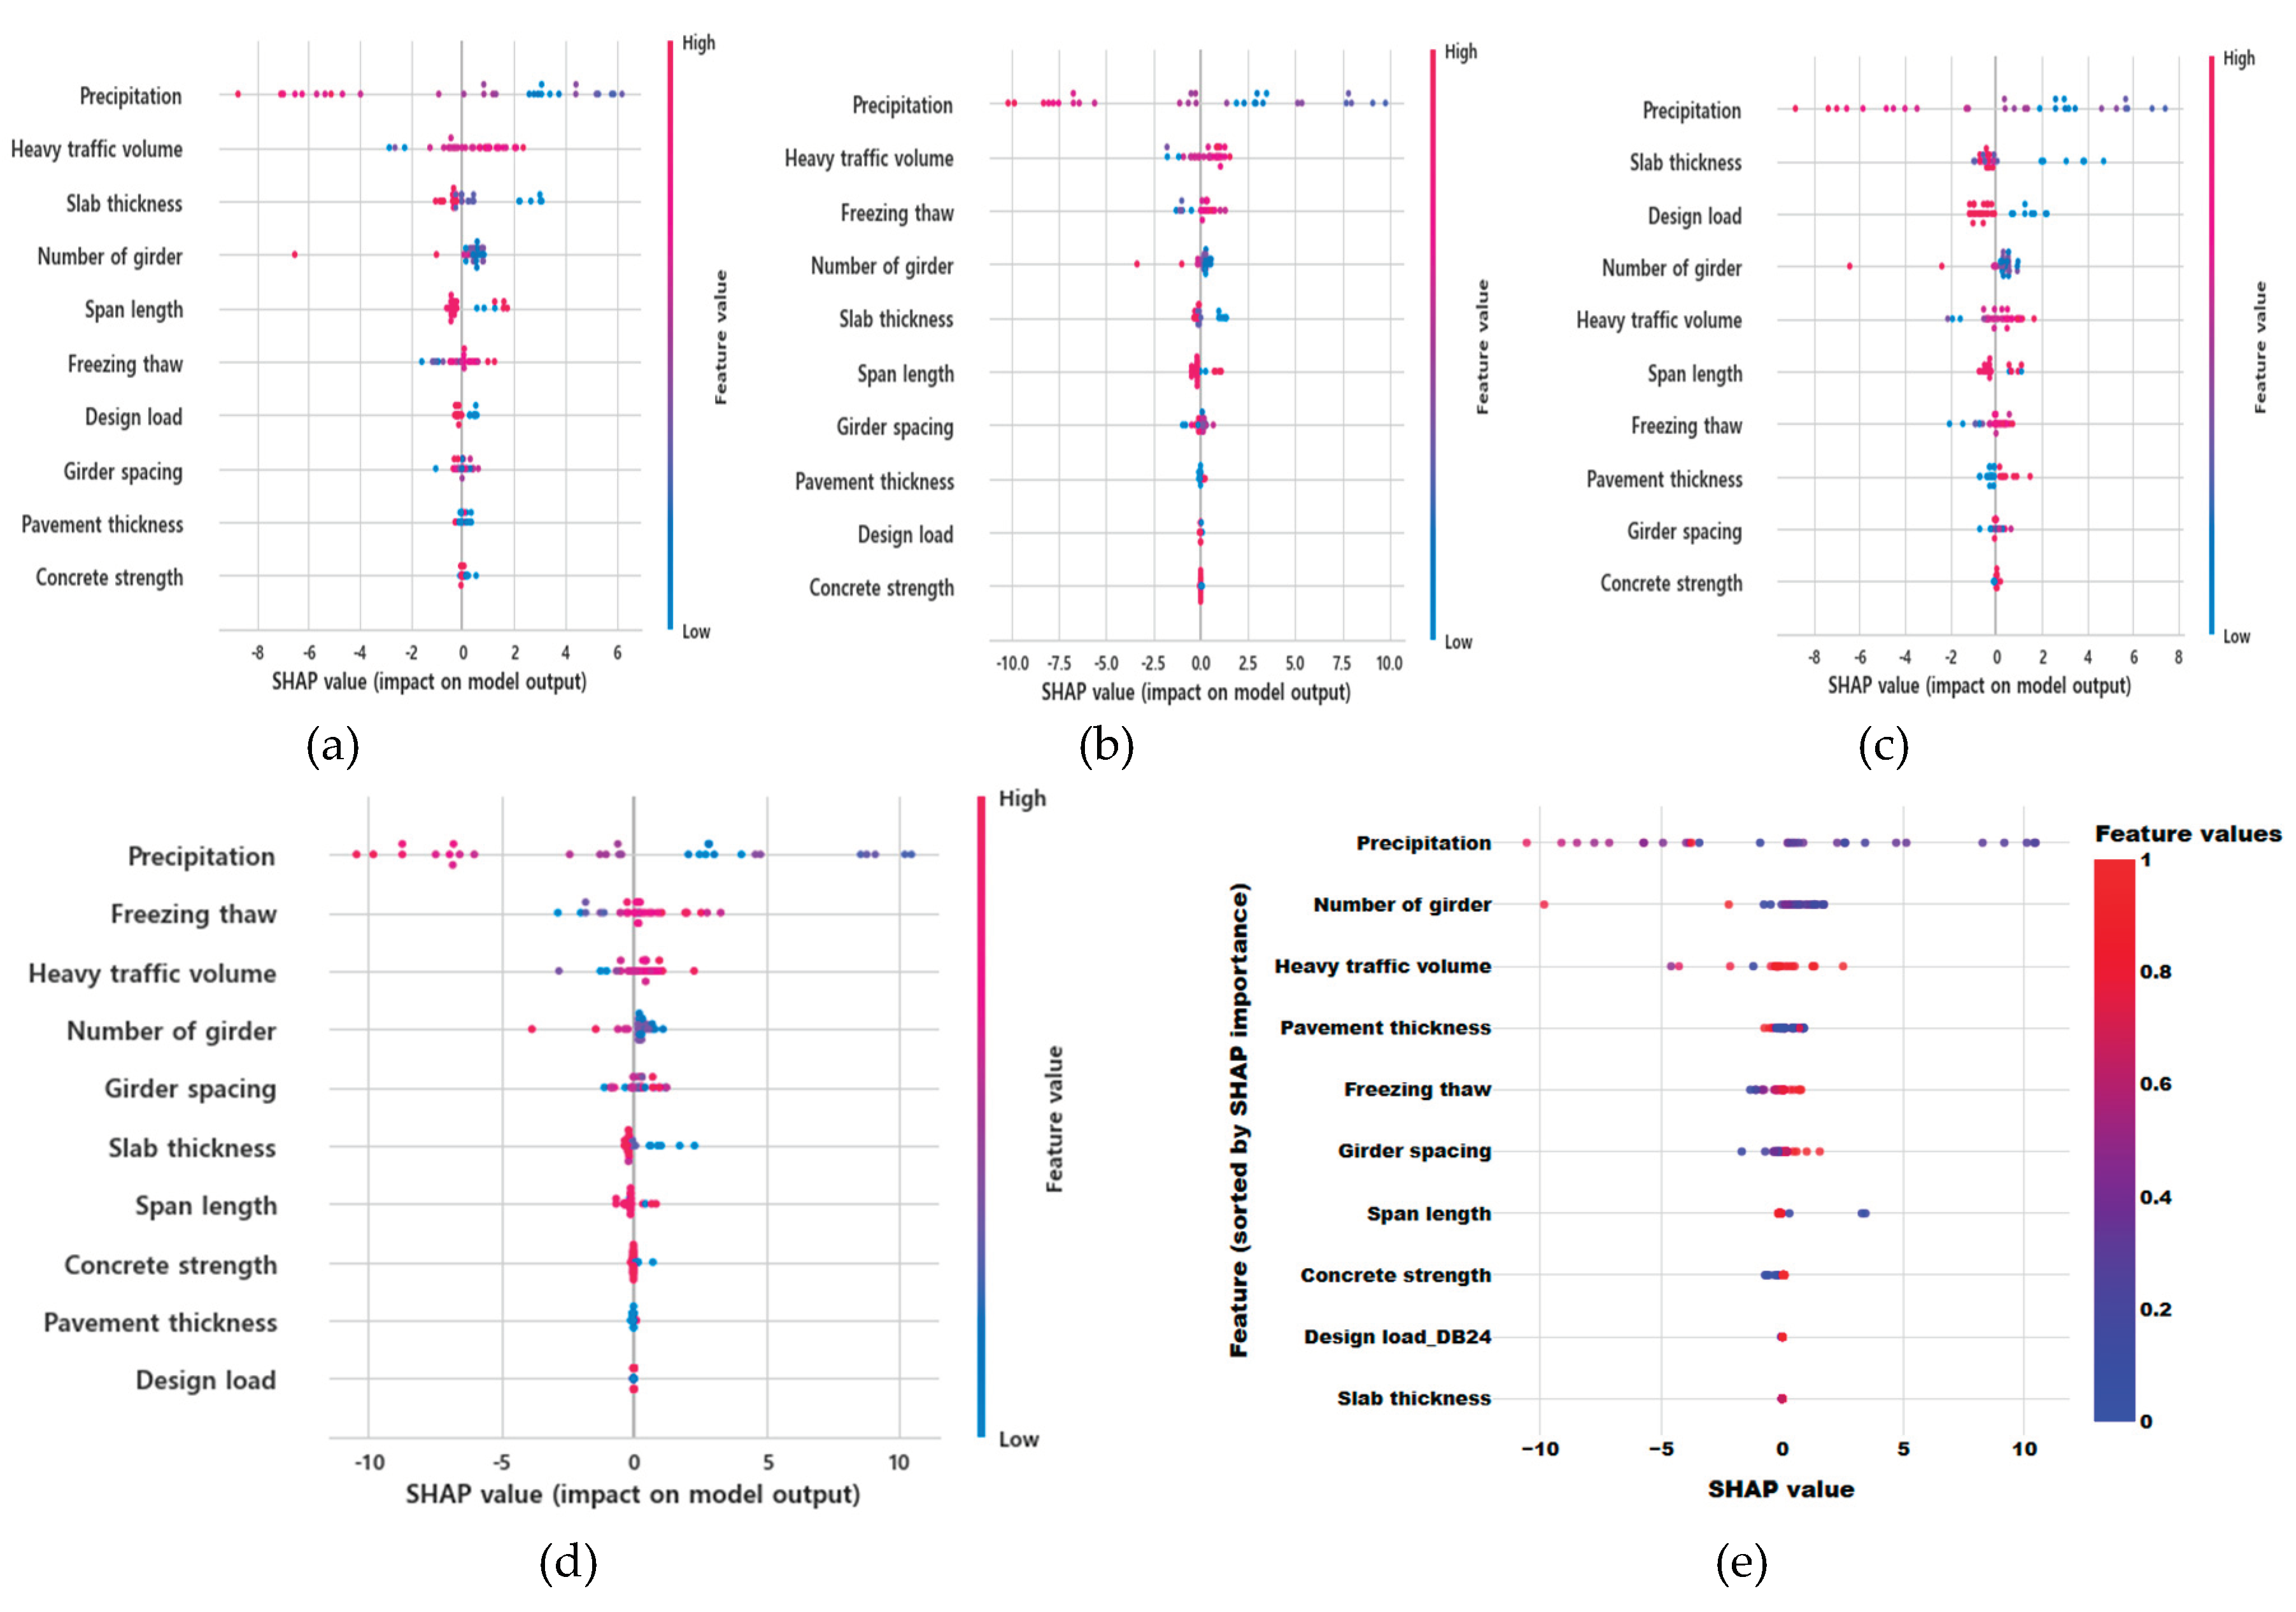
Figure 16.
Results of the ML model for phase 2,3 showing exponential trends in the moment zone (a) predicted value for phase 2 (b) SHAP value for phase2 (c) predicted value for phase 3 (d) SHAP value for phase3.
Figure 16.
Results of the ML model for phase 2,3 showing exponential trends in the moment zone (a) predicted value for phase 2 (b) SHAP value for phase2 (c) predicted value for phase 3 (d) SHAP value for phase3.
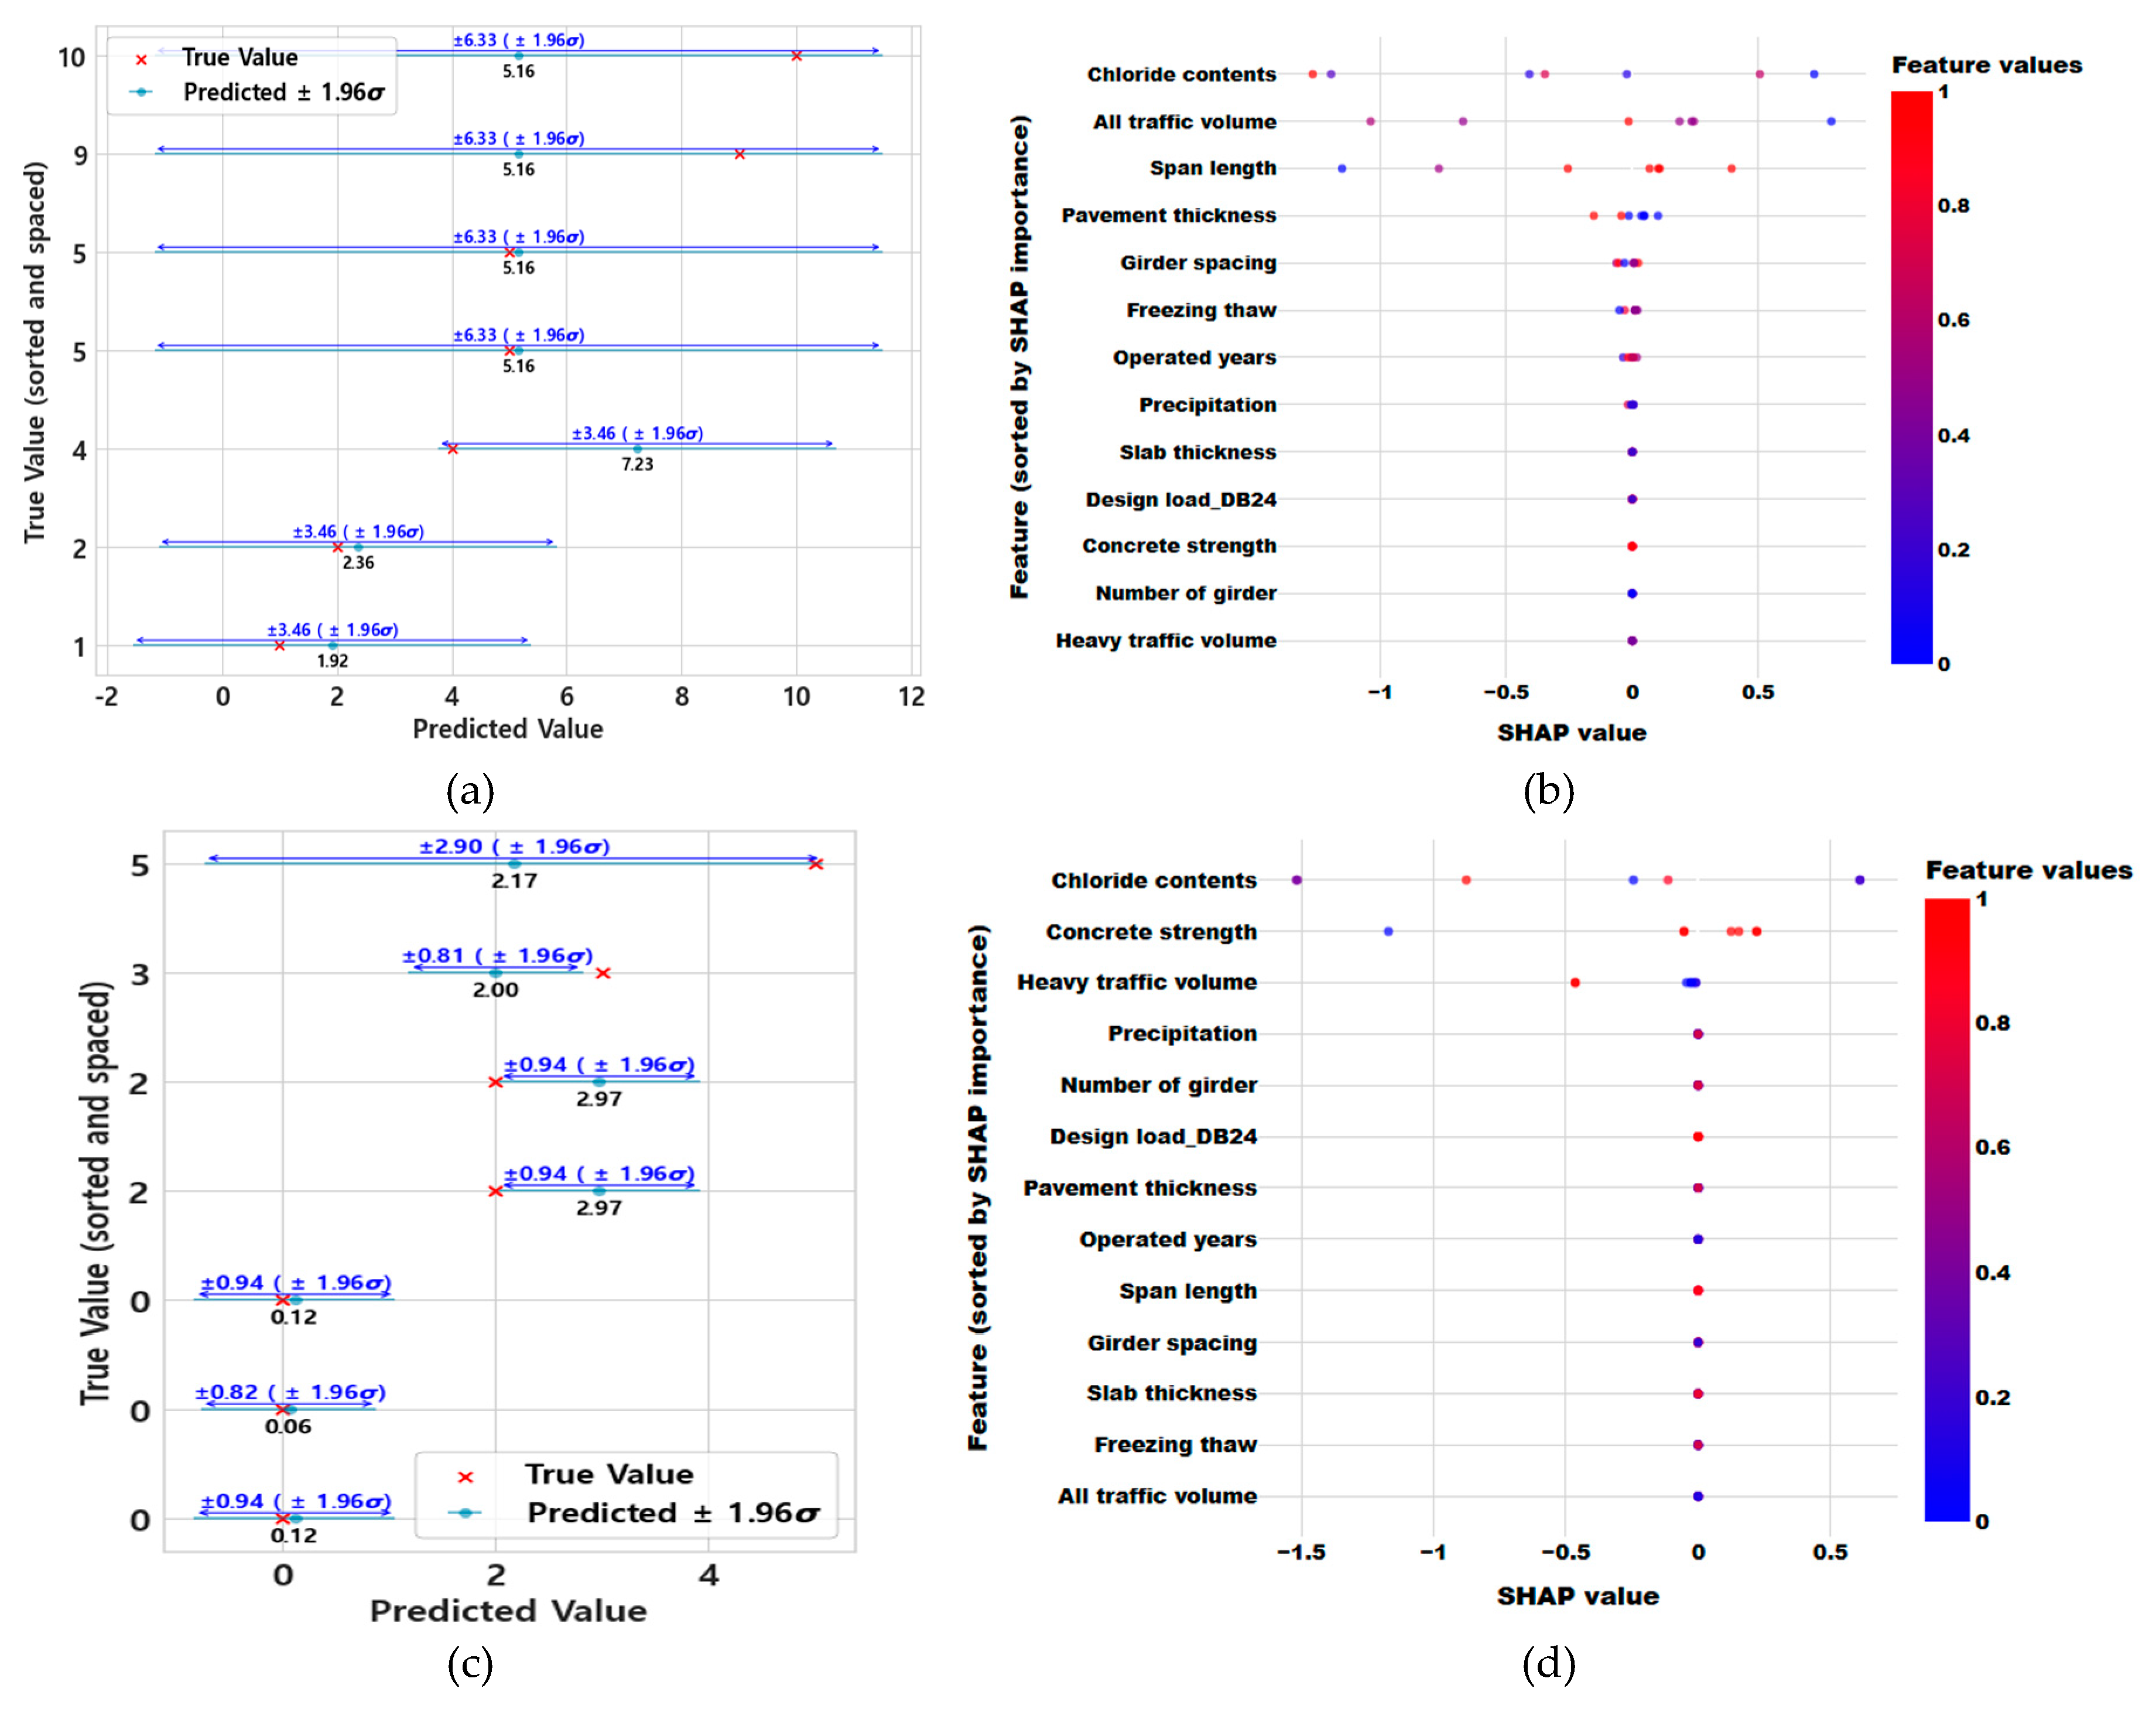
Figure 17.
Results of the ML model showing exponential trends in the cantilever zone (a) (b) predicted values and SHAP of phase1 (c) (d) predicted values and SHAP of phase2 (e) (f) predicted values and SHAP of phase3.
Figure 17.
Results of the ML model showing exponential trends in the cantilever zone (a) (b) predicted values and SHAP of phase1 (c) (d) predicted values and SHAP of phase2 (e) (f) predicted values and SHAP of phase3.
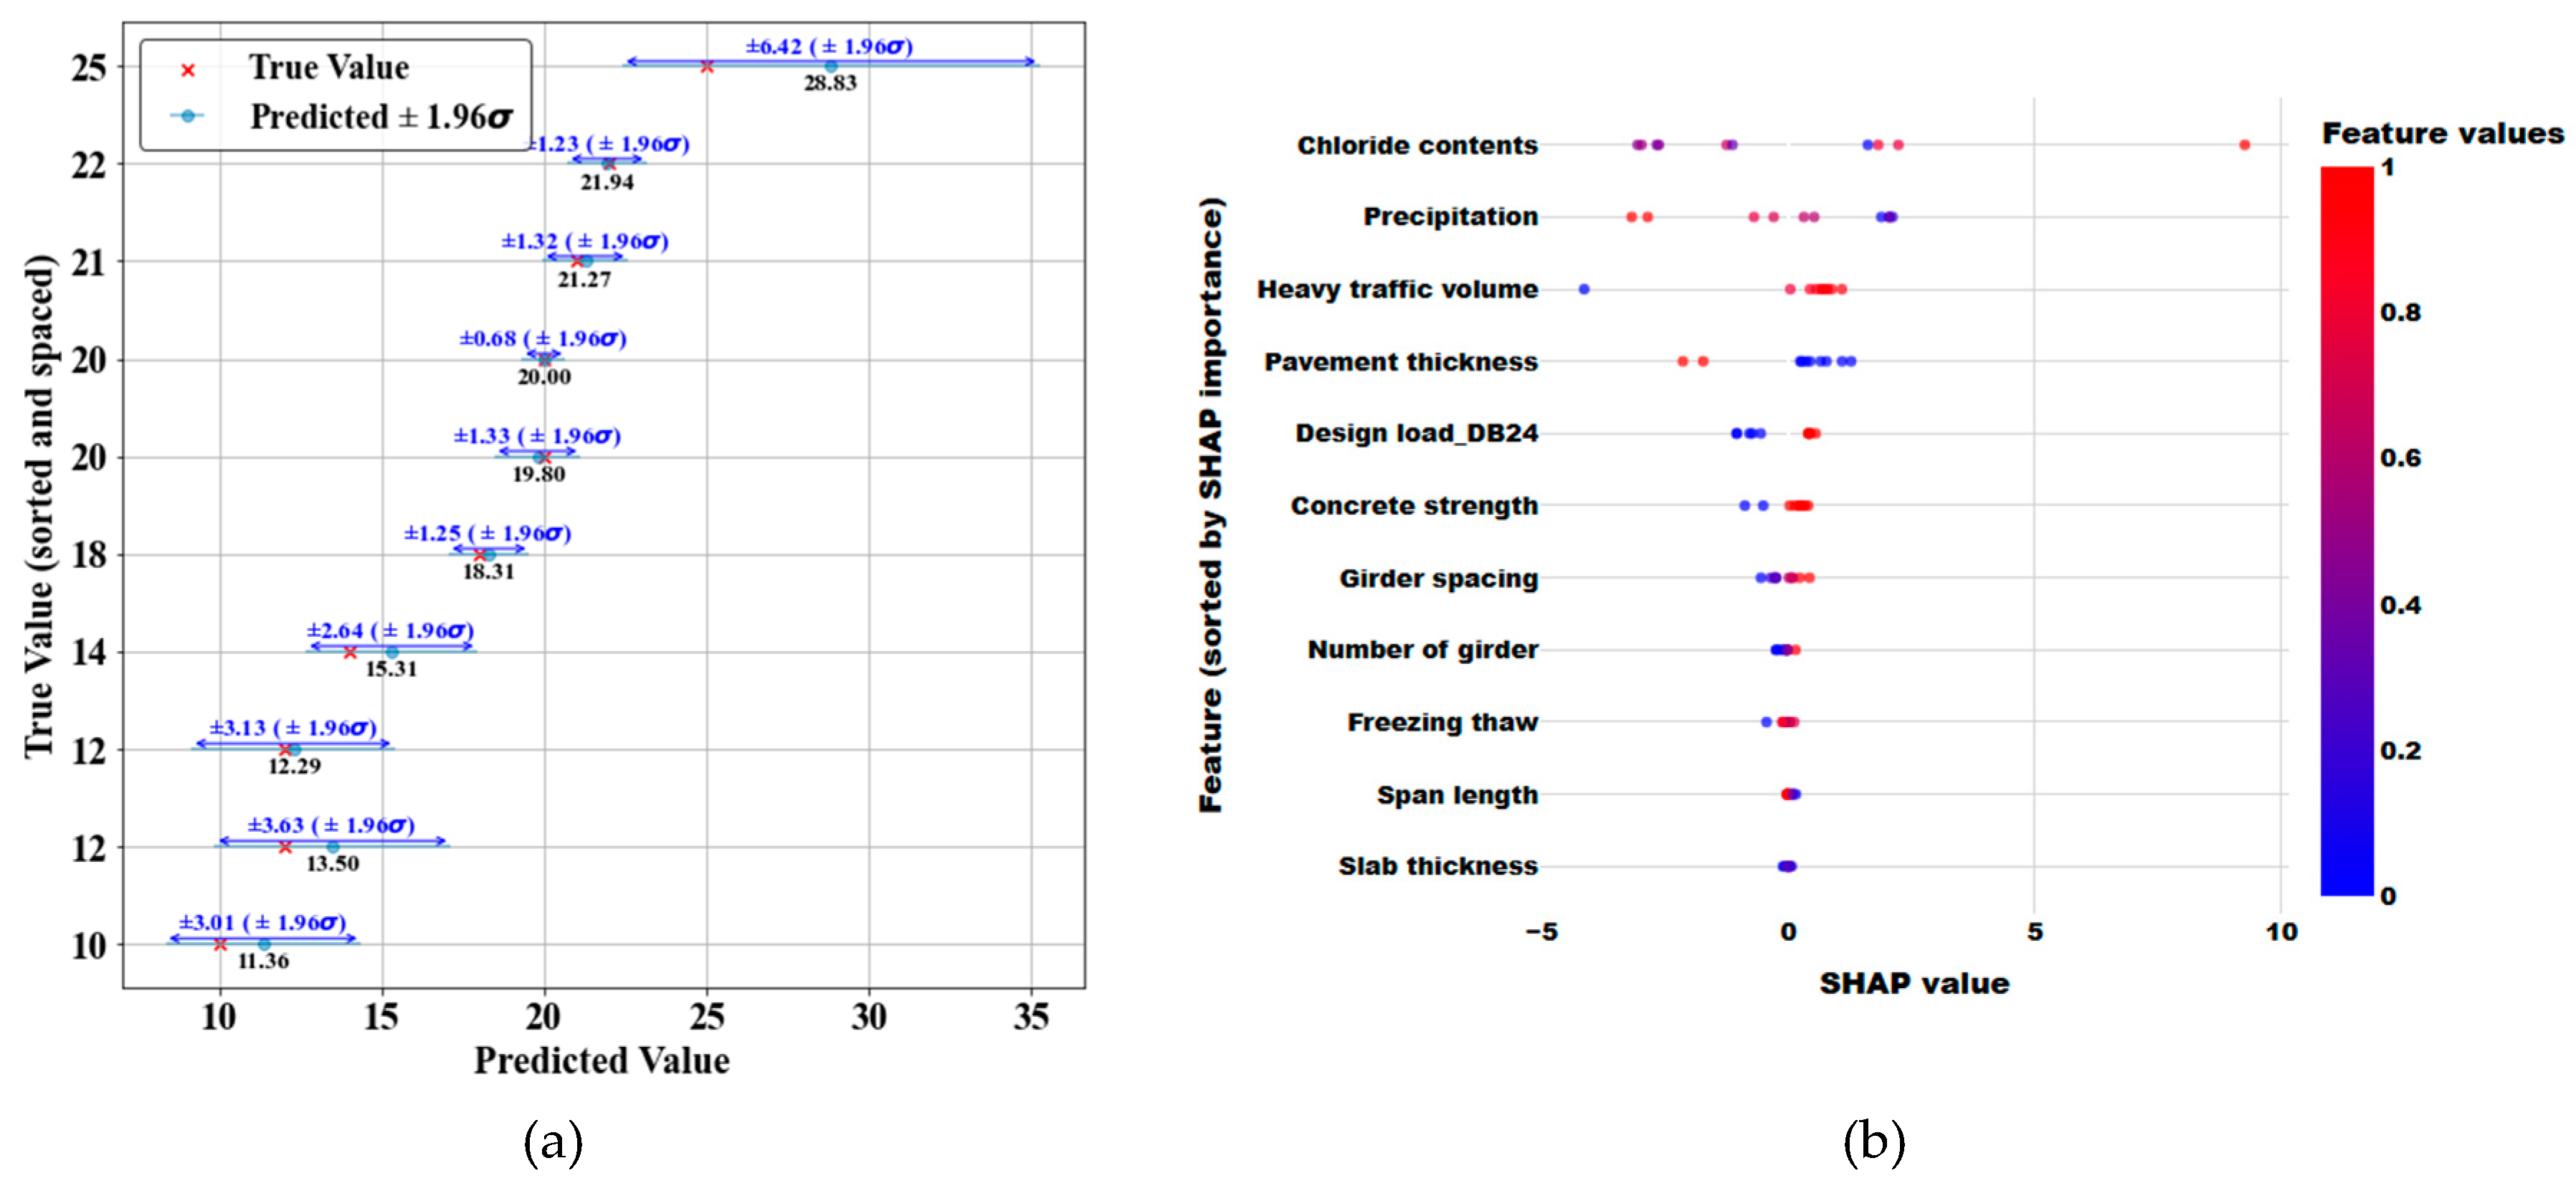
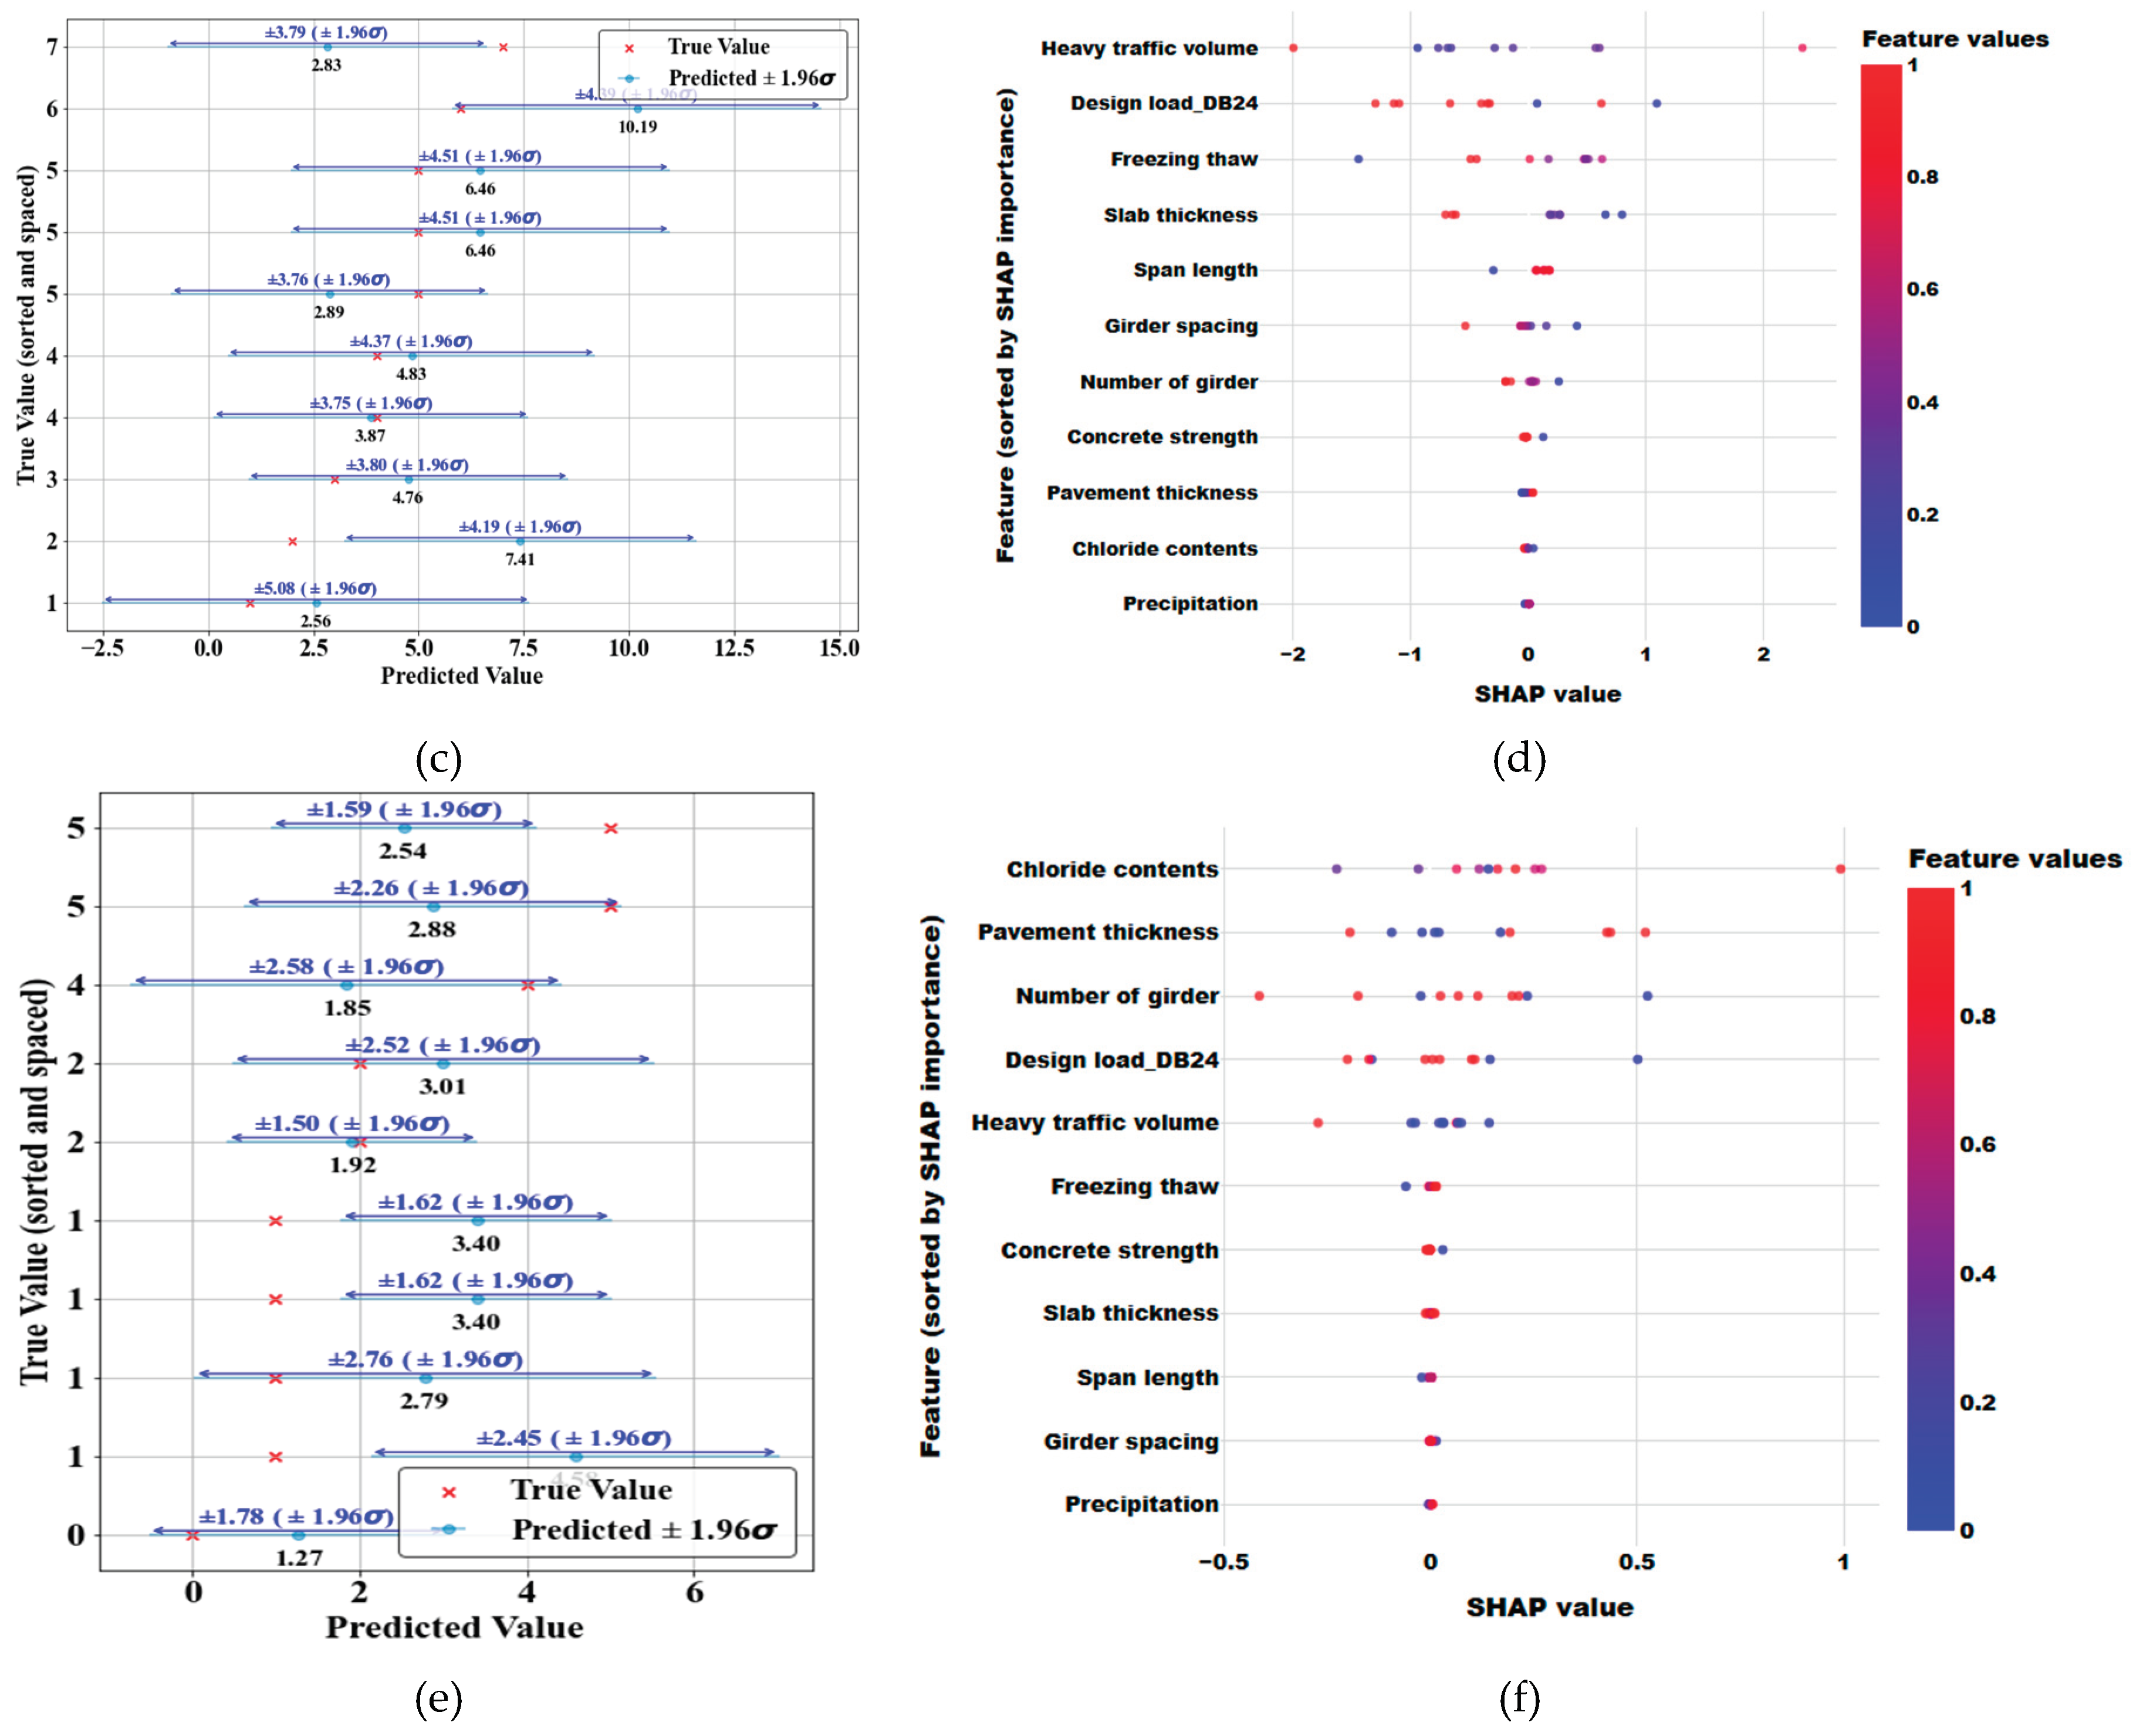
Figure 18.
Results of the ML model for phase 1 showing logarithmic trends in the cantilever zone (a) predicted value of GPR (b) SHAP value of GPR.
Figure 18.
Results of the ML model for phase 1 showing logarithmic trends in the cantilever zone (a) predicted value of GPR (b) SHAP value of GPR.
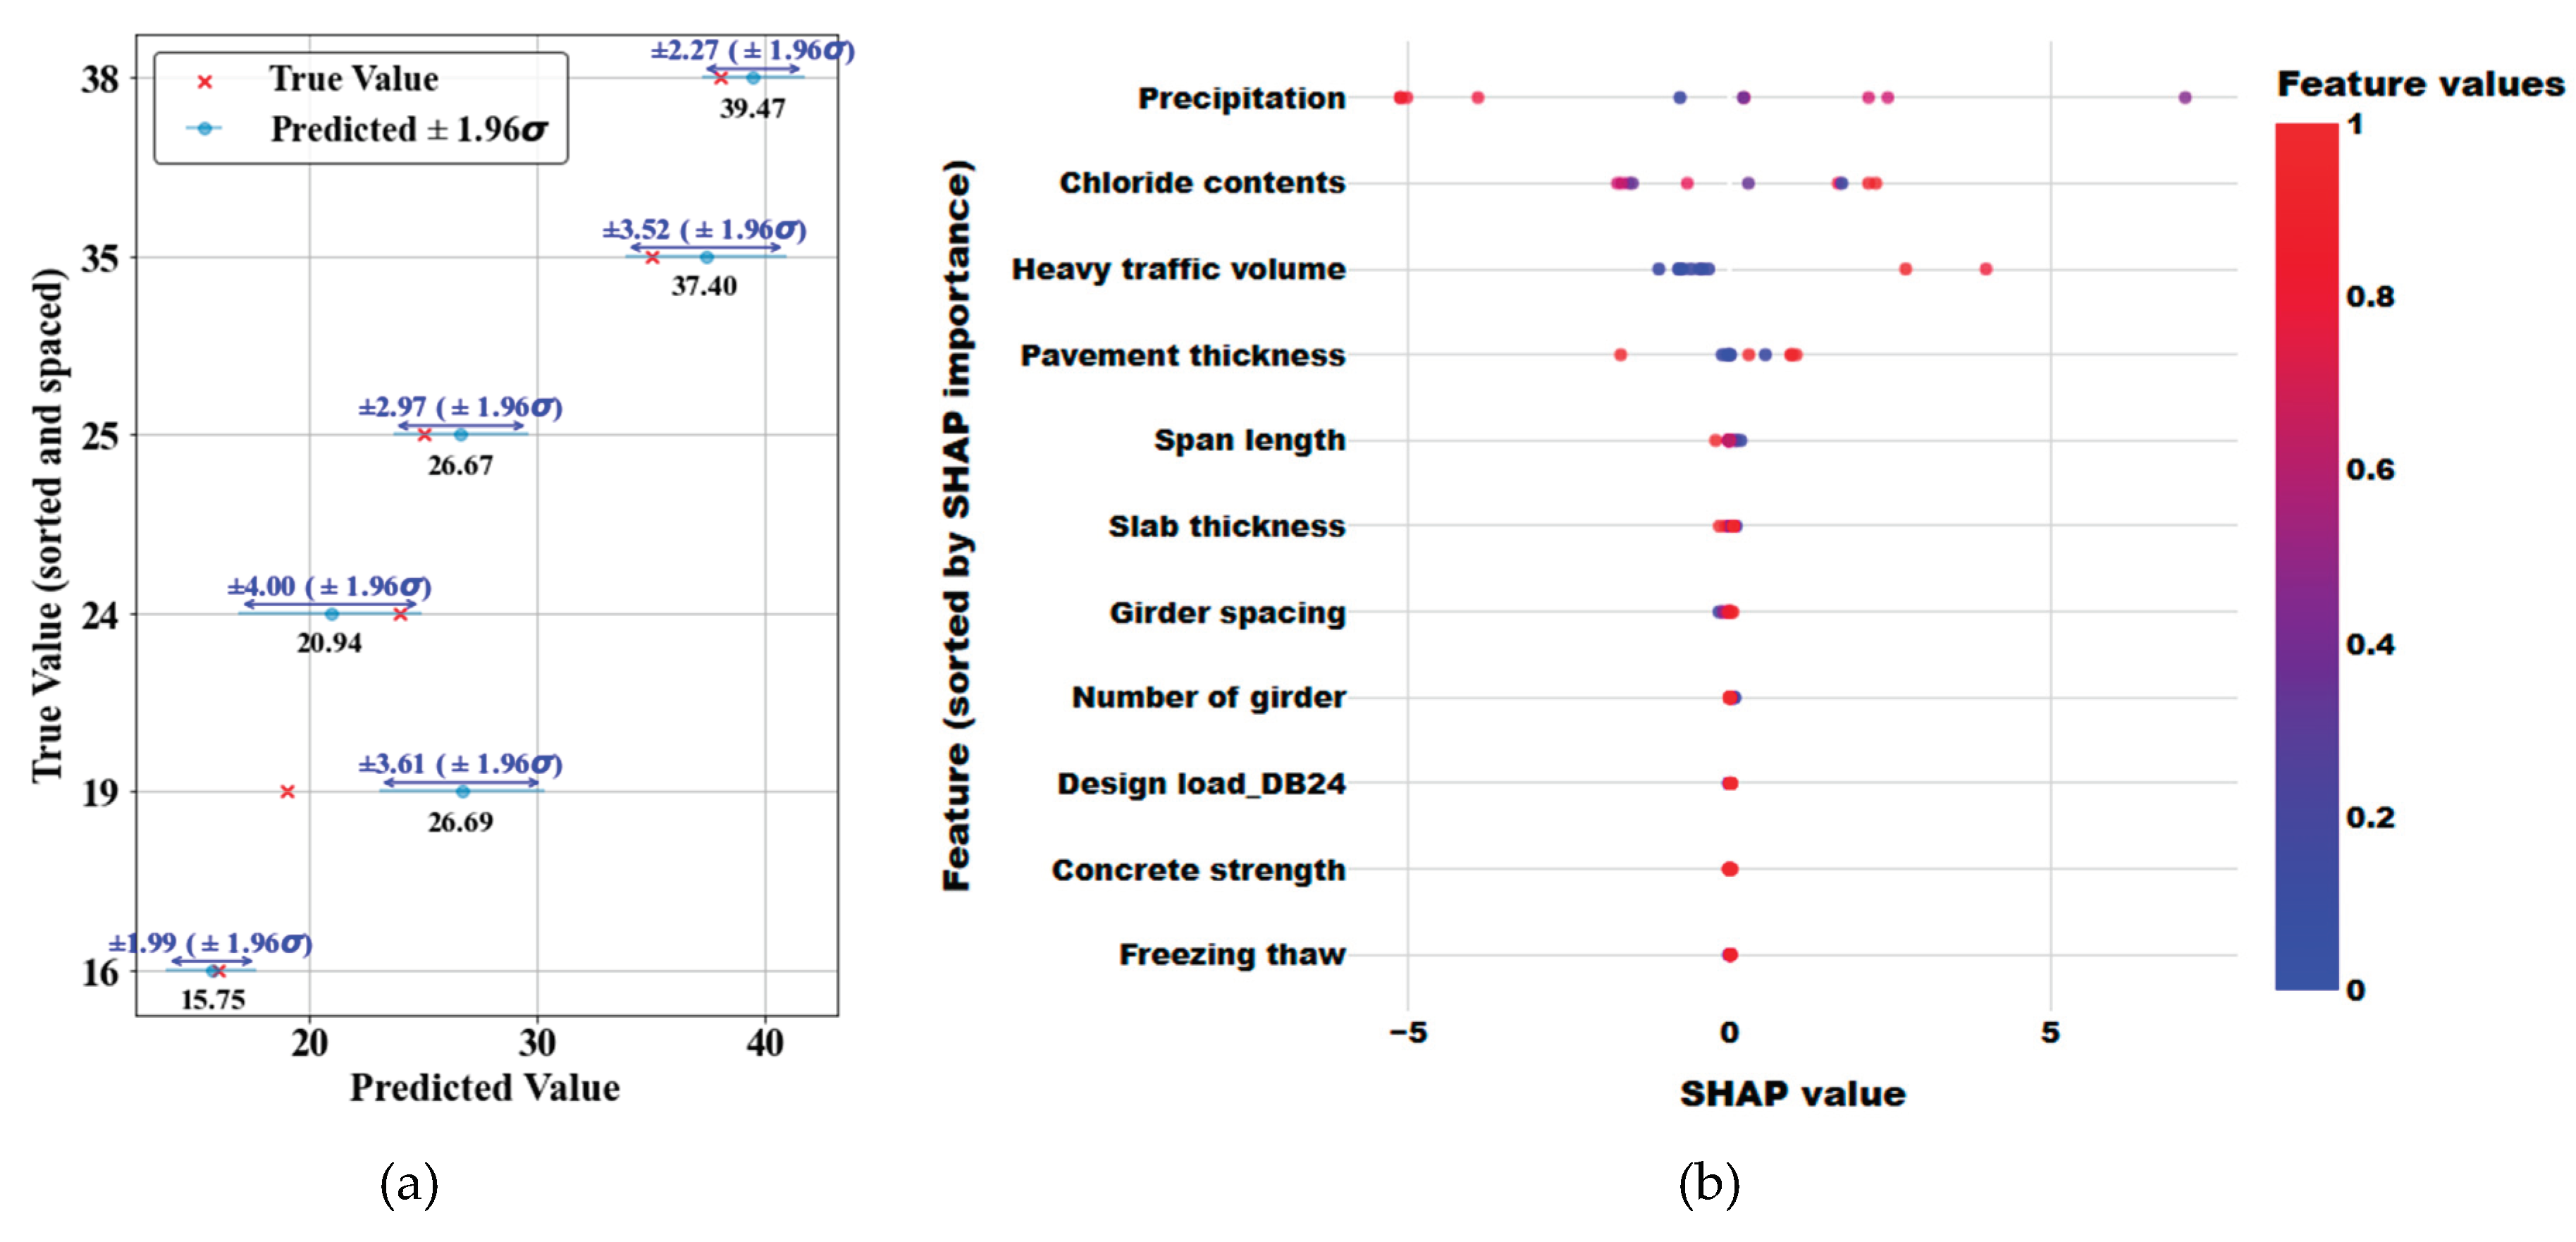
Table 1.
Bridge condition rating in Korea (MOLIT, 2021).
| Condition | State |
|---|---|
| A | Perfect, no problems |
| B | Minor problems in secondary elements, needs of small repairs for improvement in durability |
| C | Minor problems in primary elements or extensive problems in secondary elements, needs of repairs in primary elements or of rehabilitations in secondary elements |
| D | Problems in primary elements, needs of emergency repairs/rehabilitations |
| E | Serious problems in primary elements, out of service, needs of rehabilitations/ replacements |
Table 2.
Typical description of rating in India (UBMS, 2019).
| Rating | Description |
|---|---|
| 9 | No Visual Distress |
| 8 | Presence of Micro cracks |
| 7 | Extensive micro cracks |
| 6 | Micro Cracks changes to Cracks |
| 5 | Cracks widening |
| 4 | Start of delamination |
| 3 | Delamination extensive and start of spalling |
| 2 | Spalling extensive and loss of section |
| 1 | Sectional reduction in the core concrete |
| 0 | Section failed |
Table 3.
Standard condition rating in the US (AASHTO, 2018).
| Index | Condition | Explanation |
|---|---|---|
| N | Not Applicable | - |
| 9 | Excellent Condition | No problem noted |
| 8 | Very good Condition | No problem noted |
| 7 | Good Condition | Some minor problems |
| 6 | Satisfactory Condition | Structural elements show minor deterioration |
| 5 | Fair Condition | All primary structural elements are sound but may have minor section loss, cracking, spalling, or scour |
| 4 | Poor Condition | Advanced section loss, deterioration, spalling, or scour |
| 3 | Serious Condition | Loss of section, deterioration, spalling, or scour have seriously affected primary structural components |
| 2 | Critical Condition | Advanced deterioration of primary structural elements, fatigue cracks in steel or shear cracks in concrete may be present |
| 1 | "Imminent" Failure Condition | Major deterioration or section loss present in critical structural components, or obvious vertical or horizontal movement affecting structural stability |
| 0 | Failed Condition | Out of service, beyond corrective action |
Table 4.
Definition of damage states for bridge slabs.
| Phase | Deterioration Stage | Description | Remarks |
|---|---|---|---|
| Phase 1 | State 1 | Transverse crack (Crack width < 0.1 mm) |
|
| State 2 | Transverse crack (0.1 mm < Crack width < 0.3 mm) |
||
| State 3 | Map crack, transverse crack (Crack width > 0.3 mm) |
||
| State 4 | Efflorescence near cracks | ||
| Phase 2 | State 5 | Corrosion condition | Leakage, chloride (>0.4%), carbonation depth (>cover) |
| State 6 | Corrosion initiation | Rust stains on the concrete surface | |
| Phase 3 | State 7, 8 | Delamination and spalling | Service life limit |
Table 5.
Definition of deterioration zone on the bridge deck.
| Zone | Location |
|---|---|
| A | Cantilever (Adjacent to negative moment region) |
| B | Negative moment region (Near Support) |
| C | Moment reversal region |
| D | Cantilever section |
| E | Positive moment region (Mid-span) |
Table 6.
Chloride status assessment standards (MOLIT, 2021).
| Class | When the chloride penetration reaches 2.5(kg/㎡) | Chloride penetration Cr(kg/㎡) | ||
|---|---|---|---|---|
| A | 30 yrs < T | Cr ≥ 0.3 | ||
| B | 20 yrs < T ≤ 30 yrs | 0.3 < Cr < 0.6 | ||
| C | 10 yrs < T ≤ 20 yrs | 0.6 < Cr < 1.2 | ||
| D | 5 yrs < T ≤ 10 yrs | 1.2 < Cr < 2.5 | ||
| E | 5 yrs ≥ T | 2.5 ≤ Cr |
Table 8.
Results of ML classification for each zone A~E.
| Voting | Feature importance | ||||||
|---|---|---|---|---|---|---|---|
| Accuracy | AUC | Recall | SHAP 1 | SHAP 2 | SHAP 3 | SHAP 4 | |
| A | 0.71 | 0.92 | 0.71 | Operated years | Freezing thaw | Chloride contents | Precipitation |
| B | 0.69 | 0.92 | 0.69 | Operated years | Traffic volume | Slab thickness | Chloride contents |
| C | 0.83 | 0.97 | 0.83 | Chloride contents | Slab thickness | Traffic volume | Freezing thaw |
| D | 0.59 | 0.87 | 0.59 | Chloride contents | Operated years | Traffic volume | Freezing thaw |
| E | 0.74 | 0.93 | 0.74 | Operated years | Chloride contents | Traffic volume | Freezing thaw |
Disclaimer/Publisher’s Note: The statements, opinions and data contained in all publications are solely those of the individual author(s) and contributor(s) and not of MDPI and/or the editor(s). MDPI and/or the editor(s) disclaim responsibility for any injury to people or property resulting from any ideas, methods, instructions or products referred to in the content. |
© 2025 by the authors. Licensee MDPI, Basel, Switzerland. This article is an open access article distributed under the terms and conditions of the Creative Commons Attribution (CC BY) license (http://creativecommons.org/licenses/by/4.0/).
Copyright: This open access article is published under a Creative Commons CC BY 4.0 license, which permit the free download, distribution, and reuse, provided that the author and preprint are cited in any reuse.


