
Submitted:
29 July 2025
Posted:
31 July 2025
You are already at the latest version
Abstract
Aiming at the problems of small target detection feature extraction difficulty, complex background interference, high missed detection rate and high real-time requirements in aerial images of UAVs, this paper proposes an innovative SRTSOD-YOLO series model based on YOLO11 model. This model integrates a Multi-scale Feature Complementary Aggregation Module (MFCAM) in the backbone network. MFCAM is committed to al-leviating the problem of difficult feature extraction caused by the loss of small target information with the increase of network depth. Through the combination of channel and spatial attention mechanism and convolutional feature extraction of different scales, the position of small objects in the image can be effectively captured. In addition, we design a new neck architecture, called Gated Activation Convolutional Fusion Pyramid Network (GAC-FPN), which efficiently highlights important features and suppresses irrelevant background information during multi-scale feature fusion. GAC-FPN uses three main strategies to enhance small target detection performance: adding a detector head with a small receptive field while deleting the detector head with the original largest receptive field, making full use of large-scale features, and using gated activation convolutional module. Aiming at the imbalance of positive and negative samples in the image, the adaptive threshold focus loss function is used to replace the original binary cross-entropy loss function in the detection head, which speeds up the convergence speed of the network. In addition, in order to adapt to different application scenarios, we generate different versions of SRTSOD-YOLO by setting different widths and depths of network modules: small model (SRTSOD-YOLO-n), smaller model (SRT-SOD-YOLO-s), medium model (SRTSOD-YOLO-m), and large model (SRT-SOD-YOLO-l). The experimental results on two datasets, VisDrone2019 and UAVDT, showed that SRTSOD-YOLO-n improved the mAP50 index by 3.1% and 1.2% compared to YOLO11n, and SRTSOD-YOLO-l improved the mAP50 index by 7.9% and 3.3% compared to YOLO11l, respectively. Compared with other existing methods, SRT-SOD-YOLO-l achieves the highest detection accuracy while maintaining real-time performance, demonstrating the superiority of the proposed method.
Keywords:
UAV
; small target detection
; YOLO11
; feature fusion
; attention mechanism
1. Introduction
In recent years, with the rapid development of deep learning technology, object detection technology, as one of the research directions in the field of computer vision, has been rapidly improved. Object detection technology can effectively locate and classify objects in images or videos. With the deep integration of UAV platform and computer vision technology, target detection based on aerial images has become one of the core technologies in traffic monitoring [1,2,3,4], smart city [5,6], power facility inspection [7], disaster relief [8] and other fields.
At present, mainstream object detection algorithms are mainly based on deep learning models, which can be roughly divided into three categories: two-stage methods, one-stage methods and transformer-based methods. The two-stage detection algorithm divides the detection problem into two stages. First, the candidate regions are generated, and then the candidate regions are classified (generally position refinement is required). The main implementations of this kind of algorithm include: R-CNN [9], SPPNET [10], Fast R-CNN [11], Faster R-CNN [12], etc. The detection accuracy of two-stage target detection algorithm is relatively high, but the detection speed needs to be improved. The one-stage method takes the YOLO series of algorithms as a typical representative. YOLO provides a more direct idea: directly regressing the position of the bounding box and the confidence of the category to which the bounding box belongs at the output layer. Compared with the object detection of the R-CNN system, YOLO converts object detection from a classification problem to a regression problem. In 2017, Vaswani et al. proposed Transformer [13], which introduced Self-Attention mechanism to replace the loop structure of traditional RNN/LSTM to realize global dependency modeling and parallel computing. Multi-head attention is proposed to enhance the model’s ability to capture information at different semantic levels. It has completely changed the natural language processing paradigm and become the core foundation of large models such as BERT and GPT. In 2020, the Google team proposed Vision Transformer [14], which achieved the high performance of the pure Transformer architecture on visual tasks for the first time, breaking the monopoly of CNN, and surpassing ResNet in accuracy on large-scale data sets (such as ImageNet-21K). DETR [15] was proposed by Facebook in 2020. Compared with the YOLO series methods, it does not require anchor design and NMS post-processing. It is called a real end-to-end target detection method by its authors, creating a new paradigm of target detection. However, with the increase of input image resolution, the calculation amount and memory access cost of DETR will also increase greatly.
Although the current mainstream algorithms have achieved competitive detection performance for conventional targets, such as the detection on the common benchmarks MS COCO [16] and Pascal VOC [17]. However, detecting small objects (e.g., smaller than 32x32 pixels [16]) in aerial images is still a challenging task [18,19,20]. As shown in Figure 1a–c, the image background is extremely complex, and the UAV usually shoots from a high position above the ground, resulting in a small size of the target in the image, so the targets in the aerial image of the UAV are almost all small targets. Kai Liu et al. [21] made statistics on the VisDrone dataset and found that each image contains 54 targets on average, but those targets only occupy 8.1% of the pixels in total. At present, when the mainstream detection algorithms detect small targets in aerial images of UAV, it will easily lead to the loss of small target features with the deepening of network hierarchy. In addition, as shown in Figure 1(d), Figure 1e,f, the UAV can photograph targets from different angles, including frontal viewing angle, side viewing angle, and top viewing angle. The scale of the same target varies greatly under different viewing angles. Moreover, for the same category of targets in the same aerial photography scene, the imaging of targets close to the UAV is larger, and the imaging of targets far from the UAV is smaller. In addition, as shown in Figure 1g,h, when the UAV shoots at different time (such as day and night), it obtains targets with different lighting conditions. Moreover, when the UAV is flying at high speed or shooting fast When moving targets, the targets in the image will be blurred. In addition, the engineering deployment of UAV target detection algorithms is usually designed differently for two typical scenarios [22,23]: In the airborne sensing-ground computing architecture, the raw data obtained by the imaging device is transmitted back to the ground workstation in real time through a low-latency link, relying on the GPU cluster to perform the back-end processing flow. In this mode, the detection model is not strictly limited by the number of parameters and computational complexity, and its core goal is to fully exploit the spatial details in high-resolution images through the optimization of deep network architecture (such as multi-scale feature fusion, attention enhancement and other strategies), so as to break through the accuracy bottleneck of small object detection. In contrast, edge computing-oriented airborne embedded systems need to complete real-time image analysis locally, which puts forward dual constraints on algorithm design: on the one hand, a lightweight model based on neural architecture search must be built to meet the quantitative deployment requirements of airborne chips. On the other hand, it is necessary to weigh the balance between model capacity and feature representation power to maintain the reliable detection rate of key targets under the limited memory bandwidth and power consumption budget. The technical focus of such scenarios has shifted from simply pursuing indicator improvement to developing edge intelligent detection solutions that take into account real-time and lightweight, with special attention to the collaborative optimization of low-power computing architectures and compact storage configurations.
Based on the above factors, the visual analysis and processing of dedicated platforms such as UAV [24,25] have been hindered. In order to fill the performance gap between detecting small-scale and normal-scale objects and improve the detection ability of small-scale targets in high-resolution UAV aerial images, researchers have made a lot of efforts in data enhancement [26,27,28,29,30,31] hierarchical feature aggregation [32,33,34,35] based on attention strategies [36,37,38,39] and other aspects.
However, the above method generalization is still limited because the poor pixels occupied by small objects lack sufficient visual information to highlight the feature representation [40]. Moreover, there is a core contradiction in the above research: when trying to optimize the running efficiency of the algorithm (such as increasing the frame rate or reducing the memory footprint), the detection accuracy often decreases significantly, and this asymmetric accuracy-efficiency loss seriously restricts the deployment value of the algorithm in practical engineering.
To solve the above problems, we propose a new SRTSOD-YOLO model, which is a series. Our study uses YOLO11 as the underlying network framework and implements targeted modifications. The improved YOLO11 model enhances the detection performance of small targets without significantly increasing the computational resource consumption. To ensure that the model meets different application requirements, we derived multiple versions based on the SRTSOD-YOLO framework, SRTSOD-YOLO-n, SRTSOD-YOLO-s, SRTSOD-YOLO-m, and SRTSOD-YOLO-l. Experimental results on the authoritative UAVDT [41] and VisDrone2019 [42] datasets show that the proposed SRTSOD-YOLO network achieves superior detection accuracy with fewer parameters and lower computational complexity, significantly outperforming the baseline YOLO11 network.
The main contributions of our study are as follows:
- Multi-scale Feature Complementary Aggregation Module (MFCAM) is integrated into the backbone network. MFCAM is committed to alleviating the problem of difficult feature extraction caused by the loss of small target information as the network depth increases. Through channel and spatial attention mechanism combined with convolutional feature extraction at different scales, the location of small targets in images can be effectively captured.
- We design a new neck architecture called Gated Activation Convolutional Fusion Pyramid Network (GAC-FPN), which efficiently highlights important features and suppresses irrelevant background information during multi-scale feature fusion. GAC-FPN uses three main strategies to enhance small target detection performance: adding a detector head with a small receptive field while deleting the detector head with the original largest receptive field, making full use of large-scale features, and using gated activation convolutional module.
- Aiming at the imbalance of positive and negative samples in the image, we use an adaptive threshold focus loss function in the detection head to replace the original binary cross entropy loss, which speeds up the convergence speed of the network and improves the detection accuracy of the model for small targets.
- In order to meet different practical task requirements, we propose different SRTSOD-YOLO versions of object detection models. These models include high-capacity models for ground workstations, focusing on multi-scale feature fusion and context modeling, giving full play to the parallel computing advantages of GPU clusters, and lightweight models for airborne platforms to achieve edge-end real-time reasoning while ensuring the recall rate of key targets. This hierarchical design paradigm improves the flexibility of algorithm deployment.
The following parts of this paper are structured as follows: Section 2 provides an overview of the object detection methods of UAV aerial images, YOLO series algorithms, and related research on YOLO11 networks. Section 3 introduces the SRTSOD-YOLO model and elaborates on the architecture and operation principle of the proposed model. Section 4 details the dataset, experimental setup (including environment and parameters), error type evaluation indicators, and discusses various experiments such as ablation studies, comparative analysis, and validation using UAVDT and VisDrone2019 datasets to determine the feasibility of the method. Section 5 describes SRTSOD-YOLO’s solutions to many difficulties in target detection of UAV aerial images. Section 6 summarizes the results and highlights potential directions for subsequent research.
2. Related Work
2.1. Target Detection Methods of UAV Aerial Images
With the rapid development of computer vision technology, researchers have proposed many UAV aerial image target detection methods based on deep learning. The detection performance has been improved and the development of UAV image target detection field has been promoted. Li et al. [43] proposed an efficient Vision Transformer-based tracking framework Aba-ViTrack for UAV tracking, which combines adaptive and background-aware token computation. Du et al. [25] proposed a new global context-enhanced adaptive sparse convolutional network to solve the problems of insufficient integration of small target context information and clumsy control of mask ratio in the presence of foregrounds with different proportions, achieving the best balance between detection accuracy and efficiency in detecting UAV targets. Wang et al. [44] proposed a diversity knowledge awareness and fusion network, which utilizes image-level and instance-level features to achieve diversified knowledge representation, and established an innovative baseline architecture for detecting targets and their key parts in UAV images. Chen et al. [45] proposed an offset-guided adaptive feature alignment method, which can adaptively adjust the relative positions between multi-modal features, solving the problem of weak misalignment during visible-infrared image fusion. Wang et al. [46] proposed a cross-modal aerial remote sensing image target detection network that effectively learns different sensor image features to capture different scene and target features. Liu et al. [47] adopted the RFCAConv convolution method to solve the parameter sharing problem in the convolution process by optimizing the receptive field of the convolution kernel, which combines coordinate attention to effectively improve the extraction and processing of feature information. Wang et al. [48] designed a feature fusion module TP-Fusion containing DConv to improve the detection rate of small targets. It can fuse the information of lower-level features, and it can actively adjust the shape of the convolution kernel to fit targets of different sizes and poses to obtain more detailed feature information. Suo et al. [49] proposed a transparent energy consumption model that explains the complex relationship between energy consumption and key factors, including UAV, edge devices, flight altitude, flight speed, and detection sampling rate, helping to optimize energy consumption in UAV-based target detection. Wang et al. [50] proposed a new frequency-domain deentanglement method to solve the problem of weak generalization ability due to domain offset when UAV target detection networks are deployed to complex and invisible real-world scenarios. Chen et al. [51] proposed a semantic information-guided fusion module specifically tailored for small targets. This module uses high-level semantic information to guide and align the bottom-level texture information, thus enhancing the semantic representation of small targets at the feature level and improving the detection ability of the model for small targets. Ying et al. [52] proposed a pyramid dual-pool attention path aggregation network to achieve accurate vehicle localization by seamlessly integrating spatial and semantic information from different feature layers. Furthermore, the vehicle detection performance of the model is improved by adopting a parallel strategy to integrate the hybrid attention mechanism. Zou et al. [53] proposed a learnable image mapping network. The image enhancement network is formed by the fusion of La Press pyramid and DPM, which enhances the detail features in the input image and improves the representation ability of the target area. Dutta et al. [54] proposed a multi-view aerial visual recognition video dataset using ground cameras and UAV-mounted cameras to record synchronized scenes from different angles. Meanwhile, they propose a curriculum-based semi-supervised object detection method whose superior performance shows the importance of learning geo-aware representations. Ding et al. [55] proposed the attention module OSAM, which efficiently extracts positional features from images to represent objects with minimal parameters.
In recent years, breakthroughs have been made in the field of UAV visual perception research. The dedicated detection algorithm based on the deep learning framework shows significant performance improvement in low-altitude complex scenes by optimizing the feature extraction mechanism and spatial attention mechanism. The innovative model architecture and algorithm design not only effectively overcome the technical bottlenecks of traditional detection methods in terms of scale change, target occlusion and illumination interference, but also successfully achieve the collaborative optimization of detection accuracy and computational efficiency through multi-modal data fusion and lightweight network structure. This technological breakthrough provides more reliable visual perception solutions for vertical fields such as smart city management, precision agricultural monitoring and emergency rescue, and effectively promotes the expansion and deepening of low-altitude economic application ecology.
2.2. The YOLO Series Algorithms
Yolo series algorithms are representative of one-stage target detection methods, achieving a satisfactory balance in detection accuracy and efficiency. As the pioneer of YOLO series algorithms, YOLOv1 [56] realizes end-to-end object detection and significantly improves the detection speed. YOLOv2 [57] was proposed by Redmon and Farhadi in 2017 to improve the detection accuracy of small objects and handle multiscale changes more efficiently. This advancement is achieved by integrating batch normalization, anchor boxes, feature pyramid networks, and multi-scale training, mitigating previous problems while maintaining real-time performance. Starting from YOLOv3 [58], this series of models has been modularized and is mainly divided into three parts: backbone, neck and head. backbone is mainly responsible for extracting features of different scales, neck is mainly responsible for fusing features of different scales, and head is responsible for predicting the position and category of targets in images. The improvements of YOLO v3 [58] mainly include: the promotion of the backbone network, from darknet-19 in v2 [59] to deaknet-53 in v3 [58]. In addition, the number of anchor boxes is increased from 5 in v2 [57] to 9 in v3 [58]. In 2020, Bochkovskiy et al. proposed YOLOv4 [60], which combined various advanced technologies at the time, including Mosaic data augmentation, a brand-new backbone network CSPDarkNet-53, mish activation function, spatial pyramid pooling, DropBlock strategy to prevent overfitting, and path aggregation network for neck fusion. YOLOv5 was developed by the Ultralytics team led by Glenn Jocher and has undergone constant iterations of updates. It uses the lightweight CSPDarknet as its backbone network and includes various optimization strategies such as adaptive picture scaling, multi-scale training, and adaptive anchor box generation. YOLOv5 excels in real-time performance, making it more suitable for application scenarios that require fast inference. Li et al. proposed YOLOv6 [61], replacing CSPDarknet with EfficientRep, enhancing hardware compatibility while maintaining high accuracy. Wang et al. developed YOLOv7 [62] to incorporate model re-parameterization into the network architecture and a novel high-efficiency layer aggregation network to improve network efficiency and performance. In 2023, the Ultralytics team released YOLOv8, which uses a novel C2f structure in the backbone network, introduces an Anchor-Free detection head, simplifies the model structure and improves small target detection capabilities. YOLOv8 is the first unified multi-tasking version of YOLO, which is friendly to industrial deployment and has become the mainstream choice for real-time detection. YOLOv9 [63] was released by the Chien-Yao Wang team in 2024. The main improvements include: proposing a programmable gradient information framework to solve the problem of information loss in deep networks. Generalized high efficiency layer aggregation network is introduced to enhance multi-scale feature expression ability. In 2024, the Tsinghua University team released YOLOv10 [64]. The main improvements include: eliminating non-maximum suppression and reducing post-processing delay. Dual-label allocation strategy and space-channel decoupling downsampling are adopted to optimize feature retention. Introducing large kernel convolution to enhance location awareness. In 2024, the Ultralytics team launched YOLO11. The main improvements include: proposing the C3K2 module to optimize feature aggregation, and the C2PSA module to enhance global attention. Use depth separable convolution compression parameter quantities to adapt to edge devices.
2.3. The YOLO11 Architecture
YOLO11, released by the Ultralytics team in 2024, represents the latest progress in the YOLO series of object detection models. It continues the classic three-stage architecture of the YOLO series, consisting of Backbone, Neck and Head, as shown in Figure 2.
The input image is three-channel, and the size of the image is 640 pixels × 640 pixels. The CBS module represents the Conv2d(two-dimensional convolution layer) + BatchNorm2d(batch normalization layer) + SiLu(activation function). The feature maps with different resolutions were obtained by downsampling five times in the backbone network using convolution with a kernel size of 3×3 and a step size of 2. The C3K2 module is introduced into the backbone network, and the multi-branch architecture is adopted to extract fine-grained details and deep information, replacing the C2F module in the YOLOv8 backbone network, which significantly enhances its feature extraction ability. This module provides two switchable working modes: c3k = True and c3k = False, which can flexibly adjust the feature extraction strategy according to the task characteristics. In the active state of c3k, it adopts the grouping parallel processing mechanism: the input features are first evenly divided into several sub-channel groups, and after each group undergoes independent convolution operation, information fusion is realized through channel splicing. When the parameter c3k is set to False, the C3K2 module switches to the C2F module at this time. The fast spatial pyramid pooling module(SPPF) is the core component of feature fusion of YOLO11 model, which adopts a multi-level feature aggregation architecture to achieve efficient multi-granularity information extraction. The SPPF workflow includes three stages of processing: pre-feature compression layer, cascade pooling operation and cross-scale feature fusion. The pre-feature compression layer reduces feature dimensions through convolution kernels to reduce spatial redundancy while retaining key semantic information. Cascading pooling operation refers to the three-level maximum pooling layer hierarchically expanding feature coverage with a pyramid structure, focusing on local details (5×5 maximum pooling), mid-order textures (9×9 maximum pooling), and global contours (13×13 maximum pooling). Cross-scale feature fusion means that different receptive field feature map features are aggregated by 1×1 convolution. As the core innovative component of YOLO11, the cross-scale pixel spatial attention module significantly improves feature representation capabilities in complex scenes through the collaborative mechanism of multi-scale spatial perception and pixel-level fine-grained enhancement. In addition, in the classification branch of the detection head, DWConv is used to replace the traditional convolution, and the standard convolution is split into depth-wise convolution and point-wise convolution, which reduces the amount of parameters. YOLO11 achieves the balance of accuracy and speed through C3K2 lightweight design, C2PSA multi-scale attention and DWConv efficient reasoning. Its modular architecture and flexible deployment capabilities make it ideal for industrial-grade applications.
The YOLO11 series model width and depth can be adjusted by parameter variation, and its size range is five levels (from high to low): yolo11x, yolo11l, yolo11m, yolo11s, and yolo11n, as shown in Table 1.
3. The Proposed Model
3.1. The SRTSOD-YOLO Network Structure
We implemented numerous optimizations and improvements to the YOLO11n baseline architecture, mainly focusing on the backbone network and neck components. By adjusting the number of module output channels and the number of C3k in the C3K2 module, SRTSOD-YOLO can be customized for specific scenarios, resulting in different versions, including SRTSOD-YOLO-n, SRTSOD-YOLO-s, SRTSOD-YOLO-m, and SRTSOD-YOLO-l. The parameters of the network module are shown in Table 2 and Table 3.
Figure 3 is a network configuration diagram of SRTSOD-YOLO. The backbone network of our model includes four main components: CBS module, multiscale feature complementary aggregation module (MFCAM), SPPF module, and C2PSA module.
In the standard YOLO11 network, the CBS modules of the first, third, fifth and seventh layers are respectively connected to the C3K2 modules. In the SRTSOD-YOLO network, we employ an innovative MFCAM module to do this, which is capable of efficiently capturing important information in images through channel and spatial attention mechanisms combined with convolutional feature extraction at different scales. This module extracts multi-scale image features through convolution operations at three different scales (3×3, 5×5, 7×7). In this way, the module can adapt to image information of different scales and improve the recognition ability of objects of different sizes of the network. Compared to the YOLO11 neck, we developed a novel neck architecture called Gated Activated Convolutional Fusion Pyramid Network (GAC-FPN). There are three improvements in GAC-FPN: (1) increasing the number of downsampling in the backbone network and making full use of large-scale features; (2) using gating to activate the convolution module; (3) Add a detector head with small receptive field and delete the detector head with the original largest receptive field. In addition, aiming at the imbalance of positive and negative samples in the image, the adaptive threshold focus loss function is used to replace the original binary cross-entropy loss function in the detection head, which speeds up the convergence speed of the network.
3.2. The Multi-Scale Feature Complementary Aggregation Module
Inspired by the paper [65], we propose a multi-scale feature complementary aggregation module, which aims to alleviate the problem of difficult feature extraction caused by the loss of small target information with the increase of network depth. It is combined with convolutional feature extraction of different scales through channel and spatial attention mechanisms to enhance the expression ability of features and can effectively capture the location of small targets in images, as shown in Figure 4.
The first is the segmentation stage of the MFCAM module. We divide the channels of input features (Xinput∈RC× H × W) into βC channels and (1-β) C channels, corresponding to X1 and X2 respectively. Where 0 <= β <= 1 is the shunt ratio, and the value of β is very important in the network. As the deep neural network continues to evolve deeper, the low-level spatial feature representations at the basic level gradually show an explicit trend, and are implicitly encoded into high-dimensional latent vectors through nonlinear mapping. In addition, the input feature Xinput is evenly divided into 4 parts in the channel dimension, and X3, X4, X5 and X6 are obtained respectively. The segmentation stage can be expressed as:
Where X1∈RβC× H × W, X2∈R(1-β)C × H × W, X3∈RC/4 × H × W, X4∈RC/4 × H × W, X5∈RC/4 × H × W, X6∈RC/4 × H × W.
Then, there is the directional conversion phase of the MFCAM module. We send the obtained X1 to the branch consisting of depth-wise convolution and point-wise convolution, and then pass it into the channel attention module to obtain the weight on each channel. In Figure 4, the weight output by the channel attention module is denoted as ω1 ∈ RC × 1 × 1. X2 is sent to the spatial attention module, and weights are assigned to each spatial position of the feature map, emphasizing important regions related to the target and suppressing irrelevant regions. In Figure 4, the weights output by the spatial attention module are expressed as ω2 ∈ R 1 × H × W. Then, X3, X4, and X5 are processed using convolutions with convolution kernel sizes of 7 × 7, 5 × 5, and 3 × 3, respectively, to extract multi-scale image features. Then, the feature maps processed by convolution kernels of different sizes are spliced in channel dimensions, and then the feature map Xmultiscale is obtained after point-wise convolution. For many visual tasks, objects and scenes may have different representations at different scales. Through multiscale convolution, the model is able to adapt to objects or regions of different sizes. This conversion process is represented by the following formula:
Next, there is the feature aggregation stage of the MFCAM. After obtaining the channel attention weight ω1 and spatial attention weight ω2, they are respectively mapped to the feature map Xmultiscale containing multi-scale information. Then the two branches are connected together and added to the input feature Xinput, and then passed to a 3 × 3 convolution layer. Finally, the output of the MFCAM, namely the feature map Xoutput, is obtained (Xoutput ∈ RC × H × W). Xoutput is calculated as follows:
Where ⨂ is element-wise multiplication.
In the visual inspection tasks of UAV platforms, maintaining the high-resolution spatial representation capabilities of large-scale feature maps has become a key factor in improving detection accuracy in response to the effective identification needs of small targets. Overall, the MFCAM combines channel and spatial attention mechanisms with convolutional feature extraction at different scales, aiming to improve the ability of convolutional neural networks to express small target features in aerial images, process different scale information in images, and suppress the interference of irrelevant features. In addition, depth-wise convolution and point-wise convolution are used in this module, which ensures relatively low computing resources while propagating multi-scale shallow spatial position information to deeper layers of the network. Compared with C3K2 module, the MFCAM has more advantages in reducing the spatial information loss of small targets and enhancing the feature expression of small targets at different scales.
3.3. The Gated Activation Convolutional Fusion Pyramid Network
The target detection task in UAV aerial images needs to solve two key problems: position awareness and category discrimination at the same time. In the process of feature extraction, location recognition depends on accurate spatial information, while category judgment requires rich semantic context representation. With the deepening of convolution levels in the backbone network, although the semantic abstraction ability of feature maps can be effectively improved, it will cause layer-by-layer attenuation of spatial location information. Although existing improvement schemes (such as MFCAM module) have improved this, there is still room for optimization in the dynamic equalization of spatial accuracy and semantic depth. Therefore, by optimizing the feature fusion structure to integrate the feature expressions at different levels of the backbone network and establish a complementary mechanism of spatial and semantic information, it can provide more discriminant composite features for the detector head.
In order to achieve multi-scale feature fusion, YOLO11 uses a path aggregation feature pyramid network [32,66] at the network neck. The multi-level features extracted by the backbone network are first transmitted through top-down paths: high-level semantic features (as shown in Figure 2 The feature map output by layer 10) is spliced with low-level features (as shown in the feature map output by layer 6 in Figure 2) in channel dimensions through upsampling to form fused semantic enhancement features. This process iterates down layer by layer, ultimately generating a feature pyramid containing high-level semantic information. The path aggregation structure further enhances the propagation and interaction of features on the basis of feature pyramid, so that the target features can be effectively transmitted to the subsequent detection layer. However, the existing path aggregation feature pyramid network still has several shortcomings for small target detection tasks in UAV aerial images. The core challenge stems from the architecture’s failure to fully integrate the multi-level representation of large-size feature maps, and such feature hierarchy is particularly critical to preserving the spatial details of tiny targets. At the same time, the existing feature interaction mechanism only performs simple channel stitching and convolution operations, and there are feature redundancy and semantic gaps in multi-level fusion features (such as high-level features losing small target details). These problems lead to insufficient collaboration efficiency among features with different resolutions, and it is difficult to establish a complementary mechanism among multi-level features. Therefore, in order to solve the above problems, we have developed a new neck architecture, called Gated Activation Convolutional Fusion Pyramid Network (GAC-FPN), as shown in the network neck structure in Figure 3, it efficiently highlights important features and suppresses irrelevant background information during multi-scale feature fusion. GAC-FPN uses three main strategies to enhance small target detection performance: adding a detector head with a small receptive field while deleting the detector head with the original largest receptive field, making full use of large-scale features, and using gated activation convolutional module.
In this study, the topological reconstruction of classical feature pyramid networks is carried out in two aspects. As shown in Figure 3, first, in the dimension of spatial feature enhancement, the detailed information of the shallow feature map is fully mined through the hierarchical expansion strategy: the large target detection module (20 pixels × 20 pixels) at the top of the original pyramid is deleted, and the prediction layer (160 pixels × 160 pixels) specializing in tiny targets is added, so that the network can effectively capture high-resolution edge texture information in shallow features. Secondly, in the dimension of cross-level information interaction, a multi-scale feature fusion path is reconstructed. The feature maps output by layers 0, 1 and 4 in the backbone network are downsampled, and the obtained results are transmitted to the 23rd, 19th and 15th layers of the neck respectively. The input of layer 15 is derived from the result of down-sampling of the feature map output by layer 4, the feature map output by layer 6, and the feature map output by layer 14. The input of layer 19 is derived from the result of down-sampling of the feature map output by layer 1, the feature map output by layer 4, and the feature map output by layer 18. The input of layer 23 comes from the result of down-sampling of the feature map output by layer 0, the feature map output by layer 1, and the feature map output by layer 22. Fully integrate the multi-level expression of large-size feature maps, and build a multi-level cross-scale feature interaction path. This improvement realizes the collaborative optimization of pixel-level positioning accuracy and semantic abstraction ability by establishing the dynamic mapping relationship between the bottom-level spatial details and the high-level semantic representation.
In addition, inspired by the paper [67], we propose a gated activation convolutional module, which aims to alleviate the problems of feature redundancy and semantic gap in multi-scale and multi-level feature fusion, efficiently highlight important features, and suppress irrelevant background information. As shown in Figure 5, this study uses adaptive gating unit to realize dynamic weight allocation between feature channels and spatial dimensions, and improves the model’s perception ability of fine-grained features through element-by-element feature modulation [68,69]. In order to optimize the efficiency of the model, a lightweight convolution module (BottConv) based on rank constraint optimization is designed [70]. This component achieves the compression of computational resources by projecting high-dimensional feature tensors into a low-dimensional latent space while maintaining the expressiveness of the features.
As shown in Figure 5, the input feature x ∈ RC× H × W passes through the branch path composed of Block1 and Block2 and the branch path of Block3, respectively, one is used to perform standard convolution and the other is used to generate gating weights. Each Block module includes a BottConv layer, followed by a normalization and activation function, resulting in features Block2out and Block3out as follows:
Then, the output of Block3 is processed by the gating unit to generate the gating weight Gateout:
To generate a gated feature map, Block2out and Gateout are combined by a Hadamard product:
The gated feature map gfm(x) is then processed again by Block4 to further extract fine-grained details, and finally, after applying residual connection, the resulting output is:
Our proposed gated activation convolutional module includes BottConv and deeper gated branches. This design enables the model to retain important multi-scale features of small targets in aerial images while maintaining computational resource compression. At the same time, it enhances the model’s perception ability of fine-grained features, thereby improving the model’s detection performance for small targets.
3.4. The Adaptive Threshold Focus Loss Function
In drone aerial images, the background usually dominates, and only a small area is covered by the targets. This data distribution characteristic makes it easier for the model to capture the feature information of the background rather than the targets during training. Consider the background as an easy-to-learn sample, while the target belongs to the difficult sample. However, even if the characteristics of the background have been fully grasped, it still occupies a large weight in the calculation of training error. In fact, the simple samples that constitute the main regions of the image dominate the update direction of the model weights, which in turn masks the contribution of the target regions. In order to alleviate this problem, we use the adaptive threshold focus loss proposed by Yang et al. [71] to replace the original binary cross entropy loss, and adaptively adjust the loss value according to the predicted probability value, aiming to enhance the detection performance of small targets in aerial photography of UAVs.
The classical cross-entropy loss function can be expressed as:
Where p represents the prediction probability and y represents the true label. Its concise expression is:
Where
The expression for the adaptive threshold focus loss can be expressed as:
Where λ is a hyperparameter greater than 1 and the expression of pc is as follows:
Where pc represents the predicted value of the next epoch, pt represents the current average predicted probability value, and pi represents the average predicted probability value of each training epoch.
4. Experiment and Analysis
4.1. Image Datasets for Small Object Detection
To validate the proposed SRTSOD-YOLO model, we selected two representative and widely applied UAV perspective datasets, VisDrone and UAVDT, for experimental evaluation. The VisDrone dataset is widely recognized and authoritative in the field of international UAV vision research. We use its 2019 version, developed and open source by the AISKYEYE team of Tianjin University, aiming to promote visual perception technology under UAV platforms, especially research on tasks such as target detection, target tracking and semantic segmentation. With its huge data volume and remarkable scenario diversity, VisDrone2019 has become a benchmark reference dataset in this field. This resource contains 288 videos obtained in complex environments (covering urban streets, rural fields, construction sites, etc.). In addition, the data set also provides 10,209 aerial images, covering a wide range of geographical locations and environmental conditions, and is suitable for object detection research in single-frame images. Ten kinds of target objects are finely annotated in the data set. Following the official segmentation criteria of the VisDrone2019 challenge, the samples were divided into training sets (6,471), validation sets (548), and test sets (1,610).
The UAVDT dataset, jointly published by the University of Chinese Academy of Sciences, Harbin Institute of Technology, Huawei Noah’s Ark Laboratory, and the University of Texas at San Antonio, among others, consists of 100 video sequences selected from over 10 hours of videos taken by drone platforms at multiple locations in urban areas, representing a variety of common scenes, including squares, main roads, toll booths, highways, intersections, and T-junctions. Approximately 80,000 representative frames selected from 10 hours of raw video were fully annotated with bounding boxes as well as up to 14 attributes (e.g., weather conditions, flight altitude, camera view, vehicle class, and occlusion) for three basic computer vision tasks: object detection, single object tracking, and multiple object tracking.
4.2. Experimental Setup
The experiment was executed on the ubantu operating system. At the time of the experiment, the Python version was 3.8, the PyTorch version was 1.2.0, and the Cuda version was 11.3. The hardware used for these experiments was two NVIDIA 3090 graphics cards with 24G of video memory. SRTSOD-YOLO is improved based on YOLO11 Ultralytics version 8.3.39. The training was carried out for 300 epochs and the input image was resized to 640×640 pixels. The optimization utilizes the stochastic gradient descent algorithm, starting from an initial learning rate of 0.01 and gradually decreasing to a final learning rate of 0.0001. Each model is trained without the use of pre-trained weights to ensure a fair comparison.
4.3. Experimental Evaluation Index
To fully evaluate model performance, we measure from the following dimensions: In terms of detection accuracy, the performance of all target categories is evaluated with the mean average precision mAP@0.5 and mAP@0.5:0.95 indicators. In terms of computational complexity, giga floating-point operations (GFLOPs) are used for quantization. In terms of model scale, it is reflected by the total amount of parameters. In terms of processing speed, the frames per second (FPS) indicator is used to reflect the real-time inference throughput of the model.
4.4. Assessment of Error Types
In object detection tasks, the evaluation of the model cannot rely solely on the mean average precision (mAP) metric. Although mAP provides a global quantitative evaluation of model performance and comprehensively reflects the detection accuracy of the model in various categories, it is difficult to fully reflect the specific performance of the model in real scenarios. The key point is that it is difficult to effectively identify the specific error patterns generated by the model based on the mAP score alone. For example, false positive (FP) results may stem from duplicate boxes, mislabels, mislocation, or confusion with background regions. A false negative (FN) may indicate a true target that failed to be detected or a complete prediction omission [72]. The frequency and combination of these different types of errors can have a differentiated impact on the final mAP result. Therefore, it is of great value to deeply analyze the error composition of the model.
Based on this, we attribute all FPs and FNs to the following six error types: label error(Cls), position bias(Loc), label and position double error(both), duplicate detection (Dup), background misjudgment(Bkg), and Missed target(Missed) (as shown in Figure 6). To accurately identify these error types, we adopted the TIDE toolkit [72]. This tool not only classifies and summarizes errors clearly and concisely, but also completely isolates the impact of each error type on the final result, making the error analysis results more intuitive and easy to understand.
The core principle of the TIDE tool is: for each false positive box, calculate its maximum IoU (denoted as IoUmax) with all real target boxes in the same category. Two key IoU thresholds are set: the threshold tf for distinguishing the foreground (target) defaults to 0.5, and the threshold tb for distinguishing the background defaults to 0.1 (unless a different value is specifically specified).
- Classification Error: IoUmax ≥ tf for GT of the incorrect class (i.e., localized correctly but classified incorrectly).
- Localization Error: tb ≤ IoUmax ≤ tf for GT of the correct class (i.e., classified correctly but localized incorrectly).
- Both Cls and Loc Error: tb ≤ IoUmax ≤ tf for GT of the incorrect class (i.e., classified incorrectly and localized incorrectly).
- Duplicate Detection Error: IoUmax ≥ tf for GT of the correct class but another higher-scoring detection already matched that GT (i.e., would be correct if not for a higher scoring detection).
- Background Error: IoUmax ≤ tb for all GT (i.e., detected background as foreground).
- Missed GT Error: All undetected ground truth (false negatives) not already covered by classification or localization error.
4.5. Comparative Analysis with YOLO11
After elaborating on the SRTSOD-YOLO model proposed in Chapter 3 and the evaluation indicators in Chapters 4.3 and 4.4, we compare the experimental results of different versions of the proposed SRTSOD-YOLO model and the corresponding versions of YOLO11 on the VisDrone2019 dataset. The performance and model size of SRTSOD-YOLO and YOLO11 are shown in Table 4 and Figure 7.
As shown in the data in Table 4, compared with the standard YOLO11 model, different versions of the SRTSOD-YOLO model show a leading advantage. Specifically, SRTSOD-YOLO-n reached 36.3% on the index mAP50, an increase of 3.1% compared with YOLO11n. SRTSOD-YOLO-s reached 44.4%, an increase of 3.8% compared with YOLO11s. SRTSOD-YOLO-m reached 49.6%, an increase of 6.1% compared to YOLO11m. SRTSOD-YOLO-1 reached 53.8%, an increase of 7.9% compared with YOLO11l. In terms of model parameter quantity and computational complexity, the four versions of SRTSOD-YOLO have slightly increased model parameter quantity and computational complexity compared with the corresponding versions of YOLO11. Taking SRTSOD-YOLO-l as an example, compared with YOLO11, the computational complexity is increased by 8.5% and the model parameter quantity is increased by 9.1%. These results prove that SRTSOD-YOLO achieves higher detection performance on the premise of a small increase in model parameters and computational cost. In addition, although the FPS of each version of SRTSOD-YOLO is only slightly lower than that of YOLO11, it can still fully meet the real-time processing requirements required by UAV scenarios.
As shown in Figure 7, each version of the proposed detection model SRTSOD-YOLO consistently outperforms each version of the corresponding baseline model YOLO11 regardless of the model size. In-depth analysis reveals that the difference of detection performance between the two shows a significant trend of expanding with the increase of model scale. Under the scale of version “n”, based on the mAP50 index, SRTSOD-YOLO-n achieved a performance lead of 3.1% compared to YOLO11n. However, when the model size was increased to version “l”, its mAP50 dominance value increased to 7.9%, significantly widening the gap between the two models. This phenomenon confirms that with the increase of model parameters and computational complexity, the improvement rate of SRTSOD-YOLO in detection accuracy is significantly accelerated. Therefore, when deployed on a hardware platform with sufficient computing power, especially in a large-scale model configuration, the model is expected to achieve higher target detection accuracy.
We use the TIDE toolkit to perform error type analysis on the “s” and “l” versions of the proposed SRTSOD-YOLO model and YOLO11 model, respectively, as shown in Table 5. Compared with YOLO11s, SRTSOD-YOLO-s showed a 0.24 decrease in label error measure Ecls, a 0.21 decrease in position bias measure Eloc, a 0.02 decrease in label versus position double error measure Eboth, a 0.03 decrease in duplicate detection measure Edup, a 0.09 decrease in background misjudgment measure Ebkg, and a 0.19 decrease in omission target measure Emissed. Compared with YOLO11l, SRTSOD-YOLO-l had a 0.5 decrease in label error measure Ecls, a 0.28 decrease in position bias measure Eloc, a 0.04 decrease in label versus position double error measure Eboth, a 0.09 decrease in duplicate detection measure Edup, a 0.42 decrease in background misjudgment measure Ebkg, and a 1.08 decrease in missing target measure Emissed. It can be seen that compared with the baseline model YOLO11, the six error types indicators in the detection results of the SRTSOD-YOLO model have all declined, especially the missing target measure Emissed indicator has the largest decrease. Our proposed model has better small target localization ability and fewer missed detections, which significantly proves the detection performance of the SRTSOD-YOLO model.
To validate the performance of the proposed model more comprehensively, a diverse dataset is employed for evaluation. When training the model using the Visdrone2019 dataset and the UAVDT dataset, the input image size is both 640 pixels × 640 pixels, and the training epochs are 300. It is worth noting that the two indicators, GFLOPs and model parameter quantities, are inherent attributes of the model, and their values are not affected by the type and size of the dataset. Therefore, this study focuses on the accuracy performance on the UAVDT dataset, specifically analyzing the mAP@ 0.5 and mAP@0.5:0.95 indicators.
As shown in Table 6, the results of each version of SRTSOD-YOLO and YOLO11 running on the UAVDT dataset are shown. In terms of the mAP@0.5 indicator, SRTSOD-YOLO-n improved by 1.2% over YOLO11n, SRTSOD-YOLO-s improved by 3.8% over YOLO11s, SRTSOD-YOLO-m improved by 4.9% over YOLO11m, and SRTSOD-YOLO-l improved by 3.3%. In terms of the mAP@0.5:0.95 indicator, SRTSOD-YOLO-n improved by 0.6% over YOLO11n, SRTSOD-YOLO-s improved by 2.2% over YOLO11s, SRTSOD-YOLO-m improved by 3.1% over YOLO11m, and SRTSOD-YOLO-l increased by 2.2% over YOLO11l. The results show that our proposed model has better detection performance compared to the baseline model on the UAVDT dataset.
Based on the two datasets of VisDrone2019 and UAVDT, this subsection makes a comprehensive comparison of multiple evaluation indicators for multiple versions of the proposed model and the corresponding baseline model. Tests show that our method shows significant advantages in small target detection performance. Further comparison shows that although the four variants of SRTSOD-YOLO are slightly higher than the corresponding baseline version in terms of parameter quantity and computational complexity. However, the improved model achieves higher positioning accuracy and significantly reduces the incidence of missed detection and false detection.
4.6. Ablation Experiment
To verify the effectiveness of the improved method used in the SRTSOD-YOLO network, we conducted ablation experiments based on the YOLO11n model with incremental addition of the improved method. We train the model with the same hyperparameters to conduct a fair experiment. The ablation experiment was designed as follows:
- (1)
- A: Multi-scale Feature Complementary Aggregation Module (MFCAM) is used in the backbone network.
- (2)
- B: Add a detector with a small receptive field and delete the detector with the original maximum receptive field.
- (3)
- C: A multi-scale and multi-level feature fusion pathway is reconstructed at the neck of the model to fully integrate the multi-level expression of large-size feature maps.
- (4)
- D: Use gated activation convolutional modules at the neck of the model.
- (5)
- E: The original binary cross-entropy loss was replaced by using an adaptive threshold focus loss.
The experimental results in Table 7 clearly show that with the sequential introduction of improvement strategies at each stage, the accuracy of the detection model continues to improve. In particular, the second stage has the most significant improvement in accuracy, and its mAP@0.5 index is 1.2 percentage points higher than that of the first stage when the multi-scale feature complementary aggregation module is used in the YOLO11n backbone network. In addition, the third stage increases the parameter quantity and computational complexity of the model most significantly. This result verifies that large-scale feature maps contain rich spatial detail information, and effective mining and utilization of such information can significantly improve the small target detection ability of the model. Finally, the ablation study on the VisDrone2019 dataset further confirmed that the proposed series of optimization strategies effectively improved the detection accuracy.
4.7. Visual Comparison
In order to show the performance difference between the proposed model and the baseline model more intuitively, we compared the detection effects of SRTSOD-YOLO-s and SRTSOD-YOLO-l with those of YOLO11s and YOLO11l benchmark models. As shown in Figure 8, Figure 9, Figure 10, Figure 11 and Figure 12, multiple representative pictures are selected in the test set of VisDrone2019 dataset. Under the same input conditions, our model has more advantages in detection accuracy. At the same time, the false detection rate and missed detection rate are also significantly reduced. When objects are densely distributed in some scenes, in order to improve clarity, their confidence labels and category labels are not displayed, and bounding boxes of different colors are used to distinguish different categories.
Further, through the visual comparison of heat maps between models, it is found that our proposed model significantly surpasses the benchmark system in target perception and accurate positioning. As shown in Figure 13, Figure 14, Figure 15, Figure 16 and Figure 17, this intuitive contrast of heat maps clearly reveals how our model can effectively suppress false detection and improve the accurate capture of targets in complex backgrounds. Each heat map plots the distribution of the model’s confidence in the presence of potential targets in space, where warm-colored regions (such as regions with higher concentrations of red or yellow) correspond to regions where the model is more reliable in targets localization. This visualization method not only proves the advantages of our model, but also contributes key visual guidance for subsequent model tuning and refinement. With this analysis method, we can accurately identify the performance of the model in specific situations and lock in potential room for improvement.
4.8. Comparison with YOLO Series Algorithms
With its excellent performance and wide applicability, YOLO network has become a representative framework of one-stage target detection algorithm. In order to verify the effectiveness of SRTSOD-YOLO in target detection and its adaptability to UAV application scenarios, we conducted a comprehensive evaluation of the algorithm and the YOLO series based on the VisDrone2019 data set. The experiment focuses on the detection accuracy, model parameters and computational complexity.
4.8.1. Comparison with YOLO Series Lightweight Models
To fairly compare the performance of various lightweight models, we selected YOLOv3 Tiny, YOLOv5s, YOLOv6s, YOLOv7 Tiny, YOLOv8s and YOLOv10s for testing. All models were trained with consistent hyperparameter settings, and none were loaded with any pre-training weights. Specific performance data are recorded in Table 8 and Figure 18.
The experimental data finally confirmed that compared with the YOLO series lightweight models, SRTSOD-YOLO-s achieved the best recognition effect on the premise of fewer parameters and lower computing resource requirements, and its advancement was confirmed. As shown in Figure 18, compared with large-scale targets such as “cars” and “buses”, SRTSOD-YOLO-s shows the best recognition ability in recognizing small targets (such as “people” and “pedestrian”). Specifically, in the “pedestrian” target category, compared with the YOLOv10s model, its detection performance has improved by 11.2%, and in the “people” target category, compared with the YOLOv10s model, its detection performance has improved by 11.5%. It demonstrates the model’s excellent ability in small-size target recognition tasks. The efficiency of other lightweight networks in this detection task is low, because the design of these models is positioned on the detection of conventional-scale targets, and the recognition of small-scale targets is not particularly enhanced.
4.8.2. Comparison with YOLO Series Large-Scale Models
In order to verify the competitive performance of the proposed model SRTSOD-YOLO, we conducted a systematic horizontal evaluation of the YOLO series of large models based on the VisDrone2019 dataset. See Table 9 and Figure 19 for details of the comparison results of refinement performance.
We included the YOLOv9e model in this comparison. Table 9 shows that SRTSOD-YOLO-1 is the best in three indicators: mAP@0.5, mAP@0.5:0.95 and floating-point computation, and YOLOv9e ranks second in mAP@0.5 indicator. Specifically, the mAP50 index of SRTSOD-YOLO-1 was 4.9% higher than that of YOLOv9e, but only 48.1% of the number of parameters of YOLOv9e. Figure 19 shows that YOLOv9e surpasses SRTSOD-YOLO-1 in detecting “bus” objects. However, its detection accuracy for other small-sized objects is significantly lower than that of SRTSOD-YOLO-l. These findings highlight the excellent performance of the SRTSOD-YOLO series in small object detection. It is worth noting that SRTSOD-YOLO-l has the least amount of floating-point operations among all models, highlighting its design efficiency.
In conclusion, experiments confirm that the proposed model provides the best performance at different scales. It has higher accuracy and computational efficiency than other models and is more compact. The results provide a reliable basis for selecting the most appropriate model scale according to the task requirements and computing platform conditions in practical applications.
4.9. Comparison with Other Object Detection Models
In order to comprehensively test the comprehensive performance of the SRTSOD-YOLO series models, we have constructed a multi-dimensional comparison system, which includes multiple scale improvement algorithms under the YOLO framework and long-proven classic detection methods as the benchmark reference for its performance analysis. In the field of object detection academic research, there are significant differences in the experimental paradigms adopted by different teams. Each research project shows diversity in terms of data set selection, hardware configuration and hyperparameter setting. The various widely-used models also lack a unified standard in terms of data allocation strategies (such as the proportion of training set, validation set and test set) and the defined range of target categories.Some literatures fail to fully disclose experimental details or provide comprehensive evaluation indicators, and many advanced models fail to open source code. These factors together constitute obstacles to the comparability of cross-study results. In order to ensure the rigor and verifiability of the conclusions of this study, we strictly follow the data segmentation specifications and input size standards of cutting-edge models in the domain. The model was trained based on the publicly available VisDrone benchmark dataset, and its performance was finally verified on the standardized test set.
As shown in Table 10, we systematically compare the quantification results of the model proposed in this study with multiple cutting-edge models on the VisDrone dataset. The horizontal evaluation results highlight the core competitiveness of our solution: while ensuring leading target recognition accuracy and spatial positioning accuracy, the complexity of the model architecture is significantly reduced. This coexistence of high accuracy and low resource consumption means that the model not only has excellent perception capabilities, but its exquisite structural design greatly reduces the computing load. The resulting leap in real-time processing efficiency directly strengthens the practical value and system integration potential of this technology in highly dynamic scenarios.
4.10. Comparison of UAVDT Dataset
To evaluate the generalization capability of the proposed model, we conducted comparative experiments on the UAVDT dataset. The results are shown in Table 11, and SRTSOD-YOLO-1 showed the best performance on the mAP@0.5 evaluation index. In addition, SRTSOD-YOLO-n has the best performance in model parameters and floating-point calculations. Based on these findings, the proposed model has a satisfactory generalization ability.
5. Discussion
There are many difficulties in target detection of UAV aerial images. This section describes SRTSOD-YOLO’s solutions to these problems.
5.1. Multi-Scale Object Coexistence and Difficult Feature Extraction Problem
UAVs can shoot targets from different angles and distances, and the scale of the same target changes greatly under different viewing angles. Moreover, for the same category of targets in the same aerial photography scene, the imaging of targets close to the UAV is larger, and the imaging of targets far from the UAV is smaller. The coexistence of multi-scale targets and the difficulty of feature extraction (especially for small targets) are one of the challenges faced by UAV aerial image target detection tasks. In order to meet this challenge, SRTSOD-YOLO integrates a Multi-scale Feature Complementary Aggregation Module (MFCAM) in the backbone network. MFCAM is dedicated to the combination of convolutional feature extraction of different scales through channel and spatial attention mechanisms, which can effectively capture the positions of targets of different scales in images. Secondly, SRTSOD-YOLO fuses shallow large-scale features rich in spatial information with deep features rich in semantic information in the neck of the network. In addition, SRTSOD-YOLO deleted the large target detection head (20 × 20 pixels) at the top of the original pyramid at the network head, and added a detection head specializing in tiny targets (160 × 160 pixels). Three detection heads of SRTSOD-YOLO detect targets of different scales, large, medium and small, respectively. As shown in Figure 18 and Figure 19, SRTSOD-YOLO shows satisfactory detection performance for different scale targets “bus”, “car” and “people”, proving that our solution can effectively deal with multi-scale target coexistence and difficult feature extraction problems.
5.2. Complex Background Interference and Positive and Negative Sample Imbalance Problem
In order to solve the problems of complex background interference and imbalance between positive and negative samples in UAV aerial images, we design a new neck architecture, called Gated Activation Convolutional Fusion Pyramid Network (GAC-FPN), which can improve the collaborative efficiency of spatial information and semantic information fusion, establish a complementary mechanism between multi-level features, efficiently highlight important features and suppress irrelevant background information during multi-scale feature fusion. In addition, aiming at the imbalance of positive and negative samples in the image, we use the adaptive threshold focus loss function to replace the original binary cross-entropy loss in the detection head. Therefore, SRTSOD-YOLO can accurately locate objects even in the face of complex background interference and imbalance between positive and negative samples.
6. Conclusions
This study proposes and verifies an improved real-time target detection algorithm for detecting small targets (including a variety of common vehicles and pedestrians) from the perspective of UAV. The core innovations are: Firstly, the Multi-scale Feature Complementary Aggregation Module is introduced into the backbone network. By combining the channel and spatial attention mechanisms with convolutional features of different scales, it is possible to effectively capture the positions of small targets in the image. Secondly, a novel gated activation convolutional fusion pyramid structure is adopted to optimize the feature fusion process. Furthermore, the adaptive threshold focus loss function is innovatively used to replace the standard binary cross-entropy loss, and the foreground-background imbalance problem is dealt with more effectively. The synergistic effect of these technologies significantly improves the performance of the model in accurately identifying small targets in complex backgrounds.
In order to meet the needs of diverse applications, we have launched the SRTSOD-YOLO series models with different parameter scales. Experiments on two widely recognized UAV datasets (Visdrone2019 and UAVDT) fully confirm the effectiveness and real-time of the proposed algorithm. Compared with a variety of advanced target detection models, SRTSOD-YOLO performs well on core indicators such as mAP@0.5 and mAP@0.5:0.95, significantly reducing false detection rates and missed detection rates while maintaining low computational overhead.
The innovative method in this work not only effectively solves the problem of small target detection in UAV images, but also has a broad application prospect. In key scenarios such as smart city management, dynamic environmental monitoring, and post-disaster emergency response, accurate small target identification is the key support for efficient decision-making and timely action. Future research will be devoted to further compressing the model volume and reducing the computational complexity on the basis of maintaining the high accuracy of the model. At the same time, in view of the environmental diversity and dynamics of UAV applications, we will actively explore more adaptive mechanisms and robust learning strategies to enhance the model’s adaptability in various complex mission scenarios. In addition, we plan to cooperate with the company to promote the actual deployment and test verification of the model, aiming to provide more powerful and flexible UAV target detection solutions for related fields.
Author Contributions
Conceptualization, Z.X., H.Z. and P.L.; methodology, Z.X., H.Z. and P.L.; software, Z.X. and G.Z.; validation, Z.X., G.Z. and Y.C.; writing—original draft preparation, Z.X.; writing—review and editing, Z.X. and L.W. All authors have read and agreed to the published version of the manuscript.
Funding
This research received no external funding.
Data Availability Statement
The original contributions presented in the study are included in the article, further inquiries can be directed to the corresponding author.
Acknowledgments
We thank the editors and reviewers for their hard work and valuable advice.
Conflicts of Interest
The authors declare no conflicts of interest.
References
- Byun, S.; Shin, I.-K.; Moon, J.; Kang, J.; Choi, S.-I. Road Traffic Monitoring from UAV Images Using Deep Learning Networks. Remote Sensing 2021, 13, 4027. [Google Scholar] [CrossRef]
- Sun, W.; Dai, L.; Zhang, X.; Chang, P.; He, X. RSOD: Real-Time Small Object Detection Algorithm in UAV-Based Traffic Monitoring. Appl Intell 2022, 52, 8448–8463. [Google Scholar] [CrossRef]
- Muhmad Kamarulzaman, A. M.; Wan Mohd Jaafar, W. S.; Mohd Said, M. N.; Saad, S. N. M.; Mohan, M. UAV Implementations in Urban Planning and Related Sectors of Rapidly Developing Nations: A Review and Future Perspectives for Malaysia. Remote Sensing 2023, 15, 2845. [Google Scholar] [CrossRef]
- Yu, Y.; Gu, T.; Guan, H.; Li, D.; Jin, S. Vehicle Detection From High-Resolution Remote Sensing Imagery Using Convolutional Capsule Networks. IEEE Geosci. Remote Sensing Lett. 2019, 16, 1894–1898. [Google Scholar] [CrossRef]
- Li, Y.; Huang, Y.; Tao, Q. Improving Real-Time Object Detection in Internet-of-Things Smart City Traffic with YOLOv8-DSAF Method. Sci Rep 2024, 14. [Google Scholar] [CrossRef]
- An, R.; Zhang, X.; Sun, M.; Wang, G. GC-YOLOv9: Innovative Smart City Traffic Monitoring Solution. Alexandria Engineering Journal 2024, 106, 277–287. [Google Scholar] [CrossRef]
- Li, Z.; Zhang, Y.; Wu, H.; Suzuki, S.; Namiki, A.; Wang, W. Design and Application of a UAV Autonomous Inspection System for High-Voltage Power Transmission Lines. Remote Sensing 2023, 15, 865. [Google Scholar] [CrossRef]
- Vedanth, S.; B, U. N. K.; Harshavardhan, S.; Rao, T.; Kodipalli, A. Drone-Based Artificial Intelligence for Efficient Disaster Management: The Significance of Accurate Object Detection and Recognition. In 2024 IEEE 9th International Conference for Convergence in Technology (I2CT); IEEE: Pune, India, 2024; pp. 1–5. [Google Scholar] [CrossRef]
- Girshick, R.; Donahue, J.; Darrell, T.; Malik, J. Rich Feature Hierarchies for Accurate Object Detection and Semantic Segmentation.
- He, K.; Zhang, X.; Ren, S.; Sun, J. Spatial Pyramid Pooling in Deep Convolutional Networks for Visual Recognition. IEEE Trans. Pattern Anal. Mach. Intell. 2015, 37, 1904–1916. [Google Scholar] [CrossRef]
- Girshick_Fast_R-CNN_ICCV_2015_paper.
- Ren, S.; He, K.; Girshick, R.; Sun, J. Faster R-CNN: Towards Real-Time Object Detection with Region Proposal Networks. IEEE Trans. Pattern Anal. Mach. Intell. 2017, 39, 1137–1149. [Google Scholar] [CrossRef]
- Vaswani, A.; Shazeer, N.; Parmar, N.; Uszkoreit, J.; Jones, L.; Gomez, A. N.; Kaiser, Ł.; Polosukhin, I. Attention Is All You Need.
- Dosovitskiy, A.; Beyer, L.; Kolesnikov, A.; Weissenborn, D.; Zhai, X.; Unterthiner, T.; Dehghani, M.; Minderer, M.; Heigold, G.; Gelly, S.; Uszkoreit, J.; Houlsby, N. An Image Is Worth 16x16 Words: Transformers for Image Recognition at Scale. arXiv June 3, 2021. [CrossRef]
- End-to-End Object Detection with Transformers. Lecture Notes in Computer Science; Springer International Publishing: Cham, 2020; pp. 213–229. [Google Scholar] [CrossRef]
- Microsoft COCO: Common Objects in Context. Lecture Notes in Computer Science; Springer International Publishing: Cham, 2014; pp. 740–755. [Google Scholar] [CrossRef]
- Everingham, M.; Van Gool, L.; Williams, C. K. I.; Winn, J.; Zisserman, A. The Pascal Visual Object Classes (VOC) Challenge. Int J Comput Vis 2010, 88, 303–338. [Google Scholar] [CrossRef]
- Long, Y.; Gong, Y.; Xiao, Z.; Liu, Q. Accurate Object Localization in Remote Sensing Images Based on Convolutional Neural Networks. IEEE Trans. Geosci. Remote Sensing 2017, 55, 2486–2498. [Google Scholar] [CrossRef]
- Yu, X.; Gong, Y.; Jiang, N.; Ye, Q.; Han, Z. Scale Match for Tiny Person Detection. In 2020 IEEE Winter Conference on Applications of Computer Vision (WACV); IEEE: Snowmass Village, CO, USA, 2020. [Google Scholar] [CrossRef]
- Li, W.; Wei, W.; Zhang, L. GSDet: Object Detection in Aerial Images Based on Scale Reasoning. IEEE Trans. on Image Process. 2021, 30, 4599–4609. [Google Scholar] [CrossRef]
- Liu, K.; Fu, Z.; Jin, S.; Chen, Z.; Zhou, F.; Jiang, R.; Chen, Y.; Ye, J. ESOD: Efficient Small Object Detection on High-Resolution Images. IEEE Trans. on Image Process. 2025, 34, 183–195. [Google Scholar] [CrossRef]
- Adaimi, G.; Kreiss, S.; Alahi, A. Perceiving Traffic from Aerial Images. arXiv September 16, 2020. [CrossRef]
- Bouguettaya, A.; Zarzour, H.; Kechida, A.; Taberkit, A. M. Vehicle Detection From UAV Imagery With Deep Learning: A Review. IEEE Trans. Neural Netw. Learning Syst. 2022, 33, 6047–6067. [Google Scholar] [CrossRef] [PubMed]
- Zhu, P.; Wen, L.; Bian, X.; Ling, H.; Hu, Q. Vision Meets Drones: A Challenge. arXiv April 23, 2018. [CrossRef]
- Du, B.; Huang, Y.; Chen, J.; Huang, D. Adaptive Sparse Convolutional Networks with Global Context Enhancement for Faster Object Detection on Drone Images. In 2023 IEEE/CVF Conference on Computer Vision and Pattern Recognition (CVPR); IEEE: Vancouver, BC, Canada, 2023; pp. 13435–13444. [Google Scholar] [CrossRef]
- Ghiasi, G.; Cui, Y.; Srinivas, A.; Qian, R.; Lin, T.-Y.; Cubuk, E. D.; Le, Q. V.; Zoph, B. Simple Copy-Paste Is a Strong Data Augmentation Method for Instance Segmentation. In 2021 IEEE/CVF Conference on Computer Vision and Pattern Recognition (CVPR); IEEE: Nashville, TN, USA, 2021. [Google Scholar] [CrossRef]
- Kisantal, M.; Wojna, Z.; Murawski, J.; Naruniec, J.; Cho, K. Augmentation for Small Object Detection. arXiv February 19, 2019. [CrossRef]
- Chen, C.; Zhang, Y.; Lv, Q.; Wei, S.; Wang, X.; Sun, X.; Dong, J. RRNet: A Hybrid Detector for Object Detection in Drone-Captured Images. In 2019 IEEE/CVF International Conference on Computer Vision Workshop (ICCVW); IEEE: Seoul, Korea (South), 2019. [Google Scholar] [CrossRef]
- Zhang, X.; Izquierdo, E.; Chandramouli, K. Dense and Small Object Detection in UAV Vision Based on Cascade Network. In 2019 IEEE/CVF International Conference on Computer Vision Workshop (ICCVW); IEEE: Seoul, Korea (South), 2019; pp. 118–126. [Google Scholar] [CrossRef]
- Wang, X.; Zhu, D.; Yan, Y. Towards Efficient Detection for Small Objects via Attention-Guided Detection Network and Data Augmentation. Sensors 2022, 22, 7663. [Google Scholar] [CrossRef] [PubMed]
- Bosquet, B.; Cores, D.; Seidenari, L.; Brea, V. M.; Mucientes, M.; Bimbo, A. D. A Full Data Augmentation Pipeline for Small Object Detection Based on Generative Adversarial Networks. Pattern Recognition 2023, 133, 108998. [Google Scholar] [CrossRef]
- Liu, S.; Qi, L.; Qin, H.; Shi, J.; Jia, J. Path Aggregation Network for Instance Segmentation.
- Liu, Z.; Gao, G.; Sun, L.; Fang, L. IPG-Net: Image Pyramid Guidance Network for Small Object Detection. In 2020 IEEE/CVF Conference on Computer Vision and Pattern Recognition Workshops (CVPRW); IEEE: Seattle, WA, USA, 2020; pp. 4422–4430. [Google Scholar] [CrossRef]
- Gong, Y.; Yu, X.; Ding, Y.; Peng, X.; Zhao, J.; Han, Z. Effective Fusion Factor in FPN for Tiny Object Detection. In 2021 IEEE Winter Conference on Applications of Computer Vision (WACV); IEEE: Waikoloa, HI, USA, 2021; pp. 1159–1167. [Google Scholar] [CrossRef]
- Liu, S.; Huang, D.; Wang, Y. Learning Spatial Fusion for Single-Shot Object Detection. arXiv November 25, 2019. [CrossRef]
- Yang, X.; Yang, J.; Yan, J.; Zhang, Y.; Zhang, T.; Guo, Z.; Sun, X.; Fu, K. SCRDet: Towards More Robust Detection for Small, Cluttered and Rotated Objects. In 2019 IEEE/CVF International Conference on Computer Vision (ICCV); IEEE: Seoul, Korea (South), 2019; pp. 8231–8240. [Google Scholar] [CrossRef]
- Fu, J.; Sun, X.; Wang, Z.; Fu, K. An Anchor-Free Method Based on Feature Balancing and Refinement Network for Multiscale Ship Detection in SAR Images. IEEE Trans. Geosci. Remote Sensing 2021, 59, 1331–1344. [Google Scholar] [CrossRef]
- Lu, X.; Ji, J.; Xing, Z.; Miao, Q. Attention and Feature Fusion SSD for Remote Sensing Object Detection. IEEE Trans. Instrum. Meas. 2021, 70, 1–9. [Google Scholar] [CrossRef]
- Ran, Q.; Wang, Q.; Zhao, B.; Wu, Y.; Pu, S.; Li, Z. Lightweight Oriented Object Detection Using Multiscale Context and Enhanced Channel Attention in Remote Sensing Images. IEEE J. Sel. Top. Appl. Earth Observations Remote Sensing 2021, 14, 5786–5795. [Google Scholar] [CrossRef]
- Wu, X.; Hong, D.; Chanussot, J. UIU-Net: U-Net in U-Net for Infrared Small Object Detection. IEEE Trans. on Image Process. 2023, 32, 364–376. [Google Scholar] [CrossRef]
- Du, D.; Qi, Y.; Yu, H.; Yang, Y.; Duan, K.; Li, G.; Zhang, W.; Huang, Q.; Tian, Q. The Unmanned Aerial Vehicle Benchmark: Object Detection and Tracking. In Computer Vision – ECCV 2018; Ferrari, V., Hebert, M., Sminchisescu, C., Weiss, Y., Eds.; Lecture Notes in Computer Science; Springer International Publishing: Cham, 2018; Vol. 11214, pp. 375–391. [Google Scholar] [CrossRef]
- Zhu, P.; Wen, L.; Du, D.; Bian, X.; Fan, H.; Hu, Q.; Ling, H. Detection and Tracking Meet Drones Challenge. IEEE Trans. Pattern Anal. Mach. Intell. 2022, 44, 7380–7399. [Google Scholar] [CrossRef] [PubMed]
- Li, S.; Yang, Y.; Zeng, D.; Wang, X. Adaptive and Background-Aware Vision Transformer for Real-Time UAV Tracking. In 2023 IEEE/CVF International Conference on Computer Vision (ICCV); IEEE: Paris, France, 2023; pp. 13943–13954. [Google Scholar] [CrossRef]
- Wang, H.; Shen, Q.; Deng, Z. A Diverse Knowledge Perception and Fusion Network for Detecting Targets and Key Parts in UAV Images. Neurocomputing 2025, 612, 128748. [Google Scholar] [CrossRef]
- Chen, C.; Qi, J.; Liu, X.; Bin, K.; Fu, R.; Hu, X.; Zhong, P. Weakly Misalignment-Free Adaptive Feature Alignment for UAVs-Based Multimodal Object Detection.
- Wang, H.; Wang, C.; Fu, Q.; Zhang, D.; Kou, R.; Yu, Y.; Song, J. Cross-Modal Oriented Object Detection of UAV Aerial Images Based on Image Feature. IEEE Trans. Geosci. Remote Sensing 2024, 62, 1–21. [Google Scholar] [CrossRef]
- Liu, J.; Wen, B.; Xiao, J.; Sun, M. Design of UAV Target Detection Network Based on Deep Feature Fusion and Optimization with Small Targets in Complex Contexts. Neurocomputing 2025, 639, 130207. [Google Scholar] [CrossRef]
- Wang, J.; Li, X.; Chen, J.; Zhou, L.; Guo, L.; He, Z.; Zhou, H.; Zhang, Z. DPH-YOLOv8: Improved YOLOv8 Based on Double Prediction Heads for the UAV Image Object Detection. IEEE Trans. Geosci. Remote Sensing 2024, 62, 1–15. [Google Scholar] [CrossRef]
- Suo, J.; Zhang, X.; Shi, W.; Zhou, W. E3-UAV: An Edge-Based Energy-Efficient Object Detection System for Unmanned Aerial Vehicles. IEEE Internet Things J. 2024, 11, 4398–4413. [Google Scholar] [CrossRef]
- Wang, K.; Fu, X.; Huang, Y.; Cao, C.; Shi, G.; Zha, Z.-J. Generalized UAV Object Detection via Frequency Domain Disentanglement. In 2023 IEEE/CVF Conference on Computer Vision and Pattern Recognition (CVPR); IEEE: Vancouver, BC, Canada, 2023; pp. 1064–1073. [Google Scholar] [CrossRef]
- Chen, Y.; Ye, Z.; Sun, H.; Gong, T.; Xiong, S.; Lu, X. Global–Local Fusion With Semantic Information Guidance for Accurate Small Object Detection in UAV Aerial Images. IEEE Trans. Geosci. Remote Sensing 2025, 63, 1–15. [Google Scholar] [CrossRef]
- Ying, Z.; Zhou, J.; Zhai, Y.; Quan, H.; Li, W.; Genovese, A.; Piuri, V.; Scotti, F. Large-Scale High-Altitude UAV-Based Vehicle Detection via Pyramid Dual Pooling Attention Path Aggregation Network. IEEE Trans. Intell. Transport. Syst. 2024, 25, 14426–14444. [Google Scholar] [CrossRef]
- Zou, T.; Ge, Q.; Huang, Y. MFP-DETR: Marine UAV Target Detection Based on Multi-Scale Fuzzy Perception. Neurocomputing 2025, 635, 129843. [Google Scholar] [CrossRef]
- Dutta, A.; Das, S.; Nielsen, J.; Chakraborty, R.; Shah, M. Multiview Aerial Visual Recognition (MAVREC): Can Multi-View Improve Aerial Visual Perception? In 2024 IEEE/CVF Conference on Computer Vision and Pattern Recognition (CVPR); IEEE: Seattle, WA, USA, 2024; pp. 22678–22690. [Google Scholar] [CrossRef]
- Ding, X.; Zhang, R.; Liu, Q.; Yang, Y. Real-Time Small Object Detection Using Adaptive Weighted Fusion of Efficient Positional Features. Pattern Recognition 2025, 167, 111717. [Google Scholar] [CrossRef]
- Redmon, J.; Divvala, S.; Girshick, R.; Farhadi, A. You Only Look Once: Unified, Real-Time Object Detection. In 2016 IEEE Conference on Computer Vision and Pattern Recognition (CVPR); IEEE: Las Vegas, NV, USA, 2016; pp. 779–788. [Google Scholar] [CrossRef]
- Redmon, J.; Farhadi, A. YOLO9000: Better, Faster, Stronger. In 2017 IEEE Conference on Computer Vision and Pattern Recognition (CVPR); IEEE: Honolulu, HI, 2017; pp. 6517–6525. [Google Scholar] [CrossRef]
- Redmon, J.; Farhadi, A. YOLOv3: An Incremental Improvement.
- Redmon, J.; Farhadi, A. YOLO9000: Better, Faster, Stronger. arXiv December 25, 2016. http://arxiv.org/abs/1612.08242 (accessed 2023-05-25).
- Bochkovskiy, A.; Wang, C.-Y.; Liao, H.-Y. M. YOLOv4: Optimal Speed and Accuracy of Object Detection. arXiv April 22, 2020. http://arxiv.org/abs/2004.10934 (accessed 2024-03-11).
- Li, C.; Li, L.; Jiang, H.; Weng, K.; Geng, Y.; Li, L.; Ke, Z.; Li, Q.; Cheng, M.; Nie, W.; Li, Y.; Zhang, B.; Liang, Y.; Zhou, L.; Xu, X.; Chu, X.; Wei, X.; Wei, X. YOLOv6: A Single-Stage Object Detection Framework for Industrial Applications. arXiv September 7, 2022. http://arxiv.org/abs/2209.02976 (accessed 2024-03-11).
- Wang, C.-Y.; Bochkovskiy, A.; Liao, H.-Y. M. YOLOv7: Trainable Bag-of-Freebies Sets New State-of-the-Art for Real-Time Object Detectors. In 2023 IEEE/CVF Conference on Computer Vision and Pattern Recognition (CVPR); IEEE: Vancouver, BC, Canada, 2023; pp. 7464–7475. [Google Scholar] [CrossRef]
- YOLOv9: Learning What You Want to Learn Using Programmable Gradient Information. Lecture Notes in Computer Science; Springer Nature Switzerland: Cham, 2025; pp. 1–21. [Google Scholar] [CrossRef]
- Wang, A.; Chen, H.; Liu, L.; Chen, K.; Lin, Z.; Han, J.; Ding, G. YOLOv10: Real-Time End-to-End Object Detection. arXiv October 30, 2024. [CrossRef]
- Xiao, Y.; Xu, T.; Xin, Y.; Li, J. FBRT-YOLO: Faster and Better for Real-Time Aerial Image Detection. AAAI 2025, 39, 8673–8681. [Google Scholar] [CrossRef]
- Lin, T.-Y.; Dollar, P.; Girshick, R.; He, K.; Hariharan, B.; Belongie, S. Feature Pyramid Networks for Object Detection. In 2017 IEEE Conference on Computer Vision and Pattern Recognition (CVPR); IEEE: Honolulu, HI, 2017. [Google Scholar] [CrossRef]
- Liu, H.; Jia, C.; Shi, F.; Cheng, X.; Chen, S. SCSegamba: Lightweight Structure-Aware Vision Mamba for Crack Segmentation in Structures. arXiv March 23, 2025. [CrossRef]
- Dauphin, Y. N.; Fan, A.; Auli, M.; Grangier, D. Language Modeling with Gated Convolutional Networks.
- Yu, J.; Lin, Z.; Yang, J.; Shen, X.; Lu, X.; Huang, T. S. Free-Form Image Inpainting With Gated Convolution.
- Li, J.; Nie, Q.; Fu, W.; Lin, Y.; Tao, G.; Liu, Y.; Wang, C. LORS: Low-Rank Residual Structure for Parameter-Efficient Network Stacking. In 2024 IEEE/CVF Conference on Computer Vision and Pattern Recognition (CVPR); IEEE: Seattle, WA, USA, 2024; pp. 15866–15876. [Google Scholar] [CrossRef]
- Yang, B.; Zhang, X.; Zhang, J.; Luo, J.; Zhou, M.; Pi, Y. EFLNet: Enhancing Feature Learning Network for Infrared Small Target Detection. IEEE Trans. Geosci. Remote Sensing 2024, 62, 1–11. [Google Scholar] [CrossRef]
- TIDE: A General Toolbox for Identifying Object Detection Errors. In Lecture Notes in Computer Science; Springer International Publishing: Cham, 2020; pp. 558–573. [CrossRef]
- Yue, M.; Zhang, L.; Huang, J.; Zhang, H. Lightweight and Efficient Tiny-Object Detection Based on Improved YOLOv8n for UAV Aerial Images. Drones 2024, 8, 276. [Google Scholar] [CrossRef]
- Xu, H.; Zheng, W.; Liu, F.; Li, P.; Wang, R. Unmanned Aerial Vehicle Perspective Small Target Recognition Algorithm Based on Improved YOLOv5. Remote Sensing 2023, 15, 3583. [Google Scholar] [CrossRef]
- Li, Y.; Fan, Q.; Huang, H.; Han, Z.; Gu, Q. A Modified YOLOv8 Detection Network for UAV Aerial Image Recognition. Drones 2023, 7, 304. [Google Scholar] [CrossRef]
- Tahir, N. U. A.; Long, Z.; Zhang, Z.; Asim, M.; ELAffendi, M. PVswin-YOLOv8s: UAV-Based Pedestrian and Vehicle Detection for Traffic Management in Smart Cities Using Improved YOLOv8. Drones 2024, 8, 84. [Google Scholar] [CrossRef]
- Wang, G.; Chen, Y.; An, P.; Hong, H.; Hu, J.; Huang, T. UAV-YOLOv8: A Small-Object-Detection Model Based on Improved YOLOv8 for UAV Aerial Photography Scenarios. Sensors 2023, 23, 7190. [Google Scholar] [CrossRef]
- Zhang, Z. Drone-YOLO: An Efficient Neural Network Method for Target Detection in Drone Images. Drones 2023, 7, 526. [Google Scholar] [CrossRef]
- Liu, Y.; Zhang, J.; Liu, S.; Xu, L.; Wang, Y. Aams-Yolo: A Small Object Detection Method for UAV Capture Scenes Based on YOLOv7. Cluster Comput 2025, 28. [Google Scholar] [CrossRef]
- Bai, C.; Zhang, K.; Jin, H.; Qian, P.; Zhai, R.; Lu, K. SFFEF-YOLO: Small Object Detection Network Based on Fine-Grained Feature Extraction and Fusion for Unmanned Aerial Images. Image and Vision Computing 2025, 156, 105469. [Google Scholar] [CrossRef]
- Chen, Z.; Zhang, Y.; Xing, S. YOLO-LE: A Lightweight and Efficient UAV Aerial Image Target Detection Model. Springer Science and Business Media LLC September 12, 2024. [CrossRef]
- Lu, Y.; Sun, M. Lightweight Multidimensional Feature Enhancement Algorithm LPS-YOLO for UAV Remote Sensing Target Detection. Sci Rep 2025, 15. [Google Scholar] [CrossRef] [PubMed]
- Wang, H.; Liu, J.; Zhao, J.; Zhang, J.; Zhao, D. Precision and Speed: LSOD-YOLO for Lightweight Small Object Detection. Expert Systems with Applications 2025, 269, 126440. [Google Scholar] [CrossRef]
- Zhou, L.; Zhao, S.; Liu, Z.; Zhang, W.; Qiao, B.; Liu, Y. A Lightweight Aerial Image Object Detector Based on Mask Information Enhancement. IEEE Trans. Instrum. Meas. 2025, 74, 1–17. [Google Scholar] [CrossRef]
- Jiang, L.; Yuan, B.; Du, J.; Chen, B.; Xie, H.; Tian, J.; Yuan, Z. MFFSODNet: Multiscale Feature Fusion Small Object Detection Network for UAV Aerial Images. IEEE Trans. Instrum. Meas. 2024, 73, 1–14. [Google Scholar] [CrossRef]
- Yan, H.; Kong, X.; Wang, J.; Tomiyama, H. ST-YOLO: An Enhanced Detector of Small Objects in Unmanned Aerial Vehicle Imagery. Drones 2025, 9, 338. [Google Scholar] [CrossRef]
Figure 1.
Examples of drone aerial images.
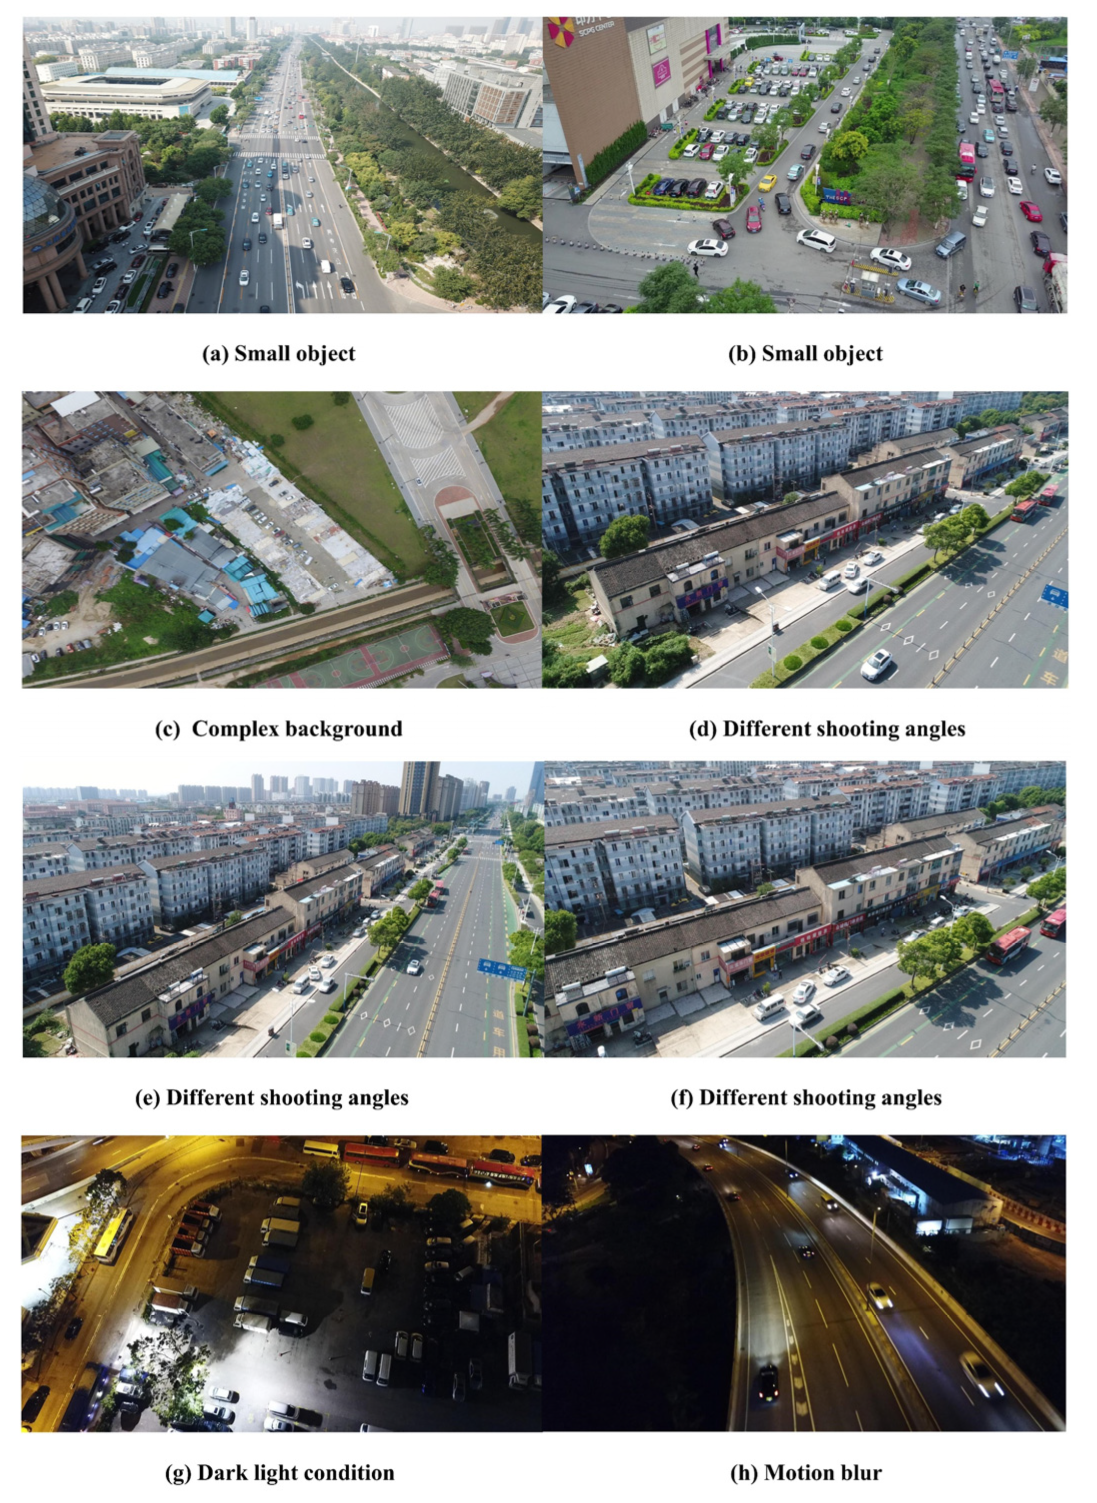
Figure 2.
The YOLO11 network structure diagram.
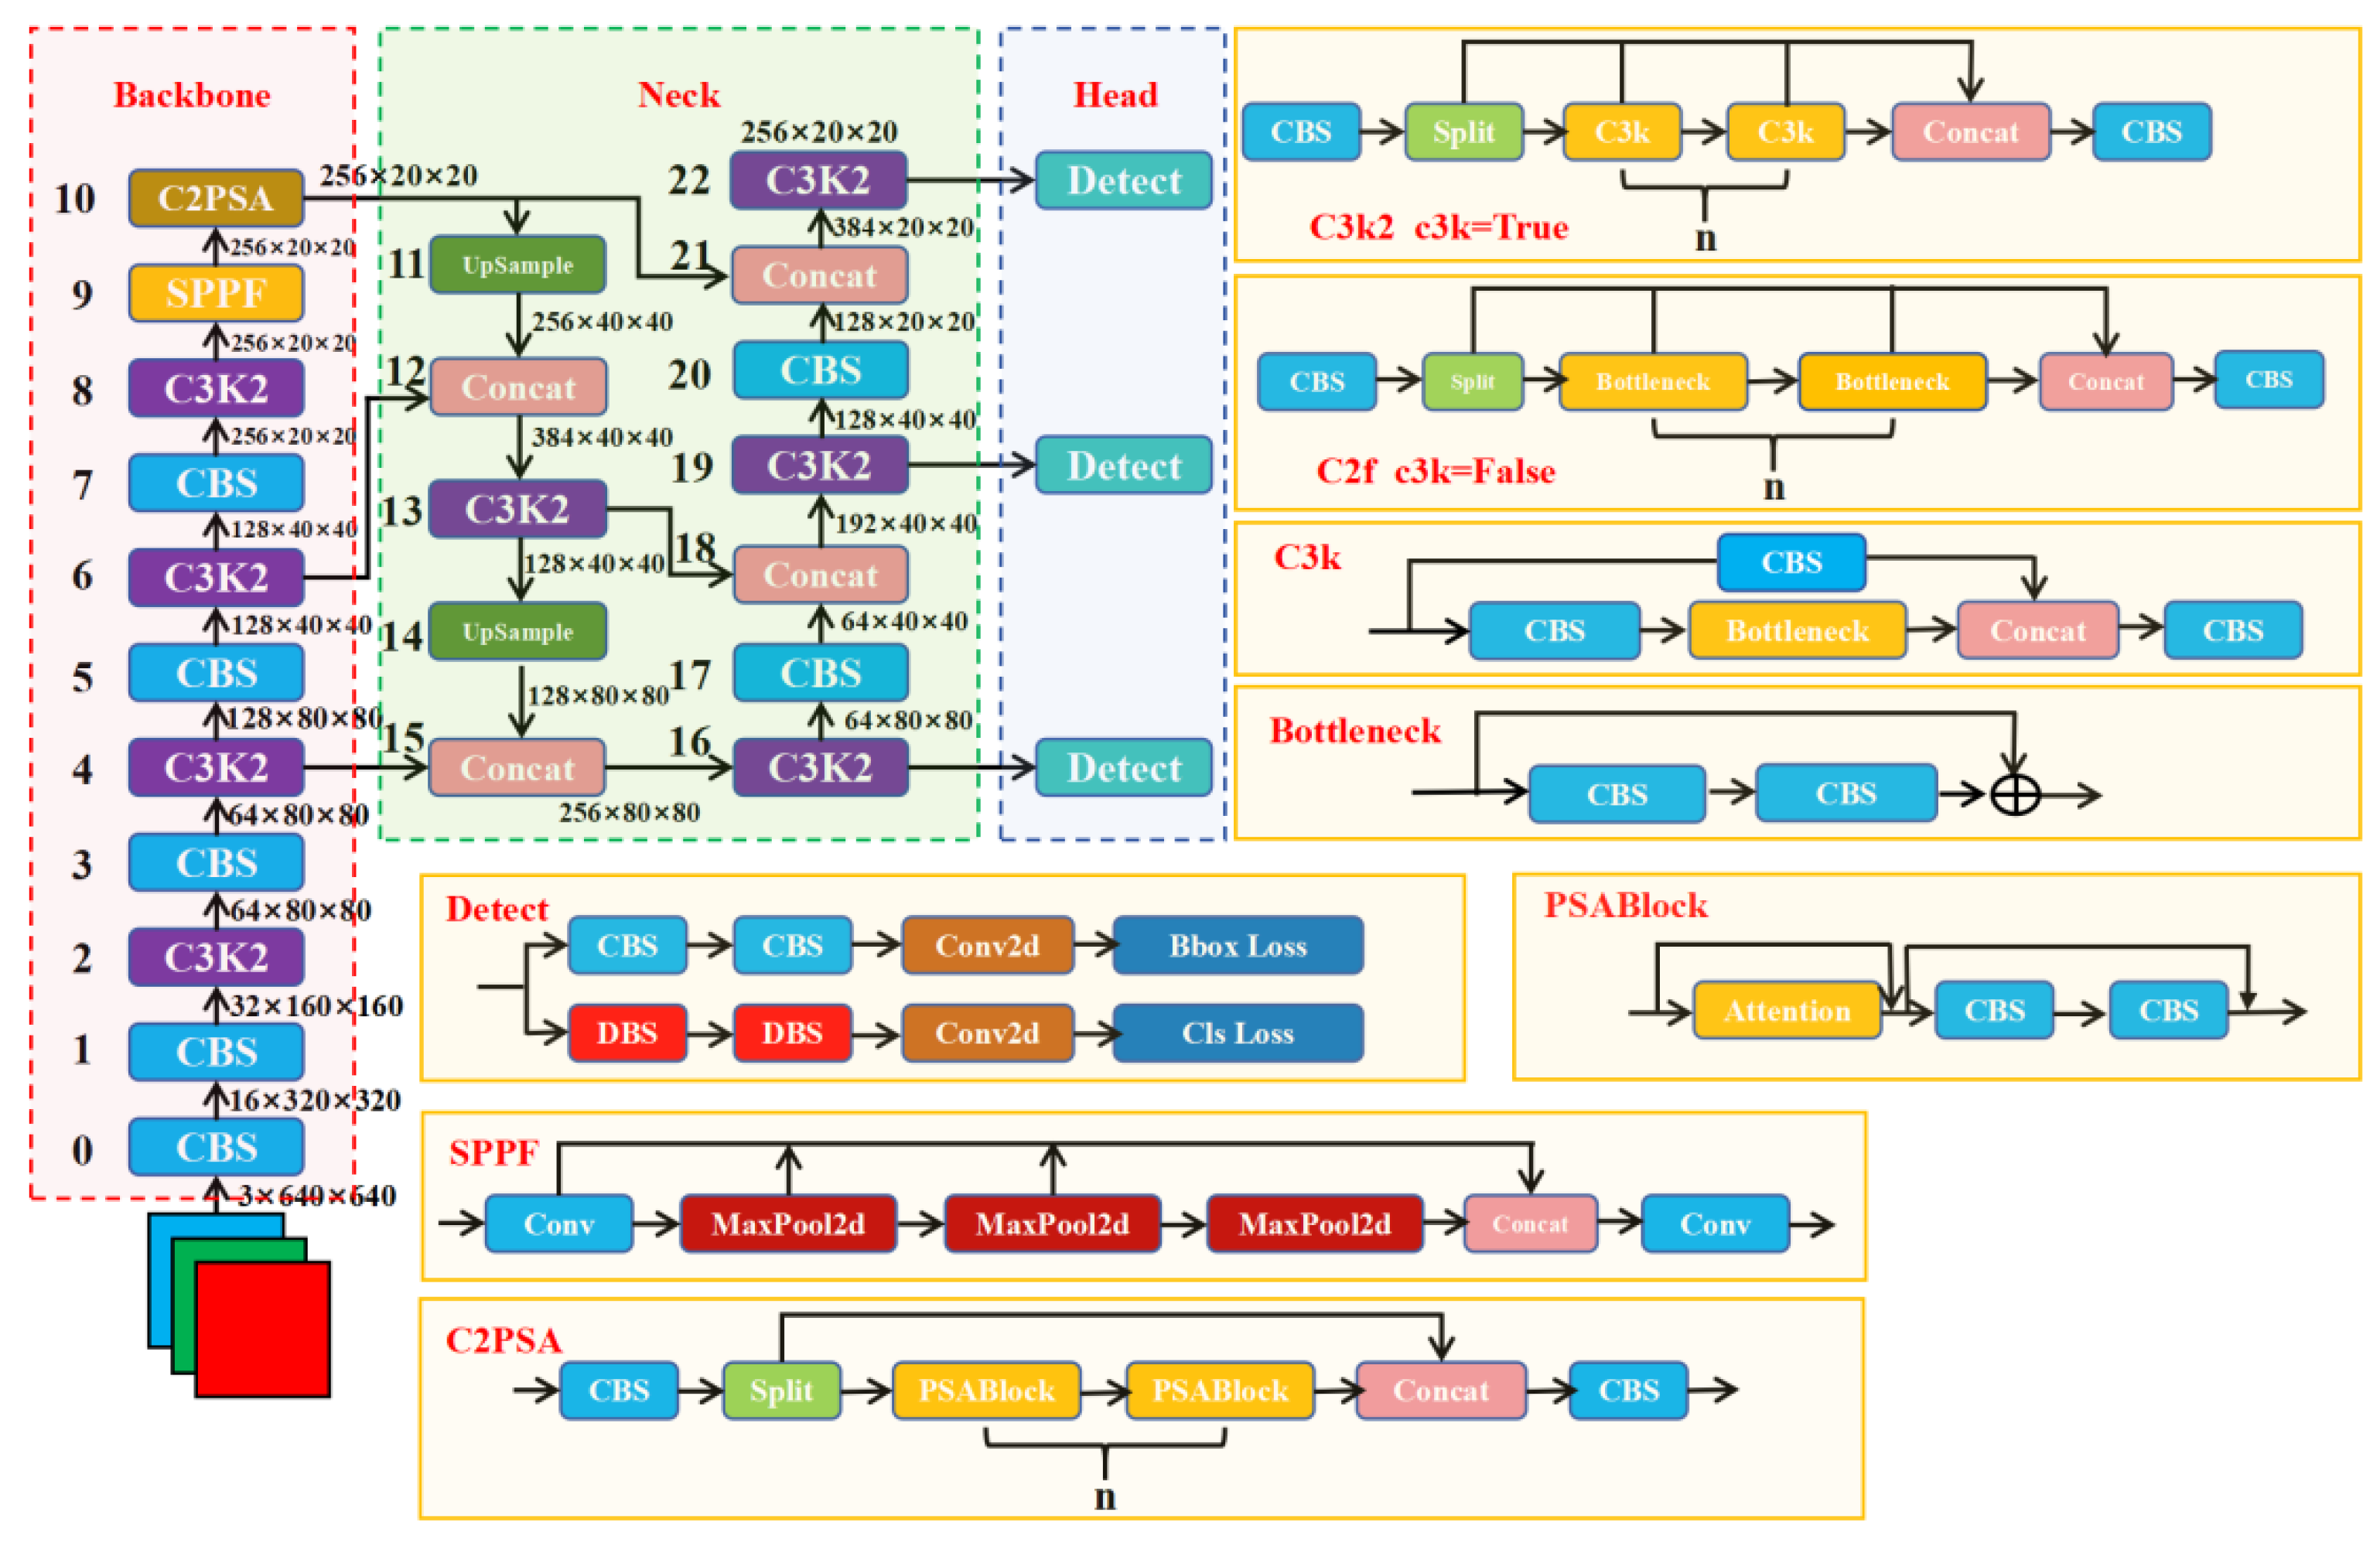
Figure 3.
The SRTSOD-YOLO network structure diagram.
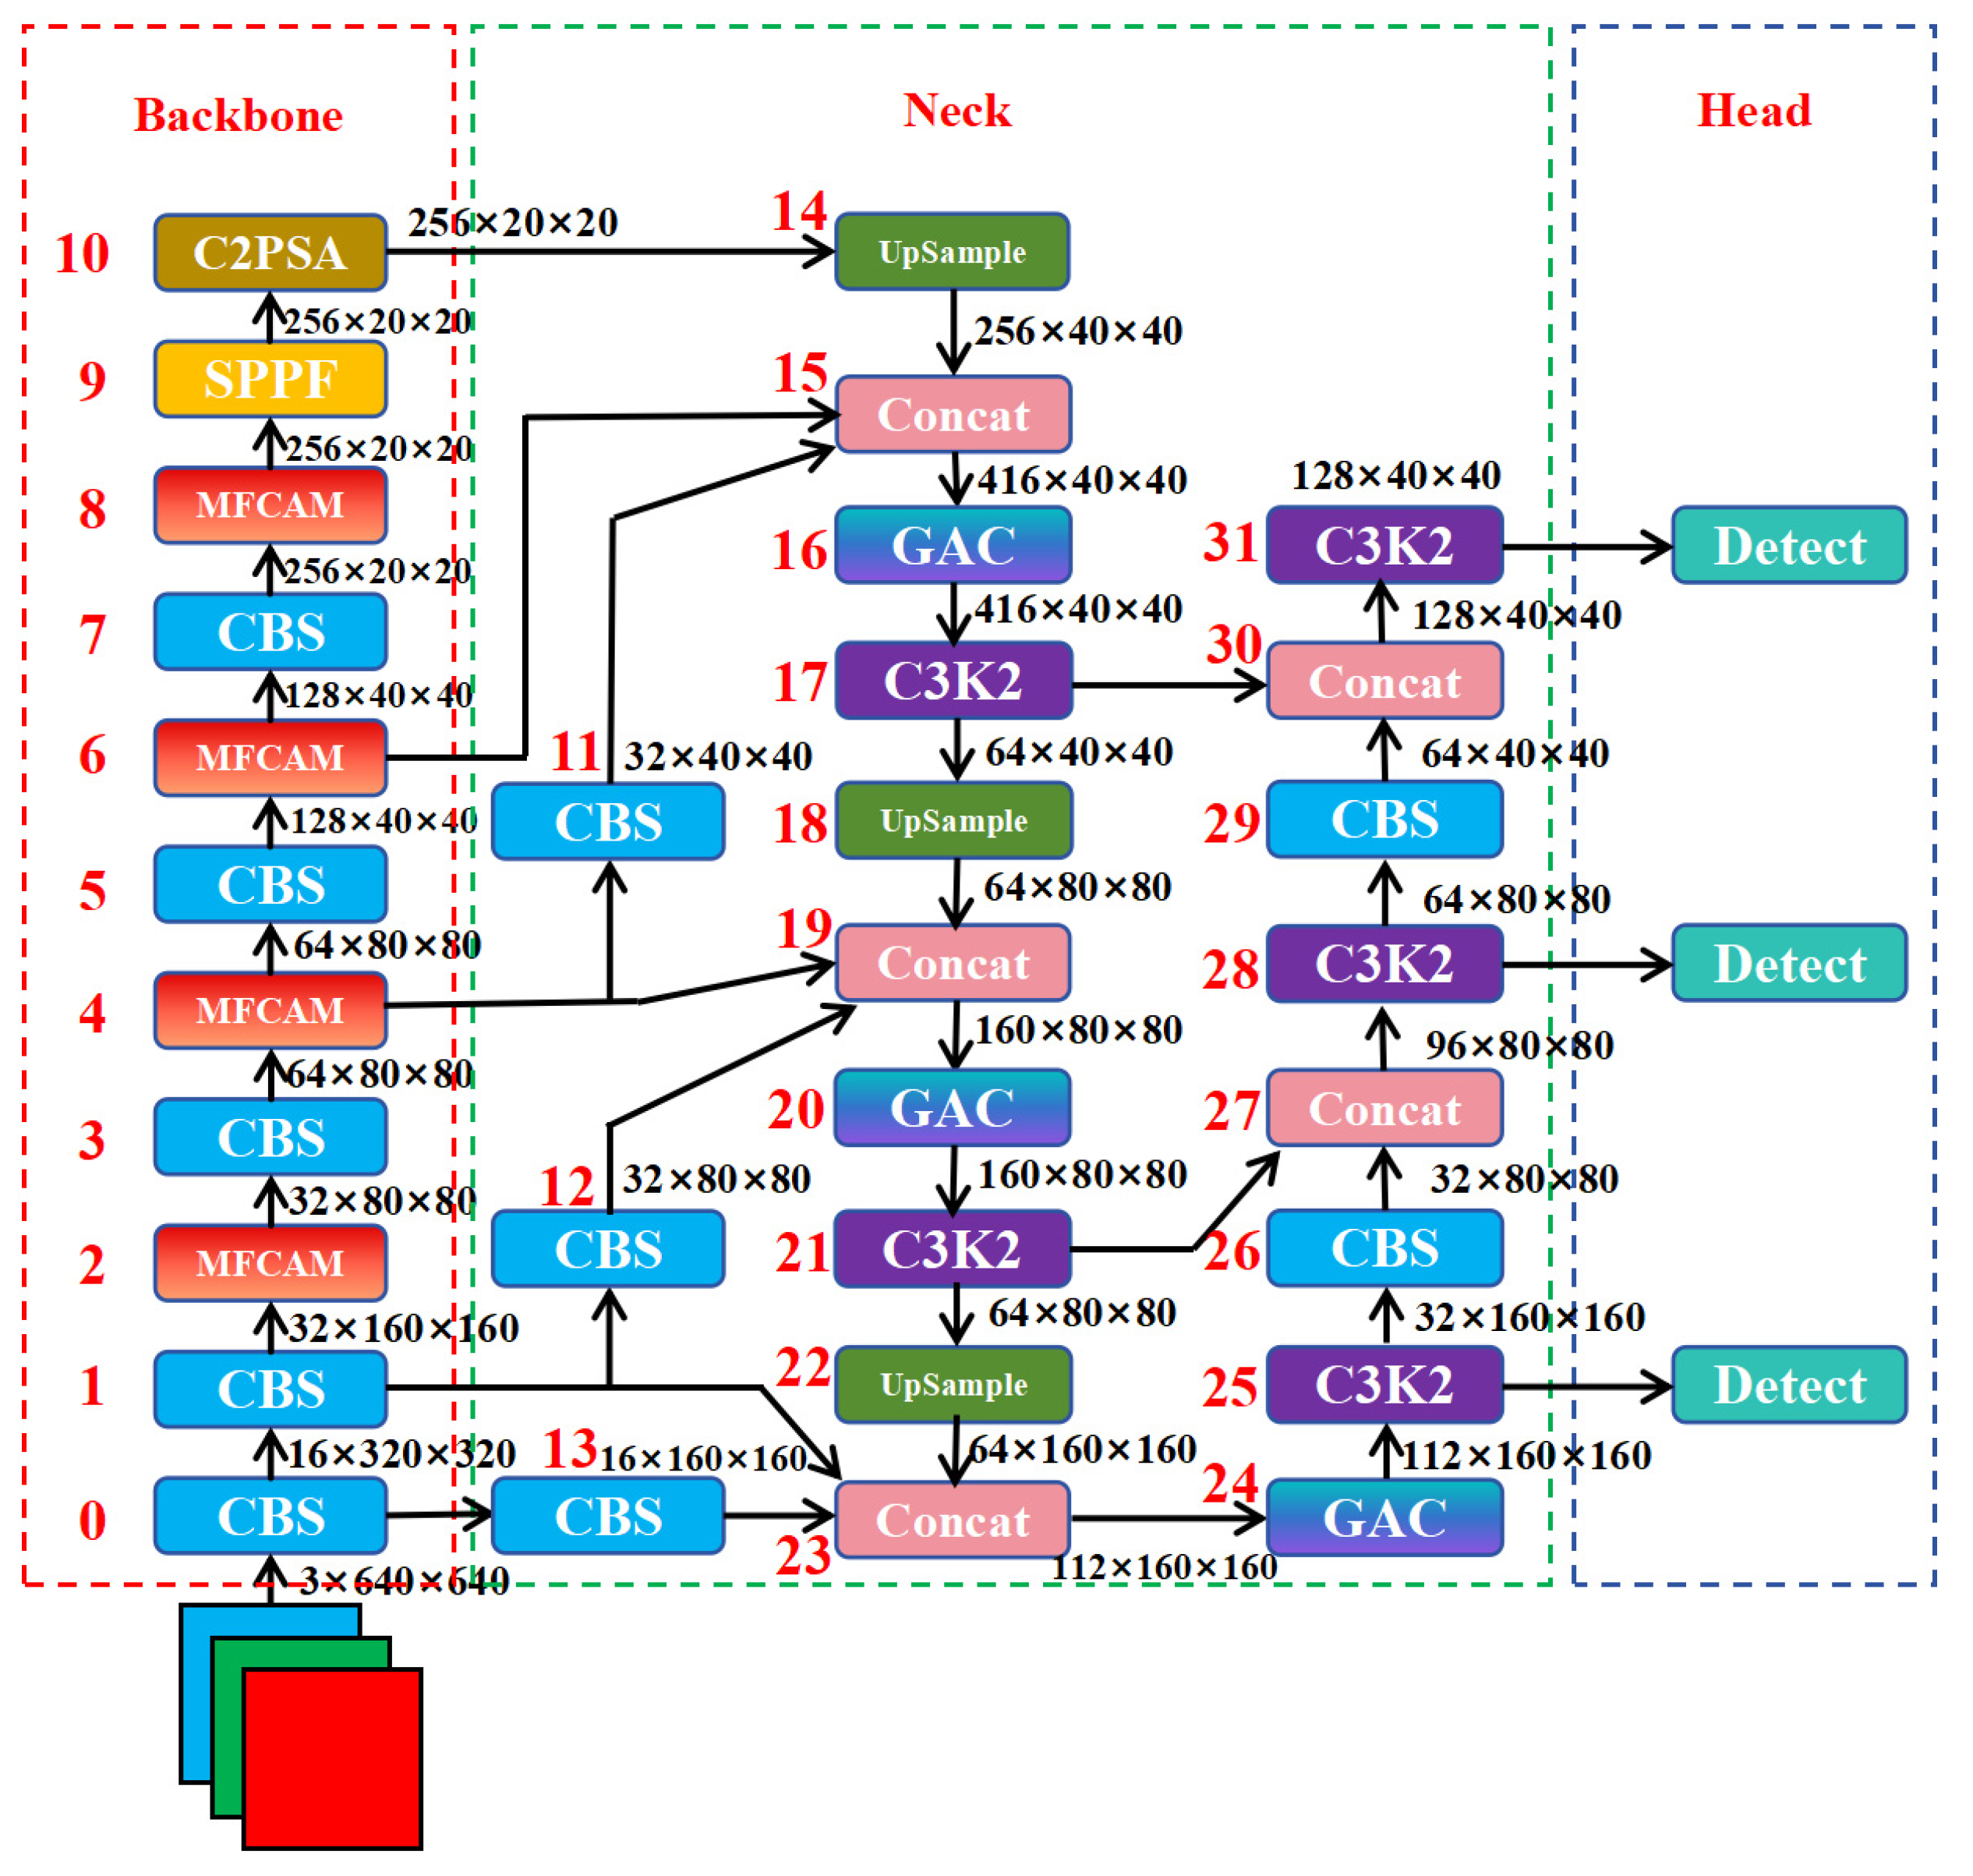
Figure 4.
The structure diagram of multi-scale feature complementary aggregation module.
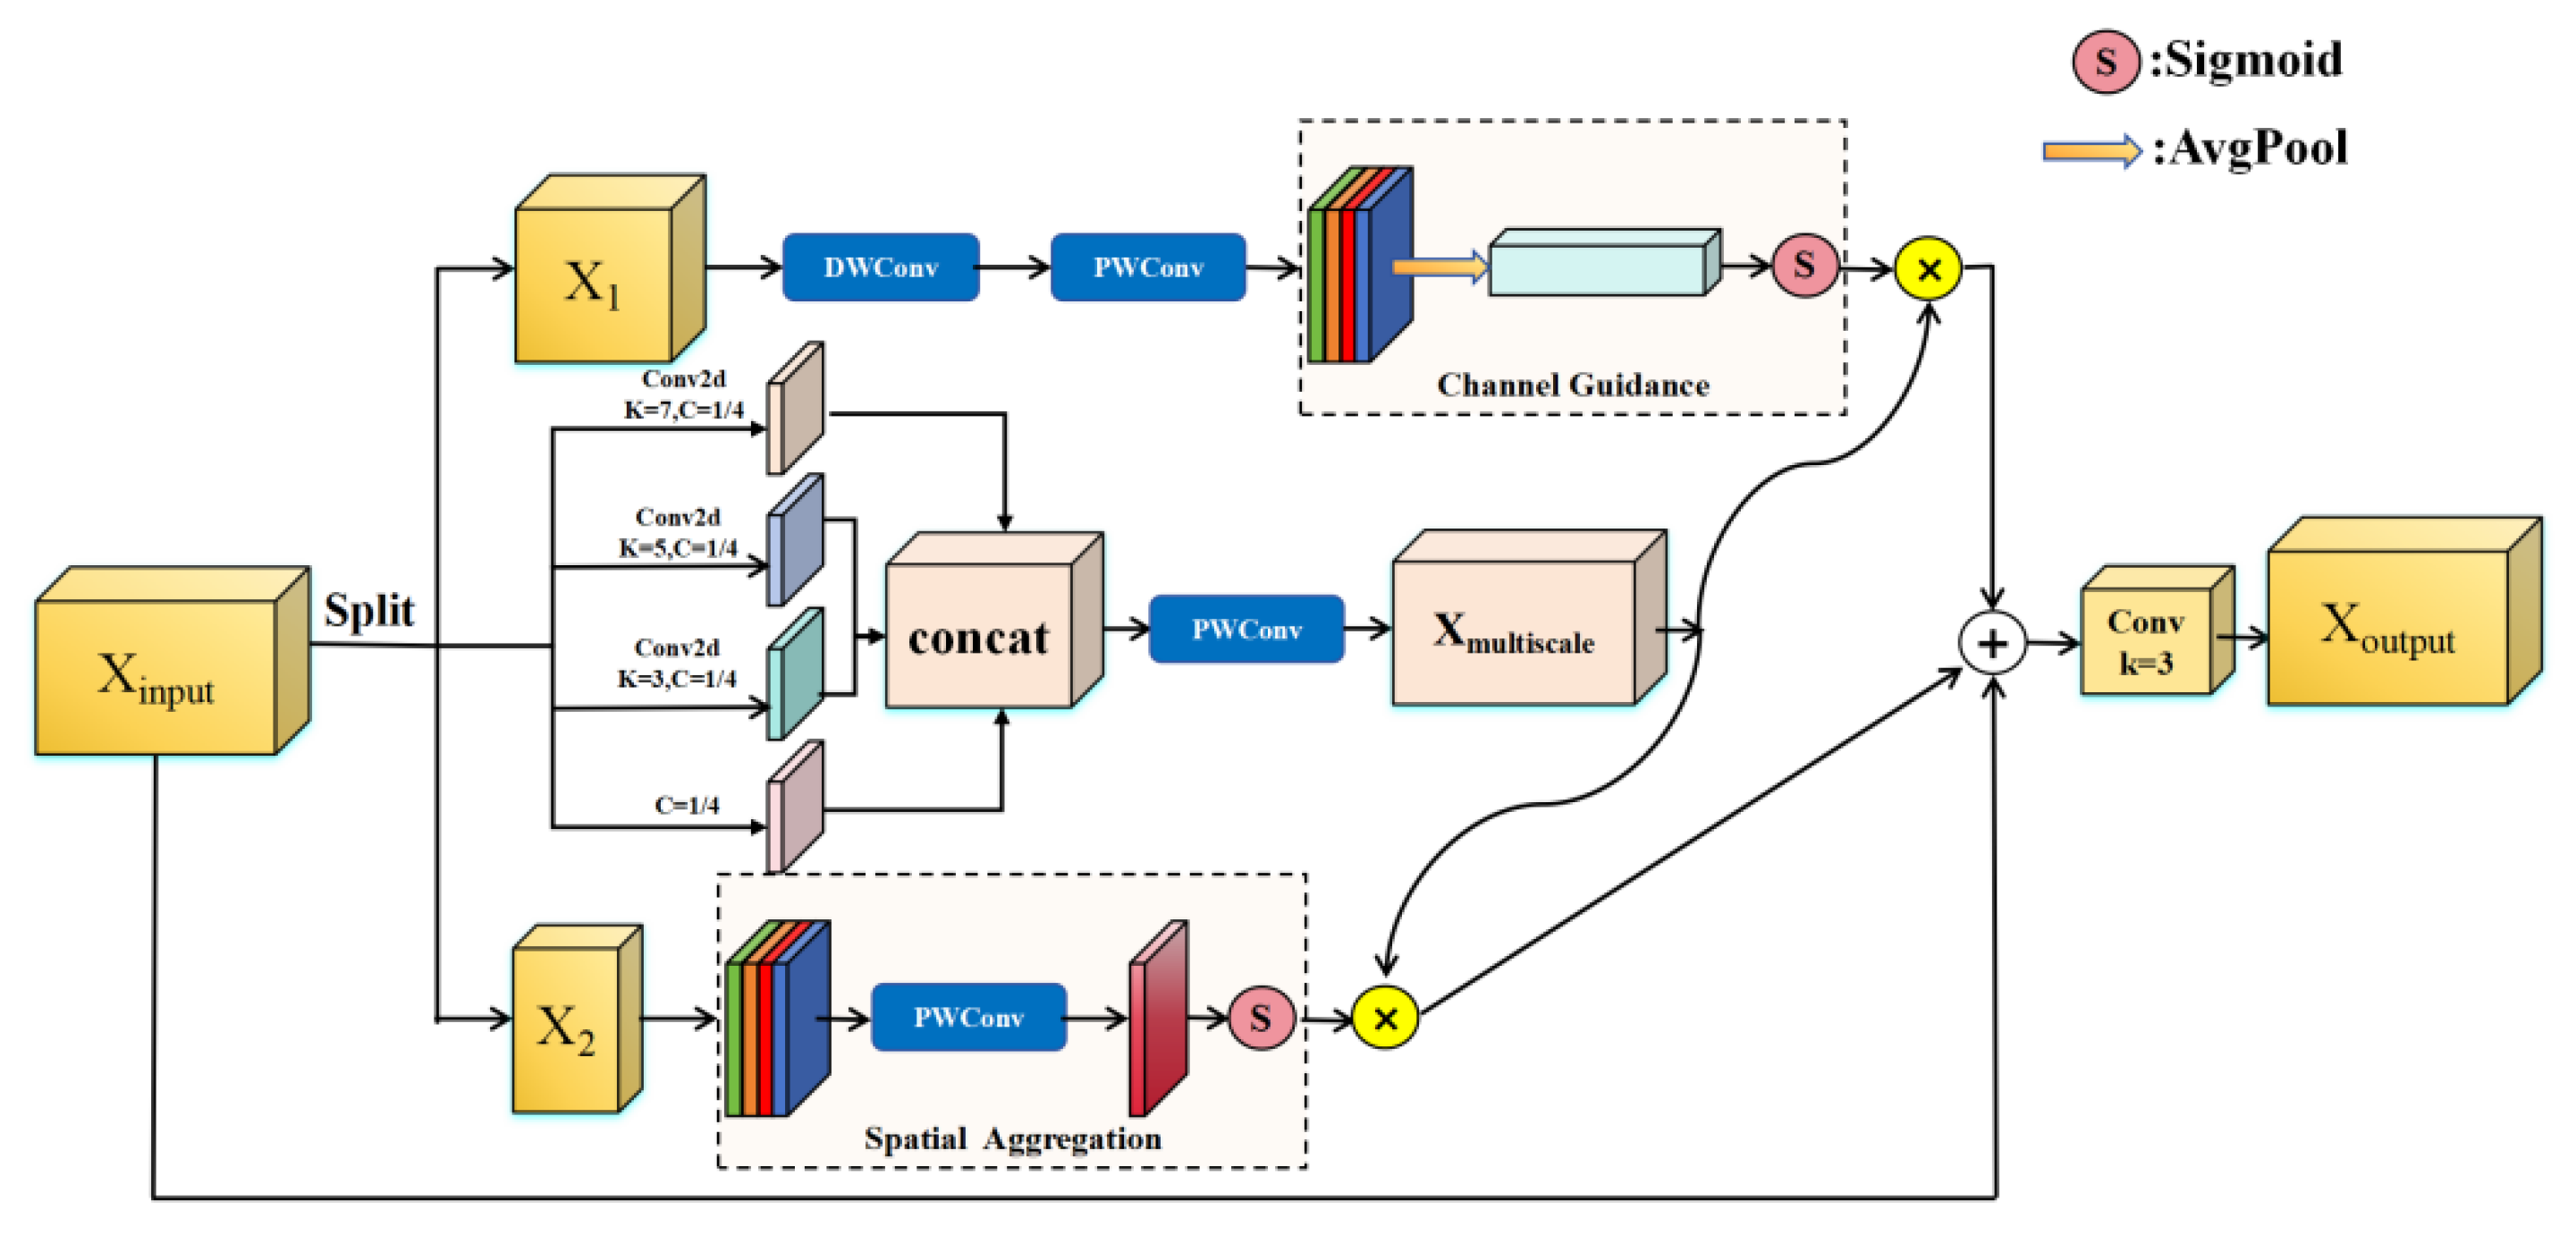
Figure 5.
The structure diagram of gated activation convolutional module.
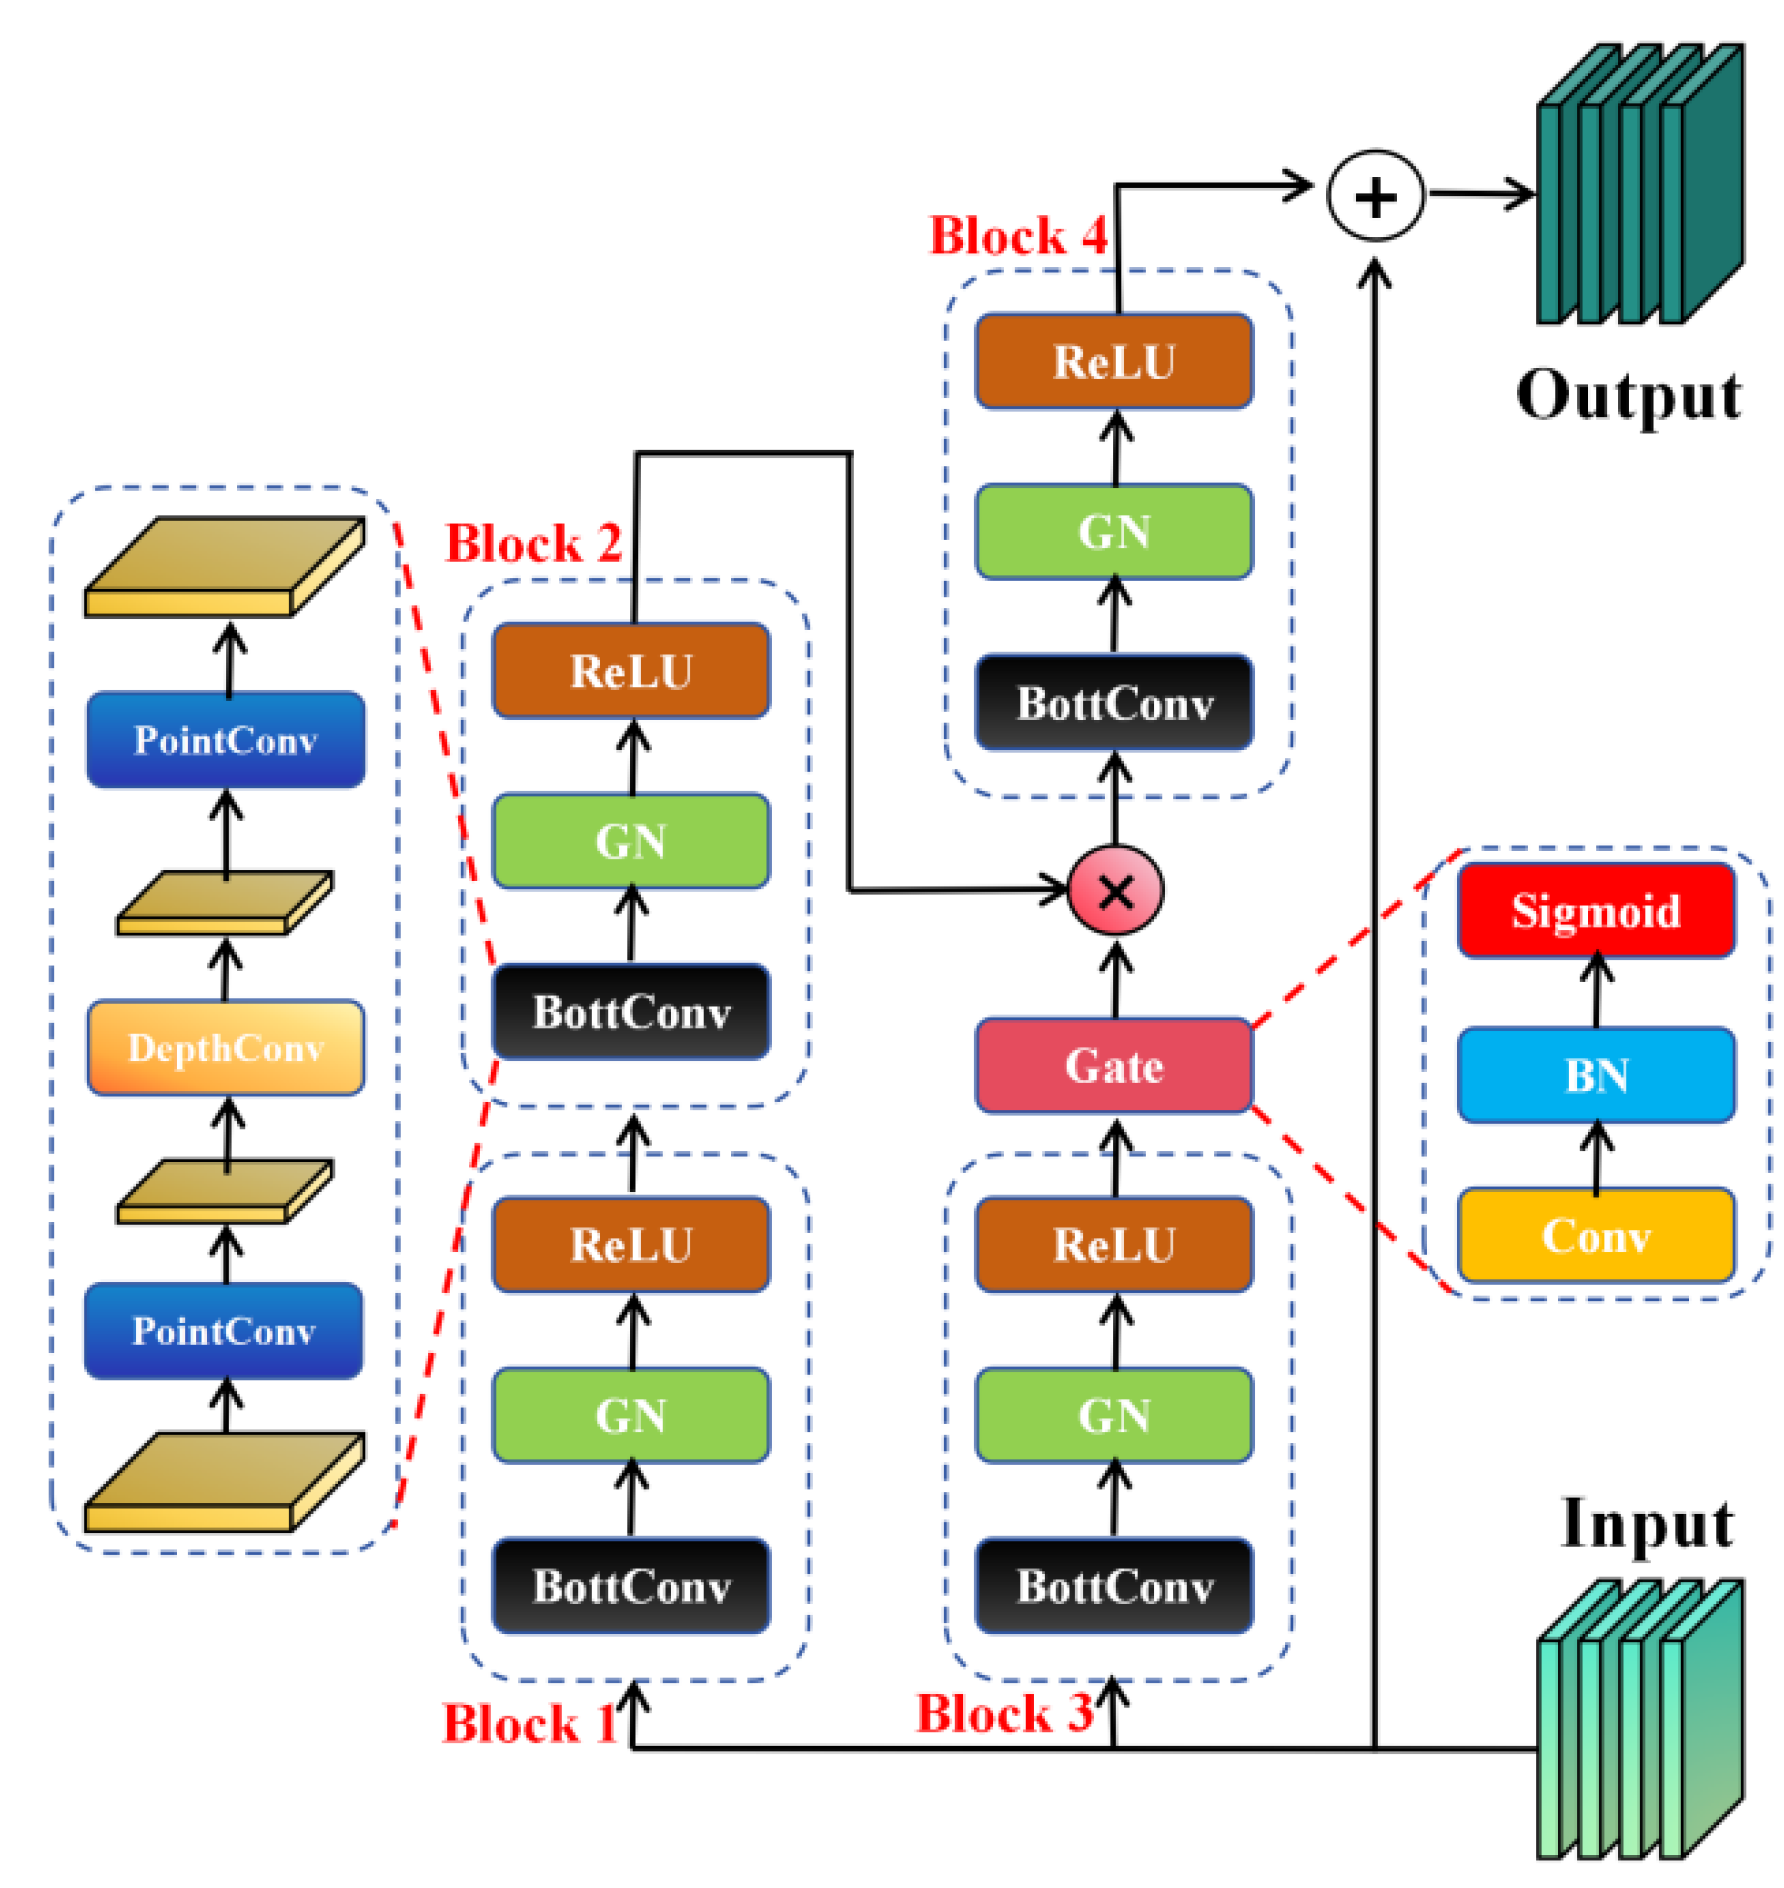
Figure 6.
Introduction to six error types.
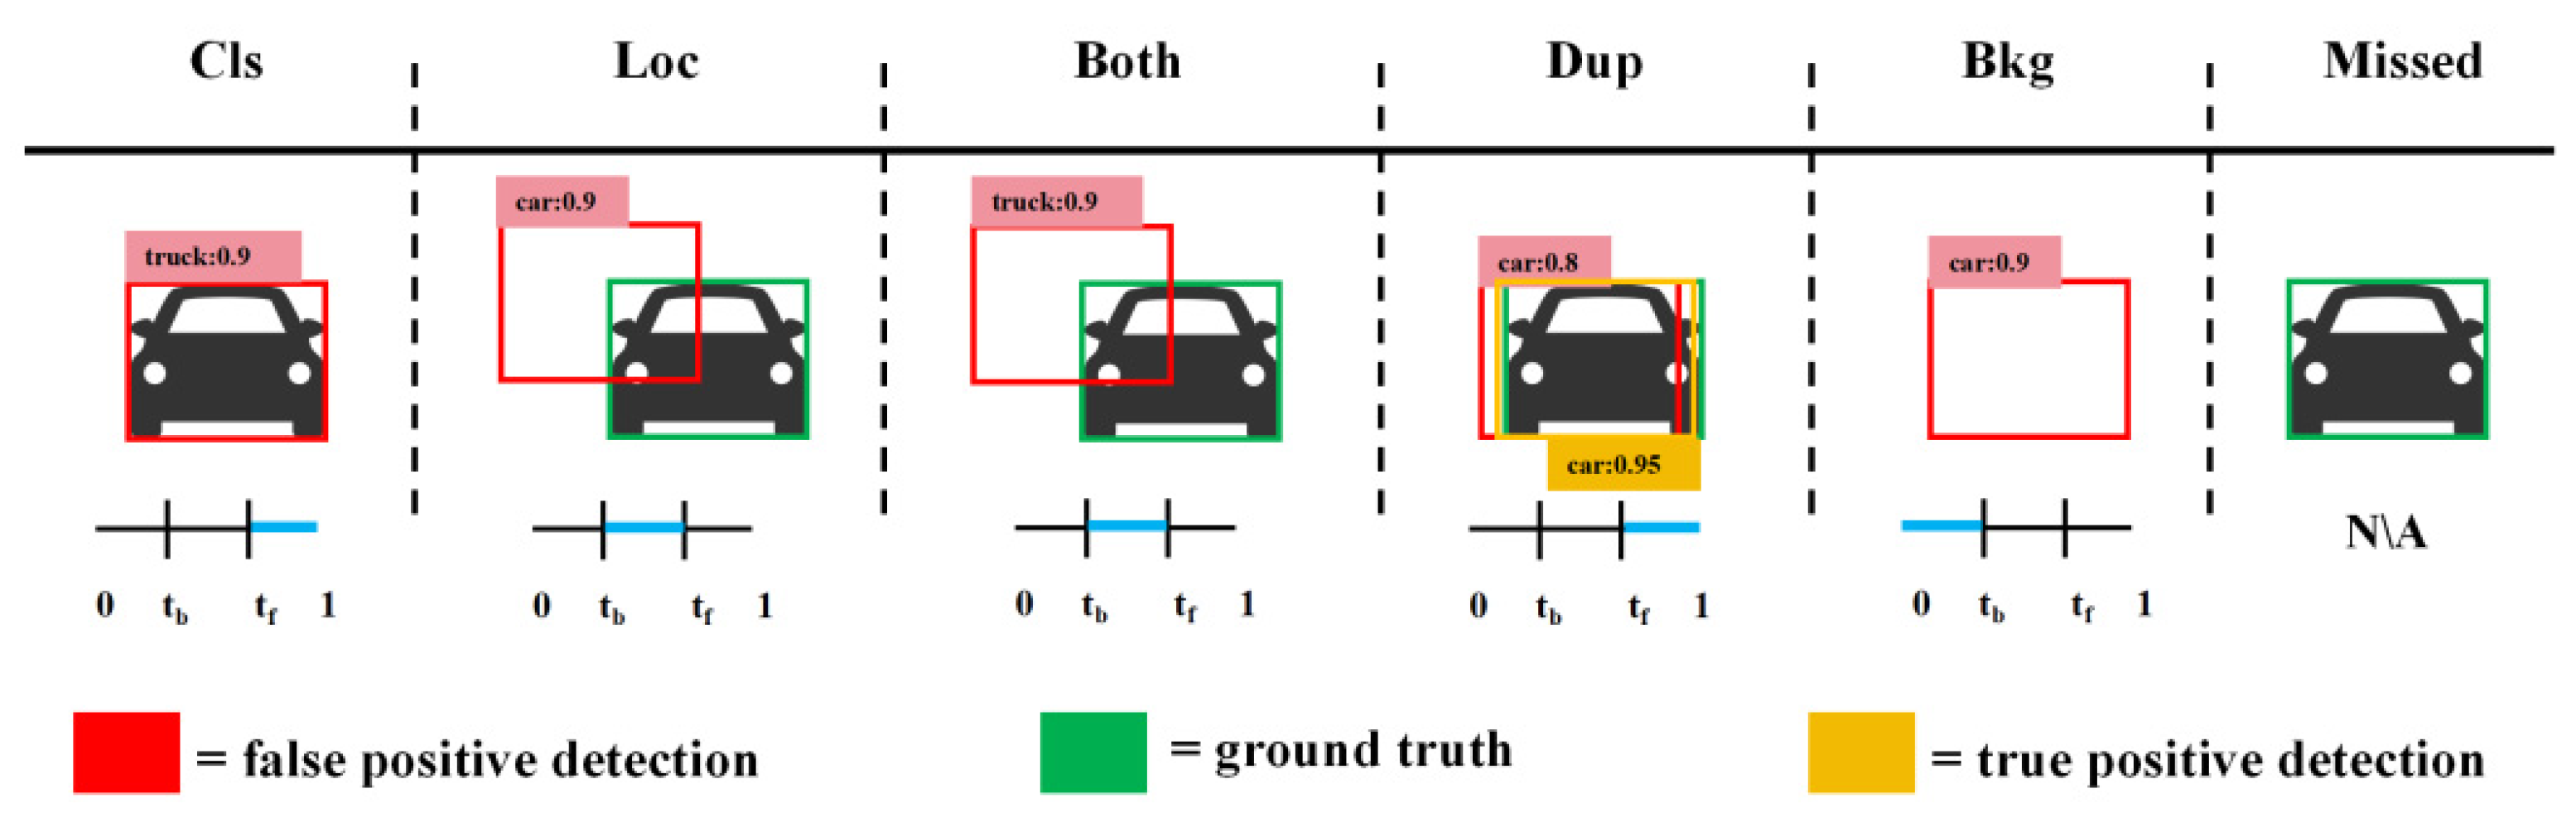
Figure 7.
Relationship between detection accuracy and scale.
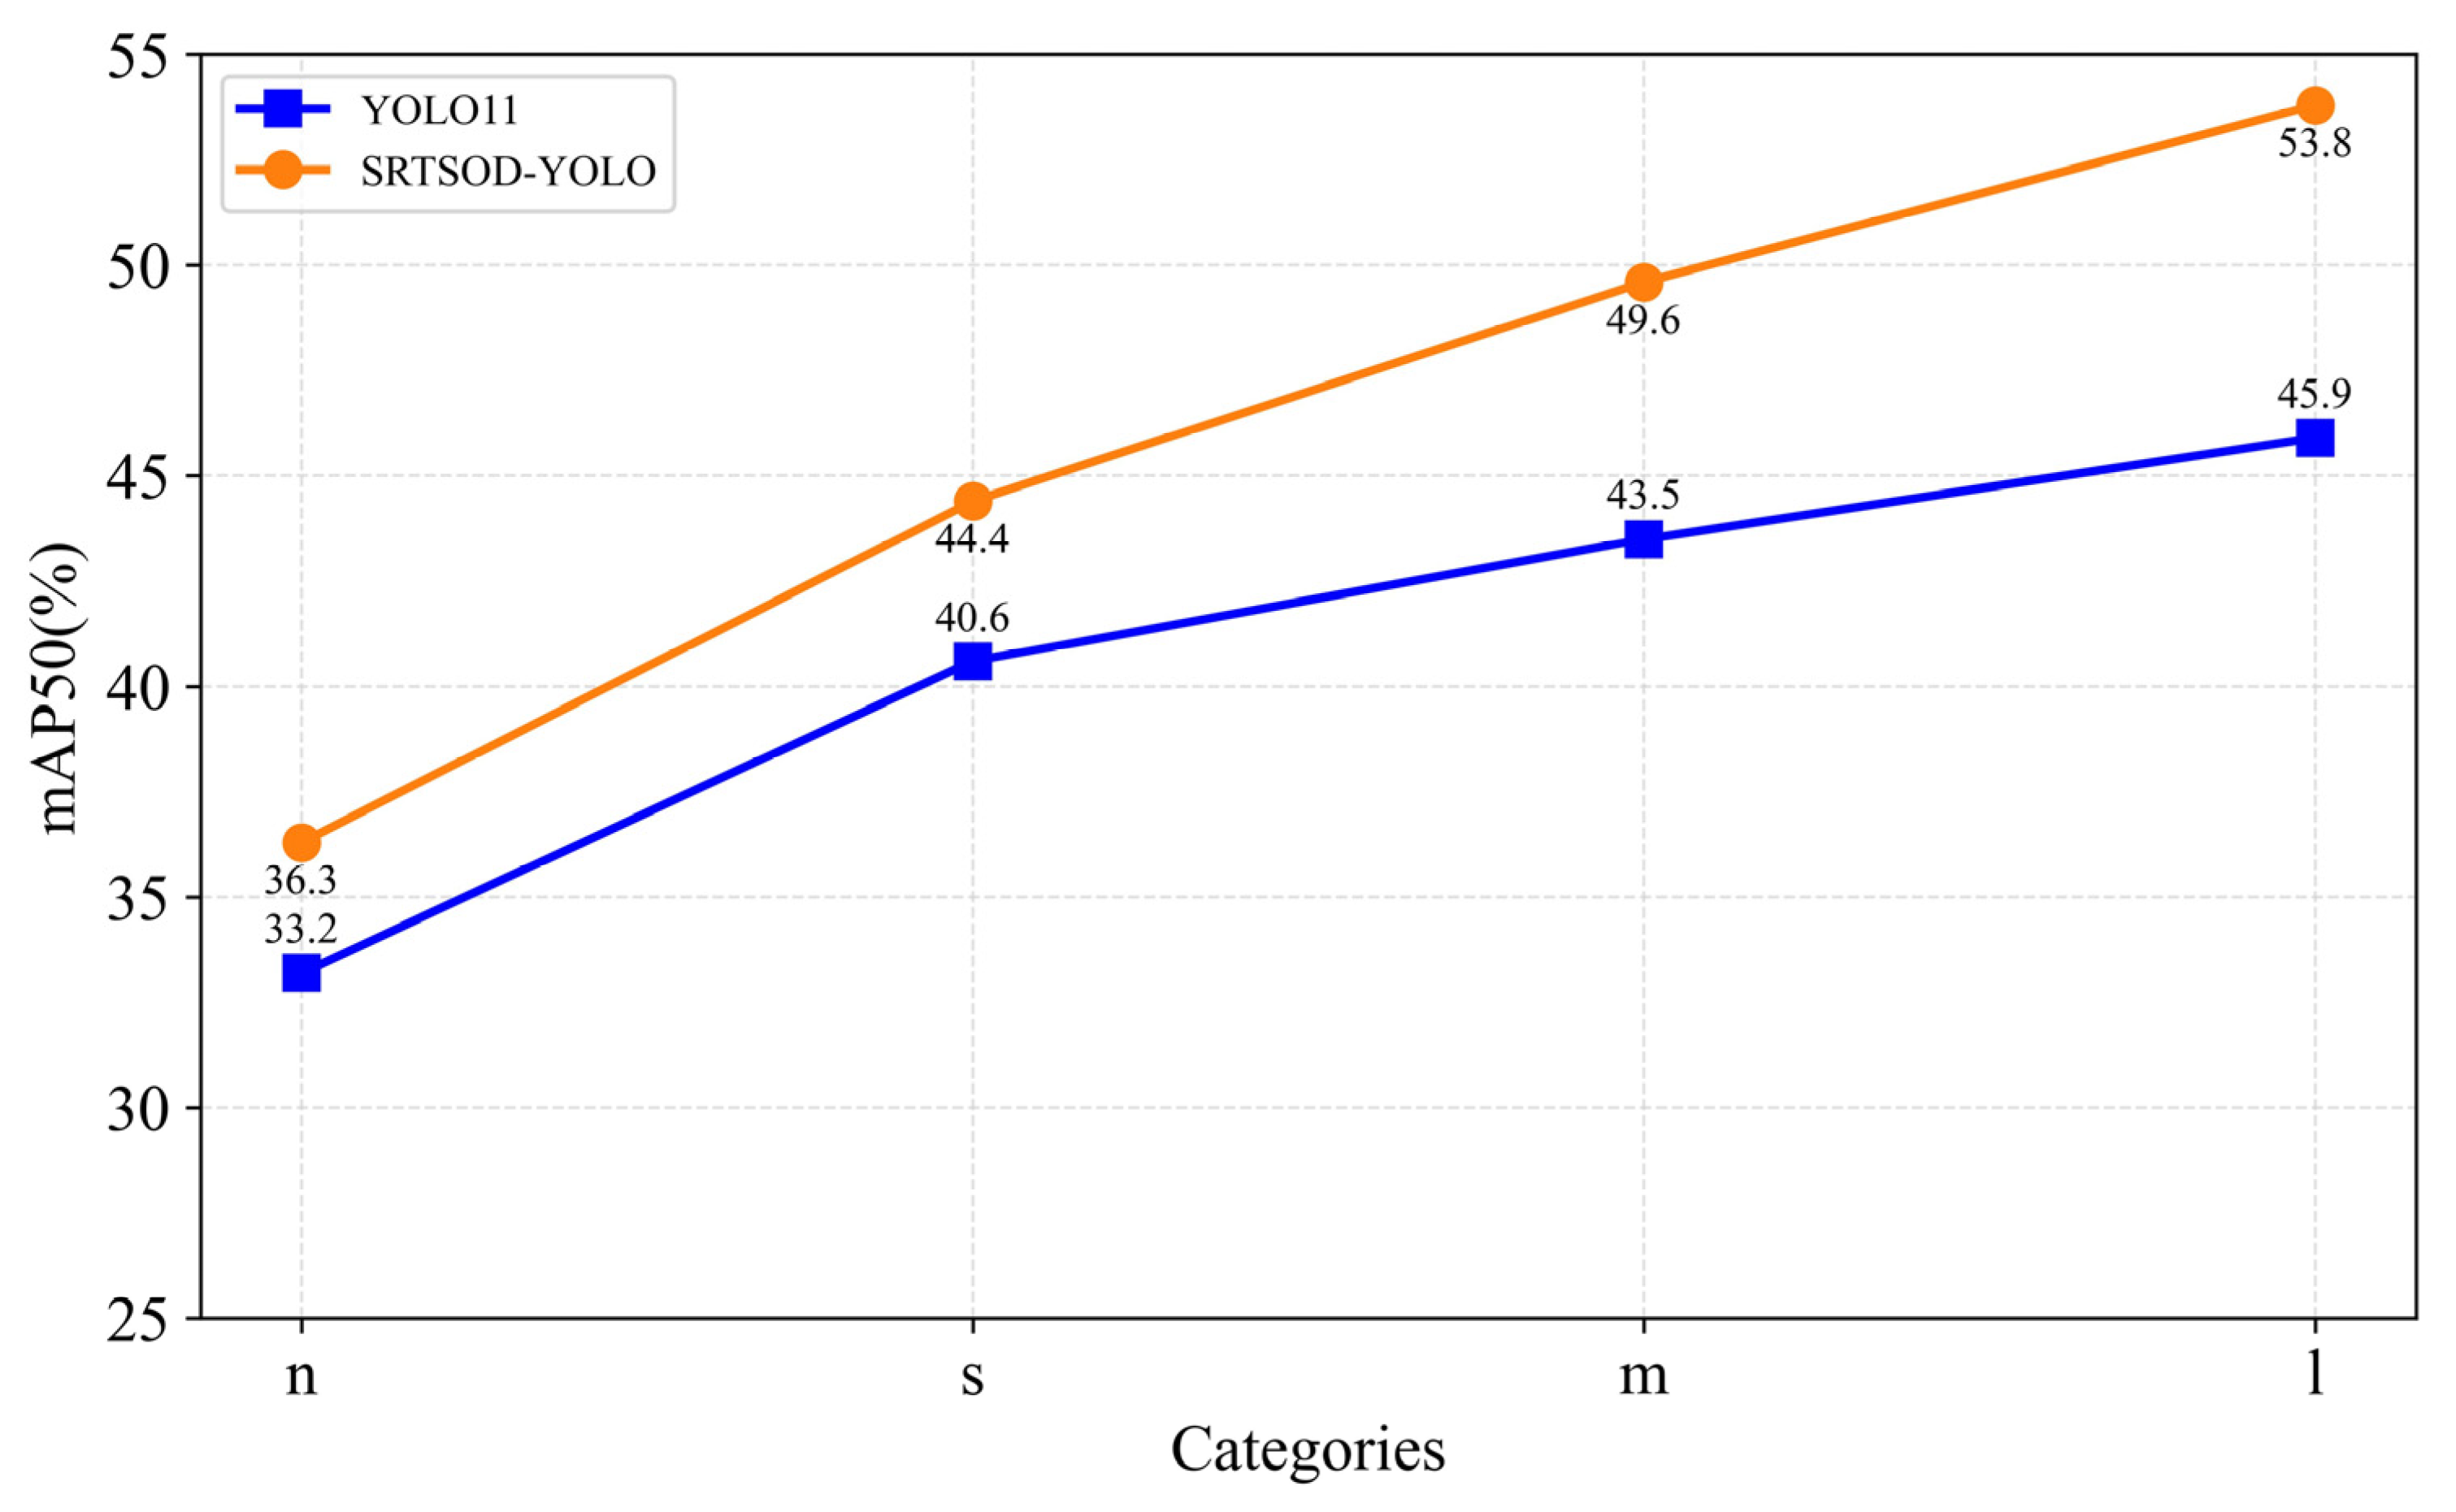
Figure 8.
On the Visdrone2019 dataset, the detection effect comparison between the proposed model and the baseline model.
Figure 8.
On the Visdrone2019 dataset, the detection effect comparison between the proposed model and the baseline model.
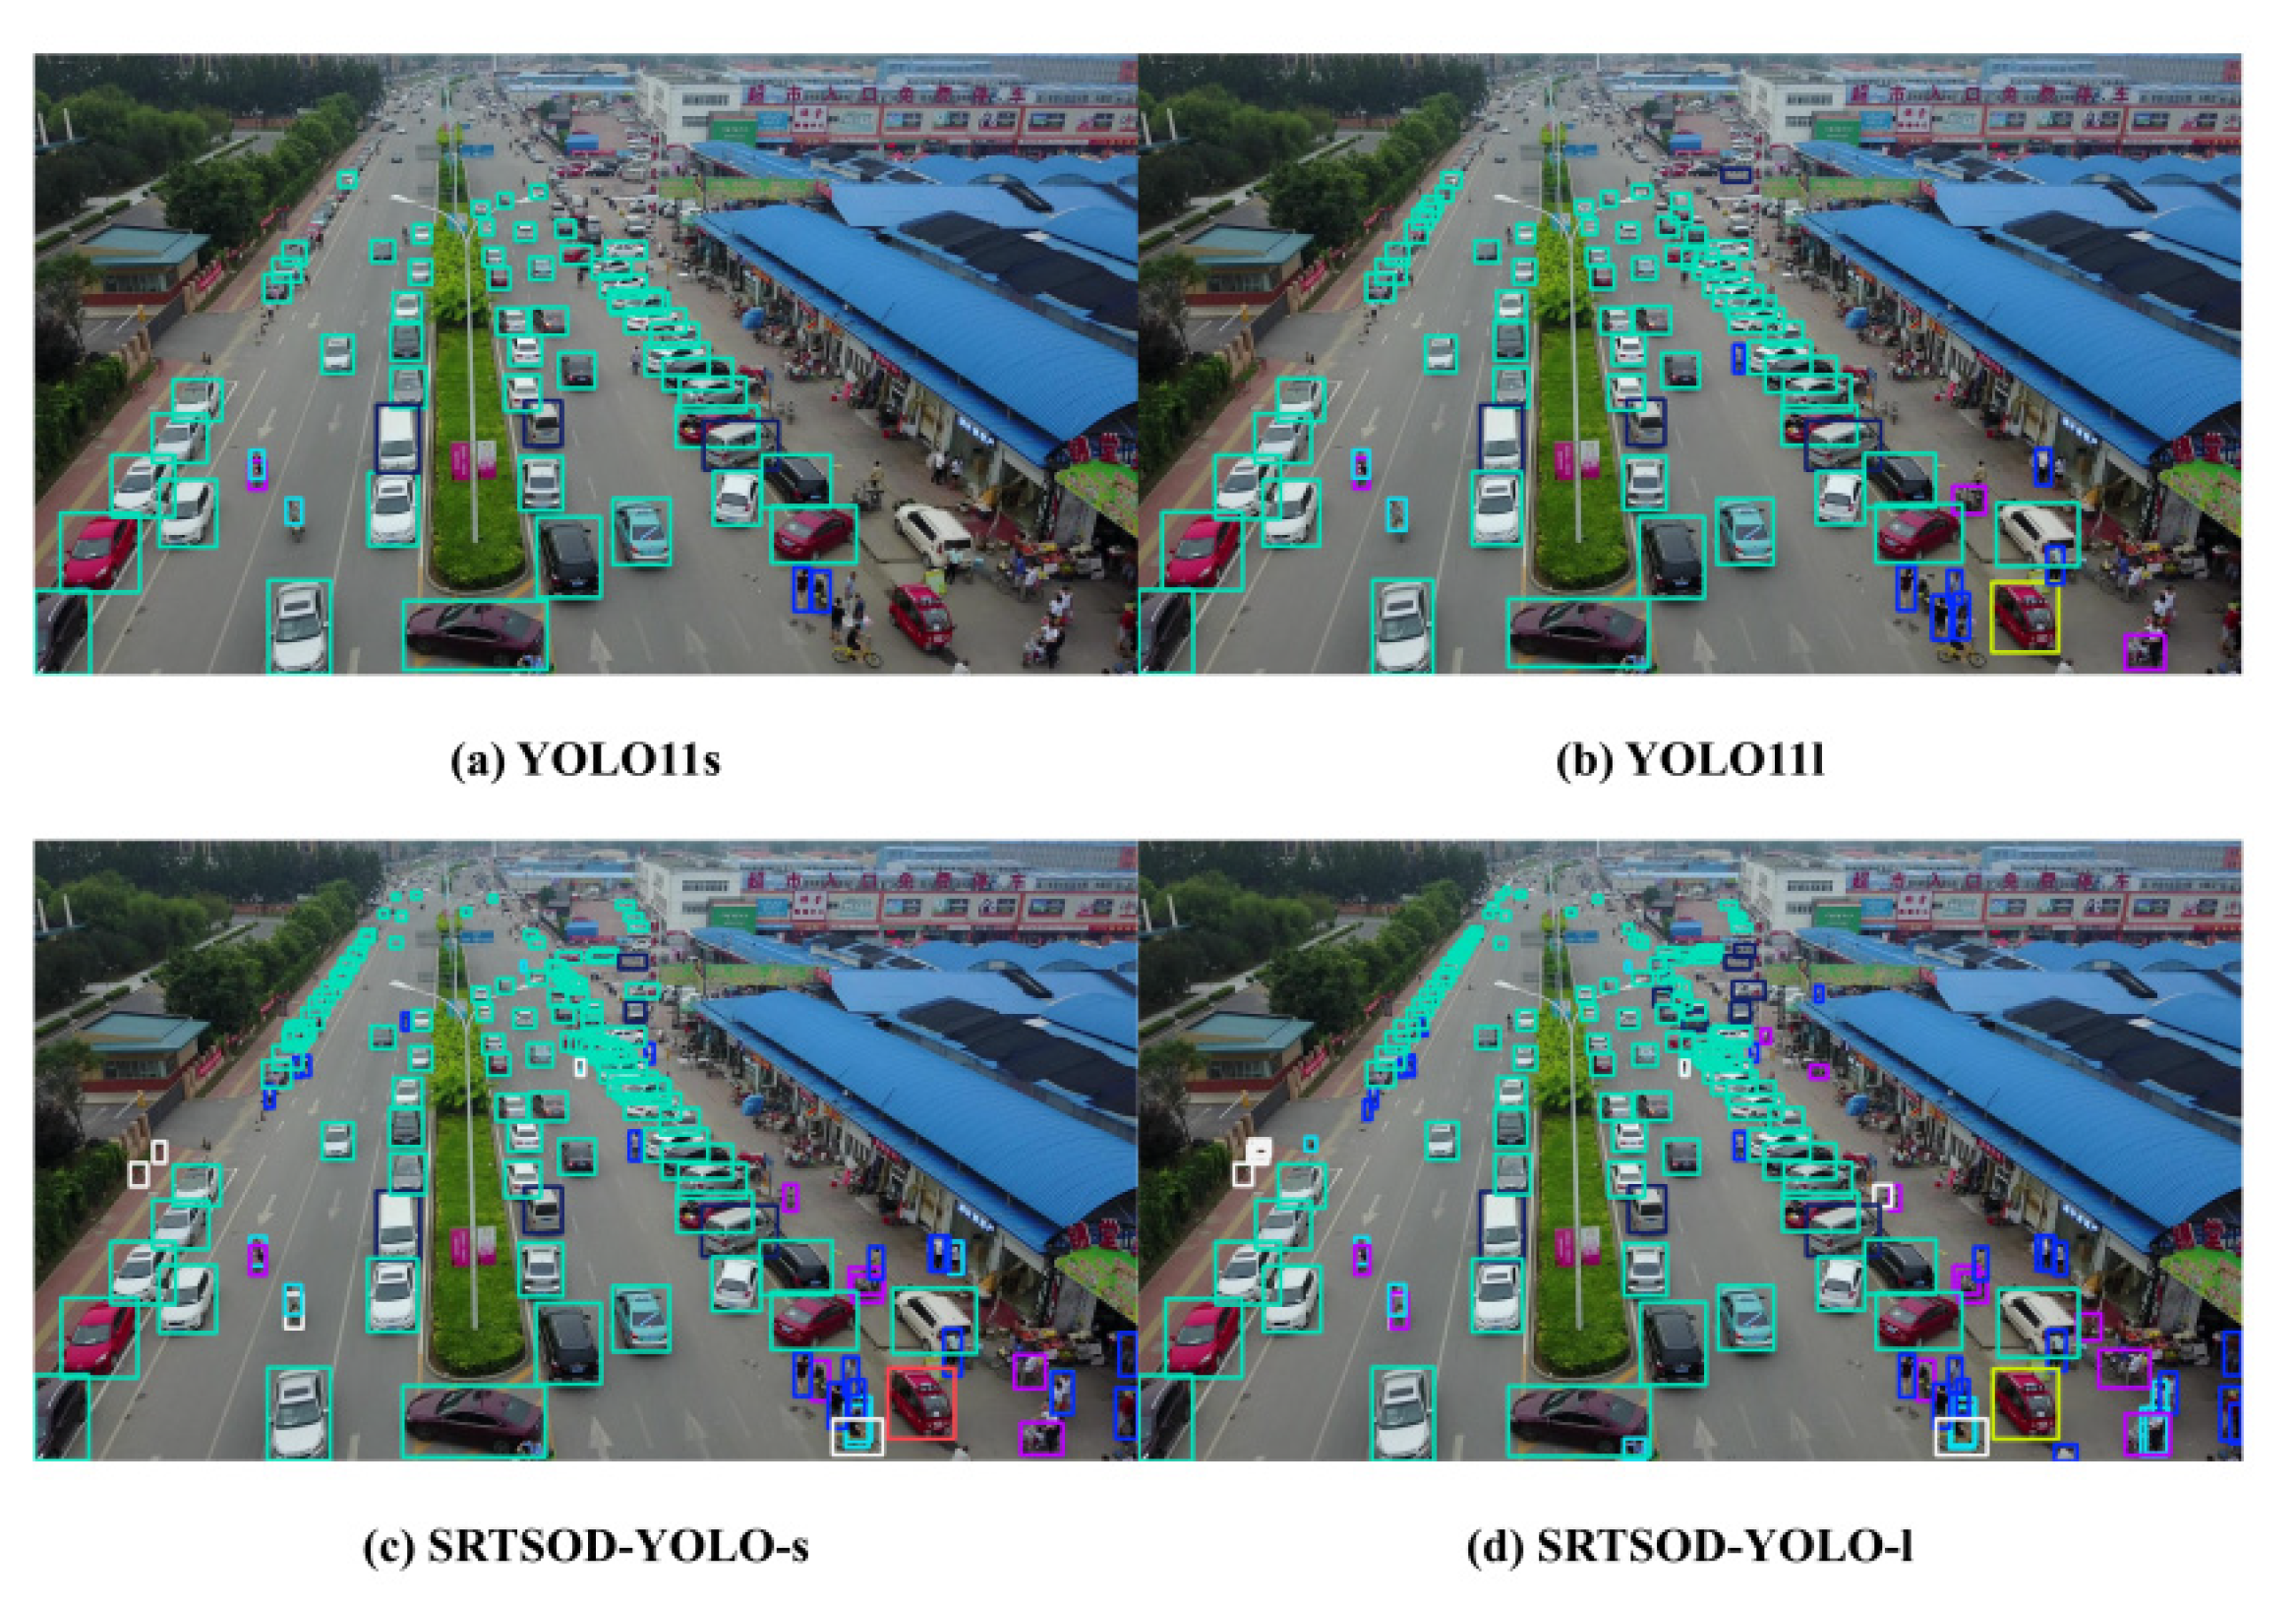
Figure 9.
Cont.
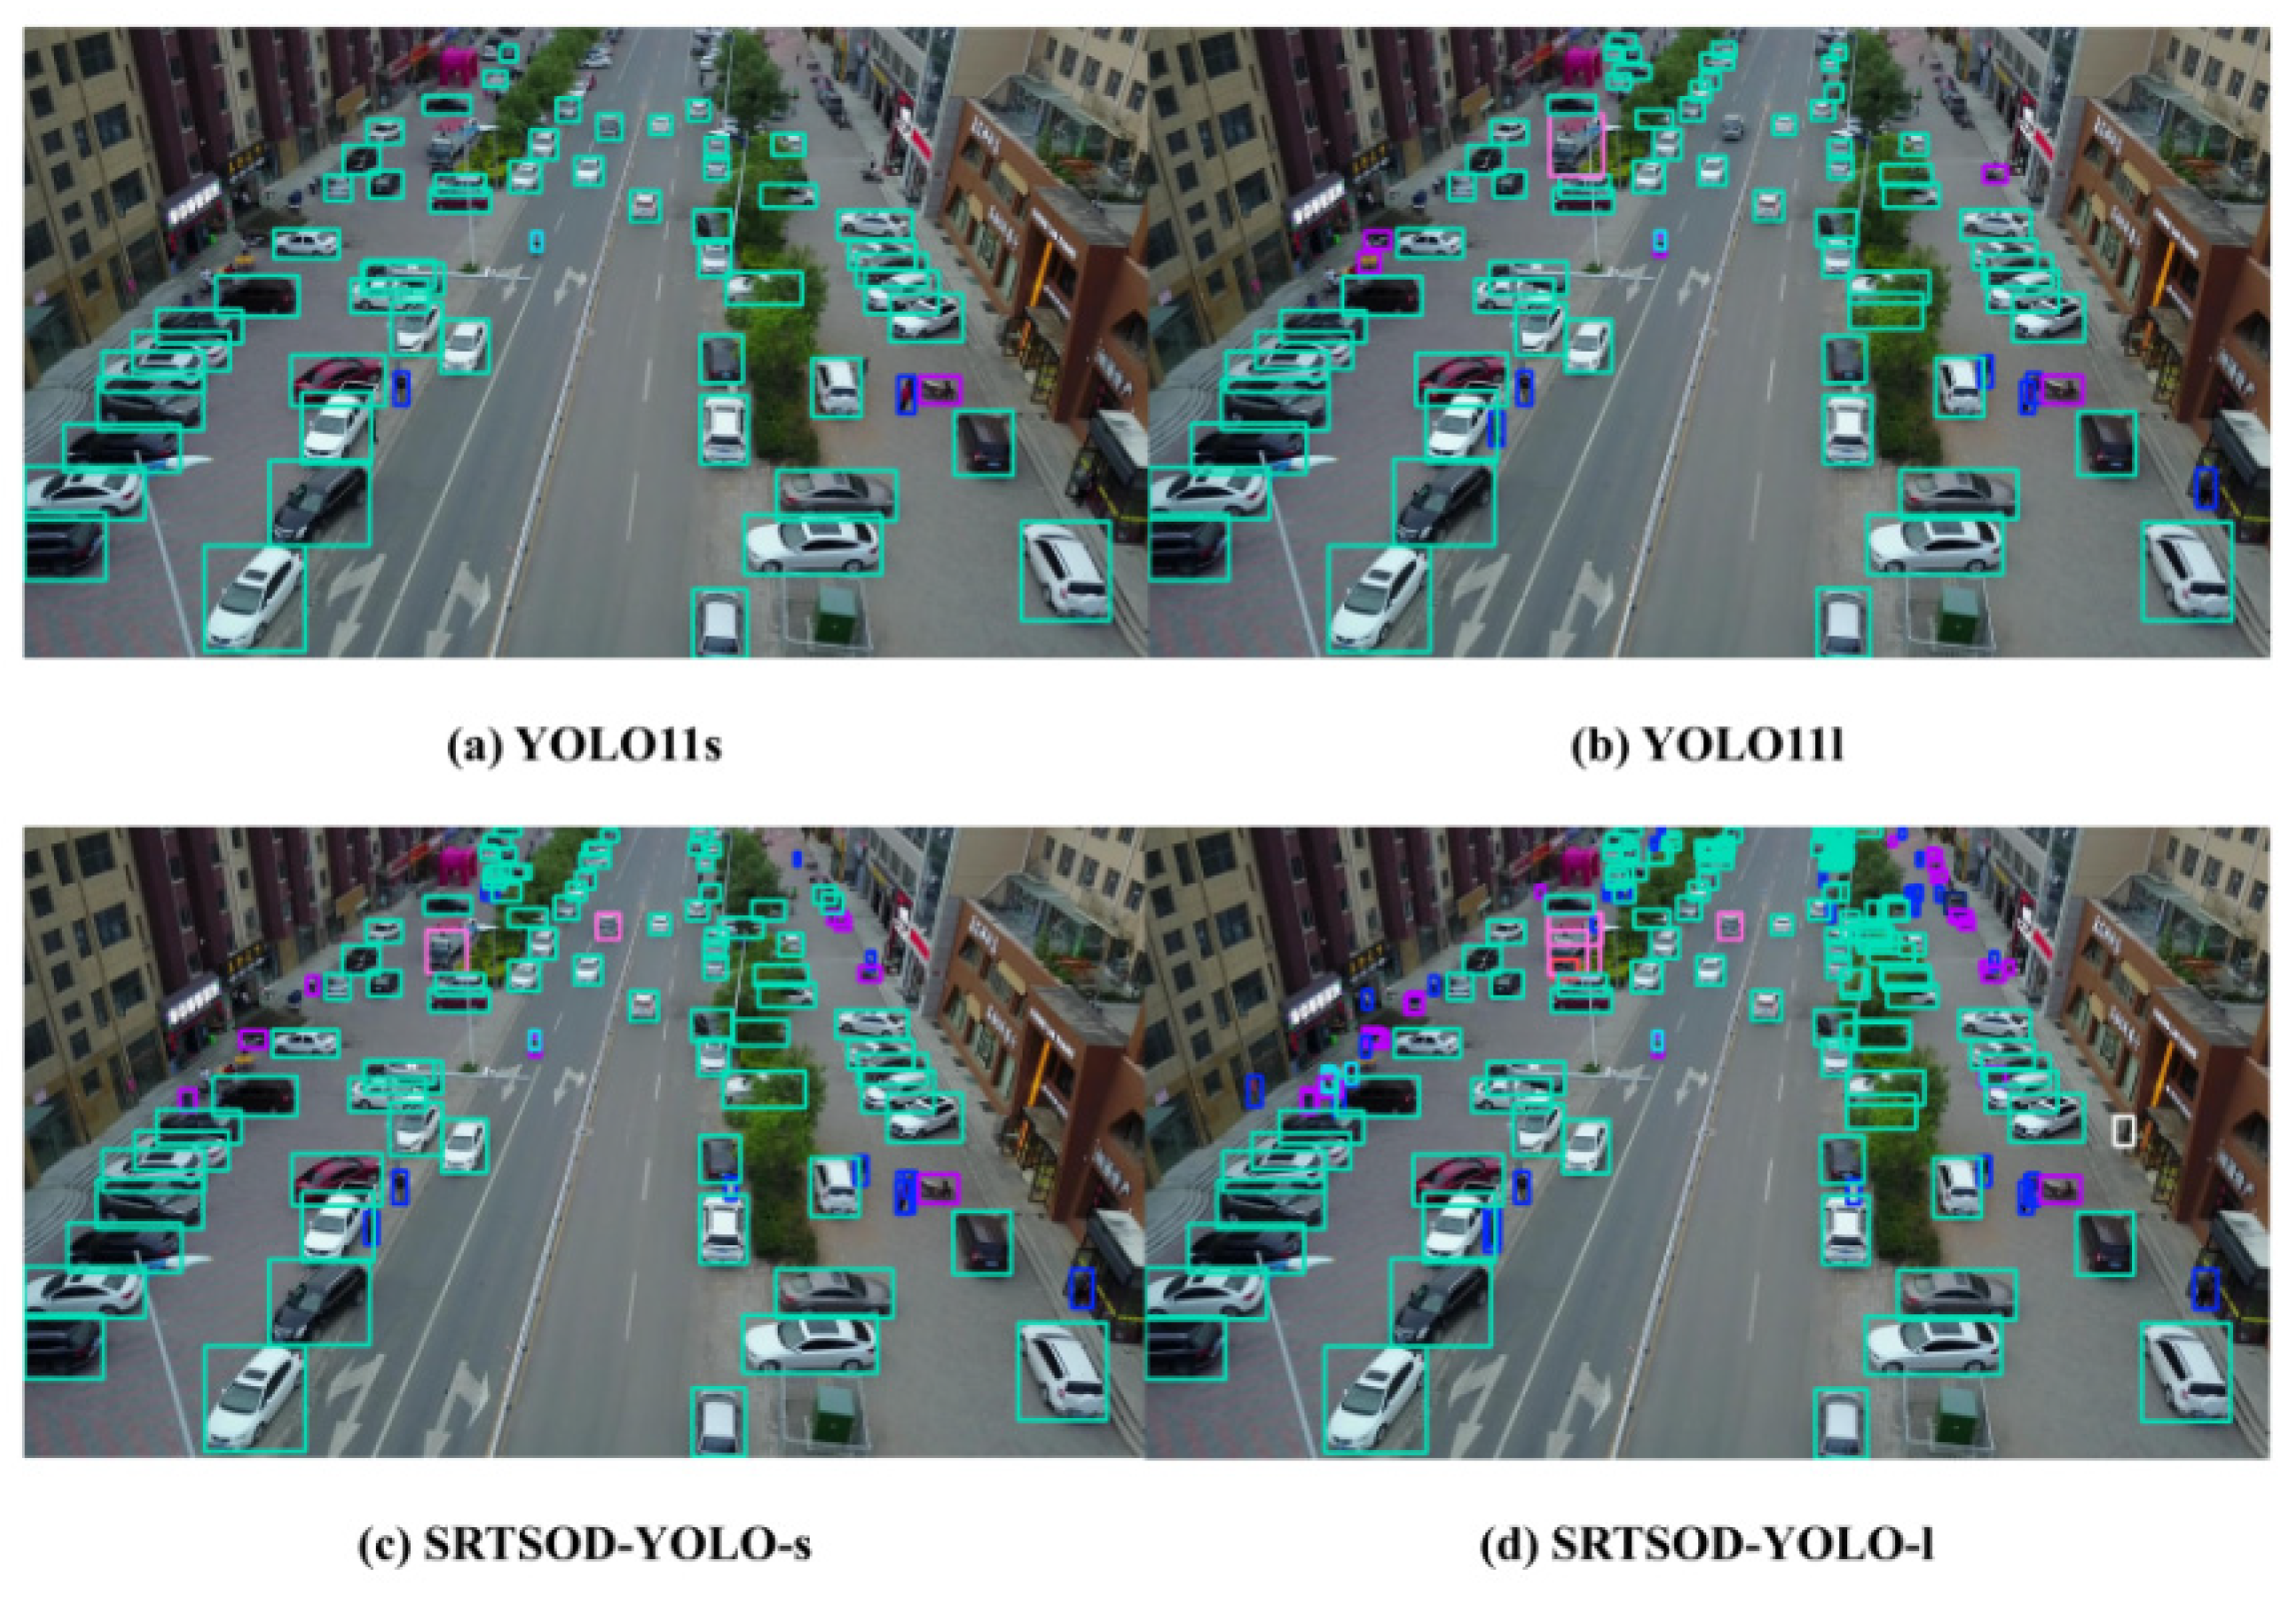
Figure 10.
Cont.
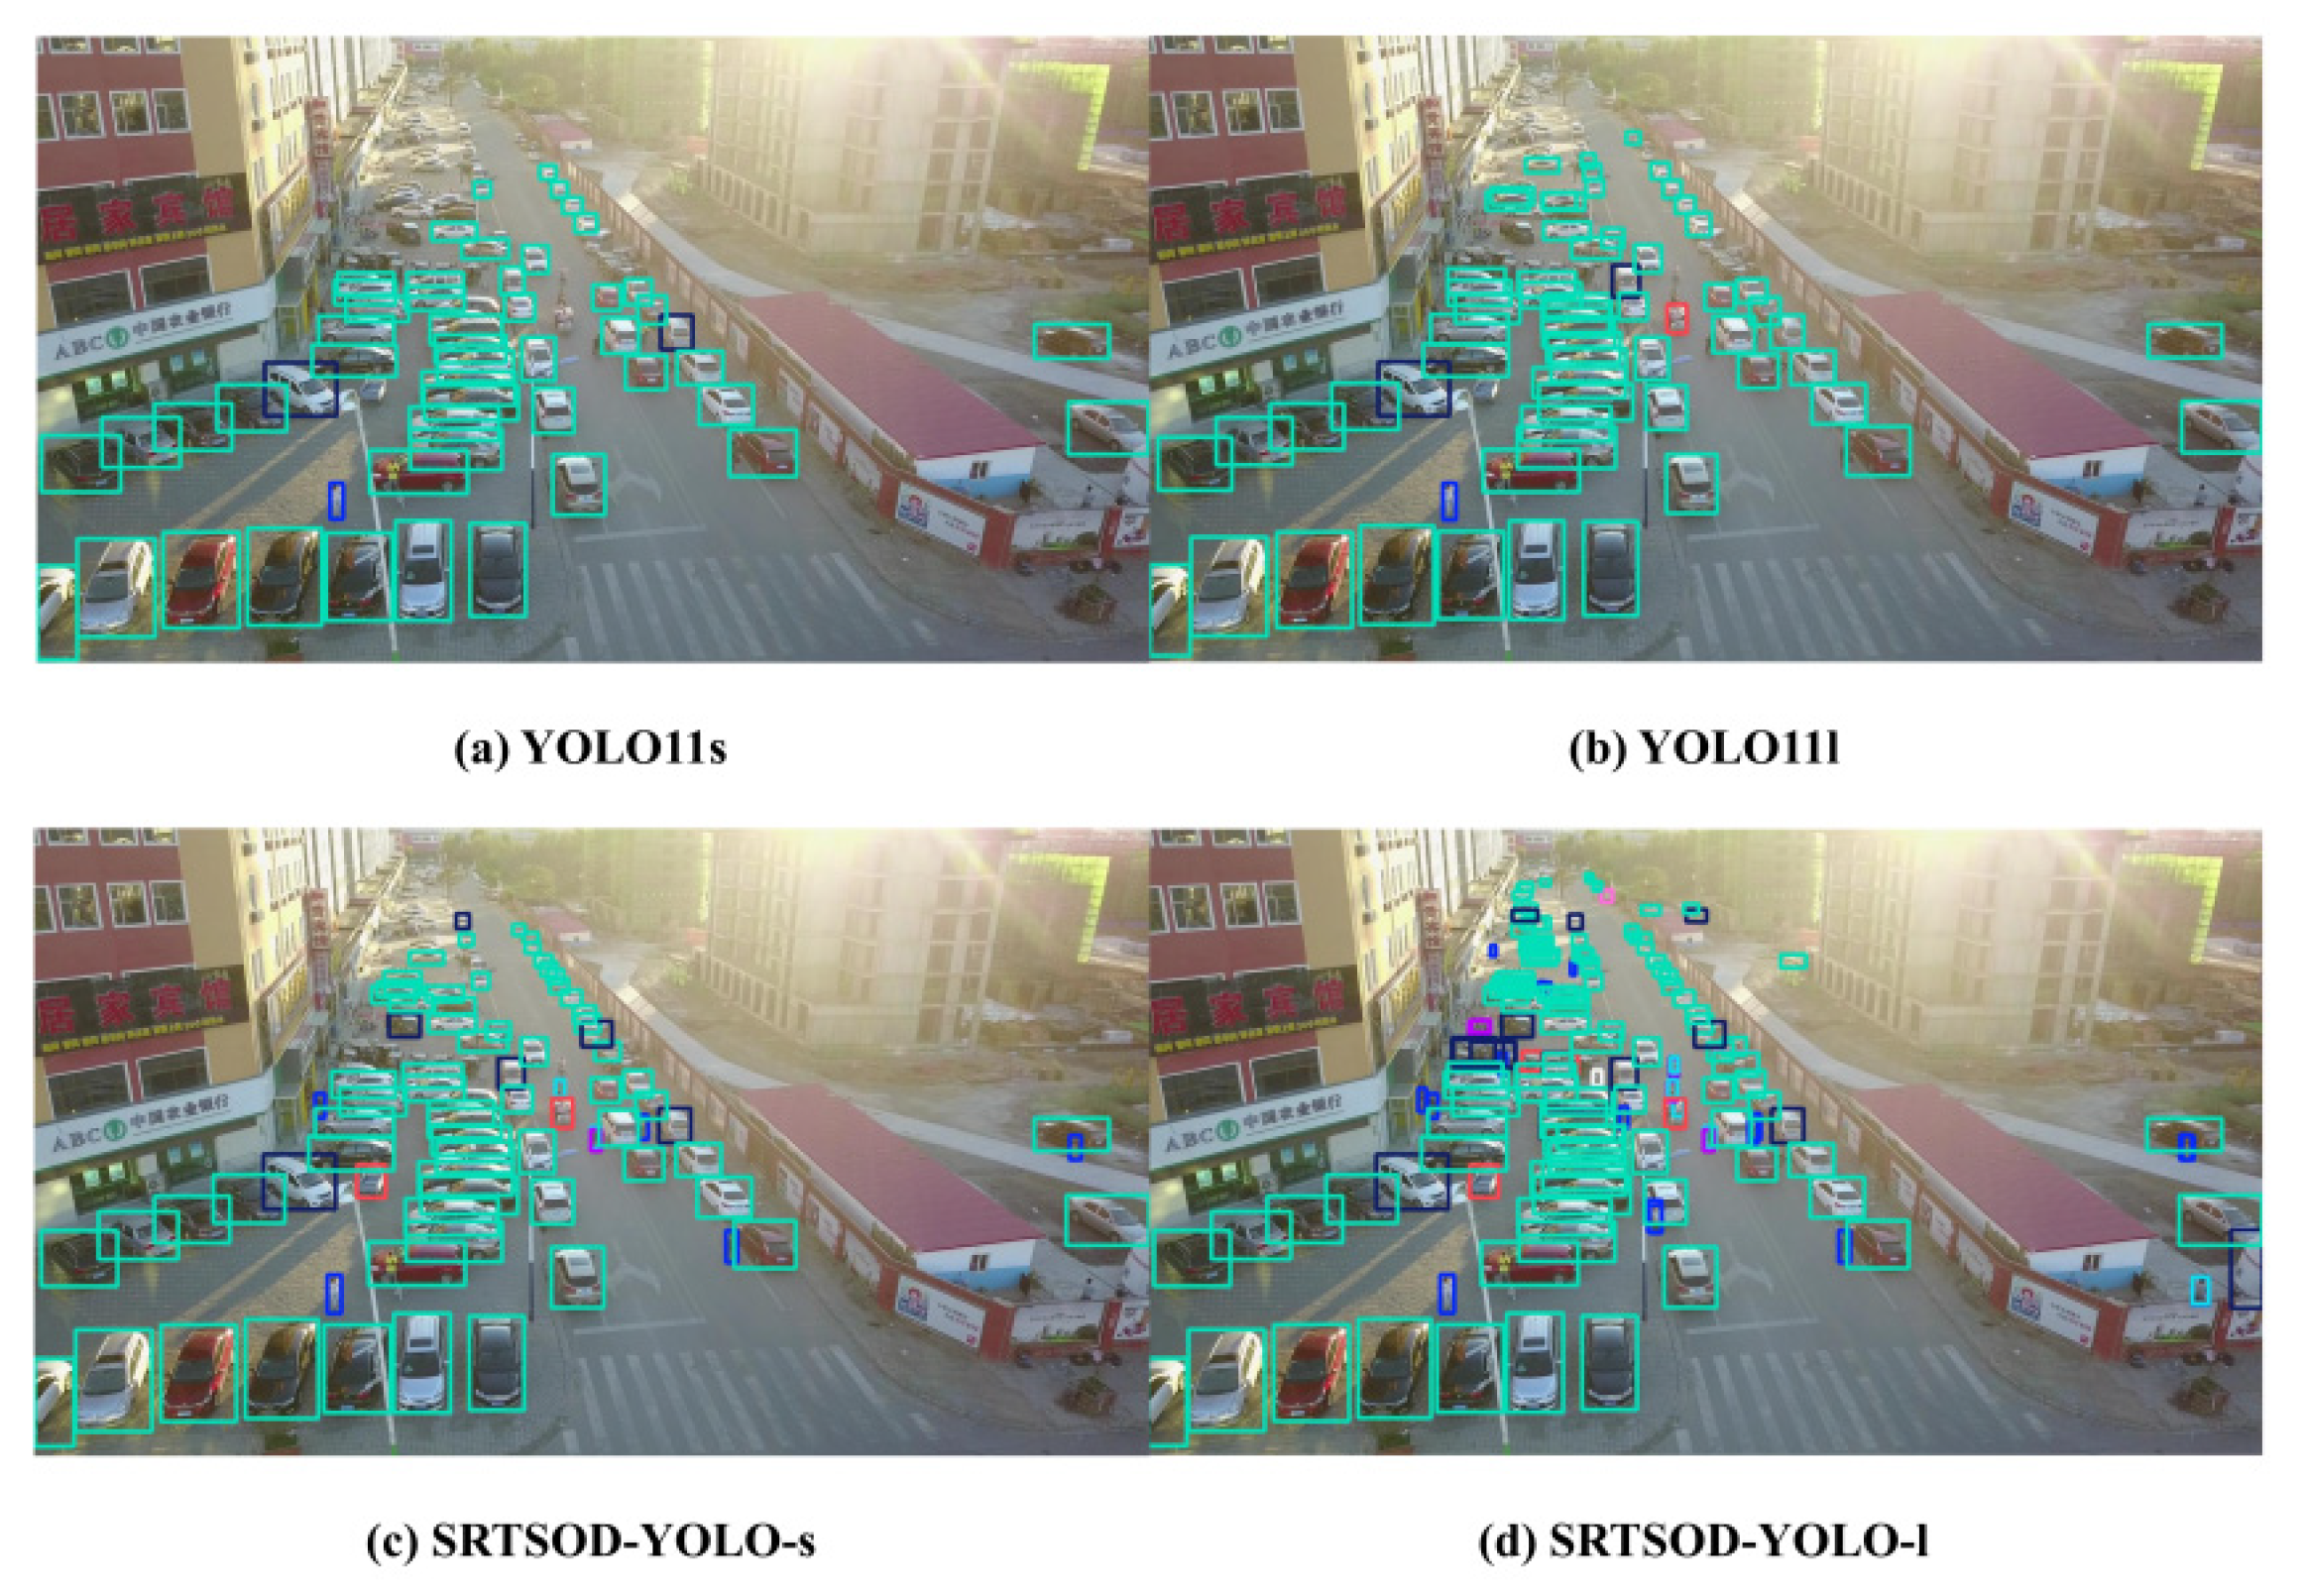
Figure 11.
Cont.
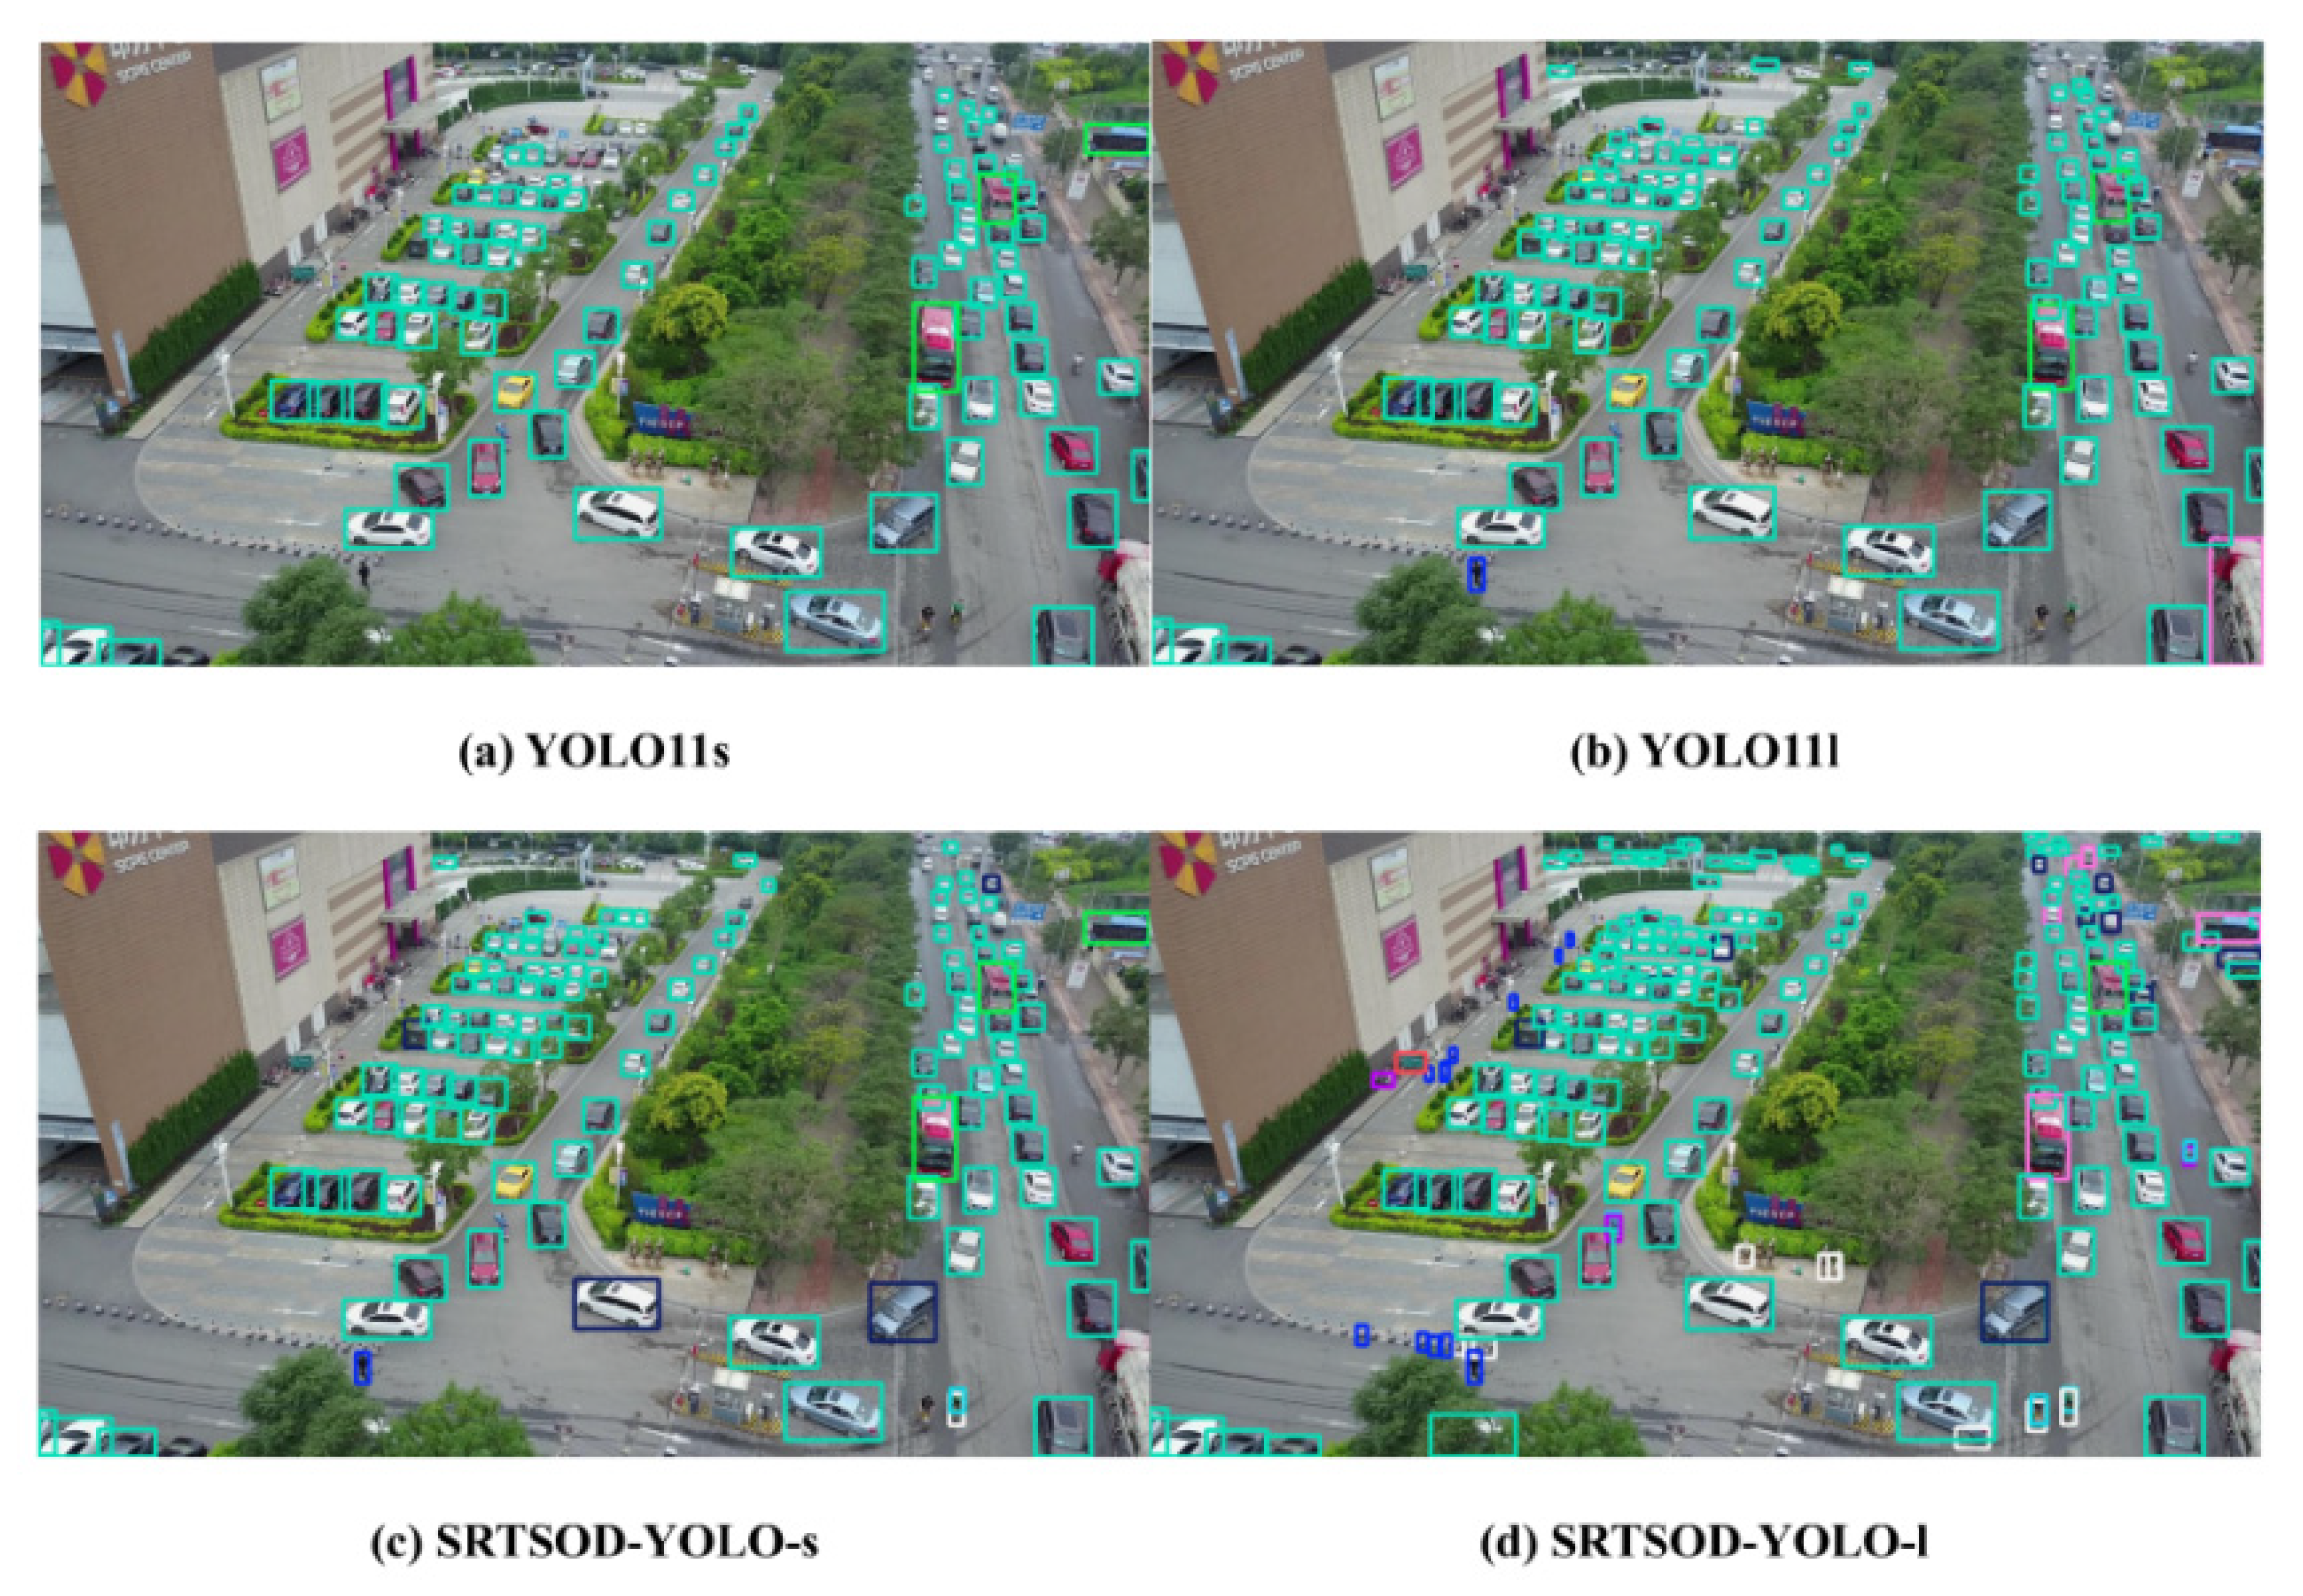
Figure 12.
Cont.
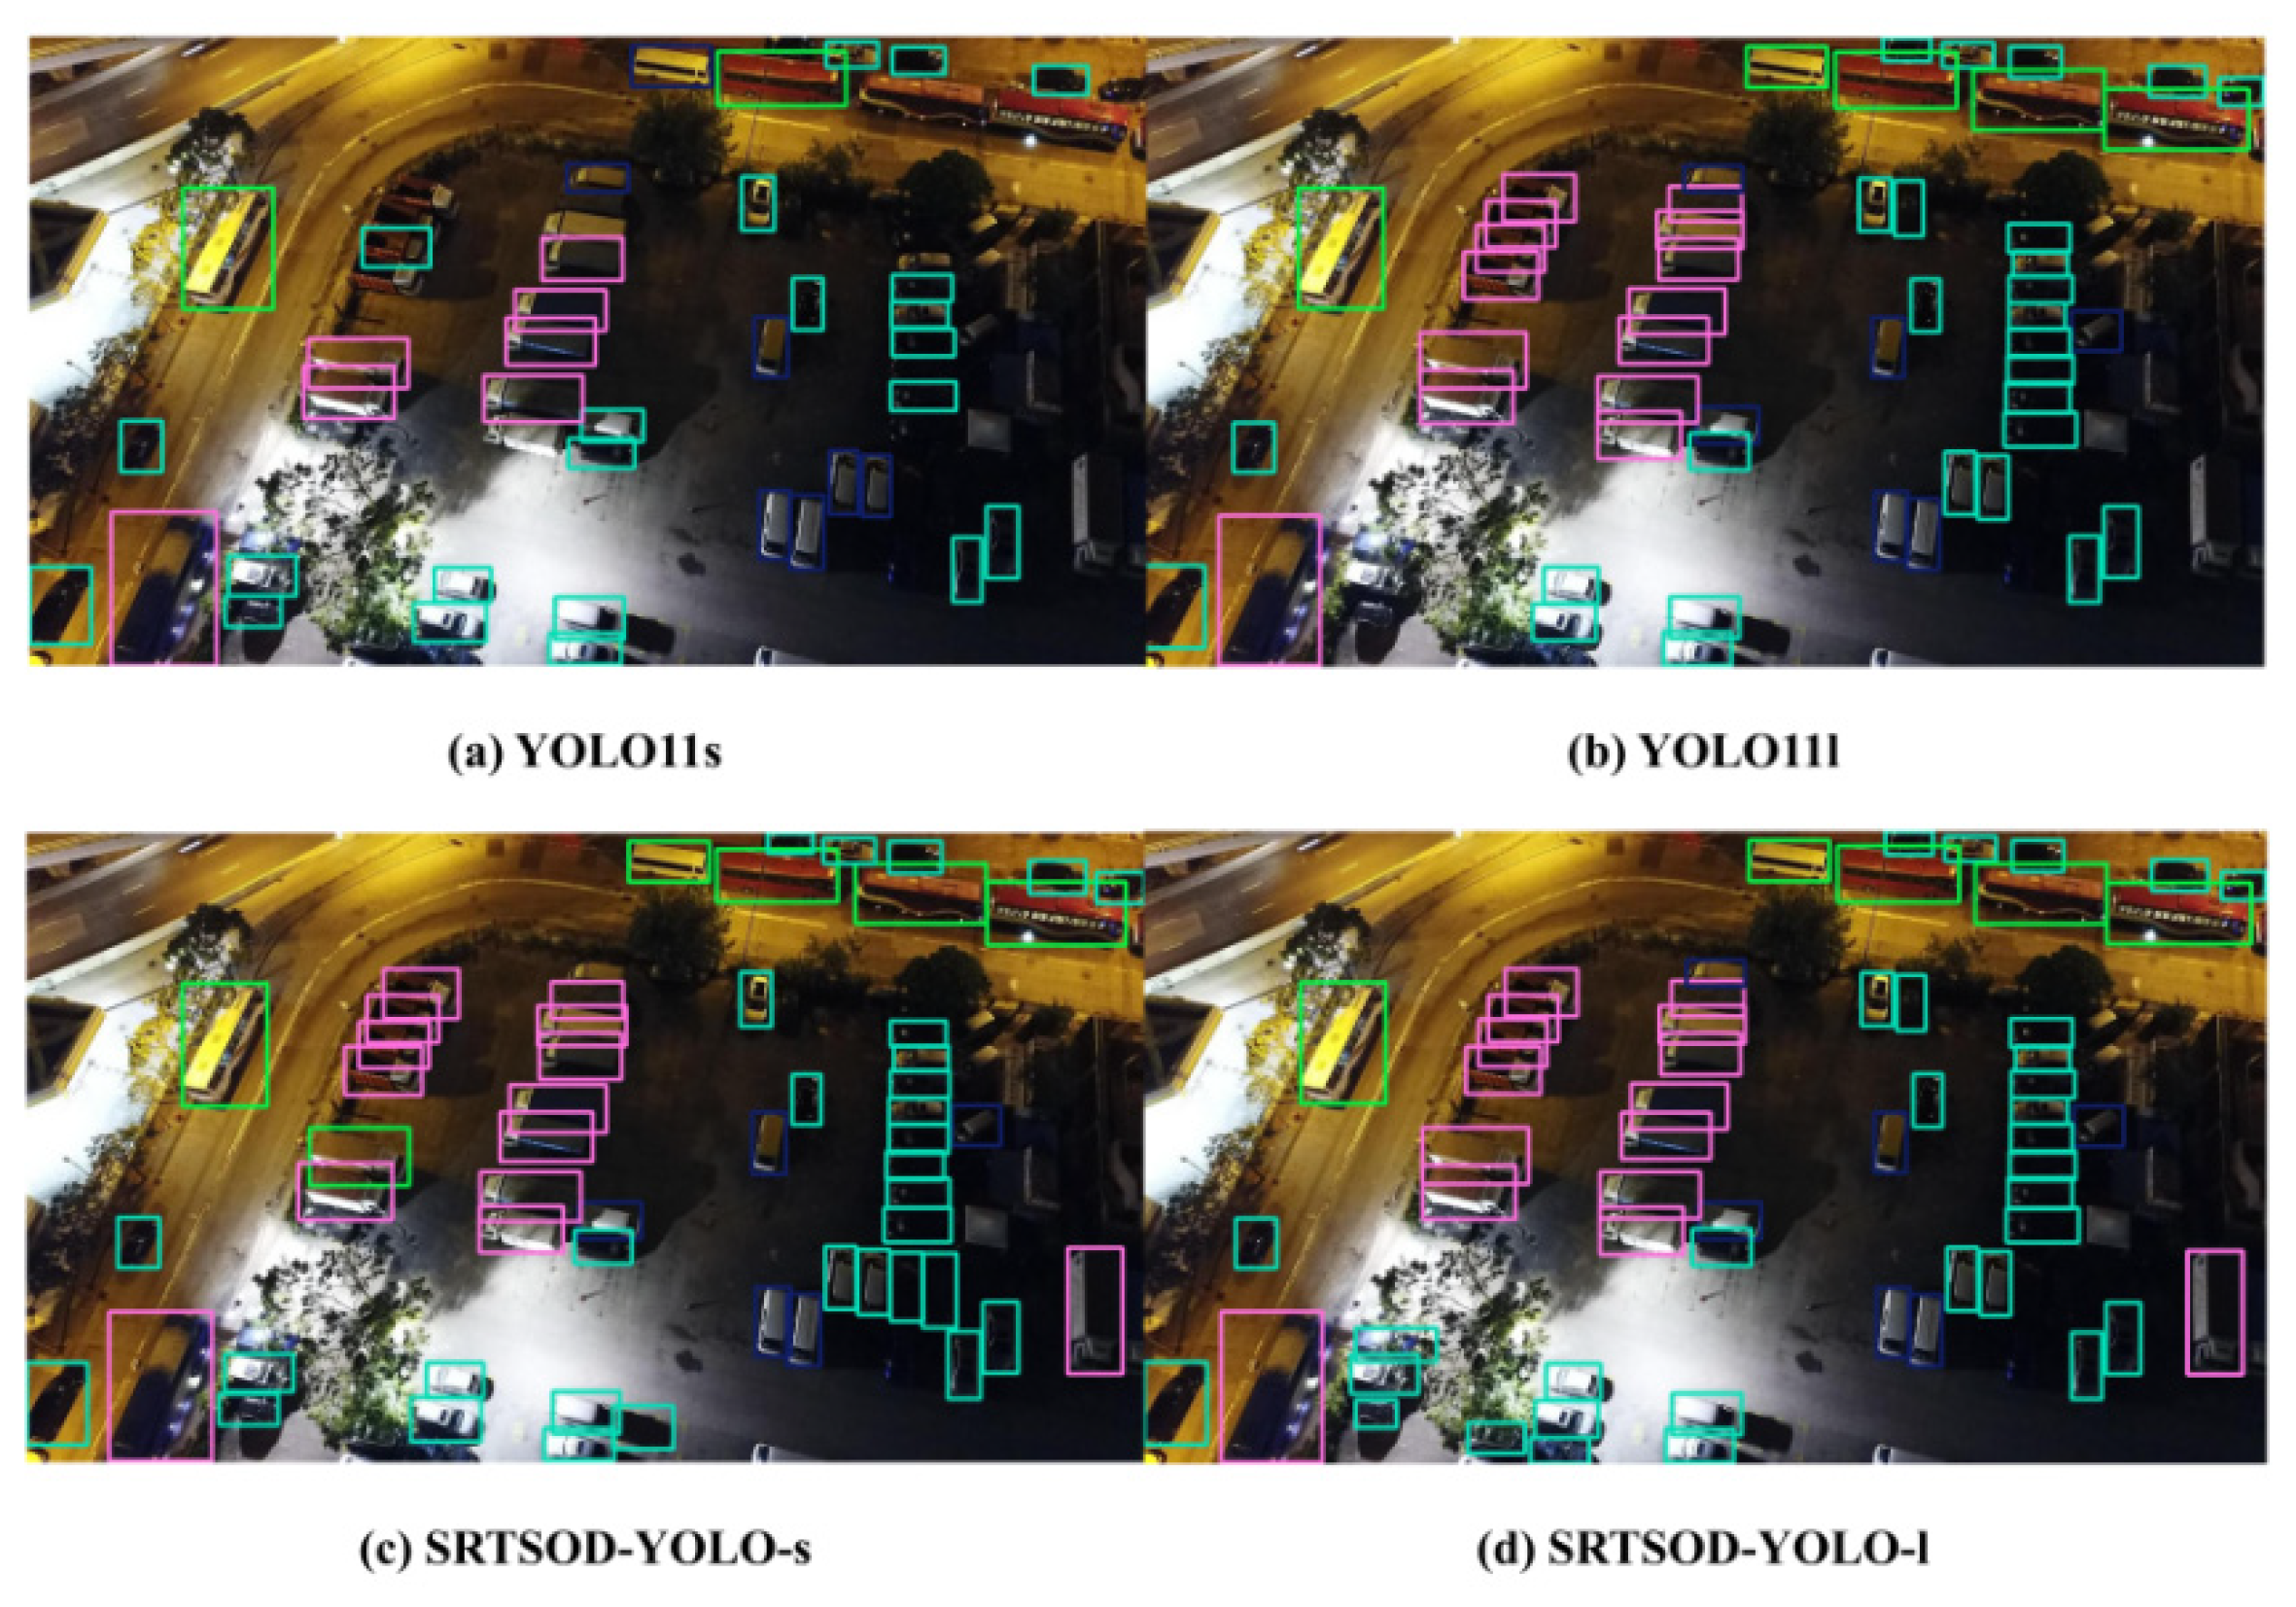
Figure 13.
The heatmap comparison between the proposed model and the baseline model on the Visdrone2019 dataset.
Figure 13.
The heatmap comparison between the proposed model and the baseline model on the Visdrone2019 dataset.
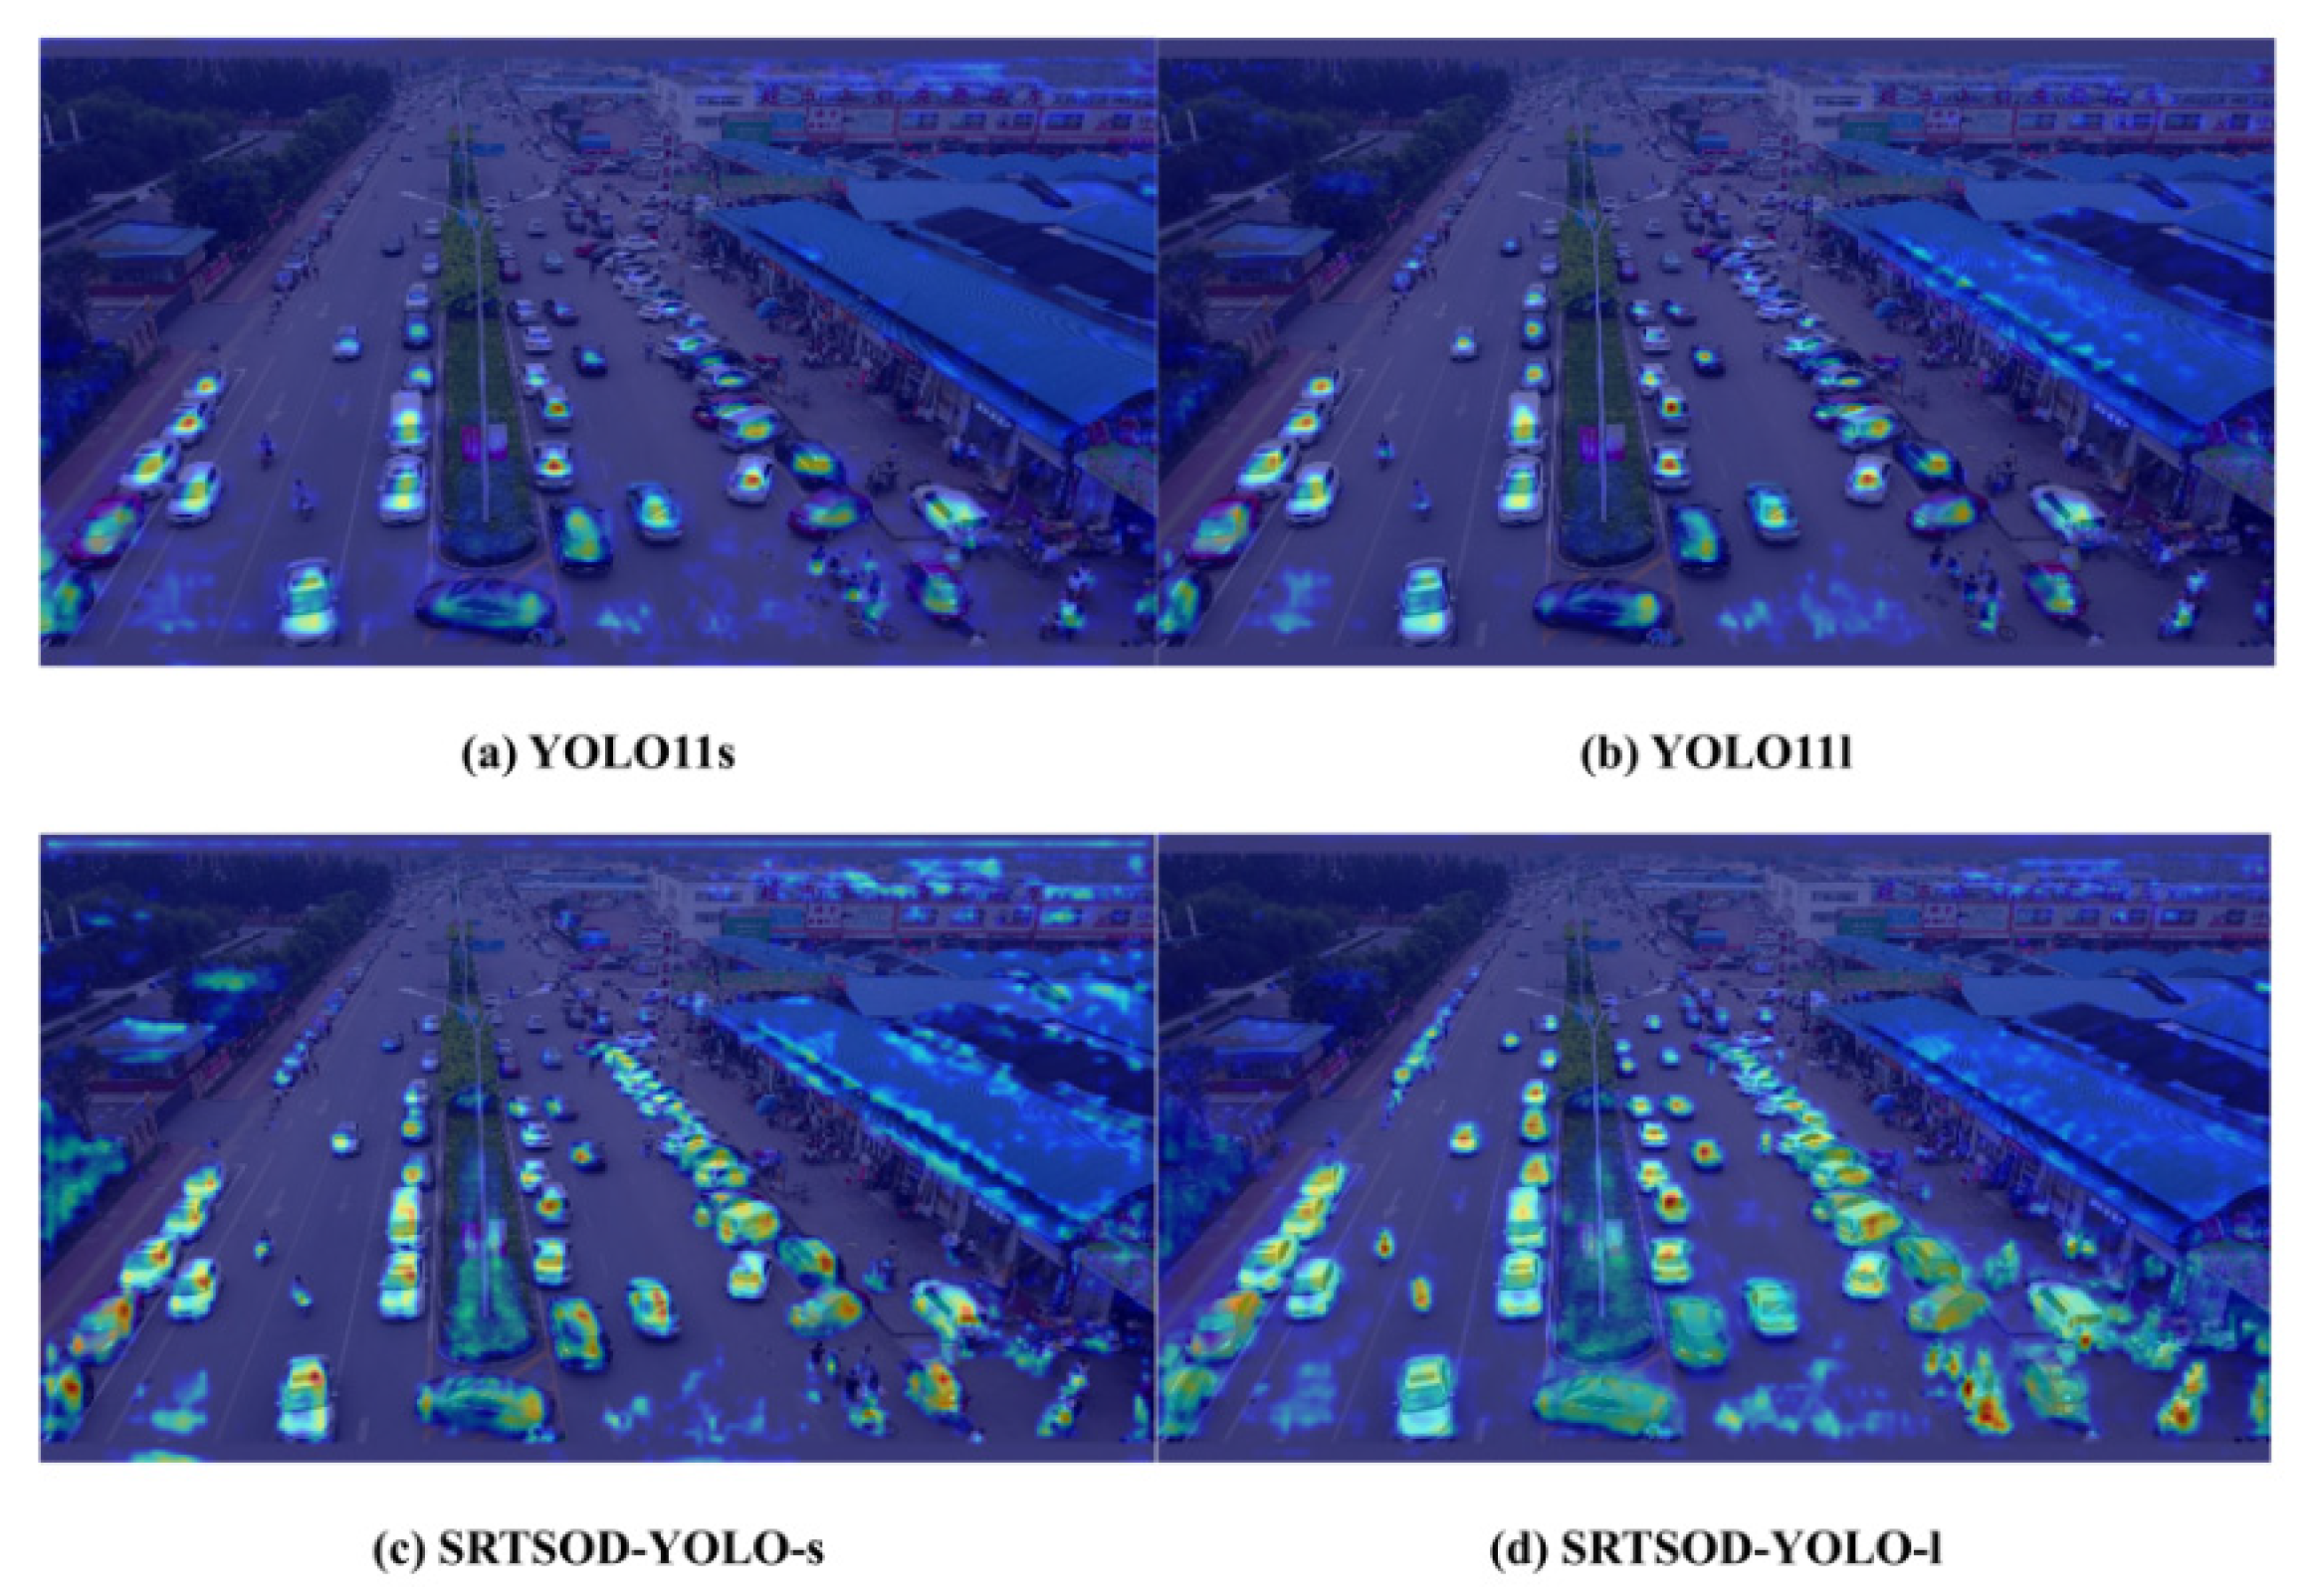
Figure 14.
Cont.
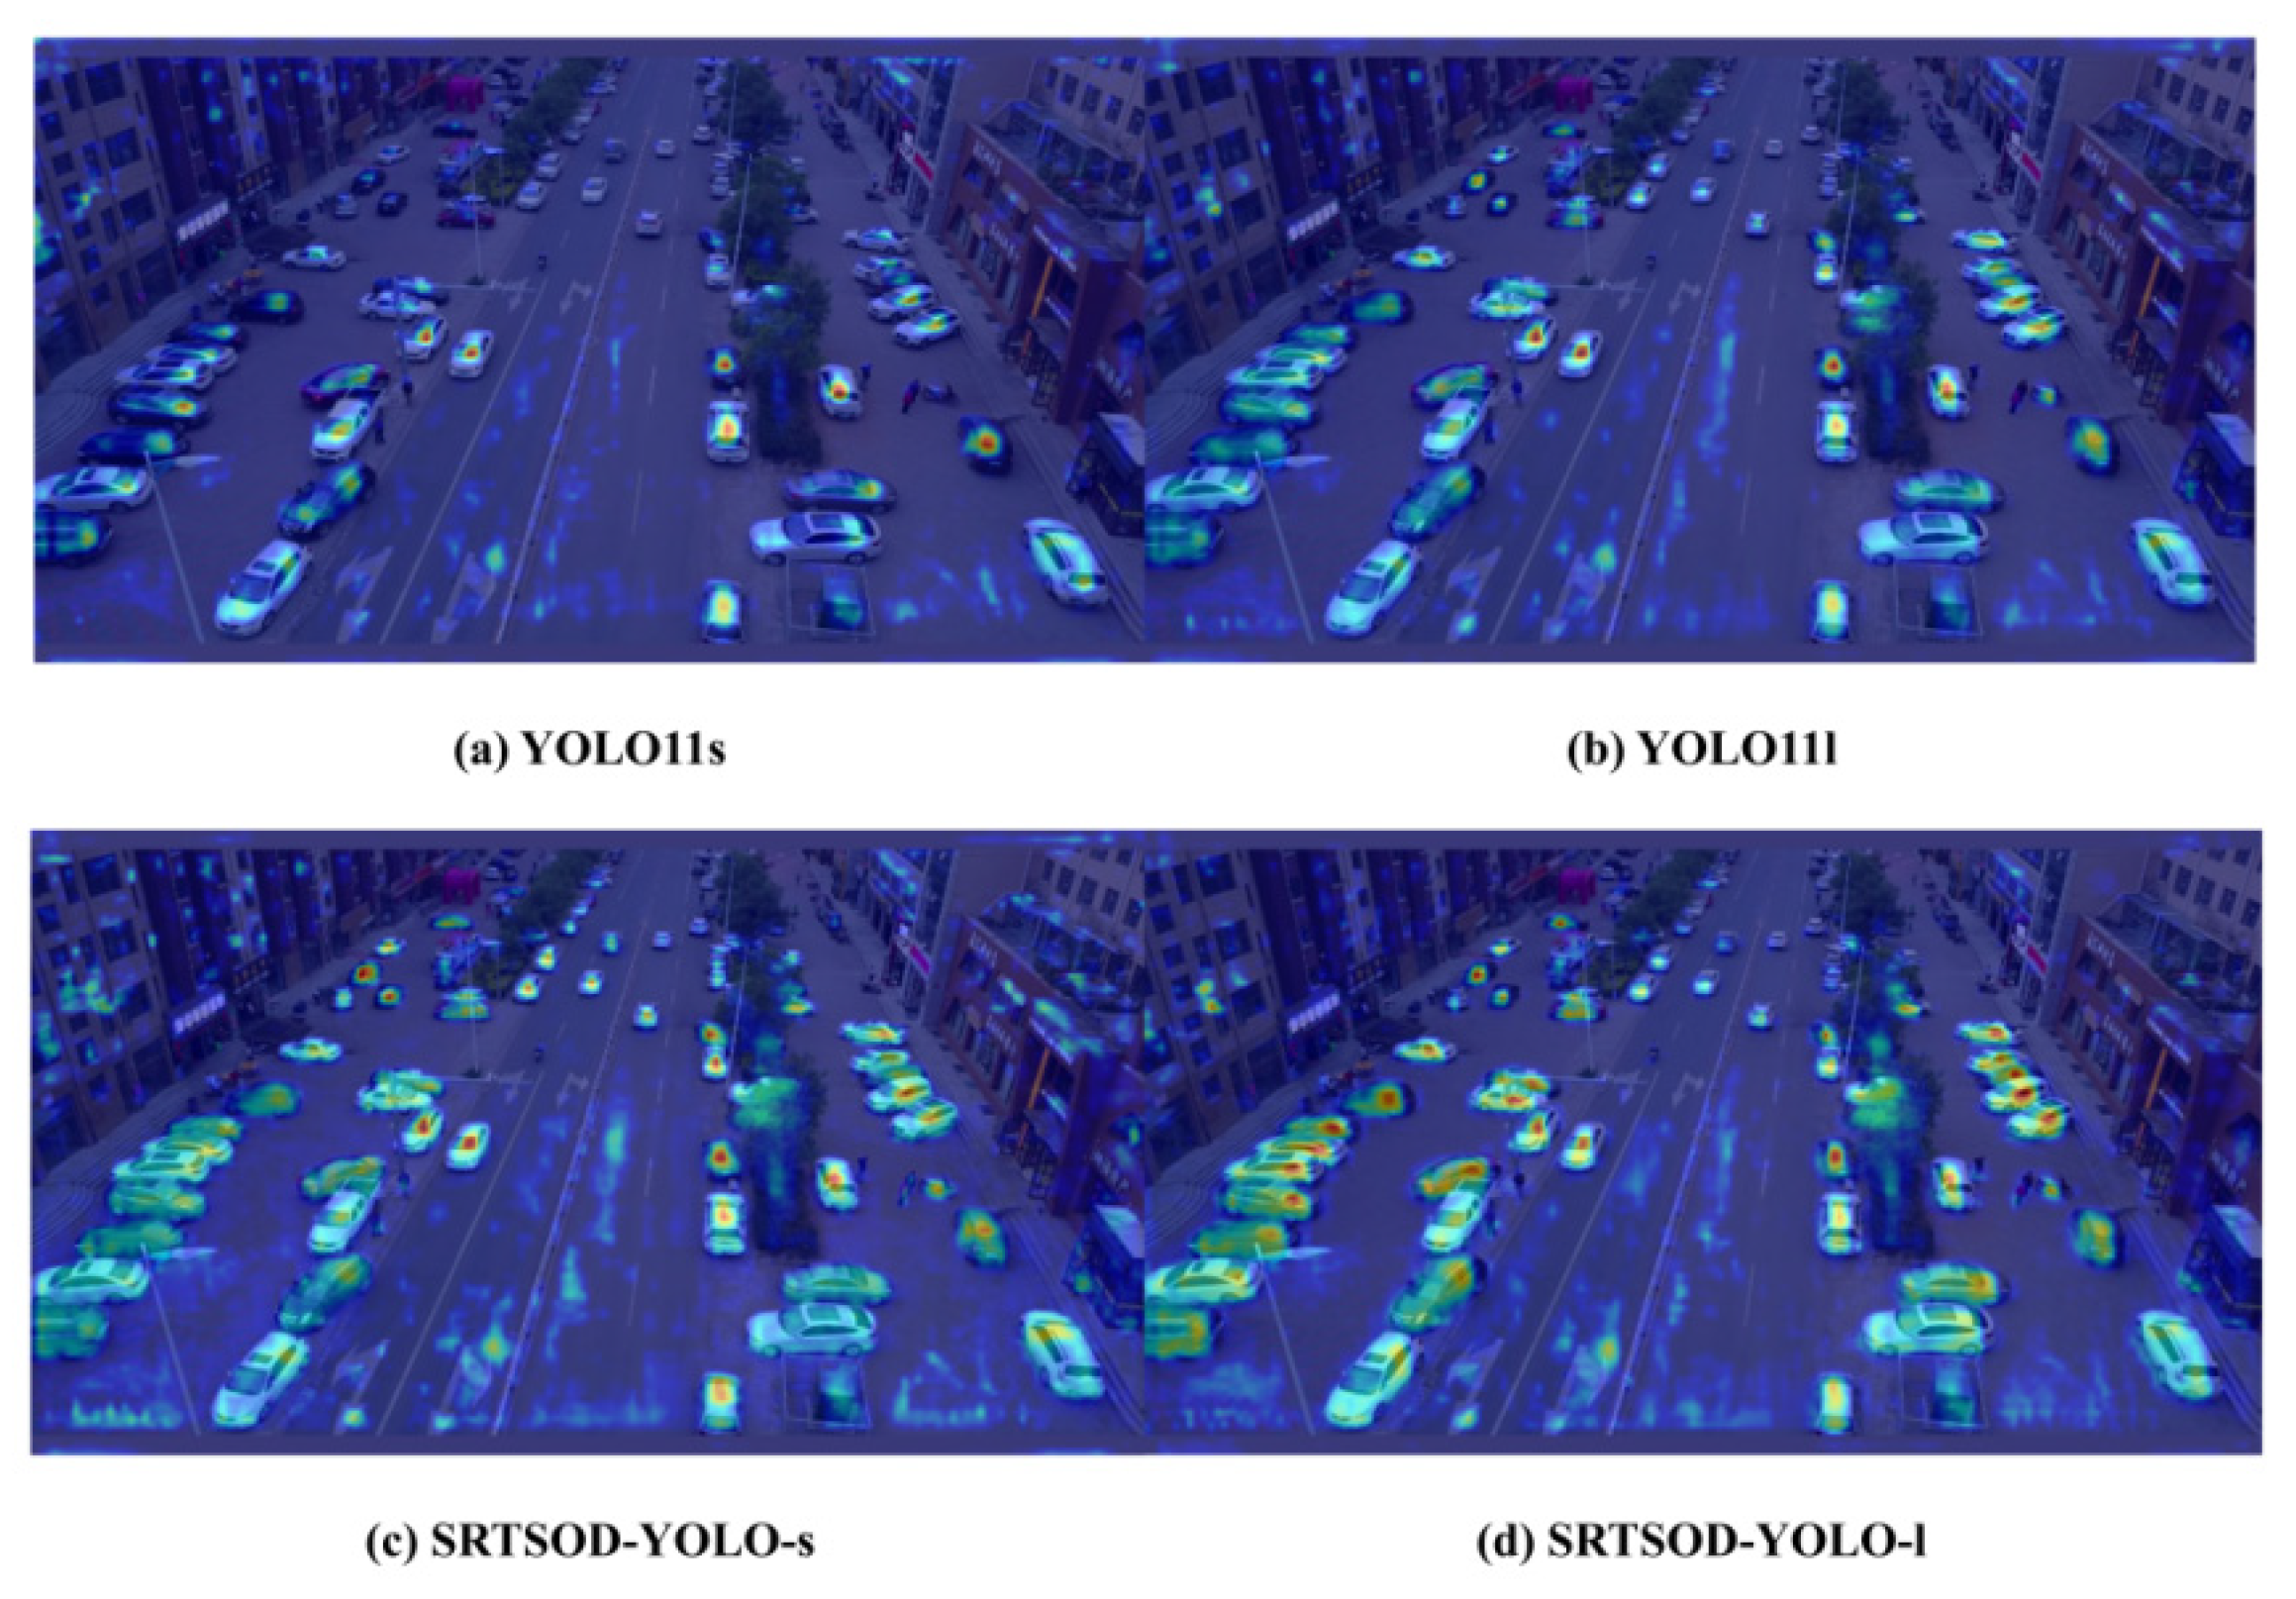
Figure 15.
Cont.
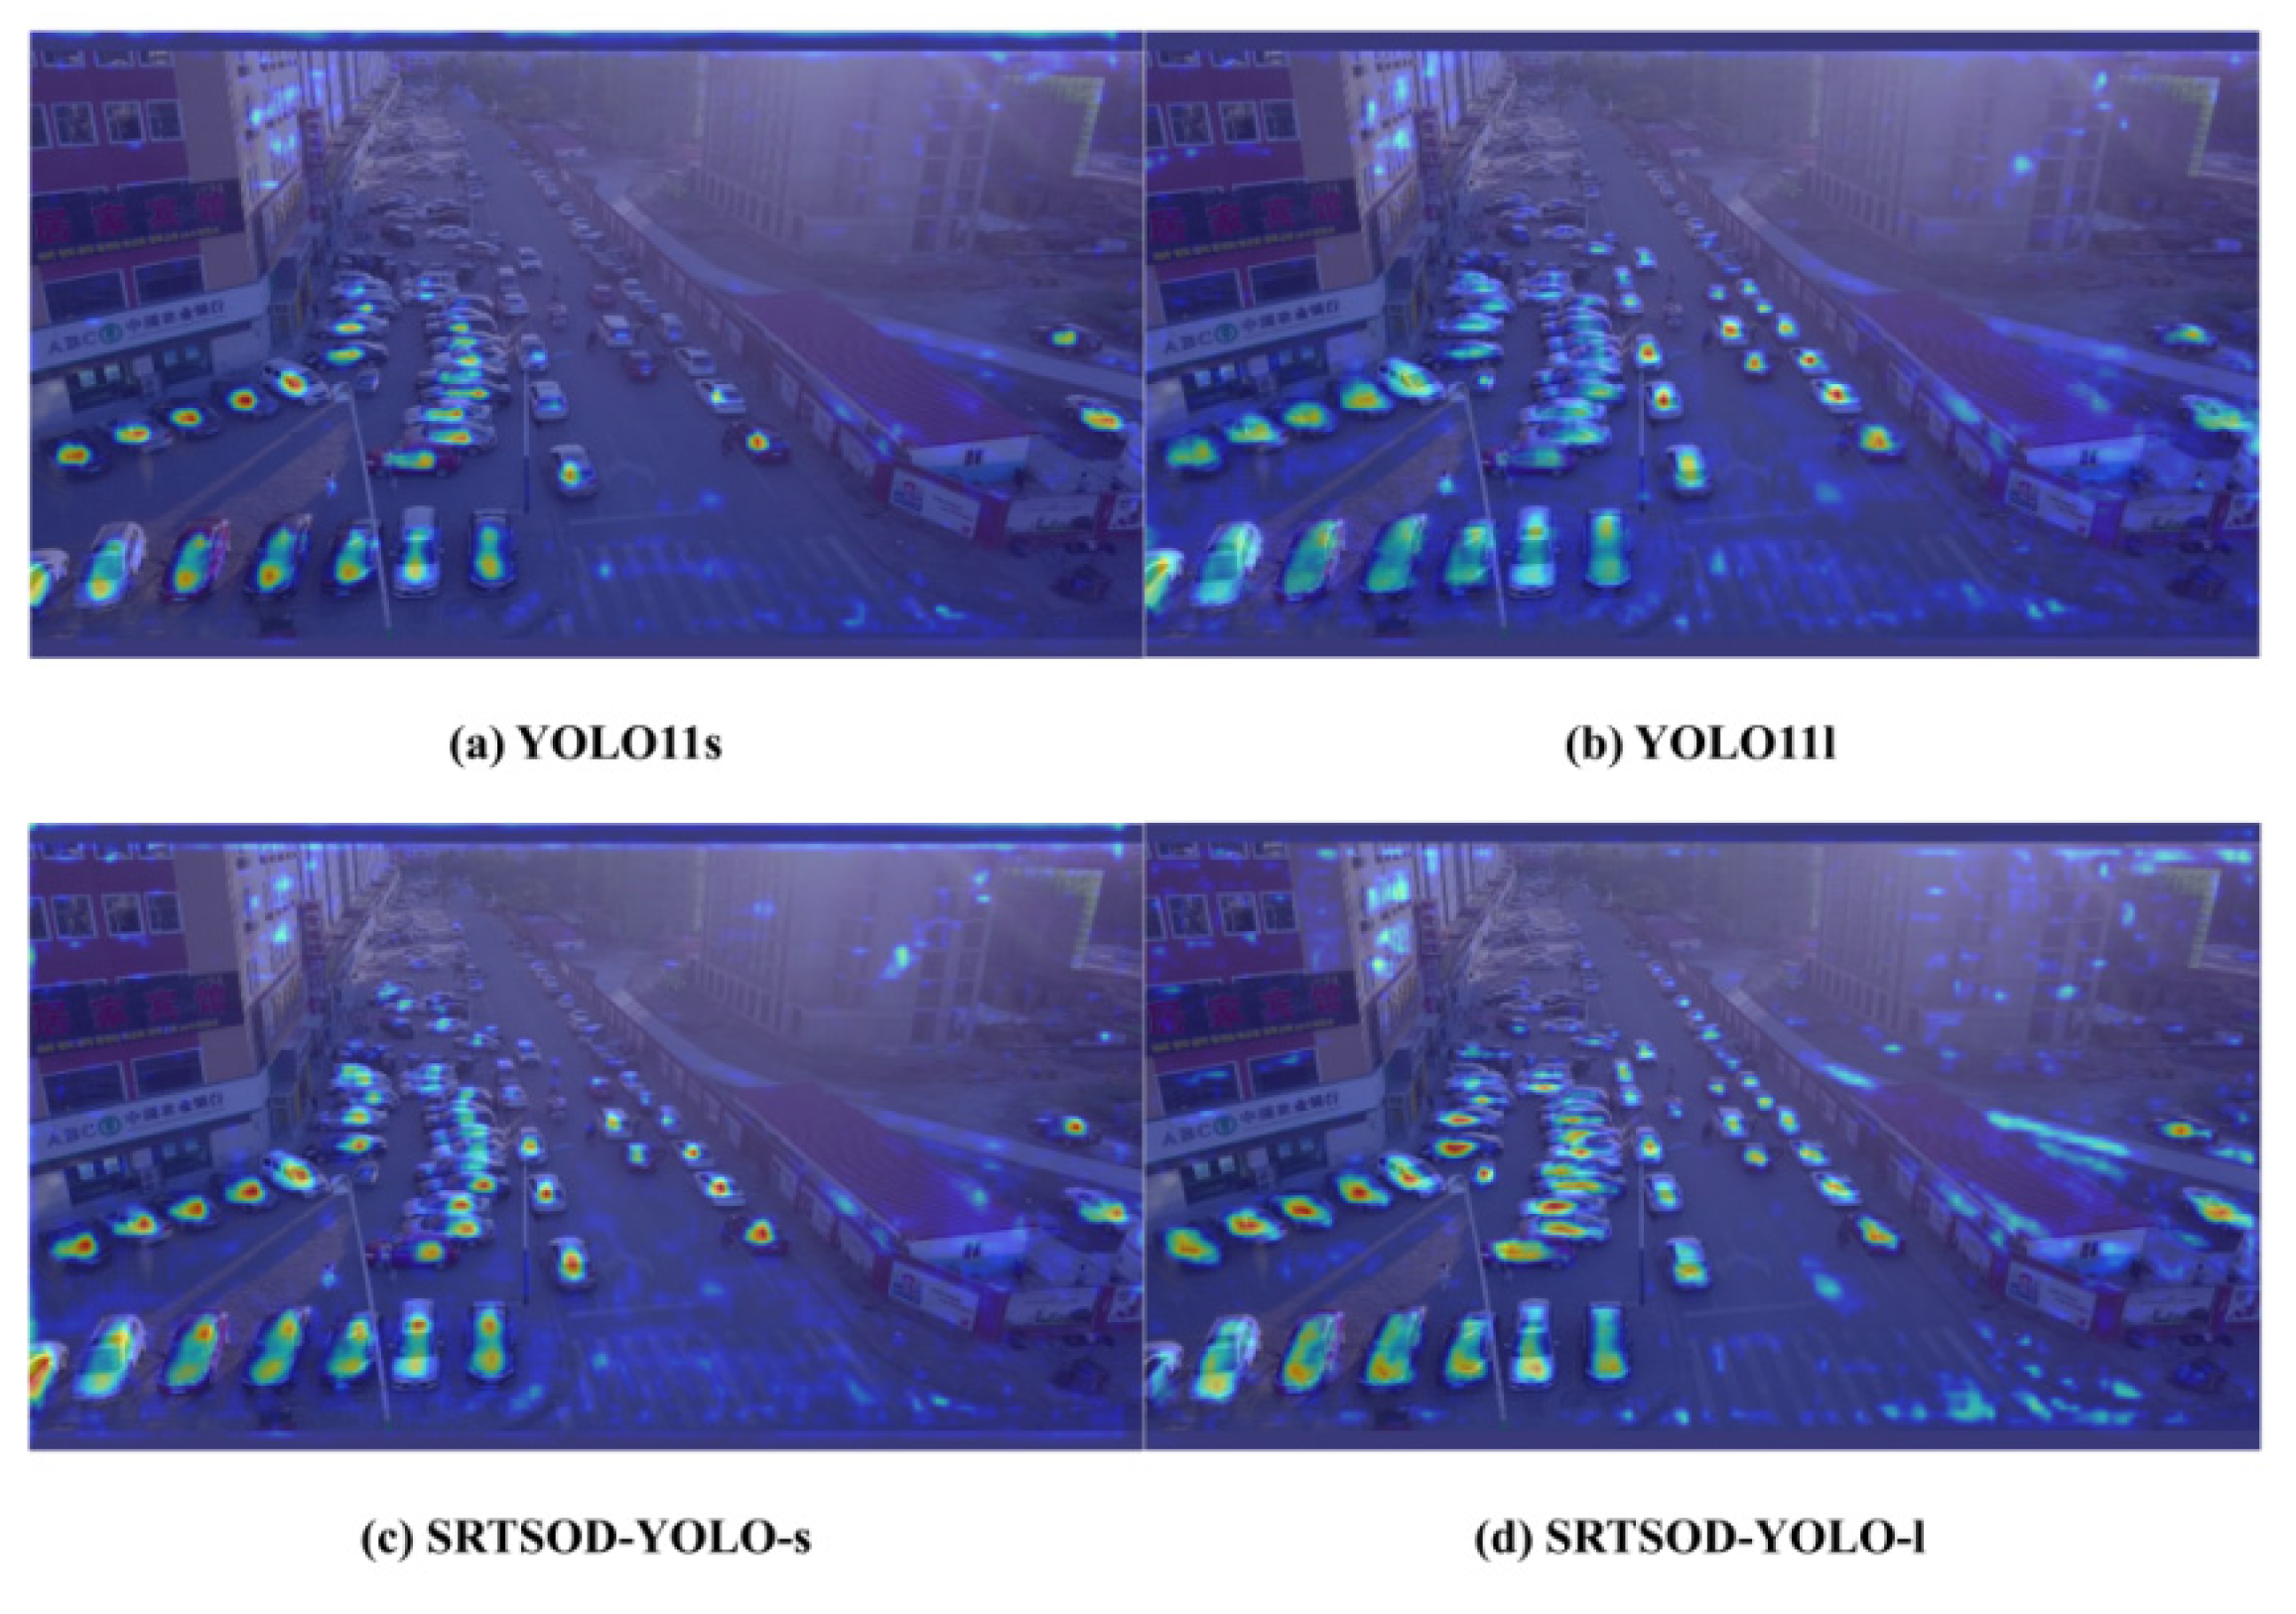
Figure 16.
Cont.
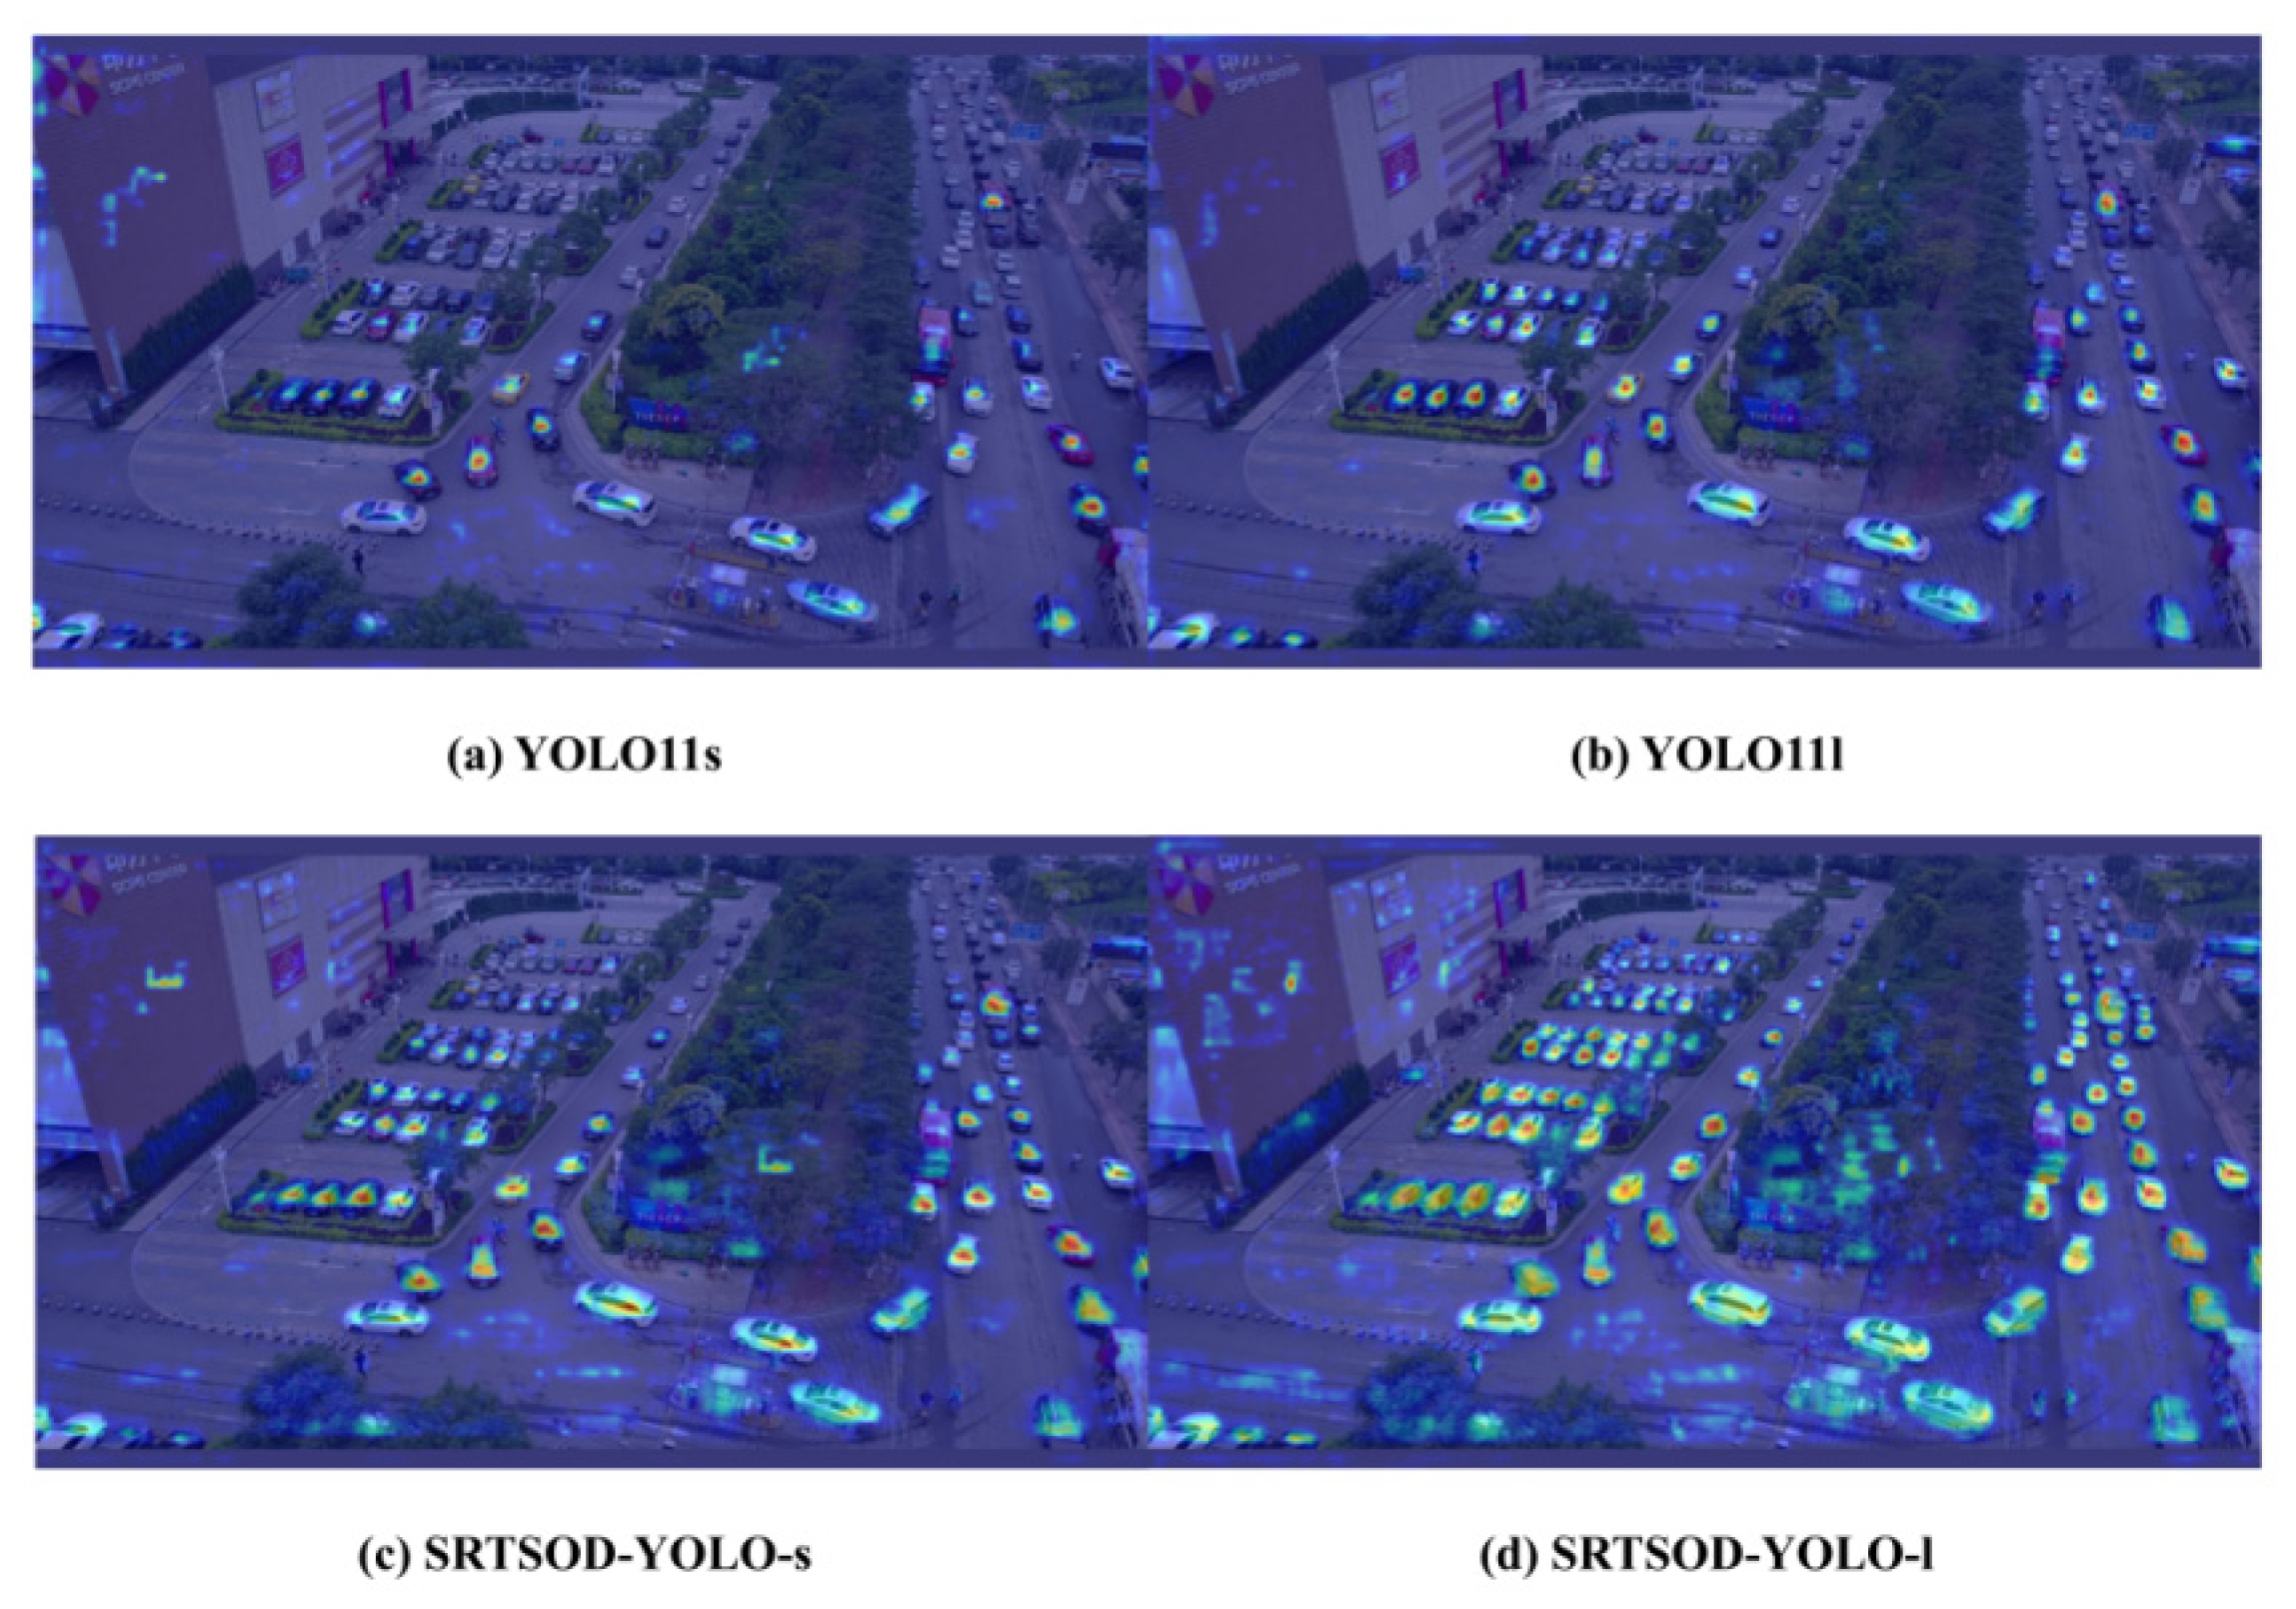
Figure 17.
Cont.
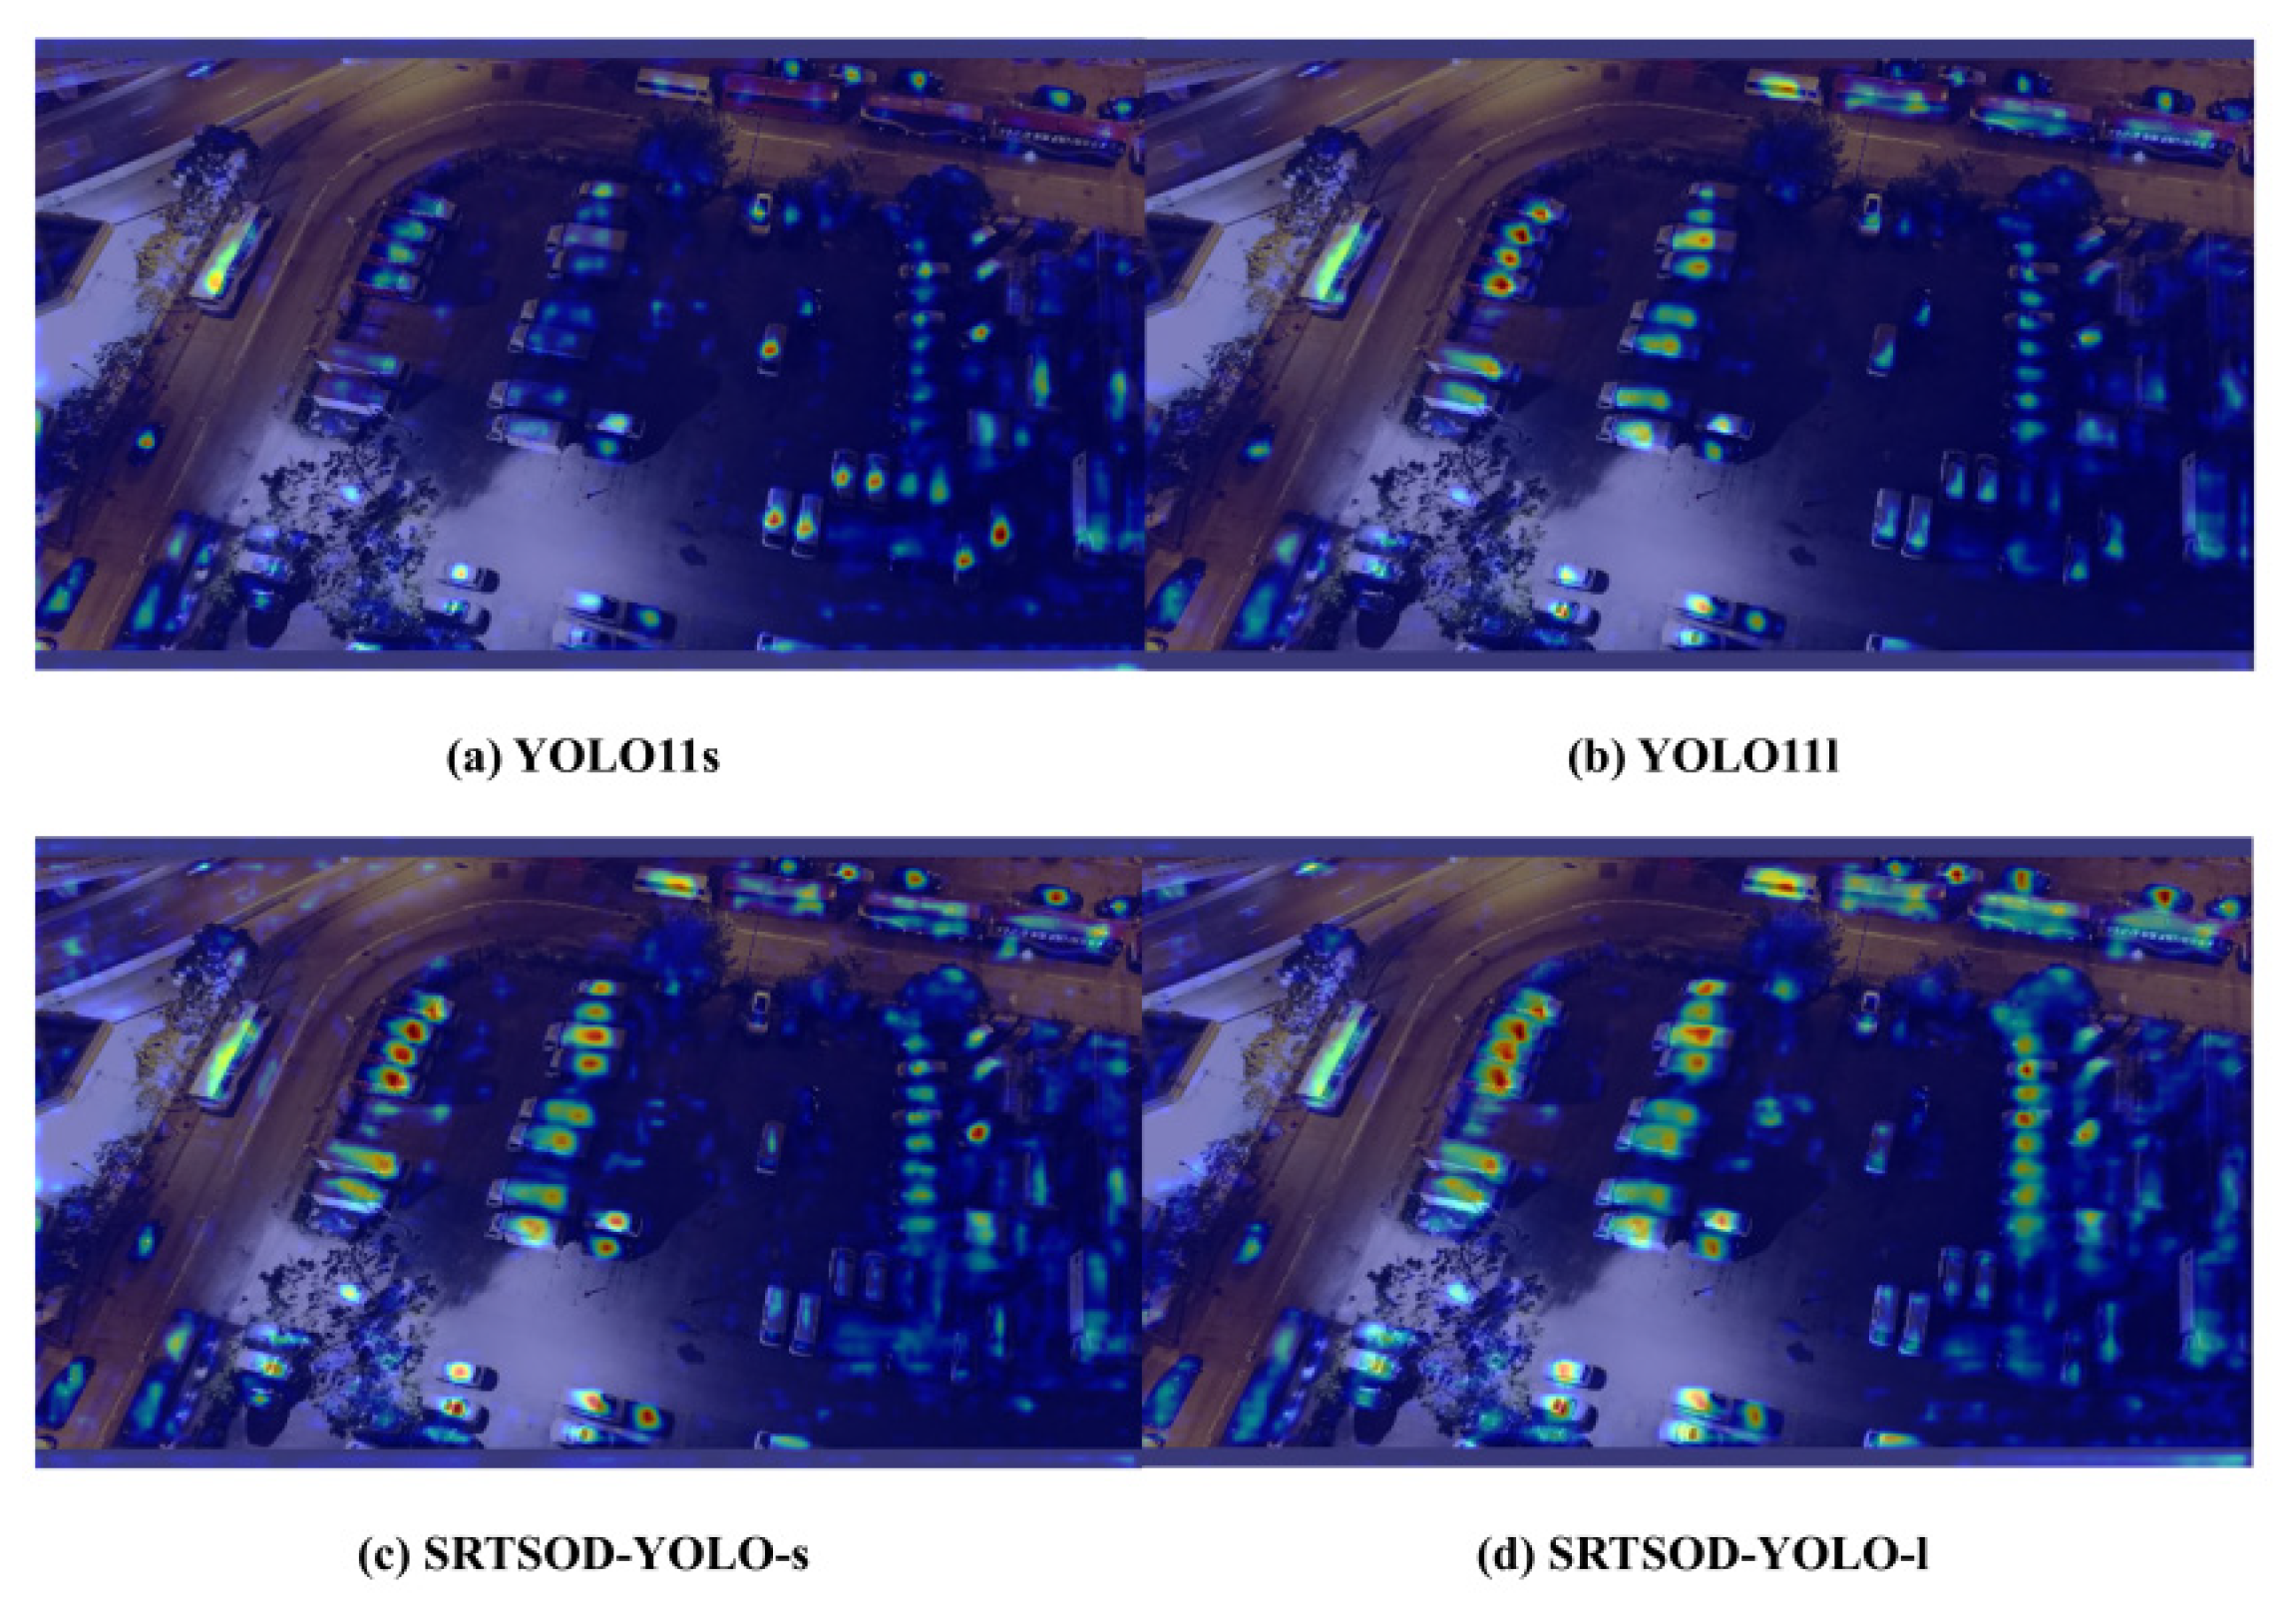
Figure 18.
Detection accuracy of various lightweight models for different classes on Visdrone2019 dataset.
Figure 18.
Detection accuracy of various lightweight models for different classes on Visdrone2019 dataset.
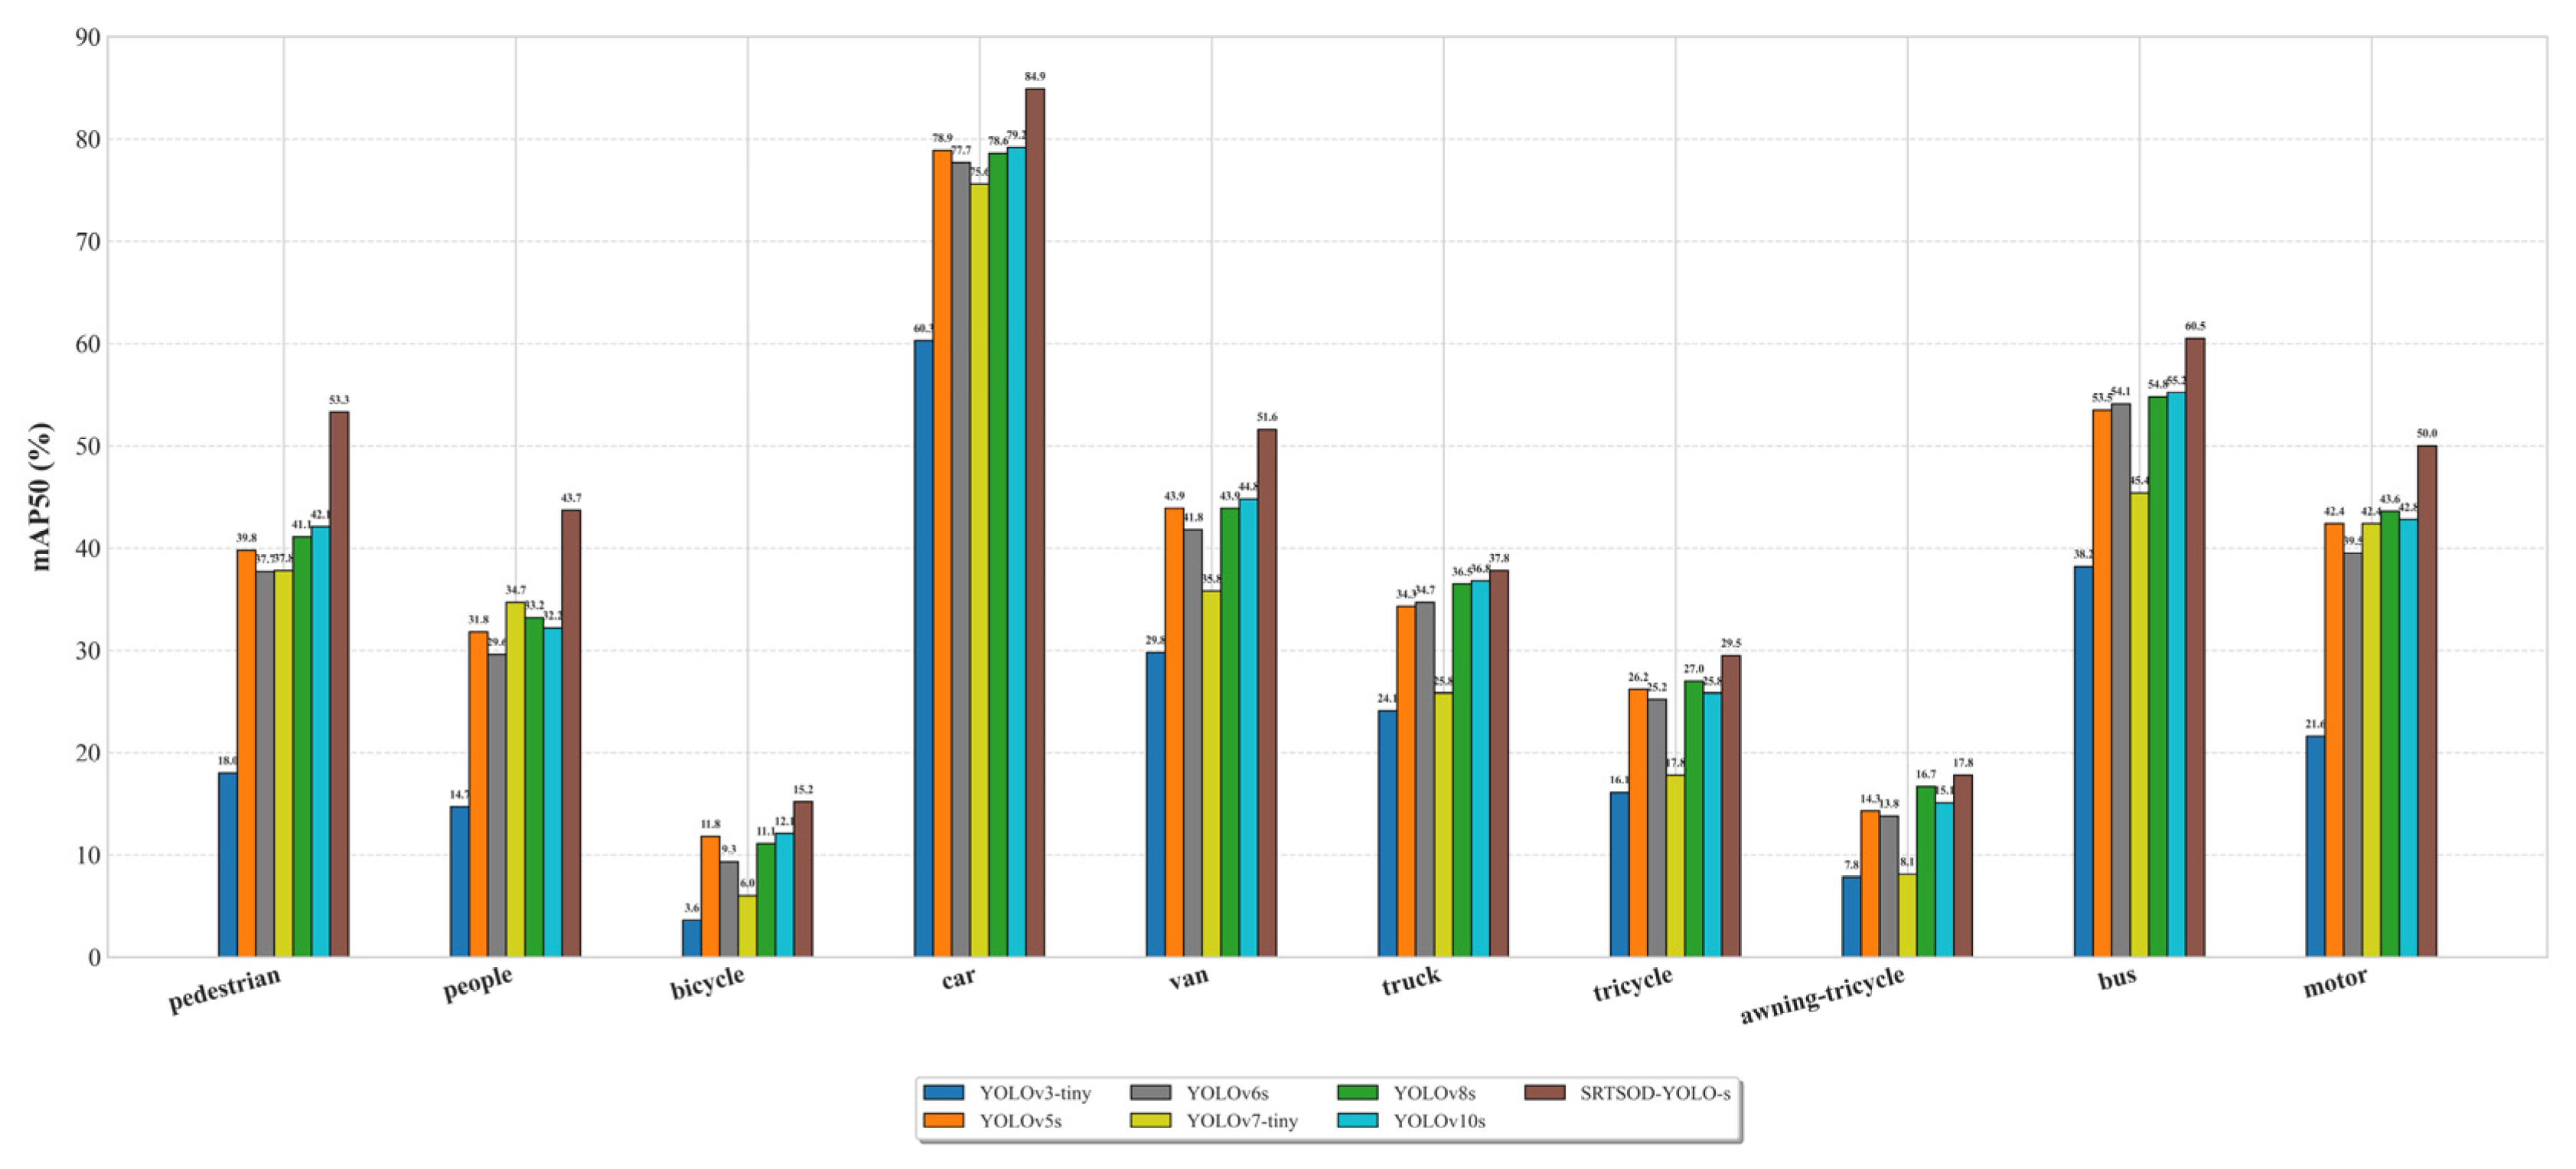
Figure 19.
Detection accuracy of various large-scale models for different classes on the Visdrone2019 dataset.
Figure 19.
Detection accuracy of various large-scale models for different classes on the Visdrone2019 dataset.
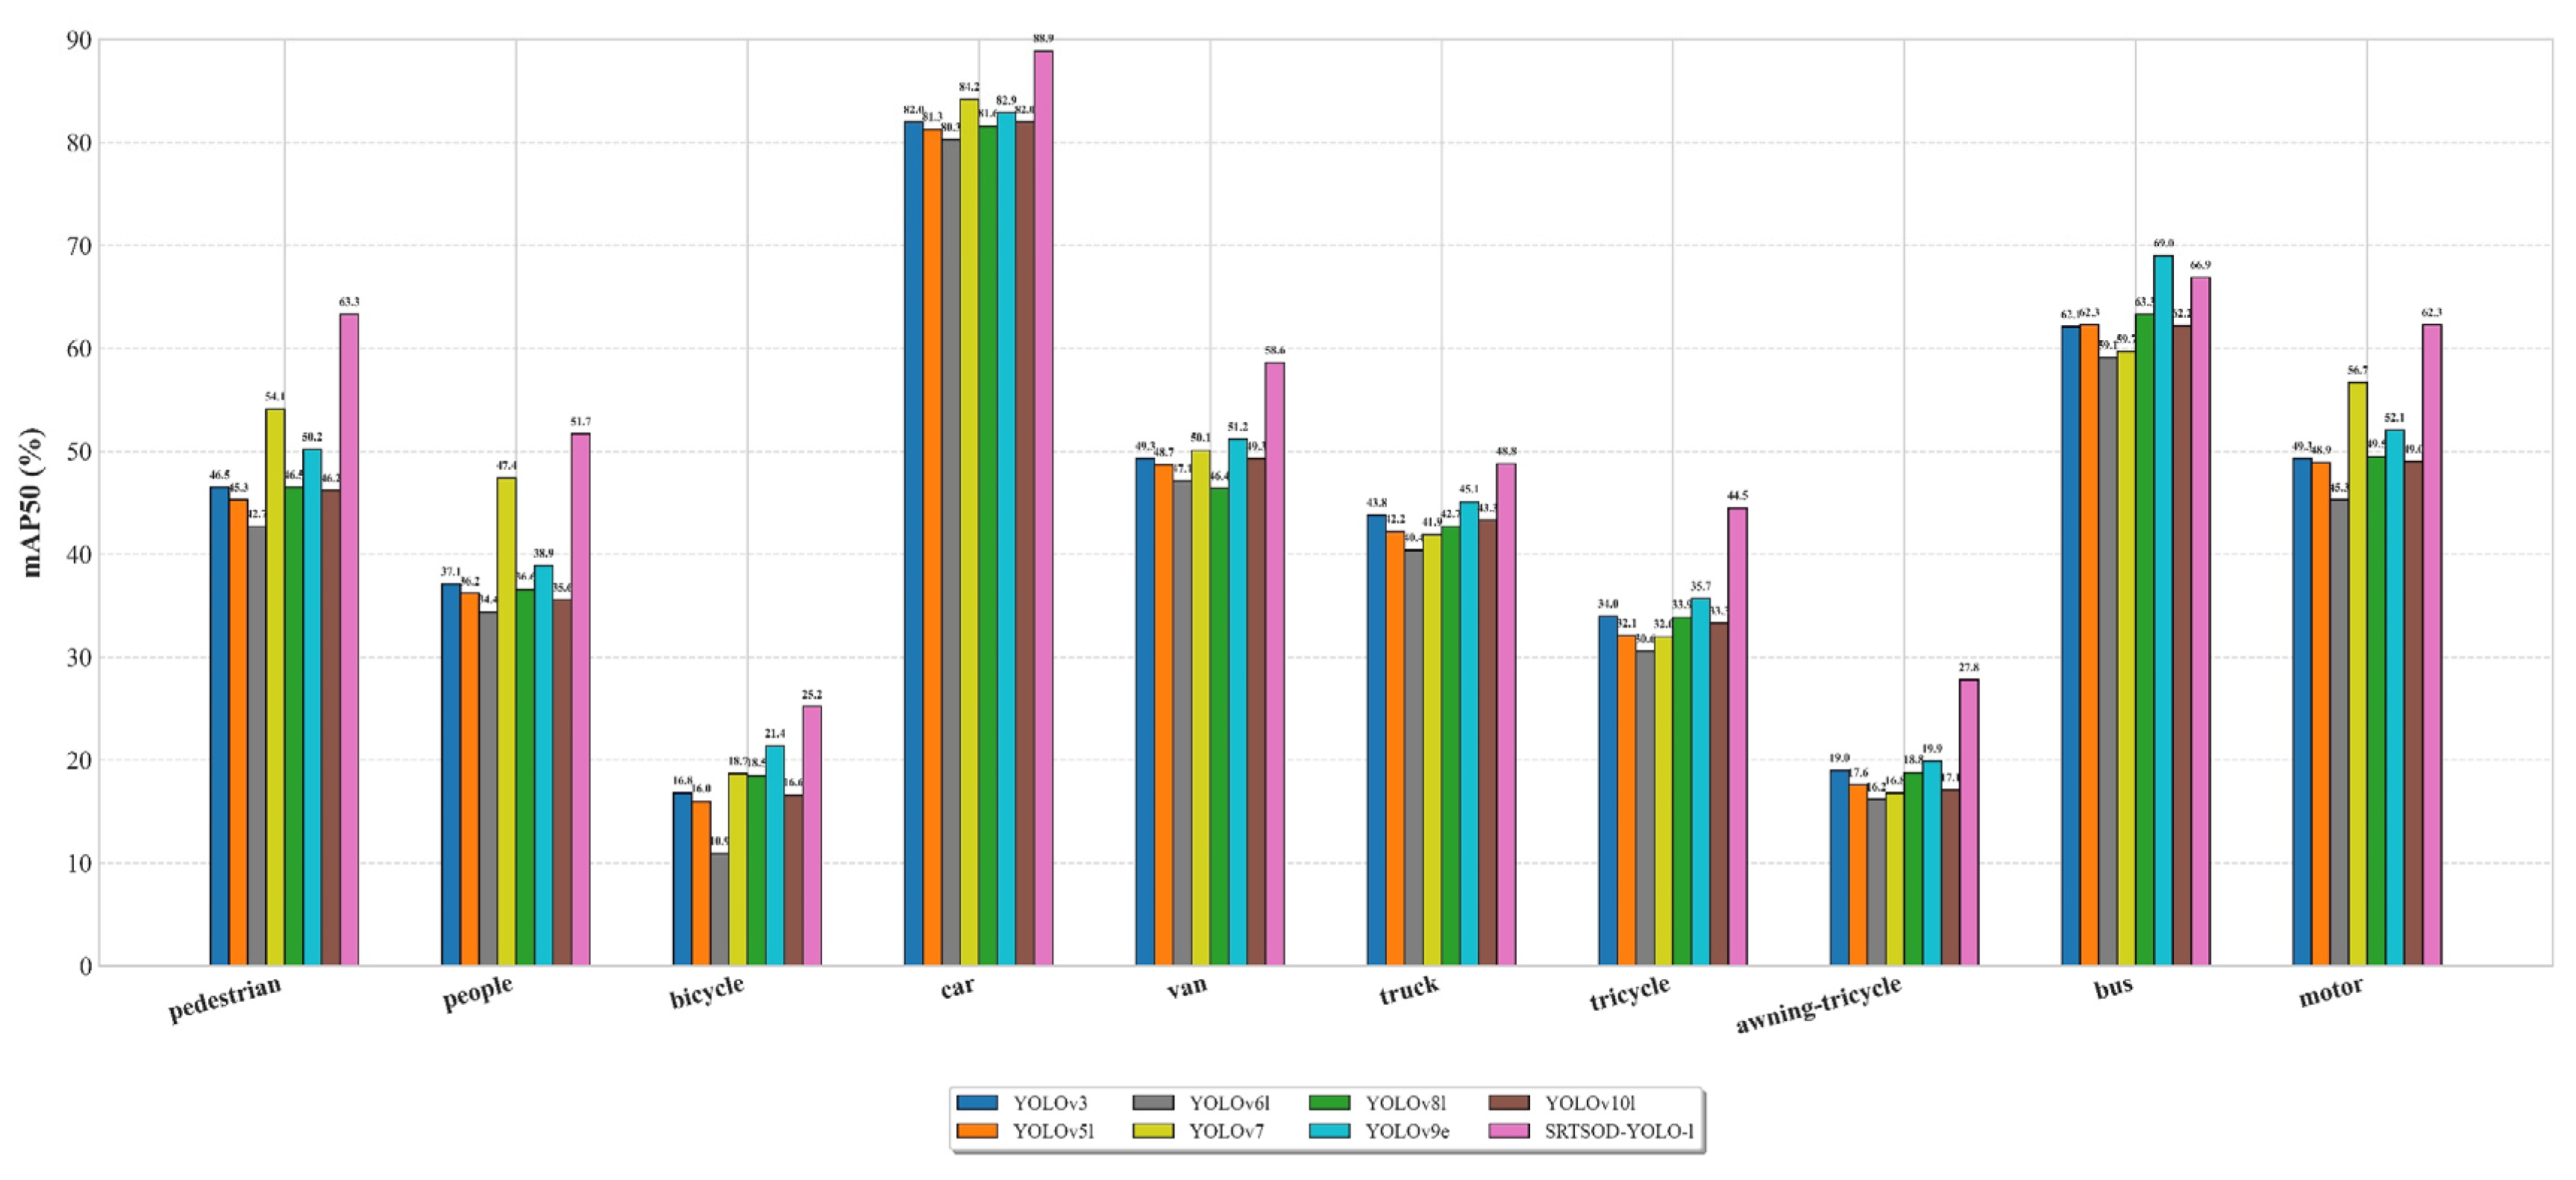

Table 1.
The YOLO11 model variants with different depths and widths.
| Model | Depth | Width | Maximum number of channels |
|---|---|---|---|
| yolo11x | 1.00 | 1.50 | 512 |
| yolo11l | 1.00 | 1.00 | 512 |
| yolo11m | 0.50 | 1.00 | 512 |
| yolo11s | 0.50 | 0.50 | 1024 |
| yolo11n | 0.50 | 0.25 | 1024 |
Table 2.
The parameter settings for SRTSOD-YOLO backbone.
| Layer | Module | SRTSOD-YOLO-n | SRTSOD-YOLO-s | SRTSOD-YOLO-m | SRTSOD-YOLO-l |
|---|---|---|---|---|---|
| 0 | CBS | 8 | 16 | 32 | 32 |
| 1 | CBS | 16 | 32 | 64 | 64 |
| 2 | MFCAM | 16 | 32 | 64 | 64 |
| 3 | CBS | 32 | 64 | 128 | 128 |
| 4 | MFCAM | 32 | 64 | 128 | 128 |
| 5 | CBS | 64 | 128 | 256 | 256 |
| 6 | MFCAM | 64 | 128 | 256 | 256 |
| 7 | CBS | 128 | 256 | 512 | 512 |
| 8 | MFCAM | 128 | 256 | 512 | 512 |
| 9 | SPPF | 128 | 256 | 512 | 512 |
| 10 | C2PSA | 128 | 256 | 512 | 512 |
Table 3.
The parameter settings for SRTSOD-YOLO neck.
| Layer | Module | SRTSOD-YOLO-n | SRTSOD-YOLO-s | SRTSOD-YOLO-m | SRTSOD-YOLO-l |
|---|---|---|---|---|---|
| 11 | CBS | 16 | 32 | 64 | 64 |
| 12 | CBS | 16 | 32 | 64 | 64 |
| 13 | CBS | 16 | 16 | 32 | 32 |
| 14 | Upsample | 128 | 256 | 512 | 512 |
| 15 | Concat | 208 | 416 | 832 | 832 |
| 16 | GAC | 208 | 416 | 832 | 832 |
| 17 | C3K2 | 32/n=1 | 64/n=1 | 128/n=2 | 128/n=4 |
| 18 | Upsample | 32 | 64 | 128 | 128 |
| 19 | Concat | 80 | 160 | 320 | 320 |
| 20 | GAC | 80 | 160 | 320 | 320 |
| 21 | C3K2 | 32/n=1 | 64/n=1 | 128/n=2 | 128/n=4 |
| 22 | Upsample | 32 | 64 | 128 | 128 |
| 23 | Concat | 64 | 112 | 224 | 224 |
| 24 | GAC | 64 | 112 | 224 | 224 |
| 25 | C3K2 | 16/n=1 | 32/n=1 | 64/n=2 | 64/n=4 |
| 26 | CBS | 16 | 32 | 64 | 64 |
| 27 | Concat | 48 | 96 | 192 | 192 |
| 28 | C3K2 | 32/n=1 | 64/n=1 | 128/n=2 | 128/n=4 |
| 29 | CBS | 32 | 64 | 128 | 128 |
| 30 | Concat | 64 | 128 | 256 | 256 |
| 31 | C3K2 | 64/n=1 | 128/n=1 | 256/n=2 | 256/n=4 |
Table 4.
Comparison of individual versions of SRTSOD-YOLO and YOLO11 on VisDrone2019 dataset.
| Network | mAP50 (%) | mAP50-95 (%) | Params (M) | GFLOPs | FPS |
|---|---|---|---|---|---|
| YOLO11n | 33.2 | 20.6 | 2.6 | 6.5 | 164 |
| SRTSOD-YOLO-n | 36.3 | 21.8 | 3.5 | 7.4 | 147 |
| YOLO11s | 40.6 | 24.5 | 9.4 | 21.6 | 153 |
| SRTSOD-YOLO-s | 44.4 | 27.0 | 11.1 | 24.2 | 138 |
| YOLO11m | 43.5 | 26.3 | 20.1 | 68.2 | 135 |
| SRTSOD-YOLO-m | 49.6 | 30.4 | 22.2 | 72.7 | 124 |
| YOLO11l | 45.9 | 28.2 | 25.3 | 87.3 | 111 |
| SRTSOD-YOLO-l | 53.8 | 33.8 | 27.6 | 94.7 | 99 |
Table 5.
Comparison of error types between SRTSOD-YOLO and YOLO11 on the VisDrone2019 dataset.
| Model | Ecls | Eloc | Eboth | Edup | Ebkg | Emissed |
|---|---|---|---|---|---|---|
| YOLO11s | 15.30 | 4.32 | 0.52 | 0.18 | 2.35 | 14.46 |
| SRTSOD-YOLO-s | 15.06 | 4.11 | 0.50 | 0.15 | 2.26 | 14.27 |
| YOLO11l | 14.59 | 4.19 | 0.53 | 0.12 | 2.55 | 15.04 |
| SRTSOD-YOLO-l | 14.09 | 3.91 | 0.49 | 0.03 | 2.13 | 13.96 |
Table 6.
Comparison of individual versions of SRTSOD-YOLO and YOLO11 on UAVDT dataset.
| Network | mAP50 (%) | mAP50-95 (%) |
|---|---|---|
| YOLO11n | 32.3 | 20.2 |
| SRTSOD-YOLO-n | 33.5 | 20.8 |
| YOLO11s | 34.6 | 21.4 |
| SRTSOD-YOLO-s | 38.4 | 23.6 |
| YOLO11m | 39.8 | 24.2 |
| SRTSOD-YOLO-m | 44.7 | 27.3 |
| YOLO11l | 43.9 | 26.5 |
| SRTSOD-YOLO-l | 47.2 | 28.7 |
Table 7.
Results of ablation experiments in VisDrone2019.
| Network | A | B | C | D | E | mAP50(%) | mAP50-95 (%) | Params (M) | GFLOPs |
|---|---|---|---|---|---|---|---|---|---|
| YOLO11n | 33.2 | 20.6 | 2.6 | 6.5 | |||||
| SRTSOD-YOLO-n | √ | 33.9 | 20.7 | 2.7 | 6.7 | ||||
| √ | √ | 35.1 | 21.2 | 2.9 | 6.9 | ||||
| √ | √ | √ | 35.6 | 21.5 | 3.3 | 7.3 | |||
| √ | √ | √ | √ | 36.0 | 21.7 | 3.5 | 7.4 | ||
| √ | √ | √ | √ | √ | 36.3 | 21.8 | 3.5 | 7.4 |
Table 8.
Comparison of SRTSOD-YOLO-s and YOLO series lightweight models.
| Network | mAP50 (%) | mAP50-95 (%) | Params (M) | GFLOPs |
|---|---|---|---|---|
| YOLOv3-tiny | 23.4 | 13.0 | 12.1 | 18.9 |
| YOLOv5s | 37.7 | 22.3 | 9.1 | 23.8 |
| YOLOv6s | 36.3 | 21.4 | 16.3 | 44.0 |
| YOLOv7-tiny | 32.9 | 16.8 | 6.0 | 13.3 |
| YOLOv8s | 39.0 | 23.3 | 11.6 | 28.7 |
| YOLOv10s | 38.6 | 23.1 | 7.4 | 21.4 |
| SRTSOD-YOLO-s | 44.4 | 27.0 | 11.1 | 24.2 |
Table 9.
Comparison of large-scale models of SRTSOD-YOLO-l and YOLO series.
| Network | mAP50 (%) | mAP50-95 (%) | Params (M) | GFLOPs |
|---|---|---|---|---|
| YOLOv3 | 44.0 | 26.9 | 103.7 | 282.3 |
| YOLOv5l | 43.0 | 26.2 | 53.2 | 134.7 |
| YOLOv6l | 40.7 | 24.8 | 110.9 | 391.2 |
| YOLOv7 | 46.2 | 25.9 | 37.2 | 105.3 |
| YOLOv8l | 43.8 | 26.9 | 43.6 | 164.9 |
| YOLOv9e | 46.6 | 28.9 | 57.4 | 189.2 |
| YOLOv10l | 43.5 | 26.8 | 24.9 | 120.0 |
| SRTSOD-YOLO-l | 53.8 | 33.8 | 27.6 | 94.7 |
Table 10.
Comparison of SRTSOD-YOLO series models and other object detection models on Visdrone2019 dataset.
Table 10.
Comparison of SRTSOD-YOLO series models and other object detection models on Visdrone2019 dataset.
| Network | mAP50 (%) | mAP50-95 (%) | Params (M) | GFLOPs |
|---|---|---|---|---|
| LE-YOLO [73] | 39.3 | 22.7 | 2.1 | 13.1 |
| YOLOv5-pp[74] | 41.7 | - | 10.5 | - |
| Modified YOLOv8[75] | 42.2 | - | 9.66 | - |
| PVswin-YOLOv8[76] | 43.3 | - | 21.6 | - |
| UAV-YOLOv8[77] | 47.0 | 29.2 | 10.3 | - |
| Drone-YOLO[78] | 51.3 | 31.9 | 76.2 | - |
| Aams-yolo[79] | 47.2 | 29.1 | 59.2 | 171.7 |
| SFFEF-YOLO[80] | 50.1 | 31.0 | - | - |
| YOLO-LE[81] | 39.9 | 22.5 | 4.0 | 8.5 |
| LPS-YOLO(large)[82] | 53.2 | 34.3 | 44.1 | - |
| LSOD-YOLO[83] | 37.0 | - | 3.8 | 33.9 |
| BFDet[84] | 51.4 | 29.5 | 5.6 | 25.6 |
| Faster RCNN | 37.2 | 21.9 | 41.2 | 292.8 |
| Cascade RCNN | 39.1 | 24.3 | 68.9 | 320.7 |
| RetinaNet | 19.1 | 10.6 | 35.7 | 299.5 |
| CenterNet | 33.7 | 18.8 | 70.8 | 137.2 |
| MFFSODNet[85] | 45.5 | - | 4.5 | - |
| SRTSOD-YOLO-n | 36.3 | 21.8 | 3.5 | 7.4 |
| SRTSOD-YOLO-s | 44.4 | 27.0 | 11.1 | 24.2 |
| SRTSOD-YOLO-m | 49.6 | 30.4 | 22.2 | 72.7 |
| SRTSOD-YOLO-l | 53.8 | 33.8 | 27.6 | 94.7 |
Table 11.
Comparison of SRTSOD-YOLO series models and other object detection models on UAVDT dataset.
Table 11.
Comparison of SRTSOD-YOLO series models and other object detection models on UAVDT dataset.
| Network | mAP50 (%) | mAP50-95 (%) | Params (M) | GFLOPs |
|---|---|---|---|---|
| Aams-yolo [79] | 43.1 | 29.9 | 59.2 | 171.7 |
| SFFEF-YOLO [80] | 44.1 | 29.1 | - | - |
| ST-YOLO [86] | 33.4 | - | 9.0 | 20.1 |
| LSOD-YOLO [83] | 37.1 | 22.1 | - | - |
| BFDet [84] | 46.0 | 26.3 | - | - |
| Faster RCNN | 36.5 | 21.4 | 41.1 | 292.3 |
| Cascade RCNN | 38.7 | 23.9 | 68.8 | 320.5 |
| RetinaNet | 18.8 | 10.4 | 35.7 | 299.5 |
| CenterNet | 32.9 | 18.2 | 70.8 | 137.2 |
| YOLOv7 | 41.9 | 25.4 | 36.5 | 105.3 |
| SRTSOD-YOLO-n | 33.5 | 20.8 | 3.5 | 7.4 |
| SRTSOD-YOLO-s | 38.4 | 23.6 | 11.1 | 24.2 |
| SRTSOD-YOLO-m | 44.7 | 27.3 | 22.2 | 72.7 |
| SRTSOD-YOLO-l | 47.2 | 28.7 | 27.6 | 94.7 |
Disclaimer/Publisher’s Note: The statements, opinions and data contained in all publications are solely those of the individual author(s) and contributor(s) and not of MDPI and/or the editor(s). MDPI and/or the editor(s) disclaim responsibility for any injury to people or property resulting from any ideas, methods, instructions or products referred to in the content. |
© 2025 by the authors. Licensee MDPI, Basel, Switzerland. This article is an open access article distributed under the terms and conditions of the Creative Commons Attribution (CC BY) license (http://creativecommons.org/licenses/by/4.0/).
Copyright: This open access article is published under a Creative Commons CC BY 4.0 license, which permit the free download, distribution, and reuse, provided that the author and preprint are cited in any reuse.


