
Submitted:
30 July 2025
Posted:
30 July 2025
You are already at the latest version
Abstract
To advance a hydrogen-based energy society, the development of efficient hydrogen storage materials is essential. In particular, such materials are expected to be lightweight and chemically stable. Moreover, they must allow for easy storage and release of hydrogen. In this study, we theoretically designed hydrogen storage and release devices based on graphene (GR)—a lightweight and chemically stable material—using a direct ab initio molecular dynamics (AIMD) approach. The target reaction in this study is the hydrogen abstraction from hydrogenated graphene, GR-H, by hydrogen atom, resulting in molecular hydrogen formation (reaction 1):
GR–H + H → GR + H2 (1)
Hydrogen atoms (H) can be readily generated through the discharge of H2 gas. The calculated activation energies are -0.3 kcal/mol for reaction 1. The direct AIMD calculations showed that the reaction (1) proceeds without activation barrier, and H2 is easily formed by the collision of H-atom to GR-H surface. For comparison, the addition of hydrogen atoms to graphene (reaction 2) were calculated:
GR + H → GR–H (2)
The activation energies were calculated to be 5-7 kcal/mol for reaction 2. These energetic profiles indicate that both hydrogen storage and release proceed with low activation energies. On the basis of these calculations, H2-storage/release device was designed.
Keywords:
Hydrogen storage
; Ab initio dynamics
; Hydrogen release
; Graphene
; Translational energy
; Collision energy
; Hydrogen Addition
; Hydrogen abstraction
1. Introduction
Carbon materials are among the most promising candidates for hydrogen (H2) storage due to their lightweight nature and chemical stability.[1,2,3] For instance, the interactions between carbon nanotubes (CNTs) and H2,[4,5,6] as well as between graphene (GR) and H2, have been extensively studied.[7,8,9] However, the binding energies of H2 to these carbon materials are typically less than 1 kcal/mol,[10,11] which results in low hydrogen storage efficiency for pristine carbon materials.
To address this limitation, alkali metals such as lithium atoms or ions have been doped onto carbon surfaces. For example, lithium-doped graphene (GR-Li) has been shown to increase the adsorption energy of H2 to approximately 5–6 kcal/mol.[12,13] Moreover, it has been reported that up to 10 H2 molecules per Li atom can be efficiently bound to GR-Li. Other metals, such as Na, K, Mg, and Al, have also been shown to have hydrogen storage capacity.[14,15,16,17]
In the present study, we theoretically explore the potential of hydrogen storage via chemical bonding between GR nanoflakes and hydrogen atoms. One known approach for chemical hydrogen storage is the hydrogenation of aromatic hydrocarbons (organic chemical hydride method), which allows for both the storage and transport of hydrogen in a chemically bound form. A representative example is the hydrogenation of benzene to cyclohexane:[18,19,20,21]
benzene + 3 H2 → C6H12 (cyclohexane)
Cyclohexane is produced by the addition of hydrogen atoms to the π-bonds of the benzene ring. This product can be transported, and hydrogen can later be released via catalytic dehydrogenation. Thus, both metal doping and chemical hydrogenation are considered viable strategies for H2 storage.
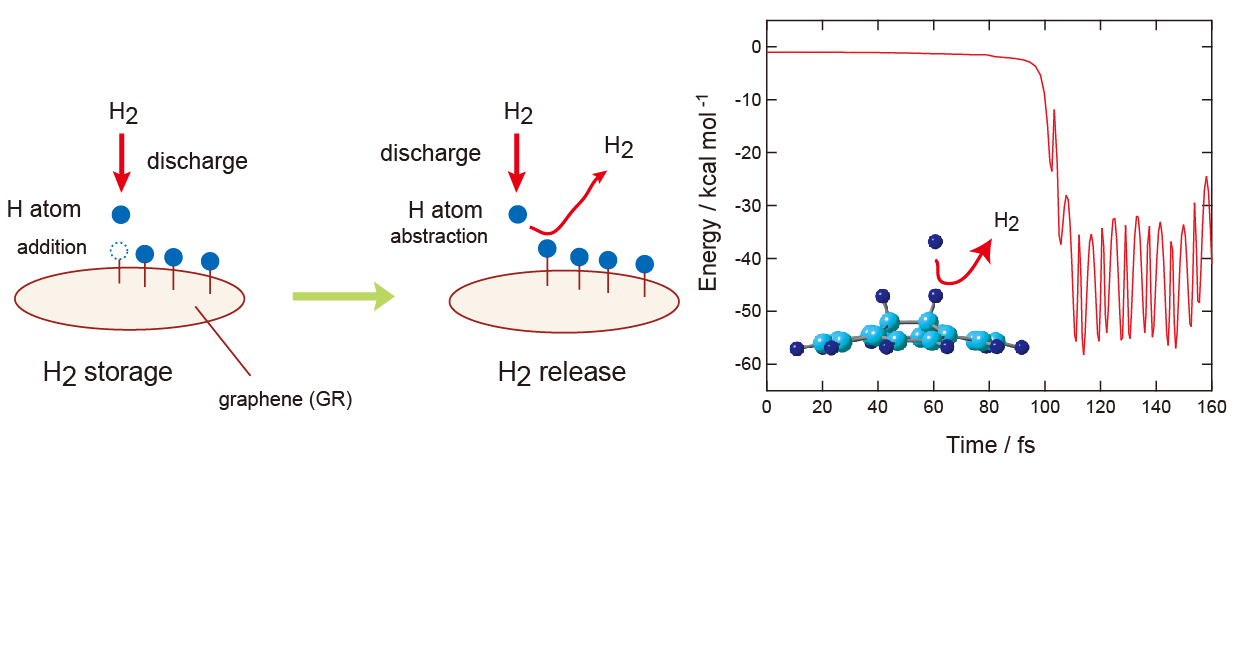
In the present study, we perform a molecular-level design of a GR-based hydrogen storage system using direct ab initio molecular dynamics (AIMD) simulations. Figure 1 shows a schematic illustration of the reaction model investigated in this study. The overall process can be described as follows:
H2 + hν (discharge) → H + H
Molecular hydrogen (H2) is readily dissociated into atomic hydrogen via electrical discharge. The resulting hydrogen atoms are then introduced to the graphene surface, where they react with carbon atoms to form C–H bonds on GR surface:
GR + H → GR–H (hydrogen atom addition)
GR–H + H → H–(GR)–H (H2 storage)
GR–H + H → H–(GR)–H (H2 storage)
Through this process, H2 is stored on GR surface in the form of two hydrogen atoms (H2 storage). The release of hydrogen can occur via the following reactions:
H–GR–H + H → GR–H + H2 (H2 release)
GR–H + H → GR + H2
GR–H + H → GR + H2
The H-atom, generated by discharge, attacks to the C-H hydrogen of H-(GR)-H, and then H2 is formed (H2 molecule). The primary reaction of interest in this study is the hydrogen release process (H2 release):
H–(GR)–H + H → GR–H + H2
For comparison, we also investigate the energetics of the hydrogen addition reaction:
GR + H → GR–H
Both the energetics and the reaction times for hydrogen storage and release are evaluated using direct AIMD simulations.
For Reaction II,[22,23] we investigated previously the activation and reaction energies by means of DFT methods. Also, direct H2 addition reaction to GR, H2 + GR → H-(GR)-H (Reaction III), were investigated.[24] The activation energies of Reactions II and III were calculated to be 5-7 and 80 kcal/mol, respectively.[22,23,24] These results indicated that the direct H2 addition to GR (Reaction III) is impossible under the normal condition. In contrast, Reaction II is possible in normal condition if H-atom is generated.
2. Computational Details
2.1. Ab Initio Calculations
Four types of graphene nanoflake composed of 7, 14, and 19 benzene rings were used in this study, and are referred to as “GR04, GR07, GR14, and GR19” hereafter, respectively. Figure 2A shows the structures of GRs used in this calculations. DFT calculations were performed using the CAM-B3LYP Coulomb-attenuating exchange-correlation energy functional[25] with the 6-31G(d) and 6-311G(d,p) basis sets.[26] The structure of GRs ware first optimized, after which one or two hydrogen atom was placed in the central region of the GR. The mono- and di-hydrogenated GRs were expressed as GR-H and H-(GR)-H, respectively. The structures of GR-H and H-(GR)-H were then fully optimized. The binding energy of the H atom to GR is defined as follows:
where E(X) is the total energy of X. The H atom binds exothermally to the GR when Ebind(H) is positive.
Atomic charges were calculated using the natural bond population analysis (NPA) algorithm.[27] All calculations were performed using the Gaussian 09 software package.[28] We previously investigated interactions between graphene and various molecules using DFT at the same level of theory.[13,17,29,30] A similar technique was used for the H-(GR)-H system in this study.
2.2. Direct AIMD Calculations
Figure 2B shows the initial configuration of the collision reaction system. For the direct AIMD calculations, the H-(GR)-H cluster were optimized at the CAM-B3LYP/6-31G(d) level. Subsequently, H atom was positioned above the cluster at a distance of r1=4.0–4.5 Å; the trajectory began from this position. The collision energies of H-atom (Ecoll) were set to 1-15 kcal/mol at time zero. The near collinear collision was assumed: impact parameter (b) was b=0-0.5 Å. The excess energy, momentum vector, and rotational temperature of the reaction system were assumed to be zero (at 0 fs). The equations of motion for N atoms in the reaction system are given by
where j = 1–3N, H is the classical Hamiltonian, Qj is the Cartesian coordinate of the j-th mode, U is the potential energy, and Pj is the conjugated momentum; these equations were numerically solved (NVE ensemble). The velocity Verlet algorithm, with a time step of 0.10–0.25 fs, was used to solve the equations of motion for the system. The maximum simulation time was 2.0 ps. The total energy drift in all trajectory calculations was <0.01 kcal/mol. The numbers of trajectory runs were 22 (Ecoll = 1.0), and 5 (Ecoll = 2.0-15), respectively. The effects of the functional on the reaction mechanism were investigated using the APFD functional and compared with those of the CAM-B3LYP functional. Direct AIMD calculations were performed using custom-made AIMD codes.[31,32,33,34]
3. Results
- Structures at stationary points for the hydrogen abstraction reaction.
Figure 3 shows the optimized structures along the reaction coordinate for the reaction:
where H-(GR)-H means hydrogenated GR (two H-atoms are added to the surface of GR).
H-(GR)-H + H → H-(GR) + H2,
At reactant state (RC), the C-H bond length was calculated to be r2=1.099 Å. After the injection of hydrogen (H) atom to H-(GR)-H, van der Waals (vdW) complex was first formed on the surface in the initial state of the reaction (denoted to vdW-1). The H-atom was located between two surface C-H sites and made the bridge structure composed of C-H--H--H-C (r1=2.237 and r3=2.550 Å). The C-H bond was slightly elongated by the interaction with the H-atom (the C-H bond length was changed from r2= 1.099 to 1.101 Å).
Next, the reaction reached to transition state (TS) via vdW-1. The H-atom was located at r1=1.772, and r3=2.930 Å at TS. The C-H bond of the surface C-H site was elongated at TS (r2=1.111 Å). The H-H bond (r1=1.772 Å) was significantly longer than that of H2 molecule in gas phase (r(H-H)= 0.746 Å). After TS, H2 molecule was formed by the H-atom abstraction.
In the final state of the reaction, vdW complex was formed (vdW-2), where H2 was weakly bound to the radical site of the surface. H2 was located at r2=3.301 Å from the surface. The H-H bond of H2 was r1=0.747 Å, which is a normal bond length of H2 molecule. After the H2 reduction from H-(GR)-H, the product (PD) was remained as H-(GR).
- B.
- Energy diagram for the hydrogen abstraction reaction
The energy diagram for the reaction is given in Figure 4. The energy level of RC corresponds to the total energy of H-GR-H + H. The initial vdW state (vdW-1) was -0.4 kcal/mol lower in energy than that of RC (zero level). The energy of TS was -0.3 kcal/mol, indicating that the hydrogen abstraction reaction can proceed without activation energy.
After TS of the H-abstraction, the energy of reaction system decreased largely to -53.1 kcal/mol because the H-H bond was newly formed by the formation of H2. The energy level of vdW state at the PD state was -53.1 kcal/mol (vdW-2). The energy of product state (PD) (-52.9 kcal/mol) was slightly higher than that of vdW-2, where H2 was dissociated from the surface. The reaction can be expressed as:
RC[H(radical) + H-(GR19)-H] → vdW-1 → TS → vdW2 → PD[(GR19)-H + H2]. This reaction spontaneously occurs without activation barrier.
- C.
- Intrinsic reaction coordinate
The intrinsic reaction coordinate (IRC) for the hydrogen abstraction reaction from H-(GR)-H was calculated at the CAM-B3LYP/6-31G(d) level. The result is given in Figure S1 (in supporting information: SI). The point at s=0.0 in (amu)1/2Bohr corresponds to TS structure in the reaction, and the points at s= -0.5 and s=3.0 indicate the reactant and product regions, respectively. The shape of IRC suggested that the energy decreases drastically after the TS point because the H2 molecule with a strong H-H bond is formed. The structure at s= -0.5 was close to that of vdW-1. After TS, the energy decreased largely to -23.0 kcal/mol (s=1.2) and -55.0 kcal/mol (s =3.2). At s=3.2, H2 molecule dissociated from H-GR as H2 molecule. This IRC calculation indicated that the TS structure connected between RC and PD states for the H-abstraction reaction.
- D.
- Reaction dynamics
The direct AIMD calculations were carried out at the CAM/6-31G(d) level of theory. GR07 was used as graphene nanoflake. The collision energy was Ecoll=1.0 kcal/mol. The snapshots of hydrogen abstraction reaction on GR are illustrated in Figure 5, where the reaction is expressed as H + H-(GR)-H → H-(GR) + H2.
In the initial structure at time = 0.0 fs, the H-atom was located at r1=4.640 Å. The C-H distance of surface as r2=1.100 Å. At time = 80 fs, the H-atom was located at r1=2.187 Å, and the C-H bond was r2=1.102 Å. The H-atom was more closed to the C-H (r1=1.521 and r2=1.139 Å) at 95 fs. At 100 fs, the structure was close to that of TS (r1=1.131 and r2=1.246 Å), indicating that the C-H bond was largely elongated by the H-abstraction (1.246 Å). At 103 fs, H2 molecule was completely formed: H-H bond length was r1=0.709 Å and H2 was located at r2=1.463 Å from the surface. The distances of H2 from the surface were changed to 1.571 Å (106 fs), 2.474 Å (114 fs), 4.275 Å (130 fs), suggesting that H2 leaved rapidly from the surface. Thus, the H-abstraction and H2 formation reactions were completed at 130 fs.
Time evolution of potential energy (PE) and interatomic distances (r1 and r2) are given in Figure 6.
At time zero, the H atom started from r1=4.640 Å above the surface of H-(GR)-H. The H atom gradually approached to C-H site of H-(GR)-H: distances (r1, r2)= (3.460, 1.100) at 40 fs, (2.827, 1.101) at 60 fs, and (2.187, 1.102) at 80 fs. PE was slightly decreased: -0.5 kcal/mol at 80 fs. PE drastically changed around time= 100 fs, where the hydrogen abstraction rapidly occurred a time 95-105 fs. The H-H bond was newly formed after the abstraction, and H2 molecule was formed at this time. After the H2 formation, H2 was rapidly dissociated from the surface: the distances of H2 from the surface were 3.2 Å (120 fs) and 5.0 Å (140 fs). PE vibrated largely in the ranges (-40) - (-55) kcal/mol after the H2 dissociation.
A total of 22 trajectories were run at collision energy of Ecoll =1.0 kcal/mol. The translational energies of product H2 (Etrans) formed by the H-abstraction reaction (H-(GR)-H + H → H-(GR) + H2) are given in Figure 7. Etrans’s were distributed in the ranges 12.0-22.0 kcal/mol with the peak of Etrans =15.0 kcal/mol. The average of Etrans was 14.9 kcal/mol, which is 26 % of total available energy. The remained energies were transferred into the vibrational modes of H2-streetching mode and deformation modes of GR.
The time evolution of PE for selected five trajectories are given in Figure S2. Also, the results of DFT-APFD functional are given in Figure S3 for comparison. The similar results were obtained in both methods.
- E.
- Hydrogen addition reaction to GR surface
In previous sections, the hydrogen abstraction reaction was calculated and discussed. In this section, the hydrogen addition to the GR surface was re-examined. The reaction is expressed as GR + H → GR-H. In previous papers, we calculated the activation energies for the H-atom addition reaction to the GR surface using CAM-B3LYP functional. In this section, the energies were re-calculated using the APFD functional. The energy diagram and structure of TS for the H addition to the GR surface are given in Figure 8.
At TS, the H atom was located at 1.736 Å from the surface. In case of GR19, the activation energy was calculated to be Ea= 6.2 kcal/mol (CAM-B3LYP) and 5.3 kcal/mol (APFD). The calculated activation energies for several sized GRs are given in Table 1. The activation energies were 6.8 kcal/mol (GR04), 6.6 (GR07), and 5.6 (GR14), indicating that the activation energies were very low (Ea= 5-7 kcal/mol). This low activation barrier is due to the fact that the binding energies of H addition to the GR surface were large in the ranges 14.7-22.4 kcal/mol, as shown in Table 1. The similar results were obtained by the APFD functional. These results indicated that both H-addition and abstraction reactions proceed under low activation energy on GR.
4. Discussion and Conclusions
- Theoretical design of H2 storage/release device
On the basis of the present calculations, the H2 storage and release device is designed in this section. A schematic illustration H2 storage/release device is given in Figure 9.
In case of H2 storage process, first, the H2 gas is introduces into the reaction tube and H2 is discharged. The hydrogen atom (H-atom) is easily generated: H2 + discharge → H + H. The H-atom reacts with carbon atom of GR surface and GR-H (hydrogenated graphene) is formed:
GR + H → GR–H
GR-H + H → H-(GR)–H
This reaction can proceed with a low activation energy (Ea=5-7 kcal/mol). The hydrogen molecule (H2) is chemically captures as H-atoms on GR surface. The present calculations indicated that H2 storage process proceeds with low activation energy of 5-7 kcal/mol after the discharge.
In case of H2 release process, H-tom is generated again by discharge of H2. The H-atom reacts with H-atom on the GR surface and H2 is easily formed by the H abstraction reaction:
H + H-(GR)-H → H2 + H-(GR)
This reaction can proceed also without activation energy (Ea= -0.3 kcal/mol: negative activation energy). The represent study thus designed the H2 storage/release device composed of graphene.
- B.
- Conclusion
The development of hydrogen storage and release materials is one of the key themes in the development of a hydrogen society. In the present study, we theoretically designed hydrogen storage and release devices based on graphene (GR)—a lightweight and chemically stable material—using a direct AIMD approach. The calculations showed that the hydrogen addition reaction (H2 storage):
proceeds with low activation energy (5-7 kcal/mol). Also, the hydrogen abstraction from hydrogenated graphene (H2 release):
occurs without activation energy. The direct AIMD calculations indicate that H-atom abstraction proceeds without the reaction barrier. The model designed in this study could be a new hydrogen storage/release device.
H + GR → (GR)-H
H + H-(GR)-H → H2 + H-(GR)
Supplementary Materials
The following supporting information can be downloaded at the website of this paper posted on Preprints.org. † Electronic suppurting information (EI)
available. See DOI: ESI is available on the website:
Conflicts of Interest
The authors declare no conflicts of interest.
References
- Firlej, L.; Kuchta, B.; Walczak, K.; Journet, C. Hydrogen Storage in Pure and Boron-Substituted Nanoporous Carbons—Numerical and Experimental Perspective. Nanomaterials 2021, 11, 2173. [Google Scholar] [CrossRef]
- Firlej, L.; Kuchta, B.; Wexler, C.; Pfeifer, P. Boron substituted graphene: Energy landscape for hydrogen adsorption. Adsorption 2009, 15, 312–317. [Google Scholar] [CrossRef]
- Altuntepe, A.; Çelik, S.; Zan, R. Optimizing Hydrogen Storage and Fuel Cell Performance Using Carbon-Based Materials: Insights into Pressure and Surface Area Effects. Hydrogen 2025, 6, 22. [Google Scholar] [CrossRef]
- Ioannatos, G. E.; Verykios, X. E. H2 Storage on Single- and Multi-Walled Carbon Nanotubes. Int. J. Hydrogen Energy 2010, 35, 622–628. [Google Scholar] [CrossRef]
- Namitha, R; Radhika, D; Krishnamurthy, G. , Manufacturing and Processing of Carbon Nanotubes for H2 Storage, Phys. Chem. Sold state, 2021, 22, 209–216.
- Itas, Yahaya Saadu, Studies of H2 storage efficiency of metal-doped carbon nanotubes by optical adsorption spectra analysis, Diamond and related materials, 2023, 136, 109964. DOI:10.1016/j.diamond.2023. 1099.
- Chavhan, M.P.; Marzouki, M.; Jaouadi, M.; Ghodbane, O.; Zelenková, G.; Almasi, M.; Maříková, M.; Bezdicka, P.; Tolasz, J.; Murafa, N. Pore Engineering in Carbon Monoliths Through Soft Templating, In Situ Grown Graphene, and Post-Activation for CO2 Capture, H2 Storage, and Electrochemical Capacitor. Nanomaterials 2025, 15, 900. [Google Scholar] [CrossRef]
- Kostoglou, N.; Liao, C.-W.; Wang, C.-Y.; Kondo, J. N.; Tampaxis, C.; Steriotis, T.; Giannakopoulos, K.; Kontos, A. G.; Hinder, S.; Baker, M.; Bousser, E.; Matthews, A.; Rebholz, C.; Mitterer, C. Effect of Pt nanoparticle decoration on the H2 storage performance of plasma-derived nanoporous graphene. Carbon 2021, 171, 294–305. [Google Scholar] [CrossRef]
- Jain, V.; Kandasubramanian, B. , Functionalized Graphene Materials for Hydrogen Storage, J. Mater. Sci. 2020, 55, 1865–1903. [Google Scholar] [CrossRef]
- Ganji, M.D.; Hosseini-Khah, S.M.; Amini-Tabar, Z. Theoretical insight into hydrogen adsorption onto graphene: A first-principles B3LYP-D3 study. Phys. Chem. Chem. Phys. 2015, 17, 2504–2511. [Google Scholar] [CrossRef]
- Cabria, I.; López, M.J.; Alonso, J.A. Searching for DFT-based methods that include dispersion interactions to calculate the physisorption of H2 on benzene and graphene. J. Chem. Phys. 2017, 146, 214104. [Google Scholar] [CrossRef]
- Tachikawa, H.; Iyama, T. Mechanism of Hydrogen Storage in the Graphene Nanoflake–Lithium–H2 System. J. Phys. Chem. C 2019, 123, 8709. [Google Scholar] [CrossRef]
- Tachikawa, H.; Iyama, T. , Reactions of Graphene Nano-Flakes in Materials Chemistry and Astrophysics. PhysChem 2022, 2, 145–162. [Google Scholar] [CrossRef]
- Tachikawa, H.; Izumi, Y.; Iyama, T.; Azumi, K. ; Molecular Design of a Reversible Hydrogen Storage Device Composed of the Graphene Nanoflake–Magnesium–H2 System ACS Omega 2021, 6, 11, 7778–7785. [CrossRef]
- Tachikawa H, Yi H, Iyama T, Yamasaki S and Azumi K, Hydrogen storage mechanism in sodium-based graphene nanoflakes: A density functional theory study, Hydrogen, 2022, 3, 43–52.
- Tachikawa, H.; Izumi, Y.; Iyama, T.; Abe, S.; Watanabe, I. Aluminum-Doping Effects on the Electronic States of Graphene Nanoflake: Diffusion and Hydrogen Storage Mechanism. Nanomaterials, 2023, 13, 2046. [Google Scholar] [CrossRef] [PubMed]
- Tachikawa, H. Hydrogen Storages Based on Graphene Nano-Flakes: Density Functional Theory Approach. C 2022, 8, 36. [Google Scholar] [CrossRef]
- Struijk, J.; d’Angremond, M.; Regt, W. J. M. L.; Scholten, J. J. F. , Partial Liquid Phase Hydrogenation of Benzene to Cyclohexene over Ruthenium Catalysts in the Presence of an Aqueous Salt Solution: I. Preparation, Characterization of the Catalyst and Study of a Number of Process Variables. Appl. Catal., A 1992, 83, 263–295. [Google Scholar] [CrossRef]
- Foppa, L.; Dupont, J. , Benzene Partial Hydrogenation: Advances and Perspectives. Chem. Soc. Rev. 1886. [Google Scholar] [CrossRef]
- Chen, Z.; Sun, H.; Peng, Z.; Gao, J.; Li, B.; Liu, Z.; Liu, S. Selective Hydrogenation of Benzene: Progress of Understanding for the Ru-Based Catalytic System Design. Ind. Eng. Chem. Res. 1379. [Google Scholar] [CrossRef]
- Hu, Z-Y. ; He, Z-Z.; Chen, L.; Shang, C.; Liu, Z-P. In Situ Selective Site-Blocking Dictates Benzene Partial Hydrogenation to Cyclohexene on Zn-Promoted Ru-Based Catalysts, ACS Catal. 2025, 15, 9, 7015–7027. [CrossRef]
- Tachikawa, H. Hydrogen atom addition to the surface of graphene nanoflakes: A density functional theory study. Appl. Surf. Sci. 2017, 396, 1335. [Google Scholar] [CrossRef]
- Tachikawa, H. , Methyl radical addition to the surface of graphene nanoflakes: A density functional theory study, Surf. Sci. 2019, 679, 196–201. [Google Scholar] [CrossRef]
- Kawabata, H.; Tachikawa, H. , A density functional theory study on the carbon defect in a graphene nano-flake surface promoting hydrogenation Jpn. J. Appl. Phys. 2020, 59, 025508. [Google Scholar] [CrossRef]
- Yanai, T.; Tew, D.; Handy, N. A New Hybrid Exchange-Correlation Functional Using the Coulomb-Attenuating Method (CAM-B3LYP). Chem. Phys. Lett. 2004, 393, 51–57. [Google Scholar] [CrossRef]
- McLean, A. D.; Chandler, G. S. Contracted Gaussian Basis Sets for Molecular Calculations. I. Second Low Atoms, Z=11-18. J. Chem. Phys. 1980, 72, 5639–5648. [Google Scholar] [CrossRef]
- Foster, J. P.; Weinhold, F. Natural Hybrid Orbitals. J. Am. Chem. Soc. 1980, 102, 7211–7218. [Google Scholar] [CrossRef]
- Frisch, M. J.; Trucks, G. W.; Schlegel, H. B.; Scuseria, G. E.; Robb, M. A.; Cheeseman, J. R.; Scalmani, G.; Barone, V.; Mennucci, B.; Petersson, G. A. ; et. al., Gaussian 09, revision D.01; Gaussian, Inc.: Wallingford, CT, 2013. [Google Scholar]
- Tachikawa, H.; Kawabata, H.; Abe, S.; Watanabe, I. Mechanism of Carrier Formation in P3HT-C60-PCBM Solar Cells. Nanomaterials 2024, 14, 1400. [Google Scholar] [CrossRef]
- Tachikawa, H.; Lund, A. , Structures and electronic states of trimer radical cations of coronene: DFT-ESR simulation study, Phys. Chem. Chem. Phys., 2022, 24, 10318–10324. [Google Scholar] [CrossRef]
- Tachikawa, H. , Intracluster reaction dynamics of NO+(H2O)n, J. Chem. Phys. 2024, 161, 09430. [Google Scholar] [CrossRef] [PubMed]
- Tachikawa, H. , Mechanism of ionic dissociation of HCl in the smallest water clusters, Phys. Chem. Chem. Phys., 2024, 26, 3623–3631. [Google Scholar] [CrossRef] [PubMed]
- Tachikawa, H. ,C-C Bond Formation Reaction Catalyzed by a Lithium Atom: Benzene-to-Biphenyl Coupling, ACS Omega, 2023, 8, 10600-10606. [CrossRef]
- Tachikawa, H. , Reaction Dynamics of NO+ with Water Clusters J Phys Chem A, 2022,126, 119-124. [CrossRef]
Figure 1.
Schematic illustration of reaction model in the present study.
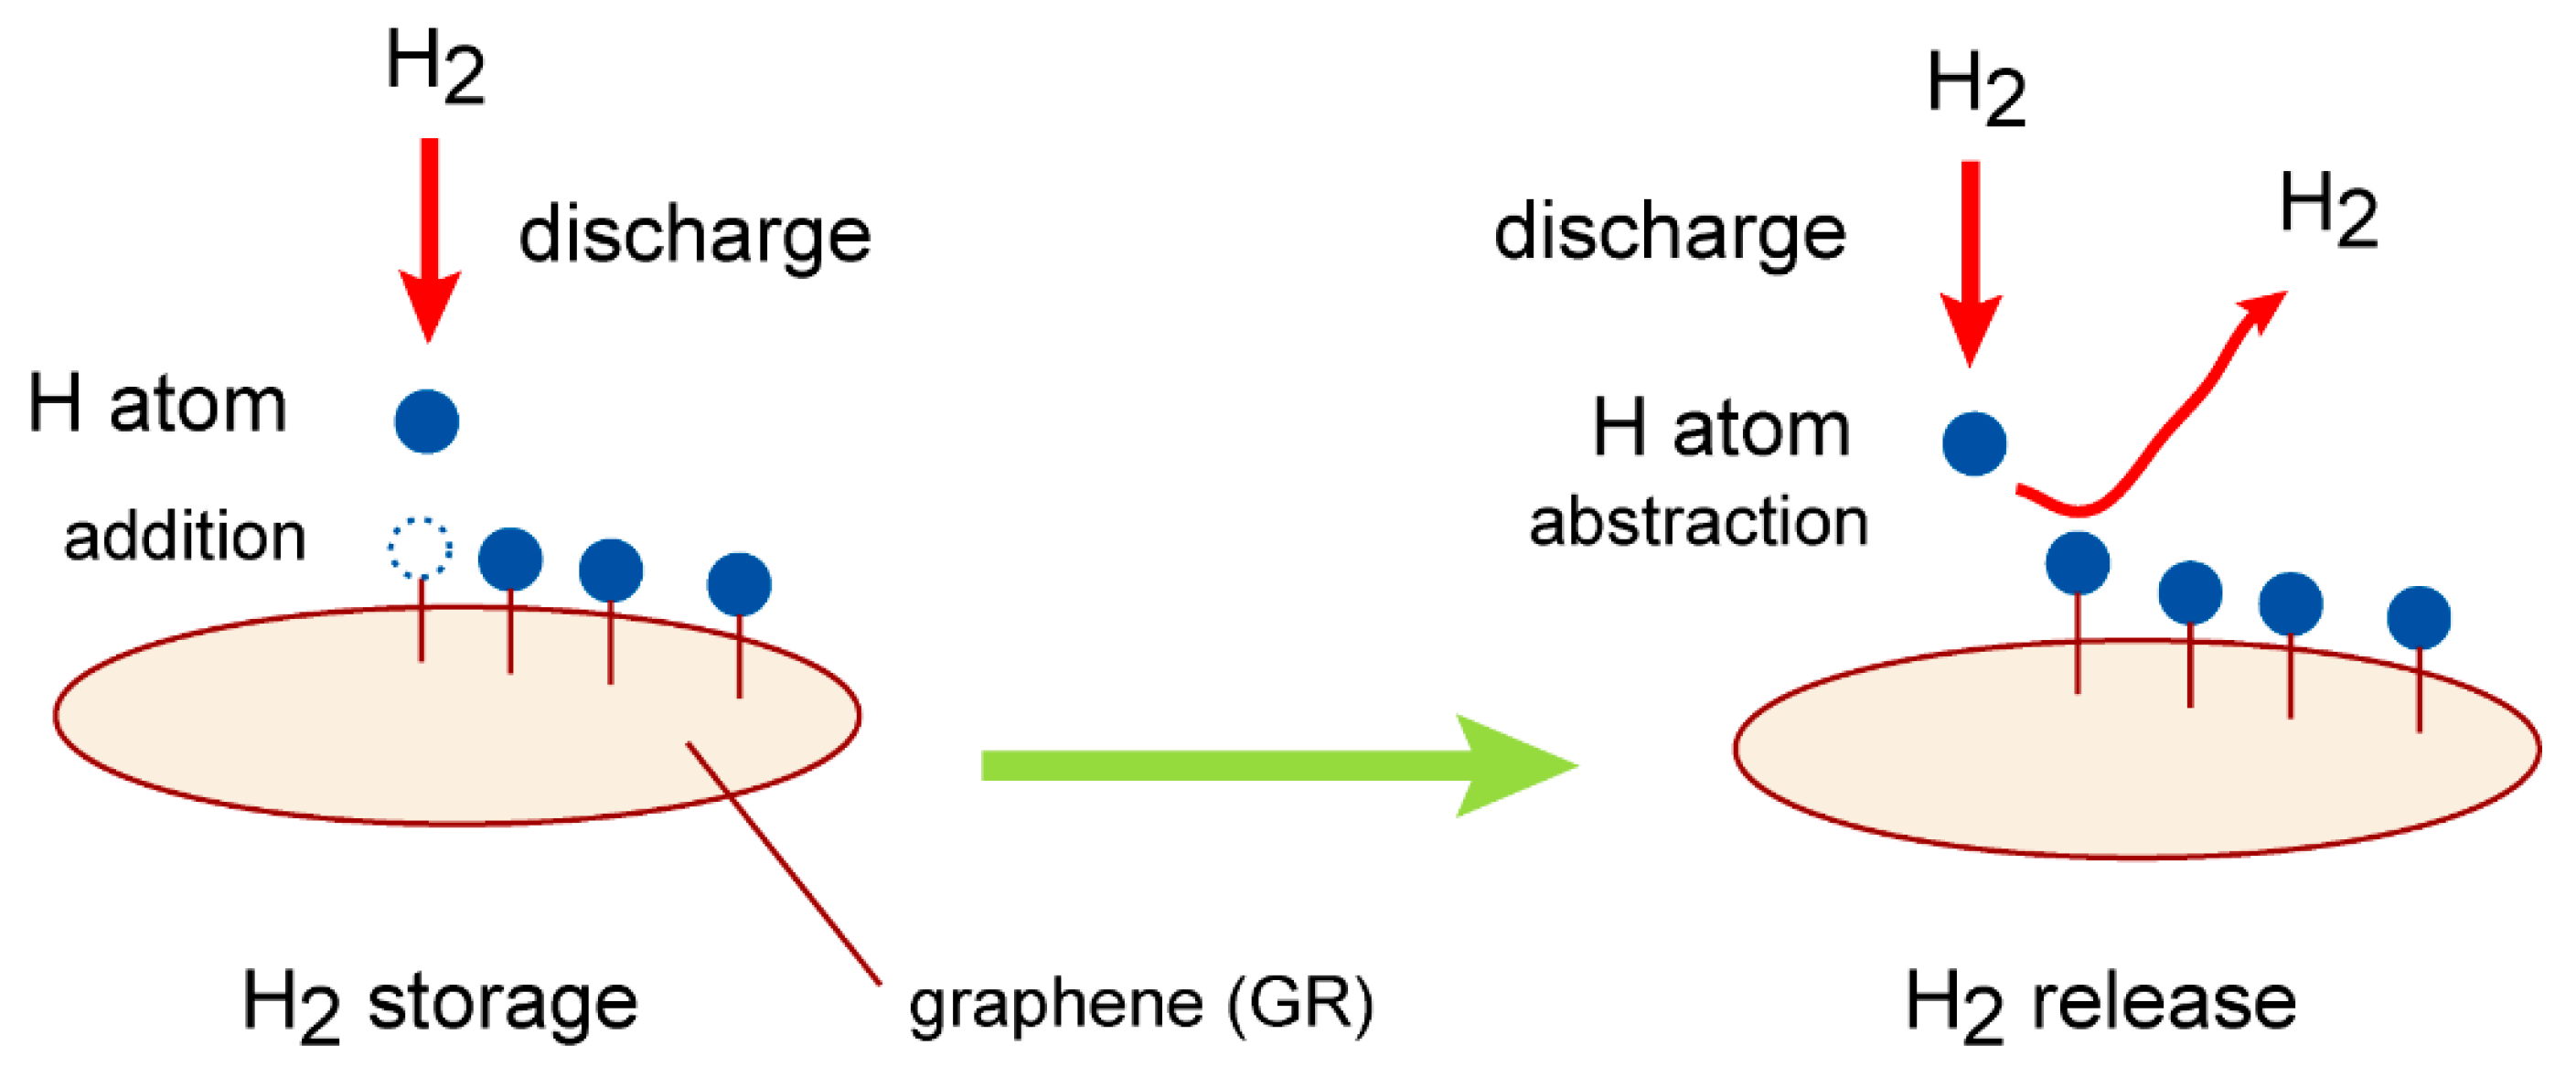
Figure 2.
(A) Graphene (GR) nanoflake used in the present study as a carbon material. GR04, GR07, GR14, and GR19 are composed of 4, 7, 14, and 19 benzene rings. The carbon atoms in the edge region are terminated by hydrogen atoms. (B) Initial geometry configuration in hydrogen abstraction reaction, H + H-(GR)-H → H2 + (GR)-H, at time zero in direct ab initio MD calculations. Notation “r1” means distance of collisional hydrogen atom from hydrogen atom on H-(GR)-H (hydrogenated GR).
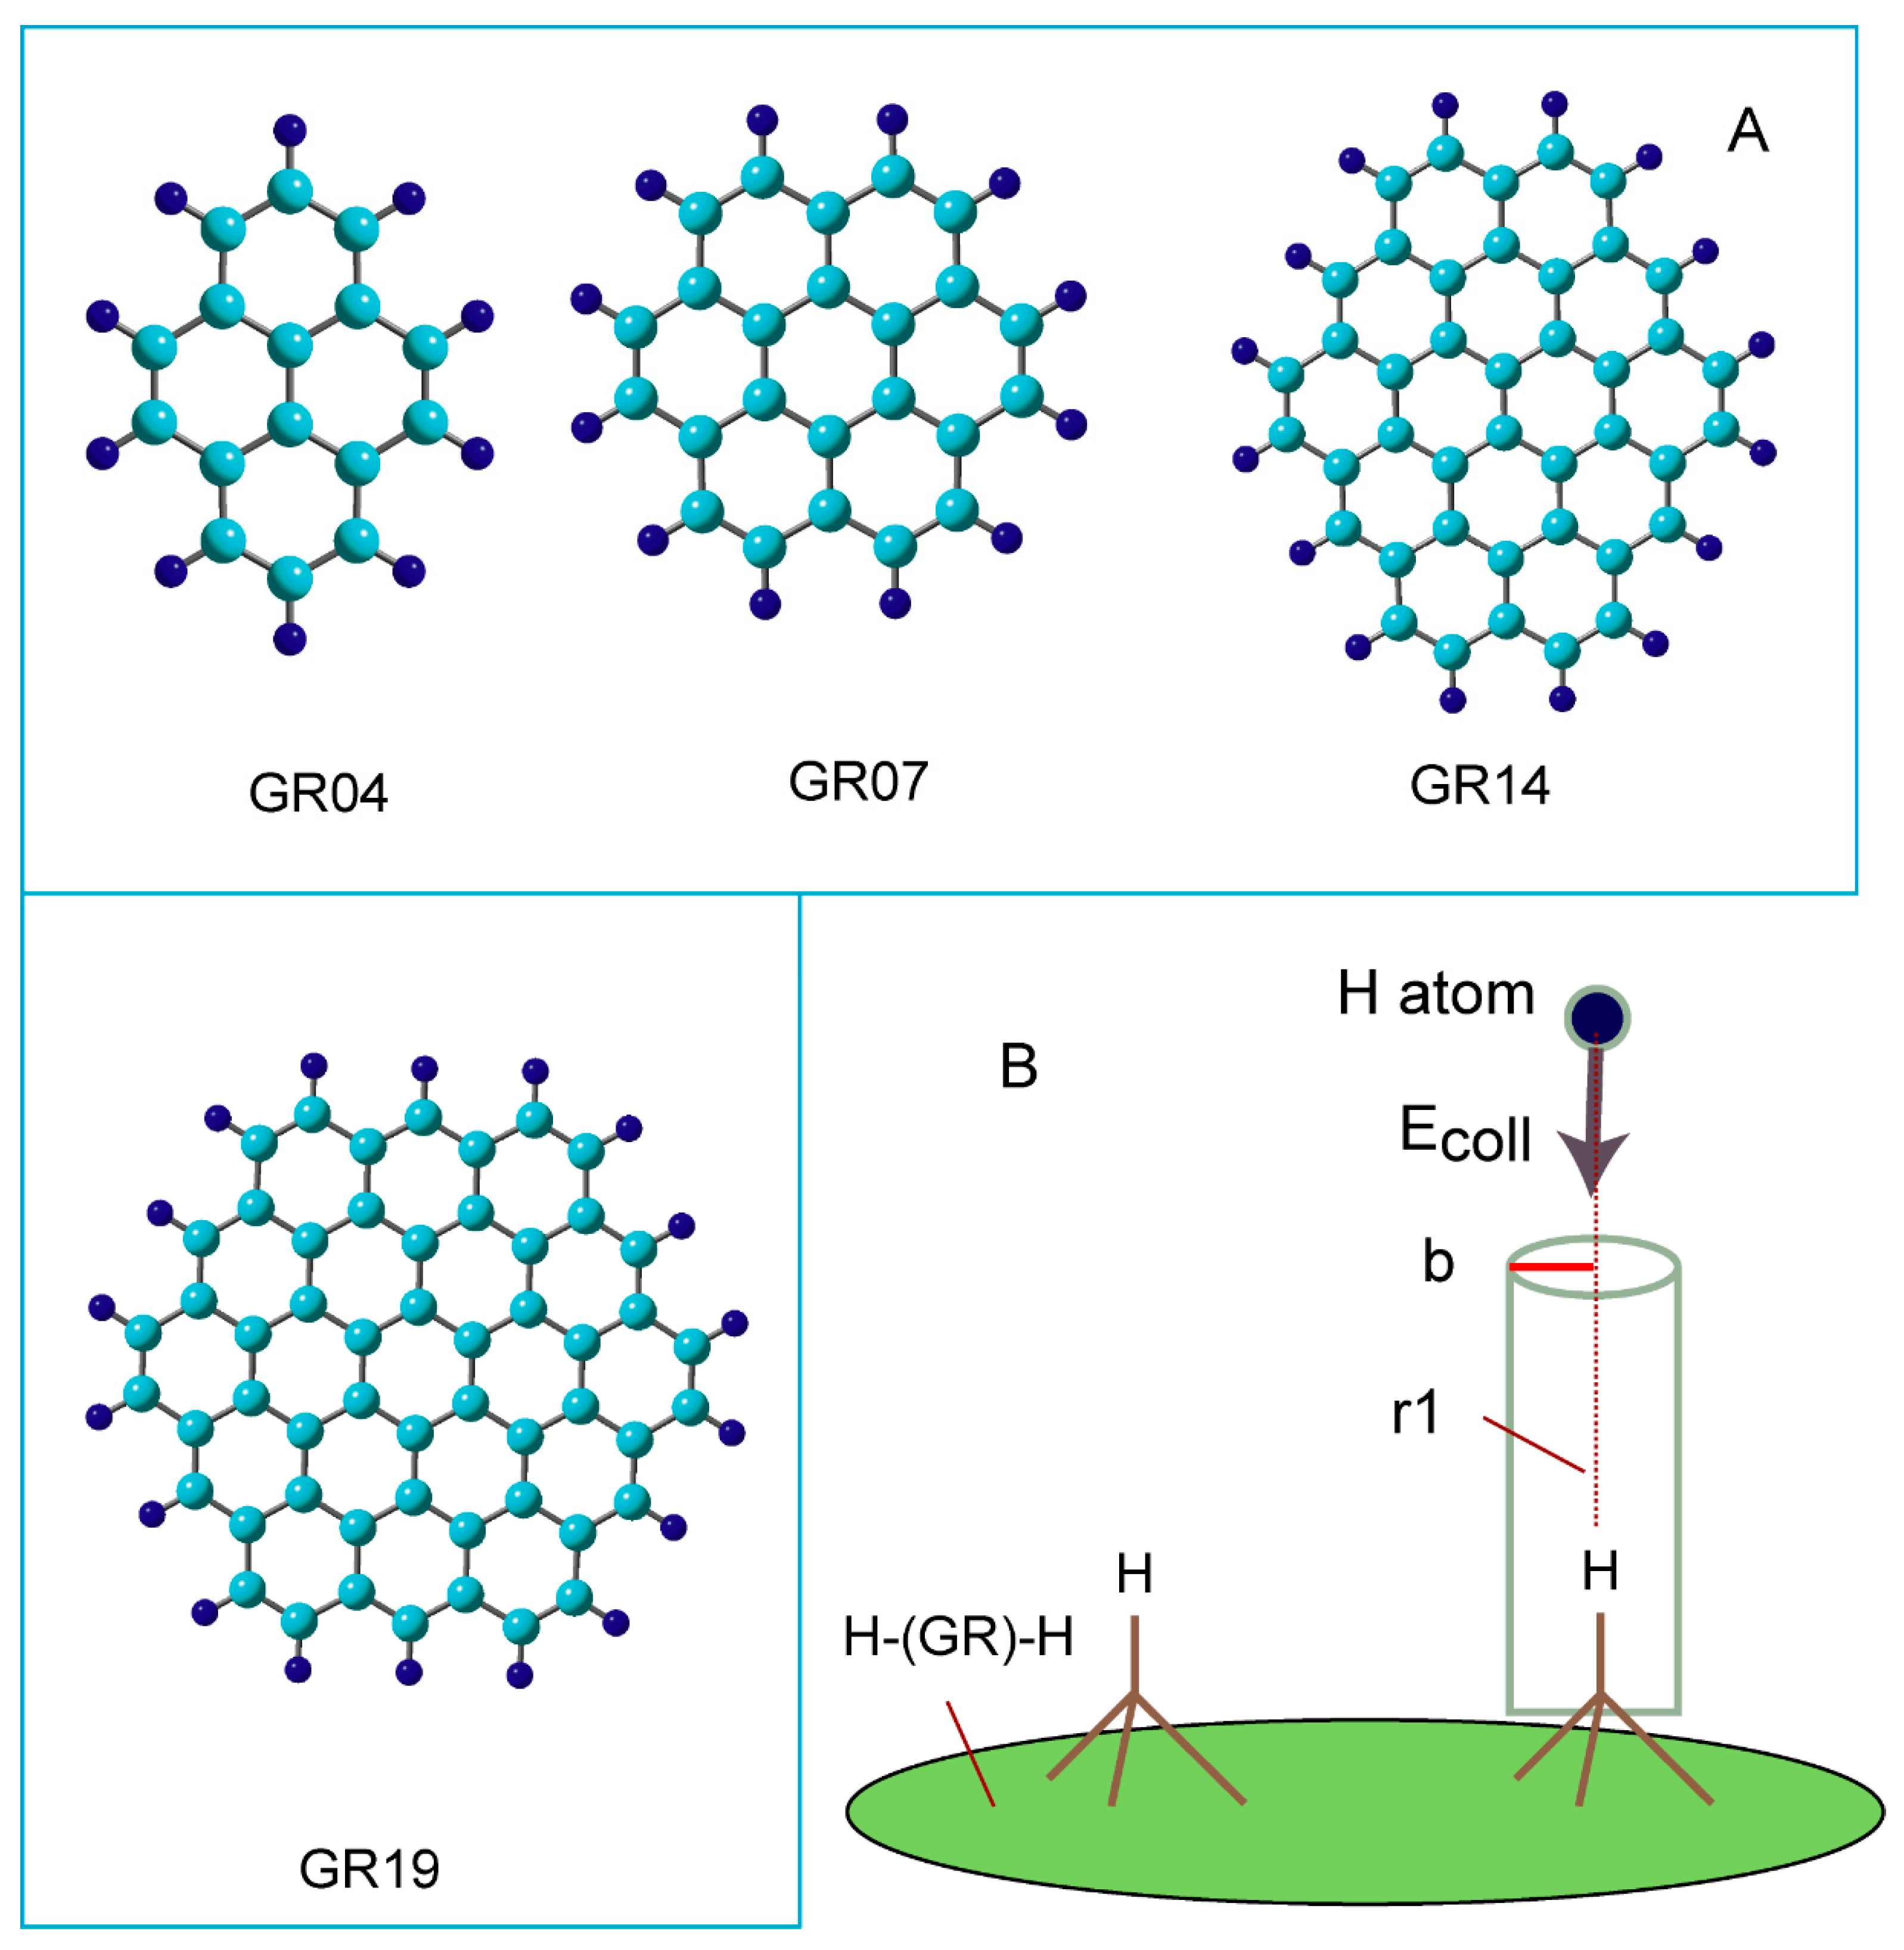
Figure 3.
(A) Optimized structures of reaction system along the hydrogen abstraction reaction: hydrogenated GR at reactant state (RC: H-(GR)-H), van der Waals states (vdW-1 and 2), transition state (TS), and product state (PD: GR-H). The distances and bond lengths are in Å. The calculations were carried out at the CAM-B3LYP/ 6-311G(d,p) level.
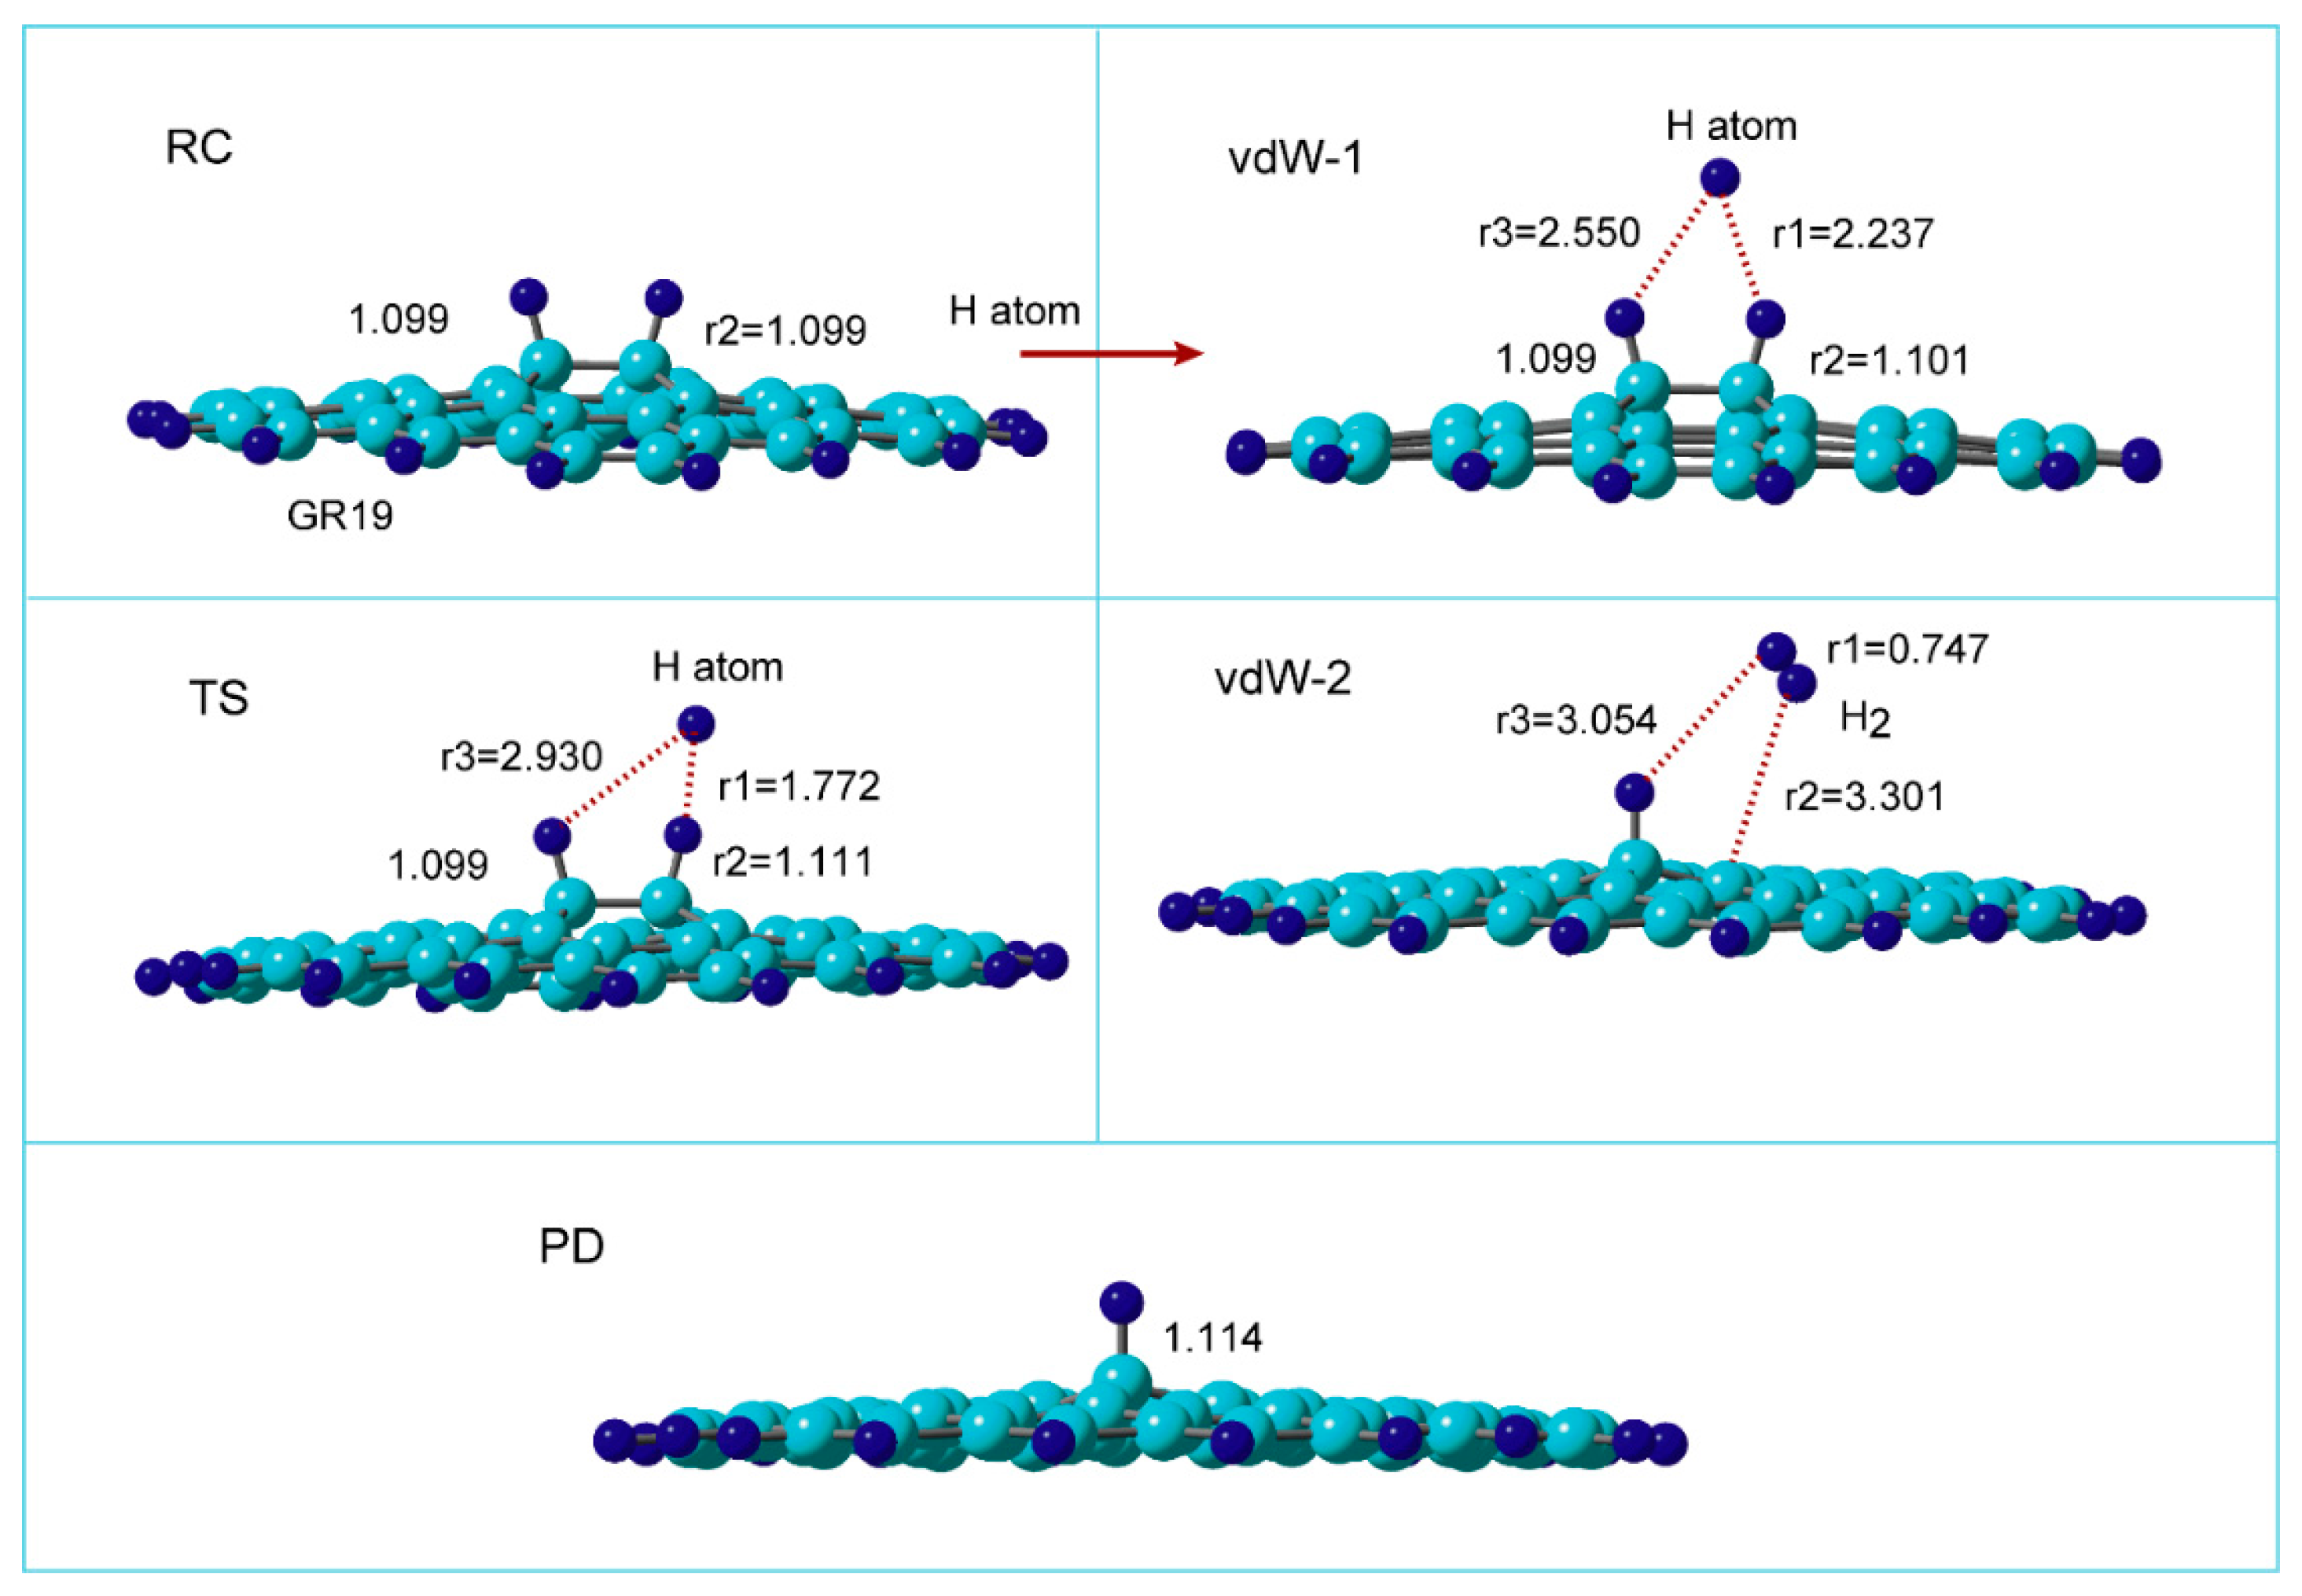
Figure 4.
(A) Energy diagram of reaction system along the hydrogen abstraction reaction: hydrogenated GR14 at reactant state (RC: H-(GR)-H), van der Waals states (vdW-1 and 2), transition state (TS), and product state (PD: GR-H). The distances and bond lengths are in Å. The calculations were carried out at the CAM-B3LYP/ 6-311G(d,p) level.
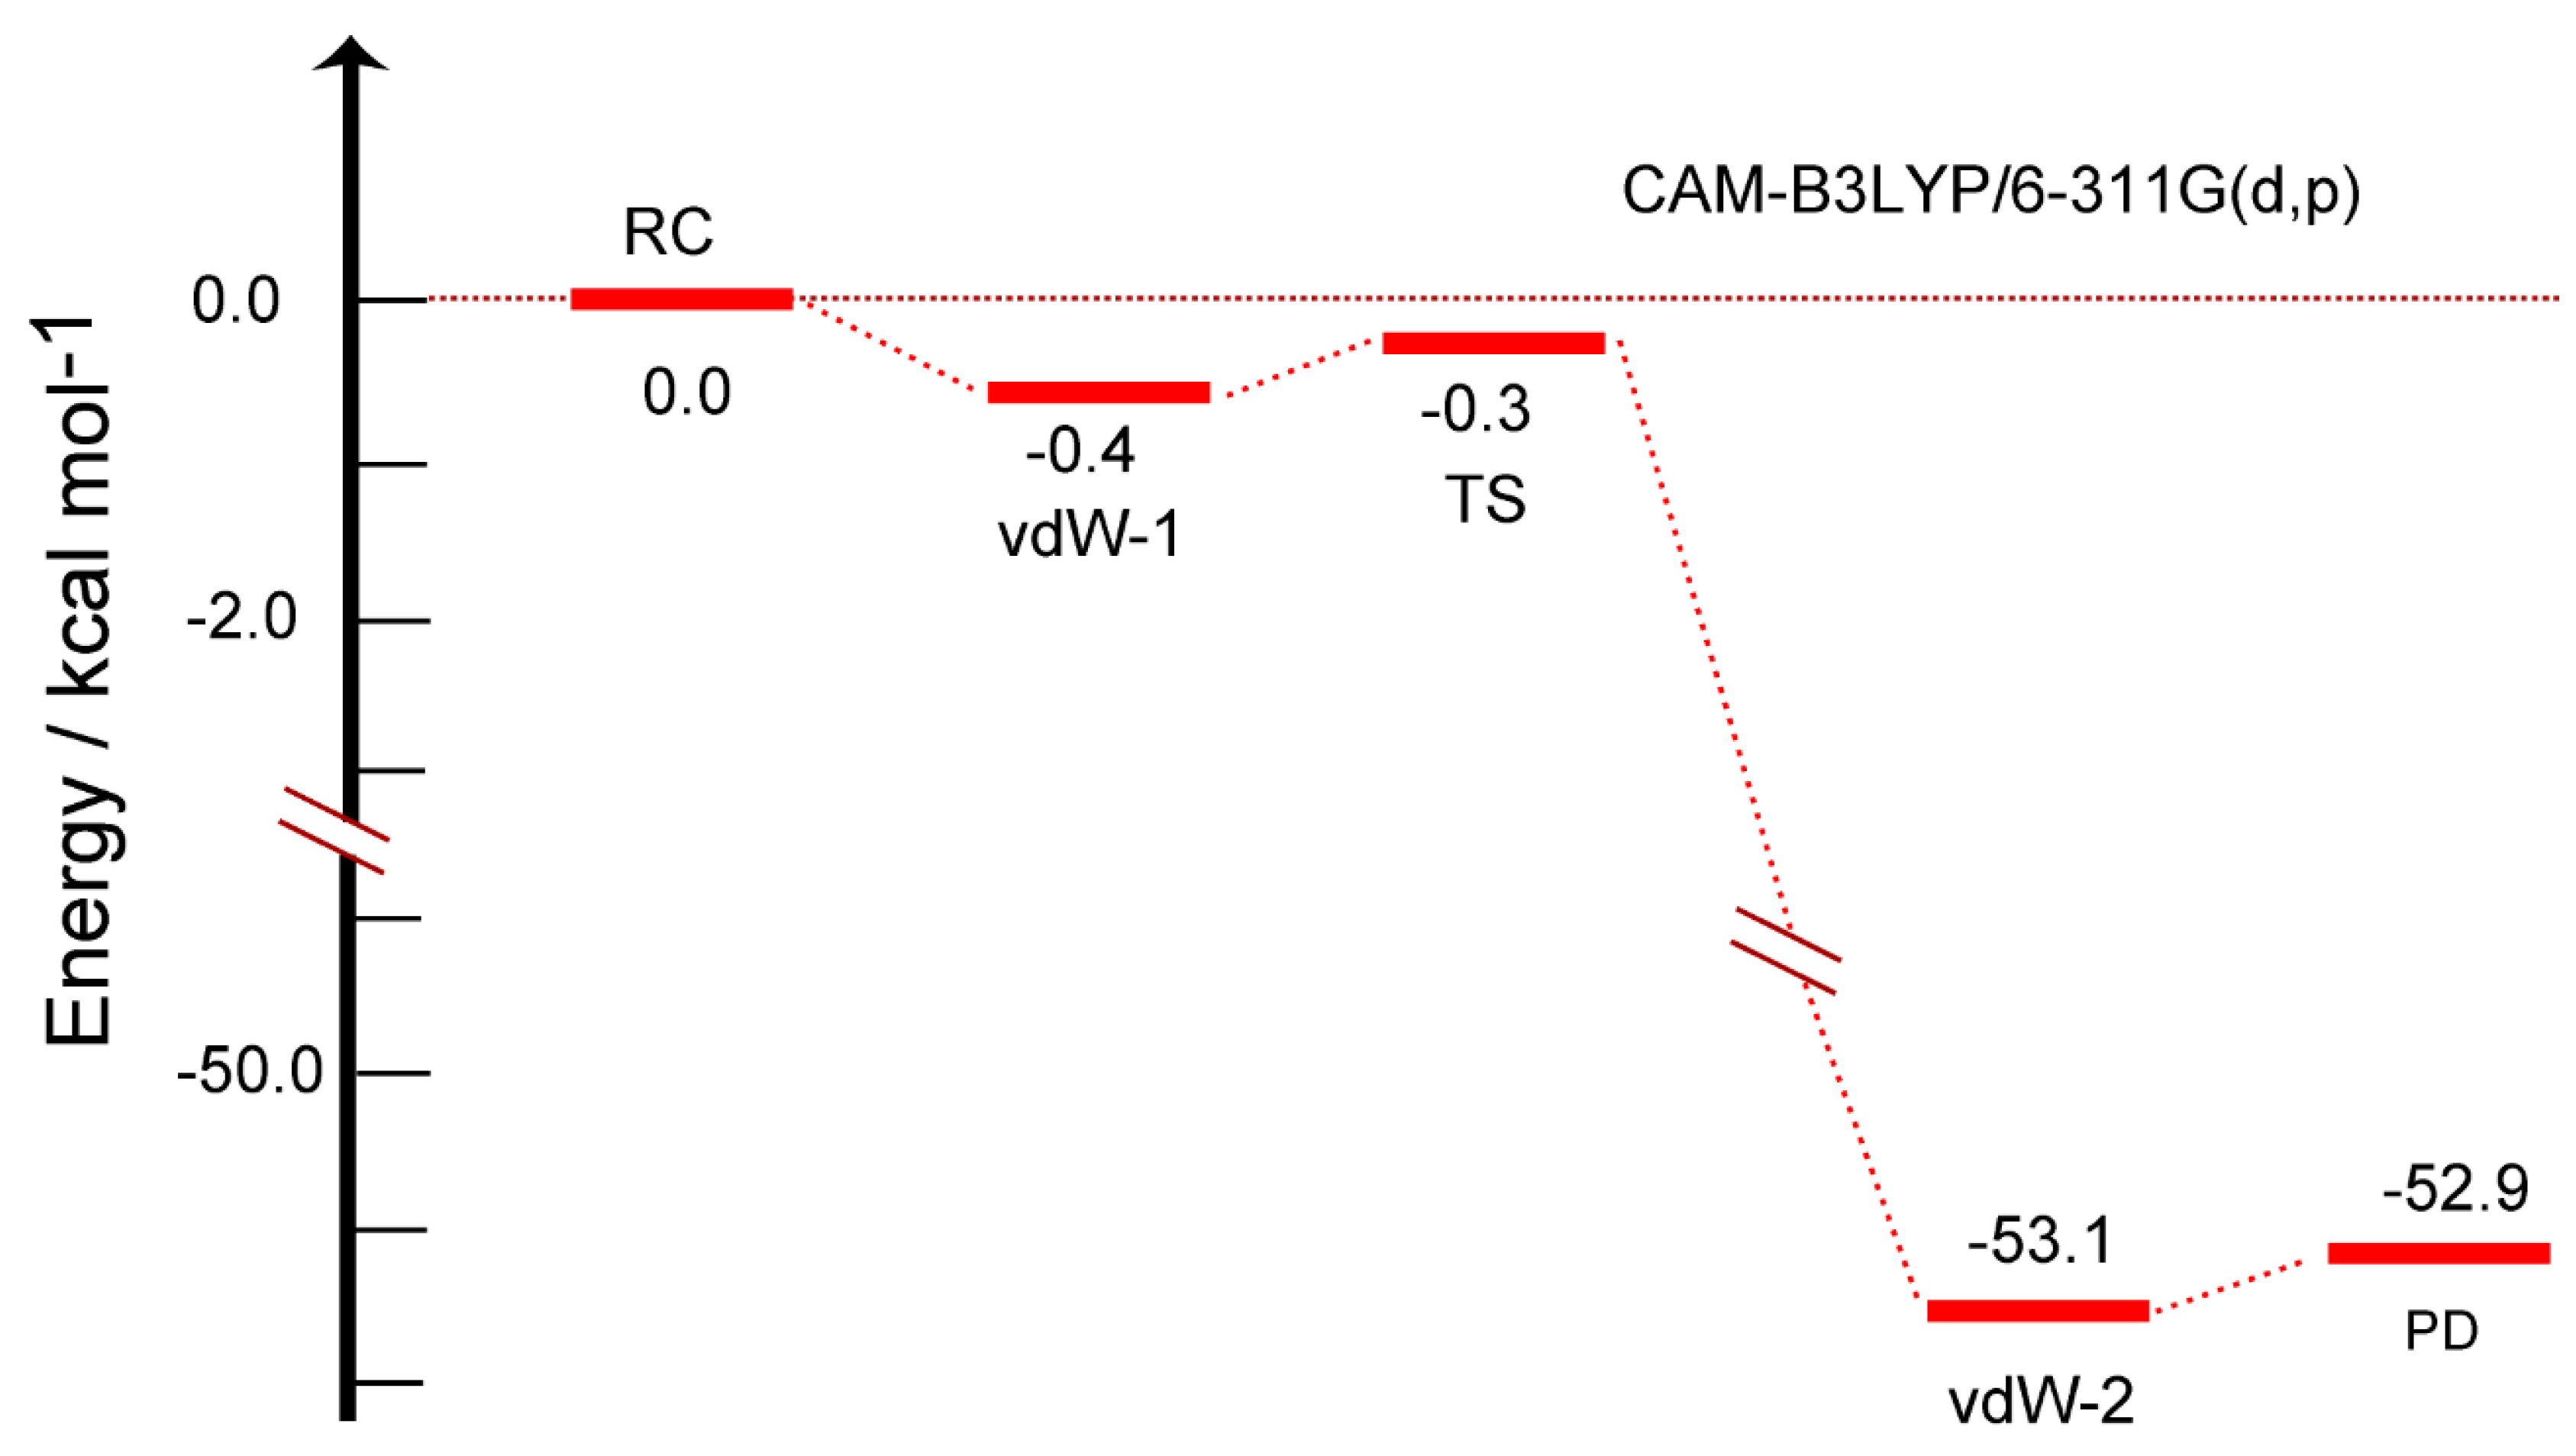
Figure 5.
Time evolution of snapshots of reaction system for hydrogen abstraction reaction, H + H-(GR)-H → H2 + GR-H. Direct AIMD calculation were performed at the CAM-B3LYP/6-31G(d) level. The CAM-B3LYP/6-31G(d)-optimized geometry of H-(GR)-H was used as the initial geometry at time zero. The distances and bond lengths are in Å. GR04 was used.
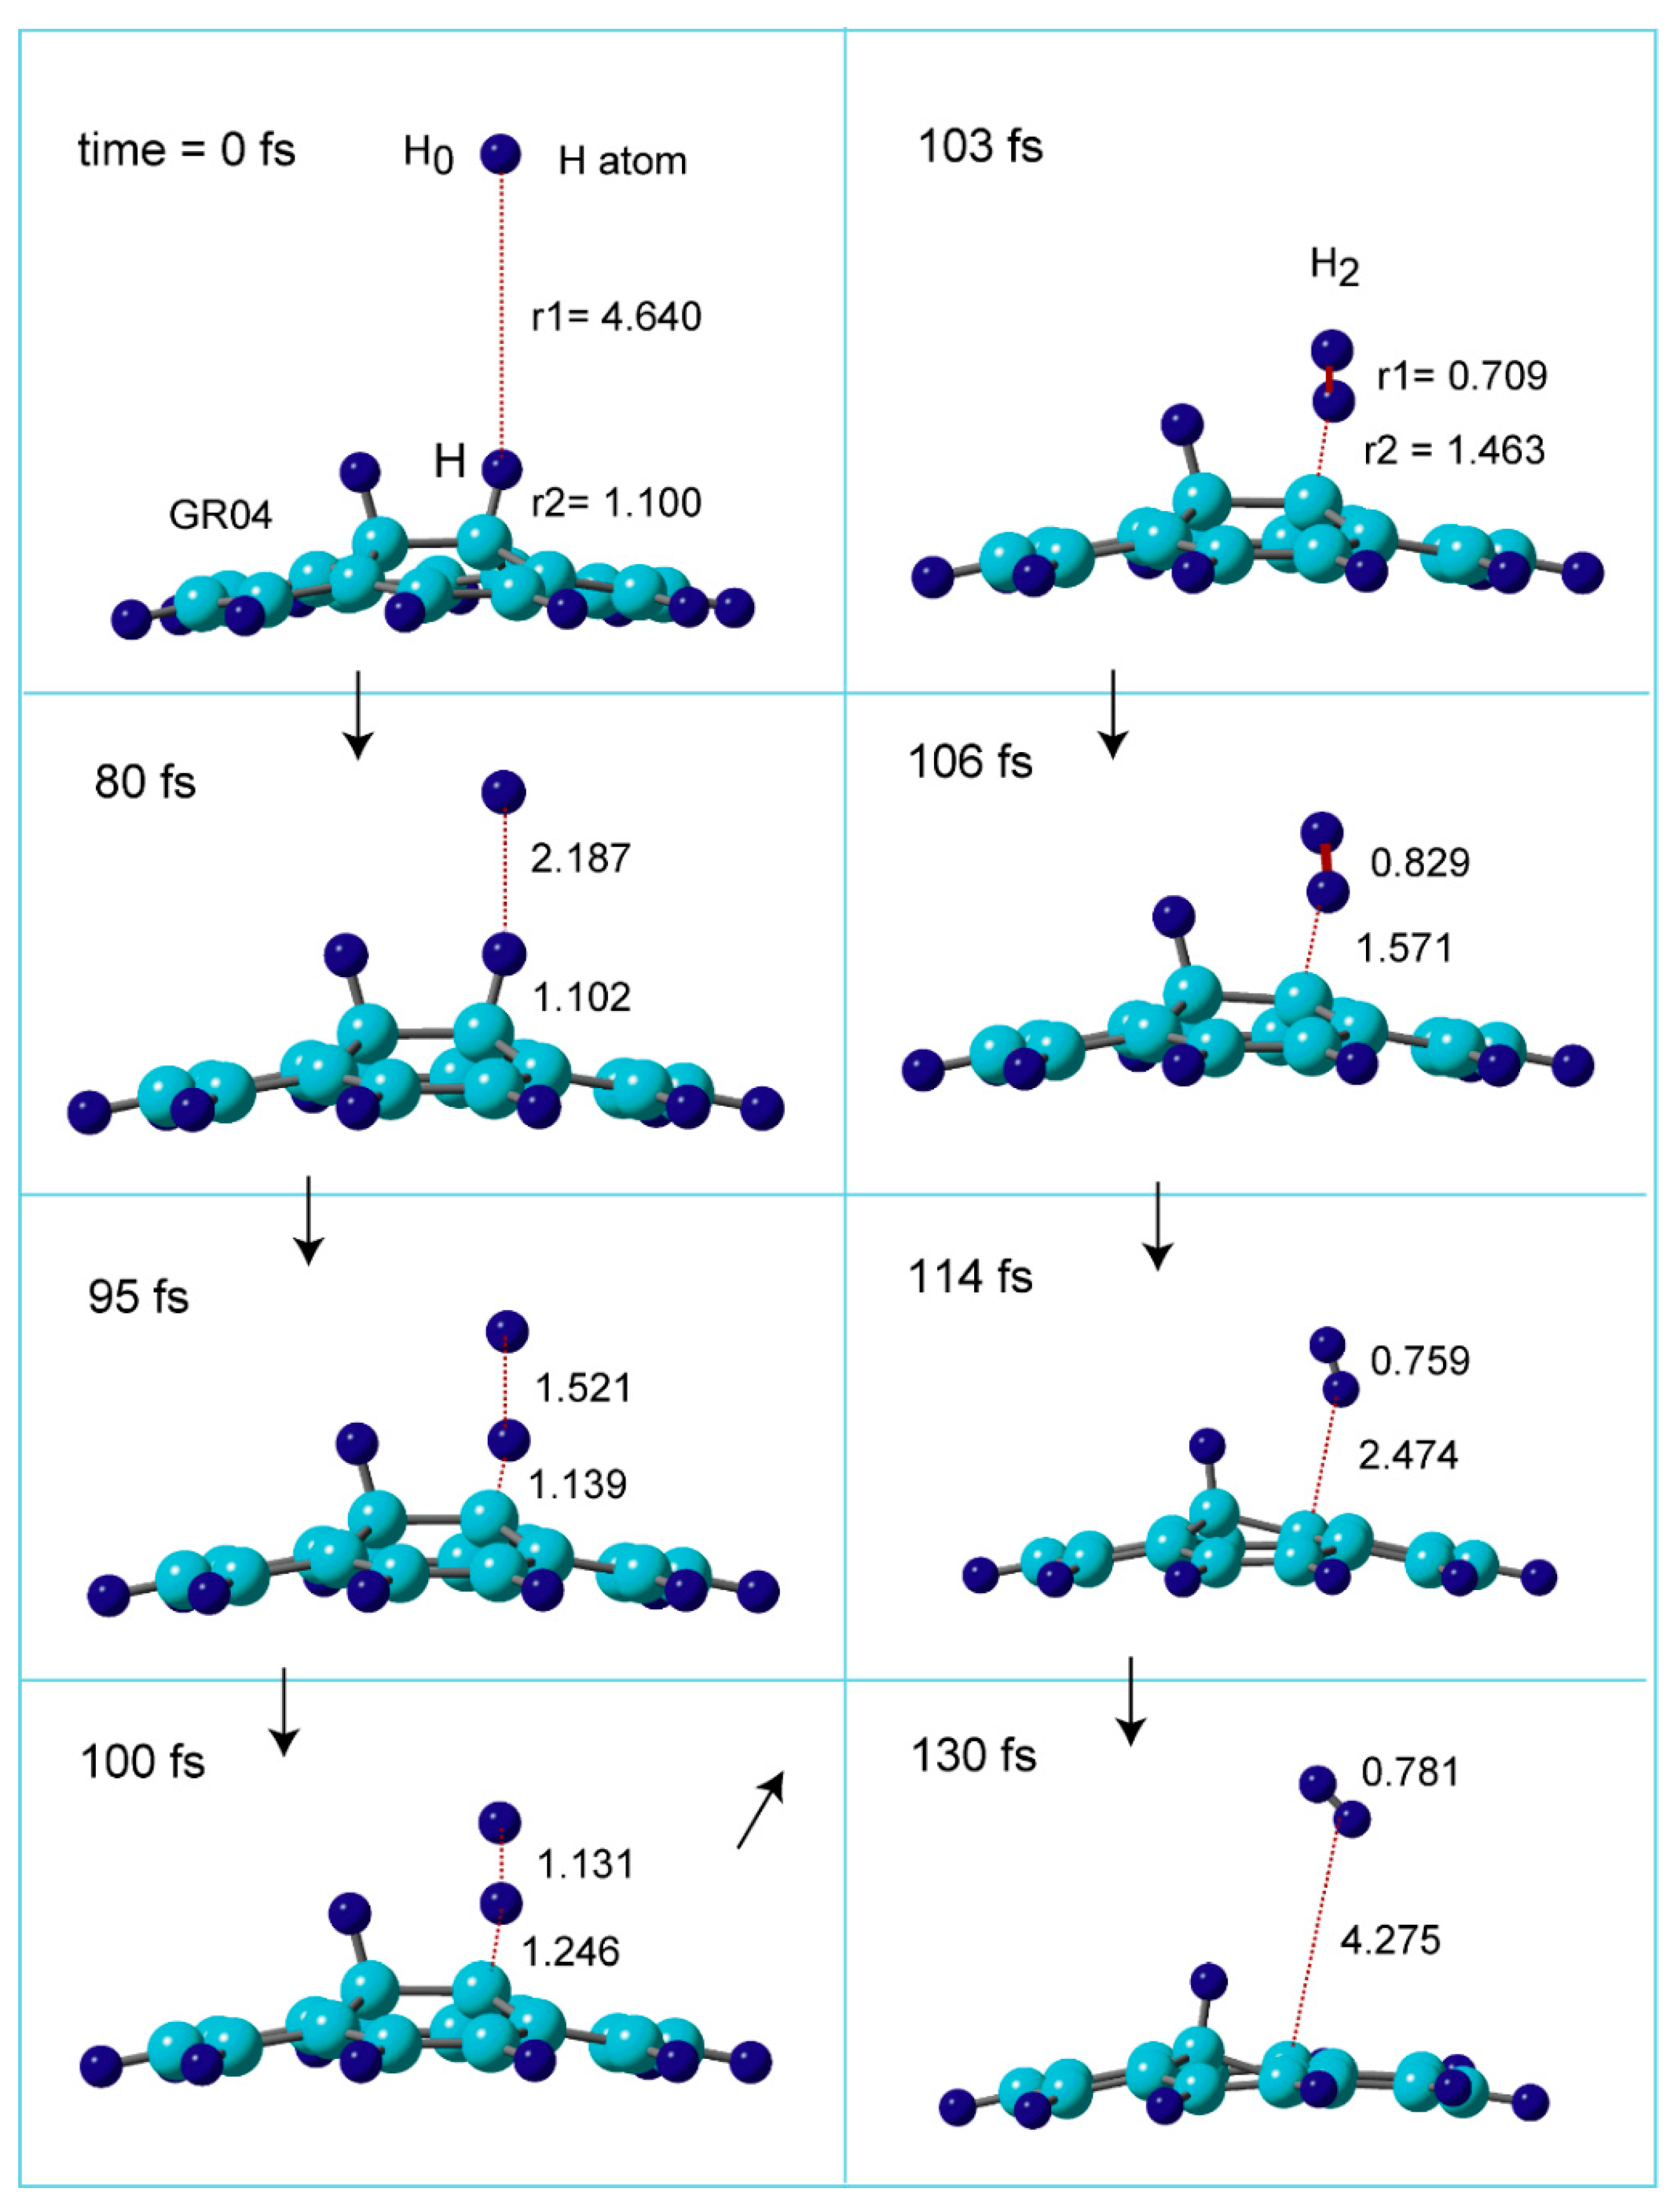
Figure 6.
Time evolution of (A) potential energy and (B) interatomic distances of reaction system (r1 and r2). Direct AIMD calculation were performed at the CAM-B3LYP/6-31G(d) level. The CAM-B3LYP/6-31G(d)-optimized geometry of H-(GR)-H was used as the initial geometries of H-(GR)-H at time zero.
Figure 6.
Time evolution of (A) potential energy and (B) interatomic distances of reaction system (r1 and r2). Direct AIMD calculation were performed at the CAM-B3LYP/6-31G(d) level. The CAM-B3LYP/6-31G(d)-optimized geometry of H-(GR)-H was used as the initial geometries of H-(GR)-H at time zero.
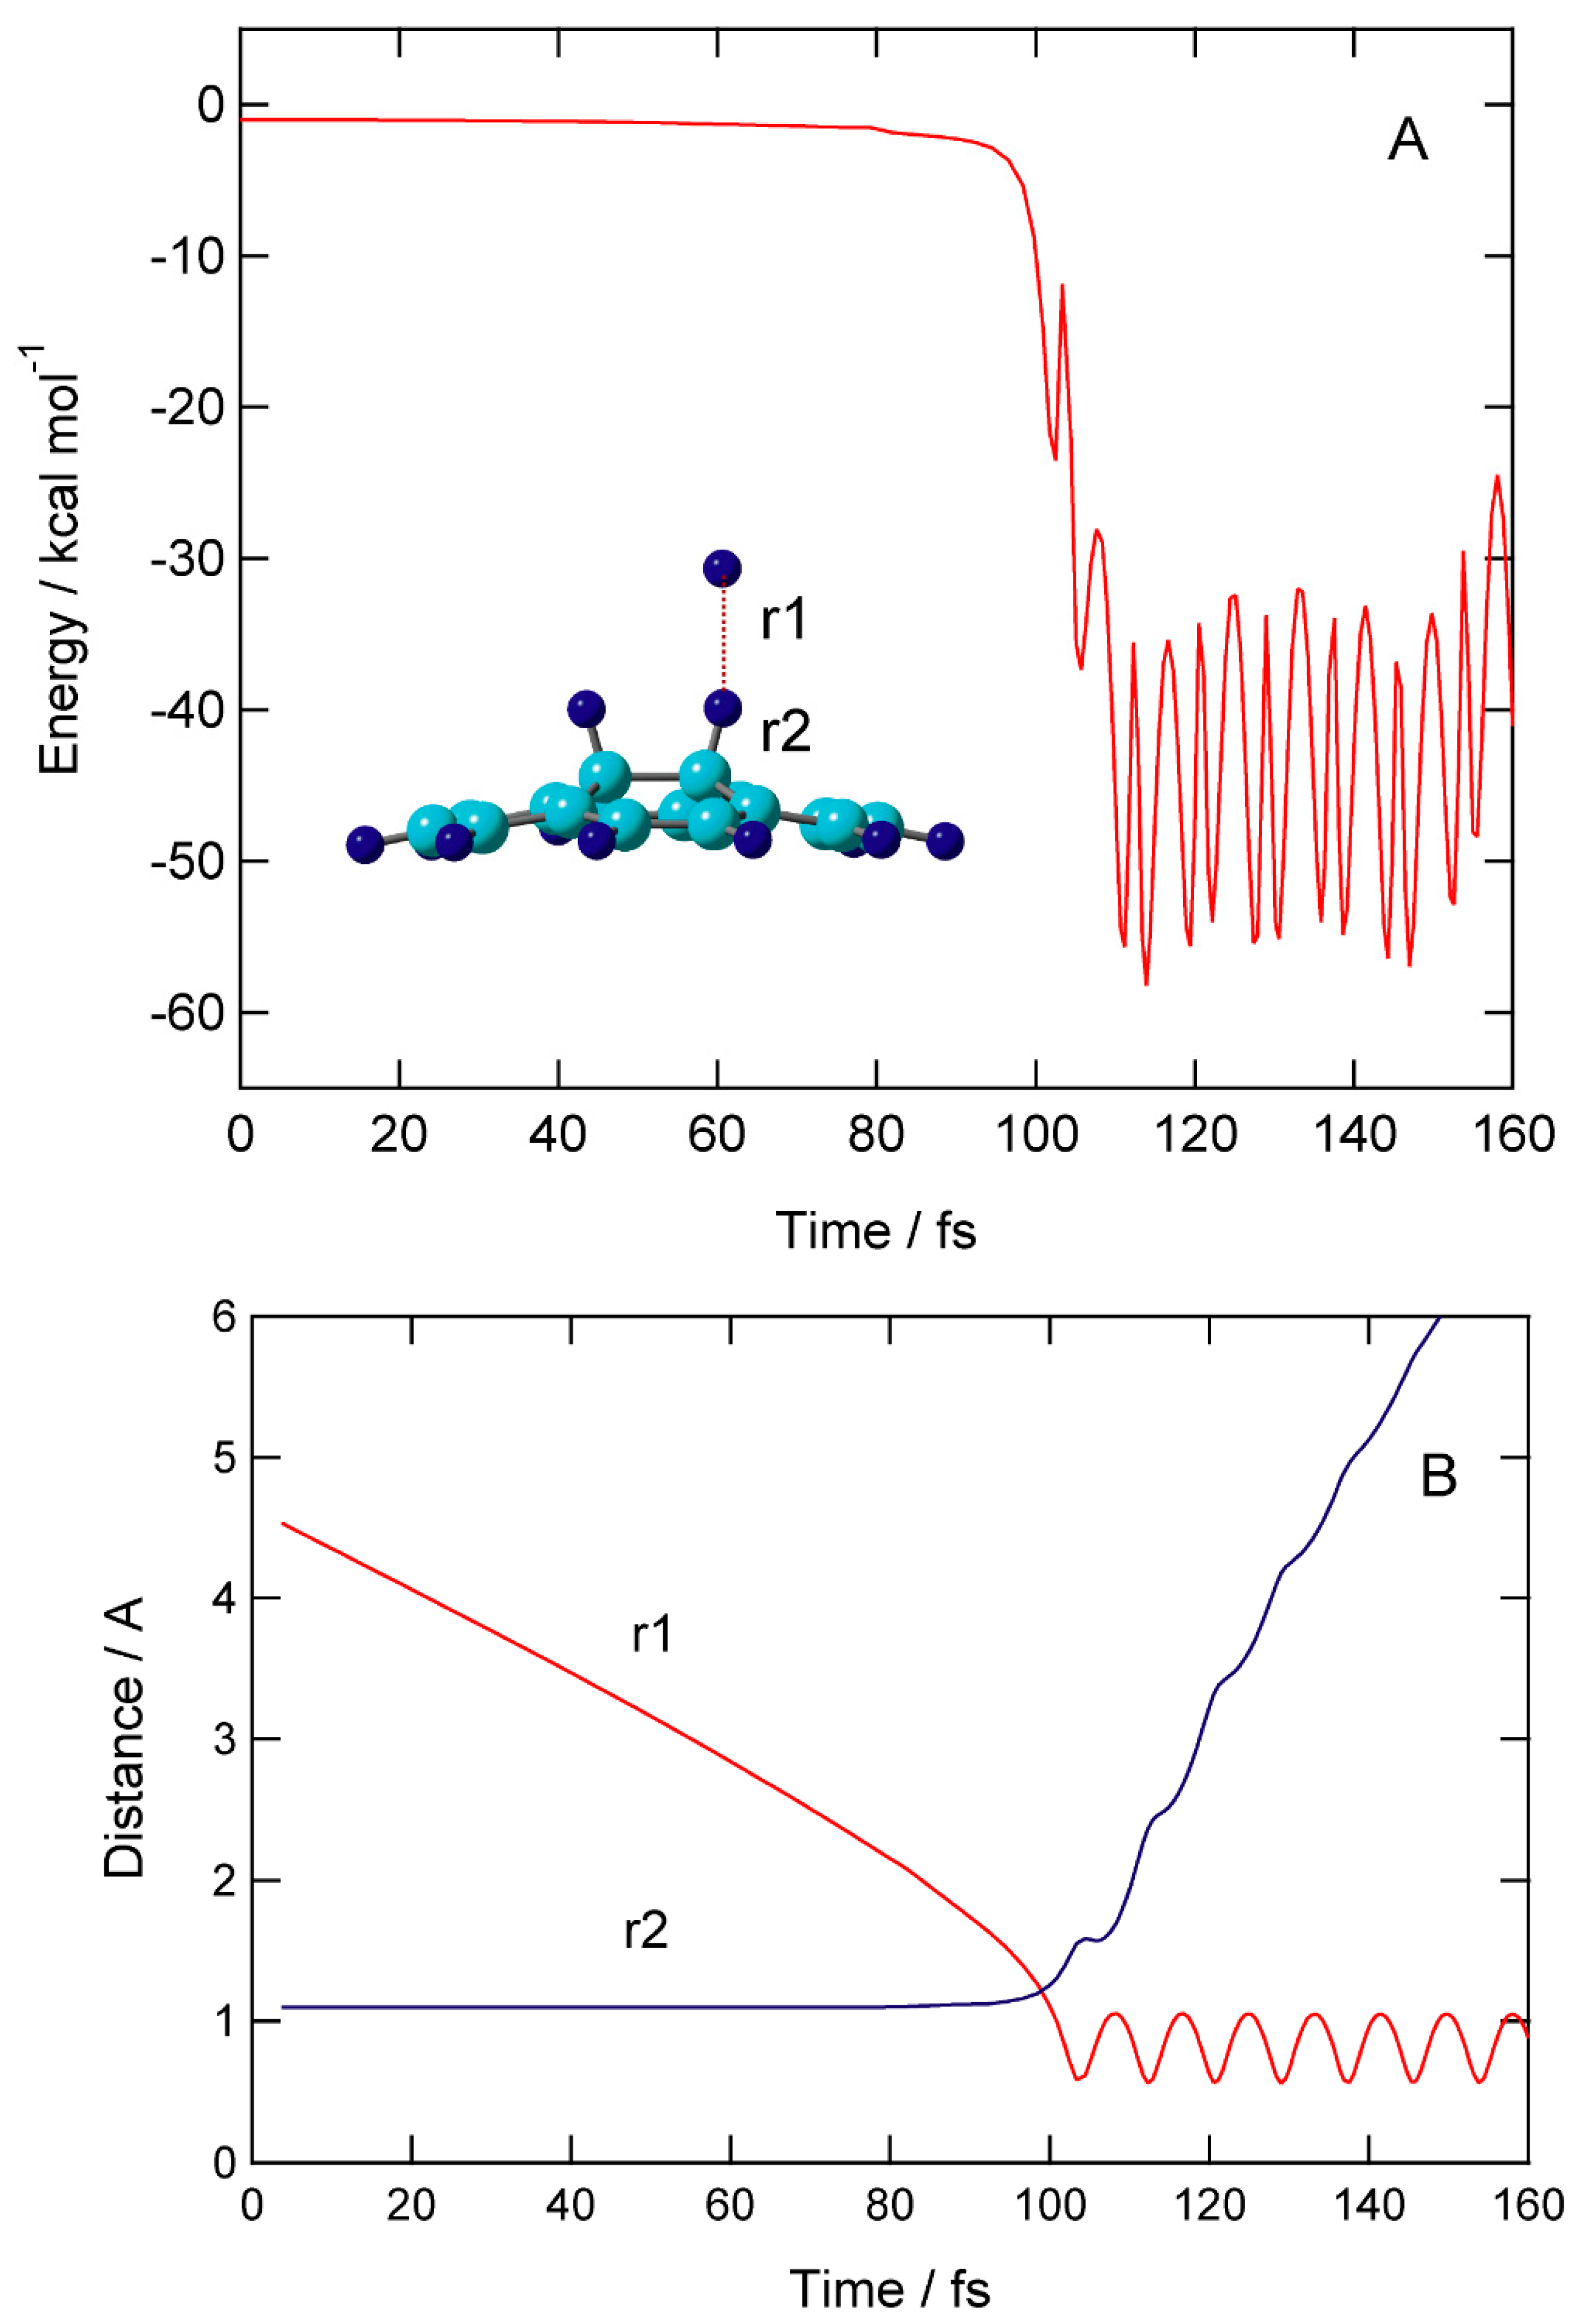
Figure 7.
Distribution of translational energy of product H2 (Etr) formed by the H-abstraction reaction for H + H-(GR)-H → H2 + (GR)-H. Direct AIMD calculation were performed at the CAM-B3LYP/6-31G(d) level.
Figure 7.
Distribution of translational energy of product H2 (Etr) formed by the H-abstraction reaction for H + H-(GR)-H → H2 + (GR)-H. Direct AIMD calculation were performed at the CAM-B3LYP/6-31G(d) level.
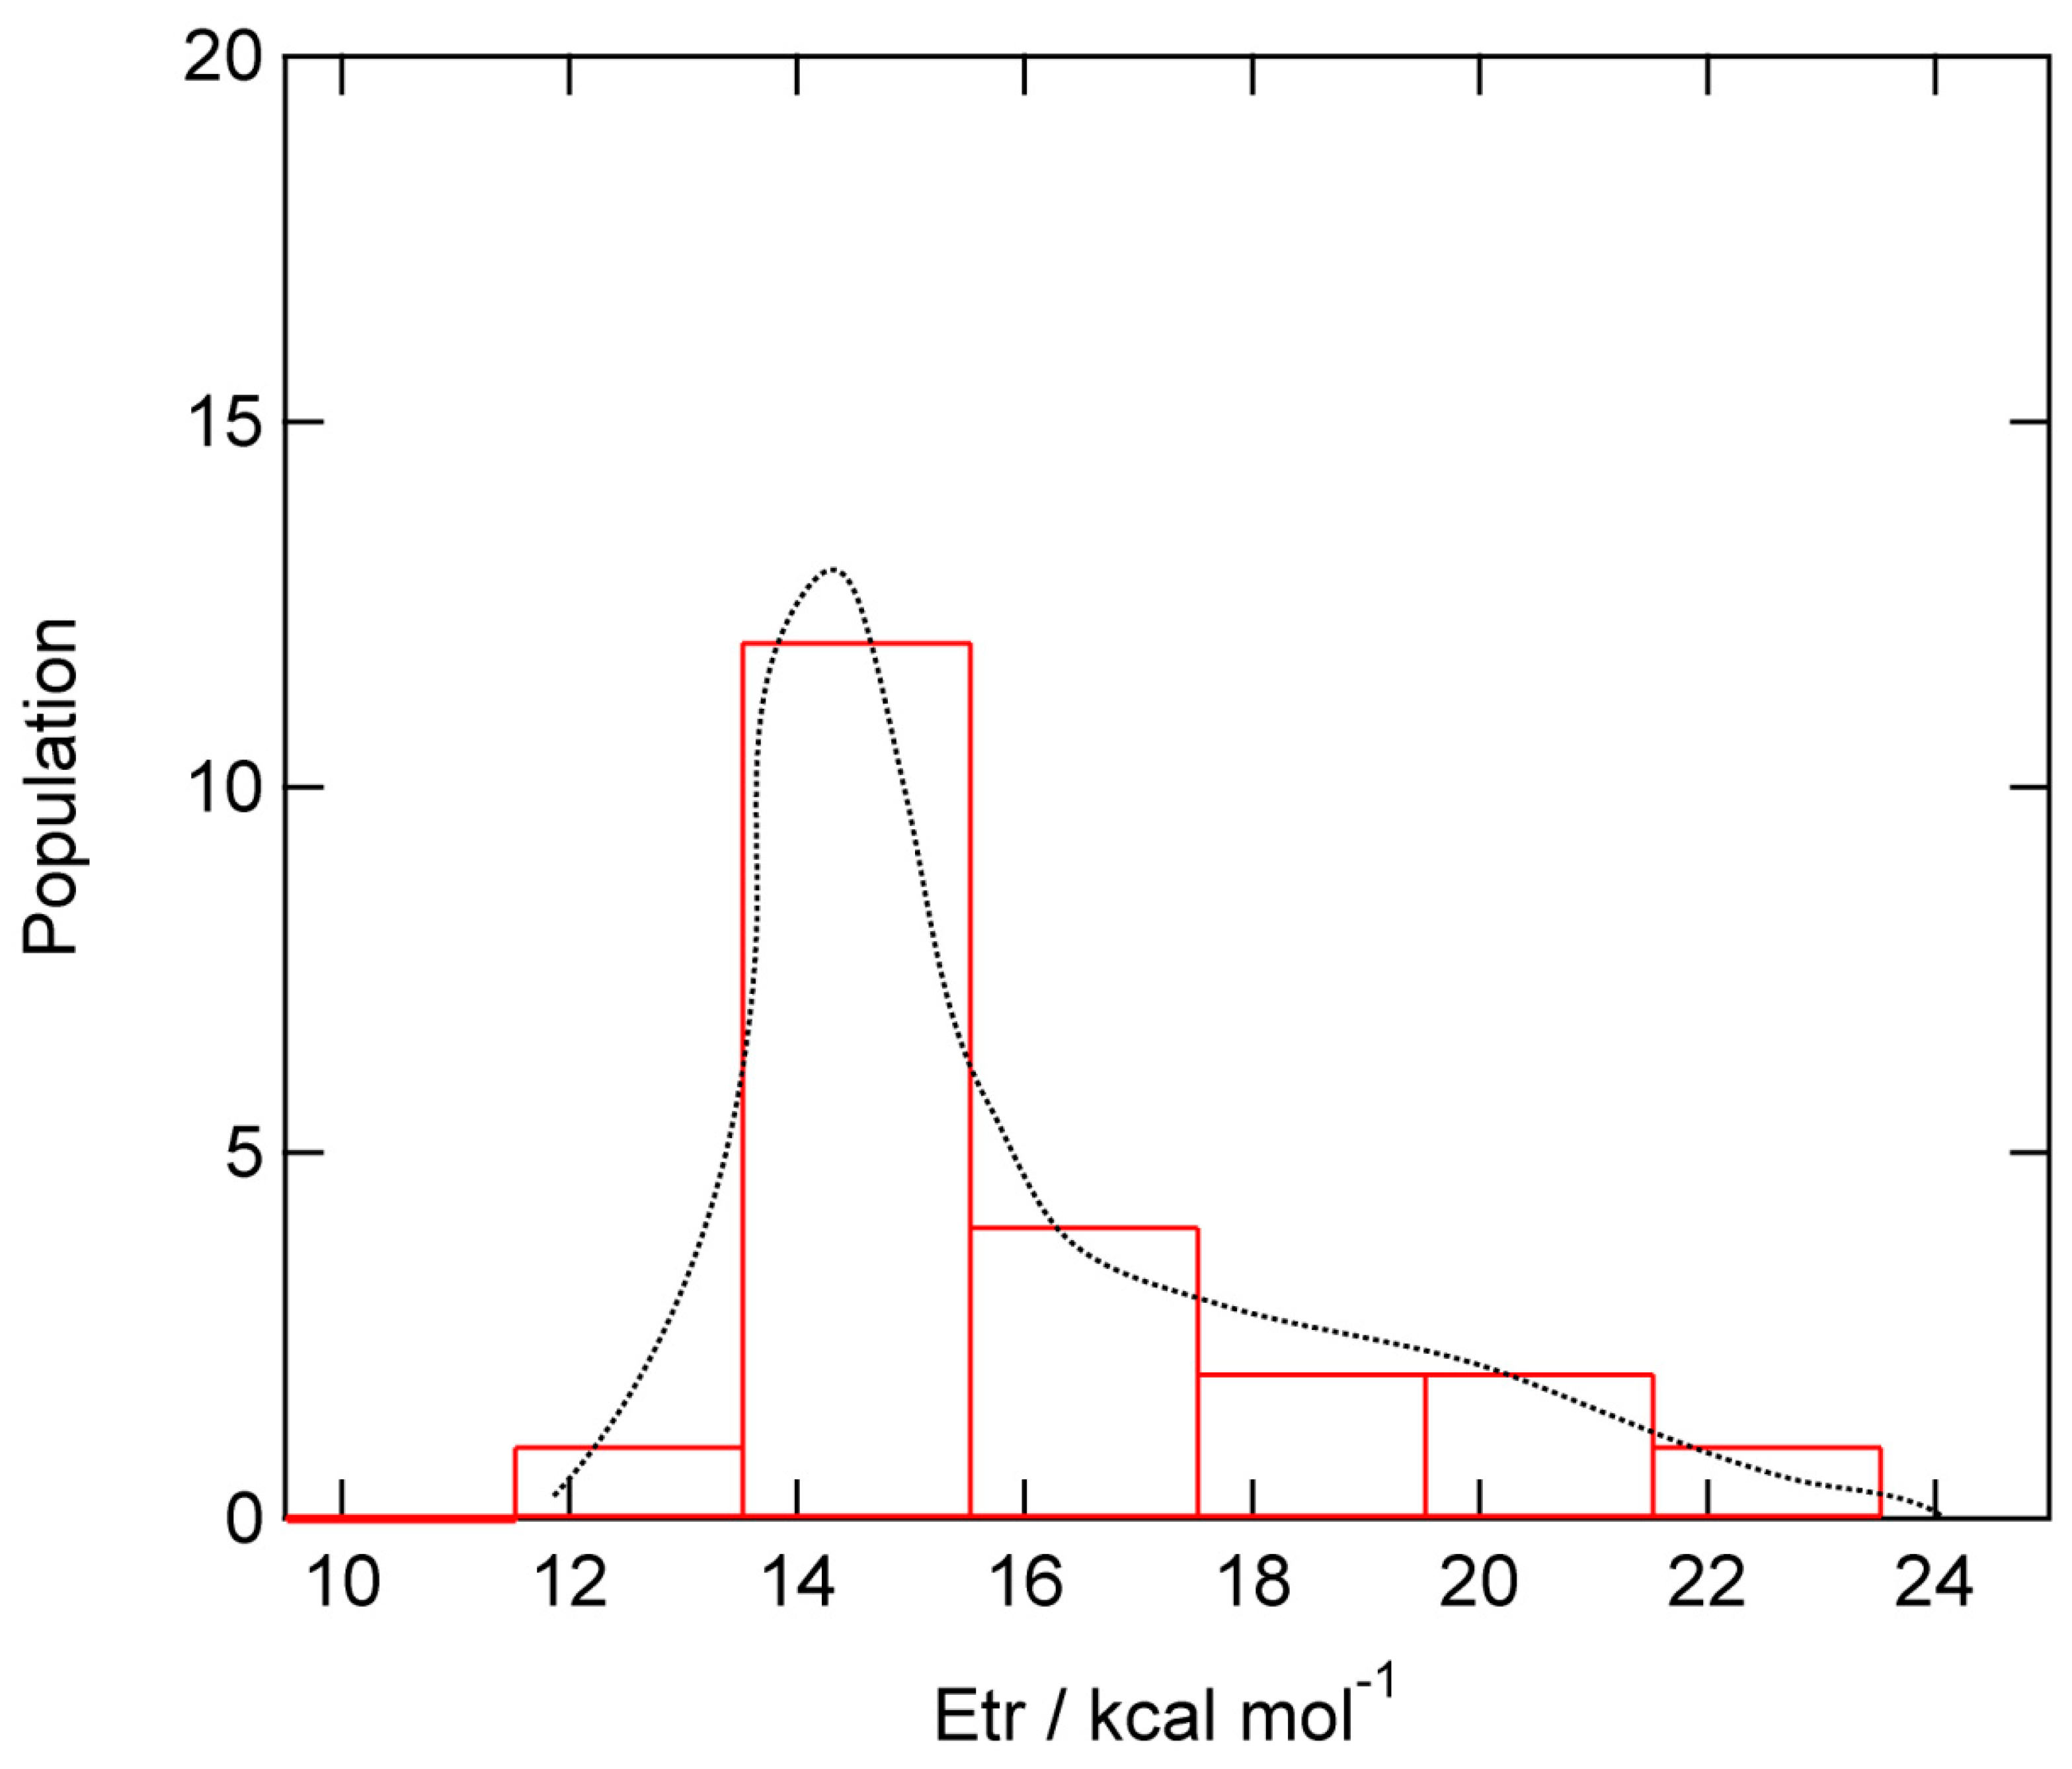
Figure 8.
Energy diagram for the hydrogen addition reaction: GR + H at reactant state (RC), and transition state (TS), and product state (PD: GR-H). The relative energies and distances are in kcal/mol and Å, respectively. The calculations were carried out at the CAM-B3LYP/6-311G(d,p) level. The values obtained by APFD/6-311G(d,p) level are given in parenthesis. GR19 was used.
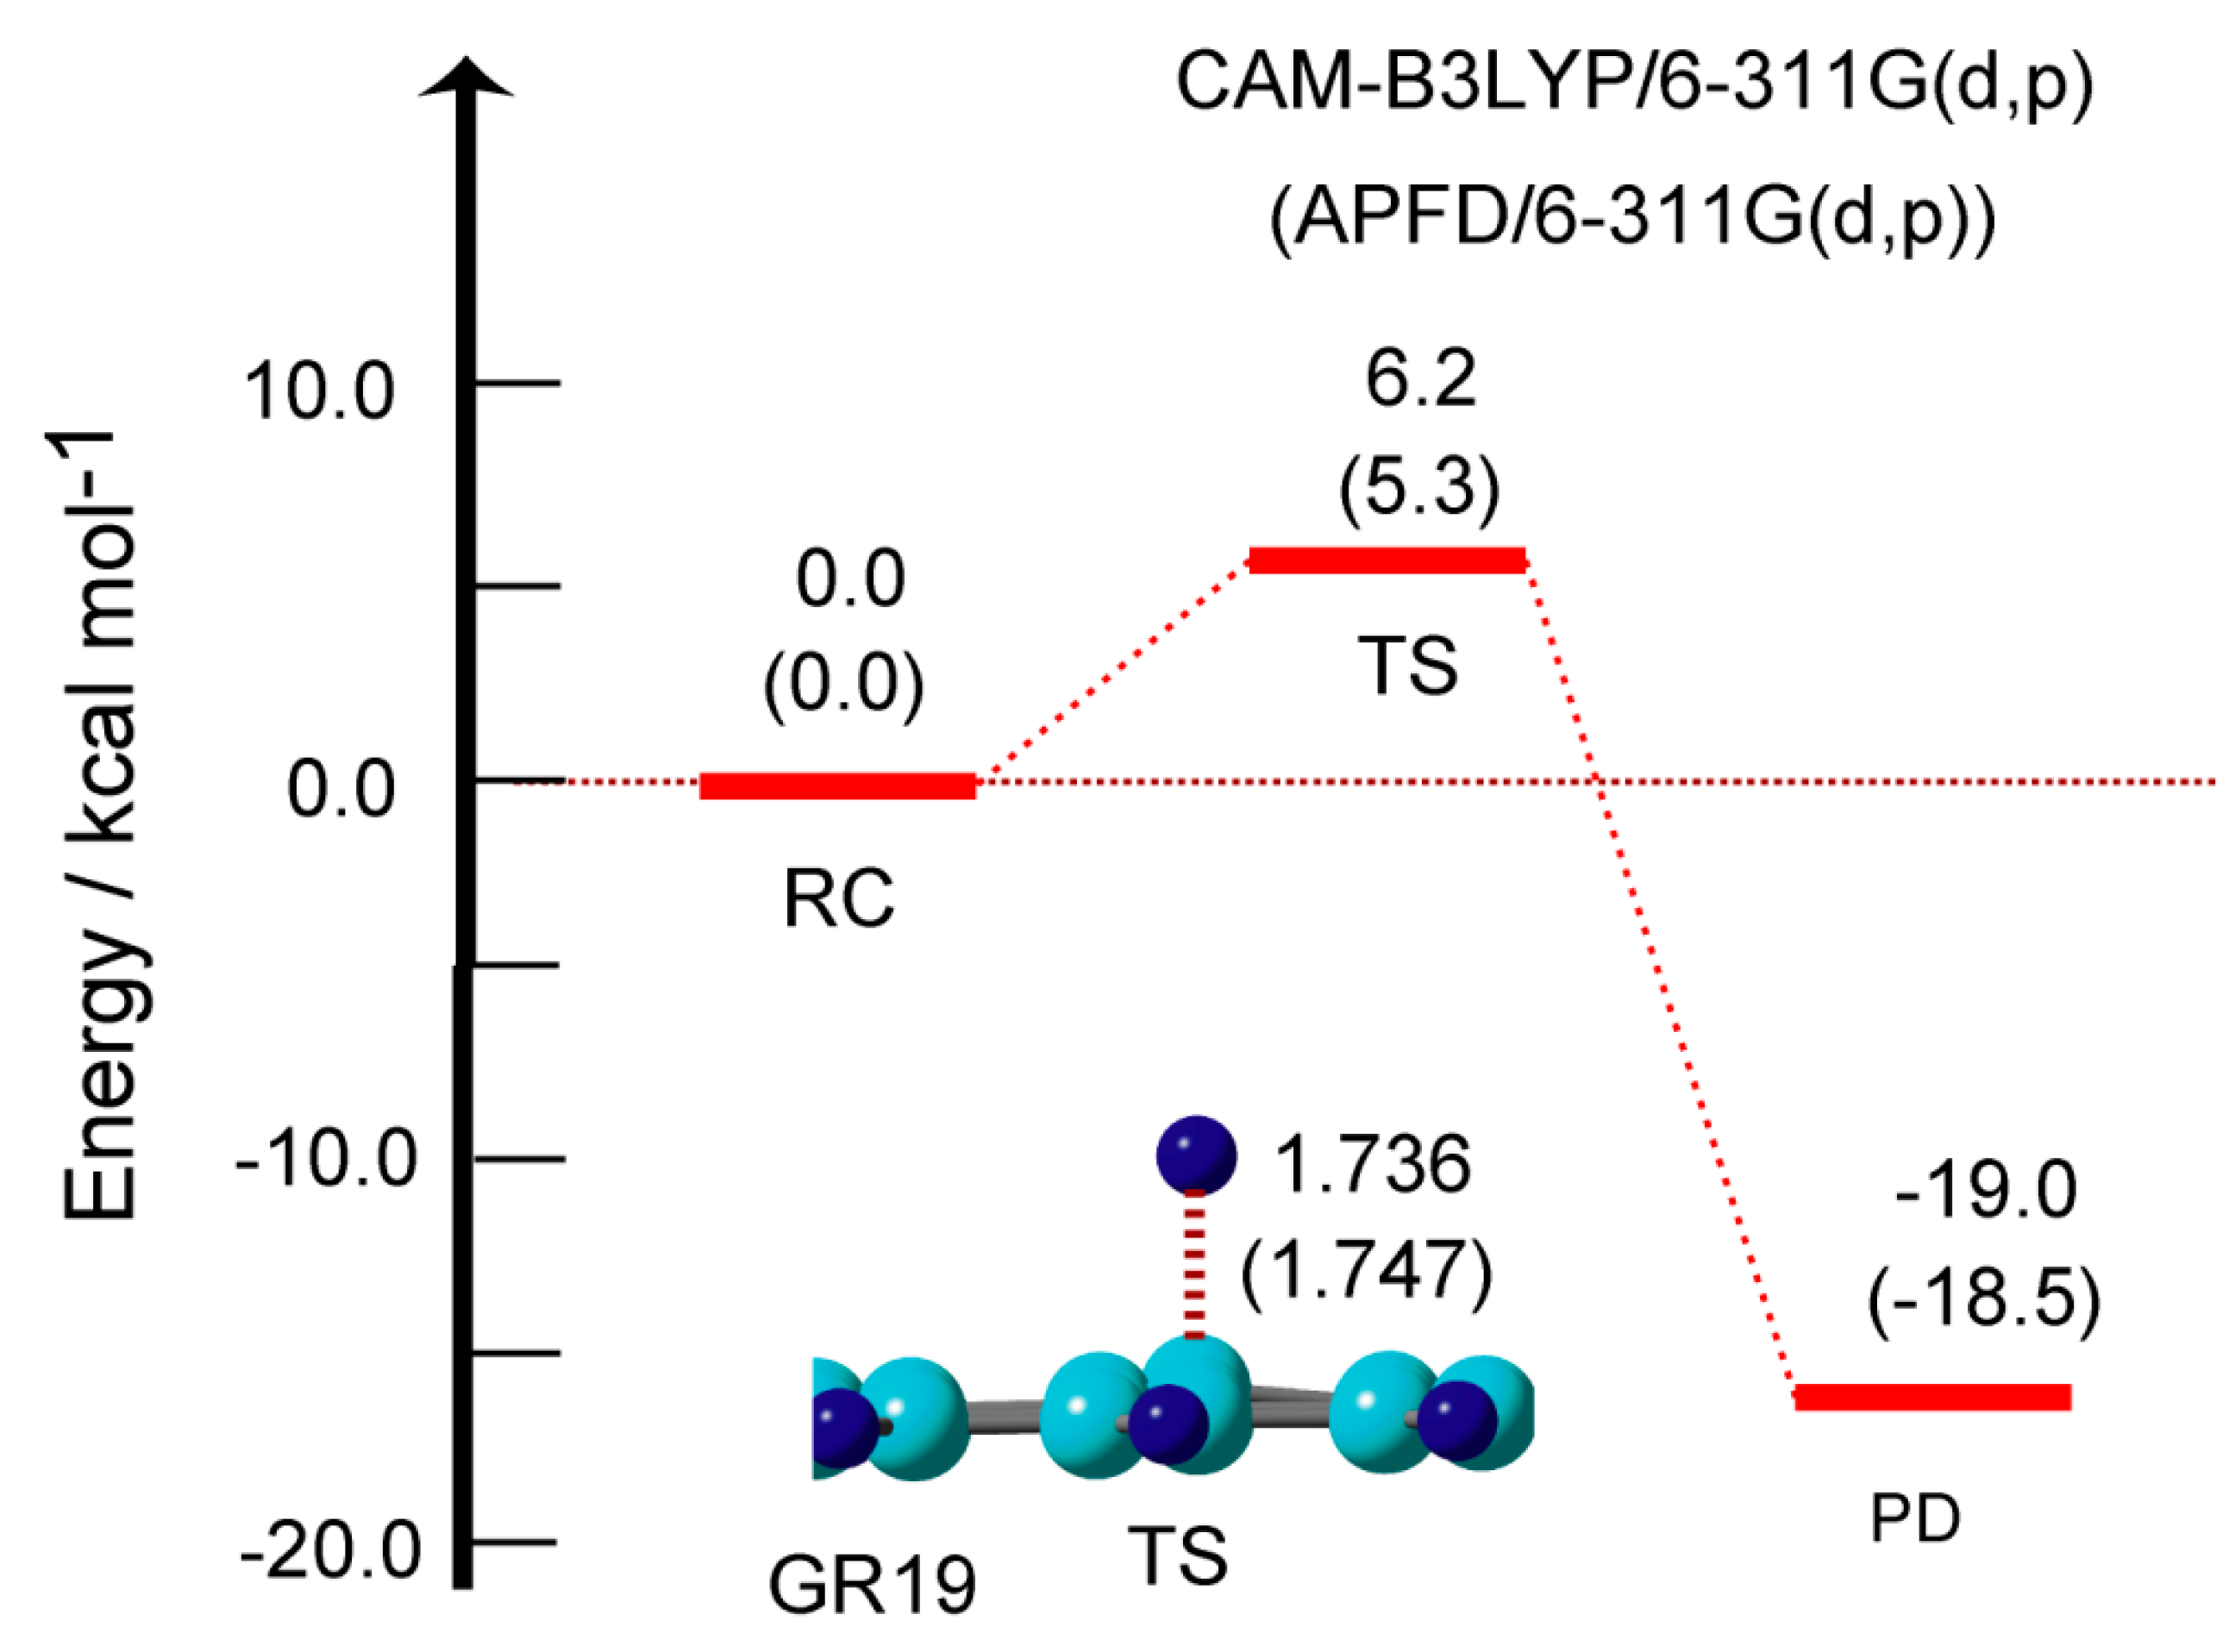
Figure 9.
Schematic illustration of H2 storage/release device proposed in this study.
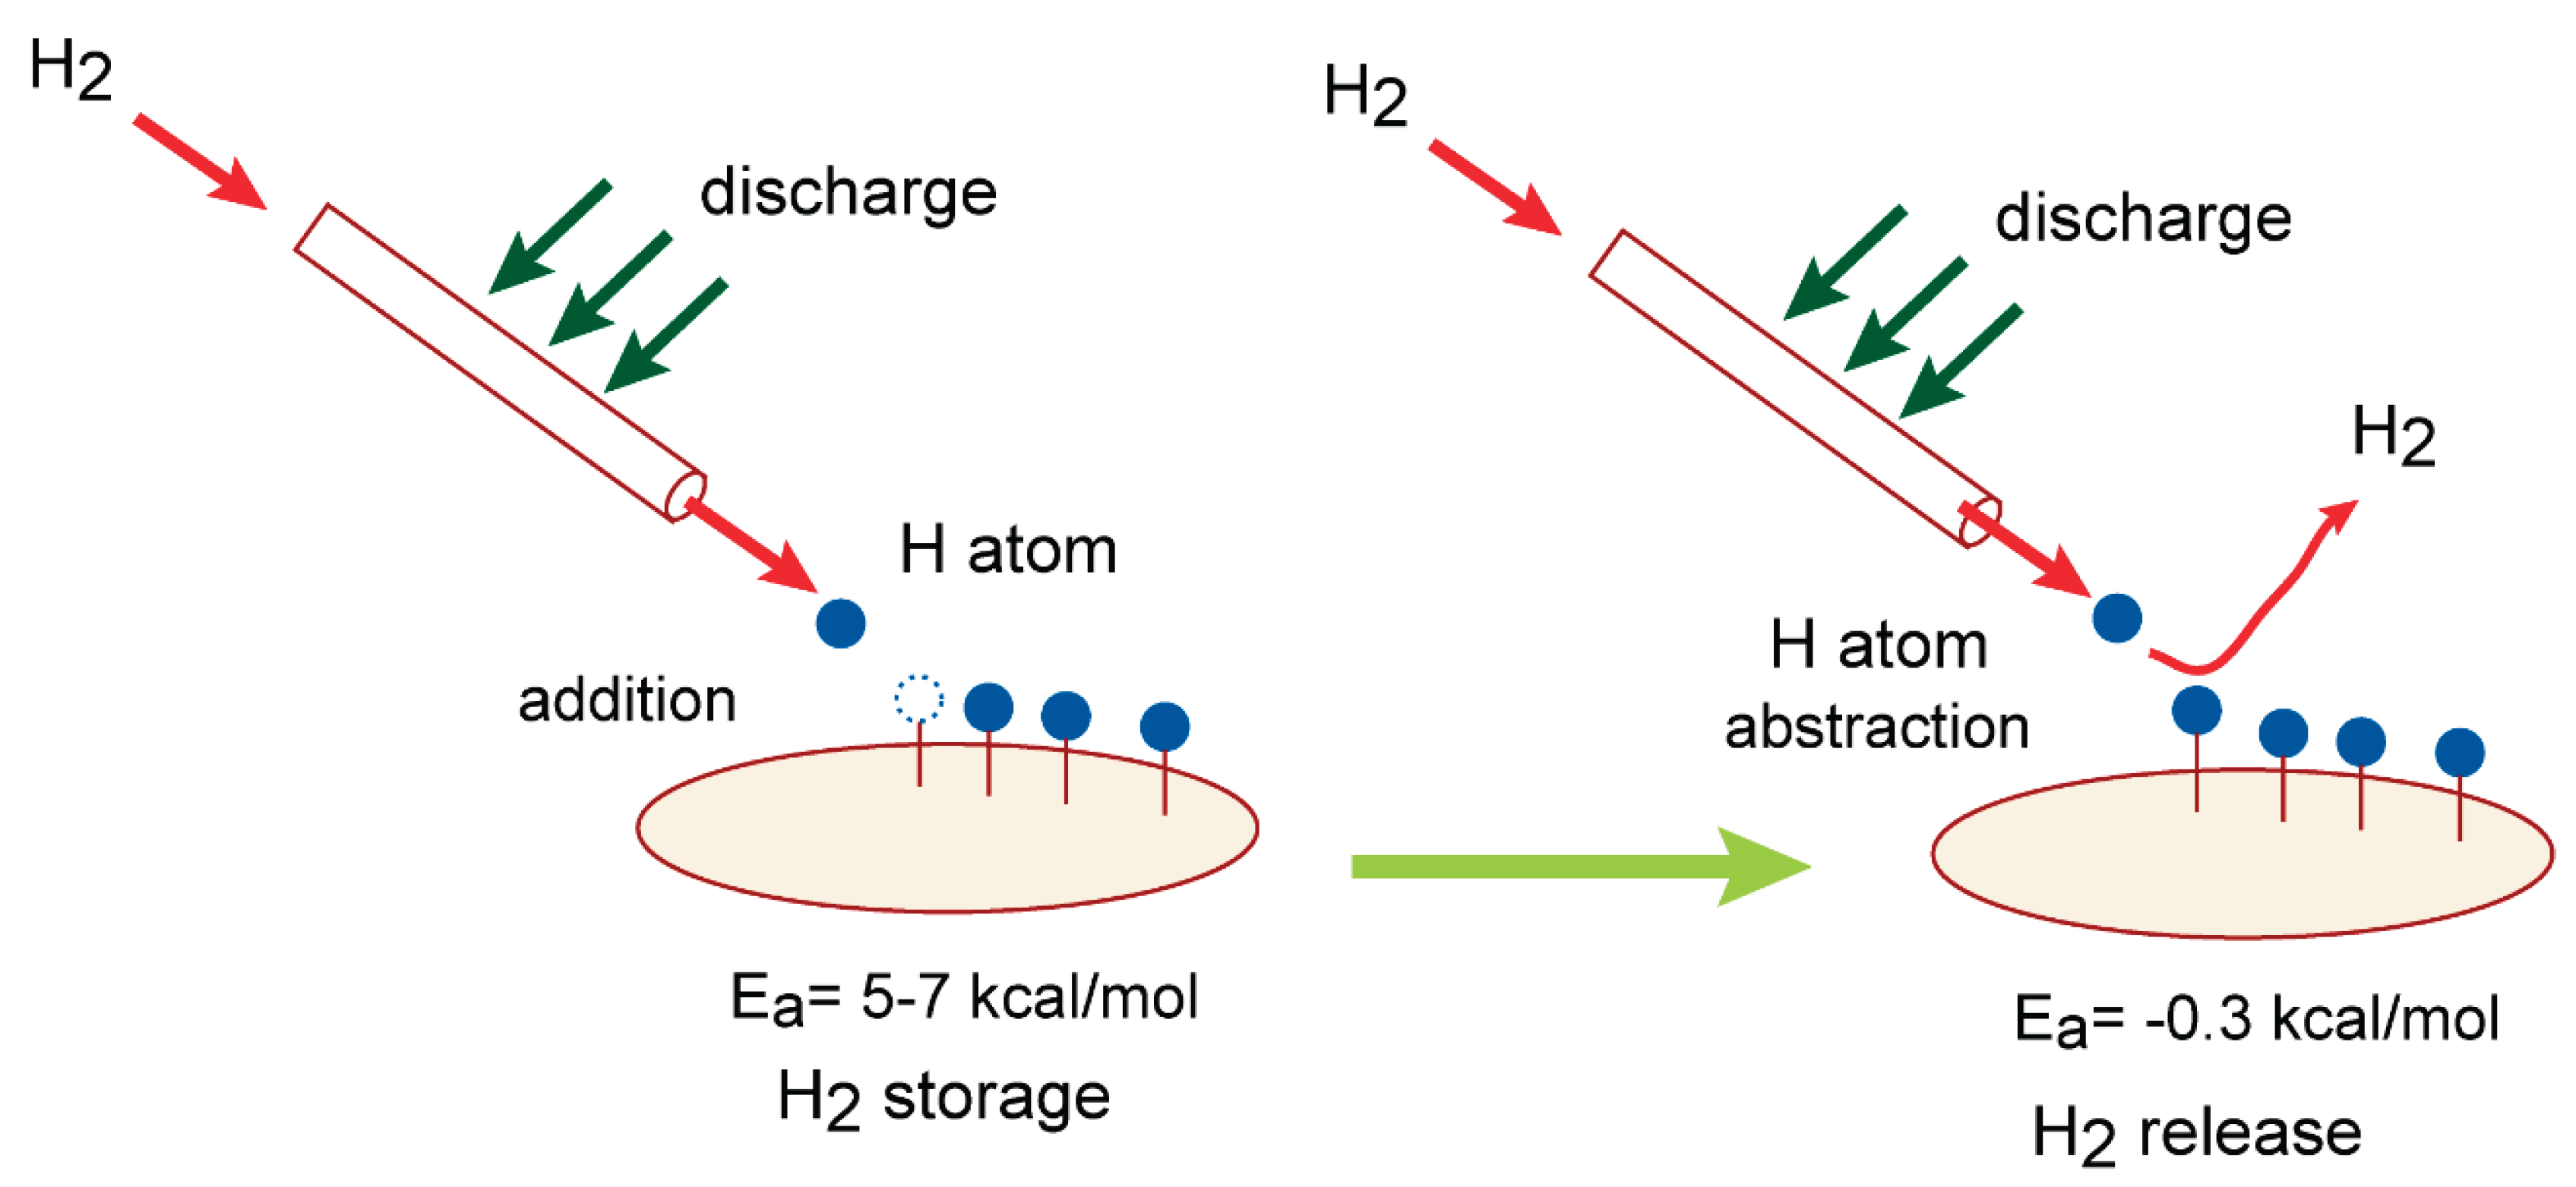

Table 1.
Activation energies for the hydrogen addition reaction (Ea in kcal/mol), GR(n) + H → GR(n)-H, calculated at the CAM-B3LYP or APFD/6-311G(d,p) levels.
Table 1.
Activation energies for the hydrogen addition reaction (Ea in kcal/mol), GR(n) + H → GR(n)-H, calculated at the CAM-B3LYP or APFD/6-311G(d,p) levels.
| n | CAM-B3LYP/6-311G(d,p) | APFD/6-311G(d,p) |
|---|---|---|
| 4 | 6.8 | 5.7 |
| 7 | 6.6 | 5.6 |
| 14 | 5.6 | 4.9 |
| 19 | 6.2 | 5.3 |
Disclaimer/Publisher’s Note: The statements, opinions and data contained in all publications are solely those of the individual author(s) and contributor(s) and not of MDPI and/or the editor(s). MDPI and/or the editor(s) disclaim responsibility for any injury to people or property resulting from any ideas, methods, instructions or products referred to in the content. |
© 2025 by the authors. Licensee MDPI, Basel, Switzerland. This article is an open access article distributed under the terms and conditions of the Creative Commons Attribution (CC BY) license (http://creativecommons.org/licenses/by/4.0/).
Copyright: This open access article is published under a Creative Commons CC BY 4.0 license, which permit the free download, distribution, and reuse, provided that the author and preprint are cited in any reuse.


