
Submitted:
29 July 2025
Posted:
31 July 2025
You are already at the latest version
Abstract
We determine the efficiency of singlet oxygen generated through a Raman excitation process in aerated distilled water. Focused nanosecond light pulses in the spectral blue region induce Raman transition toward the singlet oxygen state, generating a Stokes signal in the red spectral region. The signal is proportional to the number of photons corresponding to the amount of excited oxygen molecules. We calculate the efficiency by dividing the number of generated singlet oxygen molecules by the number of incoming pumping photons. We determine an efficiency of (8±2) 10-5 for water when pumping at 410 nm with a pulse energy of 13 mJ. We demonstrate that the Raman method exhibits no photobleaching, a phenomenon typically observed when photosensitizers are used. Thanks to this property, Raman excitation continues as long as the sample is irradiated, generating more singlet oxygen molecules over time than the photosensitization method.
Keywords:
Raman spectroscopy
; singlet oxygen photoexcitation
; efficiency of the Raman generated singlet oxygen
1. Introduction
Singlet oxygen (1O2) corresponds to the lowest excited electronic quantum level of molecular oxygen. In this state, the molecule is highly electrophilic, which is the basis for its broad applications in photochemistry, photobiology, and photomedicine [1-5]. Quantum mechanics forbids direct one-photon excitation toward the 1O2 state, resulting in a low transition probability. Photosensitization is the general method for efficient 1O2 photoproduction [6-7]. A large photosensitizer molecule absorbs visible (VI) light, accumulating the absorbed energy on a triple metastable level. From there, the energy is transmitted to surrounding oxygen molecules, exciting the 1O2 state. We have recently demonstrated a photosensitizer-free 1O2 photoexcitation based on the Raman effect [8-10]. A pumping photon produces a Raman transition from ground toward the 1O2 level, emitting a Stokes photon of lower energy. The difference between the pumping and Stokes photon energies is equal to the energy needed for the transition. The lack of use of the photosensitizer simplifies the procedures and prevents potential secondary effects, like excessive photosensitivity or unexpected phototoxicity. In a recent publication, we demonstrated the detection of phosphorescence at 1270 nm from the Raman photoexcited 1O2 [10]. However, determining the efficiency of the process (ΦΔ) is still a task to be completed. The present work eliminates the gap. We define ΦΔ as the relation between the number of Raman-generated 1O2 molecules and the total number of pumping photons. We measure ΦΔ of (8±2) 10-5 in distilled water (H2O) when pumping at 410 nm with nanosecond pulses of an energy of 13 mJ.
Furthermore, we compare the Raman approach with the photosensitization method using the well-known photosensitizer, Rose Bengal. The 1O2 chemical trap, uric acid, is used to evaluate both methods. We show that, over time, the Raman method generates more 1O2 molecules than the photosensitization method. Rose Bengal exhibits near-full photobleaching after sixty minutes of irradiation, interrupting 1O2 photoproduction. In the Raman method, photobleaching does not take place. Consequently, the Raman 1O2 generation continues without interruption even after hours of irradiation.
2. Theoretical Considerations
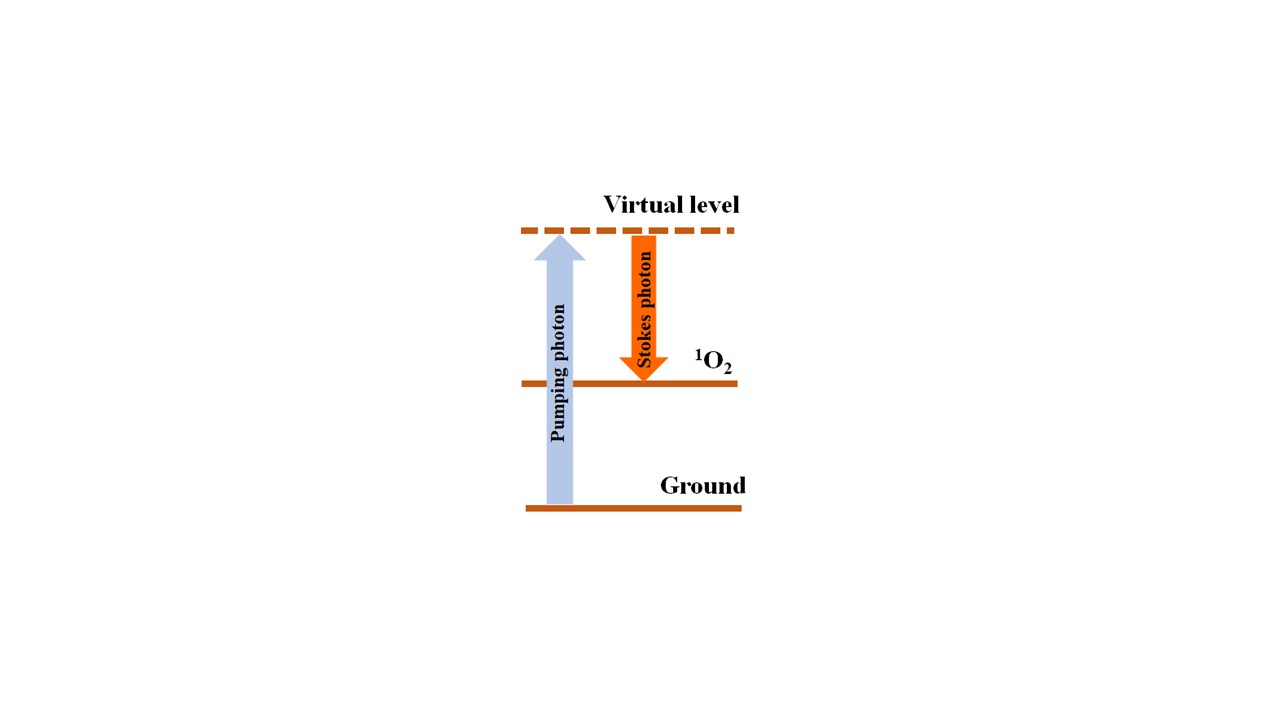
Figure 1a shows a simplified schematic of 1O2 Raman excitation. A pumping photon induces a Raman transition from the ground toward the 1O2 level, emitting a Stokes photon. For example, when pumping at 410 nm in H2O, the 1O2 Stokes component occurs around 605 nm. The magnitude of this signal yields a direct measurement of the amount of excited 1O2 molecules. Other Stokes photons related to the excitation of solvent vibrational modes and their overtones are generated. When pumping at 410 nm, the H2O stretching vibrational mode produces a Stokes component at 475 nm. An additional overtone of this Stokes signal is also observed at 566 nm. The difference in wavelength between the Stokes components allows for their identification and separation using optical filters. Experiments below demonstrate that most of the energy involved in the Raman process originates from the solvent stretching modes. Despite this fact, the 1O2 Stokes can still be detected, showing that a significant amount of 1O2 molecules is still being generated.
In the photosensitization method, the photosensitizer’s quantum yield measures the efficiency of 1O2 photoproduction [11-15]. The photosensitizer’s quantum yield is defined as the number of excited oxygen molecules divided by the number of photons absorbed by the photosensitizer. The commonly used photosensitizer Rose Bengal exhibits a quantum yield value of 0.76 at 532 nm in H2O [15-16]. As discussed above, for the Raman method, ΦΔ is defined by the equation
where NΔ and Np are the number of 1O2 Stokes and pumping photons, respectively. The number of photons can be estimated by measuring the signal energy corresponding to each process divided by the energy of one photon. Then, we can write
where is the averaged 1O2 Stokes wavelength, EΔ is its energy, λp is the pump wavelength, and Ep is its energy.
2. Materials and Methods
Figure 1b shows the experiment setup. An optical parametric oscillator (OPO, OPOTEK, Carlsbad, CA, US) provides 6-nanosecond excitation in the blue-green region (410-520 nm) with an average energy per pulse of 14 mJ. A beam splitter B deviates part of the light toward a reference detector. A 20 cm focal length lens L1 focuses the pump light onto a 10 cm path-length glass cuvette containing the sample. A neutral filter (NDF1) placed at the exit of the sample significantly reduces the power to avoid optical damage to the filters. A lens L2 focuses the resulting signal onto the detector. An additional neutral density filter, NDF2, is placed at the entrance of the detector, reducing the signal intensity to avoid detector saturation. To detect the signal, we use a silicon detector (Thorlabs DET100A2, Newton, NJ, US) with a responsivity of 0.2 A/W at 410 nm and 0.4 A/W at 610 nm and a rise time of 35 ns.
The silicon detector signal is sent without further amplification toward a digital oscilloscope (TDS 3052, Tektronix, Beaverton, OR, US) for averaging and display. The oscilloscope averages 512 pulses, providing a stable signal proportional to the emitted luminescence. Due to their Raman character, the Stokes signals follow the time dependence of the pump pulse. Since the detector risetime is longer than the excitation pulse, the signal time evolution is limited by it. To calibrate the signal provided by the silicon sensor, we use calibrated detectors. To measure pulse energies above 100 μJ, we use a pyroelectric energy meter (PE25BF-DIF-C, Ophir USA, Newport Corporation, North Logan, UT, US). For measuring energies below 100 μJ, we use a diode power meter (Thorlabs PM100, Newton, NJ, US).
We detect the pump signal using the corresponding interference filter. When pumping at 410 nm, we use an interference filter at (410±10) nm. The 1O2 Stokes signal is measured using a long-pass filter. When pumping at 410 nm, we use a filter with a cutoff at 610 nm. Below, we show that the collected signal corresponds to the amount of 1O2 molecules. The Stokes signals from the solvent stretching modes are evaluated in a similar manner.
Aerated distilled H2O in 20 cm and 10 cm pathlength glass cuvettes was used as a sample. We use solutions of sodium bisulfite (NaHSO3) as an oxygen quencher to aid in identifying the oxygen contribution [17]. The concentration of dissolved oxygen in H2O decreases when the NaHSO3 concentration increases. Water solutions of NaHSO3 exhibit a reduced 1O2 Stokes signal, as it corresponds to a reduced oxygen concentration. To measure the amount of oxygen in the solutions, we used an oxygen optical sensor (Vernier Optical DO Probe, Vernier, Beaverton, OR).
We used uric acid as a 1O2 chemical trap to compare the efficiency of the photosensitization and Raman methods. The uric acid UV absorbance at 294 nm is a direct measurement of the amount of 1O2 being generated [18-19]. We use Rose Bengal as a photosensitizer. A solution of 10 μM Rose Bengal in H2O was prepared.
To collect spectra of the Stokes signals, we use a spectrometer (red Tide USB 650, Ocean Optics, Orlando, FL).
4. Results and Discussion
The solvent Stokes contributions are significant, but they can be eliminated using optical filters. Figure 2a shows the spectra collected using the Ocean Optics spectrometer after passing through neutral filters with a total optical density of six when pumping distilled water at 410 nm. The first peak at 410 nm corresponds to the pumping field. The peak at 475 nm corresponds to the H2O stretching mode at a frequency of 3350 cm-1 [20-23]. This mode is the dominant part of the total Stokes field.
Figure 2b shows the spectrum after using a neutral density filter with an optical density of two and a long-pass filter with a cutoff at 550 nm. A diminished Stokes peak at 475 nm and a peak at 566 nm are observed. The last peak corresponds to the first overtone of the H2O vibrational mode at 6700 cm-1. When using a neutral density filter with an optical density of one and a long-pass filter with a cutoff at 610 nm, the solvent Stokes components at 475 nm and 566 nm are fully depleted (see Figure 2c). The arbitrary units in all figures (2a, 2b, and 2c) are the same. Thus, the signal depicted by Figure 2c is four orders of magnitude smaller than the signal shown on Figure 2a and one order of magnitude smaller than the signal shown on Figure 2b. To demonstrate that the curve shown in Figure 2c is oxygen-dependent, we reduce the oxygen concentration using the oxygen quencher NaHSO3.
Figure 3a shows the singlet peak obtained when using the long-pass filter at 610 nm for different concentrations of NaHSO3. The blue line corresponds to the condition where no NaHSO3 is added. As the NaHSO3 concentration increases, the signal decreases. At a concentration of 40 mg/ml, the signal has been significantly reduced. Using the optical oxygen sensor, we measure the oxygen concentration in each sample solution. Figure 3b shows how the oxygen concentration decreases as the NaHSO3 concentration increases. A nearly linear dependence is observed for concentrations below 10 mg/ml. Figure 3 shows that the observed Stokes signal collected using the 610 nm long-pass filter is oxygen-dependent. Its amplitude provides a direct measurement of the amount of 1O2 molecules being generated in the process. We note that the H2O Stokes components are not affected by the presence of NaHSO3.
Figure 4a shows the pulse energy corresponding to the excitation pump light (blue light). The signal was collected using the diode detector and energy sensor for calibration purposes. We use an interference filter at (410±10) nm to select only the pump light. Using an interference filter at (475±10) nm, we collect a Stokes signal corresponding to the H2O stretching mode at 3350 cm-1 (red line in figure 4a). A significant portion of the pump field, (23±1) %, is converted into this Stokes component. The standard deviation is estimated over 10 experiments. We also measured the contribution from the overtone at 566 nm using the corresponding filter, which accounted for (0.25±0.01) % of the total incoming light. The 1O2 Stokes contribution is significantly smaller. Figure 4b shows the 1O2 Stokes signal, together with the pumping signal, on a logarithmic scale. We estimated a pulse energy of (0.7±0.2) μJ. Under these conditions, equation (2) provides ΦΔ=(8±2) 10-5. Using these values, we estimate that each pulse of pumping light generates approximately 4 1011 1O2 molecules.
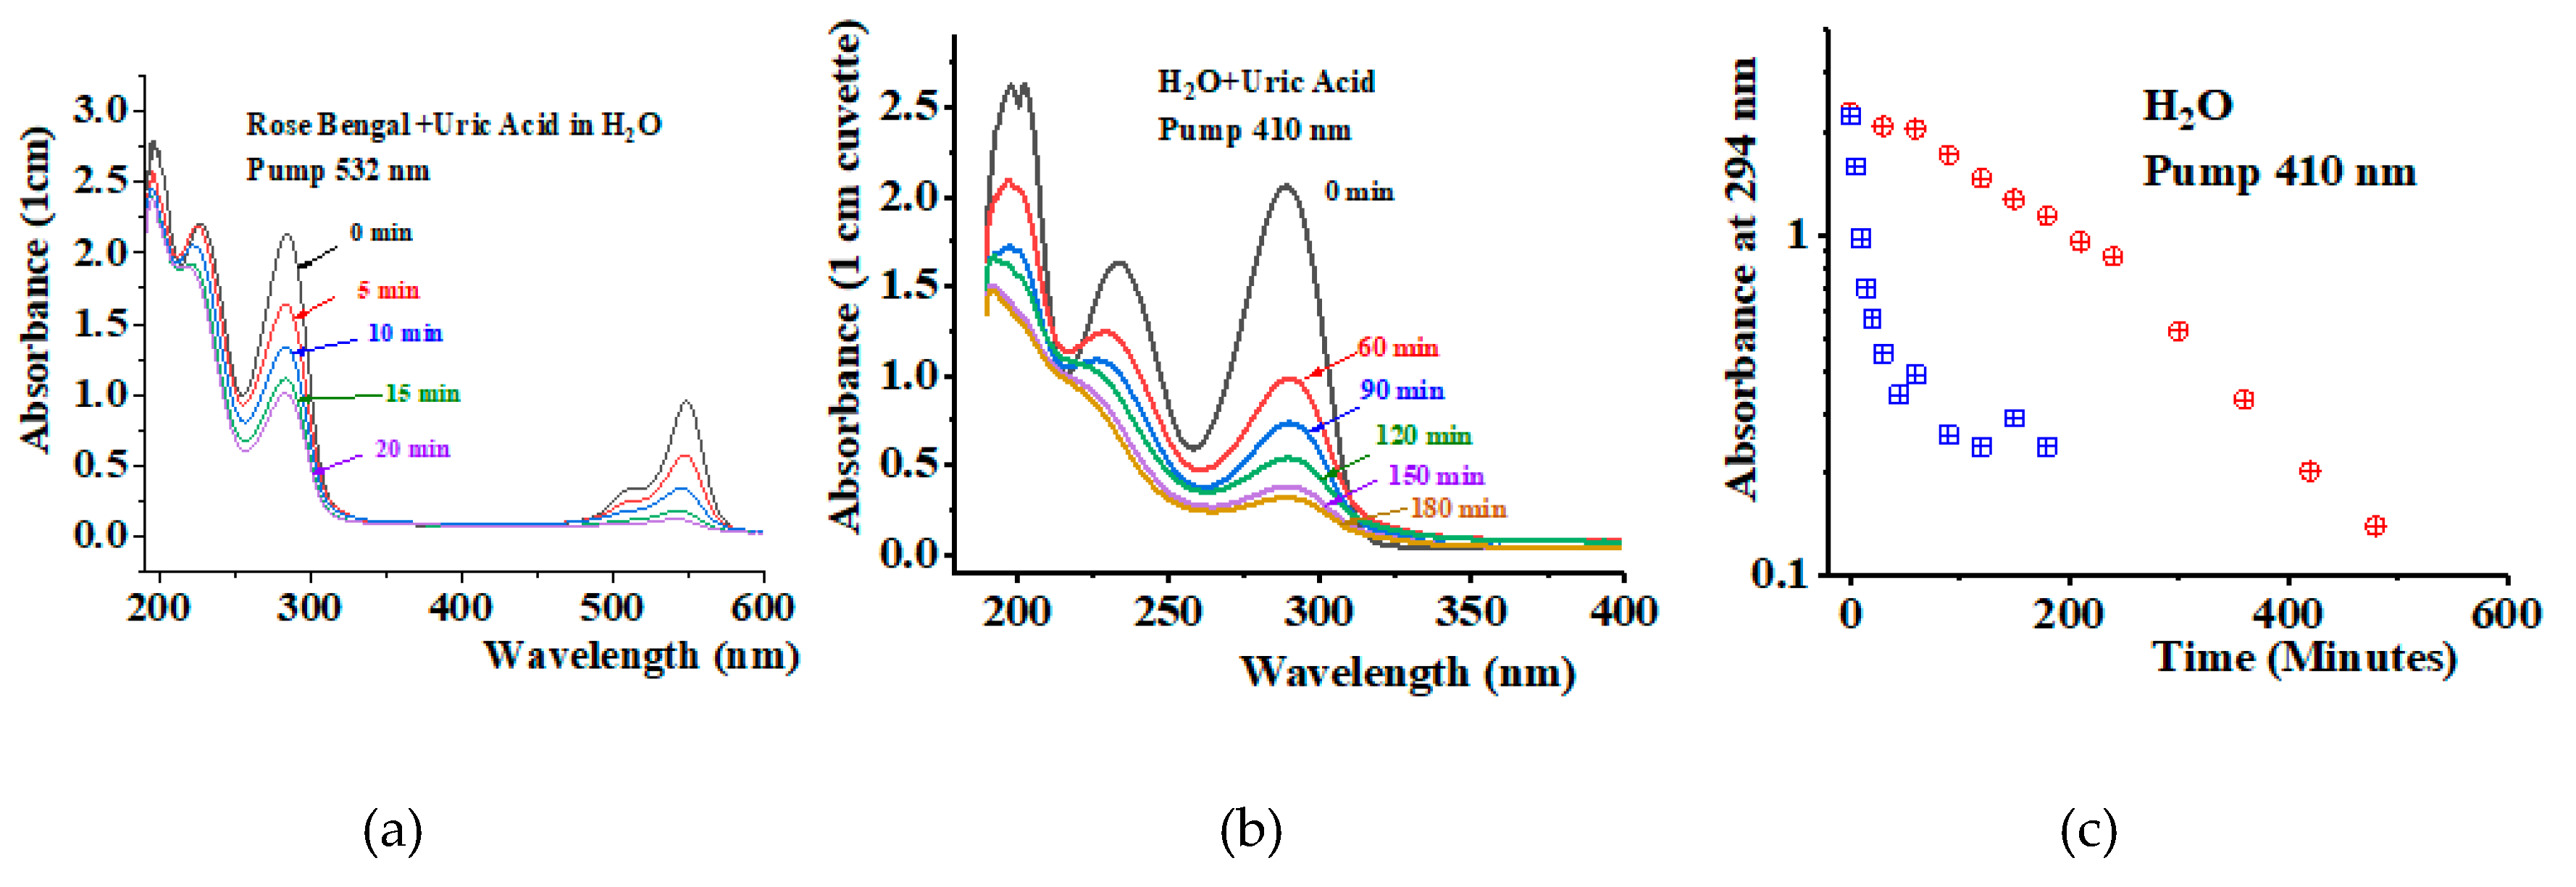
To understand the potential practical applications of the Raman method, we compare it with the conventional photosensitization method. We use the well-known photosensitizer Rose Bengal for this purpose. We prepare solutions of Rose Bengal in H2O at a concentration of 10 μM. We also use uric acid at a concentration of 120 μM as a 1O2 chemical trap to monitor the amount of 1O2 being generated in each method. We irradiate the Rose Bengal and uric acid solution at 532 nm in five-minute intervals. At the end of each interval, we measure the UV spectrum of the solution to monitor the amplitude of the peak at 294 nm.
Figure 5a shows the UV-VI absorbance spectra of the Rose Bengal solution containing uric acid at a concentration of 120 μM, measured for different irradiation times. We observe a reduction in the uric acid peak at 294 nm, corresponding to the depletion of 1O2 generated by the uric acid. The peak depletes by a factor of four after twenty minutes but does not entirely disappear. The spectra also show the Rose Bengal absorbance peak around 540 nm. This peak also decreases, evidencing photobleaching. Due to the photobleaching of Rose Bengal, the process of 1O2 generation stops. Figure 5b shows results obtained for a solution of uric acid with no photosensitizer in H2O. In this experiment, irradiation is performed at 410 nm over longer time intervals: 60, 90, 120, and up to 480 minutes. Again, we observe depletion of the uric acid peak at 294 nm, evidencing the Raman generation of 1O2 molecules. No photobleaching effect is observed in the Raman experiment, resulting in a more complete reduction of the 294 nm peak over time. Figure 5c shows the uric acid absorbance at 294 nm as a function of irradiation time for both experiments. For the Rose Bengal solution, the uric acid absorbance at 294 nm decreases from an initial value of 2.3 to 0.3 after 20 minutes of irradiation. It remains around this value for the rest of the experiment. For the Raman experiment, the peak reduces from 2.3 to a value around 0.1 after 400 minutes of irradiation. The Rose Bengal experiment exhibits a fast photoproduction of 1O2. However, due to photobleaching of the photosensitizer, the process is not fully complete. In the Raman experiment, the 1O2 photoproduction is less effective. However, because of the absence of photobleaching, the 1O2 photoexcitation persists as long as the sample is being irradiated.
5. Conclusions
We have estimated the efficiency of the 1O2 Raman photogeneration in H2O by measuring the signal amplitude of the 1O2 Stokes signal. Defining the efficiency as the relation between the number of photogenerated 1O2 molecules divided by the number of pumping photons, we determine an efficiency of (8±2) 10-4 for H2O at 410 nm. We compare the Raman method with the photosensitization method using Rose Bengal as a photosensitizer. The photosensitizer generates 1O2 molecules rapidly, but the process eventually stops due to photobleaching of the photosensitizer. The Raman method generates 1O2 molecules at a rate slower than the photosensitization methods. However, thanks to the intrinsic absence of photobleaching, the Raman method generates more 1O2 molecules over time than the photosensitization method, despite its low efficiency values. The efficiency of the Raman method can be enhanced based on the fundamental principles of Raman interaction. Raman lasers, Raman amplifiers, and Raman fiber sensors are based on these principles [23-25]. Stokes signal grows exponentially with distance. The gain depends on the pumping field intensity, the nonlinear Raman susceptibility, and the propagation losses. A system should be designed to provide a significant gain for the 1O2 Stokes component with low losses, while maintaining low gain and substantial losses for the solvent Stokes components. These considerations may play a crucial role in improving the 1O2 Raman photogeneration efficiency for practical applications of the Raman approach. One useful application is the purification of water caused by viruses or bacteria. In a previous communication, we demonstrated the deactivation of viruses in an aqueous environment through simple irradiation with blue light, without the use of photosensitizers [26].
Funding
The research was sponsored by the Air Force Office of Scientific Research and was accomplished under Grant Number W911NF-23-1-0245. The views and conclusions are those of the author and should not be interpreted as representing the official policies, either expressed or implied, of the Air Force Office of Scientific Research or the US Government. The US Government is authorized to reproduce and distribute reprints for Government purposes, notwithstanding any copyright notation herein.
Data Availability Statement
Al relevant data are within the paper.
Conflicts of Interest
“The author declares no conflicts of interest.”
References
- Singlet Oxygen: Applications in Biosciences and Nanosciences, Volume 2 - Comprehensive Series in Photochemical & Photobiological Sciences, Volume 14, 1st ed.; S. Nonell, C. Flors, editors. Cambridge, UK: Royal Society of Chemistry, Thomas Graham House, 2016.
- Pibiri, I.; Buscemi, S.; Palumbo Piccionello, A.; Pace, A. Photochemically Produced Singlet Oxygen: Applications and Perspectives. ChemPhotoChem 2018, 2(7), 535–547. [Google Scholar] [CrossRef]
- DeRosa, M.C.; Crutchley, R.J. Photosensitized Singlet Oxygen and its Applications. Coordination Chem. Rev 2002, 233-234, 351–371. [Google Scholar] [CrossRef]
- Sobotta, L.; Skupin-Mrugalska, P.; Mielcarek, J.; Goslinski, T.; Balzarini, J. Photosensitizers Mediated Photodynamic Inactivation against Virus Particles. Mini Rev. Med. Chem. 2015, 15(6), 503–521. [Google Scholar] [CrossRef] [PubMed]
- Dougherty, T.J.; Gomer, C.J.; Henderson, B.W.; Jori, G.; Kessel, D.; Korbelik, M.; Moan, J.; Peng, Q. “Photodynamic Therapy”. JNCI: J. Nat. Cancer Inst 998, 90, 889–905. [Google Scholar] [CrossRef] [PubMed]
- Frank Kino, F.; Medeiros Silva, G.T. The Photophysics of Photosensitization: A brief overview. J. Photochem. Photobiol. 2021, 7, 100042. [Google Scholar] [CrossRef]
- Michelin, C.; Hoffmann, N. Photosensitization and Photocatalysis - Perspectives in organic Chemistry. ACS Catal. 2018, 8, 12046–12055. [Google Scholar] [CrossRef]
- Marcano Olaizola, A.; Kingsley, D.; Kuis, R. ; A. Johnson, A. Stimulated Raman Generation of Aqueous Singlet Oxygen without Photosensitizers. J. Photochem. Photobio. B: Bio 2022, 235, 112562. [Google Scholar] [CrossRef] [PubMed]
- Marcano Olaizola, A.; Zerrad, A.; Jenneto, F.; Kingsley, D. “Confirming the Stimulated Raman Origin of Singlet-Oxygen Photogeneration”. J. Raman Spectros. 2024, 2024. 55, 58–64. [Google Scholar] [CrossRef]
- Marcano Olaizola, A. “Near-Infrared Phosphorescence of Raman Photogenerated Singlet Oxygen.” Photochem 2025. 5(1), 7-14. [CrossRef]
- Wilkinson, F.; Helman, W.P; Ross, A.B. Quantum Yields for the Photosensitized Formation of the Lowest Electronically Excited Singlet State of Molecular Oxygen in Solution. J. Phys. Chem. Ref. Data, 1993. 22(1), 113-262.
- Ossola, R.; Jönsson, O.M.; Moor, K.; McNeill, K. Singlet Oxygen quantum yields in environmental waters. Chem. Rev. 2021, 121, 4100–4146. [Google Scholar] [CrossRef]
- Lutkus, L.V.; Rickenbach, S.S.; McCormick, T.M. Singlet Oxygen Quantum Yields Determined by Oxygen Consumption. J. Photochem Photobiol. A: Chemistry 2019, 378, 131–135. [Google Scholar] [CrossRef]
- Morgan, J.; Yun, Y.J.; Ayitou, A.J.L. Estimation of Singlet Oxygen Quantum Yield Using Novel Green-Absorbing Baird-Type Aromatic Photosensitizers. Photochem. Photobiol. 2022, 98, 57–61. [Google Scholar] [CrossRef] [PubMed]
- Szewczyk, G.; Mokrzynski, K. Concentration-Dependent Photoproduction of Singlet Oxygen by Common Photosensitizers. Mol. 2025, 30(5), 1130. [Google Scholar] [CrossRef] [PubMed]
- Murasecco-Suardi, P.; Gassmann, E.; Braun, A.M.; Oliveros, E. Determination of the Quantum Yield of Intersystem crossing of Rose Bengal. Helvetica, 1987. 70, 1760-1773. [CrossRef]
- Salasi, M.; Pojtanabuntoeng, T.; S. Wong, S.; Lehmann, M. Efficacy of bisulfite ions as an oxygen scavenger in monoethylene glycol (at least 20 wt%)/water mixtures. SPE J. 2017. 22(05), 1467–1477.
- R. C. Trivedi, L. Rebar, K. Desal, L. J. Stong, New ultraviolet (340 nm) method for essay of uric acid in serum or plasma. Clin. Chem 1978, 1978. 24, 562–566.
- F. Fisher, G. Graschew, H. J. Sinn, W. Maier-Borst, W. J. Lorenz, P. M, Schlag, A chemical dosimeter for the determination of photodynamic activity of photosensitizers. Clin. Chim. Acta 1998. 274, 89-104.
- Gao, Y.; Gong, N.; Sun, C.; Wang, W.; Men, Z. Stimulated Raman scattering investigation of isotopic substitution H2O/D2O system. J. Mol. Liquids 2020, 297, 11923. [Google Scholar] [CrossRef]
- Sun, Q. The Raman OH stretching bands of liquid water. Vibrational Spectros. 2009, 51(2), 213–217. [Google Scholar] [CrossRef]
- Bertie, J.E.; Lan, Z. Infrared intensities of liquids XX: The intensity of the OH stretching band of liquid water revisited, and the best current values of the optical constants of H2O(l) at 25°C between 15,000 and 1 cm-1," Appl. Spectrosc. 1996, 50, 1047–1057. [Google Scholar] [CrossRef]
- Ozdal, B.; Bahram, J. Demonstration of a Silicon Raman Laser. Opt. Exp. 2004, 12, 5269–5273. [Google Scholar] [CrossRef]
- Rong, H.; Jone, R.; Liu, A.; Cohen, O.; Hak, D.; Fang, A.; Paniccia, M. A Continuous -Wave Raman Silicon Laser. Nature 2005, 433, 725–728. [Google Scholar] [CrossRef] [PubMed]
- Guo, L.; Huang, J.; Chen, Y.; Zhang,B.; Ji, M. Fiber-Enhanced Stimulated Raman Scattering and Sensitive Detection of Dilute Solutions. Biosensors, 2022; 12, 243–254. [Google Scholar]
- Kingsley, D.H.; Kuis, R.; Perez, R.; Basaldua, I.; Burkins, P.; Marcano Olaizola, A.; Johnson, A. Oxygen-dependent laser inactivation of murine norovirus using visible light lasers. Virology Journal 2018. 15:117. [CrossRef]
Figure 1.
(a) Schematic of the Raman excitation of oxygen dissolved in the solvent. (b) Experimental setup showing the optical parametric oscillator (OPO), a beam splitter B, a reference detector Ref, lenses L1 and L2, the sample cuvette, neutral density filters NDF1 and NDF2, an optical filter OF, a silicon detector D, and an oscilloscope.
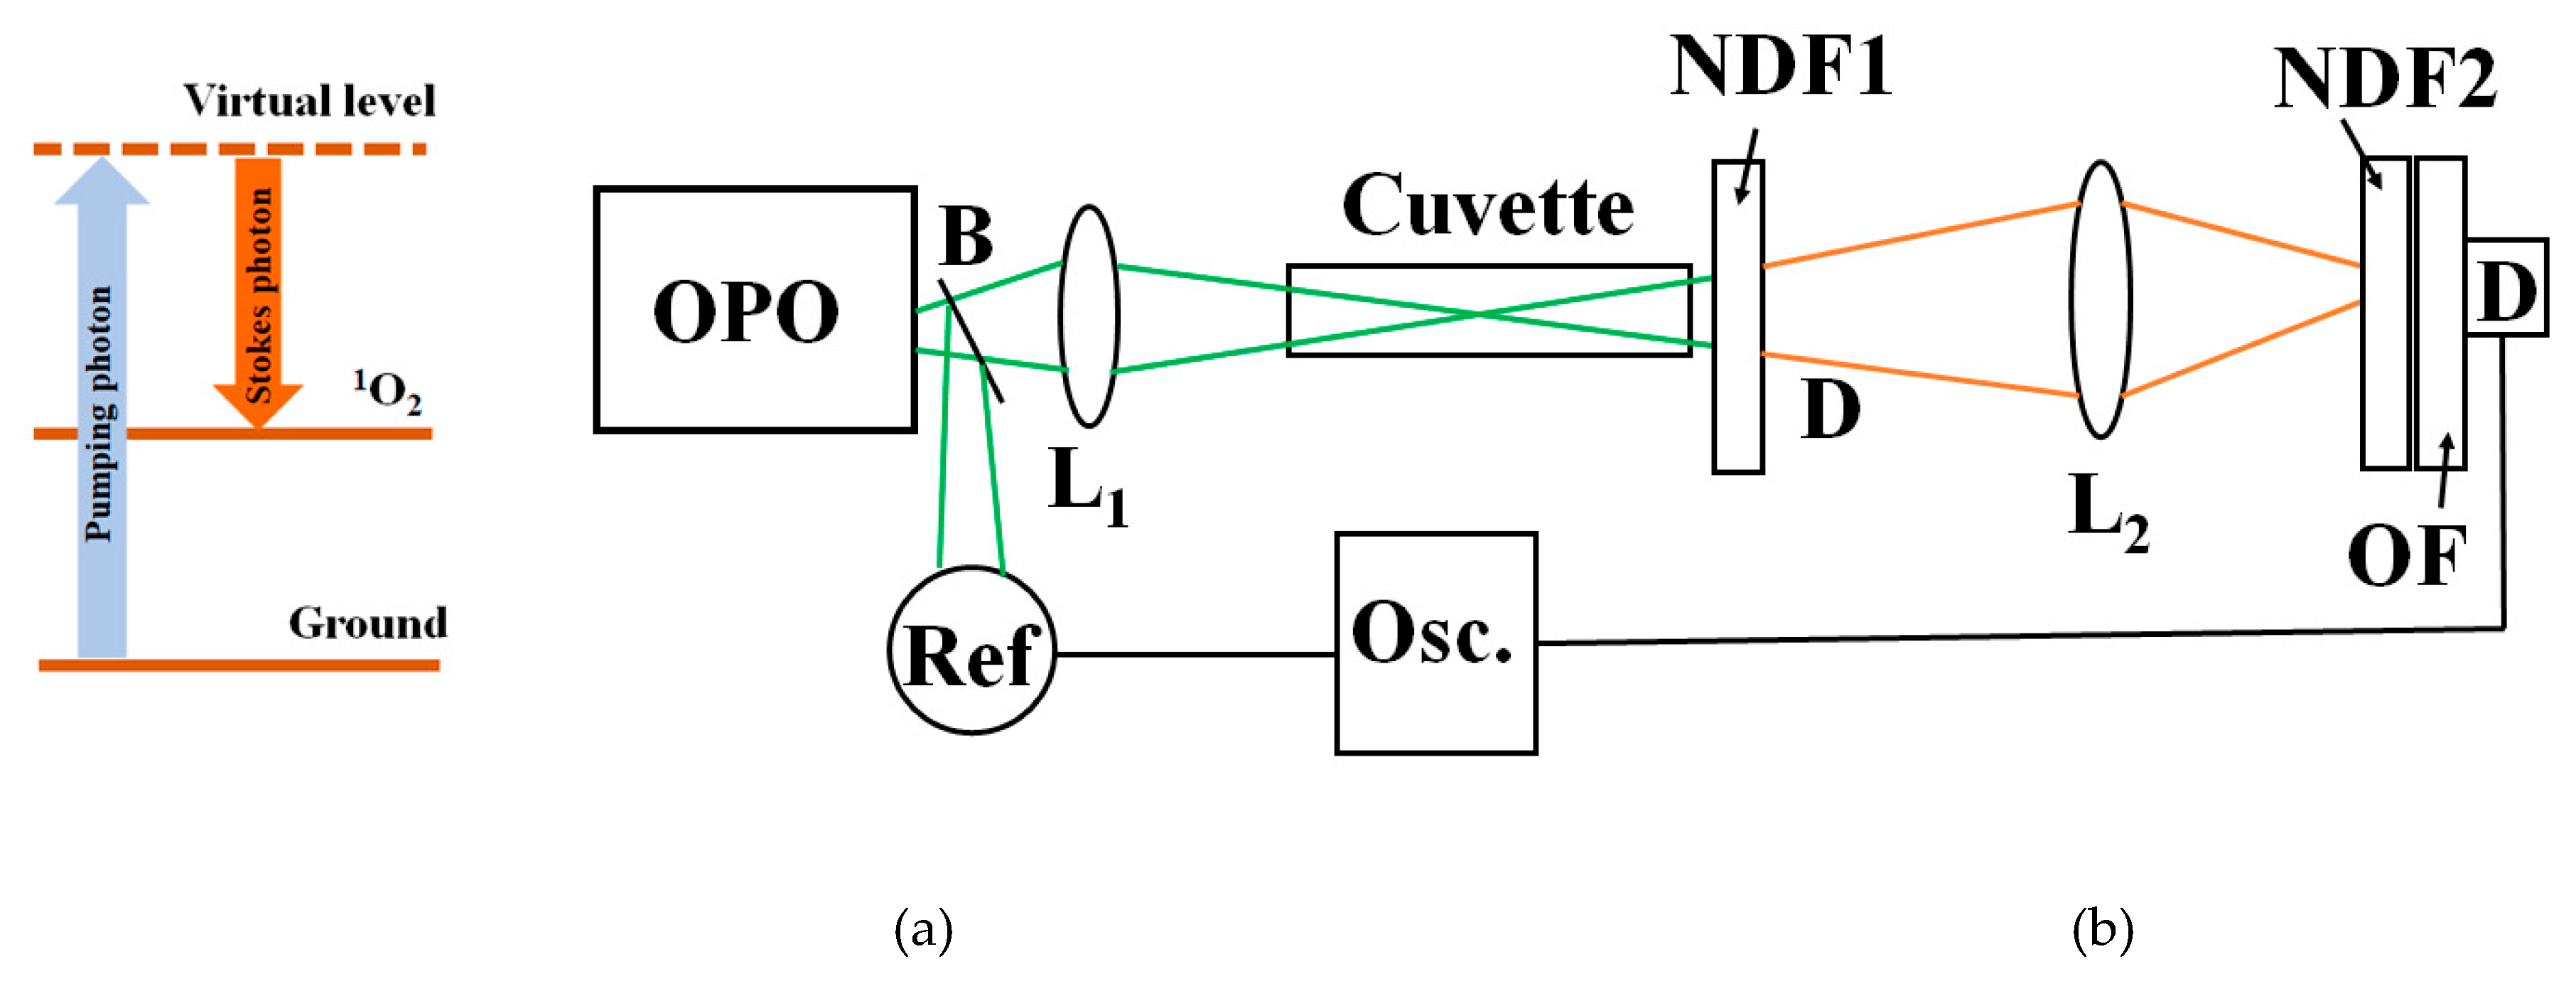
Figure 2.
(a) Raman spectra obtained using neutral filters with an optical density of six. (b) Raman spectra obtained using a neutral density filter with an optical density of two and a longpass filter with a cutoff at 550 nm. (c) Raman spectra obtained using neutral density filters with an optical density of one and a long-pass filter with a cutoff at 610 nm.
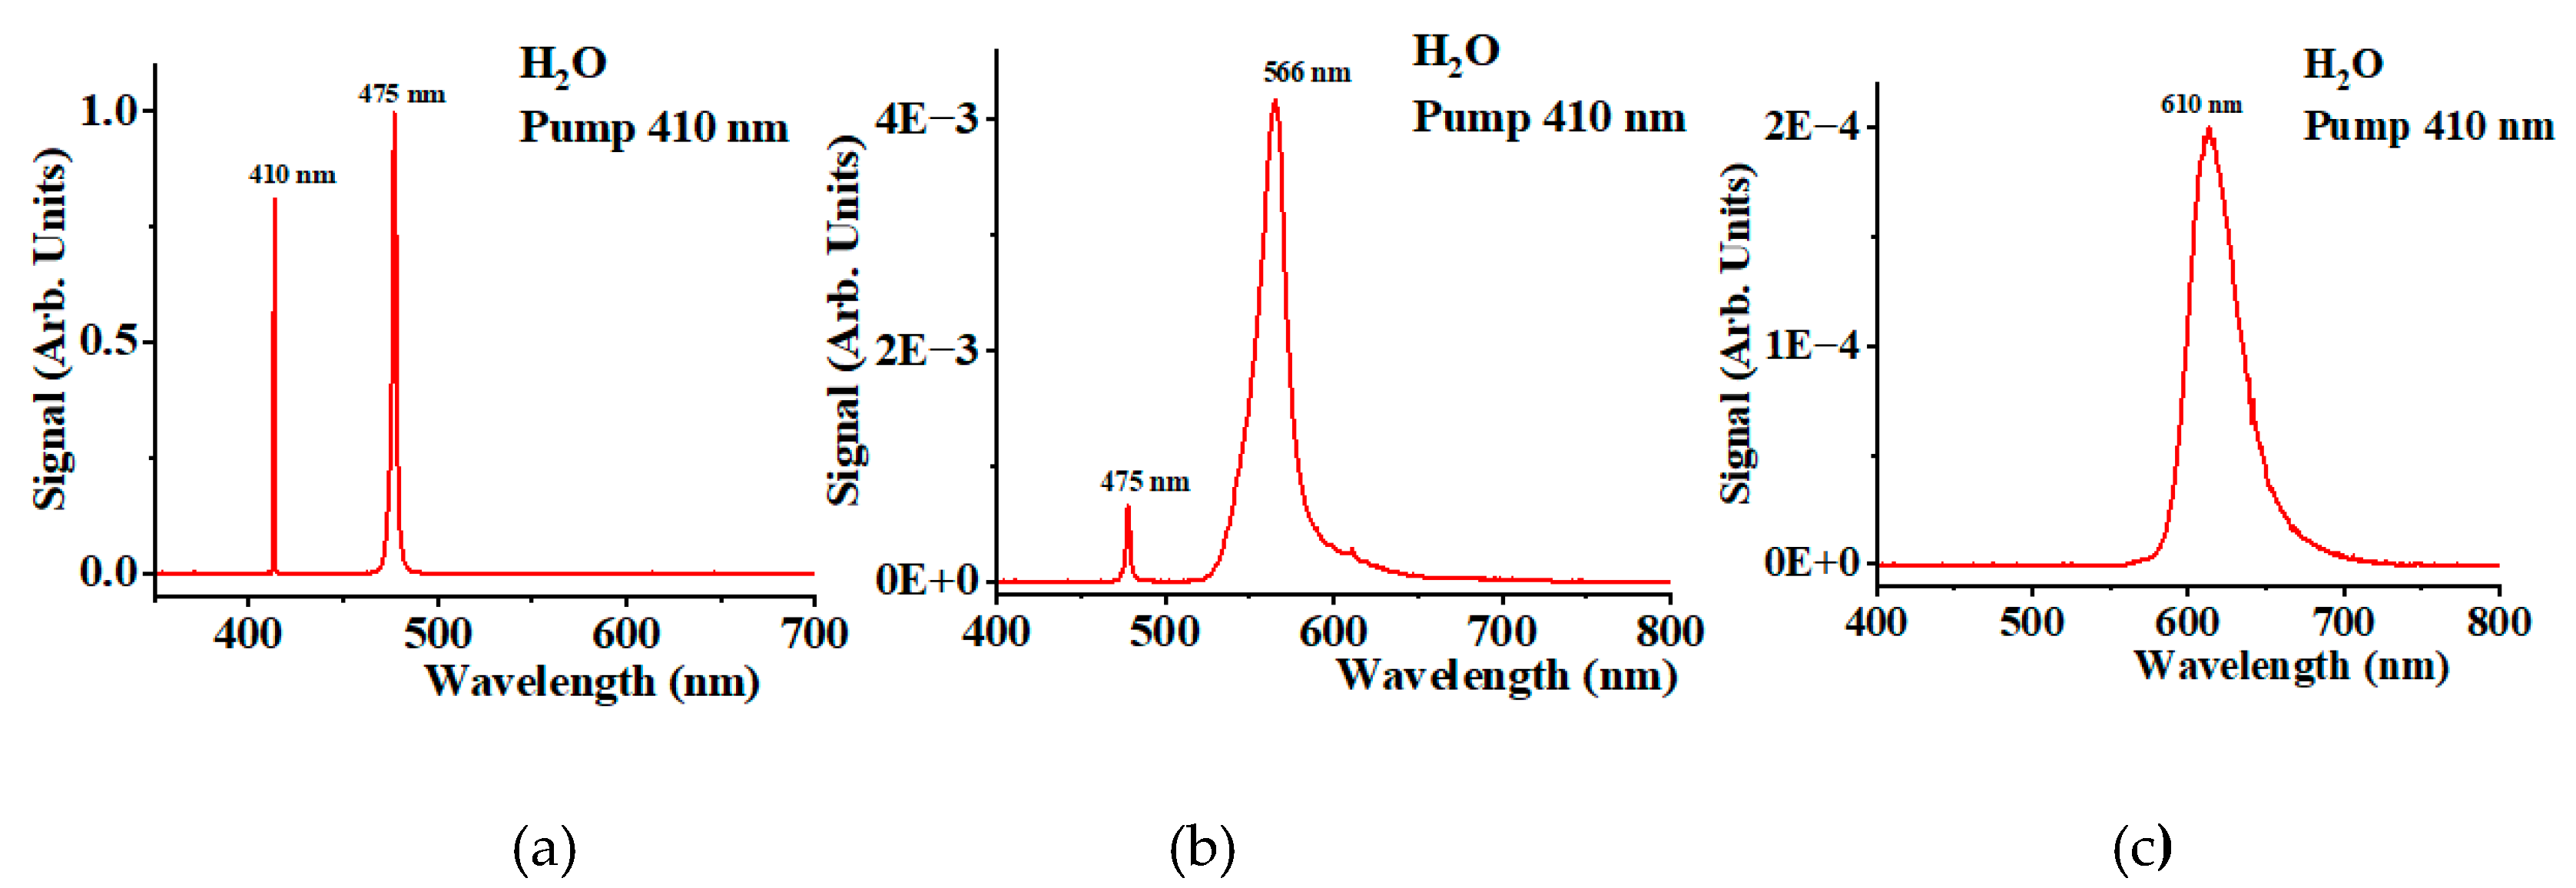
Figure 3.
(a) 1O2 Stokes spectra for solutions of NaHSO3 in H2O at different concentrations. (b) Oxygen concentration as a function of NaHSO3 concentration. .
Figure 3.
(a) 1O2 Stokes spectra for solutions of NaHSO3 in H2O at different concentrations. (b) Oxygen concentration as a function of NaHSO3 concentration. .
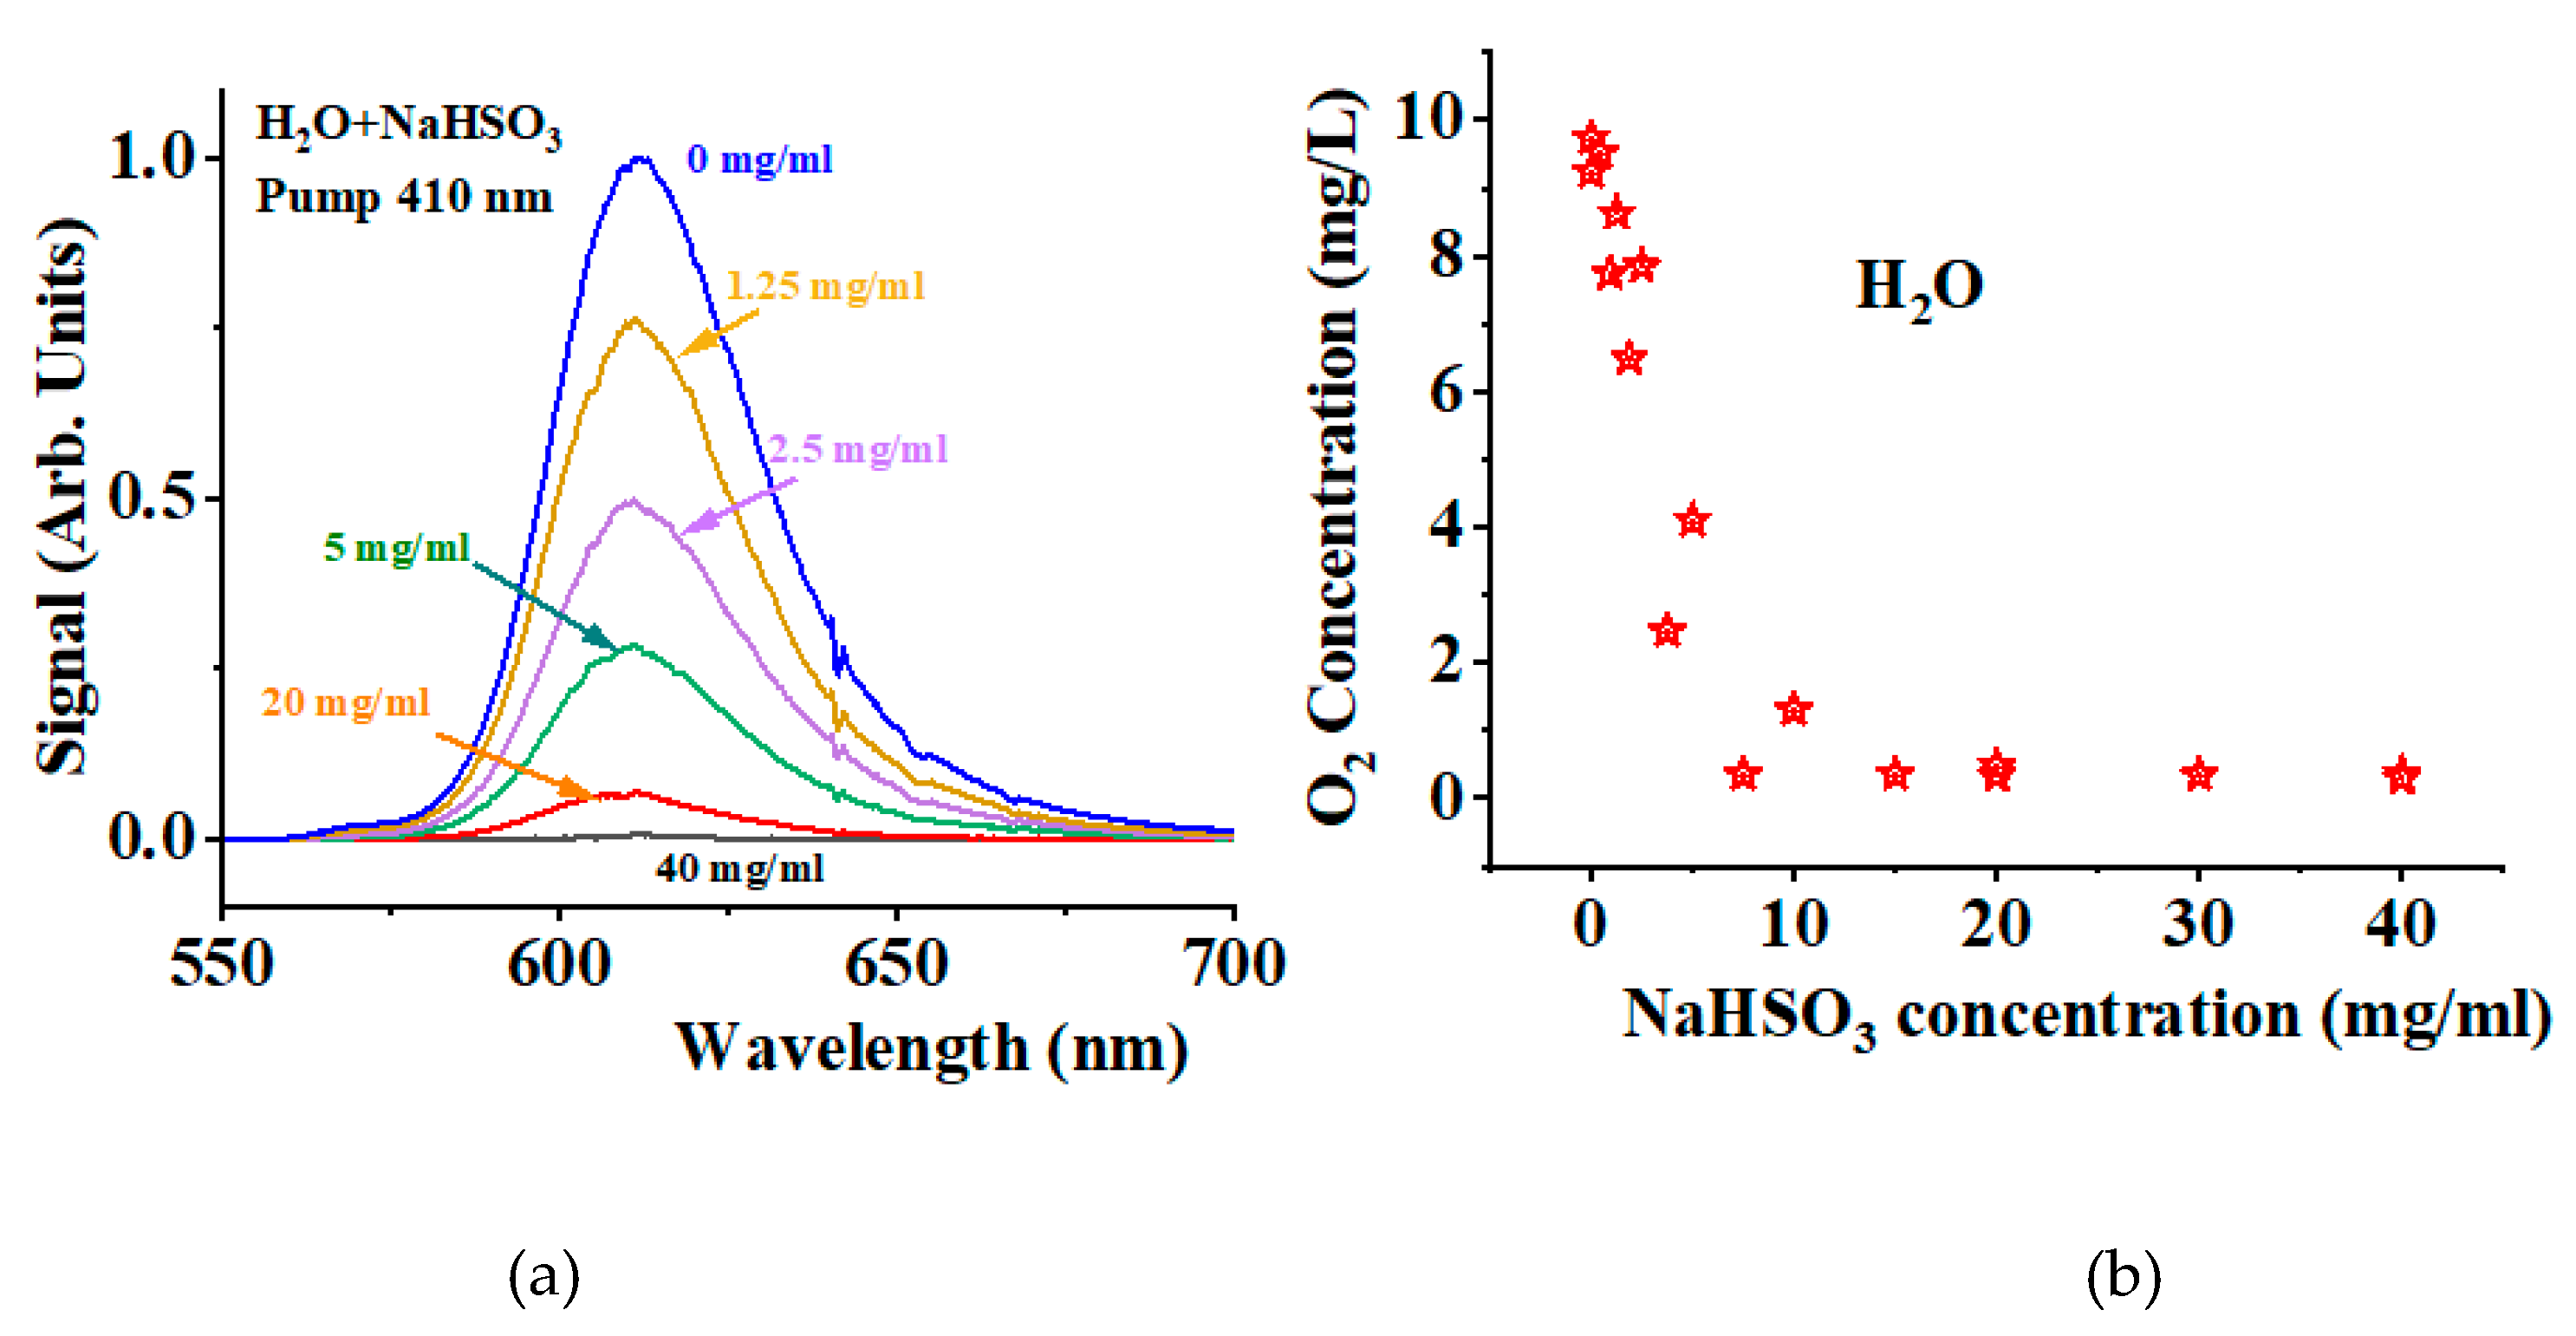
Figure 4.
(a) Pump pulse energy (blue line) and pulse energy of the H2O stretching mode Stokes at 475 nm (red line). (b) Pump pulse energy (blue line) and pulse energy of the 1O2 Stokes at 610 nm, plotted on a logarithmic scale.
Figure 4.
(a) Pump pulse energy (blue line) and pulse energy of the H2O stretching mode Stokes at 475 nm (red line). (b) Pump pulse energy (blue line) and pulse energy of the 1O2 Stokes at 610 nm, plotted on a logarithmic scale.
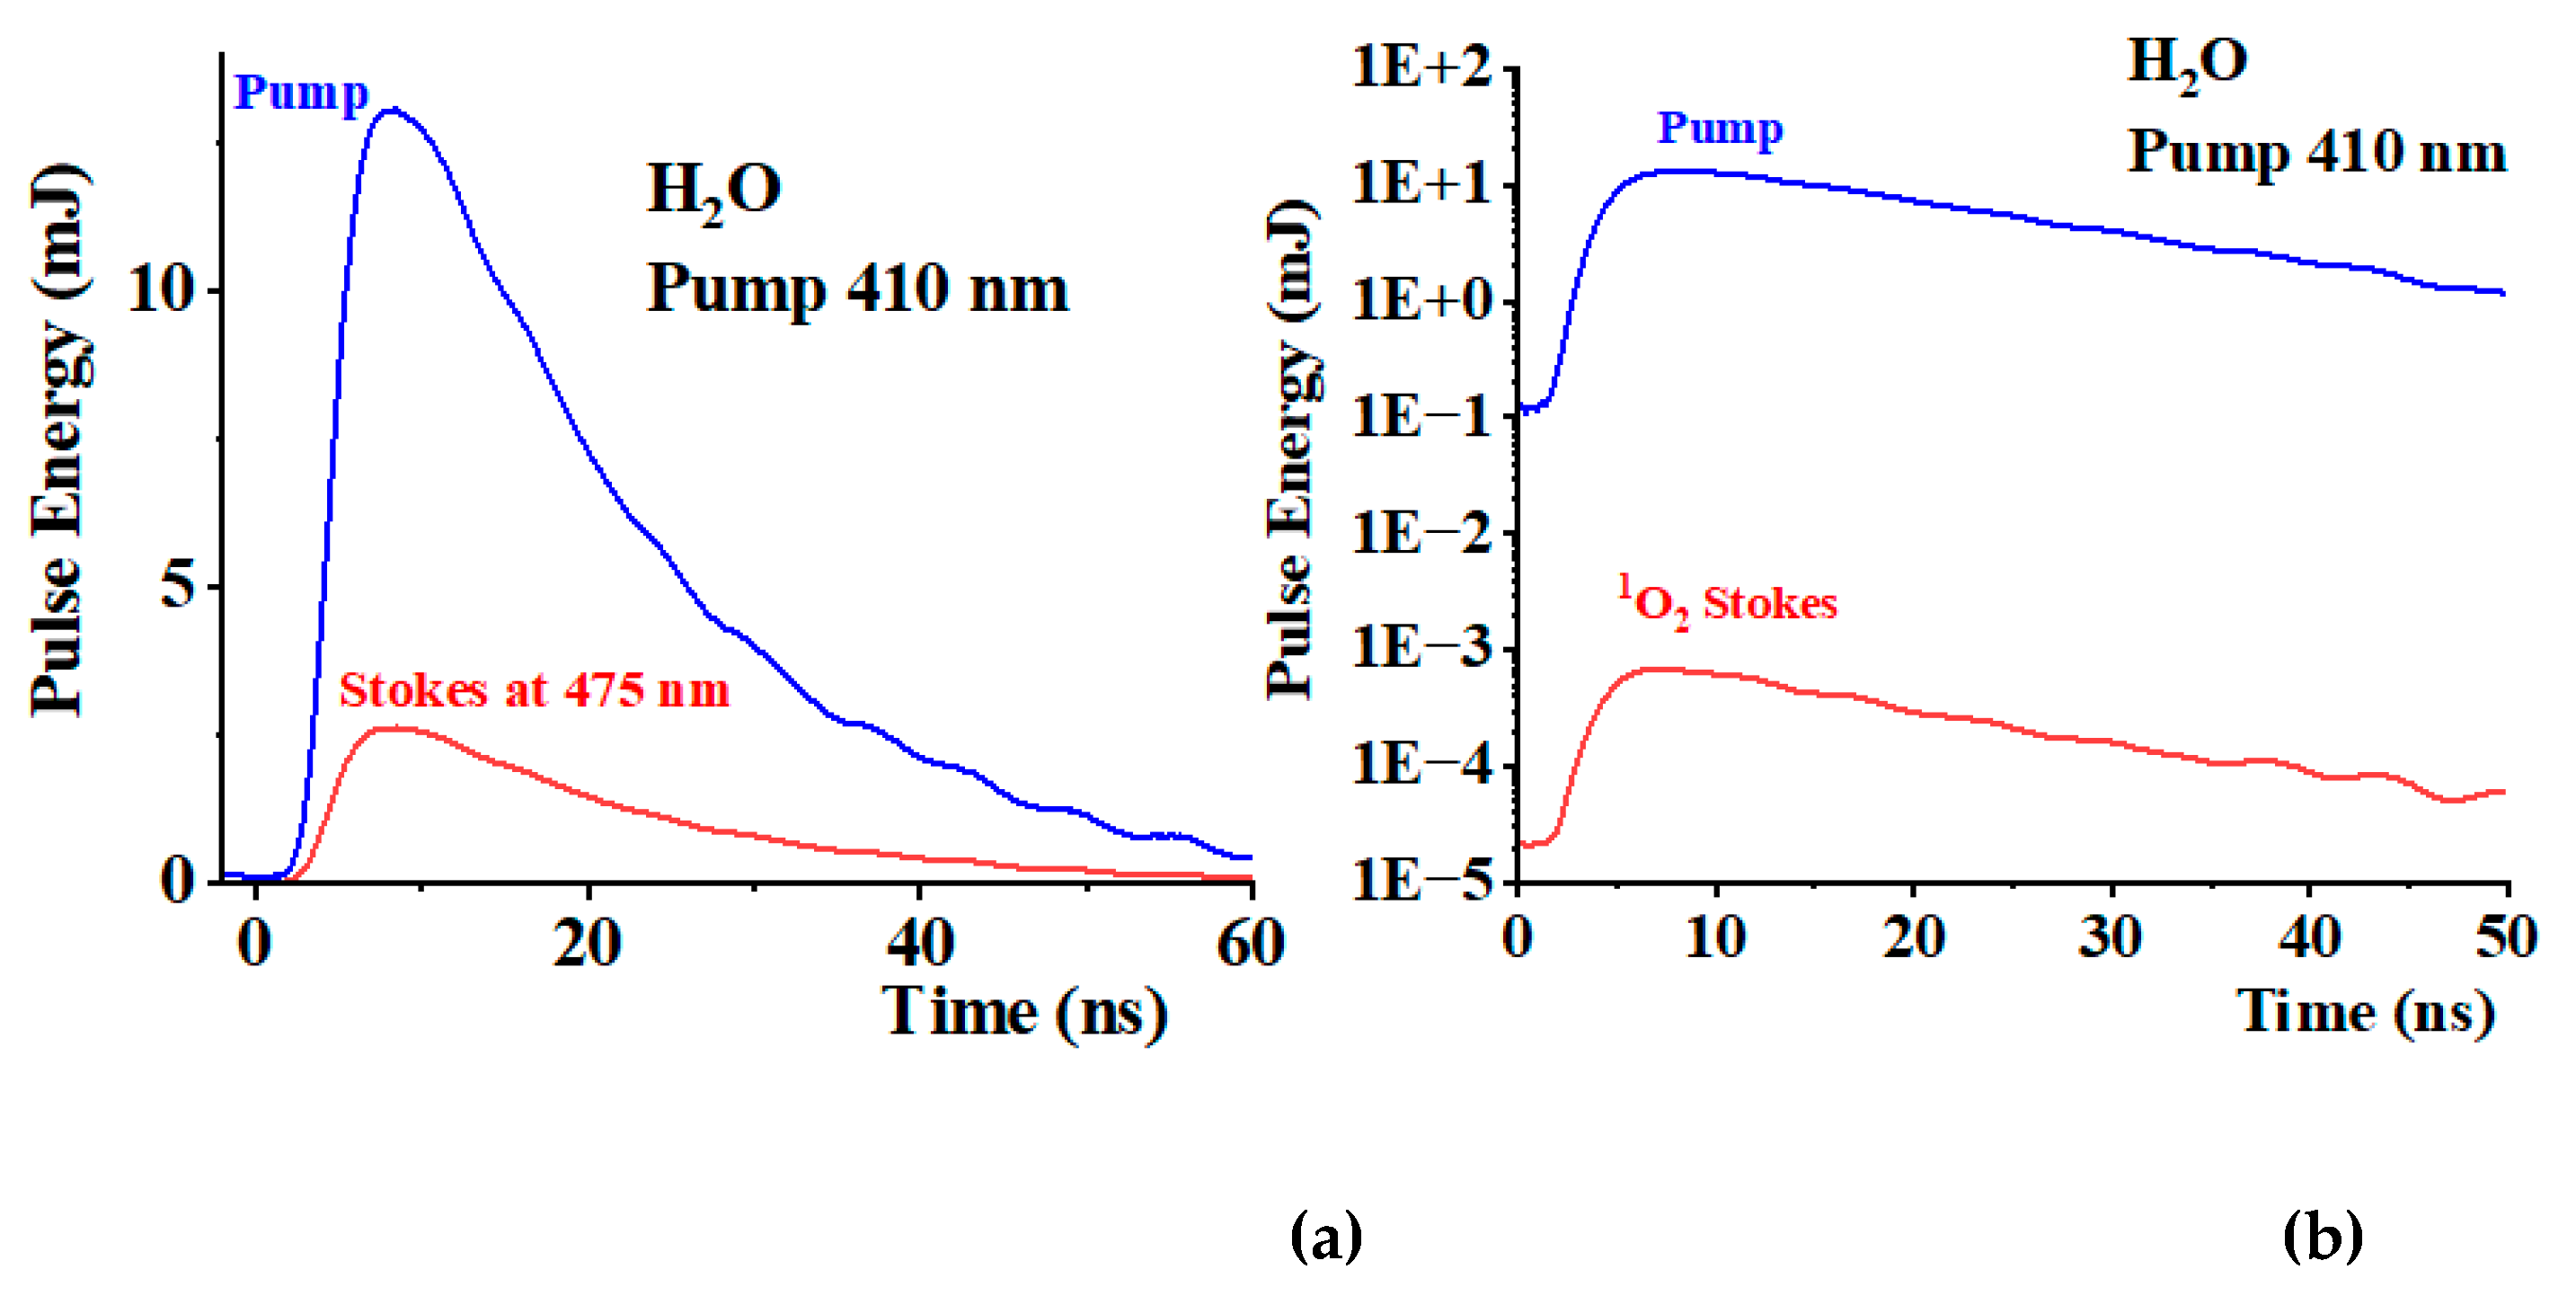
Figure 5.
(a) Absorbance spectra of a Rose Bengal H2O solution at a concentration of 10 μM combined with uric acid at a concentration of 120 μM being irradiated at 532 nm for different irradiation times. (b) Absorbance spectra of the uric solution in H2O at a concentration of 120 μM being irradiated at 410 nm for different irradiation times. (c) Absorbance dependence on irradiation time for the solution corresponding to the photosensitization experiment shown on plot 5(a) (blue crossed squares) and absorbance dependence on irradiation time for the Raman photoexcitation experiment (red crossed circles).
Disclaimer/Publisher’s Note: The statements, opinions and data contained in all publications are solely those of the individual author(s) and contributor(s) and not of MDPI and/or the editor(s). MDPI and/or the editor(s) disclaim responsibility for any injury to people or property resulting from any ideas, methods, instructions or products referred to in the content. |
© 2025 by the authors. Licensee MDPI, Basel, Switzerland. This article is an open access article distributed under the terms and conditions of the Creative Commons Attribution (CC BY) license (http://creativecommons.org/licenses/by/4.0/).
Copyright: This open access article is published under a Creative Commons CC BY 4.0 license, which permit the free download, distribution, and reuse, provided that the author and preprint are cited in any reuse.


