Submitted:
30 July 2025
Posted:
30 July 2025
You are already at the latest version
Abstract
This study examines the relationship between three scarcity marketing strategies (limited edition, store exclusive, and online only) and consumer engagement, as measured by the number of reviews, in the beauty e-commerce sector. While research shows that scarcity can boost immediate purchases and willingness to pay, it does not necessarily lead to more post-purchase behaviors like writing reviews. Findings from Sephora data show that products employing scarcity strategies receive significantly fewer reviews than regular products. Among the scarcity categories, Sephora-exclusive products received the highest number of reviews, followed by online-only and limited-edition products, suggesting different scarcity strategies lead to different engagement outcomes. Random Forest was the best-performing model even though its predictive power was moderate (R2 ≈ 0.44). XGBoost closely followed (R2 ≈ 0.43). Feature importance analysis revealed that the number of product variations was the most influential factor in predicting review count, while scarcity categories also appeared among top features. Theoretically, this study demonstrates that scarcity marketing strategies are associated with a lower review count, and this effect depends on the specific type of scarcity. Brands should reconsider employing scarcity marketing if their goal is to garner a large number of reviews, and instead consider broadening product variations and leveraging machine learning to inform data-driven decisions. Some limitations of this study include relying on data from just one retailer, oversimplifying scarcity categories, and not having access to social media, time-series, or user data. These areas offer valuable opportunities for future research.
Keywords:
scarcity
; limited edition
; reviews
; e-commerce
; beauty
; marketing
The online retail market has experienced significant growth in recent years, particularly following the COVID-19 pandemic, which has led to e-commerce becoming the norm for many products, including beauty and personal care items. Social media has also heavily influenced product marketing because it often provides consumers direct links straight to the advertised products. Altogether, these have boosted the beauty e-commerce sector and posed challenges for traditional brick-and-mortar stores, both in general and specifically within the beauty segment.
As a result of this surge, competition in this sector has intensified at all levels. The personal care category online is largely dominated by two major e-commerce companies: Amazon and Walmart (Yltävä, 2024). They had impressive sales of about USD 5.2 billion and USD 4.3 billion, respectively, in 2023. They further reported that specialty retailers like Sephora and Ulta are also following these sales figures, which have consecutively reached USD 2.8 billion and USD 2.1 billion. Because of this, it is crucial for brands to differentiate themselves among competitors using clever digital marketing strategies. One strategy is to utilize scarcity marketing, often manifested in products as limited-editions, store exclusives, or online-only products, with the hope that these products will trigger people’s psychology, such as sense of urgency, fear of missing out (FOMO), and increased perceived value, especially for consumers that score high on need for uniqueness (NFU).
In the context of this study, scarcity refers to the condition where product/service is not abundant in quantity, accessible, or available for a long period of time. The scarcity principle asserts that items in limited quantities or access are perceived more valuable than they actually are (Cialdini, 2016). There are several types of scarcity: quantity-based (e.g., “Only 3 left!”), time-based (e.g., “This weekend only!”), and access-based (e.g., “Member exclusive”). Some psychological theories explain the scarcity principle. Loss aversion theory (Kahneman & Tversky, 1979) suggests that people tend to fear missing out more than they value gaining the exact same thing. The reactance theory (Torrance & Brehm, 1966) suggests that scarcity motivates people to avoid the stress of knowing items are nearly sold out by making a purchase promptly. Furthermore, signaling theory (Lynn, 1991) suggests that scarcity can act as a signal of quality. When something is hard to get, people often assume it must be in high demand—and that makes it more desirable.
Owning something rare and valuable can also serve as social proof, as it is a way of signaling to others that one has the access to exclusive items (Cialdini, 2009).
The psychological mechanisms relate to larger social influence contexts. For example, when a consumer sees that a product is almost sold out, it can trigger a strong sense of FOMO, making them more likely to buy it quickly. On the other hand, consumers with a high NFU seek rare or exclusive items to differentiate themselves from others. The bandwagon effect (Leibenstein, 1950) explains the interesting phenomenon where FOMO and NFU can occur together, which is the situation where people are motivated to follow trends but also want to express their identity at the same time.
Scarcity cues, especially in online retail, based on signaling theory (Spence, 1973), are crucial for consumers to gauge product quality in information-asymmetrical environments like e-commerce, where the absence of physical cues prevents them from seeing or testing products directly. When consumers perceive these scarcity cues as genuine and reliable, meaning they are not simply deceitful tactics for brands to gain profits and exploit the psychology of scarcity, they can raise the perceived value of the products, increasing the likelihood of purchase.
There is no doubt that engagement and popularity metrics such as star ratings and reviews are key aspects of the e-commerce industry. These have acted as electronic word of mouth (eWOM) (Chevalier & Mayzlin, 2006) and social proof, heavily influencing consumers’ purchase decisions (Senecal & Nantel, 2004); moreover, in the beauty e-commerce sector, where product testing is not feasible. Review counts, even though they do not indicate direction (positive or negative), are particularly compelling. Unlike ratings, which typically use a scale from one to five, reviews do not have limits and thus paint a clearer picture of the actual product qualities and characteristics, and how other consumers engage with and evaluate the products.
This study particularly examines three types of scarcity marketing strategies: limited-edition (quantity-based scarcity), store-exclusive (access-based scarcity), and online-only (access-based scarcity) products. Limited-edition products are limited in quantity. They are often released seasonally or with collaborations with celebrities or other brands. Typically, these products build anticipation before their release, creating a sense of urgency that can boost both sales and customer engagement. (Brock, 1965; Han et al., 2010). Store-exclusive products can only be purchased at certain retailers. Brands aim that these kinds of products will bring heavy traffic to their retail stores, and thus help to increase consumer loyalty (Grewal et al., 1998). Because this kind of product is only available at a single retailer, reviews are all funneled and concentrated on that retailer’s platform, which can lead to a higher review count. From the consumer’s perspective, their shopping experience feels more exciting whey they successfully obtain these special products, while owning the products help differentiate themselves from others. Online-only products, while seemingly abundant in the current digital-first world, still convey exclusivity because they are limited to a single platform, the online platform.
Direct-to-consumer (DTC) brands also use this strategy, as well as other retailers that sell products only on their websites or mobile apps. Since online-only products are sold exclusively through digital platforms, reviews tend to be centralized in one place, as in the case for store-exclusive products. As a result, brands may see a greater number of review submissions for online-only products.
While scarcity marketing has been widely researched, most of the focus has been on immediate outcomes like purchase intent and willingness to pay, rather than what happens after the purchase. A meta-analysis on scarcity by Ladeira et al. (2023) found that quantity-based scarcity tends to drive consumers to make immediate purchases, while the same effect on access-based scarcity has a weaker impact and more nuanced outcomes, depending on the product types. Aggarwal and Vaidyanathan (2003) found that the limited-quantity tactic leads to an increased sense of urgency, and therefore, an increased purchase intention, because it creates a perceived competition among consumers. Ku et al. (2012) discovered a similar pattern in which scarcity cues in online shopping heightened arousal and intense pressure during the decision-making phase, resulting in an increased chance of making a purchase.
Other scholars have looked into how scarcity affects brand perceptions. Kapferer and Bastien (2012) asserted that scarcity is the core of luxury branding, where scarcity enhances the value of the offerings, making consumers view the brand as exclusive and desirable. Similarly, Keller (2013) highlights that scarcity and perceived uniqueness can reinforce associations with high-quality and aspirational status, strengthening the brand equity.
Existing literature on scarcity also exists that is more related to consumer psychographics and cognition. According to Dörnyei and Lunardo (2021), scarcity cues can backfire with consumers who score low on NFU, as they may perceive a limited-edition product as being too exclusive or domineering. When consumers gather sufficient cognitive evidence to recognize that scarcity claims are merely a sales tactic, rather than a genuine claim, the initially increased perception of the product’s higher evaluation can drop significantly (Lee et al., 2014), which aligns with signaling theory that has a caveat that it is only valid if the signal (scarcity, in this case) is perceived as legitimate.
Despite recent studies adding a more nuanced look at various scarcity strategies, most of these studies position scarcity as a single, monolithic concept and do not differentiate between different types of scarcity, neglecting the fact that these different strategies may trigger different psychological mechanisms and therefore different consumer behavioral patterns. Furthermore, most prior work on scarcity uses experimental design and survey responses instead of examining real-world data, which may raise questions about whether the findings from these studies are meaningful and applicable to the complicated consumer behaviors in actual digital marketplaces.
The topics of online reviews has also been extensively studied by experts. According to Zhang et al. (2010), consumers do heavily rely on fellow consumers’ opinions and judgements while evaluating products, especially when they are uncertain of the quality. Interestingly, even negative reviews can boost sales because they help raise product awareness and make the item more visible to potential consumers (Liu, 2006), such as appearing in top searches. In a similar vein, (Godes & Mayzlin, 2004) discovered that the number of reviews and their spread as an eWOM are essential in predicting the product’s success.
Although there is plenty of research on product reviews, not many studies explore what actually motivates consumers to write them in the first place. One of them is the study by Hennig-Thurau et al. (2004), which identified that consumers are most importantly motivated by intrinsic factors when it comes to writing reviews, such as to vent out negative feelings, helping other consumers not to have the same bad experience, and enhancing their own image and social status. Equally important, consumers also leave reviews to derive social benefits from online engagement and to support the brand. Sista et al. (2022) find that shortly after a discount, the steady stream of review generation can be interrupted, leading to a more varied volume and sentiment (positive or negative).
However, most of these studies do not necessarily examine how product-level signals may influence review submissions.
Taken together, the gaps in the literature reinforce the need to examine the effects of scarcity marketing beyond point of sale, such as via review volume, which is the focus of this study. This study looks at scarcity strategies in a more nuanced lens as opposed to looking at it as a single monolithic idea, and aims to identify predictors of review writing on a product-level to understand if brands by any chance can control review behaviors through their product development and marketing strategies.
Theoretical Framework
Traditionally, scarcity leverages loss aversion (Kahneman & Tversky, 1979), reactance theory (Torrance & Brehm, 1966), signaling theory (Spence, 1973), FOMO, and other psychological mechanisms to prompt consumers to make faster purchase decisions.
Although more purchases raise the chances of submitting reviews, it is uncertain if this effect will lead to lasting behaviors after the transaction is finished. Consumers typically do not behave equally across different stages of the purchase journey, from the awareness, consideration, engangement and endorsement stage.
So far, research shows that consumer’s motivation to write reviews mainly comes internally. Therefore, product-level attributes like scarcity cues may not directly cause people to write reviews. Do scarcity cues still shape how consumers behave after they have made a purchase, or do they only matter up until the moment of purchase? For instance, consider a product that is short-lived and specialized, which is often true for limited-edition items. In this case, consumers might not be inclined to leave reviews, as they may not be relevant to a broader audience and might not be available soon after. According to expectation disconfirmation theory (Oliver, 1980), scarcity might lead consumers to not leave a review. Since expectations of these special products are high before the transaction, consumers will be disappointed and may not leave reviews (or leave negative ones) if the actual product does not meet their inflated expectations. However, at the same time, one may also argue that scarce products enhance a person’s status and uniqueness, motivating them to share their experiences and opinions using the product.
Studying online reviews is important. They provide valuable information for consumers and greatly impact future sales. Suppose this study finds that a specific type of scarcity strategy is associated with a higher number of reviews. In that case, brands can use these to increase purchase rates and generate reviews, creating an ongoing review-purchase cycle. This study aims to extend the existing framework on scarcity by examining what happens after the transaction has taken place, specifically, consumer engagement via writing reviews, whether it inhibits or fosters broader engagement.
All in all, this study examines the relationship between three types of scarcity strategies — limited edition, store-exclusive, and online-only — and review counts, as a measure of consumer engagement, to reveal how digital merchandising tactics not only impact sales but also drive consumer engagement in the form of reviews. Findings from this study will contribute academically to the study of scarcity marketing, specifically in the online context, and managerially inform how beauty brands and retailers can optimize their sales and merchandising strategies to better compete in the digital landscape.
Specifically, this study first quantifies the impact of scarcity on review count, a novel metric in this field. Second, this study takes a more detailed look at scarcity strategies by separating them into limited editions, store exclusives, and online-only products. This offers a more nuanced understanding compared to past research that often treated scarcity as a single concept. Third, by using machine learning models, this study also adds to the growing body of work exploring how these tools can support marketing decisions. The following research questions guide this study:
RQ1. Do products that use scarcity strategies get a higher average number of reviews than regular products?
RQ2. Among the scarcity strategies (limited edition, store exclusive, and online only), which one is associated with the highest average number of reviews?
RQ3. Which machine learning model performs best for predicting review counts in the beauty e-commerce sector?
RQ4. Are the scarcity strategies (limited edition, store exclusive, and online only) important predictors in the machine learning models to predict the number of reviews?
Methods
This study took a quantitative approach, combining both statistical analysis and predictive modeling to better understand the data from multiple angles.
Data
I used a publicly available dataset from Kaggle, titled “Sephora Products and Skincare Reviews” to conduct this study. Sephora is one of the largest and leading beauty retailers worldwide, known for its strong online presence and diverse selection of products. Its platform is rich in ratings and reviews from millions of consumers from all over the world, offering a rich, valuable, and a real-world data for studying consumer behavior in the beauty e-commerce industry. The dataset, collected in March 2023, contains 8,484 unique beauty products and 27 variables, including a mix of categorical, numerical, and text-based data.
Variables
The dependent variable of the study is the log-transformed review count, as a metric for consumer engagement. The review count exhibited skewness in distribution and therefore needed to be transformed to ensure a more stable analysis. The main independent variables of the study were three binary variables that indicated whether a product was limited edition, Sephora exclusive, or marketed online only.
I also included several control variables to isolate the effects of scarcity on review counts. The product price (in U.S. dollars) was included because price is known to affect perceived quality and purchase decision-making. A binary variable indicating whether a product was new was also added, as newer products may not have had enough time to accumulate reviews. Another binary variable that indicates whether a product is out of stock was also included. This may show high demand or limit the chance for consumers to buy a product, which can affect whether they leave a review. The main product categories— like Skincare, Makeup, and Fragrance — were included as categorical variables, since different types of products often induce different levels of consumer engagement. Finally, child count, a variable capturing the number of variants, such as shades and sizes, was included because a greater number of varieties may increase and widen product appeal and result in higher review counts.
Data Analysis Procedure
I used R version 4.3.2 to perform all analyses. Starting with data cleaning and preprocessing, I first converted binary variables into factors to ensure proper handling and interpretation. Secondly, 278 product entries (3.27%) had missing values in the review count and were therefore removed. Despite the removal, I suspected that this missingness was not random because it was not normally distributed. For instance, 14.9% of limited-edition products had a missing value in the review count. In contrast, only 2.65% of Sephora-exclusive products had this issue. Although this raised a red flag of non-random missingness, the relatively low proportion of missingness assured the decision to exclude the 278 product entries in favor of consistency and data quality.
Review count, as the target variable, was highly right-skewed, which is typical for review count data. In e-commerce, it is typical for a small number of products to gather a large number of reviews, while the majority gets very few or none at all. This long-tail distribution happens because consumers do not pay attention to all products equally. To tackle this imbalance, the variable was log-transformed to create a more normal distribution for modeling. This log-transformed review count variable was then used for the remainder of the analyses. Figure 1 displays the distribution of review counts before and after applying the log transformation.
Afterwards, I subsetted the dataset, selecting only the chosen variables and leaving out variables such as product ID, ingredients, detailed product categories, and other text-based variables. These were removed because they were either not very relevant or required natural language processing methods, which were outside the scope of this study. Even though the test for multicollinearity revealed that it was not a concern (V IF ≈ 1), love count (the number of consumers who marked a product as their favorite) showed a moderately strong correlation with reviews (r = 0.69), suggesting redundancy. Both rating and love counts are also metrics of consumer engagement, and they may be influenced by scarcity cues as well; thus, they are inappropriate to include as predictors in this study, as they would obscure the direct effect of scarcity on review counts. Therefore, to maintain model parsimony and avoid over-adjustment, I focused on the review count as the only target variable and excluded rating and love counts from the predictors.
The analysis began by examining descriptive statistics to gain a clearer understanding of the dataset, including the means, standard deviations, ranges, and frequency distributions of all variables. Afterwards, to answer RQ1 and RQ2, I first performed an independent t-test to compare the log-transformed review counts between scarcity-based products (limited-edition, Sephora-exclusive, and online-only products) and regular products. This t-test was followed by a linear regression to further compare the differences in review counts between scarcity-based and regular products. To examine them further, I conducted a one-way ANOVA across the four mutually exclusive categories: limited-edition, Sephora-exclusive, online-only, and regular products, followed by post-hoc Tukey HSD tests to reveal which specific pairs were significantly different.
To prepare for predictive modeling, I applied one-hot encoding to the categorical predictors. This included the three scarcity indicators, brand name, and product category.
I then scaled these encoded variables using z-score normalization. This step made sure that no single feature would dominate the model training just because of its scale.
I then conducted an XGBoost-based feature selection with only shallow optimization, which reduced the number of features from the full one-hot encoded matrix with over 300 features to the optimal number of 131 features. This reduction was important for minimizing overfitting, speeding up training, and producing more generalizable results. So, I used the selected 131 features to cut down dimensionality and improve model performance.
Suspecting that brand names have high potential as a confounding factor, I used the residualization technique to mitigate this issue. First, I calculated the average log-transformed review for each of the brands using the training data to prevent data leakage. The resulting variable from this calculation served as the baseline for the average consumer engagement with a particular brand. If a product exceeds its brand’s average review count, it indicates that it has relatively high engagement. Next, I took each product’s brand average and subtracted it from its log-transformed review count. This gave me the residual target variable. This residual indicated how much a product deviated from its brand norm. This residualization approach isolates brand influence from product-level effects, enabling a cleaner estimation of product-specific impacts that is free from noise from the brand. Afterward, brand names were excluded to ensure that predictive models learn from scarcity variables, rather than from brands, resulting in only 13 features left.
The data was randomly split into training, validation, and testing sets using a 60:20:20 ratio, which is a common practice in machine learning. The relatively large portions for validation and testing were chosen to support reliable and generalizable results. To ensure that the test data never influenced model tuning, I conducted all hyperparameter optimization separately, using only the training and validation sets from one fixed random split. During tuning, I applied 5-fold cross-validation within the training set to select the best hyperparameters based on averaged performance across the five folds. Optuna was used to tune each model’s hyperparameters, an automated tool that efficiently searches for the best settings for all models. This step makes sure there is no overfitting before the final evaluation on the unseen test set. Notably, the same parameters were maintained across all models, as well as the train-validation-test set ratio, to ensure fair comparisons and reproducibility. The tuned hyperparameters for each model were:
- Elastic Net: α = 0.56; λ = 0.0033
- SVM: Cost = 6.27; γ = 0.0045
- Random Forest: mtry = 30; ntree = 75
- XGBoost: η = 0.075; max depth = 9; subsample = 0.56; colsample_bytree = 0.73; min child weight = 2; γ = 0.037; λ = 1.04; α = 1.05; nrounds = 169
For this study, I used four machine learning models: Elastic Net, Support Vector Machine (SVM), Random Forest, and Extreme Gradient Boosting (XGBoost). Each model has its own strengths and weaknesses, balancing interpretability, accuracy, and robustness in different ways. Elastic Net is a linear model that blends L1 (lasso) and L2 (ridge) regularization techniques. Its ability to manage multicollinearity well and compress coefficients with less information into zero makes Elastic Net a strong baseline model that can keep interpretability intact while also reducing overfitting when the data is
high-dimensional. SVM relies on kernel methods, which makes it well-suited for capturing non-linear relationships. It performs especially well with complex datasets that involve intricate interactions and a large number of features — scenarios where traditional linear models often struggle. Random Forest, a popular tree-based method, is robust against overfitting and can model non-linear relationships and interactions that are less obvious/hidden. In addition, Random Forest makes it possible to analyze which features are most important in making predictions. This is important for practical marketing analytics and improves the understanding of features. XGBoost is a highly flexible model that, when properly tuned, often outperforms other models in terms of accuracy — making it a reliable and powerful choice for predictive tasks.
Next, I assessed model robustness by repeating the data splitting process ten times with ten different random seeds and averaging the performance metrics across these runs. This approach helps to avoid overfitting and ensures that the results are not tied to a single seed. In each of these repetitions, I reused the previously tuned hyperparameters and evaluated performance only on the fresh test sets—no additional tuning was done.
I decided to run two iterations of the four models due to the suspicion of brand as a confounding factor. The first iteration used the log-transformed review count as the target variable. The second used the brand-residualized log-transformed review count. This allowed me to examine whether brand residualization was effective as a technique for mitigating confounding factors. Using the same hyperparameters consistently, I conducted predictions on the test sets using five metrics to evaluate the models’ performances: Pearson correlation coefficient (COR), Root Mean Squared Error (RMSE), Mean Absolute Error (MAE), R-squared (R2), and the minimum-to-maximum accuracy ratio (MinMaxAcc). The performance metrics across the ten random seeds were averaged for each model to obtain a single, mean performance score per metric for evaluation. COR assesses the linear relationship between the actual and the predicted values. Both RMSE and MAE were used to gauge prediction accuracy, but RMSE places greater emphasis on larger errors, making it more sensitive to big mistakes in the model’s predictions. R2 shows the percentage of variance that the model can explain. MinMaxAcc is a metric that simply looks at how close each prediction is to the actual value.
Ultimately, depending on the model, I examined the feature importance of the best-performing model to identify which predictors most strongly influence the target variable (review count). This analysis gives a better understanding of how much each factor contributes to predicting review count for products that leverage scarcity marketing.
All analysis pipelines were fully coded and are available for full reproducibility. Key packages used were caret (Kuhn, 2022) for model training and evaluation; glmnet (Friedman et al., 2022), e1071 (Meyer et al., 2021), randomForest (Liaw & Wiener, 2002), and xgboost (Chen et al., 2023) for model execution; iml (Molnar et al., 2022) for analyzing feature importance; and Optuna (Akiba et al., 2019) for hyperparameter search, via the reticulate (Ushey et al., 2024) package interface. Additionally, tidyverse (Wickham et al., 2019) was used to assist with data wrangling and visualization, corrplot (Wei & Simko, 2021) and car (Fox & Weisberg, 2019) were used to assess correlation and multicollinearity, respectively, and Metrics (Hamner & Frasco, 2022) to provide model evaluation metrics. In addition, GPT-4 (OpenAI, 2023) and Gemini (Google DeepMind, 2024) were used to assist with coding and troubleshooting during the entire analysis.
Results
As shown in Table 1, the review count variable exhibited a high degree of variability, with a mean of 448.55, a median of 122.00, and a maximum of over 21,000, indicating that most products had fewer reviews, while a few had a very high number. While not directly used in predictive modeling, the rating variable showed an average of 4.19 (SD = 0.52) with a median of 4.29, indicating generally positive consumer sentiment across the dataset. The number of loves exhibited extreme variability, ranging from 0 to over 1.4 million. This suggests that certain products were more popular than others. Prices varied widely from USD 3 to USD 1,900, with an average of USD 51.23, suggesting a diverse mix of product tiers. Lastly, child variants had a mean of 1.68, with a maximum value of 105, indicating that while most products had no or few variants, some items were associated with a large number of SKUs.
Table 2 presents a summary of the binary variables. As evident in Table 2, the distribution of special product categories revealed that Sephora-exclusive products were the most common (28.1%), followed by products sold exclusively online (21.0%). Limited edition products represented a smaller segment (6.2%).
The dataset included 115 unique brands. Figure 2 illustrates the top 20 most frequent brands in the dataset, indicating a skew toward a few dominant names, with “SEPHORA COLLECTION” being the most frequent.
When looking at how products were spread across primary categories, Skincare and Makeup stood out as the largest groups — each accounting for over 28% of the total products in the dataset. The Hair category made up 17.2% of the data, while Fragrance 16.3%. The other categories made up a smaller portion of the data. These included Bath & Body, Mini Size, Men, and a few others. The distribution of products across primary categories is detailed in Table 3.
Research Question 1
The results of the independent-sample t-test and linear regression analysis comparing scarcity-based products with regular products revealed a significant negative effect of scarcity on review counts, as indicated by the independent t-test. Regular products had a mean log-transformed review count of 5.10 (SD = 1.74), while products that use a scarcity strategy had a mean of 4.21 (SD = 1.57); t(8049) = 22.60, p < .001, 95% CI [0.82, 0.97]. The linear regression backed up this result, showing a strong negative relationship ( =-0.89, t = -22.65, p < 0.001, adjusted R2 = 0.059). Overall, the t-test and linear regression suggested that scarcity, as a broad category, may experience reduced consumer engagement in the form of review counts, which is contrary to the assumption that scarcity should increase desirability and engagement.
Research Question 2
The distribution of products across mutually exclusive categories was as follows: regular (n = 4,301), limited edition (n = 508), Sephora exclusive (n = 2,107), and online only (n = 1,300). The mean of the log-transformed review counts was 2.71 for limited editions, 4.95 for Sephora exclusives, 3.60 for online-only products, and 5.10 for regular products.
The ANOVA test showed a clear difference in review counts among limited-edition, Sephora-exclusive, online-only, and regular products (F (3, 8212) = 514.8, p < 0.001).
Tukey’s HSD results further revealed that limited-edition products had a significantly lower average of log-transformed review counts compared to regular products (mean difference = -2.39, p < 0.001). Online-only products also had noticeably lower average log-transformed review counts than regular products, with a mean difference of -0.15 (p < 0.001).
Sephora-exclusive products received significantly lower means of log-transformed review counts than regular products (mean difference = -0.16, p = 0.003).
When comparing Sephora-exclusive and limited-edition products, Sephora-exclusive products received a significantly higher mean of log-transformed review counts than limited-edition products (mean difference = 2.23, p < 0.001). Online-only products had a much higher average of log-transformed review counts compared to limited-edition products (mean difference = 0.88, p < 0.001). Online-only products received significantly lower means of log-transformed review counts than Sephora-exclusive products (mean difference = -1.35, p < 0.001). Table 4 shows the results of the post hoc Tukey’s HSD test, which breaks down where the significant differences lie between product types.
These findings reinforce the pattern identified in the t-test, showing that regular products consistently outperform all scarcity-based products in review volume when treated as mutually exclusive groups, contradicting some initial expectations based on the scarcity theory. Among the scarcity categories, Sephora-exclusive products received the most reviews, followed by online-only products. Limited-edition products consistently had the fewest reviews, suggesting that this type of scarcity strategy might actually reduce, rather than boost, consumer engagement. Figure 3 shows this distribution. There were apparent differences in average values and variation between regular and scarcity-based products.
Research Question 3
Table 5 summarizes the mean performance metrics for each model across ten random seeds when predicting the original log-transformed review counts, with brand names still included as one-hot encoded features. Before residualization, Random Forest achieved the highest mean R2 (0.44) and (COR) (0.66) and the lowest (RMSE) (1.38) and (MAE) (1.07) among all models, indicating that it was the best model in predicting the raw log-transformed review counts. XGBoost followed closely with the mean R2 of 0.43, while Elastic Net and SVM (R2 = 0.36 and 0.38, respectively) showed comparatively lower performance.
To account for potential confounding factors related to the brand name, I also explored a residualization technique to remove brand influence from the log-transformed review counts. However, this adjustment substantially worsened model performances (as shown in Table 6), suggesting that brand influence is not a confounding factor but matters in predicting review counts. Random Forest and XGBoost, which previously showed moderate performance, experienced a significant decline in R2 and increases in (RMSE) and (MAE) after brand residualization.
Due to the significant drop in performance, I only retained the initial non-residualized log-transformed review count as the final result of this study. This decision prioritizes reproducibility and comparability over potentially noisy confounding control. Figure 4 illustrates visualizations of the five evaluation metrics across the four models before brand residualization.
From this analysis, Random Forest consistently outperformed the other models — SVM, Elastic Net, and even XGBoost — across all five evaluation metrics. Although XGBoost’s performance was close behind, it needed more extensive tuning and did not consistently beat Random Forest on every metric. The likely reason for Random Forest’s edge is its strength in capturing non-linear relationships and managing complex interactions between features. These abilities are especially important in modeling consumer behavior because features like product exclusivity, price, and SKU count may interact in unexpected ways that Random Forests can effectively capture.
Research Question 4
To understand which features contributed most to the Random Forest model’s predictions of the log-transformed review counts, feature importance was assessed using the IncNodePurity metric. The top 20 features of the Random Forest model are presented in Figure 5.
The feature importance analysis of the top-performing Random Forest model revealed that the number of product variations was the strongest predictor. It had the highest increase in mean squared error (IncMSE = 74.61). This suggests that products with a greater number of variations tend to have significantly larger consumer engagement in the form of review volumes.
Following this, scarcity-related variables such as online_only (IncMSE = 59.82) and limited_edition (IncMSE = 44.29) also exhibited strong importance, indicating that scarcity play a substantial role in driving consumer review activity. Sephora_exclusive (IncMSE = 15.34), although emerging as impactful from previous analyses, had slightly lower importance than limited edition and online-only products. Brand characteristics and pricing were similarly important, with brand_label ((IncMSE = 37.57) indicating that brand influence matters in predicting reviews, and price_usd (IncMSE = 35.04) suggesting that price is actually meaningful in predicting consumer review behavior. Product categories such as Skincare (IncMSE = 25.14) and Fragrance (IncMSE = 17.47) further contributed to the model’s performance, reflecting category-specific engagement patterns where consumers may have varying motivations to leave reviews depending on the type of product. Other factors, such as newness (IncMSE = 24.24) and stock availability (IncMSE = 14.46), demonstrated moderate importance, underscoring the multifaceted drivers behind review volume in the beauty e-commerce context, including product novelty and accessibility.
Since the performance of the XGBoost model closely followed the Random Forest model, I also examined the XGBoost model’s feature importance, as shown in Figure 6.
While the overall findings from Random Forest and XGBoost are similar, some minor differences appeared. XGBoost placed greater emphasis on pricing, indicating that price played a more important role in its predictions compared to the Random Forest model. On the other hand, Random Forest put slightly more emphasis on Sephora exclusivity and category-level predictors, such as the Skincare category. This indicates minor differences in how the two models capture the influences of products and brands.
In conclusion, both Random Forest and XGBoost revealed similar patterns in feature importance, emphasizing that product variation, pricing, and scarcity signals play key roles in driving the number of reviews. These primary factors drive consumer engagement through online reviews of beauty and personal care products.
Discussion
Summary of Results
Contrary to expectations based on the literature review, products that use scarcity strategies received fewer reviews than regular products, as evident across all statistical tests: individual t-tests, linear regression, ANOVA, and Tukey’s HSD. Limited-edition products received the fewest reviews, followed by online-only products. Sephora exclusives were the best among the three, even though they still received fewer reviews compared to regular products.
Several reasons may explain these results. First, limited edition products often attract a smaller, more niche group of consumers. This already lowers their chances of getting more reviews. They also have a limited distribution and shorter lifespans.
Additionally, these items may be perceived as collectibles, which can reduce consumers’ motivation to leave reviews, as they will not be available for an extended period of time. For these reasons, brands should not rely on review counts to approximate the engagement of limited-edition products. For instance, social media might be a better metric due to their short-lived quality. Online-only products may suffer from a lower number of reviews because consumers lack the opportunity to test and experience the tactile nature of these products, which is particularly essential for the beauty category, thereby making them hesitant to buy and leave reviews. Sephora-exclusive products, while not getting more reviews than regular products, were the top performers among limited-edition and online-only items. One reason could be that the retailer is offering some type of reward for customers to leave reviews for their brand.
These findings complicate the simple use of signaling theory and social proof. Even though scarcity strategies may increase perceived value, as repeatedly suggested by the literature, the lower number of reviews suggests that these strategies may unintentionally harm broader consumer engagement. Theories of loss aversion (Kahneman & Tversky, 1979) and the bandwagon effect (Leibenstein, 1950) predict that scarcity increases consumption. However, these theories might not be as relevant when it comes to post-purchase behaviors like writing reviews. Meanwhile, the expectation disconfirmation theory (Oliver, 1980) may hold, where the actual product quality fails to meet the overly high initial expectations of the product before it is purchased. Also, if consumers see the product as hard to get or only available for a short time, they might be less motivated to help boost its online visibility. This is especially true if they believe the audience for their review is small or nonexistent, given the product’s limited nature.
Findings from the brand residualization iteration showed that controlling for brand-level influence through residualization might eliminate useful predictive signals. Although residualization was done to address potential confounding factor, it seems that brand effects genuinely reflect consumer behavior rather than just noise or bias. This underscores the importance of thoughtfully evaluating whether a confounding factor truly needs to be removed. Brand equity may act as a factor influencing how people interpret scarcity cues, and therefore should not have been removed as a predictor. This may relate to the theory suggesting that scarcity increases perceived value only when the cues appear credible to consumers (Lee et al., 2014). If a limited-edition product comes from a lesser-known or less-reputable brand, consumers may be less inclined to engage with it — resulting in fewer reviews — compared to when the same scarcity cue comes from a well-trusted brand. Therefore, rather than removing the brand-level differences, future models might benefit from including brand strength as an important predictor.
The feature importance analysis of the Random Forest and XGBoost models revealed that the child count (i.e., the number of product variations) was the most critical factor in predicting review counts, suggesting that more product variations drive greater engagement. This idea ties into variety-seeking behavior, where consumers tend to look for and engage with products that offer personalized or distinct choices. All three scarcity indicators—limited edition, Sephora-exclusive, and online-only—were among the top 20 predictors, highlighting their importance in predicting review counts even after controlling for brand names. Interestingly, Sephora-exclusives, while showing the highest review counts among the three scarcity categories, scored the lowest on feature importance, suggesting that the variable’s predictive power might be more brand-mediated. This might indicate an interaction effect between scarcity and brand loyalty.
In short, the findings suggest that scarcity strategies might actually lower the number of reviews, challenging the common belief that scarcity should boost engagement. The findings also emphasize the importance of distinguishing between different kinds of engagement, such as pre-purchase and post-purchase.
Implications and Importance
This study provides both theoretical insights and practical advice for marketers in the beauty e-commerce sector. It contributes to our understanding of scarcity marketing by demonstrating that signals of scarcity, such as “limited edition,” “store-exclusive,” and “online-only,” do not always enhance consumer engagement. While scarcity can indicate high value during the consideration stage, it might also suggest limited usefulness or availability. The study adds depth to signaling theory by demonstrating that scarcity may not have the same effect throughout the consumer journey.
From a practical perspective, the findings question several marketing assumptions. First, the finding that scarcity-based products received fewer reviews than regular ones indicates that these strategies may hinder consumer conversation rather than enhance it. Marketers often use scarcity to create a sense of urgency and boost sales, but this study suggests there may be a downside — fewer reviews from customers. This is important to note, since customer feedback helps boost a product’s visibility and trust on e-commerce platforms.
Second, the study highlights that scarcity does not work the same way for every product or brand — it is not a one-size-fits-all strategy. Among the three types of scarcity analyzed, store-exclusive products (e.g., Sephora exclusives) received significantly more reviews than limited editions or online-only products. This finding suggests that exclusivity linked with a trusted retailer may lead to more consumer engagement. For brands and retailers, this highlights the value of maintaining a strong consumer interaction.
Third, the feature importance analysis showed that product variation — the number of available shades, sizes, or formulations — was the strongest predictor of review volume across all machine learning models. When consumers find products that really fit their preferences and needs, they are more likely to engage with them and share their experiences through reviews. Brands should focus on offering a variety of options and consider combining variation with scarcity to reduce the drop in reviews for scarcity-based products.
Fourth, scarcity signals ranked among the top 20 predictors along with pricing, newness, stock, product categories, and brand names, suggesting that scarcity should be part of a broader engagement strategy such as loyalty programs and targeted follow-up efforts. For example, limited-edition launches could be boosted by partnering with influencers, encouraging user-generated content, or sending follow-up emails that nudge customers to leave reviews before the products run out.
Fifth, using machine learning models like Random Forest and XGBoost not only helped make prediction but also offered valuable insights by highlighting which features matter most. Although the best model’s R2 was moderate (R2 ≈ .44), it still identified important factors driving consumer engagement. Predictive analytics can help brands identify products with low engagement early and take informed action, such as utilizing influencers for outreach efforts or boosting promotions.
In conclusion, scarcity strategies remain a powerful tool in digital marketing, but they work best when balanced with product variety, accessibility, and credibility. Combining scarcity strategies with prompts for customer feedback and personalized experiences is likely the most effective way to keep consumers engaged long after the purchase — especially in online beauty retail.
Limitations and Future Directions
While this study offers valuable insights, it comes with some limitations. First, by focusing solely on one retailer—Sephora — we cannot draw firm conclusions about cause and effect. Although review counts differed across various scarcity strategies, one cannot assume that scarcity causes these differences. Plus, the results might not hold true for other retailers like Amazon or Ulta, where consumer behavior, website design, and review collection methods may vary. Future studies should compare multiple retailers to examine how scarcity influences consumer reviews in various settings.
Another limitation is that the key variables were simple binary variables. In reality, products labeled as limited-edition, store-exclusive, or online-only are more nuanced and complex than these simple classifications. For example, within the limited-edition category, there might be tiers in terms of promotion lengths. Additionally, to keep the analysis simple, I considered the three scarcity categories as if they were mutually exclusive, even though some products fit into more than one category. This simplification could have obscured the differences in how the different strategies impact review counts. Future research can explore more detailed and nuanced levels of scarcity.
The absence of social media metrics also raises concerns. Analyzing social media is essential for measuring consumer engagement and should be included since it arguably reflects more genuine interactions. Not all consumers take the time to leave reviews, and some may be motivated by incentives, introducing bias. Another issue is that I did not account for the natural variations in how reviews accumulate over time. Future research should incorporate time-series data to assess whether a particular scarcity strategy leads to faster or slower accumulation of reviews. This is essential because some products may have just launched when the data were scraped, while others might have accumulated reviews over several years. Lastly, data on demographics and psychographics were not available.
Scarcity strategies might affect certain groups differently — like people who score high on NFU — which could change how scarcity influences their behavior. Including user-level data in future research will help clarify who responds to scarcity and why.
Data and Code Availability Statement
The dataset used for this study is available at https://www.kaggle.com/datasets/nadyinky/sephora-products-and-skincare-reviews/data. The full code for data preprocessing, statistical analysis, and predictive modeling can be accessed at https://github.com/cnatasha20/scarcityengagement.
Acknowledgements
I would like to thank Dr. Ziyuan Huang for his guidance throughout this study.
References
- Aggarwal, P., & Vaidyanathan, R. (2003). Use it or lose it: Purchase acceleration effects of time-limited promotions. Journal of Consumer Behaviour, 2, 393–403. [CrossRef]
- Akiba, T., Sano, S., Yanase, T., Ohta, T., & Koyama, M. (2019). Optuna: A.
- next-generation hyperparameter optimization framework. Proceedings of the 25th ACM SIGKDD International Conference on Knowledge Discovery & Data Mining, 2623–2631. [CrossRef]
- Brock, T. C. (1965). Communicator-recipient similarity and decision change. Journal of Personality and Social Psychology, 1, 650–654. [CrossRef]
- Chen, T., He, T., Benesty, M., Khotilovich, V., Tang, Y., & Cho, H. (2023). Xgboost: Extreme gradient boosting (r package version 1.7.6.1).
- https://CRAN.R-project.org/package=xgboost.
- Chevalier, J. A., & Mayzlin, D. (2006). The effect of word of mouth on sales: Online book reviews. Journal of Marketing Research, 43, 345–354. https://journals.sagepub.com/doi/abs/10.1509/jmkr.43.3.345.
- Cialdini, R. B. (2009). Influence : Science and practice (5th ed.). Pearson Education. Cialdini, R. B. (2016). Influence: The psychology of persuasion. Blackstone Audio,.
- Incorporated.
- Dörnyei, K. R., & Lunardo, R. (2021). When limited edition packages backfire: The role of emotional value, typicality and need for uniqueness. Journal of Business Research, 137, 233–243. [CrossRef]
- Fox, J., & Weisberg, S. (2019). An r companion to applied regression (3rd ed.). SAGE Publications. https://www.john-fox.ca/Companion/index.html.
- Friedman, J., Hastie, T., & Tibshirani, R. (2022). Glmnet: Lasso and elastic-net regularized generalized linear models (r package version 4.1-4). https://CRAN.R-project.org/package=glmnet.
- Godes, D., & Mayzlin, D. (2004). Using online conversations to study word-of-mouth communication. Marketing Science, 23, 545–560. [CrossRef]
- Google DeepMind. (2024). Introducing gemini: Our next-generation AI model. https://www.deepmind.com/blog/introducing-gemini-our-next-generation-ai-model.
- Grewal, D., Krishnan, R., Baker, J., & Borin, N. (1998). The effect of store name, brand name and price discounts on consumers’ evaluations and purchase intentions. Journal of Retailing, 74, 331–352. [CrossRef]
- Hamner, B., & Frasco, M. (2022). Metrics: Evaluation metrics for machine learning (r package version 0.1.4). https://CRAN.R-project.org/package=Metrics.
- Han, Y. J., Nunes, J. C., & Drèze, X. (2010). Signaling status with luxury goods: The role of brand prominence. Journal of Marketing, 74, 15–30. [CrossRef]
- Hennig-Thurau, T., Gwinner, K. P., Walsh, G., & Gremler, D. D. (2004). Electronic word-of-mouth via consumer-opinion platforms: What motivates consumers to articulate themselves on the internet? Journal of Interactive Marketing, 18, 38–52.
- https://doi.org/10.1002/dir.10073.
- Kahneman, D., & Tversky, A. (1979). Prospect theory: An analysis of decision under risk.
- Econometrica, 47, 263–292 Kapferer, J.-N., & Bastien, V. (2012). The luxury strategy: Break the rules of marketing. [CrossRef]
- to build luxury brands. Journal of Product & Brand Management, 23, 244–245. [CrossRef]
- Keller, K. L. (2013). Strategic brand management (4th ed.). Pearson Higher Education.
- Ku, H.-H., Kuo, C.-C., & Kuo, T.-W. (2012). The effect of scarcity on the purchase intentions of prevention and promotion motivated consumers. Psychology and Marketing, 29, 541–548. [CrossRef]
- Kuhn, M. (2022). Caret: Classification and regression training (r package version 6.0-93). https://CRAN.R-project.org/package=caret.
- Ladeira, W. J., Lim, W. M., Oliveira Santini, F. de, Rasul, T., Perin, M. G., & Altinay, L. (2023). A meta-analysis on the effects of product scarcity. Psychology & Marketing, 40(7), 1267–1279. [CrossRef]
- Lee, S. Y., Oh, S., & Jung, S. (2014). The effects of scarcity appeal on product evaluation: Consumers’ cognitive resources and company reputation. Social Behavior and Personality: An International Journal, 42, 743–756. [CrossRef]
- Leibenstein, H. (1950). Bandwagon, snob, and veblen effects in the theory of consumers’ demand. The Quarterly Journal of Economics, 64, 183–207.
- Liaw, A., & Wiener, M. (2002). Classification and regression by randomForest. R News, 2(3), 18–22. https://CRAN.R-project.org/package=randomForest.
- Liu, Y. (2006). Word of mouth for movies: Its dynamics and impact on box office revenue.
- Journal of Marketing, 70, 74–89. [CrossRef]
- Lynn, M. (1991). Scarcity effects on value: A quantitative review of the commodity theory literature. Psychology and Marketing, 8, 43–57.
- https://doi.org/10.1002/mar.4220080105.
- Meyer, D., Dimitriadou, E., Hornik, K., Weingessel, A., & Leisch, F. (2021). e1071: Misc functions of the department of statistics, probability theory group (formerly: E1071), TU wien (r package version 1.7-9). https://CRAN.R-project.org/package=e1071.
- Molnar, C., Bischl, B., & Casalicchio, G. (2022). Iml: Interpretable machine learning (r package version 0.11.1). https://CRAN.R-project.org/package=iml.
- Oliver, R. L. (1980). A cognitive model of the antecedents and consequences of satisfaction decisions. Journal of Marketing Research, 17, 460–469. [CrossRef]
- OpenAI. (2023). GPT-4 technical report. https://arxiv.org/abs/2303.08774.
- Senecal, S., & Nantel, J. (2004). The influence of online product recommendations on consumers’ online choices. Journal of Retailing, 80, 159–169. [CrossRef]
- Sista, B., Casais, B., & Moutinho, N. (2022). Online reviews of discount products: The case of steam. In Marketing and Smart Technologies: Proceedings of ICMarkTech 2021, 1, 259–268.
- Spence, M. (1973). Job market signaling. The Quarterly Journal of Economics, 87, 355–374. [CrossRef]
- Torrance, E. P., & Brehm, J. W. (1966). A theory of psychological reactance. The American Journal of Psychology, 81, 133. [CrossRef]
- Ushey, K., Allaire, J., & Tang, Y. (2024). Reticulate: Interface to python (r package version 1.34.0) [computer software]. https://rstudio.github.io/reticulate/.
- Wei, T., & Simko, V. (2021). Corrplot: Visualization of a correlation matrix (r package version 0.92). https://CRAN.R-project.org/package=corrplot.
- Wickham, H., Averick, M., Bryan, J., Chang, W., McGowan, L. D., François, R., Grolemund, G., Hayes, A., Henry, L., Hester, J., Kuhn, M., Pedersen, T. L., Miller, E.,.
- Bache, S. M., Müller, K., Ooms, J., Robinson, D., Seidel, D. P., Spinu, V., & Yutani, H.
- (2019). Welcome to the tidyverse. Journal of Open Source Software, 4(43), 1686. [CrossRef]
- Yltävä, L. (2024). Topic: Beauty and personal care e-commerce in the united states.
- Statista. https://www.statista.com/topics/2381/beauty-and-personal-care- ecommerce/#topicOverview.
- Zhang, Z., Ye, Q., Law, R., & Li, Y. (2010). The impact of e-word-of-mouth on the online popularity of restaurants: A comparison of consumer reviews and editor reviews.
- International Journal of Hospitality Management, 29, 694–700. [CrossRef]
Figure 1.
Distribution of review counts before and after log transformation.
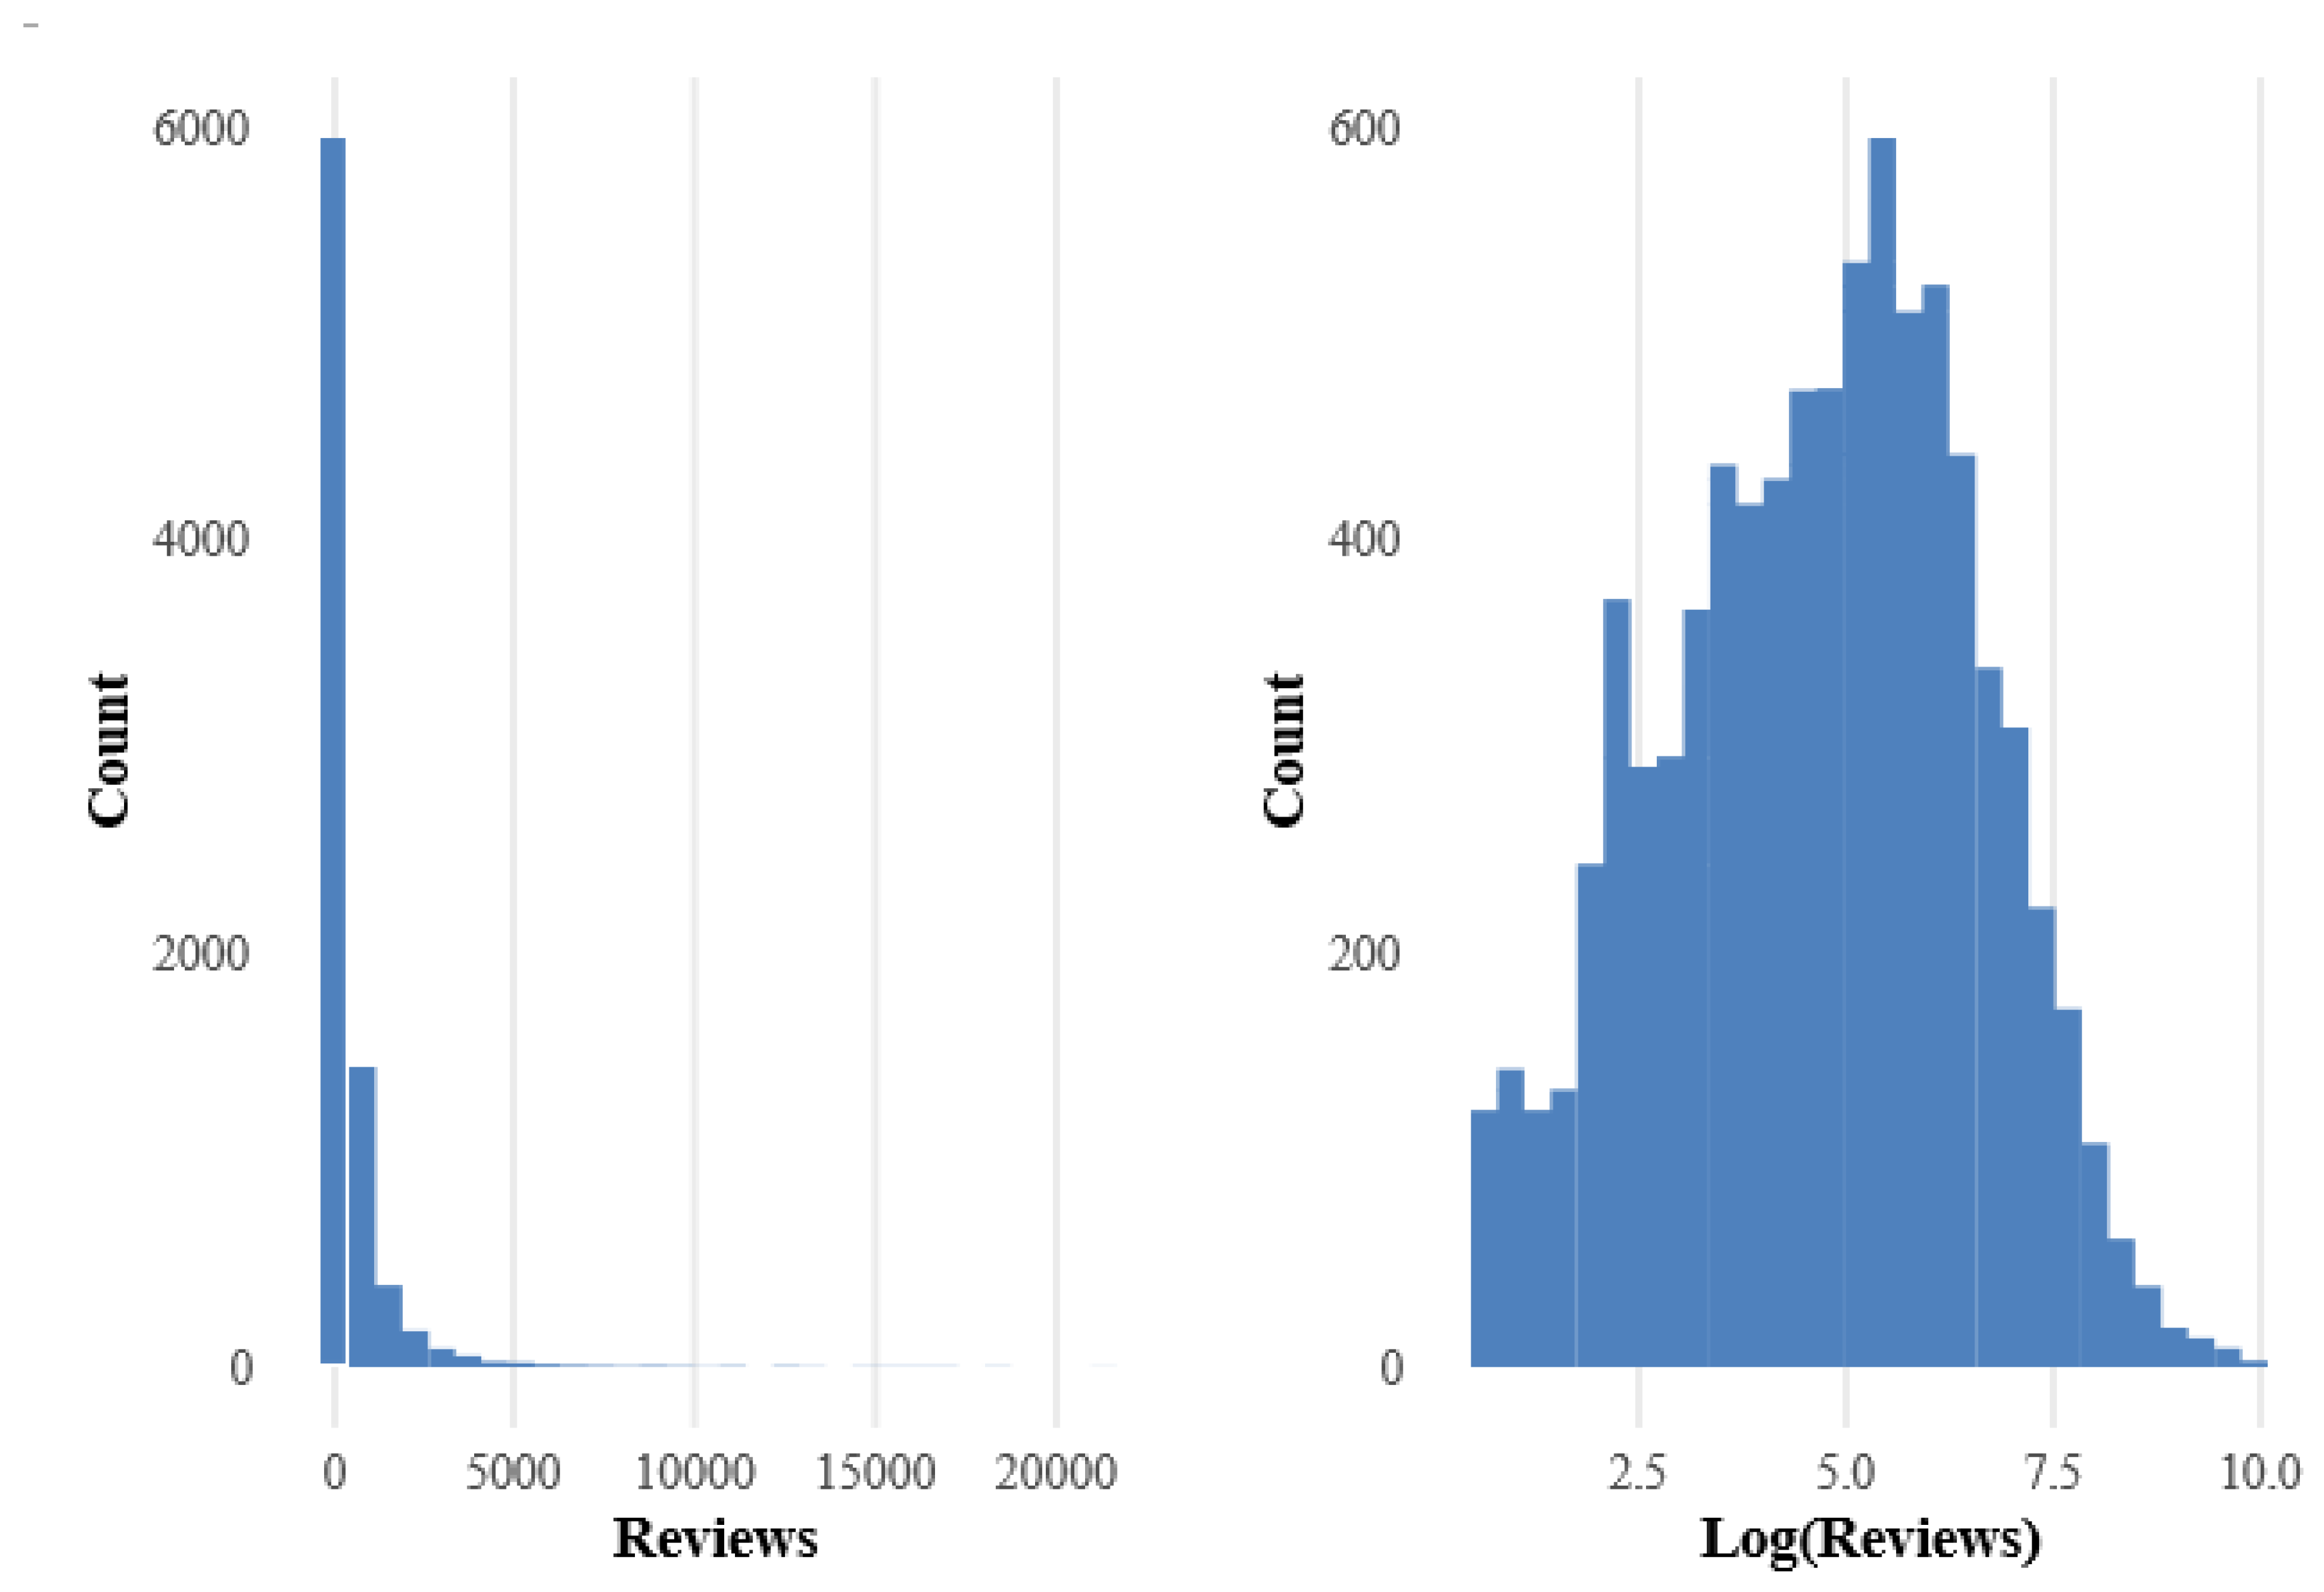
Figure 2.
Top 20 brands by product count in the dataset.
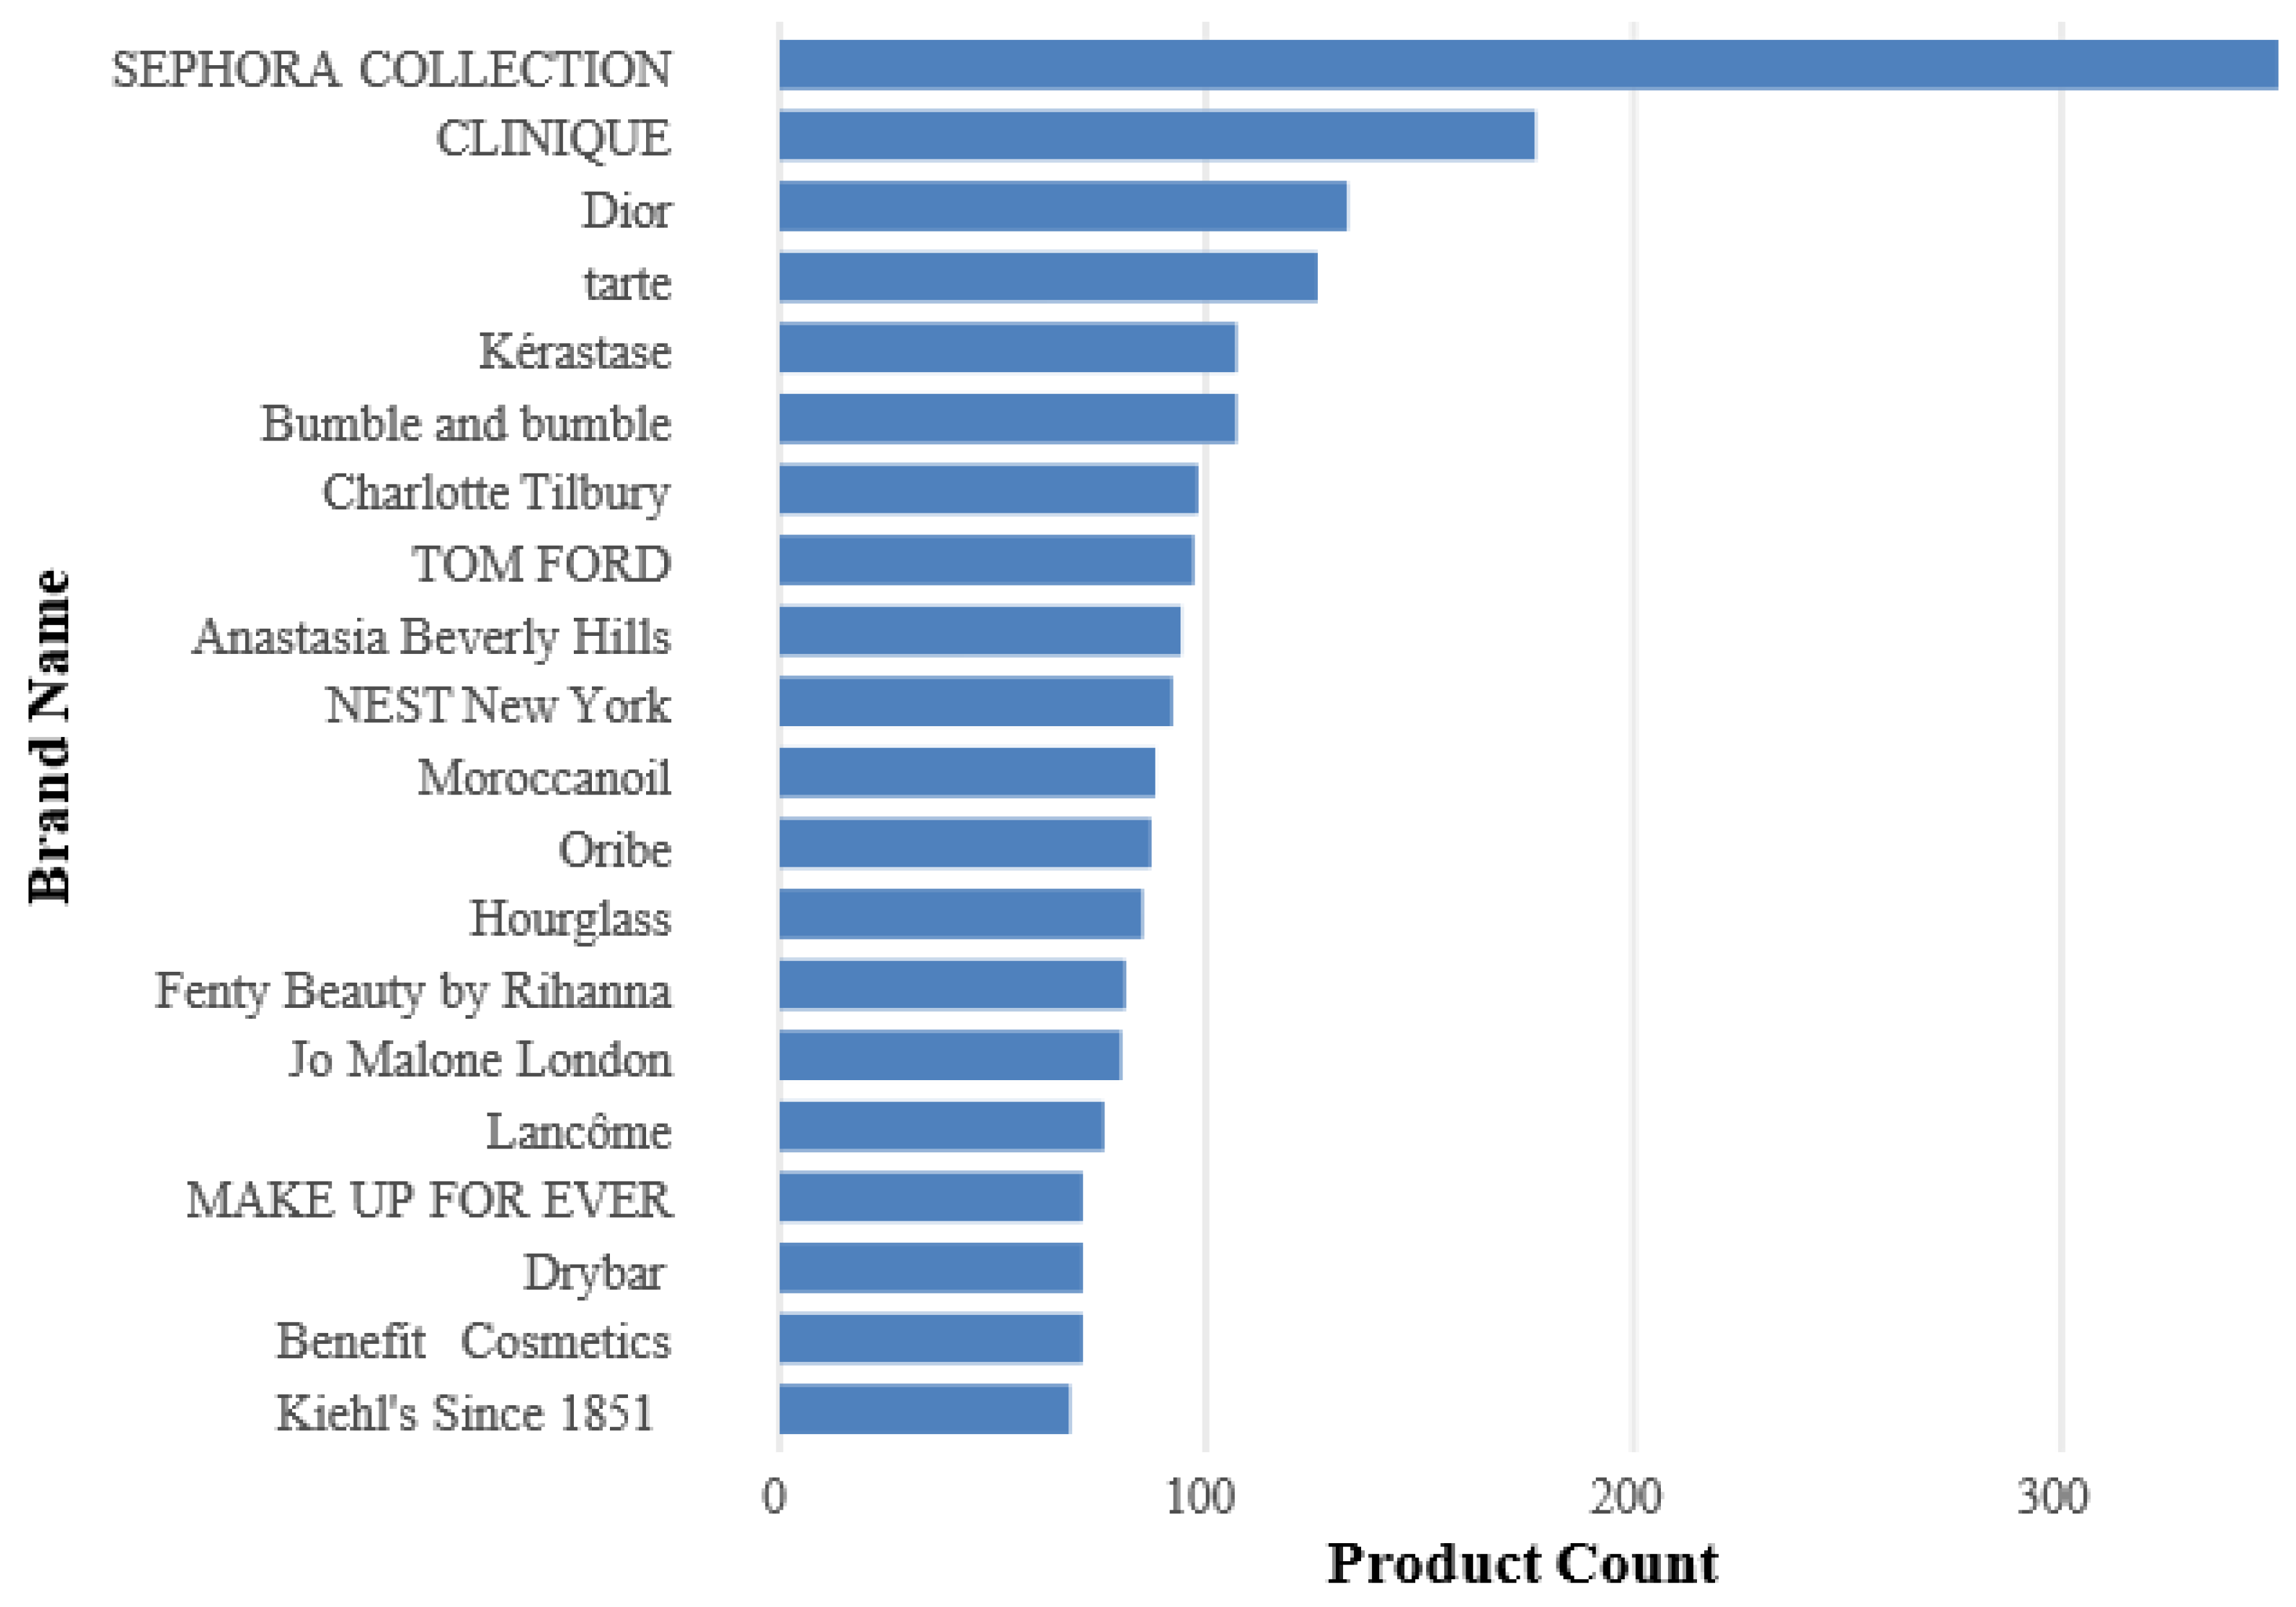
Figure 3.
Distribution of log-transformed review counts by product group.
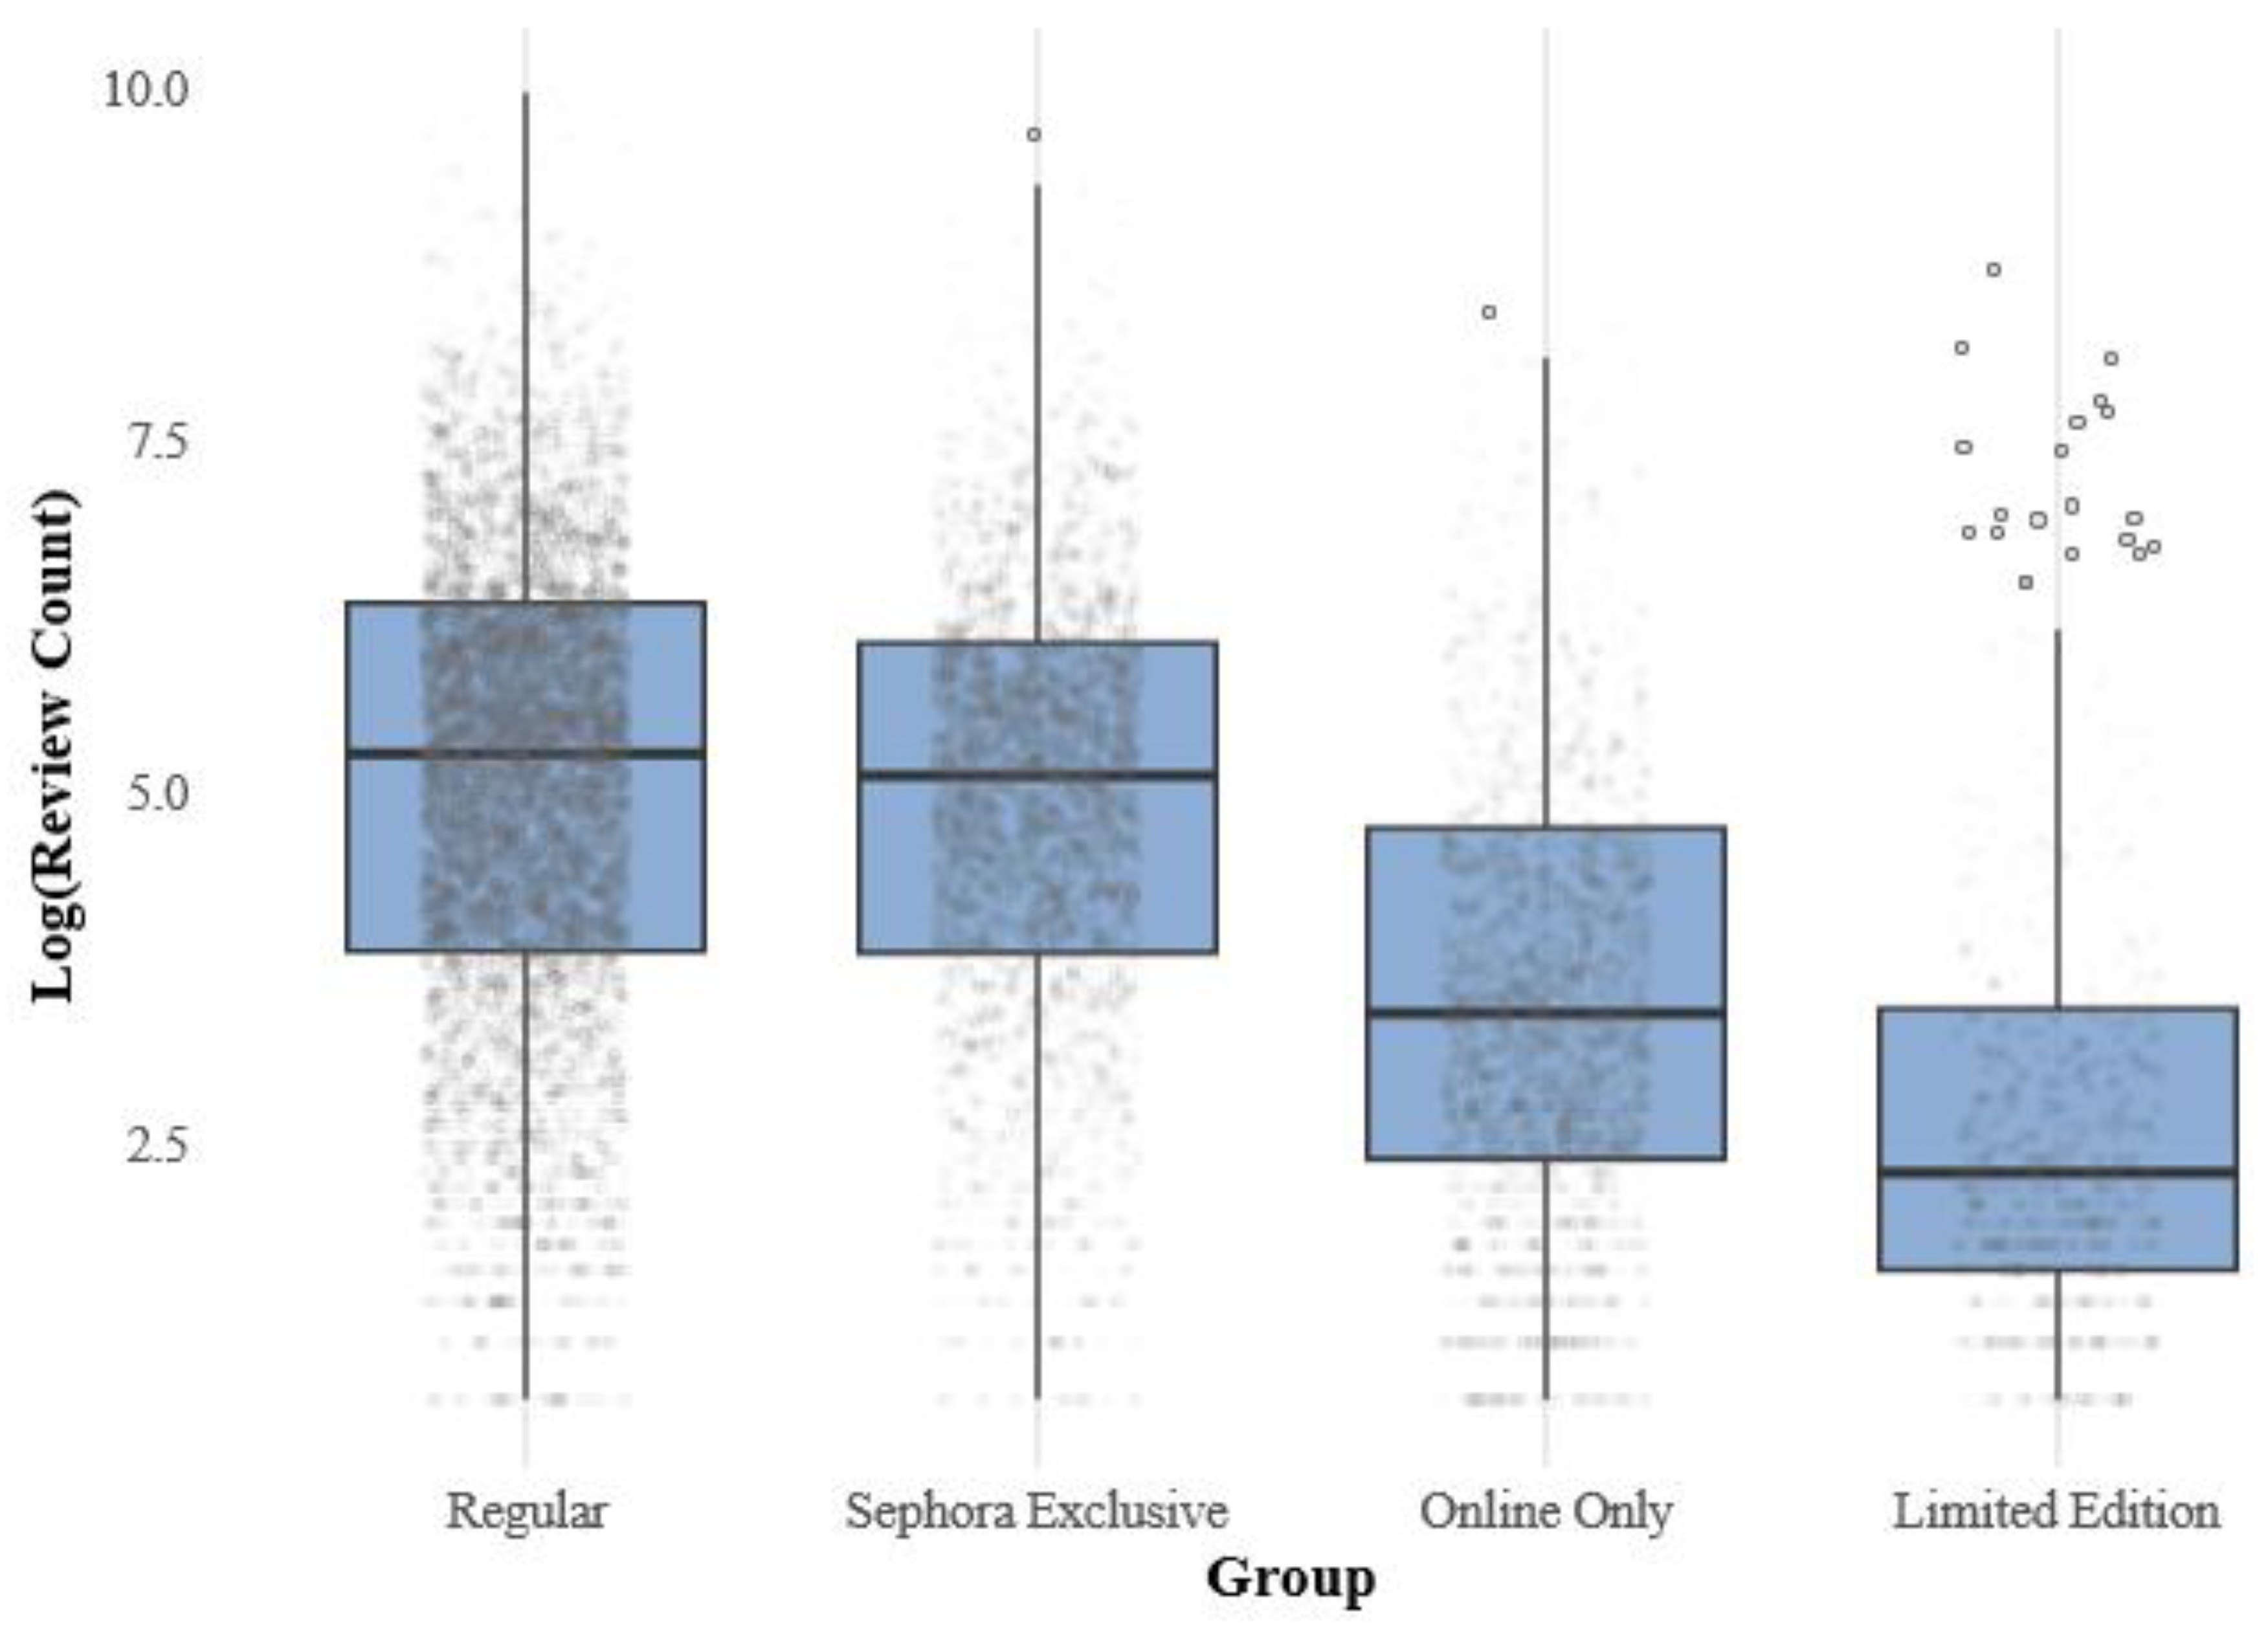
Figure 4.
Comparison of Predictive Model Performance Across Key Metrics.
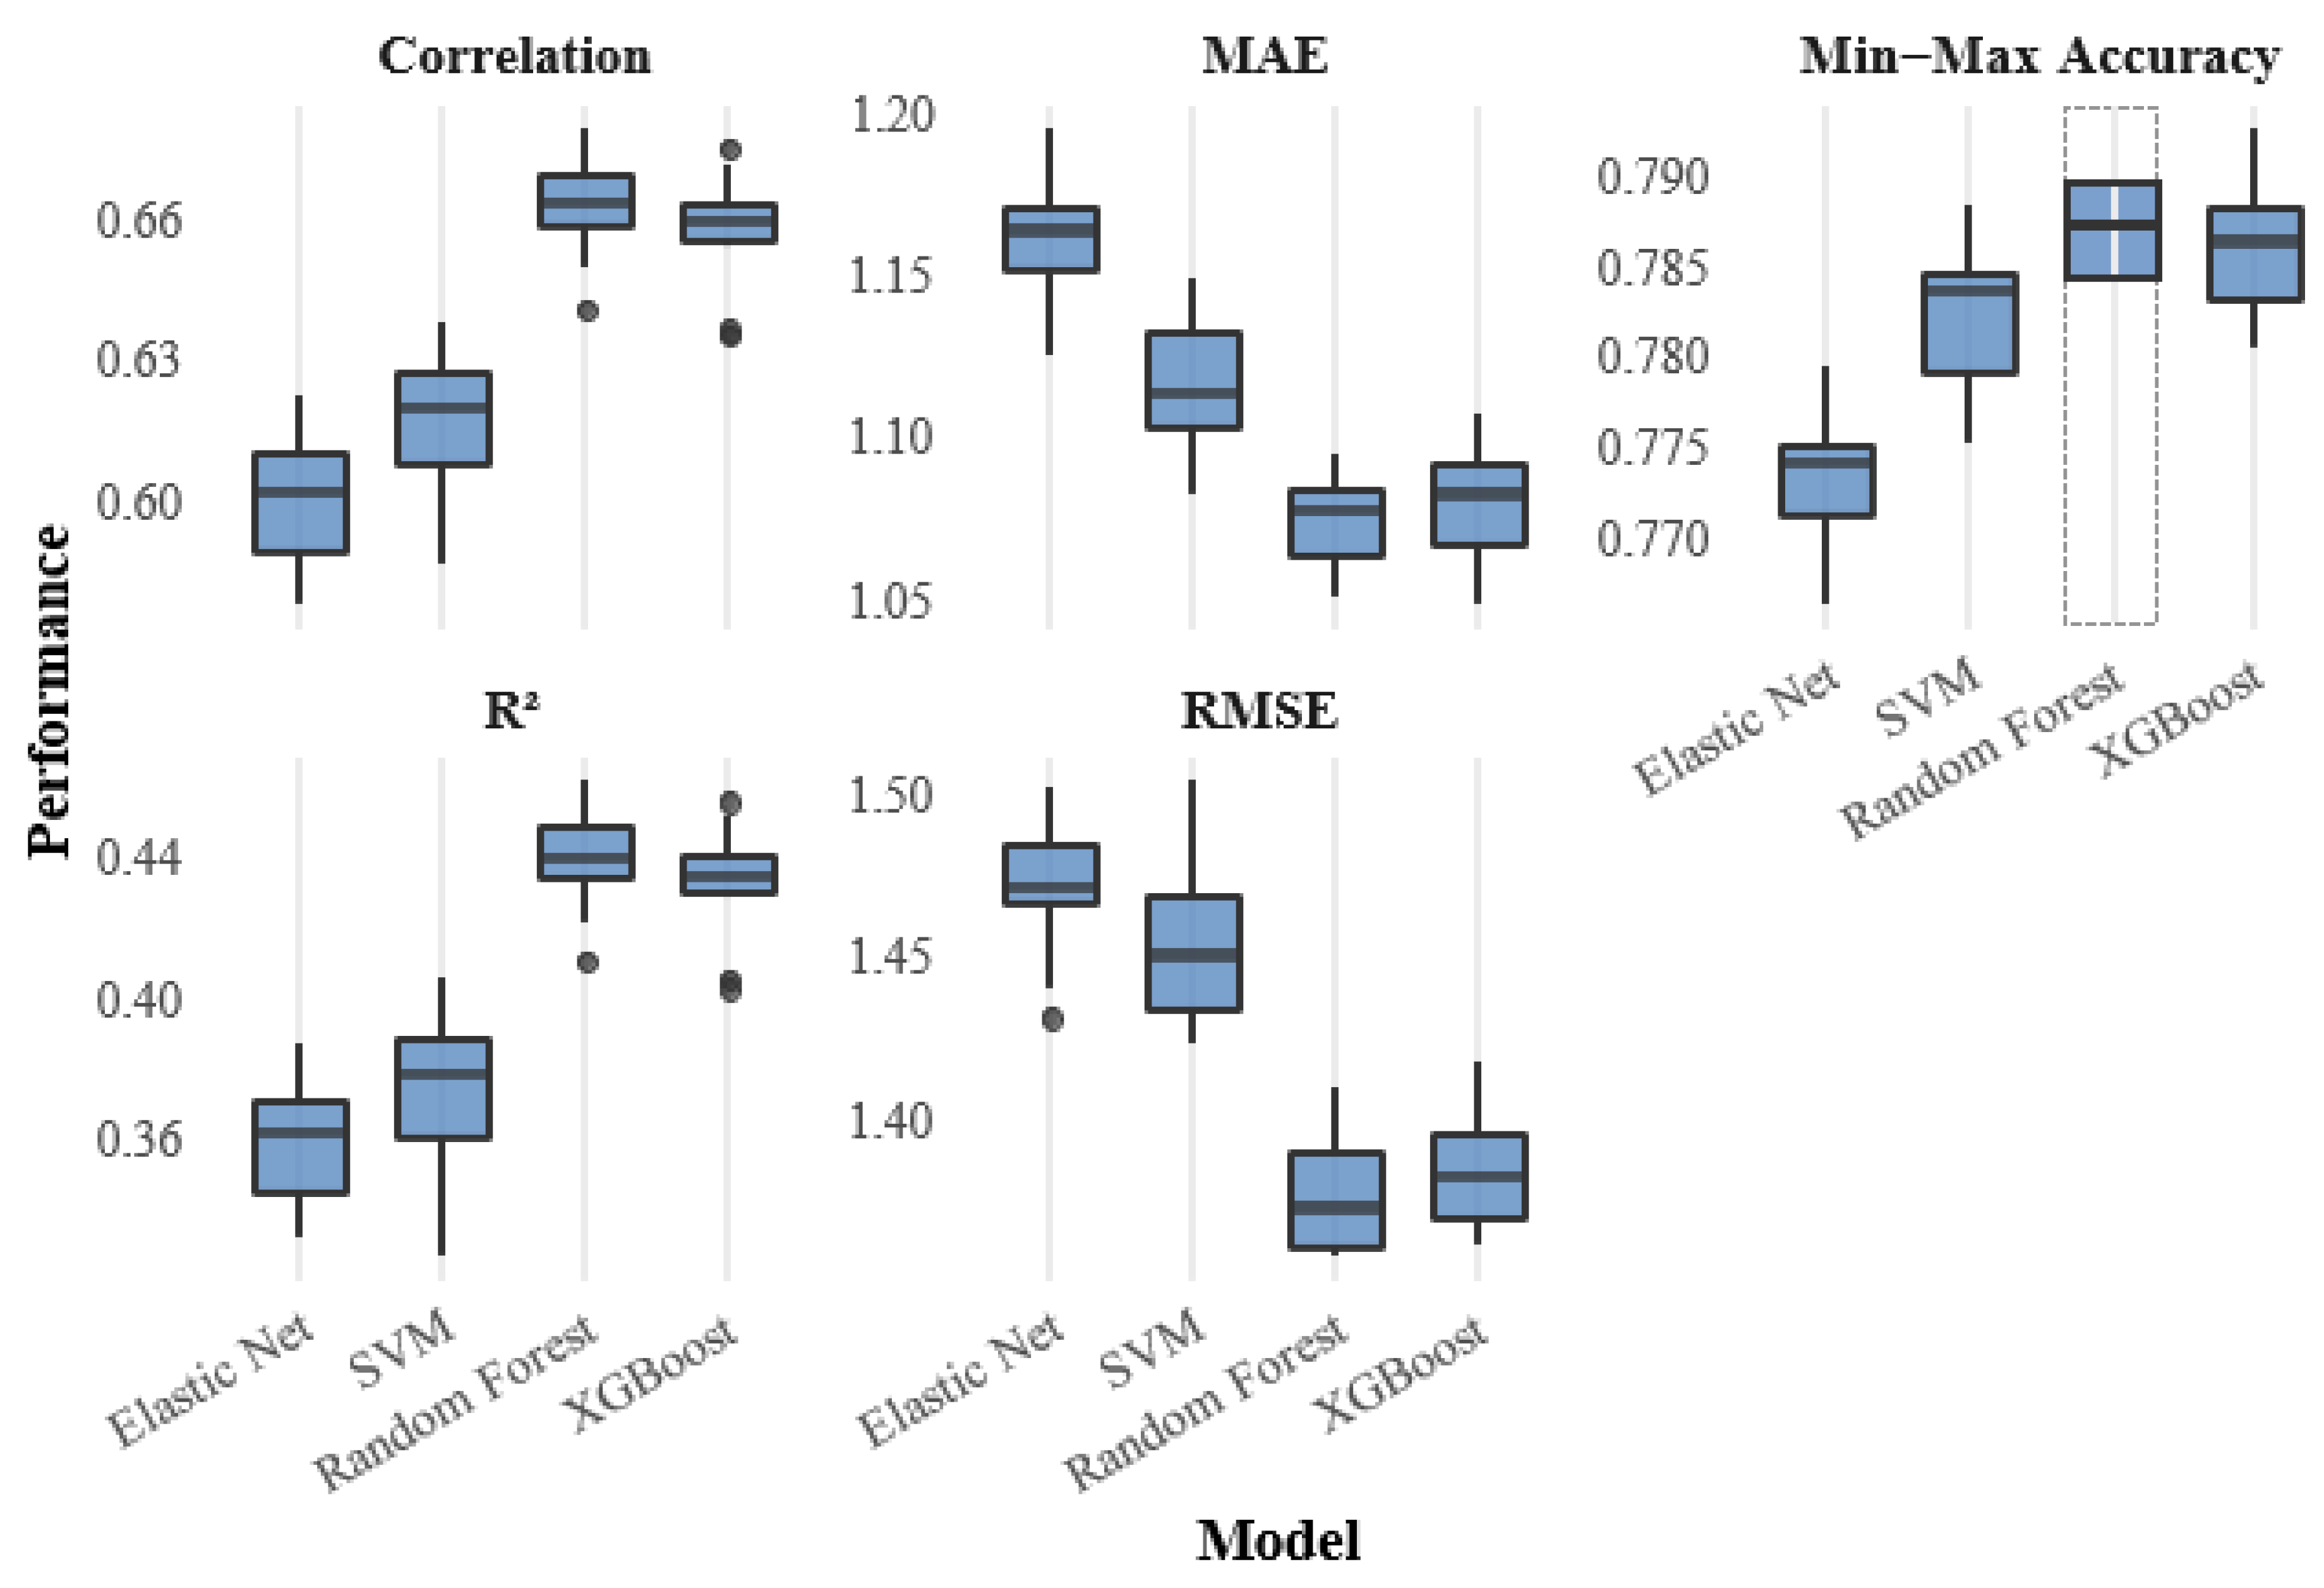
Figure 5.
Top 20 Important Features (Random Forest).
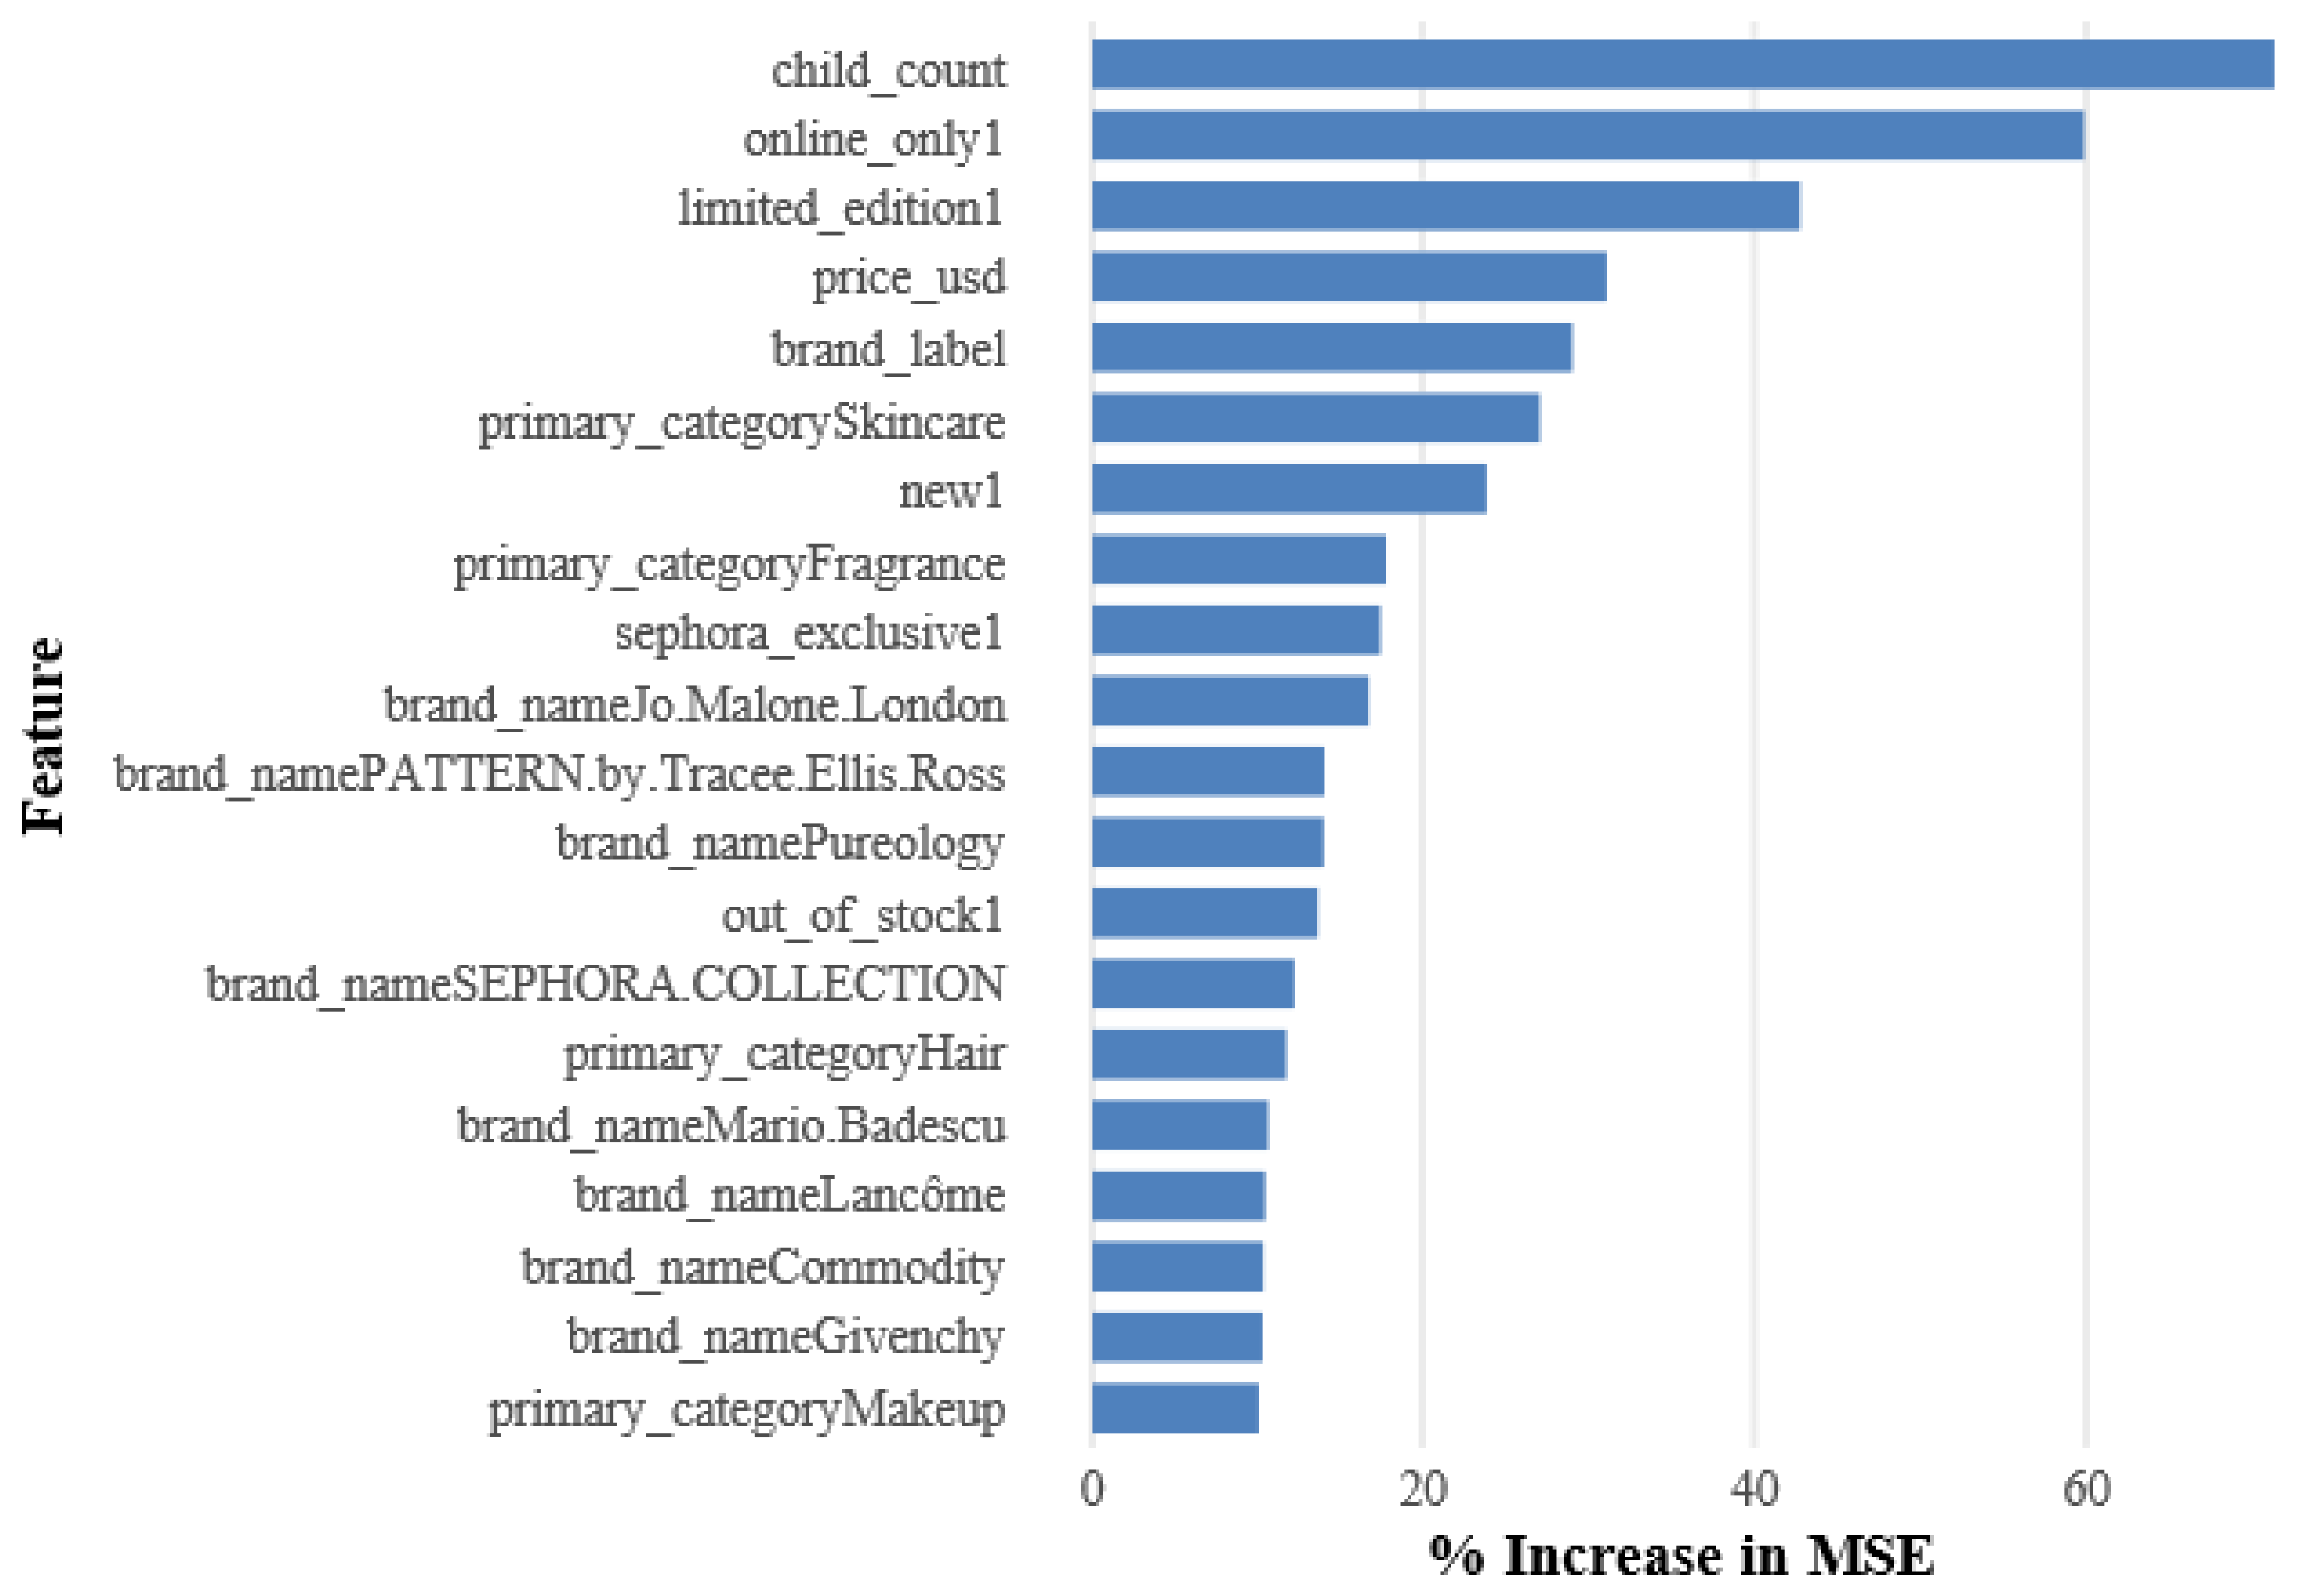
Figure 6.
Top 20 Important Features (XGBoost).
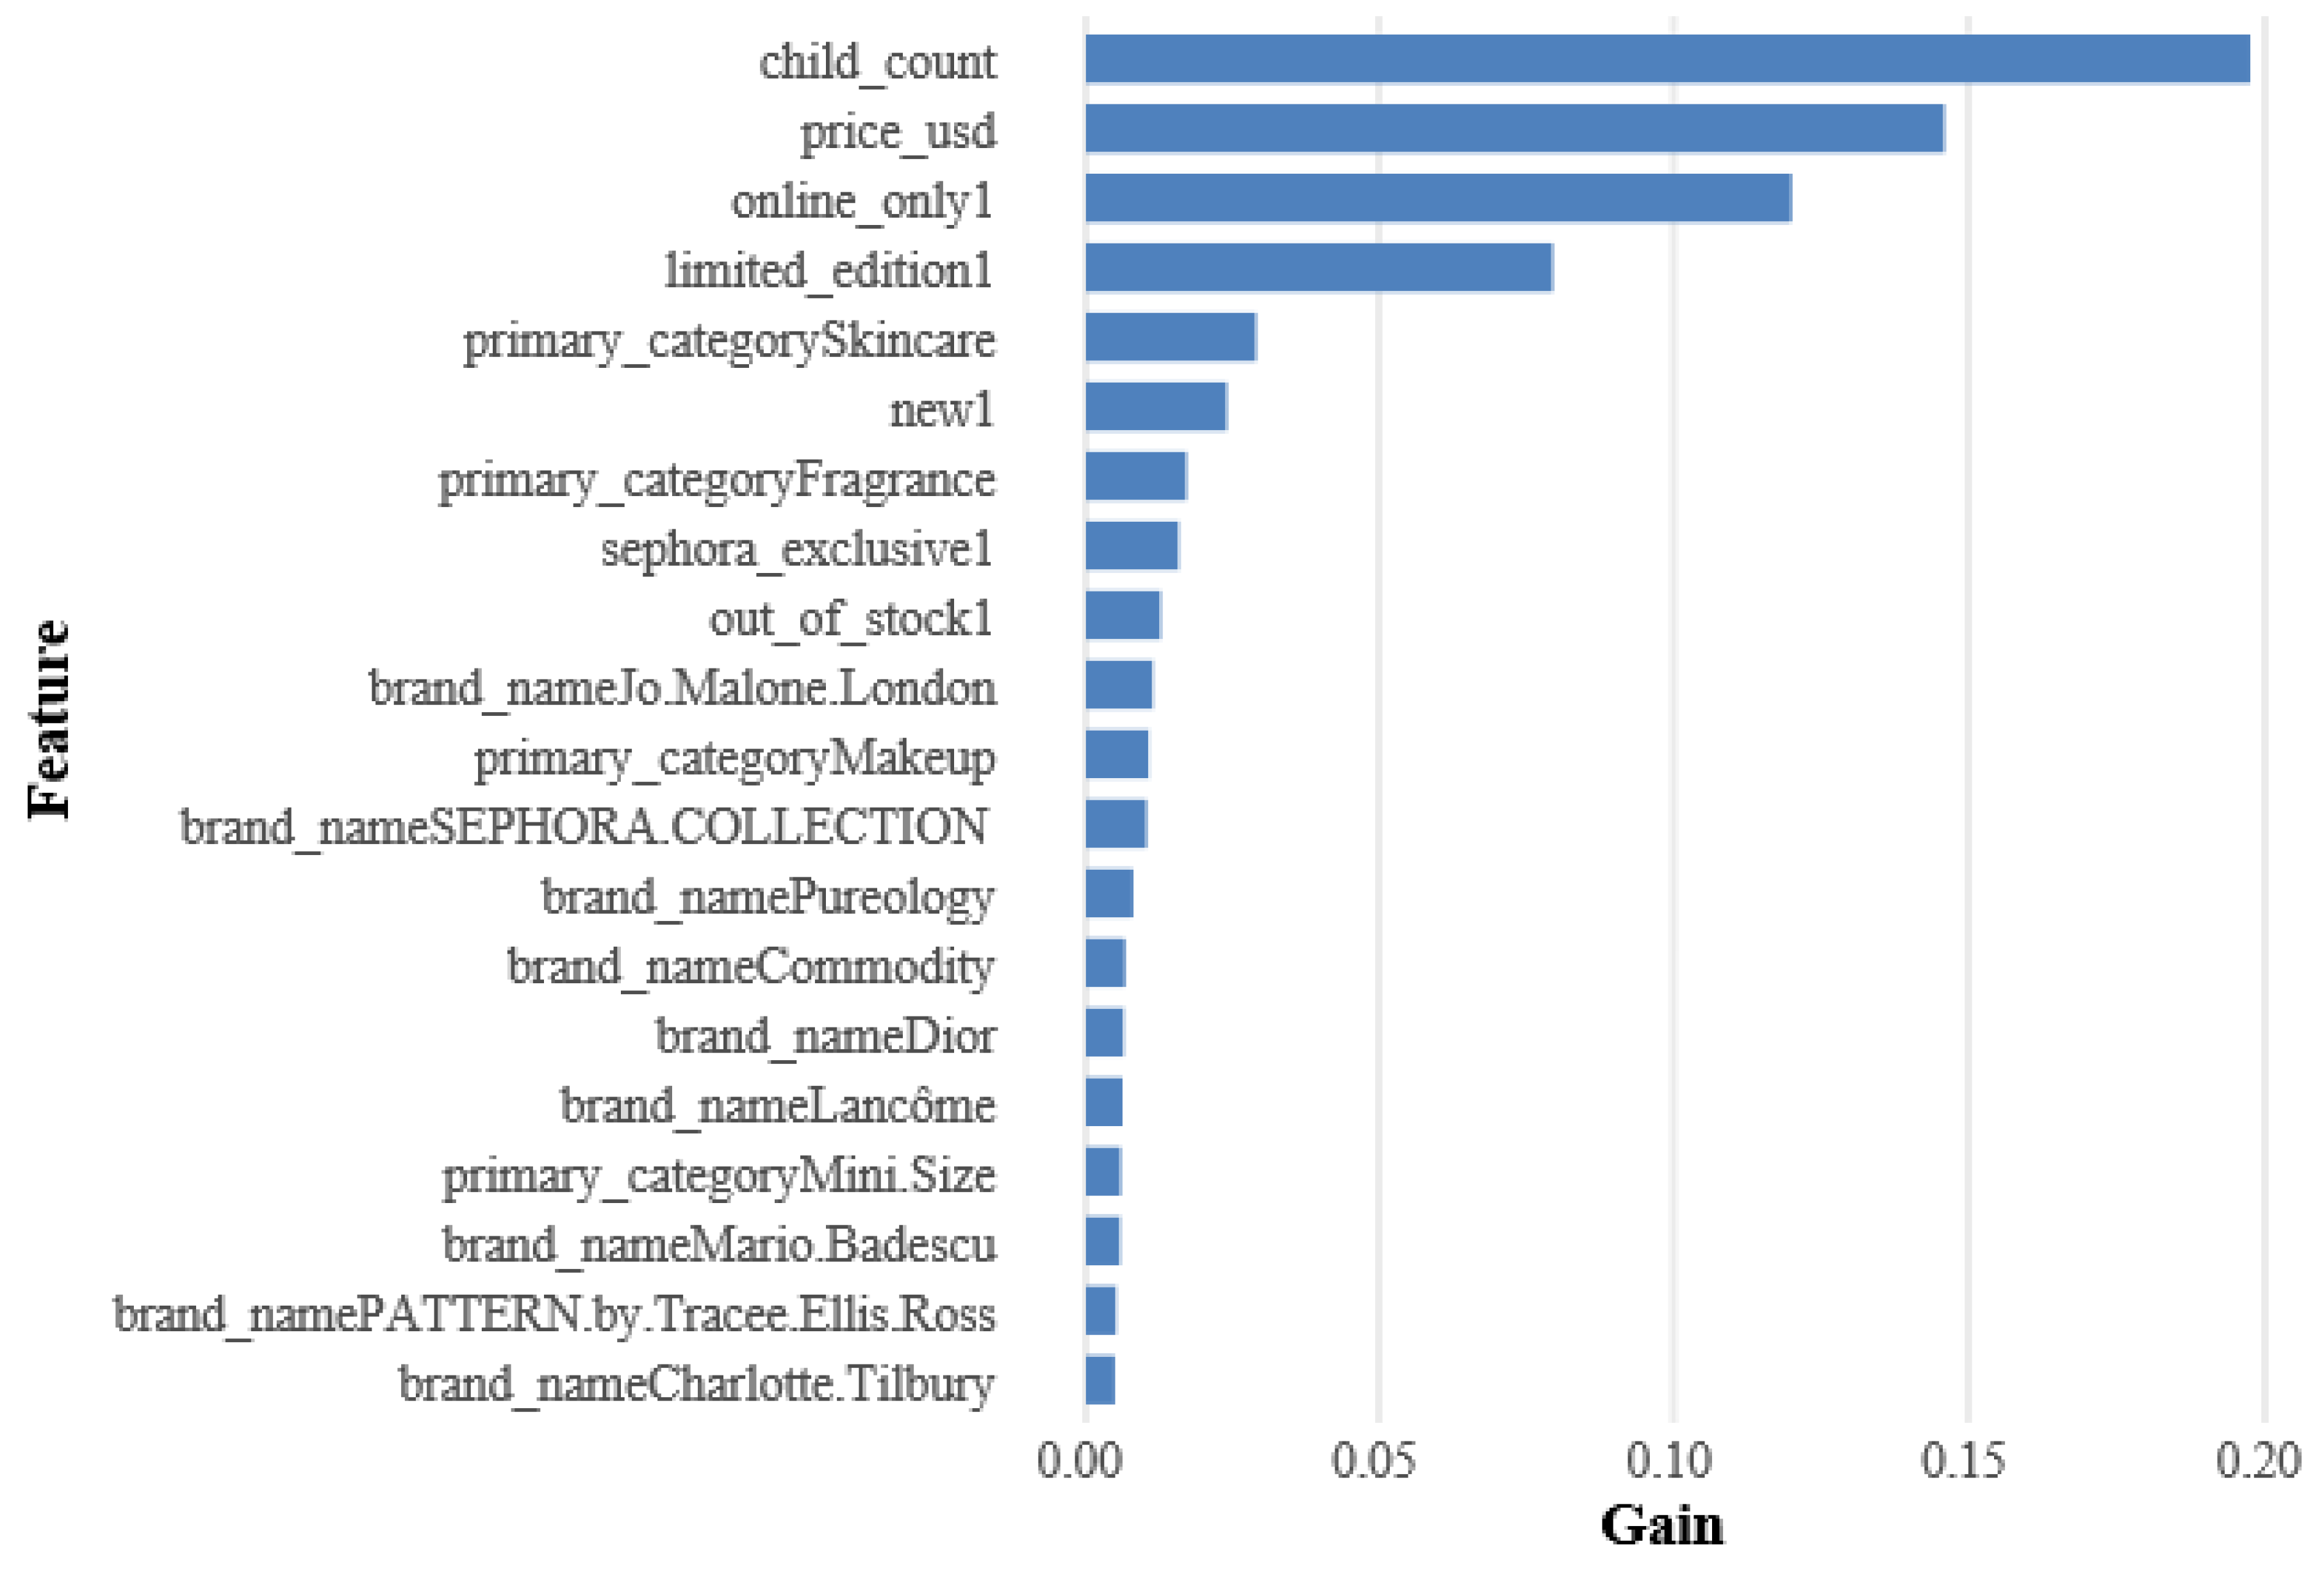

Table 1.
Summary Statistics of Key Variables.
| Variable | M (SD) | Median | Min | Max |
| Reviews | 448.55 (1101.98) | 122.00 | 1 | 21281 |
| Rating | 4.19 (0.52) | 4.29 | 1 | 5 |
| Loves Count | 30140.86 (66990.38) | 10444.00 | 0 | 1401068 |
| Price (USD) | 51.23 (53.41) | 35.00 | 3 | 1900 |
| Child Count | 1.68 (5.46) | 0.00 | 0 | 105 |
Table 2.
Frequency and Percent of Products with Binary Attribute Present.
| Variable | Frequency | Percent (%) |
| Limited Edition | 508 | 6.2 |
| Sephora Exclusive | 2310 | 28.1 |
| Online Only | 1722 | 21.0 |
| New Product | 486 | 5.9 |
| Out of Stock | 587 | 7.1 |
Table 3.
Product Counts by Primary Category.
| Primary Category | Count | Percent (%) |
| Skincare | 2351 | 28.6 |
| Makeup | 2328 | 28.3 |
| Hair | 1416 | 17.2 |
| Fragrance | 1339 | 16.3 |
| Bath & Body | 395 | 4.8 |
| Mini Size | 274 | 3.3 |
| Men | 59 | 0.7 |
| Tools & Brushes | 50 | 0.6 |
| Gifts | 4 | 0.0 |
Table 4.
Tukey HSD Post-Hoc Comparisons of Log-Transformed Review Counts Across Mutually Exclusive Product Categories.
Table 4.
Tukey HSD Post-Hoc Comparisons of Log-Transformed Review Counts Across Mutually Exclusive Product Categories.
| Comparison | Mean Difference | 95% CI (Lower) | 95% CI (Upper) | p |
| Limited Edition vs. Regular | -2.39 | -2.59 | -2.18 | < .001 |
| Sephora Exclusive vs. Regular | -0.16 | -0.27 | -0.04 | .003 |
| Online Only vs. Regular | -1.50 | -1.64 | -1.37 | < .001 |
| Sephora Exclusive vs. Limited Edition | 2.23 | 2.02 | 2.44 | < .001 |
| Online Only vs. Limited Edition | 0.88 | 0.65 | 1.11 | < .001 |
| Online Only vs. Sephora Exclusive | -1.35 | -1.50 | -1.20 | < .001 |
Table 5.
Model Performance Summary (Before Residualization).
| Model | COR (M ± SD) | RMSE (M ± SD) | MAE (M ± SD) | R² (M ± SD) | Min-Max (M ± SD) |
| Elastic Net | 0.601 ± 0.014 | 1.471 ± 0.022 | 1.162 ± 0.019 | 0.360 ± 0.018 | 0.773 ± 0.004 |
| Random Forest | 0.663 ± 0.011 | 1.377 ± 0.019 | 1.074 ± 0.014 | 0.439 ± 0.015 | 0.787 ± 0.003 |
| SVM | 0.618 ± 0.016 | 1.454 ± 0.025 | 1.116 ± 0.021 | 0.375 ± 0.023 | 0.782 ± 0.004 |
| XGBoost | 0.658 ± 0.013 | 1.385 ± 0.021 | 1.081 ± 0.019 | 0.433 ± 0.017 | 0.786 ± 0.004 |
Table 6.
Model Performance Summary (After Residualization).
| Model | COR (M ± SD) | RMSE (M ± SD) | MAE (M ± SD) | R² (M ± SD) | Min-Max (M ± SD) |
| Elastic Net | 0.471 ± 0.022 | 1.494 ± 0.024 | 1.180 ± 0.021 | 0.221 ± 0.019 | -0.071 ± 1.659 |
| Random Forest | 0.501 ± 0.016 | 1.491 ± 0.017 | 1.152 ± 0.012 | 0.223 ± 0.026 | 3.429 ± 5.634 |
| SVM | 0.501 ± 0.022 | 1.468 ± 0.025 | 1.146 ± 0.022 | 0.247 ± 0.023 | 0.698 ± 0.553 |
| XGBoost | 0.530 ± 0.018 | 1.443 ± 0.021 | 1.121 ± 0.016 | 0.273 ± 0.024 | -2.333 ± 8.391 |
Disclaimer/Publisher’s Note: The statements, opinions and data contained in all publications are solely those of the individual author(s) and contributor(s) and not of MDPI and/or the editor(s). MDPI and/or the editor(s) disclaim responsibility for any injury to people or property resulting from any ideas, methods, instructions or products referred to in the content. |
© 2025 by the author. Licensee MDPI, Basel, Switzerland. This article is an open access article distributed under the terms and conditions of the Creative Commons Attribution (CC BY) license (https://creativecommons.org/licenses/by/4.0/).
Copyright: This open access article is published under a Creative Commons CC BY 4.0 license, which permit the free download, distribution, and reuse, provided that the author and preprint are cited in any reuse.


