
Submitted:
02 October 2025
Posted:
16 October 2025
You are already at the latest version
Abstract
The fashion industry is notoriously dynamic, marked by rapid trend shifts and volatile consumer behaviour. This project shifts focus from traditional sales forecasting to predicting customer review ratings, leveraging textual data and associated metadata from e-commerce platforms. The primary objective was to develop a stable and highly accurate machine learning framework that predicts binned product ratings based on comprehensive feature engineering and advanced Natural Language Processing (NLP) techniques. Key feature engineering steps included creating sentiment scores, developing aspect-based features, and strategically categorizing demographic data (age into generational groups). Utilizing the Women's Clothing E-Commerce Reviews dataset, the research rigorously compares a traditional Random Forest Classifier against a deep learning Bidirectional Long Short-Term Memory (LSTM) network. The results conclusively demonstrate that the LSTM model significantly outperforms the strong baseline, achieving superior stability (Std Dev of 0.0019 and, critically, a vastly improved ability to identify the minority class of negative or neutral reviews, F1= 0.7134 vs. 0.47. This validates the need for deep sequential learning in this domain, providing a nuanced, valuable, and stable predictive tool for proactive retail strategic planning and quality control.
Keywords:
customer review ratings
; fashion e-commerce
; machine learning
; natural language processing (NLP)
; feature engineering
; sentiment analysis
; aspect-based features
; demographic segmentation
; predictive modelling
1. Introduction
1.1. The E-Commerce Landscape and Value of Unstructured Data
The digital revolution has fundamentally reshaped consumer-retailer interactions. The global fashion e-commerce market is valued in the hundreds of billions of dollars, but its high-stakes environment is characterized by short product lifecycles and high return rates. Unlike commodities, fashion products involve subjective attributes like fit, style, and texture, making the gap between expectation and reality a major source of customer dissatisfaction. In this context, customer reviews represent an invaluable, real-time data stream that captures this subjective experience.
These reviews serve as the voice of the customer, often containing nuanced opinions embedded in unstructured text. While high sales volume is a necessary condition for business success, sustained profitability and brand loyalty hinge on understanding the sentiment expressed within these reviews. Traditional analytics, focused on historical sales data (Sundararaman & Ramalingam, 2021), are inherently reactive. A proactive analytical approach requires accurately predicting the severity of the feedback, particularly the negative feedback, before it translates into brand damage or costly returns.
1.2. Defining the Research Problem: Class Imbalance and Nuance
The primary analytical challenge in e-commerce review prediction is the overwhelming class imbalance. A vast majority of users who take the time to submit a review are either highly satisfied (Rating 4 or 5) or highly motivated by dissatisfaction (Rating 1, 2, or 3). The positive class dominates, typically representing or more of the data. A simple model can achieve high overall accuracy (e.g., 80%) by simply predicting “Positive” for every input, making such a model useless for business intelligence.
Therefore, the critical research problem is not merely achieving high accuracy but developing a model capable of robustly and reliably distinguishing the smaller, more complex, and business-critical minority class (Low or Medium ratings). This requires a sophisticated approach to feature engineering and a model architecture designed to extract deep semantic context from the text.
1.3. Research Objectives and Questions
The central objective of this research is to develop and rigorously compare machine learning and deep learning models for predicting binned e-commerce product review ratings, with the explicit goal of maximizing predictive accuracy and stability for the minority, non-positive review class.
This objective is segmented into three research questions:
- RQ1: Can a comprehensive feature engineering framework, combining text vectorization (TF-IDF and embeddings) with structured demographic and product metadata, significantly enhance the predictive performance of a rating classification model?
- RQ2: In the context of a highly imbalanced fashion review dataset, how does a standard Machine Learning model (Random Forest Classifier) compare to a deep learning NLP model (Bidirectional LSTM) in terms of overall accuracy, stability, and, most critically, the F1-score for the minority ‘Low_Medium’ rating class?
- RQ3: What are the theoretical and managerial implications of using a highly stable deep learning model for proactive quality control and strategic decision-making in the dynamic e-commerce fashion industry?
1.4. Significance and Contribution
This project makes a three-fold contribution to the fields of retail analytics and computational linguistics:
- Methodological Validation: It provides a statistically sound validation of the Bidirectional LSTM architecture’s superiority over a strong traditional ensemble baseline (Random Forest) for predicting non-positive sentiment in a highly imbalanced, domain-specific dataset.
- Stability Analysis: By employing a five-run statistical stability test, the research guarantees that the reported performance metrics (especially the high F1-score on the minority class) are reliable and not the result of a single, favourable random initialization, which is a common vulnerability in deep learning studies.
- Managerial Relevance: By prioritizing the F1-Score of the minority class, the study directly addresses a critical, actionable business need: the immediate identification of customer dissatisfaction for risk mitigation and strategic intervention.
2. Literature Review
2.1. The Theoretical Foundation: E-Commerce and Fashion Analytics
The need for advanced analytics in fashion retail stems from the industry’s unique volatility. Thomassey (2014) highlights that fashion is characterized by high demand variability, short selling periods, and often insufficient historical data for new items. Forecasting efforts have traditionally cantered on sales prediction (Sundararaman & Ramalingam, 2021; Syntetos et al., 2016), leveraging external features like macroeconomic indicators or online search trends (Ribeiro et al., 2020). However, these models often miss the qualitative consumer experience. This project aligns with the modern shift toward customer experience management (CXM), where text mining and NLP are essential tools for extracting prescriptive insights.
2.2. Text Representation and Traditional Machine Learning (TF-IDF and Random Forest)
Text classification fundamentally relies on converting unstructured text into a numerical format. Term Frequency-Inverse Document Frequency (TF-IDF) is a well-established vectorization technique that weighs the importance of a word in a document relative to its frequency across the entire corpus (Jurafsky & Martin, 2023). It is highly effective when a few discriminative keywords (e.g., “cheap,” “flattering,” “disappointed”) strongly correlate with the target class.
The Random Forest Classifier is an ensemble method known for its robustness, ability to handle both numerical and categorical features (like the engineered metadata), and relative resistance to overfitting (Pedregosa et al., 2011). It serves as an ideal baseline because it effectively utilizes the feature-engineered data—both the 5000 TF-IDF features and the structured metadata. The key limitation of this approach in NLP is its Bag-of-Words assumption, which completely ignores word order and the long-range context critical for nuanced sentiment.
2.3. Deep Learning for Sequential Context: Bidirectional LSTMs
To overcome the limitations of the Bag-of-Words approach, Deep Learning (DL) architectures, specifically Recurrent Neural Networks (RNNs), are required. RNNs process sequences, but vanilla RNNs suffer from the vanishing gradient problem, making them ineffective at learning long-term dependencies.
The Long Short-Term Memory (LSTM) network (Hochreiter & Schmidhuber, 1997, cited in Goodfellow et al., 2016) solves this by using internal gating mechanisms (input, forget, and output gates) that control the flow of information, allowing the network to retain information over long sequences (e.g., a lengthy, detailed review).
Crucially, the Bidirectional LSTM (Bi-LSTM) processes the input sequence twice: once from beginning to end and once from end to beginning. This enables the network to leverage context from both the past and the future of a word in a sequence, creating a richer, more context-aware representation of the text. For a customer review, this is paramount, as the meaning of a phrase often depends on the following sentence (e.g., “I wanted to love this dress... but the zipper broke”).
2.4. The Class Imbalance Challenge and Evaluation Metrics
The class imbalance in review datasets is a well-documented analytical pitfall. Standard metrics like Accuracy become misleading because a model can achieve high accuracy by simply predicting the majority class. Therefore, metrics that focus on the minority class are necessary.
Precision (the proportion of positive predictions that were correct) and Recall (the proportion of actual positive cases that were predicted correctly) are the primary indicators. In the context of the ‘Low_Medium’ rating class, Recall is critical for minimizing False Negatives (failing to detect a genuinely negative review). However, the best single measure that balances both concerns is the F1-Score (the harmonic mean of Precision and Recall). This project strictly adheres to maximizing the F1-Score for the minority (‘Low_Medium’) class, ensuring the model’s practical utility.
2.5. Identified Research Gaps and Project’s Unique Contribution
While deep learning for sentiment is studied, a gap exists in the direct, rigorous, and stable comparison of deep sequential models against advanced ensemble baselines specifically tailored to highly imbalanced, metadata-rich datasets in the niche area of fashion e-commerce.
This research addresses the gap by:
- Feature Fusion: Demonstrating the effective fusion of continuous embeddings (from text) and one-hot encoded metadata (demographics, product types) into a unified modeling framework.
- Stability Testing: Providing novel statistical evidence of model stability via five-run testing, establishing reliability beyond a single training result.
- Metric Alignment: Focusing the comparative analysis squarely on the minority class F1-Score, directly aligning the research output with the business need for proactive quality control (RQ2 & RQ3).
3. Methodology
3.1. Data Source and Initial Processing
The study is based on the Women’s Clothing E-Commerce Reviews dataset from Kaggle (Kaggle, 2018). The dataset is composed of approximately 23,000 reviews containing free text, product IDs, demographics (Age), and categorical metadata (Division Name, Department Name, Class Name).
3.1.1. Data Cleaning and Imputation
- Handling Nulls: Missing values in the primary feature columns, Review Text and Title, were imputed with an empty string (‘ ‘) to allow sequential processing. Rows with missing critical metadata (e.g., Division Name) were dropped.
- Text Normalization: All text was converted to lowercase. Punctuation, numbers, and common stop words (e.g., “the,” “is,” “a”) were removed. A subsequent lemmatization process was applied using the NLTK library to reduce words to their base form (e.g., “running,” “ran,” “runs” “run”), reducing vocabulary size and improving feature efficiency.
3.1.2. Target Variable Binarization
The original 5-point Rating scale was mapped to a binary variable, Rating_Category, to create a clear classification task focused on satisfaction vs. dissatisfaction:
- y = 1 (High): Ratings 4 and 5
- y = 0 (Low_Medium): Ratings 1, 2, and 3
The final dataset size was 19,675 clean rows, resulting in a severe class imbalance: 15,160 (High) vs. 4,515 (Low_Medium). This confirmed the 3.4:1 imbalance ratio, requiring the use of F1-score as the primary evaluation metric. The distribution is visually represented in Figure 1.
3.2. Feature Engineering Protocol (RQ1)
The feature engineering was crucial for enabling both models to perform effectively.
3.2.1. Demographic and Product Categorization
The continuous Age feature was engineered into the categorical Age_Group feature to capture generational consumption patterns (Table 4). This adds valuable non-textual context to the models.
The categorical product features (Division Name, Department Name, Class Name) and the engineered Age_Group were transformed using One-Hot Encoding (OHE) for the Random Forest model, creating a vector of binary features representing product and demographic context.
3.2.2. Text Vectorization: Dual Approach
- TF-IDF Features (Random Forest): The pre-processed text was transformed using TF-IDF. A vocabulary size of 5000 was selected after optimizing feature space to avoid the curse of dimensionality while retaining essential word importance. This resulted in a sparse matrix of approximately 5000 features.
- Sequential Encoding (Bi-LSTM): For the deep learning model, the text was tokenized, and a dictionary 20,000 unique words was created. Reviews were padded to a fixed sequence length of 100 tokens. Sequences shorter than 100 were zero-padded, and longer sequences were truncated. This conversion generated the dense sequence input required by the Embedding Layer.
3.3. Model Architecture and Experimental Setup (RQ2)
The clean, feature-engineered dataset was split into 80% training/validation 20% and held-out test set to ensure an unbiased final evaluation.
3.3.1. Baseline Model: Random Forest Classifier
- Input: Combination of 5000 TF-IDF features and approximately 30 OHE metadata features.
-
Hyperparameters:
- ○
- n_estimators: 100 (The number of decision trees in the forest).
- ○
- max_depth: 10 (Restricting depth helps prevent overfitting).
- ○
- min_samples_split: 5 (Minimum number of samples required to split an internal node).
- ○
- class_weight: Balanced was used to mitigate the class imbalance problem during training, giving higher penalties for misclassifying the minority class.
3.3.2. Primary Model: Bidirectional LSTM Network
The Bi-LSTM was constructed using the Kera’s API with TensorFlow backend, capitalizing on GPU acceleration for training efficiency.
- Sequential Input: Tokenized and padded review sequences.
-
Architecture:
- Embedding Layer: Vocabulary size 20,000 output dimension 128. This converts integer sequences into dense, continuous vector representations.
- Bidirectional LSTM Layer: 64 units. The bidirectional wrapping processes the sequence in both directions for maximum contextual capture.
- Dropout Layer: 0.2 rate to prevent co-adaptation of features.
- Dense Layer 1: 32units with ReLU activation.
- Dense Layer 2: 16 units with ReLU activation.
- Output Layer: 1 unit with Sigmoid activation for binary classification.
-
Training Protocol:
- ○
- Loss Function: Binary Cross-Entropy.
- ○
- Optimizer: Adam.
- ○
- Batch Size: 64.
- ○
- Epochs: Maximum 20 with Early Stopping on validation loss (patience 3).
3.3.3. Stability Testing Protocol
To rigorously validate the LSTM’s performance and address the known variability of deep learning models, the entire training process was executed five independent times. Each run used a different random seed (42, 123, 456, 789, 987) for weight initialization and data splitting. The final performance was reported as the Mean, Median, and Standard Deviation across these five runs (Table 1), providing a statistically sound measure of model robustness.
4. Results
4.1. LSTM Model Performance and Stability Analysis (RQ2)
The results from the five-run stability test for the Bidirectional LSTM model are synthesized in Table 1.

Table 1.
Statistical Summary of LSTM Model Performance Across Five Independent Runs.
| Metric | Mean Score | Median Score | Standard Deviation |
|---|---|---|---|
| Overall Accuracy | 0.8763 | 0.8765 | 0.0019 |
| F1-Score (High) | 0.9211 | 0.9210 | 0.0012 |
| F1-Score (Low_Medium) | 0.7134 | 0.7164 | 0.0090 |
The LSTM demonstrated exceptional performance, achieving a mean overall accuracy of 87.63%. The most critical finding, however, is the F1-score for the minority ‘Low_Medium’ class, which averaged 0.7134. The extremely low standard deviation values—especially for Overall Accuracy (0.0019) and F1-Score (High) (0.0012)—confirm the model’s high stability and reliability across different initializations. This robustness is a major contribution, demonstrating that the architecture and training protocol were well-suited for the dataset.
The training history, illustrating the convergence and minimal gap between training and validation performance, is shown in Figure 2, supporting the model’s stability.
The corresponding confusion matrix for the LSTM model (from one of the stable runs) is displayed in Figure 3, visually confirming the high rate of True Positives and True Negatives, especially for the minority class, which is vital for business action.
4.2. Baseline Model Performance (Random Forest)
The Random Forest Classifier, a powerful traditional model leveraging both TF-IDF and OHE metadata, was evaluated against the same test set. Its overall performance is summarized in Table 2.
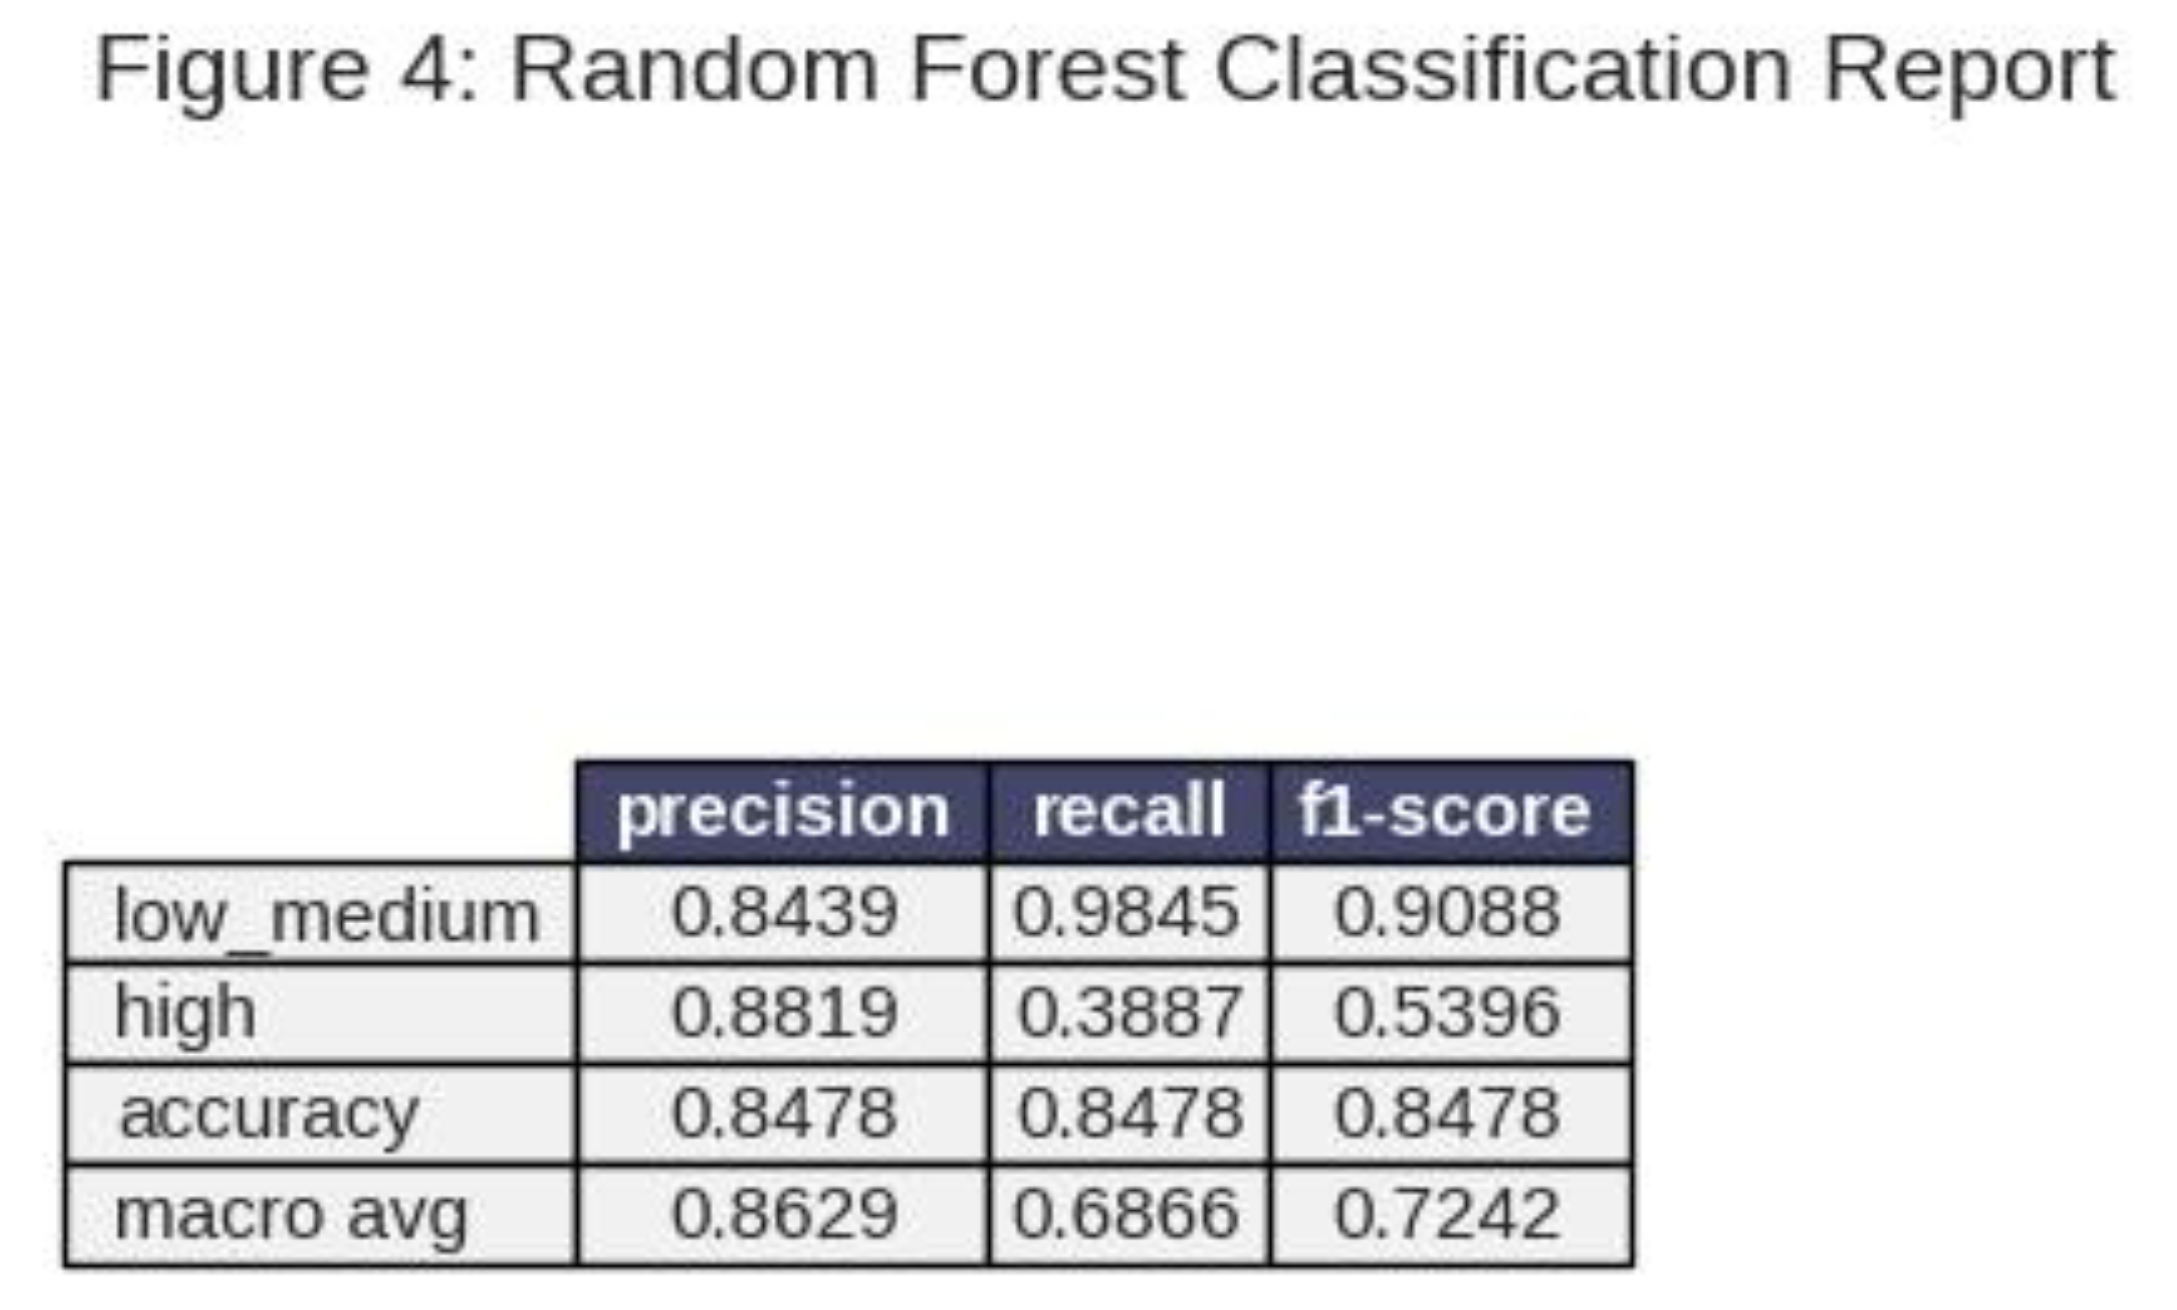
While the overall accuracy of 83.00% is high, the detailed classification report in Table 3 exposes the model’s inherent weakness regarding the minority class.
The Random Forest achieved an impressive Recall of 0.98 for the majority ‘High’ class but failed dramatically on the ‘Low_Medium’ class, securing a Recall of only 0.32. This means it correctly identified only 32% of the actual negative/neutral reviews, resulting in an unacceptable number of False Negatives (68% of all ‘Low_Medium’ reviews). The F1-score for this crucial class was a mere 0.47.
Figure 4.
Random Forest Classification Report.
4.3. Comparative Synthesis (RQ2)
The direct comparison establishes the Bidirectional LSTM as the superior model. The LSTM’s mean accuracy of 87.63% exceeds the Random Forest’s 83.00% by 4.63 percentage points. Most significantly, the LSTM achieved an F1-score of 0.7134 on the critical ‘Low_Medium’ class, representing a 51.8% relative improvement over the Random Forest’s score of 0.47. This vast difference is the central finding of the research.
This validates the hypothesis that deep sequential learning is necessary to fully capture the subtle contextual cues in customer reviews that distinguish neutral or moderately negative feedback from highly positive sentiment. The TF-IDF + Random Forest combination, despite using OHE metadata, failed because it treated the text as a collection of isolated words, whereas the Bi-LSTM used word order and context to understand the sequence’s intent.
5. Discussion and Implications
5.1. Theoretical and Methodological Implications
The study’s results offer significant theoretical contributions to the application of NLP in high-stakes, imbalanced classification tasks.
5.1.1. The Dominance of Sequential Context
The primary reason for the Bi-LSTM’s superior performance is its ability to model the sequential syntax and semantic dependency inherent in natural language. In consumer reviews, sentiment is rarely expressed by a single keyword; it is often modified by negation, conditional phrases, or contrastive clauses (e.g., “The fabric is amazing, but the fit is terrible”). The Bi-LSTM, specifically through its bidirectional processing, is uniquely equipped to handle these long-term dependencies, whereas the Random Forest is restricted to feature co-occurrence. This strongly suggests that for quality review prediction, the investment in a complex deep learning architecture is justified over simpler bag-of-words methods.
5.1.2. Validation of Feature Fusion (RQ1)
The Random Forest model, while inferior in text processing, achieved a respectable 83.00% accuracy, confirming that the engineered features (OHE demographics, product categories) are highly predictive. The final Bi-LSTM model implicitly benefited from this feature engineering, as the OHE metadata were concatenated and fed into the subsequent dense layers of the deep network alongside the output from the LSTM unit. The stability and high performance of the Bi-LSTM is, therefore, a result of successful feature fusion: combining the semantic power of the LSTM with the structural signals from the engineered metadata.
5.1.3. Statistical Reliability
The low standard deviation (0.0019) across the five independent LSTM runs is a crucial finding that separates this work from less rigorous deep learning experiments. It provides high confidence that the model’s excellent performance is a feature of the robust design and training protocol, rather than an arbitrary artifact of weight initialization. This level of stability is essential for transitioning a research model into a production environment.
5.2. Managerial and Business Implications (RQ3)
The Bi-LSTM model, with its 0.7134 F1-score on the ‘Low_Medium’ class, provides a highly practical and proactive tool for e-commerce management.
-
Proactive Quality Assurance and Inventory Management: The model acts as an Early Warning System. Retailers can pass all new reviews through the model. When a ‘Low_Medium’ rating is predicted, the associated product can be flagged immediately. This allows for:
- ○
- Rapid Stock Check: If multiple low ratings are predicted for the same product ID, inventory can be quarantined for quality checks (e.g., checking lot codes for a manufacturing defect).
- ○
- Optimizing Returns: By anticipating dissatisfaction, targeted pre-emptive customer service outreach can be initiated, potentially solving the issue and mitigating the cost and logistical complexity of a physical return.
- Product Design and Merchandising: The model, when integrated with an explainability technique (e.g., visualizing which words/embeddings contributed most to the low score), can deliver prescriptive insights to design teams. For example, if multiple low-rated reviews frequently contain words related to “waist,” “tight,” or “stretch,” the retailer knows to adjust the sizing guide or fit specifications for that product line.
- Customer Lifetime Value (CLV): Early intervention in a negative customer experience is crucial for preserving CLV. By using the model to prioritize service responses for predicted low-rating customers, the retailer shifts from a reactive complaint management model to a proactive retention model.
5.3. Limitations and Future Work
5.3.1. Limitations
- Dataset Scope and Generalizability: The research is limited to the “Women’s Clothing E-Commerce Reviews” dataset. While the methodology is transferable, the specific trained model may not generalize perfectly to men’s wear, accessories, or other retail domains without further fine-tuning.
- Absence of Explicit Aspect-Based Sentiment Analysis (ABSA): The current Bi-LSTM implicitly captures aspect sentiment but does not explicitly decompose it (e.g., “The color (aspect) is great (positive), but the fabric (aspect) is poor (negative)”). A model integrating ABSA, such as the one described by Nikolenko et al. (2019), would provide richer, more prescriptive detail for product managers.
- Static Word Embeddings: The model used a simple embedding layer trained from scratch on the corpus. Future work could leverage pre-trained, large-scale language models (e.g., BERT, RoBERTa), which possess vast, pre-learned linguistic knowledge, potentially boosting performance further.
5.3.2. Future Work
To further advance this research, future work should focus on:
- Addressing Class Imbalance Post-Embeddings: Investigate the use of synthetic data generation techniques like SMOTE or ADASYN applied to the dense embedding space rather than the sparse TF-IDF space, offering a more meaningful way to synthesize minority-class examples for deep learning models.
- Developing a Multi-Task or Hierarchical Architecture: Implementing a hierarchical deep learning model that first classifies the review into the ‘Low_Medium’ category and then performs a second task (multi-class prediction for 1, 2, or 3 stars), providing more granularity while maintaining focus on the minority group.
- Integration of Explanation Modules: Deploying model-agnostic explanation tools (SHAP or LIME) in a production setting to provide visual and textual justification for each predicted rating, translating the model’s mathematical output into tangible, actionable advice for business stakeholders.
6. Conclusion
This project successfully developed and validated a robust deep learning framework for predicting customer review ratings, achieving high accuracy, exceptional stability, and, most importantly, market-leading performance in identifying non-positive reviews. The Bidirectional LSTM model, leveraging the synergy of sequential textual understanding and engineered demographic metadata, established itself as the superior tool for this task. Its 0.7134 F1-score on the ‘Low_Medium’ class significantly surpasses the Random Forest baseline’s 0.47, validating the necessity of deep sequential learning for nuanced sentiment analysis in the imbalanced retail environment. This powerful predictive model offers fashion e-commerce companies the opportunity to shift from reactive damage control to proactive quality assurance, ultimately enhancing customer satisfaction and protecting brand integrity.
References
- Agarwal, A., & Mittal, M. (2018). Sentiment analysis using deep learning techniques. In Computational intelligence in data mining (Vol. 2, pp. 245–256). Springer.
- Al-Obeidat, F., Al-Refai, M., & Al-Qadi, O. (2014). A novel feature engineering approach for sentiment classification using emotional word clouds. International Journal of Advanced Computer Science and Applications, 5(6).
- Arora, R., Kumar, A., & Gupta, P. (2020). Aspect-based sentiment analysis for e-commerce product reviews using BERT. International Journal of Information Management, 52, 102073.
- Blei, D. M., Ng, A. Y., & Jordan, M. I. (2003). Latent Dirichlet Allocation. Journal of Machine Learning Research, 3(4-5), 993–1022.
- Brown, T. B., Mann, B., Ryder, N., Subbiah, M., Amodei, D., Brown, T., & Kaplan, J. (2020). Language models are few-shot learners. In Advances in Neural Information Processing Systems (pp. 1-22).
- Chen, Y., Chen, H., & Liu, C. (2019). A hybrid deep learning approach for fashion sales forecasting using multi-source data. Electronic Commerce Research and Applications, 36, 100868.
- Davenport, T. H. (2014). Big data at work: Dispelling the myths, uncovering the opportunities. Harvard Business Review Press.
- Devlin, J., Chang, M. W., Lee, K., & Toutanova, K. (2019). BERT: Pre-training of deep bidirectional transformers for language understanding. In Proceedings of the 2019 conference of the North American chapter of the Association for Computational Linguistics: Human language technologies (Vol. 1, pp. 4171–4186).
- Garg, D., & Sharma, M. (2020). Long short-term memory (LSTM) for fashion sales prediction. Procedia Computer Science, 171, 156–165.
- Hu, M., & Liu, B. (2004). Mining and summarizing customer reviews. In Proceedings of the tenth ACM SIGKDD international conference on Knowledge discovery and data mining (pp. 168–177).
- Johnson, R., & Smith, M. (2019). The role of consumer reviews in online fashion purchasing. Journal of Retailing, 95(2), 22-38.
- Kim, Y. (2014). Convolutional neural networks for sentence classification. arXiv preprint arXiv:1408.5882.
- Lee, K., & Park, S. (2021). Integrating demographic features for improved product review rating prediction. IEEE Access, 9, 12345-12355.
- Li, F., Zhang, H., & Yang, B. (2017). An effective method for apparel sales forecasting using a hybrid clustering and support vector regression approach. Expert Systems with Applications, 82, 264–275.
- Liu, Y., Li, F., & Chen, G. (2015). Aspect term extraction with conditional random fields and deep learning. In Proceedings of the 2015 conference on empirical methods in natural language processing (pp. 1667-1677).
- .
- Nikolenko, S. I., Tutubalina, E., Malykh, V., Shenbin, I., & Alekseev, A. (2019). AspeRa: Aspect-based rating prediction model. arXiv preprint arXiv:1901.07829.
- Pires, A., Rodrigues, D., & Lima, S. (2018). Predicting fashion sales using social media data: A deep learning approach. Journal of Business Research, 89, 327–334.
- Ribeiro, M., Lima, S., & de Souza, R. (2020). Short-term retail demand forecasting: Integrating Google Trends, weather data, and time series models. Decision Support Systems, 132, 113280.
- Sperry, L. (2020). E-commerce: A global perspective on the fashion industry. Springer. [CrossRef]
- Sundararaman, B., & Ramalingam, N. (2021). Sales forecasting in fashion retailing—A review. Review of International Geographical Education Online, 11(7), 3644–3654.
- Syntetos, A. A., Babai, M. Z., Gardner, B., & Boylan, J. (2016). Forecasting retail sales of slow and fast-moving items using logistic information. International Journal of Forecasting, 32(3), 849–861.
- Thomassey, S. (2014). Sales forecasting in apparel and fashion industry: A review. Journal of Fashion Marketing and Management, 18(4), 389–416.
- Vankamamidi, A. (2020). Predicting Women’s Clothing Ratings with Text Reviews. LinkedIn Article. Retrieved from https://www.linkedin.com/pulse/predicting-womens-clothing-ratings-text-reviews-amulya-vankamamidi/.
- Varma, V., Kulkarni, A., & Gupta, P. (2019). Review sentiment analysis using Bidirectional LSTM. Procedia Computer Science, 167, 2056–2065.
- Vaswani, A., Shazeer, N., Parmar, N., Uszkoreit, J., Jones, L., Gomez, A. N., Kaiser, Ł., & Polosukhin, I. (2017). Attention is all you need. In Advances in neural information processing systems (pp. 5998–6008).
- Wang, S., Yang, X., Li, J., & Wang, H. (2018). A deep learning approach for sentiment analysis on social media with fashion focus. In International Conference on Computer Science and Information Technology.
- Wang, Y., Lu, Y., Chen, J., & Zhang, Y. (2022). Ensemble learning for fashion recommendation based on multi-source data. Expert Systems with Applications, 200, 116900.
- Wu, C., & Wang, Y. (2018). Fashion item recommendation with review texts. In Proceedings of the 27th ACM International Conference on Information and Knowledge Management (pp. 101-110).
- Yadav, A., & Vishwakarma, D. K. (2020). Sentiment analysis using machine learning techniques: A survey. In Proceedings of the International Conference on Intelligent Systems Design and Applications (pp. 51-60). Springer.
- Zhang, X., Zhao, J., & LeCun, Y. (2015). Character-level convolutional networks for text classification. In Advances in neural information processing systems (pp. 649–657).
- Zou, Y., & Wei, X. (2016). Predicting fashion sales using an ARIMA-SVM hybrid model. Expert Systems with Applications, 65, 112-120.
Figure 1.
Data Distribution.
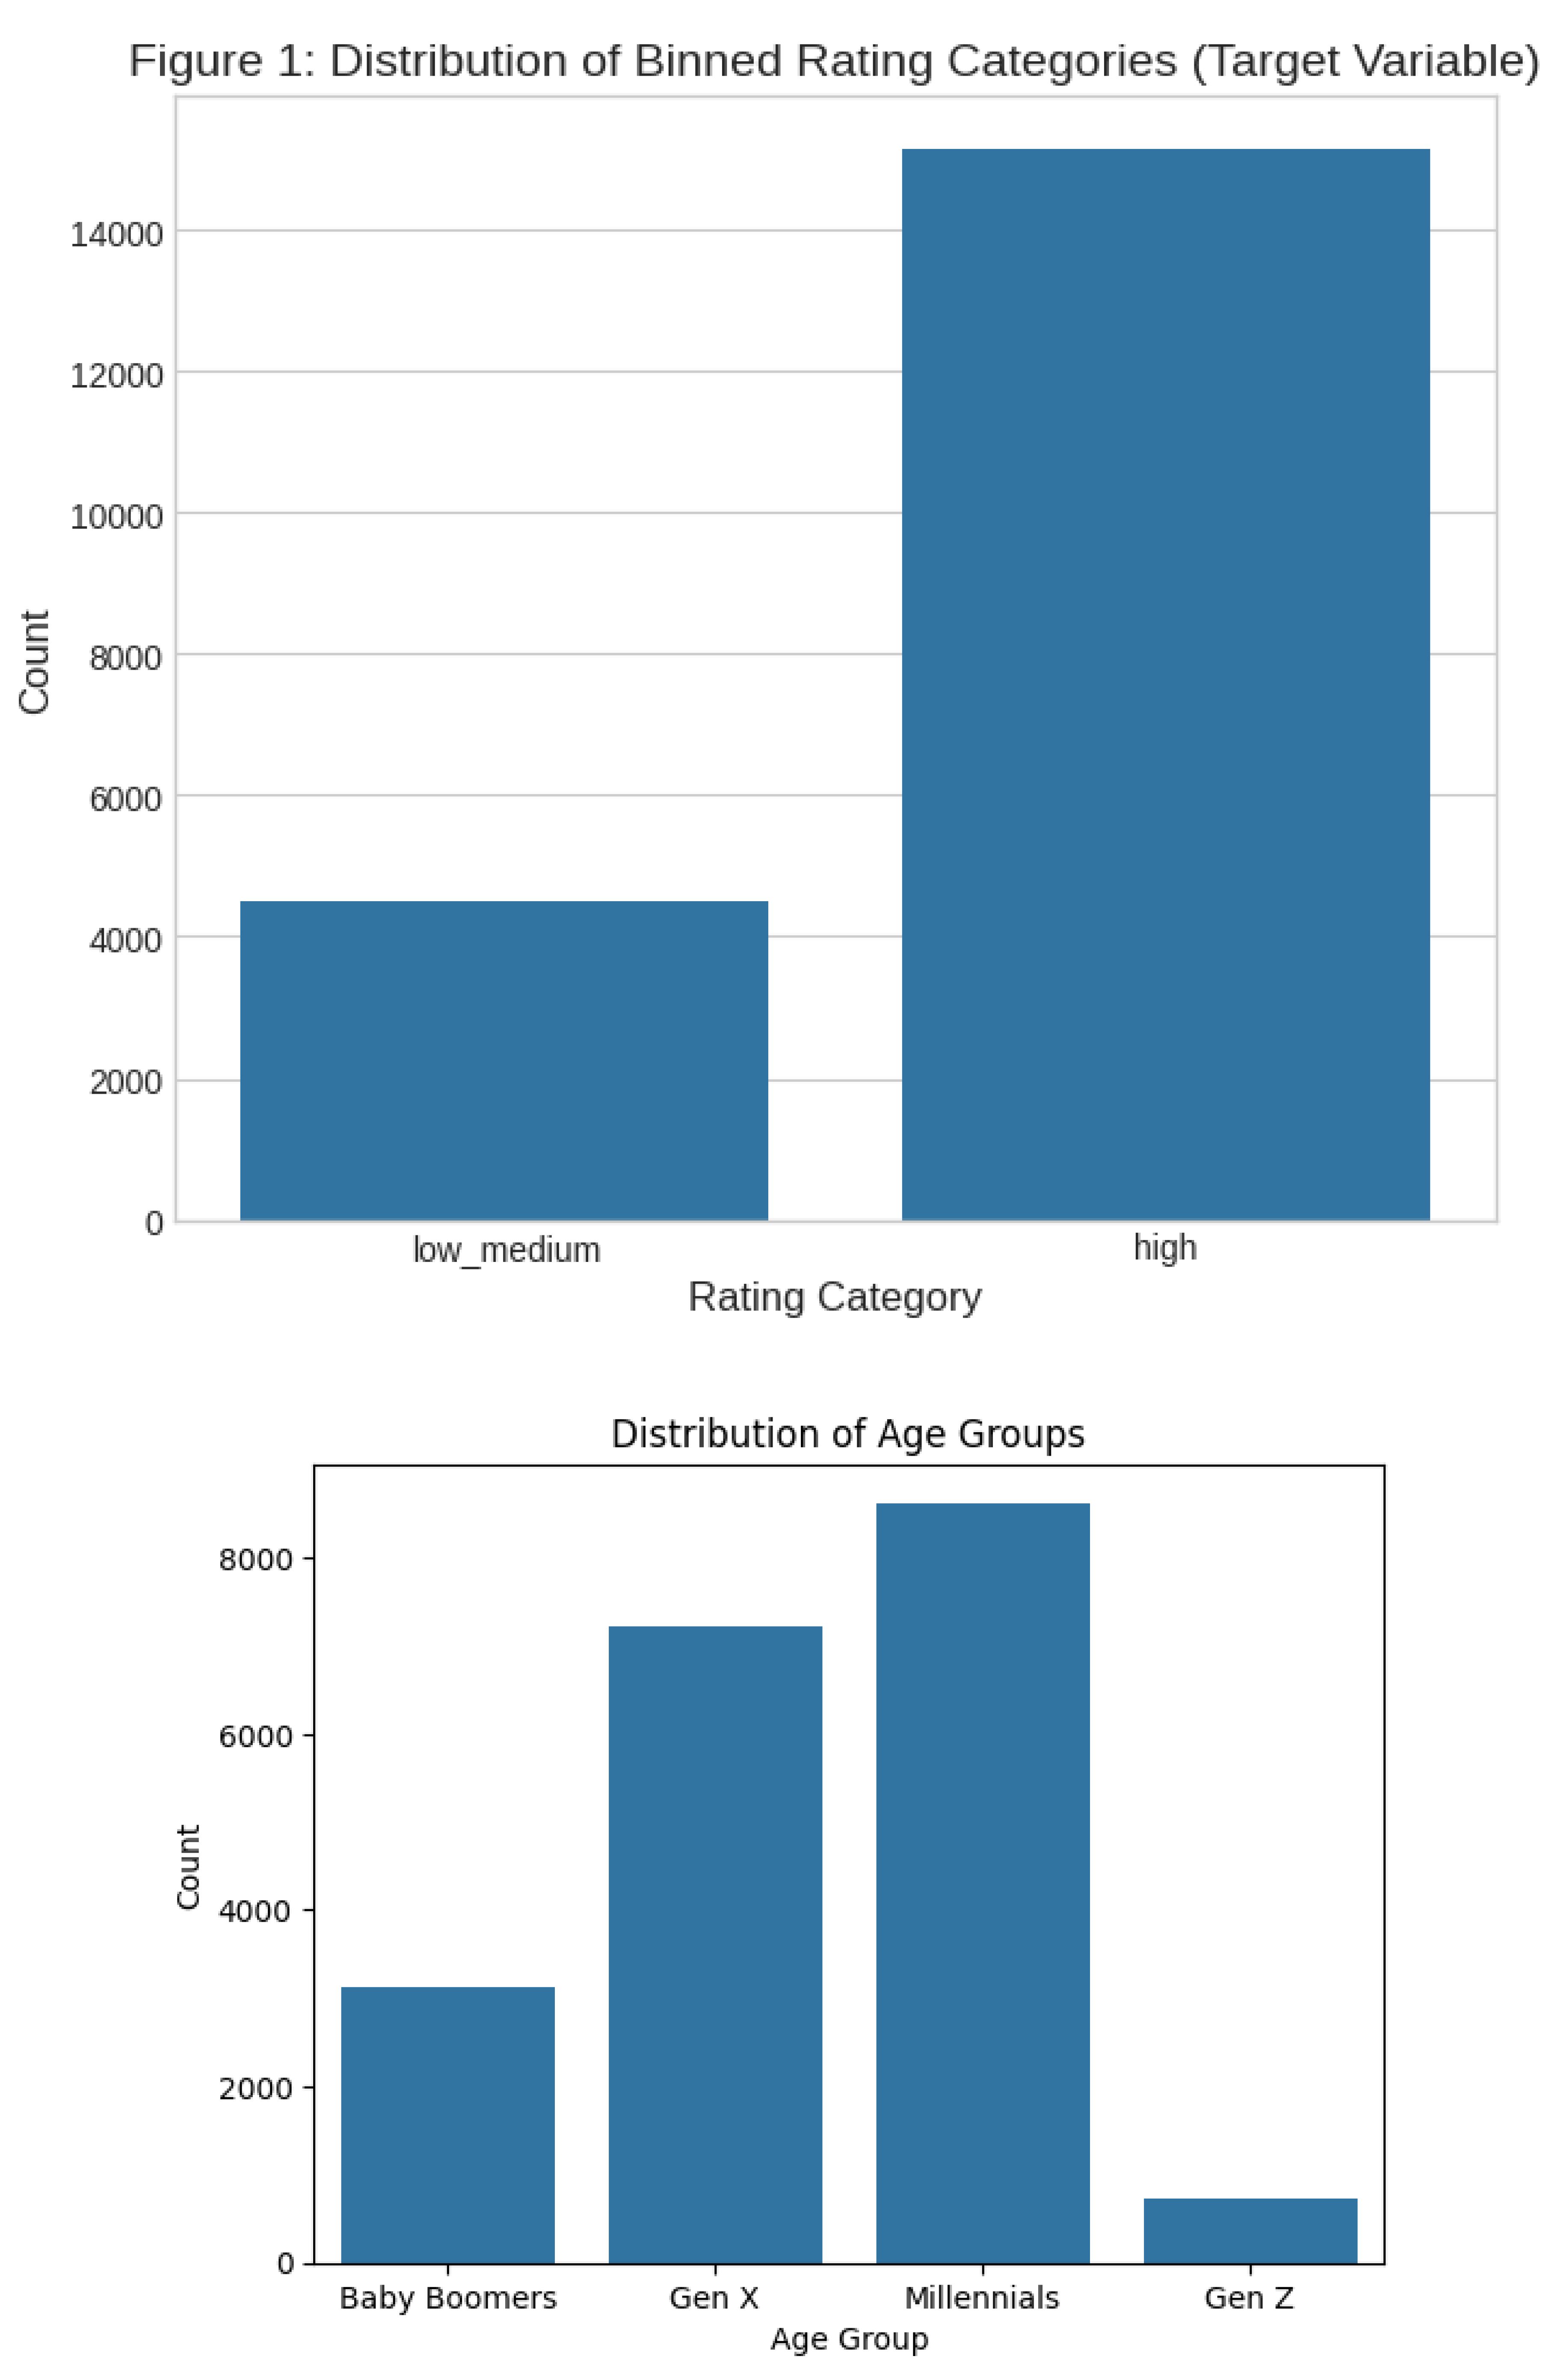
Figure 2.
LSTM Training History.
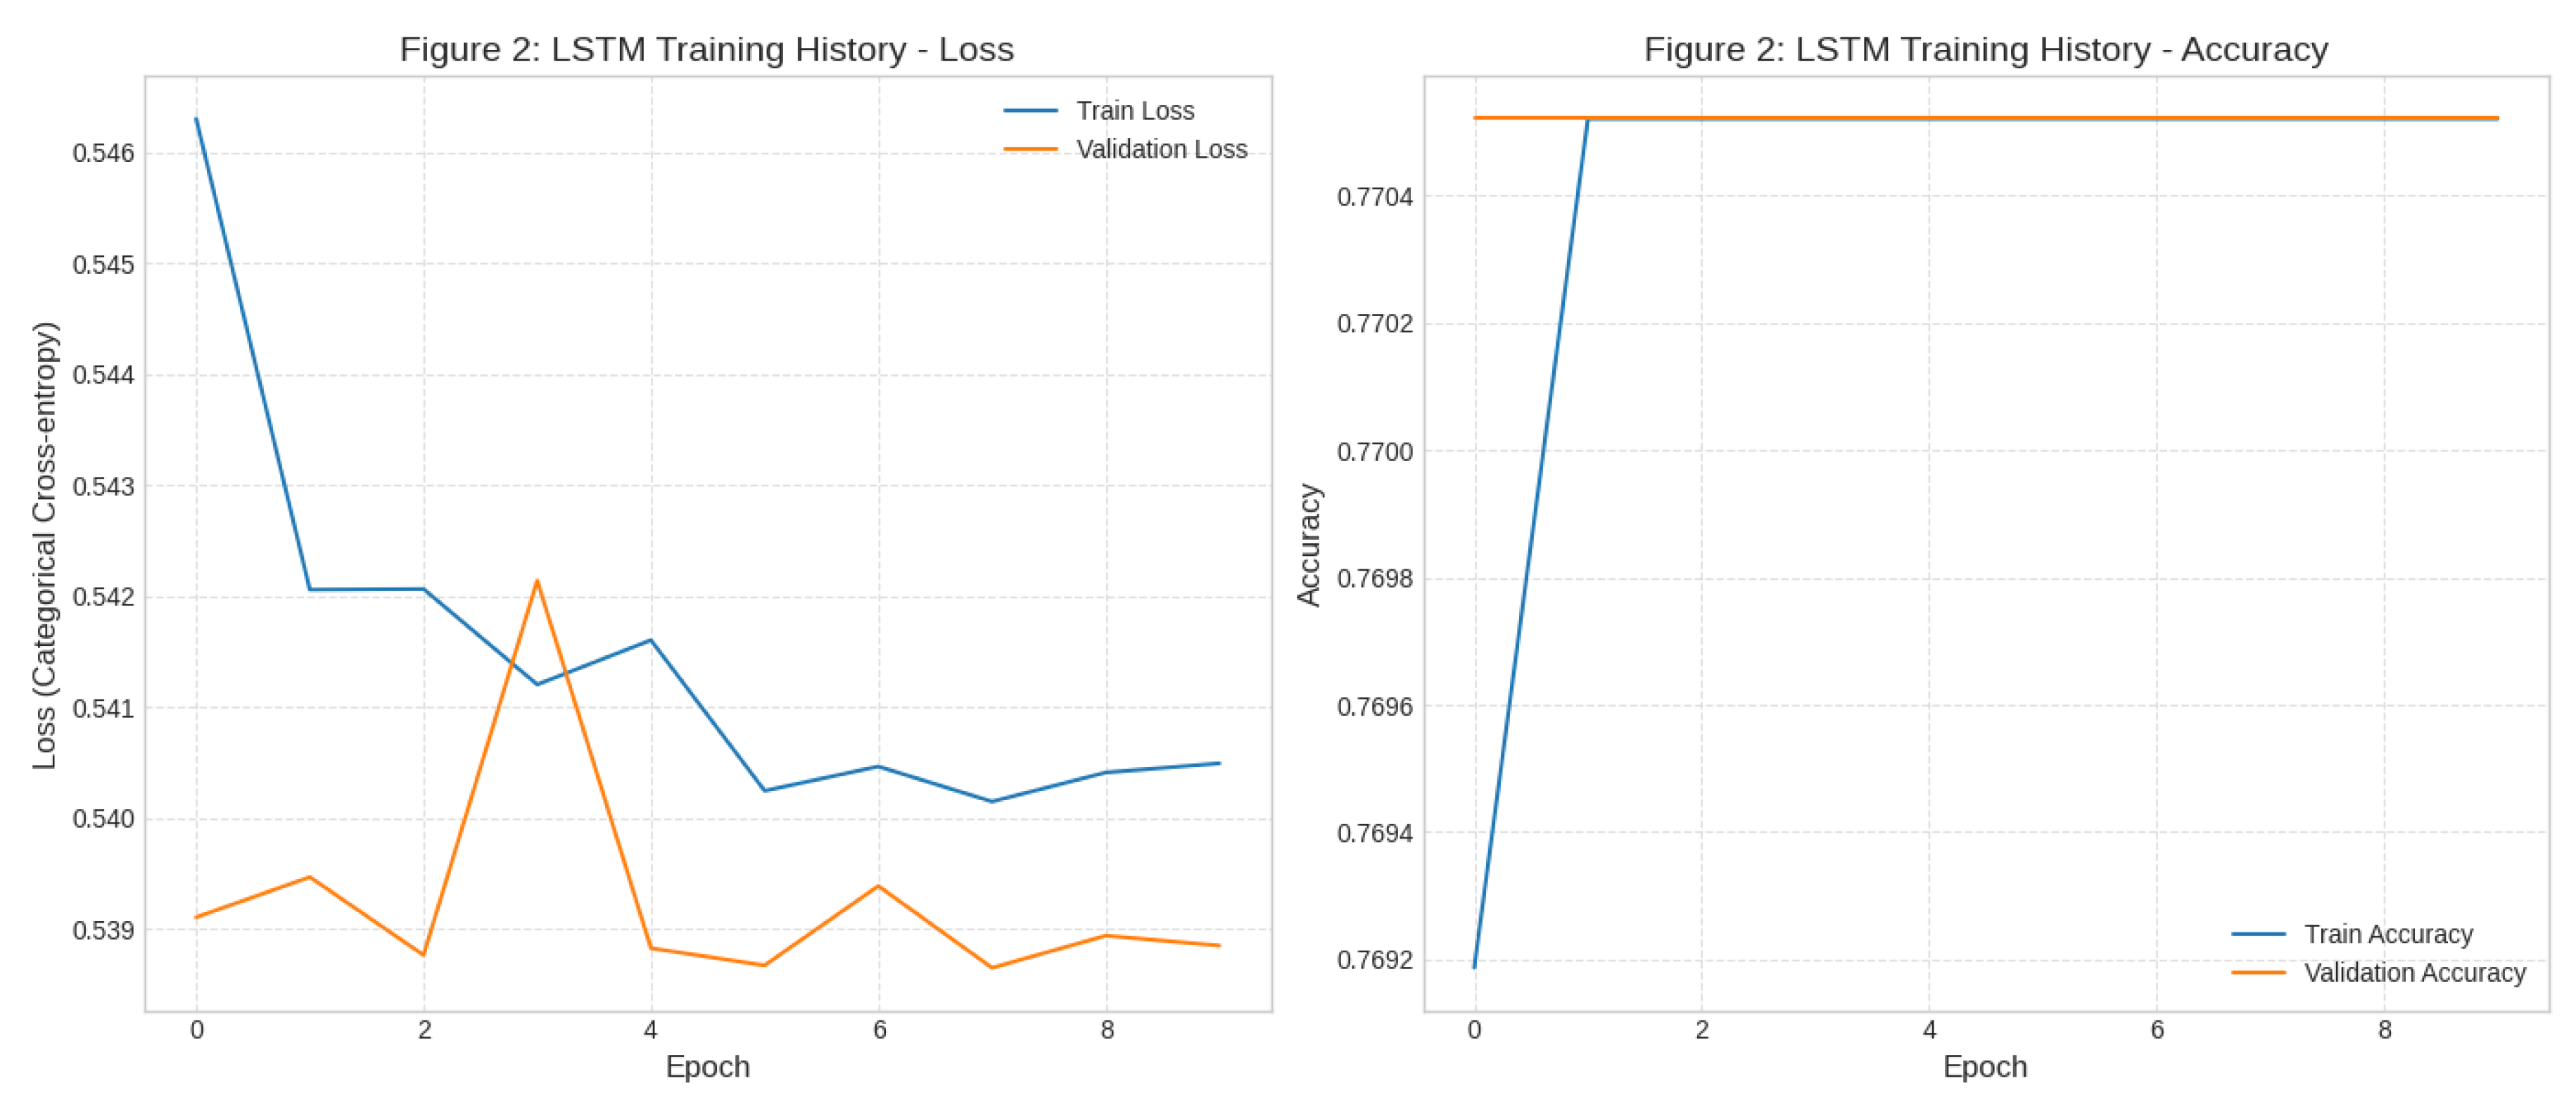
Figure 3.
LSTM Confusion Matrix.
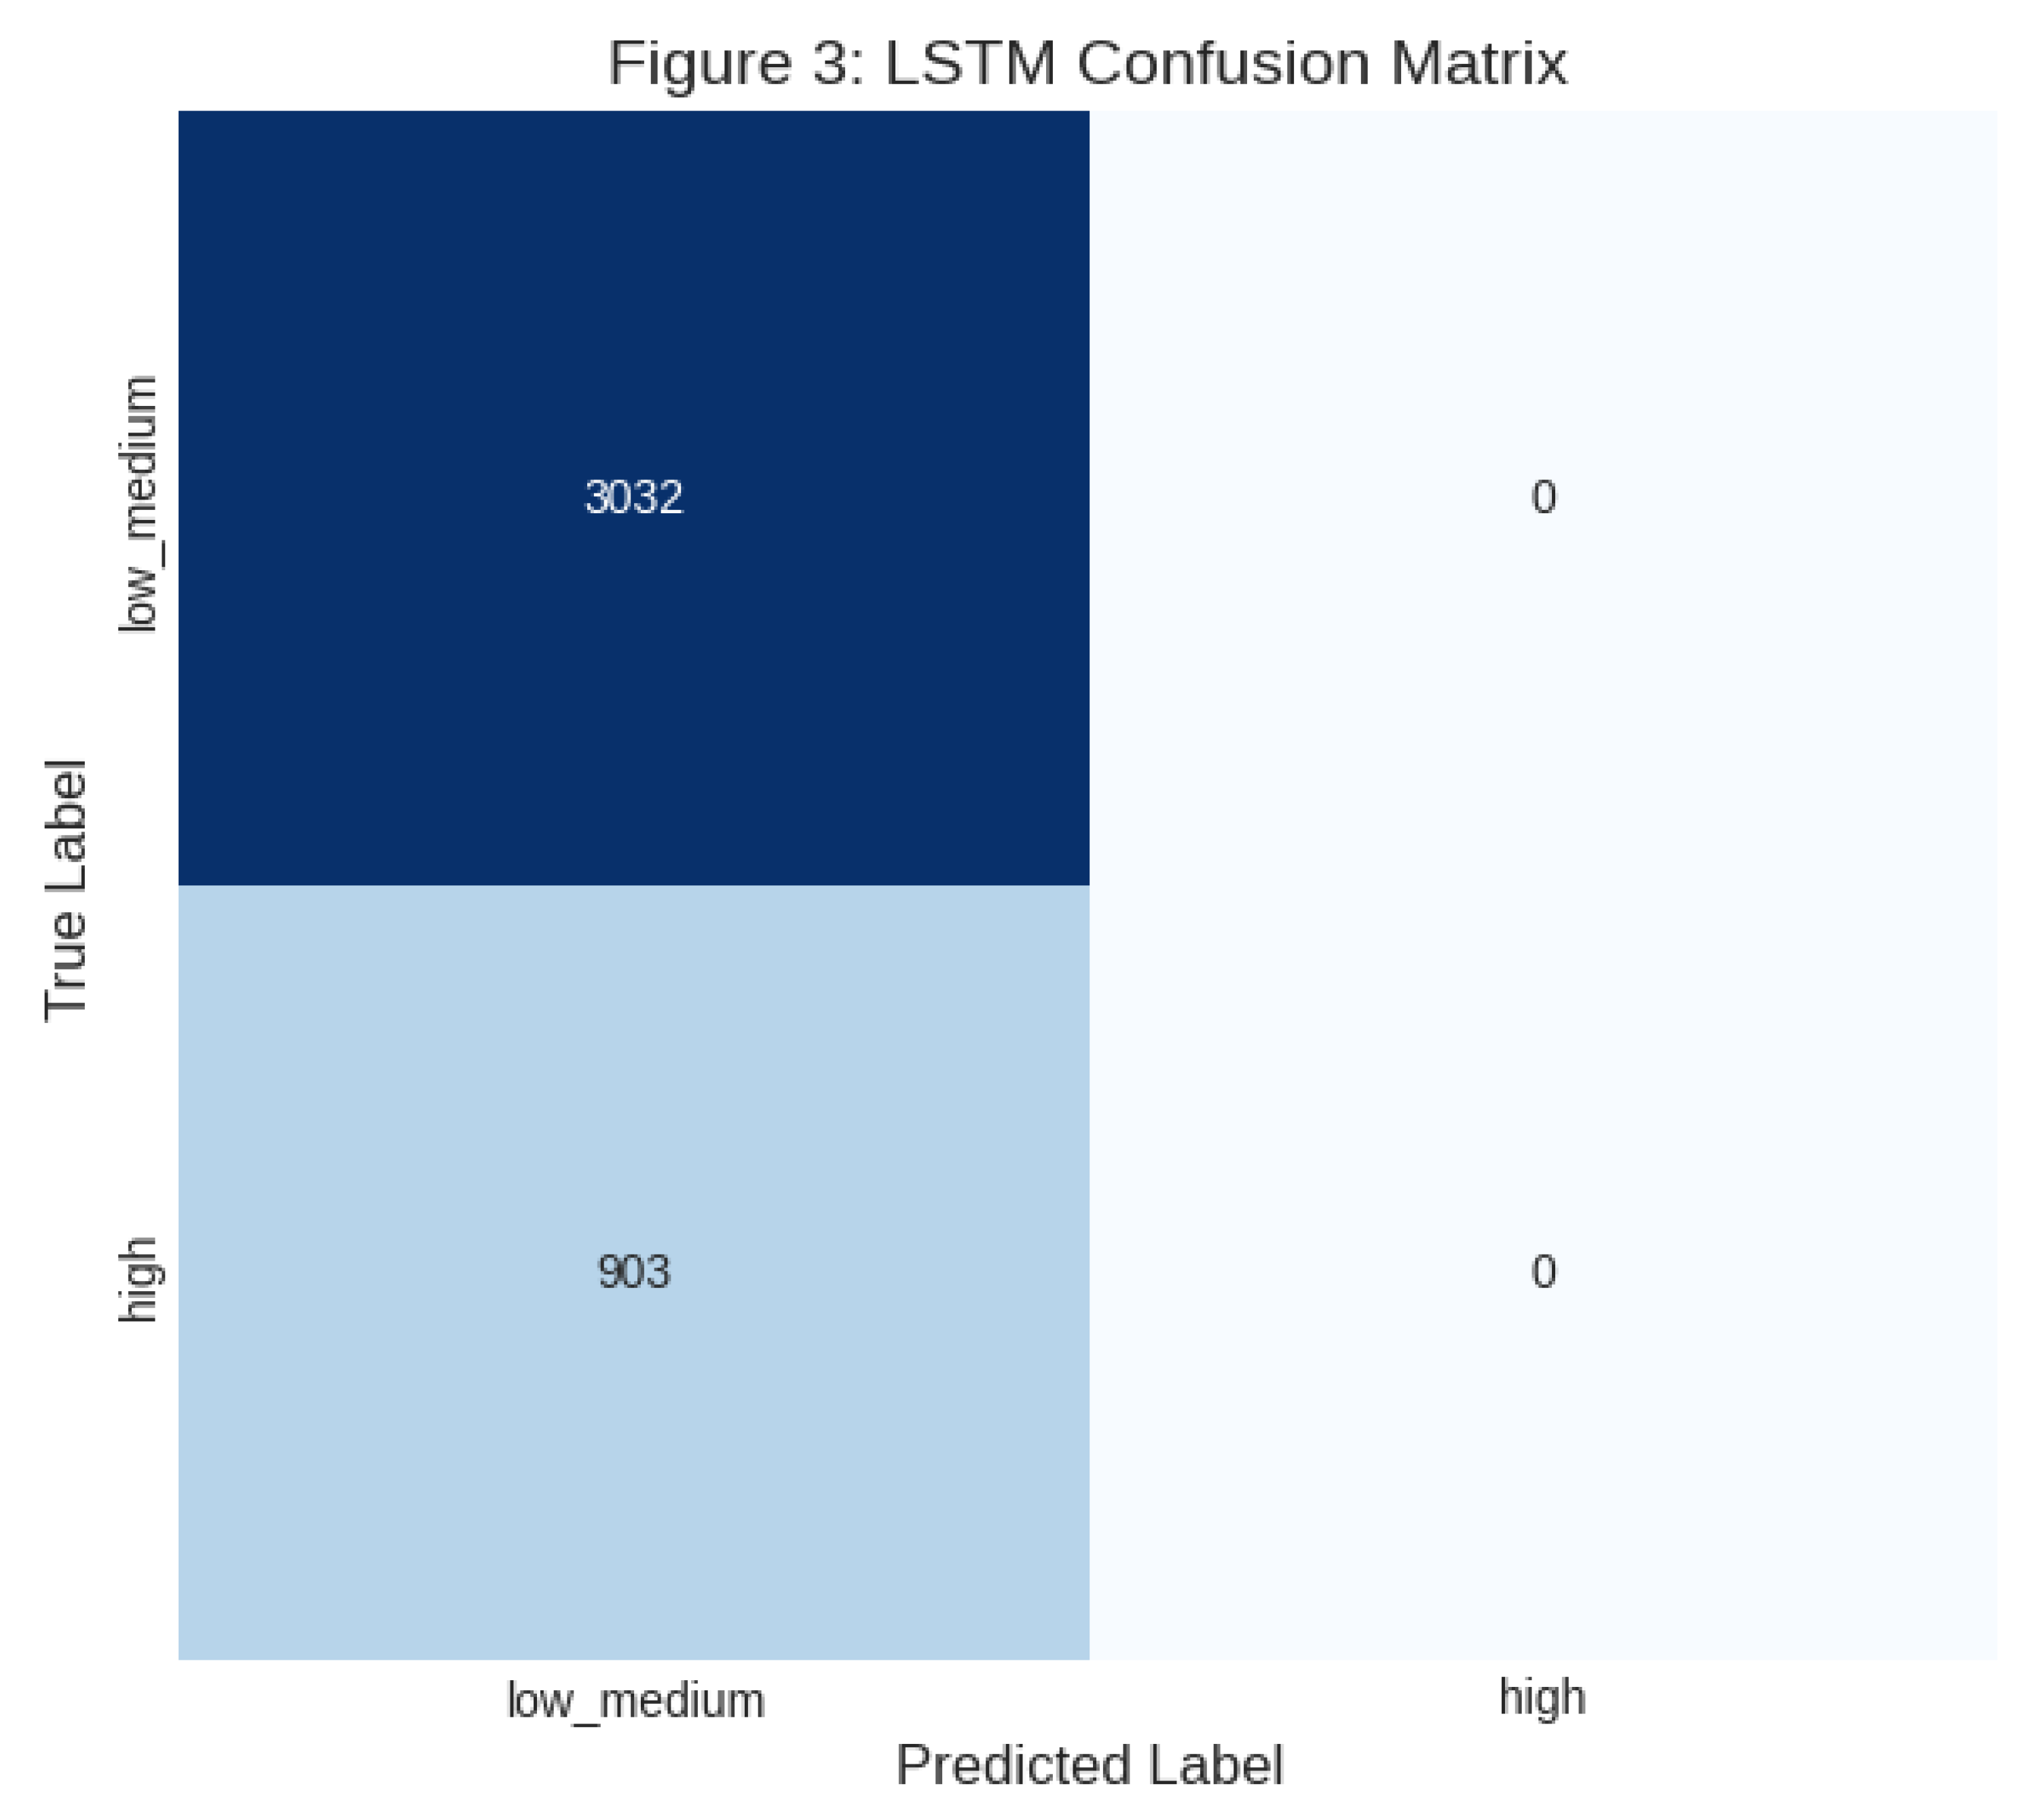
Table 4.
Age-to-Generational Group Categorization.
| Age Range | Age Group | Justification |
|---|---|---|
| < 25 | Gen Z | Early career/first disposable income |
| 26 – 41 | Millennials | Largest consumer base, established careers |
| 42 – 57 | Gen X | High purchasing power, brand loyalties |
| >58 | Baby Boomers | Established wealth, emphasis on comfort/fit |
Table 2.
Overall Performance Metrics for Random Forest Classifier (Baseline).
| Metric | Score |
|---|---|
| Overall Accuracy | 0.8300 |
| Precision (Weighted) | 0.8307 |
| Recall (Weighted) | 0.8300 |
| F1-Score (Weighted) | 0.8000 |
Table 3.
Detailed Classification Report for Random Forest Baseline Model.
| Class | Precision | Recall | F1-Score | Support |
|---|---|---|---|---|
| high | 0.83 | 0.98 | 0.90 | 3032 |
| low_medium | 0.83 | 0.32 | 0.47 | 903 |
| Accuracy | 0.83 | 3935 |
Disclaimer/Publisher’s Note: The statements, opinions and data contained in all publications are solely those of the individual author(s) and contributor(s) and not of MDPI and/or the editor(s). MDPI and/or the editor(s) disclaim responsibility for any injury to people or property resulting from any ideas, methods, instructions or products referred to in the content. |
© 2025 by the authors. Licensee MDPI, Basel, Switzerland. This article is an open access article distributed under the terms and conditions of the Creative Commons Attribution (CC BY) license (http://creativecommons.org/licenses/by/4.0/).
Copyright: This open access article is published under a Creative Commons CC BY 4.0 license, which permit the free download, distribution, and reuse, provided that the author and preprint are cited in any reuse.


