
Submitted:
29 July 2025
Posted:
30 July 2025
You are already at the latest version
Abstract
The progress of clinical diagnosis increasingly relies on innovative technologies and advanced disease biomarker detection methods. While cell labelling remains a well-established technique, label-free approaches offer significant advantages, including reduced workload, minimal sample damage, cost-effectiveness, and simplified chip integration. These approaches focus on the morpho-biophysical properties of cells, eliminating the need for labeling and thus reducing false results while enhancing data reliability and reproducibility. Current label-free methods span conventional and advanced technologies, including phase-contrast microscopy, holographic microscopy, varied cytometries, microfluidics, dynamic light scattering, atomic force microscopy, and electrical impedance spectroscopy. Their integration with artificial intelligence further enhances their utility, enabling rapid, non-invasive cell identification, dynamic cellular interaction monitoring, and electro-mechanical and morphological cues analysis, making them particularly valuable for cancer diagnostics, monitoring, and prognosis. This review compiles recent label-free cancer cell detection developments within clinical and bio-technological laboratory contexts, emphasizing biophysical alterations pertinent to liquid biopsy applications. It highlights interdisciplinary innovations that allow the characterization and potential identification of cancer cells without labelling. Furthermore, a comparative analysis addresses throughput, resolution, and detection capabilities, thereby guiding their effective deployment in biomedical research and clinical oncology settings.
Keywords:
biophysical biomarkers
; cancer cells
; label-free methods
; cell sorting
; cancer diagnostics
1. Introduction
Cancer, marked by the abnormal and uncontrollable cell growth, encompasses a wide range of pathologies that can originate in virtually any organ or body tissue [1]. It constitutes the second leading cause of mortality globally [1] and its limited survival rate results from late disease identification and poor prognosis [1,2]. Cancer diagnosis requires tests conventionally involving methods such as magnetic resonance imaging, biopsy histology, tomography, and invasive imaging (e.g., cystoscopy) [3]. Although effective, these techniques are still expensive and require complex protocols or qualified clinicians, involving the consumption of reagents that may not be available in areas of limited resources, sophisticated equipment, and the most relevant are invasive [4,5]. Therefore, it is imperative to investigate and develop complementary and alternative methodologies that are non-invasive, cost-efficient, and easily automated for cancer diagnosis and prognosis. In this context, biomarkers play a crucial role and comprise a variety of specific biomolecules such as DNA, proteins, enzymes, lipids, and glycans. These provide insights into the presence and nature of pathogenic or toxic processes, from exposure to manifestation of effects [6,7].
Biophysical biomarkers, such as extracellular matrix stiffness and cellular mechanical cues, have gained interest as potential indicators for oncological diagnosis and treatment. These markers influence the differentiation, growth and motility of tumor cells [8,9]. For the identification and analysis of biophysical changes, advanced technologies, which will be mentioned later, are successfully used in a macroscopic tumor evaluation framework.
Laboratory medicine’s continuous progress relies heavily on the development and implementation of new technologies and advanced detection methods. Cell labelling analysis has established itself as a widely used methodology. On the other hand, label-free methods are gaining significant attention due to their numerous advantages. For example, these methods enable the identification of distinctive cellular features with a lower workload, minimal damage to samples, cost-efficiency, and ease of integration into lab-on-a-chip and benchtop systems [10]. By focusing on the biophysical characteristics of cells, such as rigidity and nuclear morphometry, label-free methods eliminate the need for labelling conjugation, reducing the incidence of artifacts resulting from label-dependent methods [10,11].
Currently, label-free technologies encompass both conventional methodologies and cutting-edge innovations, including phase-contrast microscopy, which may be powered by AI-integrated algorithms, holographic microscopy, varied cytometric analysis, microfluidics, and adaptations from other disciplines like dynamic light scattering (DLS), atomic force microscopy (AFM) or electrical impedance spectroscopy (EIS) [12,13,14,15]. These techniques allow a fast[14] and label-free cell identification, dynamic monitoring of cellular interactions [12], and visualization of spatial constructions[13] and morphological cues, with a strong focus on the biophysical properties of cells, such as mechanical, magnetic, and electrical features [15]. Such capabilities are highly valuable for various biomedical applications and particularly interesting to explore in liquid biopsies, where circulating tumor cells (CTCs) are recognized as minimally invasive sources of information for the diagnosis and evolution of cancer [12,13,14,15]. CTCs consist of cancer cells released from primary tumor lesions, invade the endothelium, and spread into the bloodstream [16]. As CTCs contribute to the origin of metastasis, their identification is potentially effective for the early detection of metastatic cancer [17].
In this regard, this review compiles current findings related to the development and prospective uses of advanced technologies for label-free detection of cancer cells. Emphasis is placed on the significance of cellular biophysical alterations for cancer detection and monitoring, particularly in the context of liquid biopsies (e.g., urine, blood). Nonetheless, this review highlights the advantages and recent advancements in biomedical research associated with phase-contrast microscopy, holographic microscopy, cytometry techniques, DLS, microfluidics, AFM, and EIS. In summary, the transformative potential of label-free technologies in cancer detection will be underscored, particularly using biophysical biomarkers, while emphasizing recent advancements that drive innovation in minimally invasive diagnostic methods, paving the way for more accurate, efficient, and accessible cancer monitoring solutions.
2. Label-Free Microscopy Techniques for Cellular Analysis
2.1. Phase-Contrast Microscopy–Morphological Profiling and Segmentation
Phase-contrast microscopy is a useful tool for observing transparent or reflective samples in a label-free manner. This method uses the phase change of the waves that pass through the sample, which is later converted into larger relative changes, aiming to intensify the interference and contrast of the obtained image [18]. One of the advantages of phase-contrast microscopy lies in the possibility of examining living cells in their natural state, without staining [19]. Consequently, the dynamics of biological processes can be observed and recorded with high contrast, providing clarity in the sample’s finest details [19]. The main current limitation of this technique is that it cannot provide precise quantitative information about the optical or physical thickness of the observed object if its optical thickness is not sufficiently reduced [20].
To overcome this limitation, a deep cancer cell detector based on the Faster region-based convolutional neural networks (R-CNN) framework complemented by a Circle Scanning Algorithm (CSA) for detecting adherent cells was proposed by Zhang et al. [21]. The Faster R-CNN framework represents an advanced object detection system integrating region proposal generation with deep convolutional neural networks. By combining this approach with a specialized algorithm, the framework effectively identified and detected individual cells in images, including adherent cells, even when their numbers were limited. Moreover, a comparative analysis revealed that this detector outperformed the hybrid method, achieving a 19% improvement in performance. This study underscores the potential of using phase-contrast microscopy for cancer cell detection [21].
Detailed morphological analysis of single cells obtained using phase-contrast imaging was also performed, revealing distinct phenotypic signatures and functional diversity of cell lineages (Figure 1–A) [22]. Using a deep learning algorithm to segment cells at varying densities enabled the precise characterization of cellular properties, including size, texture, and shape [23]. Furthermore, by integrating these techniques, it was possible to highlight the morphological diversity of cells, enabling a more detailed characterization of the different cell types and confluence stages. Data from obtained images showed high variation in cell size, from very small to cells exceeding 6,000 µm2, and cell counts per image ranging from a few to more than 3,000 cells [23].
In a different approach by Jo et al., an innovative method for cells’ precise segmentation and tracking in phase-contrast microscopic images was introduced [24]. Although it did not directly address cancer detection, it analyzed cell migration, essential when understanding biological processes such as metastasis. The resulting accuracy of the proposed methodology in cell detection and tracking contributed to the study of cancer cells’ migration and behavior, aiding the understanding of cancer cells’ mobility [24]. Thus, this method demonstrates clear superiority over the manual method of directly providing cell shapes, particularly about temporal efficiency in the segmentation process. Furthermore, it employs simple but robust algorithms, enabling automated execution with high-precision results [24].
A hybrid approach combining phase-contrast microscopy and a resonant wave grating (RWG) biosensor recording the cell adhesion kinetics was developed [25]. This methodology allowed the segmentation and classification of cancer cells with high precision (Figure 1–B), reaching the highest rate on fibronectin-functionalized surfaces. Furthermore, phase-contrast microscopy data integration with cell adhesion measurements provided a detailed overview of cellular activity. The methodology was tested on one healthy and six cancer cell types (e.g., breast cancer and lung cancer cells) using a non-coated versus fibronectin-coated surface. With over 12,000 cell samples, classification accuracy was compared using these surfaces and different analysis techniques, including F1-Score, AUC Score, and AUC-PR Score, as well as segmentation strategies. The best models achieved nearly 95% accuracy, suggesting that this approach could be adapted to real-life automatic diagnostics. Thus, combining these techniques not only improved the analysis of individual cells but also contributed to a better understanding of cell adhesion mechanisms, fundamental in cancer progression [25].
Phase-contrast microscopy has undergone continuous evolution, particularly when coupled with complementary techniques, proven to be a highly effective method for the detailed observation and analysis of living cells, including the identification and characterization of cancer cells. The integration of this technique with advanced analytical approaches significantly enhanced cell detection accuracy while providing valuable insights into key biological processes, such as cell adhesion and migration, which are essential to cancer progression.
2.2. Holographic Microscopy: Quantitative Phase Imaging for 3D Characterization
Holographic microscopy (Figure 2–A), or quantitative phase microscopy, is a non-invasive technique that allows for obtaining three-dimensional (3D) label-free images of cells[26,27] It is based on the refractive index (RI) of a transparent sample, being particularly effective in monitoring adhered cells or microtissues (spheroids) [26]. This method provides quantitative phase images, constituting an accurate map of the optical phase delay induced by the sample in transmitted light, with variations dependent on the RI and sample thickness at each image pixel [26]. The phase changes of the light passing through the cells are calculated per pixel, allowing the identification of the cell and its morphological parameters, such as the area, optical volume, and optical thickness [28].
As a label-free methodology, holographic microscopy eliminates the need for staining when analyzing cell morphology and content, avoiding invasive adverse effects that can compromise cell integrity, such as cytotoxicity and phototoxicity [29]. Furthermore, this method allows the use of reduced light levels and safer conditions for the cells under study [29]. However, holographic microscopy presents some limitations that impact resolving capabilities. Among them, the finite size of the pixels stands out (affecting image quality), the need for a sampling rate (frequency of samples used in a digital recording) that must be high enough to avoid the overlap of replicas in the reconstructed image, and the presence of speckle noise, which must be reduced [30].
Nonetheless, the application of holographic microscopy proved relevant in tumor cells analysis, as it allowed the study of dynamic processes and biophysical aspects, such as migration, proliferation, and apoptosis [31]. For instance, the dynamics of cancer cell migration were analyzed in 3D collagen gel in a study by Dubois et al. [32]. This study showed significant variations in the migratory behavior of HT-1080 fibrosarcoma cells, with distances covering between 73 and 359 μm and migration speed between 14 and 52 μm per hour. These values indicated a high heterogeneity in the behavior of the HT-1080 fibrosarcoma cells under study in a collagen gel [32]. Furthermore, parameters such as phase change, optical volume, and motility were used to evaluate and quantify tumor cell invasion (Figure 2–B) [33]. The results showed a substantial reduction in the area and volume of invasive HELA cells, correlating with infiltration into the monolayer, while non-invasive cells maintained their morphological characteristics. Invasion speed was defined as the decrease in cell volume per unit of time, revealing a linear relationship between migration and invasion speed [33]. Namely, cells with greater migratory capacity showed a slower invasion speed, suggesting that cell movement dynamics impact infiltration capacity [33]. Furthermore, holographic microscopy effectively differentiates between cells undergoing apoptosis and healthy control cells. It provides precise quantitative data regarding cell number, confluence, volume, and area, facilitating accurate distinctions between primary and metastatic tumor cells. By capturing these biophysical and morphological changes in real-time, holographic microscopy represents a powerful tool for understanding tumor progression, metastatic behavior, and the response of cancer cells to therapeutic interventions [34,35].
Nucleoli volume and RI quantification were analyzed by combining holographic and confocal laser scanning microscopy (CLSM)-based fluorescence correlation spectroscopy (FCS) [36]. Strikingly, it was possible to understand the physical parameters of nucleoli in living cells, especially under physiological conditions. Recent studies demonstrated that the physicochemical properties of the nucleolus are sensitive to adenosine triphosphate (ATP) depletion and transcriptional inhibition, while they were less affected by high osmotic pressure, compared to the cytoplasm and nucleoplasm [37]. Also, studies demonstrated that the nucleolus has a dynamic rather than rigid structure, with significant variations in its morphology and volume under different physiological conditions, such as osmolarity change and transcription inhibition [36,38]. Using holographic microscopy, 3D images were obtained showing the nucleolus heterogeneity, with different RI bands representing variations in molecular density. Specifically, the nucleolus showed an average RI of 1.363, higher than the RI of cytoplasm and nucleoplasm, and changes in the physicochemical properties of the nucleolus were indicative of its response to cellular stresses, suggesting an important role in cellular regulation and ribosome biogenesis [36].
Bimodality, analysis that can display either a unimodal or multimodal distribution, may indicate abnormal cellular characteristics associated with cancer. By comparing the RI and dry mass density measured through digital holographic microscopy, researchers identified optical biomarkers capable of distinguishing cells with varying invasion and proliferation capabilities [39]. B16F1 and B16F10 cells were compared, both from murine melanoma. The first (F1) has lower pulmonary metastatic potential than the second one (F10). Specifically, cells with greater metastatic potential (F10) showed a high RI (1.3989 ± 0.0112 µg/m2) and a lower dry mass density (0.8003 ± 0.1771 µg/m2), while cells of lower metastatic potential (F1) presented a lower RI (1.3610 ± 0.0039 µg/m2) and greater dry mass density (1.4261 ± 0.0844 µg/m2) than the previous ones. Furthermore, phase distribution analysis from quantitative phase images revealed distinct patterns based on metastatic potential. Cells with lower metastatic potential exhibited multimodal distribution, characterized by multiple peaks on graphs where the x-axis represents phase values, and the y-axis represents frequency or pixel count. This suggests the presence of distinct subpopulations within the dataset, indicating heterogeneity. In contrast, cells with higher metastatic potential presented a unimodal distribution, characterized by a single peak, indicating greater homogeneity and shared cellular characteristics [39].
Holographic microscopy has also proven effective in enhancing the accuracy of urothelial carcinoma diagnosis in urinary cytology samples. For instance, a study by Pham et al. used this technique to measure cellular dry mass and assess nuclear characteristics of urothelial cells, aiming at differentiating between benign and malignant diagnoses [38]. Strikingly, nuclear dry mass and nuclear entropy were significantly increased in cancer patients compared to healthy individuals, showing an area under the curve (AUC) of 0.98 and 1, respectively. The AUC was used to assess the ability of the analyzed parameters to differentiate between cytological diagnostic categories, such as negative, atypical, suspicious, and positive for malignancy. An AUC of 1 represented a perfect model with complete classification accuracy, whereas an AUC of 0.5 indicated no discriminatory power, equivalent to random chance [38]. The nuclear dry mass quantified the integrated mass of the entire nucleus, and an increased nuclear dry mass could be associated with higher DNA content. In addition, an increased nuclear entropy suggested a higher structural heterogeneity within the nucleus [38]. The quantified nuclear dry mass of healthy epithelial cells ranged from ca. 15 to 17 picograms (pg), having an average of 15.8 pg, while cells of cancer patients ranged from 33–35 pg, having an average of 34.4 pg. Interestingly, a progressive increase in the values of nuclear dry mass and nuclear entropy accompanied the malignancy. This suggested that tumor cells presented greater mass and structural heterogeneity than healthy cells. The average total cell masses of the negative, atypical, suspicious, and positive groups were quantified as 51.1, 49.2, 59.5, and 52.6 pg, respectively. The nuclear entropy varied from 0.35 to 0.80 for healthy cases, and from 1.00 to 1.55 for cancerous samples. Thus, this study suggested that the urothelial nuclear dry mass, rather than the total cell dry mass, could be correlated with malignancy. Nonetheless, nuclear entropy was also increased in cancerous samples, demonstrating a relation with malignancy [38]. Holographic microscopy was also tested for the quantitative analysis of live pancreatic tumor cells, allowing the determination of the integral RI and the measurement of the thickness and shape of adherent cells [40]. In this study, cells presented an average RI value of 1.38±0.015, and an average thickness ranging from 7 and 23±1 . In addition, cells’ response to drug treatment and changes in cell morphology were also analyzed by holographic microscopy. For instance, after the addition of the Latrunculin B toxin, morphological changes were observed in the monitored cells, with a decrease of up to 50% in thickness, highlighting the contribution of this technique in evaluating the effectiveness of treatments and investigating dynamic biological processes associated with biophysical cellular alterations [40].
In recent studies, the diagnostic power of holographic microscopy has been significantly enhanced through its integration with complementary analytical techniques, offering deeper insight into cancer cell behavior and classification. For example, combining holographic microscopy with computerized algorithms, such as self-supervised learning, enabled an accurate distinction of different cancer cell lines [41]. This combination allowed a detailed analysis of tumor cells’ morphology and intracellular content, thus contributing to a better understanding of the cellular characteristics associated with cancer [41,42]. The combined approach efficiently identified different modalities of cell death, such as apoptosis and necroptosis, in cancer cells[34], opening new avenues for investigating regulatory mechanisms associated with cell death.[34,41,42] Finally, the combination with Raman spectroscopy allowed the observation of morphological and molecular differences between cells with different metastatic potentials, specifically between parental cells, CTCs, and lung metastatic cells [43]. The obtained 3D RI tomograms revealed morphological variations, such as area, aspect ratio, and dry mass, which increased with the metastatic potential of cells, with lung metastatic cells showing significantly higher dry mass when compared to parental cells and CTCs. Yet, statistical analysis indicated that although there were significant morphological differences, overlap in the distributions of morphological parameters made it difficult to robustly classify cells based on these features alone. On the other hand, Raman spectroscopy allowed the identification of distinct spectral signatures associated with each cell type [43].
Beyond oncology applications, holographic microscopy has also shown considerable promise in hematological analysis, where accurate detection and classification of blood cells are essential for diagnosing and monitoring various diseases. Notably, optical diffraction tomography (ODT)–a 3D extension of holographic microscopy–has enabled high-resolution, label-free imaging of blood cells, offering detailed structural and biophysical information (Figure 2-C). In a recent study by Ryu et al., ODT was combined with deep learning algorithms to develop a label-free hematology analysis framework capable of classifying major blood cell types, including normal and abnormal red blood cells (RBCs), platelets, and white blood cells (WBCs), achieving a total classification accuracy of 0.971 [44]. In addition to categorical classification, the system successfully estimated key hematological indices, such as mean corpuscular volume (MCV) and mean corpuscular hemoglobin (MCH), by analyzing the RI distributions of individual cells. These estimations showed strong correlation with conventional hematological measurements, with Pearson correlation coefficients of 0.905 for MCV and 0.889 for MCH. These findings underscore the potential of ODT, when combined with artificial intelligence, as a powerful, label-free alternative to traditional hematology analyzers, especially for applications requiring high-throughput, quantitative, and reagent-free blood analysis [44].
In summary, holographic microscopy is an innovative, non-invasive technique that enables detailed 3D cell analysis without requiring chemical markers. This approach is advantageous for studying dynamic processes and cellular morphology, making it highly useful in cancer investigation and diagnosis. Its ability to provide quantitative data on optical phase and cell morphology, along with its compatibility with other techniques, offers valuable insights into the characteristics and behavior of tumor cells.
3. Cytometric Techniques
Cytometry encompasses a range of analytical techniques that quantify the physical and chemical characteristics of individual cells or particles. Traditionally, these methods rely on light scattering and fluorescence emission to assess parameters such as size, granularity, and biomarker expression[45]. Modern cytometric approaches have evolved to include label-free strategies that harness additional cellular features, such as electrical impedance, mechanical deformability, and morphological characteristics, for complete analysis. In these systems, cells typically pass through laser beams or electrical fields, where detectors capture real-time data on their intrinsic properties [46]. The following subsections explore several label-free cytometric modalities that are particularly relevant for cancer research and diagnostics.
3.1. Deformability Cytometry: Mechanical Fingerprinting of Cells
Deformability cytometry allows the analysis of cells’ mechanical properties, such as deformability and viscoelasticity–features closely linked to key biological processes, such as cell differentiation, therapeutic response, and disease progression, including in cancer [47]. Assessing these biophysical properties in real-time provides valuable insights into dynamic cell behavior under physiological and pathological conditions. Early deformability cytometry platforms used extensional flow to stretch cells at throughputs of up to 1,000 cells per second, with deformability quantified by the maximum aspect ratio during forced deformation [47]. Notably, the application of this methodology was demonstrated using Latrunculin B on HL60 leukemia cells, where increased deformability after actin disruption revealed mechanophenotypic differences between treated and untreated cancer cells—differences not consistently captured by all cytometry modalities, suggesting variable sensitivity to cytoskeletal alterations among techniques [48]. More recently, Asghari et al. [49] introduced viscoelastic deformability cytometry (vDC), a high-throughput, label-free platform capable of analyzing up to 100,000 cells per second using parallelized microfluidics and viscoelastic flow (Figure 3-A). This system enabled real-time mechanical phenotyping of both liquid and solid biopsies, distinguishing malignant from normal cells based on deformability and size. For example, red blood cells and PBMCs differed in deformability, while breast cancer cell lines were distinguishable by size. Notably, chronic lymphocytic leukemia (CLL) cells showed significantly higher deformability than healthy B cells and PBMCs, highlighting vDC diagnostic potential. The platform also used to differentiate glioma-initiating cells (GICs) from more differentiated glioma cells (LTCs) and astrocytes, and successfully detected rare cancer cells in blood, demonstrating strong applicability for liquid biopsy [49]. These results confirm that vDC offers a robust, label-free method for cancer detection and disease monitoring through mechanical phenotyping.
Complementing this, Hua et al. [50] developed a constriction-based deformability cytometry (cDC) platform integrated with a deep learning–powered computational framework (ATMQcD), achieving a throughput of approximately 25,000 cells per minute, substantially higher than most prior image-based deformability systems (Figure 3–B). The platform captured multiple biomechanical parameters, including passage time, area-in-constriction, and deformation index, which were processed through a pipeline combining object detection (YOLOv5), tracking (Deep SORT), and segmentation (ResUNet++). These features were used to extract a stiffness index (c1), enabling quantification of cell deformability at single-cell resolution and independent of size. When applied to breast, lung, and bladder cancer cell lines, including hypoxia-conditioned subpopulations, the system effectively stratified metastatic potential and detected mechanical heterogeneity within mixed populations [50]. Notably, it classified metastatic phenotypes with over 92% accuracy using a support vector machine model trained on multiparametric data and achieved 89.5% accuracy in distinguishing cancer cells from leukocytes in a blood-like context. The incorporation of a physics-based viscoelastic model grounded in power-law rheology further enabled stiffness estimation aligned with atomic force microscopy benchmarks.
Collectively, these advances underscore the growing clinical and translational relevance of deformability cytometry as a high-throughput, label-free modality for probing cellular mechanics, enabling sensitive characterization of cancer phenotypes, disease progression, and therapeutic response in both research and diagnostic settings.
3.2. Impedance Cytometry: Electrical Cell Characterization
Impedance cytometry enables the detection of a wide variety of cellular biophysical properties, even without a microscope, such as morphology, size, viability, and others, of individual cells [51]. This technique is label-free and effective in measuring the dielectric properties of single particles [51]. This cytometry is free from optical complexities and does not require high-transparency devices or frequent calibrations of the laser beam [51].
Interestingly, this technique has proven capable of distinguishing live from dead cells with 94.5% accuracy in cell analysis, processing approximately 1,000 cells per second [52]. Using a novel double differential electrode configuration and 100 µm-wide indium tin oxide (ITO) electrodes, this low-cost microfluidic impedance cytometry (MIC) device successfully discriminated between living and dead MCF-7 breast cancer cells based on calibrated electrical diameter and opacity metrics—non-invasive markers of dielectric properties (Figure 4-A) [52]. Remarkably, the device also distinguished particles of different sizes, such as 7 µm and 10 µm polystyrene beads, achieving a geometry ratio between target and electrode width of 1:20, the lowest reported in impedance cytometry to date. This capability underscores the platform’s high sensitivity and resolution, particularly for small bioparticles and subtle viability-related dielectric shifts. Furthermore, its affordability (under USD 1 per chip) and ease of fabrication with ITO electrodes instead of lithographically produced gold electrodes position it as a scalable tool for point-of-care diagnostics, drug screening, and cell state monitoring in biomedical applications.
Recently, impedance cytometry has enabled label-free, high-throughput biophysical distinction of cancer cells from cancer-associated fibroblasts (CAFs), providing insight into cell–cell interactions within the tumor microenvironment (TME) and their role in drug resistance emergence in pancreatic ductal adenocarcinoma (PDAC) (Figure 4-B) [53]. Using multifrequency single-cell impedance cytometry (0.5–30 MHz), Salahi et al. employed supervised machine learning, particularly a support vector machine (SVM), to classify viable PDAC cells versus CAFs with over 93% accuracy, based on a set of 12 impedance-derived biophysical metrics including membrane capacitance, cytoplasmic conductivity, and electrical diameter [53]. This label-free classification strategy revealed that under gemcitabine treatment, the viability of cancer cells in co-culture with CAFs increased to ~85%, compared to only ~50% in monoculture, indicating a reprogramming of cancer cells toward a drug-resistant phenotype. The system detected subtle shifts in cell populations in mixed samples and predicted cell-type composition with up to 95% accuracy after drug treatment, even when conventional markers like EpCAM became unreliable due to nonspecific uptake by CAFs. These findings underscore the potential of impedance cytometry, paired with machine learning, to dissect phenotypic transitions associated with chemoresistance and to track tumor heterogeneity and cell state in a non-invasive, scalable manner.
A significant recent development, a novel modality combining microfluidic impedance cytometry with generative artificial intelligence (AI) to reconstruct high-resolution images of cells from their electrical impedance profiles, was developed by Kokabi et al. [54]. This approach captured impedance signals as cells passed through polydimethylsiloxane (PDMS) microchannels with integrated electrodes and processed using a deep neural network with eight hidden layers. Interestingly, the method successfully distinguished between normal control beads and two cancer cell lines (MDA-MB-231 breast cancer and HeLa cervical cancer cells), achieving 91% classification accuracy on a held-out test dataset. Importantly, the reconstructed cancer cell images achieved high structural fidelity when validated against ground truth images, with mean structural similarity index (MSSIM) scores of 0.97 for breast cancer cells and 0.93 for control beads [54]. This impedance-AI hybrid approach introduced a paradigm shift in label-free cellular analysis by bridging quantitative biophysical profiling with qualitative imaging. It enabled morphological assessment and classification from a single measurement modality, offering a scalable and cost-effective alternative to conventional microscopy.
Altogether, these developments position impedance cytometry as a scalable, non-invasive platform with transformative potential for applications in drug screening, tumor microenvironment profiling, and real-time monitoring of phenotypic transitions in cancer and other diseases.
3.3. Imaging Flow Cytometry: High-Throughput Morphological and Functional Analysis
Imaging flow cytometry (IFC) combines the capabilities of both flow cytometry and microscopy. It provides detailed morphological information while enabling high-throughput, single-cell analysis and high-resolution image generation for precise morphometric cellular analysis [55]. Label-free IFC overcomes the limitations of conventional flow cytometry, which typically relies on fluorescent probe labeling. These limitations include non-specific probe binding, potential interferences, low quantitative performance, and cellular molecules labelling problems [56]. Despite its advantages, label-free IFC has some limitations. These include data complexity, high instrument cost and maintenance, data storage, and equipment handling due to its high-throughput capabilities, and software limitations, such as the need for manual intervention in defining cellular regions [57]. To address these limitations and expand the use of label-free IFC, recent technological innovations have focused on integrating complementary imaging modalities and artificial intelligence (AI)–driven analysis.
3.3.1. Multimodal Integration and AI-Enhanced Applications in IFC
Recent advancements in imaging flow cytometry (IFC) have led to the integration of dual-modality systems capable of simultaneously capturing brightfield and light-scattering images of individual cells using a single detector. One such system achieved an accuracy of 89.5% in the automatic classification of cell subtypes based solely on light-scattering features, demonstrating the potential of label-free analysis for immune profiling and disease monitoring [58]. Another notable innovation is multiplexed asymmetric-detection time-stretch optical microscopy (multi-ATOM)—a high-throughput flow cytometry platform combining IFC with ultrafast quantitative phase imaging inspired by holographic microscopy principles [59]. Multi-ATOM enables imaging at rates exceeding 10,000 cells per second, vastly outpacing conventional systems, while preserving subcellular resolution. This system allows for large-scale, single-cell phenotypic profiling with enhanced reproducibility and statistical power. In classification tasks, multi-ATOM successfully distinguished multiple human leukemia subtypes with accuracy ranging from 92% to 97%, underscoring its applicability in hematological diagnostics and cell-based research [59].
Recently, Dudaie et al. [60] developed a quantitative interferometric IFC (QIFC) platform for detecting bladder cancer cells in urine. The system captured optical path delay (OPD) maps of single cells in flow using interferometric phase microscopy (IPM) and segmented them using deep learning and machine learning algorithms (Figure 5-A). It extracted 20 biophysical features, including 7 morphological (e.g., area, eccentricity, circularity) and 13 OPD-based features (e.g., dry mass, entropy, optical volume, contrast), to classify cell lines as benign or malignant. In clinical urine samples, the system achieved 96% accuracy and 96% AUC using deep learning, and 95% accuracy with 93% AUC using gradient boosting, outperforming some FDA-approved urinary biomarkers [60]. The platform demonstrated significant differences in cell shape, internal complexity, and dry mass between healthy urothelial cells and bladder cancer cells—malignant cells exhibited higher circularity and mean OPD, and lower area, OPD energy, OPD volume, dry mass, OPD entropy, and contrast compared to healthy cells (all p < 0.001)—enabling high-accuracy classification even in mixed, label-free clinical samples. Complementarily, another study demonstrated the power of deep learning-enhanced image cytometry (DLIC) in peripheral blood mononuclear cells (PBMCs) from extranodal NK/T-cell lymphoma (ENKTL) patients[61]. By extracting biophysical markers—cell size, eccentricity, and refractive index (RI)—from over 270,000 PBMCs using AI-based nanophotonic modeling, they revealed stage-specific phenotypic heterogeneity correlated with relapse and treatment status (Figure 5–B). Notably, mean size increased (80.9 μm2 to 81.9 μm2), eccentricity decreased (0.59 to 0.56), and RI slightly decreased (1.3915 to 1.3911) from the interim to end-of-treatment groups[61]. Their system achieved on-site, label-free quantification, establishing a scalable framework for precision monitoring in hematologic malignancies. Together, these studies highlight the integration of AI in IFC as a transformative approach for label-free, biophysical profiling and clinical decision support.
Similarly, IFC, integrated with machine learning, enabled the label-free prediction of DNA content and classification of mitotic cell cycle phases by extracting morphological features from brightfield and darkfield images [62]. In fixed Jurkat cells, this method achieved a high correlation between predicted and actual DNA content (Pearson’s r = 0.896 ± 0.007), allowing classification into G1, S, and G2/M phases without fluorescence staining. Mitotic phase classification reached true positive rates of 65.5% for prophase and 100% for anaphase and telophase [62]. The platform also effectively detected cell cycle perturbations, such as a 19% increase in G2/M-phase cells following nocodazole treatment, confirming its utility in assessing drug-induced cell cycle arrest. This non-invasive, high-throughput approach eliminates staining artifacts and preserves fluorescence channels for other applications.
With these recent advancements, including integration with other microscopic techniques and AI algorithms, IFC has emerged as an innovative microfluidic approach. It stands out as one of the most promising technologies for clinically diagnosing cancer in a label-free manner. This unique technique combines high-throughput cellular analysis with high-resolution imaging, overcoming the limitations of conventional flow cytometry and enabling non-invasive cancer cell detection. Although cytometry techniques are based on microfluidic systems, this review will discuss differentiated microfluidic approaches used for label-free cellular analysis and classification in Section 5.
4. Cell and Particle Scattering Techniques
4.1. Dynamic Light Scattering and Zeta Potential
Dynamic light scattering (DLS) is conventionally a characterization technique in the materials field intended for particle size analysis in suspension or polymers in solution, based on capturing temporal oscillations through the analysis of the intensity or autocorrelation function of photons [63]. In contrast, static light scattering measures the angular distribution of the intensity of the scattered light resulting from interactions between light and sample particles. Recently, DLS has emerged as a promising tool for cell and tissue analysis for disease detection [64]. This technique offers several interesting features for biomedical applications, such non-invasive nature, rapid analysis, and minimal sample preparation. Furthermore, DLS is particularly well-suited for analyzing nanoscale particles (e.g., exosomes) [63]. However, several limitations affect the use of DLS. The technique is highly sensitive to variations in temperature and solvent viscosity, requiring precise control of experimental conditions. Furthermore, its resolution is constrained by the cumulant analysis method and artifacts, such as bubbles and reflective particles, which can degrade data quality. At low particle concentrations, the reduced signal-to-noise ratio presents additional challenges, requiring the use of sensitive detectors, larger sample volumes, and samples with higher refractive indices [65].
Notably, the surface charge of cells is dynamic (Figure 6-A), varying significantly with pH and ionic conditions of the surrounding medium. For instance, studies have shown that the zeta potential of breast cancer cells becomes more negative at alkaline pH and neutralizes or reverses at acidic pH (Figure 6-B) [66]. Furthermore, increased ionic strength, especially with divalent and trivalent electrolytes, reduces surface charge and promotes cellular aggregation, directly impacting tumor cell behavior such as adhesion and potentially metastasis [66]. DLS, therefore, provides critical insights into cellular dynamics, enabling correlations between biophysical properties and tumor cell aggregation characteristics. Moreover, DLS has successfully been applied to the non-invasive analysis of triple-negative breast cancer (TNBC, Figure 6-C) [64]. By evaluating intracellular motility and mitochondrial dynamics through intensity fluctuations of scattered light, DLS can identify and classify TNBC cells. Correlating these findings with confocal fluorescent imaging, researchers achieved high diagnostic accuracy (area under the curve of 0.95, accuracy of 0.89), highlighting DLS’s potential for precise, label-free cancer diagnostics.
On the other hand, understanding the glycocalyx properties and their impact on cell adhesion is critical since adhesion significantly affects cancer cell metastasis. The removal of specific glycocalyx components, such as chondroitin sulfate, influences adhesion dynamics; intense removal reduces adhesion strength and speed, whereas moderate digestion enhances these parameters [67]. Real-time measurement of cell adhesion kinetics using Resonant Waveguide Grating (RWG) technology provides high-resolution insights into the interactions between cancer cells and the extracellular matrix, contributing essential information on the mechanisms governing tumor cell dissemination [67]. Thus, integrating DLS findings with glycocalyx characterization deepens our comprehension of the biophysical underpinnings of cancer cell adhesion and metastatic potential.
Although zeta potential analysis in cells in suspension is still not widely used, its relevance has been demonstrated in previous studies, such as the ones mentioned above. However, this technique is currently more commonly applied to the study of extracellular vesicles when studying biological aspects, including cancer, due to the nanometric size of these vesicles [68]. The zeta potential of exosomes secreted by cancer cells was demonstrated to be significantly more negative than that of normal cells, which influences the interactions of these extracellular vesicles with nanoparticles and other components of the microenvironment and may eventually be used as cancer cell biomarkers [68].
Overall, DLS has been showing promising applications as a non-invasive technique for the diagnosis of cancer, with relevance in the analysis of cancer cells and extracellular vesicles. Although this technique requires low particle concentration and presents interpretive challenges that can compromise the accuracy of results, DLS provides detailed information about cellular dynamics and the electrostatic properties of cells and vesicles. Its capabilities make it a useful technique for investigating cellular interactions, with significant potential for identifying biomarkers associated with cancer.
4.2. Surface-Enhanced Raman Spectroscopy
Surface-enhanced Raman spectroscopy (SERS) stands out for its high specificity and sensitivity. SERS allows the detection of biomarkers at very low concentrations and the identification of CTCs [70,71,72]. This technique makes it possible to monitor changes in the molecular composition of cells and tissues, since each biomolecule has a characteristic Raman spectrum, differentiating between non-cancerous and cancerous cells and the analysis of biological fluids to identify disease-associated alterations [70]. However, this technique also has limitations, such as the need for more robust plasmonic substrates and the complexity in manufacturing SERS nanoparticles, in addition to emphasizing the importance of developing methods that integrate SERS with other analytical techniques to increase efficiency and clinical applicability [72].
Strikingly, SERS has emerged as a powerful technique due to its remarkable sensitivity and specificity in detecting cancer-related biomarkers. This methodology successfully differentiated serum samples from cancer patients and healthy controls, achieving diagnostic accuracies exceeding 90% [70]. More specifically research into the effects of varying silver nanoparticle (AgNP) concentrations demonstrated significant spectral changes directly related to disease-specific biomarkers, notably hypoxanthine and uric acid [70]. Moreover, a comparison of serum spectra before and after tumor removal indicated that post-operative spectral profiles closely matched those of healthy individuals [70]. Thus, SERS can effectively monitor alterations in serum composition following surgical intervention, highlighting its utility in evaluating treatment efficacy. Additionally, SERS plays a crucial role in identifying and characterizing circulating tumor cells (CTCs). Given the rarity and challenging detection of CTCs, SERS offers significant advantages, such as eliminating complex cell separation processes, enabling rapid and efficient analysis. Furthermore, the technique provides detailed molecular profiles, facilitating the evaluation of prognostic and predictive biomarkers. This capability allows clinicians to predict disease progression accurately and assess patient responses to specific therapies, thus enhancing personalized treatment approaches [71].
Interestingly, applying this technique to liquid biopsies, which offer a non-invasive alternative to traditional biopsies, allows for biomarker analysis in samples of blood and other body fluids [72]. The technique enables the molecular characterization of individual tumor cells, contributing to a better understanding of tumor heterogeneity and response to treatment. Furthermore, SERS has been integrated into microfluidic devices, facilitating real-time analysis and manipulation of single cells, which could lead to discoveries about cancer biology and the identification of new biomarkers relevant for diagnosis and prognosis [72].
Nonetheless, the integration of SERS with AI has shown great promise for early cancer detection. A recent study demonstrated that this approach can distinguish cancerous from healthy serum samples with high accuracy (95.81%), sensitivity (95.40%), and specificity (95.87%) [73]. Using only 15 µL of serum and silver nanowires to enhance the SERS signal, spectral data were analyzed through a support vector machine (SVM) model that evaluated 50 Raman intervals within the 600–1800 cm−1 range [73]. The study included over 1,900 samples across five cancer types—lung, colorectal, hepatic, gastric, and esophageal—enhancing model robustness. This method also distinguished early cancer from other diseases and showed potential in identifying subtle spectral differences between cancerous and non-cancerous samples. These results highlight the feasibility of applying SERS-AI systems as a rapid, non-invasive, and accurate cancer screening tool in clinical settings.
In conclusion, SERS has demonstrated remarkable potential in cancer detection and monitoring due to its high sensitivity and specificity. Its application in liquid biopsies and integration with microfluidic devices enable real-time, non-invasive analysis of tumor biomarkers, improving early diagnosis and treatment monitoring. The technique’s effectiveness in detecting CTCs without complex separation procedures further enhances its clinical utility. Additionally, the combination of SERS with AI has significantly improved cancer classification accuracy, allowing precise differentiation between cancerous and healthy samples. Despite challenges related to substrate robustness and nanoparticle fabrication, continued advancements in SERS technology and its integration with other analytical methods will further enhance its clinical applicability in oncology.
5. Microfluidics Systems for Cellular Analysis
Microfluidics involves the manipulation and analysis of small fluid volumes within microscale channels, typically measuring hundreds of micrometers in width [74]. Operating at the submillimeter scale, these systems offer several advantages, including high sensitivity, minimal reagent consumption, cost-effectiveness, and superior spatiotemporal resolution [75]. Despite these benefits, challenges remain, particularly in scalability, due to the intricacies of device design, prototyping, and fabrication. Additional limitations include sample preparation complexities, channel clogging, and surface fouling from biological materials, which can compromise reliability and hinder broader implementation [76]. Nevertheless, the integration of high-capacity microfluidic platforms in oncology is revolutionizing the research field. A notable example is a system capable of generating approximately 12,000 tumor spheroids per chip [77]. This platform enables drug screening in a 3D environment that more closely mimics the in vivo tumor conditions when compared to traditional 2D cultures. Importantly, cell viability assessments were performed in a non-destructive, label-free manner, showing strong concordance with conventional viability assays and demonstrating compatibility with various compounds and cell lines [77]. Such approaches hold significant promise not only for drug development but also for personalized medicine, offering the potential to predict therapeutic response or assess disease prognosis through label-free, patient-specific cancer modeling.
The following sections delve into each of these microfluidic strategies in detail, highlighting their operating principles, recent advances, and implications for precision oncology based on label-free approaches and on cellular biophysical biomarkers.
5.1. Passive Cell Separation Microfluidics
Passive microfluidics refers to the manipulation of flows in microstructured devices that operate without the need for external forces [78]. In the absence of these forces, the system can be substantially simplified, resulting in an improvement in its operational reliability. Furthermore, passive and label-free microfluidic devices have a remarkable ability to meet separation requirements in reduced times, due to their superior particle throughput compared to active microfluidic systems [78].
5.1.1. Deterministic Lateral Displacement
Deterministic lateral displacement (DLD) is a passive method with great potential, capable of segregating suspended particles based on their structural dimensions. This technique has been widely used in the separation of several classes of bioparticles, including CTCs and hematologic cells [79]. With DLD, particles of different dimensions are segregated into two trajectory modes as they pass through the device: collision mode and zigzag motion mode [78]. Larger particles are continuously deflected by the pillars, moving primarily along the array’s direction, while smaller particles, lacking sufficient mass to collide with the pillars, follow the fluid flow and the periodic pattern of the pillar array. To define the size range for each movement pattern, the concept of critical particle diameter (Dc) is introduced. Particles with a diameter smaller than Dc exhibit zigzag motion, whereas those with a diameter larger than Dc follow the collision mode [78,80].
The introduction of a new DLD chip with an optimized pillar design, which increases the efficiency of separating cells of different sizes, was crucial to enhancing the effectiveness of this technique [78]. One such application involves a dual-stage microfluidic biochip engineered for the isolation of circulating tumor cells (CTCs) and tumor clusters (Figure 7–A). In this system, the first stage uses a DLD array in the upper microchannels to perform label-free size-based classification of tumor clusters. This initial separation step achieved a recovery rate of 88.58% and a purity of 92.20%. The second stage incorporates an antibody-coated lateral filter designed to capture individual tumor cells and smaller clusters not isolated during the first pass, achieving 89.54% recovery and 89.44% purity. Even tough, not entirely label-free, the combination of passive physical separation and affinity-based selection underscores the potential of hybrid microfluidic systems for high-yield, high-purity tumor cell enrichment [81].
A critical factor in the performance of DLD systems is the pillar design within the array. Conventional zigzag modes, intended for smaller particles, may become unstable if poorly optimized, leading to unwanted trajectory deviations. To address this, a novel DLD chip was developed using topology optimization to refine pillar shape and channel width [78]. This design enabled flexible manipulation of particles, miniaturization of the device, and improved resistance to clogging. The chip was validated using both polystyrene beads and cancer cells, demonstrating enhanced capture purity of over 92.5% and a recovery rate of 97.1%, outperforming conventional DLD architectures (Figure 7-B). The refined pillar topology also allowed tighter control over the critical particle diameter (Dc), resulting in more accurate separation boundaries.
Altogether, DLD represents a robust and efficient label-free approach for the separation of tumor cells based on structural dimensions. Continued advancements in chip design, particularly through geometry optimization and integration with secondary capture strategies such as immunoaffinity, are significantly expanding the applicability of DLD in cancer diagnostics and personalized medicine. Nonetheless, current DLD platforms remain largely constrained to size-based discrimination, with limited sensitivity to cellular deformability or shape, highlighting the need for further refinement or hybridization with active sorting techniques to improve specificity and functional cell isolation.
5.1.2. Inertial Focusing and Centrifugal Microfluidics
Inertial focusing, or centrifugal microfluidics, leverages hydrodynamic forces to passively manipulate and separate cells or particles within microchannels [82]. These platforms guide particles toward equilibrium positions based on their size and density, influenced by the channel geometry and flow conditions [82], offering a label-free, high-throughput approach suitable for point-of-care diagnostics.
Strikingly, recent advances have demonstrated the feasibility of isolating rare tumor cells from urine samples using spiral microchannels [83]. By combining inertial lift and Dean drag forces, cells migrate laterally toward size-dependent equilibrium positions—larger cells concentrate near the inner wall, while smaller ones disperse outward. This method achieved a separation efficiency of ~85% and showed strong correlations with conventional diagnostic markers such as prostate-specific antigen (PSA) levels and Gleason scores, highlighting its potential for non-invasive prostate cancer screening (Figure 7-C) [83].
Another interesting application involved a low-cost centrifugal microfluidic platform engineered to isolate circulating tumor cells (CTCs) from whole blood using a Y-shaped microchannel integrated with a contraction–expansion array (CEA) and a bi-furcation region [84]. By inducing differential flow velocities and inertial focusing, cancer cells were separated from hematologic components with up to 90% efficiency [84]. These results demonstrate the clinical utility of inertial platforms for early cancer detection via liquid biopsy, especially given their alignment with prognostic biomarkers.
Nonetheless, one of the most impactful devices in this field is the CTC-iChip, which combines passive inertial focusing with active magnetic separation. Developed by Ozkumur et al.,[85] this hybrid microfluidic system captures both EpCAM-positive and EpCAM-negative cancer cells from blood, overcoming the limitations of traditional affinity-based CTC capture methods [85]. With a processing rate of ten million cells per second, the CTC-iChip enabled downstream morphological, immunohistochemical, and molecular analyses at the single-cell level. It has been successfully applied to multiple cancer types, including lung, prostate, pancreatic, breast, and melanoma, providing a comprehensive tool for tumor profiling and monitoring disease heterogeneity.
Concluding, inertial and centrifugal microfluidic cell separation methods, based on physical properties like size and shape, offer simplicity and potentiate scalability for clinical applications. While these systems are advantageous in terms of simplicity and throughput, they may have limited resolution for separating cell types with overlapping biophysical characteristics. Combining these with active techniques, such as inertial focusing and magnetic separation, enhances separation efficiency and enables the capture of a broader range of cells. This hybrid approach shows great potential for more precise and comprehensive diagnostics, particularly in complex diseases, such as cancer.
5.1.3. Microfiltration
Microfiltration is a cell separation technique that involves the selective extraction of specific cell populations from heterogeneous mixtures using size-based filtration [80]. This passive method employs specifically designed microfilters featuring precisely dimensioned microstructures, which selectively capture or retain particles that exceed a predetermined size limit, thus allowing the passage of smaller ones. In addition to size, other physical properties, such as cell morphology and rigidity, can also be exploited to enhance selective separation [80]. Unlike DLD, which relies on flow dynamics and inertial forces, microfiltration relies solely on physical barriers.
To address the challenges associated with traditional microfluidic technologies, such as non-scalable fabrication, lengthy processing times, and lack of automation, advanced membrane-based microfiltration devices have been developed. A nice example incorporated fully automated sample processing coupled with a machine-vision imaging system, significantly improving the efficiency of circulating tumor cell (CTC) isolation from blood (Figure 7-D) [86]. By using nickel membranes, this device has achieved capture efficiencies greater than 93% for various prostate cancer cell lines (including PC-3, VCaP, DU-145, and LNCaP), while maintaining high reproducibility, as indicated by coefficients of variation below 7% [86]. Importantly, processing times are greatly reduced, with the device capable of analyzing 7.5 mL blood samples in under 12 min. Captured tumor cells demonstrate high viability averaging 90.3%, suggesting minimal detrimental effects from shear stress during filtration. Moreover, this approach facilitates downstream molecular analyses, such as mutation detection, even at low concentrations of CTCs, underscoring its value in clinical disease monitoring and management [86].
The microfiltration technique was also employed for the negative enrichment of CTCs from clinically relevant volumes of unmanipulated whole blood depleting normal blood cells [87]. This strategy minimizes biased selection and makes the technology broadly applicable across different tumor types. Strikingly, Chia-Heng Chu et al. [87] developed a 3D-printed hybrid microfluidic device combining leucodepletion channels with microfiltration, effectively separating tumor cells based on their size contrast with normal blood cells. Even though not entirely label-free, the device achieved approximately a 2.34-log depletion, capturing over 99.5% of white blood cells from 10 mL of whole blood, while simultaneously recovering more than 90% of tumor cells [87]. This advanced device successfully isolated CTCs from blood samples of prostate and pancreatic cancer patients, with measured concentrations ranging from 0 to 3.4 CTCs/mL in prostate cancer samples and around 0.3 CTCs/mL in pancreatic cancer samples [87]. These results illustrate the significant potential of negative enrichment microfiltration approaches for non-invasive tumor diagnostics and liquid biopsies based on biophysical features of cells.
In conclusion, microfiltration represents a powerful and versatile tool for cell separation, offering significant improvements in isolation efficiency, throughput, automation, and compatibility with downstream analyses. Also, its combination with active separation approaches may improve the accuracy of these technologies. Nonetheless, its adaptability to various clinical applications underscores its promise in enhancing diagnostic capabilities and personalized medicine approaches in oncology.
5.2. Active Cell Separation Microfluidic
While passive microfluidic systems rely on intrinsic fluid dynamics and structural design for cell separation, active microfluidic platforms offer additional precision and tunability by applying external force fields to manipulate cells based on their unique biophysical properties. These systems rely on physical forces, such as acoustic, magnetic, and electric to induce differential motion or positioning of cells within the microscale [88]. This strategy enables highly selective, label-free separation of rare or phenotypically similar cell populations, making it particularly valuable for applications such as circulating tumor cell (CTC) isolation, cell state profiling, and tumor heterogeneity assessment (Figure 8). The following subsections explore the main active approaches—acoustofluidics, magnetofluidics, and dielectrophoresis—highlighting their principles, advantages, and emerging applications in label-free cancer cell detection.
5.2.1. Acoustofluidics
Acoustic microfluidics, also known as acoustofluidics or acoustophoresis, has emerged as a promising technique for label-free cells manipulation and separation within a microfluidic device [89]. This approach employs low-intensity acoustic pressure, namely bulk acoustic waves (BAWs) or surface acoustic waves (SAWs), to cells or particles based on their size, density, compressibility, and other physical properties, allowing for non-contact, biocompatible, and continuous sample processing [89].
Traditionally, centrifugation with density liquids is the most used conventional method for separating the main components of blood, including RBCs, WBCs, and platelets. However, this method has limitations in both efficiency and biocompatibility [90]. In contrast, acoustofluidic technologies enable continuous and gentle separation of cells without chemical labelling or extensive sample preparation. For instance, acoustofluidic separation was applied to plasma exchange, where acoustic waves guided RBCs into clean medium channels, achieving >95% recovery of RBCs and 98% contaminant removal at a flow rate of 0.17 mL/min [90]. Similarly, when separating platelets and WBCs, acoustofluidic preserved cell viability, making it particularly valuable for clinical applications. Strikingly, one of the most impactful uses of acoustofluidics in oncology is the isolation of circulating tumor cells (CTCs) from blood, a challenging task due to their rarity. Using a tilted-angle standing surface acoustic wave (SSAW) platform, researchers achieved high-throughput separation of CTCs at a flow rate of 1.2 mL/h with a recovery rate above 83%, even for samples containing as few as 100 CTCs/mL [91]. Finite element modeling was used to optimize device geometry, tilt angles, and operational parameters, ensuring efficient cell focusing and separation [91].
A critical challenge in acoustofluidics, namely acoustic cell manipulation, is cell misalignment upon entry into the acoustic field, which can affect separation and, thus, reduce its efficiency. To address this, Augustsson et al. [92] developed a pre-alignment system within a temperature-stabilized microchannel, improving separation fidelity. While focused on prostate cancer detection, it was shown >99% purity in separating 5 µm from 7 µm microspheres and 93.6–97.9% recovery of fixed tumor cells (and 72.5–93.9% for viable cells) with purity reaching up to 99.7% [92]. This study underscored the importance of precise pre-alignment in enhancing the resolution of label-free separation techniques for viable tumor cells and demonstrated that acoustophoresis can efficiently enrich both viable and fixed cancer cells with high recovery and purity [92].
Importantly, a significant challenge in analyzing CTCs is the loss of rare cells during post-separation processing steps. To address this challenge, acoustofluidics has been successfully combined with dielectrophoresis to further improve cancer cell handling efficiency (Figure 8–A) [93]. Briefly, in this study, prostate cancer cells were mixed with peripheral blood mononuclear cells to evaluate the efficiency of this method. In one approach, acoustic waves were used to concentrate prostate cancer cells, which were then captured in electroactive micro-well arrays for direct analysis, eliminating post-processing steps and minimizing the risk of rare cell loss [93]. This way, the designed platform enabled single-cell resolution analysis and high specificity, proving its clinical potential.
Thus, acoustofluidics offers a promising alternative to traditional methods, like centrifugation, due to its label-free nature, high compatibility and scalability. Importantly, it is well-suited for preserving cellular integrity when separating cancer cells from blood or urine, which is extremely important in rare cancer cells’ liquid biopsies, enabling downstream analysis with preserved viability. Combining acoustofluidics with methods like dielectrophoresis improves accuracy and further reduces cell losses. Future work focusing on device optimization and hybrid integration will further strengthen its role in minimally invasive cancer monitoring and personalized medicine.
5.2.2. Magnetofluidics
Magnetic microfluidics or magnetofluidics, employs magnetic fields to manipulate cells, particles and fluids within microchannels [94]. While magnetic forces are often used in label-dependent applications (e.g., with magnetically tagged particles), magnetofluidic systems can also be implemented in label-free modes by exploiting intrinsic biophysical properties such as mass density and magnetic susceptibility [94].
A nice example of label-free magnetofluidics is magnetic levitation, which enables the real-time monitoring and characterization of cells based on their density differences. This technique uses a paramagnetic medium, often gadolinium-based, suspended between two magnets to levitate cells at equilibrium heights corresponding to their biophysical properties [95]. Interestingly, this technique allowed the characterization and monitoring of cells and cellular events in real-time, with a cell mass density resolution of 1 × 10⁻⁴ g.mL−1, which is 10 to 100 times higher resolution than density gradient centrifugation, or at least 10 times finer resolution than passive microfluidic sorting methods [95].Moreover, magnetic levitation has allowed single-cell density quantification for various cancer types, including breast (1.044 g/mL), esophageal (1.059 g/mL), and lung cancer cells (1.062 g/mL), illustrating its applicability in cancer cell phenotyping [95].
Another good example was focused on ferrofluidics, magnetophoresis (Figure 8–B) which was used to separate cancer cells from leukocytes, achieving an average separation efficiency of 82.2% and a yield of 1.2 mL/h [96]. This method enabled the isolation of cancer cells at extremely low concentrations (~100 cells/mL) from a leukocyte sample containing approximately 106 cells/mL. Importantly, the cancer cells maintained a viability of 94.4% post-separation and retained their physiological functions, demonstrating the biocompatibility of ferrofluid systems [96]. Moreover, the cytocompatibility of ferrofluids was confirmed, showing that cancer cells not only survived exposure but also proliferated normally after detachment [96].
In a different study, magnetofluidics has also shown promise in distinguishing cancer cells with varying invasive potentials. For instance, magnetic levitation was applied to sort invasive and non-invasive breast cancer cells (MCF-7 and MDA-MB-231, respectively) from monocytic U937 cells (isolated from patient with histiocytic lymphoma) in a label-free manner [97]. Despite minimal differences in average densities (~0.011 g/mL), the system achieved approximately 70% sorting efficiency, processing samples at 1 mL/h [97]. This underscores the technique’s sensitivity in discriminating cell types with overlapping physical traits while preserving cell integrity for downstream analyses.
Also, magnetofluidics has also enabled the detection of circulating hybrid neoplastic cells (CHCs), a cell population exhibiting both tumor and hematopoietic features [98]. The results show that CHCs levitate and focus on different heights under paramagnetic conditions, allowing for the quantification of their biophysical properties. Specifically, CHCs exhibited levitation heights of 320 ± 29 μm in a 30 mM medium, increasing to 422 ± 19 μm in 50 mM and 468 ± 27 μm in 80 mM. In contrast, peripheral blood mononuclear cells (PBMCs) displayed lower levitation heights across all conditions, with an average of 226 ± 58 μm in 30 mM, 295 ± 75 μm in 50 mM, and 400 ± 84 μm in 80 mM [98]. These findings highlight the distinct biophysical properties of CHCs, which can be leveraged for their detection and isolation.
In sum, magnetofluidics offers a powerful and versatile approach for cancer cell separation and detection, leveraging inherent magnetic susceptibilities to isolate rare cells with high efficiency and minimal labeling requirements. Compared to conventional methods like density-based centrifugation or even flow cytometry, magnetofluidics systems enable label-free sorting specificity, particularly in capturing CTCs based on their inherent single-cell density. The technique also allows the characterization of cell mass biodensity. Advances in ferrofluid formulations, levitation chamber designs, and hybrid technologies will likely enhance its clinical relevance in non-invasive cancer diagnostics and personalized oncology.
5.2.3. Dielectrophoresis Microfluidics
Dielectrophoresis (DEP) is an electrokinetic phenomenon widely used in microfluidic platforms for manipulating cell movement [99]. It manipulates cells using non-uniform electric fields, leveraging differences in their dielectric properties, such as membrane capacitance, cytoplasmic conductivity, and overall polarizability [99]. Briefly, when subjected to an electric field, cells experience a force depending on their size, shape, and intrinsic electrical properties, allowing label-free separation between different cell types or functional states. DEP is particularly valuable for isolating rare cancer cells from complex biological mixtures with high specificity and minimal sample preparation.
DEP platforms operate in two primary modes: positive DEP (pDEP), where cells are attracted to regions of high electric field intensity, and negative DEP (nDEP), where cells are repelled from those regions [100]. The response is frequency-dependent and varies significantly between cell types, making DEP a flexible and tunable method for biophysical cell sorting.
In oncology research, this methodology has proven effective for separating CTCs from leukocytes while preserving cell viability [101]. A study investigating three lateral electrode configurations in 3D concluded that semicircular electrodes performed best, achieving a recovery rate of nearly 95% for MDA-MB-231 cells (breast cancer cell) without causing cellular damage [101]. The semicircular configuration enables the application of a maximum electric field of 1.11 × 10⁵ V/m, which remains below the threshold for cell electroporation, thereby ensuring cell integrity during the separation process. Additionally, a Joule heating study indicated that the temperature variation within the microchannel fluid is approximately 1 K, a safe range for maintaining cell viability. Overall, these findings confirm the effectiveness of dielectrophoresis in tumor cell separation [101].
In the broader context of isolating CTCs from blood components such as RBCs, WBCs, and platelets, a highly efficient microfluidic system incorporating a specialized dielectrophoresis configuration–the front electrode configuration dielectrophoresis structure (FEC-DEP) has demonstrated promising results (Figure 8–C). Through numerical simulations, system parameters were optimized to enhance separation efficiency and purity. Using this device, researchers achieved a separation rate of nearly 80% for CTCs, underscoring the technique’s potential for non-invasive tumor cell isolation from blood samples [102].
Altered dielectrophoresis, with a specific chip design that uses the pressure-sensitive adhesive method, allowed the capture and detection of small extracellular vesicles in biological samples, being useful for the detection of tumor biomarkers [103]. This chip, denominated acDEP-Exo chip , revealed an ability to detect small extracellular vesicles with a detection limit of 161 particles/μL, demonstrating superior sensitivity compared to conventional methods such as immunoaffinity and ultracentrifugation methods. This also analyzed specific biomarkers, such as EpCAM and MUC1, in plasma samples from breast cancer patients and healthy volunteers, revealing that the combination of these biomarkers presents high sensitivity, specificity and accuracy in diagnosis. Furthermore, it is also highlighted that dielectrophoresis allowed the capture of small extracellular vesicles without the need for conventional immunofluorescence methods, avoiding problems such as protein contamination and mechanical damage to the vesicles [103].
Thus, dielectrophoresis stands out as a precise technique for the manipulation and separation of cells and extracellular vesicles, particularly interesting to differentiate CTCs from other blood components. The use of optimized electrode configurations, such as the semicircular and frontal electrodes, demonstrated high efficacy in the recovery and preservation of tumor cells, maintaining their viability. Furthermore, the technique has shown promise in detecting tumor biomarkers by capturing small extracellular vesicles. These advances confirm the potential of dielectrophoresis as a useful method for cell separation and diagnosis of diseases such as cancer, contributing significantly to the development of non-invasive and high-precision diagnostics.
5.3. Cellular Mobility Within Microfluidic Arrays
Microfluidics designed to separate cells based on their path has also been conceived. A platform (Figure 9) was projected for the separation and enrichment of cancer cells from body fluids while addressing the difficulty of isolating metastatic tumor cells, which are generally present in small quantities in mixed fluids [104]. To overcome this challenge, the microfluidic separation of cells is based on their biomechanical properties. Cancer cells, which often have different biomechanical properties (such as size and stiffness) compared to healthy cells, are directed at other outputs of the device. Larger, stiffer cells tend to move toward specific exits, while smaller, softer cells pass through constrictions and collect at different exits. Cell path analysis demonstrated that cells with greater metastatic potential were softer and therefore behaved differently compared to less malignant cells, allowing for effective separation [104].
Other microfluidic designs have become relevant for understanding cell migration in 3D environments [105]. For instance, metastasis, which accounts for more than 90% of cancer-related deaths, relies on the complex and coordinated migration of invasive tumor cells within the tumor microenvironment, including the extracellular matrix. 3D microfluidic models overcome the limitations of conventional systems by replicating the biomechanical and biochemical properties of the tumor microenvironment. This capability is essential for studying cell migration and invasion with greater accuracy [105]. Analysis through real-time visualization of cellular dynamics, which allows the observation of migratory behaviors in response to different experimental conditions, is relevant. Thus, to address these challenges, a study revealed that cell migration is influenced by factors such as matrix stiffness, interstitial flow and interactions between tumor cells and cancer-associated fibroblasts. Furthermore, tumor cells exhibited distinct migratory behaviors, alternating between individual and collective migration, in response to biochemical and biomechanical signals [105].
Being a key marker of tumor progression, cell migration was also assessed using microfluidics integrated with the electrical cell-substrate impedance sensing (ECIS) technique, allowing real-time monitoring at the single-cell level. ECIS methodology showed effectiveness in monitoring cellular events such as adhesion, growth, and motility, through electrical changes at the interfaces between cells and electrodes [106]. Thus, the technique verified significant changes in the magnitude of impedance in metastatic cells and allowed cellular analysis of individual cells, being crucial for understanding the behavior of cancer cells during migration. In this way, the combination of microfluidics and ECIS allows for the rapid and selective detection of the migratory properties of cancer cells at the single-cell level, which may contribute to the understanding of metastasis [89,106].
6. Electro-mechanical and Surface Characterization
Beyond morphological and mechanical profiling, the electro-mechanical and surface properties of cancer cells offer valuable insights into their functional state, metastatic potential, and interaction with the tumor microenvironment. As cancer progresses, alterations in cell membrane composition, surface charge, electrical impedance, and adhesion dynamics become prominent and can be used as critical biophysical biomarkers. Label-free technologies that probe these properties—such as electrical impedance spectroscopy (EIS), atomic force microscopy (AFM)–have enabled non-invasive, high-resolution analysis of cancer cells in both static and dynamic settings. This section explores the principles, applications, and recent advances in electro-mechanical and surface characterization techniques, highlighting their role in cancer detection and real-time monitoring of biophysical cellular cues.
6.1. Atomic Force Microscopy
Atomic force microscopy (AFM) enables detailed characterization, manipulation and exploration of cells surfaces with molecular precision by assessing the structural organization of cell surfaces at the nanoscale, as well as the dynamics of membranes and cell walls. Through AFM it is also possible to measure the mechanical properties of cells, such as adhesion and magnitude [107]. The main advantage of this technique is the ability to study biological objects in their natural conditions, with minimal sample preparation, requiring only fixation to the surface. Furthermore, AFM can detect surface interaction, has extremely high sensitivity to any vertical positions, and measure cellular mechanics [108]. Despite its advantages, this technique has limitations, including low throughput, the limited imaging area, and resolution restrictions [109].
Over the last years, AFM has been a relevant tool in cancer cell research (Figure 9). Using this methodology, it has been possible to measure the mechanical properties of cancer cells, such as elasticity and cell adhesiveness, which differ significantly between benign cells and malignant breast cancer cells [112]. Cancer cells often exhibit changes in these properties, such as increased deformability [112,113]. The largest deformability of malignant cells when compared to benign cells may facilitate their migration and invasion. The AFM assessment of Young’s modulus of ovarian cells revealed the lowest invasive and migratory activity for non-malignant ovarian IOSE, medium one for HEY and the largest for HEY A8 cancer cells were accompanied by cellular stiffness changes (2.47 ± 2.05 kPa, 0.88 ± 0.53 kPa and 0.49 ± 0.22 kPa, respectively) indicating their inverse correlation with the indicators of metastatic potential [114]. Interestingly, in another research, Raji cancer cells isolated from lymphoma were shown to have lower Young’s modulus (0.2 to 0.4 kPa) compared to cutaneous T-lymphocyte non-cancerous cells (1 to 1.4 kPa) and to K-562 lymphoblast cells isolated from the bone marrow (0.6 to 0.7 kPa), suggesting that more aggressive cells are more deformable [114].
By taking advantage of AFM, the creation of stiffness profiles in tumor tissues is also possible, by identifying nanomechanical signatures that can serve as biomarkers for cancer detection [115]. Tumor tissues often exhibit bimodal elasticity profiles, reflecting the heterogeneity of tumors, where a peak of lower elasticity corresponds to softer cancer cells and another peak of higher elasticity is associated with stiffer tumor stroma. Furthermore, the elasticity of tumor tissues can vary depending on the type and stage of cancer, with the stiffness of tumor tissues generally being greater due to increased deposition and intertwining of the extracellular matrix [115].
The altered cellular stiffness properties in cancer cells result from increased tissue stiffness, which is often associated with the deposition and intertwining of the extracellular matrix [115]. Tumor tissues are generally stiffer than normal tissues, which may influence the ability of cancer cells to migrate and invade adjacent tissues [115]. Furthermore, other results demonstrated that normal and benign tissues had an unimodal distribution, indicating that these tissues have relatively uniform stiffness, while malignant tissues had a bimodal distribution, meaning that they exhibit heterogeneity [115]. AFM by measuring ECM stiffness demonstrated that matrix remodeling, characterized by an increase in stiffness, is associated with the promotion of angiogenesis and tumor growth [116]. Analysis of tumor spheroids also revealed that spheroid mechanics are heterogeneous, with different components showing significant variations in their mechanical properties, which may influence response to therapies [116].
The deformability of cancer cells, assessed by AFM, is significantly higher than that of non-malignant cells (Figure 9–A), which may serve as a biomarker of bladder cancer cells [117]. Through detailed analysis of the relationship between the mechanical properties of healthy and neoplastic bladder epithelial cells, it was observed that all carcinoma cells studied presented a similar modulus of elasticity, while non-malignant cells showed a considerably higher modulus of elasticity non-malignant (HCV29 cells modulus goes from 50 kPa at 100 nm to 10 kPa at 500 nm) than malignant cell line (HTB-9 cells modulus ranged from 15 kPa at 100 nm to 5 kPa at 500 nm), evidencing the rigidity of healthy cells compared to cancerous ones [117]. Furthermore, another study assessed breast cancer cell lines, demonstrating again that cellular stiffness is significantly higher in healthy cells, in which actin fibers are organized in well-aligned bundles, resulting in Young’s modulus values up to an order of magnitude higher compared to regions where these structures are not present (Figure 8–B). In contrast, tumor cells present a less structured actin organization, which contributes to lower rigidity and greater deformability, reinforcing the relevance of biomechanical properties in the characterization of the malignant phenotype. Precisely, at 1 Hz sensing, cell stiffness decreased with malignancy: MCF-10A (0.7 ± 0.3 kPa), MCF-7 (0.5 ± 0.1 kPa), and MDA-MB-231 (0.3 ± 0.1 kPa). At 250 Hz (PFM-AFM) sensing, all cells appeared stiffer, and the tendency was kept but enhanced between non-cancerous and cancerous cells: MCF-10A (250 ± 100 kPa), MCF-7 (28 ± 12 kPa), and MDA-MB-231 (25 ± 13 kPa); while stiffness differences between cancer lines were reduced [118].
In conclusion, AFM is an interesting tool in cancer research, enabling precise characterization of cellular mechanics and tumor tissue stiffness. By identifying differences in elasticity and adhesiveness between benign and malignant cells, AFM provides valuable insights into cancer cell behavior, migration, and invasion. Moreover, its ability to detect nanomechanical signatures offers potential for early cancer diagnosis and therapeutic assessment. Despite its limitations, AFM remains a powerful technique for advancing our understanding of tumor biomechanics and its role in cancer progression, potentially leading to the identification of cancer biomarkers.
6.2. Electrical Impedance Spectroscopy
Electrical impedance spectroscopy (EIS) is a technique that has been applied for the early detection of neoplasms [119]. This method is based on the analysis of the electrical conductivity of biological tissues, enabling the identification of discrepancies in electrophysiological properties between different types of body tissues [119]. While Zeta Potential, measured with DLS, indicates cell surface charge and potential interactions (aggregates), EIS reveals electrical impedance of the whole cell correlated with cell viability, size and internal structure. However, this technique faces challenges in microfluidic devices due to the need for high sensitivity in detecting signals in small volume sensors, which can compromise measurement accuracy [120]. Furthermore, the susceptibility to interference in measurement protocols and the large volume of data generated requires the use of advanced statistical and computational methods for accurate analysis [121].
Nonetheless, EIS has already been used to measure the bioimpedance of tissue from patients diagnosed with breast cancer, demonstrating that the technique can increase the rate of early cancer detection [119]. The results showed that the sensitivity was significantly high, at 77.8%, compared to other breast cancer detection techniques, such as mammography, which has a false negative rate ranging from 4% to 34%. Regarding Cole-Cole parameters, which are used to represent the frequency-dependent dielectric properties (like permittivity and conductivity) of biological tissues, it was observed that in seven out of nine patients analyzed, cancerous tissues consistently exhibited lower internal resistance and membrane capacitance compared to healthy tissues [119].
When increasing the resolution to the single cell level, this methodology has proven to be effective in differentiating between cancer and healthy cells, as well as distinguishing different pathological stages of cancer [122]. EIS enabled the capture and analysis of individual cells, providing insights into the electrical properties of cell membranes, such as capacitance and resistance, which varied with cancer progression. At 100 kHz, the membrane capacitance of normal MCF-10A cells (human breast tissue line) was 1.94 ± 0.14 AF/cm2. In contrast, breast cancer cell lines showed progressively lower values: 1.86 ± 0.11 AF/cm2 for MCF-7 (early-stage), 1.63 ± 0.17 AF/cm2 for MDA-MB-231 (invasive), and 1.57 ± 0.12 AF/cm2 for MDA-MB-435 (metastatic). Regarding electrical resistance at 100 kHz, normal MCF-10A cells exhibited a resistance of 24.8 ± 1.05 MΩ, while cancer cells displayed slightly varying values: 24.8 ± 0.93 MΩ for MCF-7, 24.9 ± 1.12 MΩ for MDA-MB-231, and 26.2 ± 1.07 MΩ for MDA-MB-435 [122]. The data revealed a decrease in membrane capacitance in cancer cells compared to healthy cells, with reductions of 4.1%, 16.0%, and 19.1% across different cancer cell lines. While the electrical resistance of cancer cells remained largely unchanged, the decrease in capacitance suggests that as cancer progresses, the cell membrane becomes more permeable. This change in permeability could serve as a potential indicator of disease stage [122].
Additionally, ESI revealed distinctive values when assessing highly metastatic cancer cells and those with lower metastatic potential [123]. Less metastatic cells exhibited a significantly higher impedance phase value of -63.4° ± 8.6°, while highly metastatic cells showed a lower value of -73.4° ± 10.4° (p < 0.001), reinforcing the method’s effectiveness in identifying distinct characteristics of cancer cells [123].
EIS has also proven valuable in monitoring chemoresistance–the ability of cancer cells to resist chemotherapy–by detecting resistant cells before symptoms manifest [124]. The technique monitored drug-induced cell adhesion, proliferation, and death, revealing a decrease in impedance as cells became chemoresistant, indicating changes in their electrical properties. Additionally, EIS facilitated the identification of cellular plasticity, which refers to the ability of cancer cells to adapt their characteristics in response to the microenvironment. Overall, EIS has proven effective in detecting these changes, enabling early identification of drug-resistant cells before clinical symptoms emerge [124].
In conclusion, EIS has proven to be a powerful tool in cancer research, offering valuable insights into the electrical properties of cancer cells. It enables the detection of changes in cellular electrical characteristics, such as capacitance and resistance, which can indicate cancer progression, metastatic potential, and chemoresistance. EIS also allows for the monitoring of cellular plasticity, making it possible to identify drug-resistant cells before clinical symptoms appear. These capabilities highlight EIS’s potential for early diagnosis and personalized treatment strategies in cancer management.
7. Clinical Translation
The clinical translation of label-free biophysical cellular detection methods marks a significant step toward non-invasive, real-time, and personalized cancer diagnostics. These technologies, ranging from optical, mechanical, electrical, and microfluidic platforms, offer the possibility to assess intrinsic physical and functional characteristics of cells without the need for molecular labels, complex preparation steps, or cell destruction. Yet, several challenges hinder widespread clinical adoption (Figure 10). One major limitation is the lack of standardization across platforms, including variation in chip design, measurement parameters, and cell processing protocols, which complicates comparison between studies and reduces reproducibility. Additionally, most current studies are limited to small patient cohorts or preclinical models, highlighting the need for large-scale, multicenter validation to establish diagnostic accuracy, sensitivity, and clinical utility. Foremost among these is the need for robust validation and standardization. Currently, many label-free platforms lack cross-institutional reproducibility and standardized operating procedures, which hinders their integration into routine diagnostic workflows[125]. These systems must demonstrate consistent performance across diverse laboratory settings and patient populations for regulatory approval from agencies, namely the FDA or EMA. Establishing standardized protocols and quality control measures will be essential to build clinical confidence and facilitate large-scale adoption.
Another major consideration is sample throughput and automation [130]. For label-free systems to be viable in busy clinical environments, such as oncology diagnostics, population screening, or treatment monitoring, they must be able to process high sample numbers (volumes of samples) quickly and reliably. Integration into existing laboratory workflows is crucial, as is the automation of image and data analysis, which can be supported by artificial intelligence (AI) and machine learning algorithms[126]. These enhancements will reduce operator dependency, minimize errors, and improve diagnostic speed and accuracy.
Cost and accessibility also play a critical role in the translational landscape. Although label-free technologies eliminate the recurring biochemical labels and reagents expenses, the underlying instrumentation, such as holographic microscopes, impedance cytometers, or imaging flow cytometers, can be expensive. Moreover, their complexity often demands skilled operation and maintenance. To overcome these limitations, future iterations must prioritize the development of affordable, portable, and user-friendly systems. This is particularly important for deployment in low-resource settings, where advanced diagnostic capabilities are often most needed yet least available.
A key strength of label-free technologies lies in their potential for multiparametric integration. Techniques such as imaging flow cytometry and surface-enhanced Raman spectroscopy (SERS) are powerful when combined with AI and multimodal data analysis. By integrating optical, electrical, and mechanical readouts, these platforms can provide comprehensive, label-free phenotyping of cellular and subcellular structures. This capability is invaluable in oncology, where it supports the characterization of CTCs, extracellular vesicles, and other biomarkers critical for personalized medicine.
Perhaps the most immediate and impactful clinical application of label-free technologies is in the field of liquid biopsy. These non-invasive diagnostic approaches utilize body fluids, such as blood, urine, or saliva, to detect cancer-associated biomarkers. Label-free systems that can sensitively isolate and analyze CTCs, cell-free DNA (cfDNA), or exosomes offer a powerful alternative to traditional tissue biopsies[127]. They enable early cancer detection, real-time monitoring of disease progression, and evaluation of therapeutic response with minimal discomfort or risk to the patient. By eliminating the need for chemical labeling, these methods also reduce assay complexity and potential sources of variability, making them well-suited for repeated or longitudinal testing.
In summary, the clinical translation of label-free detection technologies is an evolving process that hinges on standardization, automation, cost reduction, and clinical validation. As these methods continue to improve, especially through integration with artificial intelligence and microfluidic systems, they hold great potential to revolutionize cancer diagnostics, offering precise, accessible, and non-invasive solutions for early detection and personalized treatment monitoring.
8. Conclusions and Future Perspectives
Label-free technologies that assess biophysical cellular properties have emerged as powerful tools in cancer research and diagnostics, offering a unique perspective into cell behavior without the need for molecular labeling or extensive samples preprocessing. By leveraging intrinsic biophysical cues, namely cell size, shape, stiffness, dielectric properties, and surface adhesion, explored techniques enable real-time, non-invasive characterization of cancer cells vs. normal cells, with relevance for rare cell populations such CTCs. As highlighted in this review, a diverse array of platforms, including optical imaging (e.g., holographic and phase-contrast microscopy), electro-mechanical profiling (e.g., impedance cytometry, atomic force microscopy), and microfluidic technologies (both passive and active), has demonstrated substantial potential in detecting, isolating, and phenotyping malignant cells across various cancer types.
Despite their promising applications, several barriers still hinder the clinical adoption of label-free biophysical methods. Among these are the lack of standardized protocols, limited multicenter validation studies, and technical challenges related to reproducibility and device integration. The variability in measurement outputs, especially across different platforms and sample types, complicates direct comparison and impedes the establishment of universally accepted diagnostic thresholds. Furthermore, while artificial intelligence offers powerful data analysis capabilities, its clinical deployment must be supported by transparent, interpretable models and rigorous regulatory frameworks to ensure trust and accountability in medical settings.
Having this in mind, future research should prioritize the development of robust, hybrid platforms that combine multiple biophysical modalities to improve diagnostic specificity and sensitivity. Advancing toward compact, user-friendly and point-of-care systems will also be crucial to technologies translation into routine clinical workflows. Also, longitudinal studies with large patient cohorts are needed to establish the prognostic and predictive value of biophysical biomarkers over time. Nevertheless, collaborative efforts between engineers, biologists, clinicians, and data scientists will be essential to bridge the gap between technological innovation and clinical utility.
Funding
This work is funded by national funds through the Fundação para a Ciência e a Tecnologia (FCT), under the scope of the CELLo Project (2022.05237.PTDC), and has received funding and support from the “la Caixa” Foundation under the CaixaImpulse Grant CI24-10322 (CELLECTED Project), awarded to Raphaël F. Canadas.
Conflicts of Interest
The authors declare no conflicts of interest.
References
- World Health Organization. Available online: https://www.who.int/ (accessed on 13 August 2024).
- Jayanthi, V.S.P.K.S.A.; Das, A.B.; Saxena, U. Recent Advances in Biosensor Development for the Detection of Cancer Biomarkers. Biosens Bioelectron 2017, 91, 15–23. [Google Scholar] [CrossRef] [PubMed]
- National Cancer Institute. Available online: https://www.cancer.gov/ (accessed on 23 August 2024).
- Pulumati, A.; Pulumati, A.; Dwarakanath, B.S.; Verma, A.; Papineni, R.V.L. Technological Advancements in Cancer Diagnostics: Improvements and Limitations. Cancer Rep 2023, 6. [Google Scholar] [CrossRef] [PubMed]
- Syedmoradi, L.; Norton, M.L.; Omidfar, K. Point-of-Care Cancer Diagnostic Devices: From Academic Research to Clinical Translation. Talanta 2021, 225, 122002. [Google Scholar] [CrossRef]
- Oliveira, M.C. de; Caires, H.R.; Oliveira, M.J.; Fraga, A.; Vasconcelos, M.H.; Ribeiro, R. Urinary Biomarkers in Bladder Cancer: Where Do We Stand and Potential Role of Extracellular Vesicles. Cancers (Basel) 2020, 12, 1400. [Google Scholar] [CrossRef]
- Zhou, Z.; Zou, L.; Guan, Y.; Jiang, L.; Liu, Y.; Zhang, X.; Huang, X.; Ren, H.; Li, Z.; Niu, H.; et al. Survivin as a Potential Biomarker in the Diagnosis of Bladder Cancer: A Systematic Review and Meta-Analysis. Urologic Oncology: Seminars and Original Investigations 2024, 42, 133–143. [Google Scholar] [CrossRef] [PubMed]
- Zhang, S.X.; Liu, L.; Zhao, W. Targeting Biophysical Cues: A Niche Approach to Study, Diagnose, and Treat Cancer. Trends Cancer 2018, 4, 268–271. [Google Scholar] [CrossRef]
- Yadav, S.; Barton, M.J.; Nguyen, N.-T. Biophysical Properties of Cells for Cancer Diagnosis. J Biomech 2019, 86, 1–7. [Google Scholar] [CrossRef]
- Huang, Z.; Cao, L. Quantitative Phase Imaging Based on Holography: Trends and New Perspectives. Light Sci Appl 2024, 13, 145. [Google Scholar] [CrossRef]
- Zangle, T.A.; Teitell, M.A. Live-Cell Mass Profiling: An Emerging Approach in Quantitative Biophysics. Nat Methods 2014, 11, 1221–1228. [Google Scholar] [CrossRef]
- Ker, D.F.E.; Eom, S.; Sanami, S.; Bise, R.; Pascale, C.; Yin, Z.; Huh, S.; Osuna-Highley, E.; Junkers, S.N.; Helfrich, C.J.; et al. Phase Contrast Time-Lapse Microscopy Datasets with Automated and Manual Cell Tracking Annotations. Sci Data 2018, 5, 180237. [Google Scholar] [CrossRef]
- Hejna, M.; Jorapur, A.; Song, J.S.; Judson, R.L. High Accuracy Label-Free Classification of Single-Cell Kinetic States from Holographic Cytometry of Human Melanoma Cells. Sci Rep 2017, 7, 11943. [Google Scholar] [CrossRef]
- Boya, M.; Ozkaya-Ahmadov, T.; Swain, B.E.; Chu, C.-H.; Asmare, N.; Civelekoglu, O.; Liu, R.; Lee, D.; Tobia, S.; Biliya, S.; et al. High Throughput, Label-Free Isolation of Circulating Tumor Cell Clusters in Meshed Microwells. Nat Commun 2022, 13, 3385. [Google Scholar] [CrossRef]
- Stetefeld, J.; McKenna, S.A.; Patel, T.R. Dynamic Light Scattering: A Practical Guide and Applications in Biomedical Sciences. Biophys Rev 2016, 8, 409–427. [Google Scholar] [CrossRef]
- Farshchi, F.; Hasanzadeh, M. Microfluidic Biosensing of Circulating Tumor Cells (CTCs): Recent Progress and Challenges in Efficient Diagnosis of Cancer. Biomedicine & Pharmacotherapy 2021, 134, 111153. [Google Scholar] [CrossRef]
- Vasseur, A.; Kiavue, N.; Bidard, F.; Pierga, J.; Cabel, L. Clinical Utility of Circulating Tumor Cells: An Update. Mol Oncol 2021, 15, 1647–1666. [Google Scholar] [CrossRef] [PubMed]
- Lovitt, R.W.; Wright, C.J. MICROSCOPY | Light Microscopy. In Encyclopedia of Food Microbiology; Elsevier, 1999; pp. 1379–1388.
- Douglas, B. Murphy; Ron Oldfield; Stanley Schwartz; Michael W. Davidson MicroscopyU–The Source for Microscopy Education.
- Pastorek, L.; Venit, T.; Hozák, P. Holography Microscopy as an Artifact-Free Alternative to Phase-Contrast. Histochem Cell Biol 2018, 149, 179–186. [Google Scholar] [CrossRef] [PubMed]
- Zhang, J.; Hu, H.; Chen, S.; Huang, Y.; Guan, Q. Cancer Cells Detection in Phase-Contrast Microscopy Images Based on Faster R-CNN. In Proceedings of the 2016 9th International Symposium on Computational Intelligence and Design (ISCID); IEEE, December 2016; pp. 363–367. [Google Scholar]
- Chan, T.J.; Zhang, X.; Mak, M. Biophysical Informatics Reveals Distinctive Phenotypic Signatures and Functional Diversity of Single-Cell Lineages. Bioinformatics 2023, 39. [Google Scholar] [CrossRef] [PubMed]
- Edlund, C.; Jackson, T.R.; Khalid, N.; Bevan, N.; Dale, T.; Dengel, A.; Ahmed, S.; Trygg, J.; Sjögren, R. LIVECell—A Large-Scale Dataset for Label-Free Live Cell Segmentation. Nat Methods 2021, 18, 1038–1045. [Google Scholar] [CrossRef]
- Jo, H.; Han, J.; Kim, Y.S.; Lee, Y.; Yang, S. A Novel Method for Effective Cell Segmentation and Tracking in Phase Contrast Microscopic Images. Sensors 2021, 21, 3516. [Google Scholar] [CrossRef]
- Beres, B.; Kovacs, K.D.; Kanyo, N.; Peter, B.; Szekacs, I.; Horvath, R. Label-Free Single-Cell Cancer Classification from the Spatial Distribution of Adhesion Contact Kinetics. ACS Sens 2024. [Google Scholar] [CrossRef]
- Calin, V.L.; Mihailescu, M.; Petrescu, G.E.D.; Lisievici, M.G.; Tarba, N.; Calin, D.; Ungureanu, V.G.; Pasov, D.; Brehar, F.M.; Gorgan, R.M.; et al. Grading of Glioma Tumors Using Digital Holographic Microscopy. Heliyon 2024, 10, e29897. [Google Scholar] [CrossRef]
- Martin, C.; Altman, L.E.; Rawat, S.; Wang, A.; Grier, D.G.; Manoharan, V.N. In-Line Holographic Microscopy with Model-Based Analysis. Nature Reviews Methods Primers 2022, 2, 83. [Google Scholar] [CrossRef]
- El-Schich, Z. Digital Holographic Microscopy: A Noninvasive Method to Analyze the Formation of Spheroids. Biotechniques 2021, 71, 598–603. [Google Scholar] [CrossRef]
- Pirone, D.; Bianco, V.; Miccio, L.; Memmolo, P.; Psaltis, D.; Ferraro, P. Beyond Fluorescence: Advances in Computational Label-Free Full Specificity in 3D Quantitative Phase Microscopy. Curr Opin Biotechnol 2024, 85, 103054. [Google Scholar] [CrossRef] [PubMed]
- Kelly, D.P. Resolution Limits in Practical Digital Holographic Systems. Optical Engineering 2009, 48, 095801. [Google Scholar] [CrossRef]
- El-Schich, Z.; Leida Mölder, A.; Gjörloff Wingren, A. Quantitative Phase Imaging for Label-Free Analysis of Cancer Cells—Focus on Digital Holographic Microscopy. Applied Sciences 2018, 8, 1027. [Google Scholar] [CrossRef]
- Dubois, F.; Yourassowsky, C.; Monnom, O.; Legros, J.-C.; Debeir, O.; Van Ham, P.; Kiss, R.; Decaestecker, C. Digital Holographic Microscopy for the Three-Dimensional Dynamic Analysis of in Vitro Cancer Cell Migration. J Biomed Opt 2006, 11, 054032. [Google Scholar] [CrossRef]
- Nagy, Á.G.; Székács, I.; Bonyár, A.; Horvath, R. Simple and Automatic Monitoring of Cancer Cell Invasion into an Epithelial Monolayer Using Label-Free Holographic Microscopy. Sci Rep 2022, 12, 10111. [Google Scholar] [CrossRef]
- El-Schich, Z.; Mölder, A.; Tassidis, H.; Härkönen, P.; Falck Miniotis, M.; Gjörloff Wingren, A. Induction of Morphological Changes in Death-Induced Cancer Cells Monitored by Holographic Microscopy. J Struct Biol 2015, 189, 207–212. [Google Scholar] [CrossRef]
- Roitshtain, D.; Wolbromsky, L.; Bal, E.; Greenspan, H.; Satterwhite, L.L.; Shaked, N.T. Quantitative Phase Microscopy Spatial Signatures of Cancer Cells. Cytometry Part A 2017, 91, 482–493. [Google Scholar] [CrossRef]
- Kim, T.-K.; Lee, B.-W.; Fujii, F.; Kim, J.K.; Pack, C.-G. Physicochemical Properties of Nucleoli in Live Cells Analyzed by Label-Free Optical Diffraction Tomography. Cells 2019, 8, 699. [Google Scholar] [CrossRef]
- Kim, T.-K.; Lee, B.-W.; Fujii, F.; Kim, J.K.; Pack, C.-G. Physicochemical Properties of Nucleoli in Live Cells Analyzed by Label-Free Optical Diffraction Tomography. Cells 2019, 8, 699. [Google Scholar] [CrossRef]
- Pham, H. V.; Pantanowitz, L.; Liu, Y. Quantitative Phase Imaging to Improve the Diagnostic Accuracy of Urine Cytology. Cancer Cytopathol 2016, 124, 641–650. [Google Scholar] [CrossRef]
- Calin, V.L.; Mihailescu, M.; Scarlat, E.I.; Baluta, A. V.; Calin, D.; Kovacs, E.; Savopol, T.; Moisescu, M.G. Evaluation of the Metastatic Potential of Malignant Cells by Image Processing of Digital Holographic Microscopy Data. FEBS Open Bio 2017, 7, 1527–1538. [Google Scholar] [CrossRef]
- Kemper, B.; Carl, D.; Schnekenburger, J.; Bredebusch, I.; Schäfer, M.; Domschke, W.; von Bally, G. Investigation of Living Pancreas Tumor Cells by Digital Holographic Microscopy. J Biomed Opt 2006, 11, 034005. [Google Scholar] [CrossRef]
- Rehman, A.; An, H.; Park, S.; Moon, I. Automated Classification of Elliptical Cancer Cells with Stain-Free Holographic Imaging and Self-Supervised Learning. Opt Laser Technol 2024, 174, 110646. [Google Scholar] [CrossRef]
- Raub, C.B.; Nehmetallah, G. Holography, Machine Learning, and Cancer Cells. Cytometry Part A 2017, 91, 754–756. [Google Scholar] [CrossRef] [PubMed]
- Paidi, S.K.; Shah, V.; Raj, P.; Glunde, K.; Pandey, R.; Barman, I. Coarse Raman and Optical Diffraction Tomographic Imaging Enable Label-Free Phenotyping of Isogenic Breast Cancer Cells of Varying Metastatic Potential. Biosens Bioelectron 2021, 175, 112863. [Google Scholar] [CrossRef] [PubMed]
- Ryu, D.; Bak, T.; Ahn, D.; Kang, H.; Oh, S.; Min, H.; Lee, S.; Lee, J. Deep Learning-Based Label-Free Hematology Analysis Framework Using Optical Diffraction Tomography. Heliyon 2023, 9, e18297. [Google Scholar] [CrossRef]
- Pierzchalski, A.; Mittag, A.; Tárnok, A. Introduction A: Recent Advances in Cytometry Instrumentation, Probes, and Methods. In; 2011; pp. 1–21.
- Vasdekis, A.E.; Stephanopoulos, G. Review of Methods to Probe Single Cell Metabolism and Bioenergetics. Metab Eng 2015, 27, 115–135. [Google Scholar] [CrossRef] [PubMed]
- Lee, K.C.M.; Guck, J.; Goda, K.; Tsia, K.K. Toward Deep Biophysical Cytometry: Prospects and Challenges. Trends Biotechnol 2021, 39, 1249–1262. [Google Scholar] [CrossRef]
- Urbanska, M.; Muñoz, H.E.; Shaw Bagnall, J.; Otto, O.; Manalis, S.R.; Di Carlo, D.; Guck, J. A Comparison of Microfluidic Methods for High-Throughput Cell Deformability Measurements. Nat Methods 2020, 17, 587–593. [Google Scholar] [CrossRef]
- Asghari, M.; Ivetich, S.D.; Aslan, M.K.; Aramesh, M.; Melkonyan, O.; Meng, Y.; Xu, R.; Colombo, M.; Weiss, T.; Balabanov, S.; et al. Real-Time Viscoelastic Deformability Cytometry: High-Throughput Mechanical Phenotyping of Liquid and Solid Biopsies. Sci Adv 2024, 10, eabj1133. [Google Scholar] [CrossRef]
- Hua, H.; Zou, S.; Ma, Z.; Guo, W.; Fong, C.Y.; Khoo, B.L. A Deformability-Based Biochip for Precise Label-Free Stratification of Metastatic Subtypes Using Deep Learning. Microsyst Nanoeng 2023, 9, 120. [Google Scholar] [CrossRef]
- Tang, T.; Julian, T.; Ma, D.; Yang, Y.; Li, M.; Hosokawa, Y.; Yalikun, Y. A Review on Intelligent Impedance Cytometry Systems: Development, Applications and Advances. Anal Chim Acta 2023, 1269, 341424. [Google Scholar] [CrossRef] [PubMed]
- Yang, B.; Wang, C.; Liang, X.; Li, J.; Li, S.; Wu, J.J.; Su, T.; Li, J. Label-Free Sensing of Cell Viability Using a Low-Cost Impedance Cytometry Device. Micromachines (Basel) 2023, 14. [Google Scholar] [CrossRef]
- Salahi, A.; Honrado, C.; Moore, J.; Adair, S.; Bauer, T.W.; Swami, N.S. Supervised Learning on Impedance Cytometry Data for Label-Free Biophysical Distinction of Pancreatic Cancer Cells versus Their Associated Fibroblasts under Gemcitabine Treatment. Biosens Bioelectron 2023, 231, 115262. [Google Scholar] [CrossRef]
- Kokabi, M.; Rather, G.M.; Javanmard, M. Ionic Cell Microscopy: A New Modality for Visualizing Cells Using Microfluidic Impedance Cytometry and Generative Artificial Intelligence. Biosens Bioelectron X 2025, 24, 100619. [Google Scholar] [CrossRef]
- Zuba-Surma, E.K.; Kucia, M.; Abdel-Latif, A.; Lillard, J.W.; Ratajczak, M.Z. The ImageStream System: A Key Step to a New Era in Imaging. Folia Histochem Cytobiol 2007, 45, 279–290. [Google Scholar]
- Dudaie, M.; Dotan, E.; Barnea, I.; Haifler, M.; Shaked, N.T. Detection of Bladder Cancer Cells Using Quantitative Interferometric Label-free Imaging Flow Cytometry. Cytometry Part A 2024. [Google Scholar] [CrossRef] [PubMed]
- Barteneva, N.S.; Fasler-Kan, E.; Vorobjev, I.A. Imaging Flow Cytometry. Journal of Histochemistry & Cytochemistry 2012, 60, 723–733. [Google Scholar] [CrossRef]
- Wang, Z.; Liu, Q.; Chu, R.; Song, K.; Su, X. Single-Detector Dual-Modality Imaging Flow Cytometry for Label-Free Cell Analysis with Machine Learning. Opt Lasers Eng 2023, 168, 107665. [Google Scholar] [CrossRef]
- Lee, K.C.M.; Wang, M.; Cheah, K.S.E.; Chan, G.C.F.; So, H.K.H.; Wong, K.K.Y.; Tsia, K.K. Quantitative Phase Imaging Flow Cytometry for Ultra-Large-Scale Single-Cell Biophysical Phenotyping. Cytometry Part A 2019, 95, 510–520. [Google Scholar] [CrossRef]
- Dudaie, M.; Dotan, E.; Barnea, I.; Haifler, M.; Shaked, N.T. Detection of Bladder Cancer Cells Using Quantitative Interferometric Label-Free Imaging Flow Cytometry. Cytometry Part A 2024, 105, 570–579. [Google Scholar] [CrossRef]
- Park, S.; Yoon, S.E.; Song, Y.; Tian, C.; Baek, C.; Cho, H.; Kim, W.S.; Kim, S.J.; Cho, S.-Y. A Simple Approach to Biophysical Profiling of Blood Cells in Extranodal NK/T Cell Lymphoma Patients Using Deep Learning-Integrated Image Cytometry. BMEMat n/a. [CrossRef]
- Blasi, T.; Hennig, H.; Summers, H.D.; Theis, F.J.; Cerveira, J.; Patterson, J.O.; Davies, D.; Filby, A.; Carpenter, A.E.; Rees, P. Label-Free Cell Cycle Analysis for High-Throughput Imaging Flow Cytometry. Nat Commun 2016, 7, 10256. [Google Scholar] [CrossRef]
- Ross Hallett, F. Scattering and Particle Sizing Applications*. In Encyclopedia of Spectroscopy and Spectrometry; Elsevier, 1999; pp. 2488–2494.
- Lin, M.; Liu, T.; Zheng, Y.; Ma, X. Dynamic Light Scattering Microscopy Sensing Mitochondria Dynamics for Label-Free Detection of Triple-Negative Breast Cancer Enhanced by Deep Learning. Biomed Opt Express 2023, 14, 5048. [Google Scholar] [CrossRef]
- Jia, Z.; Li, J.; Gao, L.; Yang, D.; Kanaev, A. Dynamic Light Scattering: A Powerful Tool for In Situ Nanoparticle Sizing. Colloids and Interfaces 2023, 7, 15. [Google Scholar] [CrossRef]
- Moleón Baca, J.A.; Ontiveros Ortega, A.; Aránega Jiménez, A.; Granados Principal, S. Cells Electric Charge Analyses Define Specific Properties for Cancer Cells Activity. Bioelectrochemistry 2022, 144, 108028. [Google Scholar] [CrossRef]
- Kanyo, N.; Kovacs, K.D.; Saftics, A.; Szekacs, I.; Peter, B.; Santa-Maria, A.R.; Walter, F.R.; Dér, A.; Deli, M.A.; Horvath, R. Glycocalyx Regulates the Strength and Kinetics of Cancer Cell Adhesion Revealed by Biophysical Models Based on High Resolution Label-Free Optical Data. Sci Rep 2020, 10, 22422. [Google Scholar] [CrossRef] [PubMed]
- Akagi, T.; Kato, K.; Hanamura, N.; Kobayashi, M.; Ichiki, T. Evaluation of Desialylation Effect on Zeta Potential of Extracellular Vesicles Secreted from Human Prostate Cancer Cells by On-Chip Microcapillary Electrophoresis. Jpn J Appl Phys 2014, 53, 06JL01. [Google Scholar] [CrossRef]
- Michael Pycraft Hughes The Cellular Zeta Potential: Cell Electrophysiology beyond the Membrane. Integrative Biology 2024, 16. [CrossRef]
- Avci, E.; Yilmaz, H.; Sahiner, N.; Tuna, B.G.; Cicekdal, M.B.; Eser, M.; Basak, K.; Altıntoprak, F.; Zengin, I.; Dogan, S.; et al. Label-Free Surface Enhanced Raman Spectroscopy for Cancer Detection. Cancers (Basel) 2022, 14, 5021. [Google Scholar] [CrossRef]
- Wang, X.; Qian, X.; Beitler, J.J.; Chen, Z.G.; Khuri, F.R.; Lewis, M.M.; Shin, H.J.C.; Nie, S.; Shin, D.M. Detection of Circulating Tumor Cells in Human Peripheral Blood Using Surface-Enhanced Raman Scattering Nanoparticles. Cancer Res 2011, 71, 1526–1532. [Google Scholar] [CrossRef]
- Guerrini, L.; Alvarez-Puebla, R.A. Surface-Enhanced Raman Spectroscopy in Cancer Diagnosis, Prognosis and Monitoring. Cancers (Basel) 2019, 11, 748. [Google Scholar] [CrossRef]
- Shi, L.; Li, Y.; Li, Z. Early Cancer Detection by SERS Spectroscopy and Machine Learning. Light Sci Appl 2023, 12, 234. [Google Scholar] [CrossRef]
- Whitesides, G.M. The Origins and the Future of Microfluidics. Nature 2006, 442, 368–373. [Google Scholar] [CrossRef]
- Akgönüllü, S.; Bakhshpour, M.; Pişkin, A.K.; Denizli, A. Microfluidic Systems for Cancer Diagnosis and Applications. Micromachines (Basel) 2021, 12, 1349. [Google Scholar] [CrossRef]
- Gurkan, U.A.; Wood, D.K.; Carranza, D.; Herbertson, L.H.; Diamond, S.L.; Du, E.; Guha, S.; Di Paola, J.; Hines, P.C.; Papautsky, I.; et al. Next Generation Microfluidics: Fulfilling the Promise of Lab-on-a-Chip Technologies. Lab Chip 2024, 24, 1867–1874. [Google Scholar] [CrossRef]
- Chiang, C.-C.; Anne, R.; Chawla, P.; Shaw, R.M.; He, S.; Rock, E.C.; Zhou, M.; Cheng, J.; Gong, Y.-N.; Chen, Y.-C. Deep Learning Unlocks Label-Free Viability Assessment of Cancer Spheroids in Microfluidics. Lab Chip 2024, 24, 3169–3182. [Google Scholar] [CrossRef]
- Tang, H.; Niu, J.; Pan, X.; Jin, H.; Lin, S.; Cui, D. Topology Optimization Based Deterministic Lateral Displacement Array Design for Cell Separation. J Chromatogr A 2022, 1679, 463384. [Google Scholar] [CrossRef]
- Bhattacharjee, R.; Kumar, R. Trajectory Analysis of Circulating Tumor Cells through Contorted Deterministic Lateral Displacement Array for Unruptured Trapping: A Simulation Study. Journal of the Brazilian Society of Mechanical Sciences and Engineering 2024, 46, 295. [Google Scholar] [CrossRef]
- Zhang, T.; Di Carlo, D.; Lim, C.T.; Zhou, T.; Tian, G.; Tang, T.; Shen, A.Q.; Li, W.; Li, M.; Yang, Y.; et al. Passive Microfluidic Devices for Cell Separation. Biotechnol Adv 2024, 71, 108317. [Google Scholar] [CrossRef]
- Huang, S.-J.; Chang, C.-M.; Lu, Y.-T.; Liu, C.-H. Microfluidic Biochip for Target Tumor Cell and Cell-Cluster Sorting. Sens Actuators B Chem 2023, 394, 134369. [Google Scholar] [CrossRef]
- Burger, R.; Kirby, D.; Glynn, M.; Nwankire, C.; O’Sullivan, M.; Siegrist, J.; Kinahan, D.; Aguirre, G.; Kijanka, G.; Gorkin, R.A.; et al. Centrifugal Microfluidics for Cell Analysis. Curr Opin Chem Biol 2012, 16, 409–414. [Google Scholar] [CrossRef] [PubMed]
- Rzhevskiy, A.S.; Razavi Bazaz, S.; Ding, L.; Kapitannikova, A.; Sayyadi, N.; Campbell, D.; Walsh, B.; Gillatt, D.; Ebrahimi Warkiani, M.; Zvyagin, A. V. Rapid and Label-Free Isolation of Tumour Cells from the Urine of Patients with Localised Prostate Cancer Using Inertial Microfluidics. Cancers (Basel) 2019, 12, 81. [Google Scholar] [CrossRef] [PubMed]
- Lin, C.-C.; Tsai, J.-C.; Liu, Y.-Z.; Kuo, J.-N. Label-Free Cancer Cell Separation from Whole Blood on Centrifugal Microfluidic Platform Using Hydrodynamic Technique. Microfluid Nanofluidics 2024, 28, 10. [Google Scholar] [CrossRef]
- Ozkumur, E.; Shah, A.M.; Ciciliano, J.C.; Emmink, B.L.; Miyamoto, D.T.; Brachtel, E.; Yu, M.; Chen, P.; Morgan, B.; Trautwein, J.; et al. Inertial Focusing for Tumor Antigen–Dependent and –Independent Sorting of Rare Circulating Tumor Cells. Sci Transl Med 2013, 5. [Google Scholar] [CrossRef]
- Yee-de León, J.F.; Soto-García, B.; Aráiz-Hernández, D.; Delgado-Balderas, J.R.; Esparza, M.; Aguilar-Avelar, C.; Wong-Campos, J.D.; Chacón, F.; López-Hernández, J.Y.; González-Treviño, A.M.; et al. Characterization of a Novel Automated Microfiltration Device for the Efficient Isolation and Analysis of Circulating Tumor Cells from Clinical Blood Samples. Sci Rep 2020, 10, 7543. [Google Scholar] [CrossRef]
- Chu, C.-H.; Liu, R.; Ozkaya-Ahmadov, T.; Swain, B.E.; Boya, M.; El-Rayes, B.; Akce, M.; Bilen, M.A.; Kucuk, O.; Sarioglu, A.F. Negative Enrichment of Circulating Tumor Cells from Unmanipulated Whole Blood with a 3D Printed Device. Sci Rep 2021, 11, 20583. [Google Scholar] [CrossRef] [PubMed]
- Mansor, M.A.; Jamrus, M.A.; Lok, C.K.; Ahmad, M.R.; Petrů, M.; Koloor, S.S.R. Microfluidic Device for Both Active and Passive Cell Separation Techniques: A Review. Sensors and Actuators Reports 2025, 9, 100277. [Google Scholar] [CrossRef]
- Zhang, P.; Bachman, H.; Ozcelik, A.; Huang, T.J. Acoustic Microfluidics. Annual Review of Analytical Chemistry 2020, 13, 17–43. [Google Scholar] [CrossRef]
- Wu, M.; Ozcelik, A.; Rufo, J.; Wang, Z.; Fang, R.; Jun Huang, T. Acoustofluidic Separation of Cells and Particles. Microsyst Nanoeng 2019, 5, 32. [Google Scholar] [CrossRef]
- Li, P.; Mao, Z.; Peng, Z.; Zhou, L.; Chen, Y.; Huang, P.-H.; Truica, C.I.; Drabick, J.J.; El-Deiry, W.S.; Dao, M.; et al. Acoustic Separation of Circulating Tumor Cells. Proceedings of the National Academy of Sciences 2015, 112, 4970–4975. [Google Scholar] [CrossRef]
- Augustsson, P.; Magnusson, C.; Nordin, M.; Lilja, H.; Laurell, T. Microfluidic, Label-Free Enrichment of Prostate Cancer Cells in Blood Based on Acoustophoresis. Anal Chem 2012, 84, 7954–7962. [Google Scholar] [CrossRef]
- Antfolk, M.; Kim, S.H.; Koizumi, S.; Fujii, T.; Laurell, T. Label-Free Single-Cell Separation and Imaging of Cancer Cells Using an Integrated Microfluidic System. Sci Rep 2017, 7, 46507. [Google Scholar] [CrossRef]
- Zhang, Y.; Zhou, A.; Chen, S.; Lum, G.Z.; Zhang, X. A Perspective on Magnetic Microfluidics: Towards an Intelligent Future. Biomicrofluidics 2022, 16. [Google Scholar] [CrossRef] [PubMed]
- Durmus, N.G.; Tekin, H.C.; Guven, S.; Sridhar, K.; Arslan Yildiz, A.; Calibasi, G.; Ghiran, I.; Davis, R.W.; Steinmetz, L.M.; Demirci, U. Magnetic Levitation of Single Cells. Proceedings of the National Academy of Sciences 2015, 112. [Google Scholar] [CrossRef] [PubMed]
- Zhao, W.; Cheng, R.; Lim, S.H.; Miller, J.R.; Zhang, W.; Tang, W.; Xie, J.; Mao, L. Biocompatible and Label-Free Separation of Cancer Cells from Cell Culture Lines from White Blood Cells in Ferrofluids. Lab Chip 2017, 17, 2243–2255. [Google Scholar] [CrossRef]
- Kecili, S.; Yilmaz, E.; Ozcelik, O.S.; Anil-Inevi, M.; Gunyuz, Z.E.; Yalcin-Ozuysal, O.; Ozcivici, E.; Tekin, H.C. ΜDACS Platform: A Hybrid Microfluidic Platform Using Magnetic Levitation Technique and Integrating Magnetic, Gravitational, and Drag Forces for Density-Based Rare Cancer Cell Sorting. Biosens Bioelectron X 2023, 15, 100392. [Google Scholar] [CrossRef]
- Liang, K.; Yaman, S.; Patel, R.K.; Parappilly, M.S.; Walker, B.S.; Wong, M.H.; Durmus, N.G. Magnetic Levitation and Sorting of Neoplastic Circulating Cell Hybrids. 2022.
- Chan, J.Y.; Ahmad Kayani, A. Bin; Md Ali, M.A.; Kok, C.K.; Majlis, B.Y.; Hoe, S.L.L.; Marzuki, M.; Khoo, A.S.-B.; Ostrikov, K. (Ken); Rahman, Md.A.; et al. Dielectrophoresis-Based Microfluidic Platforms for Cancer Diagnostics. Biomicrofluidics 2018, 12. [Google Scholar] [CrossRef] [PubMed]
- Kwizera, E.A.; Sun, M.; White, A.M.; Li, J.; He, X. Methods of Generating Dielectrophoretic Force for Microfluidic Manipulation of Bioparticles. ACS Biomater Sci Eng 2021, 7, 2043–2063. [Google Scholar] [CrossRef]
- Varmazyari, V.; Habibiyan, H.; Ghafoorifard, H.; Ebrahimi, M.; Ghafouri-Fard, S. A Dielectrophoresis-Based Microfluidic System Having Double-Sided Optimized 3D Electrodes for Label-Free Cancer Cell Separation with Preserving Cell Viability. Sci Rep 2022, 12, 12100. [Google Scholar] [CrossRef]
- Nguyen, T.H.; Nguyen, H.T.; Ngo, N.A.; Nguyen, M.C.; Bui Thu, H.; Ducrée, J.; Chu Duc, T.; Bui, T.T.; Do Quang, L. Numerical Study on a Facing Electrode Configuration Dielectrophoresis Microfluidic System for Efficient Biological Cell Separation. Sci Rep 2024, 14, 27627. [Google Scholar] [CrossRef] [PubMed]
- Lan, M.; Ren, Z.; Cheng, C.; Li, G.; Yang, F. Small Extracellular Vesicles Detection Using Dielectrophoresis-Based Microfluidic Chip for Diagnosis of Breast Cancer. Biosens Bioelectron 2024, 259, 116382. [Google Scholar] [CrossRef] [PubMed]
- Stone, N.E.; Raj, A.; Young, K.M.; DeLuca, A.P.; Chrit, F.E.; Tucker, B.A.; Alexeev, A.; McDonald, J.; Benigno, B.B.; Sulchek, T. Label-Free Microfluidic Enrichment of Cancer Cells from Non-Cancer Cells in Ascites. Sci Rep 2021, 11, 18032. [Google Scholar] [CrossRef] [PubMed]
- Mehta, P.; Rahman, Z.; ten Dijke, P.; Boukany, P.E. Microfluidics Meets 3D Cancer Cell Migration. Trends Cancer 2022, 8, 683–697. [Google Scholar] [CrossRef]
- Nguyen, T.A.; Yin, T.-I.; Reyes, D.; Urban, G.A. Microfluidic Chip with Integrated Electrical Cell-Impedance Sensing for Monitoring Single Cancer Cell Migration in Three-Dimensional Matrixes. Anal Chem 2013, 85, 11068–11076. [Google Scholar] [CrossRef] [PubMed]
- Heinisch, J.J.; Lipke, P.N.; Beaussart, A.; Chatel, S.E.K.; Dupres, V.; Alsteens, D.; Dufrêne, Y.F. Atomic Force Microscopy–Looking at Mechanosensors on the Cell Surface. J Cell Sci 2012. [Google Scholar] [CrossRef]
- Nalwa, H. Singh.; Webster, T.J. Cancer Nanotechnology : Nanomaterials for Cancer Diagnosis and Therapy, 2007. [Google Scholar]
- Payton, O.D.; Picco, L.; Scott, T.B. High-Speed Atomic Force Microscopy for Materials Science. International Materials Reviews 2016, 61, 473–494. [Google Scholar] [CrossRef]
- Zemła, J.; Danilkiewicz, J.; Orzechowska, B.; Pabijan, J.; Seweryn, S.; Lekka, M. Atomic Force Microscopy as a Tool for Assessing the Cellular Elasticity and Adhesiveness to Identify Cancer Cells and Tissues. Semin Cell Dev Biol 2018, 73, 115–124. [Google Scholar] [CrossRef]
- Li, M.; Liu, L.; Xi, N.; Wang, Y.; Dong, Z.; Xiao, X.; Zhang, W. Atomic Force Microscopy Imaging and Mechanical Properties Measurement of Red Blood Cells and Aggressive Cancer Cells. Sci China Life Sci 2012, 55, 968–973. [Google Scholar] [CrossRef] [PubMed]
- Xu, W.; Mezencev, R.; Kim, B.; Wang, L.; McDonald, J.; Sulchek, T. Cell Stiffness Is a Biomarker of the Metastatic Potential of Ovarian Cancer Cells. PLoS One 2012, 7, e46609. [Google Scholar] [CrossRef]
- Najera, J.; Rosenberger, M.R.; Datta, M. Atomic Force Microscopy Methods to Measure Tumor Mechanical Properties. Cancers (Basel) 2023, 15, 3285. [Google Scholar] [CrossRef]
- Li, M.; Xi, N.; Wang, Y.; Liu, L. Atomic Force Microscopy for Revealing Micro/Nanoscale Mechanics in Tumor Metastasis: From Single Cells to Microenvironmental Cues. Acta Pharmacol Sin 2021, 42, 323–339. [Google Scholar] [CrossRef]
- Ramos, J.R.; Pabijan, J.; Garcia, R.; Lekka, M. The Softening of Human Bladder Cancer Cells Happens at an Early Stage of the Malignancy Process. Beilstein Journal of Nanotechnology 2014, 5, 447–457. [Google Scholar] [CrossRef]
- Calzado-Martín, A.; Encinar, M.; Tamayo, J.; Calleja, M.; San Paulo, A. Effect of Actin Organization on the Stiffness of Living Breast Cancer Cells Revealed by Peak-Force Modulation Atomic Force Microscopy. ACS Nano 2016, 10, 3365–3374. [Google Scholar] [CrossRef] [PubMed]
- Haeri, Z.; Shokoufi, M.; Jenab, M.; Janzen, R.; Golnaraghi, F. Electrical Impedance Spectroscopy for Breast Cancer Diagnosis: Clinical Study. Integr Cancer Sci Ther 2016, 3. [Google Scholar] [CrossRef]
- Ojarand, J.; Min, M.; Koel, A. Multichannel Electrical Impedance Spectroscopy Analyzer with Microfluidic Sensors. Sensors 2019, 19, 1891. [Google Scholar] [CrossRef]
- Buscaglia, L.A.; Oliveira, O.N.; Carmo, J.P. Roadmap for Electrical Impedance Spectroscopy for Sensing: A Tutorial. IEEE Sens J 2021, 21, 22246–22257. [Google Scholar] [CrossRef]
- Han, A.; Yang, L.; Frazier, A.B. Quantification of the Heterogeneity in Breast Cancer Cell Lines Using Whole-Cell Impedance Spectroscopy. Clinical Cancer Research 2007, 13, 139–143. [Google Scholar] [CrossRef]
- Younghak Cho; Hyun Soo Kim; Frazier, A. B.; Chen, Z.G.; Dong Moon Shin; Han, A. Whole-Cell Impedance Analysis for Highly and Poorly Metastatic Cancer Cells. Journal of Microelectromechanical Systems 2009, 18, 808–817. [Google Scholar] [CrossRef]
- Crowell, L.; Yakisich, J.; Aufderheide, B.; Adams, T. Electrical Impedance Spectroscopy for Monitoring Chemoresistance of Cancer Cells. Micromachines (Basel) 2020, 11, 832. [Google Scholar] [CrossRef]
- Kalina, T. Reproducibility of Flow Cytometry Through Standardization: Opportunities and Challenges. Cytometry Part A 2020, 97, 137–147. [Google Scholar] [CrossRef] [PubMed]
- Pillay, T.S.; Topcu, D.İ.; Yenice, S. Harnessing AI for Enhanced Evidence-Based Laboratory Medicine (EBLM). Clinica Chimica Acta 2025, 569, 120181. [Google Scholar] [CrossRef] [PubMed]
- Ma, L.; Guo, H.; Zhao, Y.; Liu, Z.; Wang, C.; Bu, J.; Sun, T.; Wei, J. Liquid Biopsy in Cancer: Current Status, Challenges and Future Prospects. Signal Transduct Target Ther 2024, 9, 336. [Google Scholar] [CrossRef] [PubMed]
Figure 1.
–Phase-contrast microscopy images and computational cell segmentation. (A) Image processing and morphological analysis. (i) Instance segmentation is used to extract individual cell masks, from which morphological features such as area, circularity, and aspect ratio are computed (second panel from top). A cell network is then constructed by connecting neighboring cells based on spatial proximity, where each cell is a node and edges represent adjacency (second from bottom). The resulting network can be visualized independently of spatial coordinates as an abstract topology graph (bottom). (ii) Uniform Manifold Approximation and Projection (UMAP) clustering of YM and YMR cell populations based on network-derived morphological features. Subclass distributions reveal distinct phenotypic groupings, highlighting representative single-cell clone (SCC) lineages selected for downstream 3D analysis. Color gradient denotes local cell density, ranging from 0 to 5 × 10⁻⁴ cells/µm2, emphasizing regions of phenotypic enrichment across the projected feature space. Reproduced with permission from[22]. (B) AI-assisted label-free optical imaging for single-cell detection and segmentation. (i) Aligned projection of the adhesion image with blue markers indicating centroids of single-cell segments. Scale bar: 150 µm. (ii) Four segmentation strategies are illustrated for selected cells: red (aligned microscopy segment), green (maximum pixel), blue (cover pixel-based), and yellow (watershed-based). Cellpose predictions (p) are also included. Columns C and D show a challenging region with overlapping MCF-7 cells, highlighting segmentation robustness in complex cases. Scale bars: 50 µm. Reproduced with permission from[25].
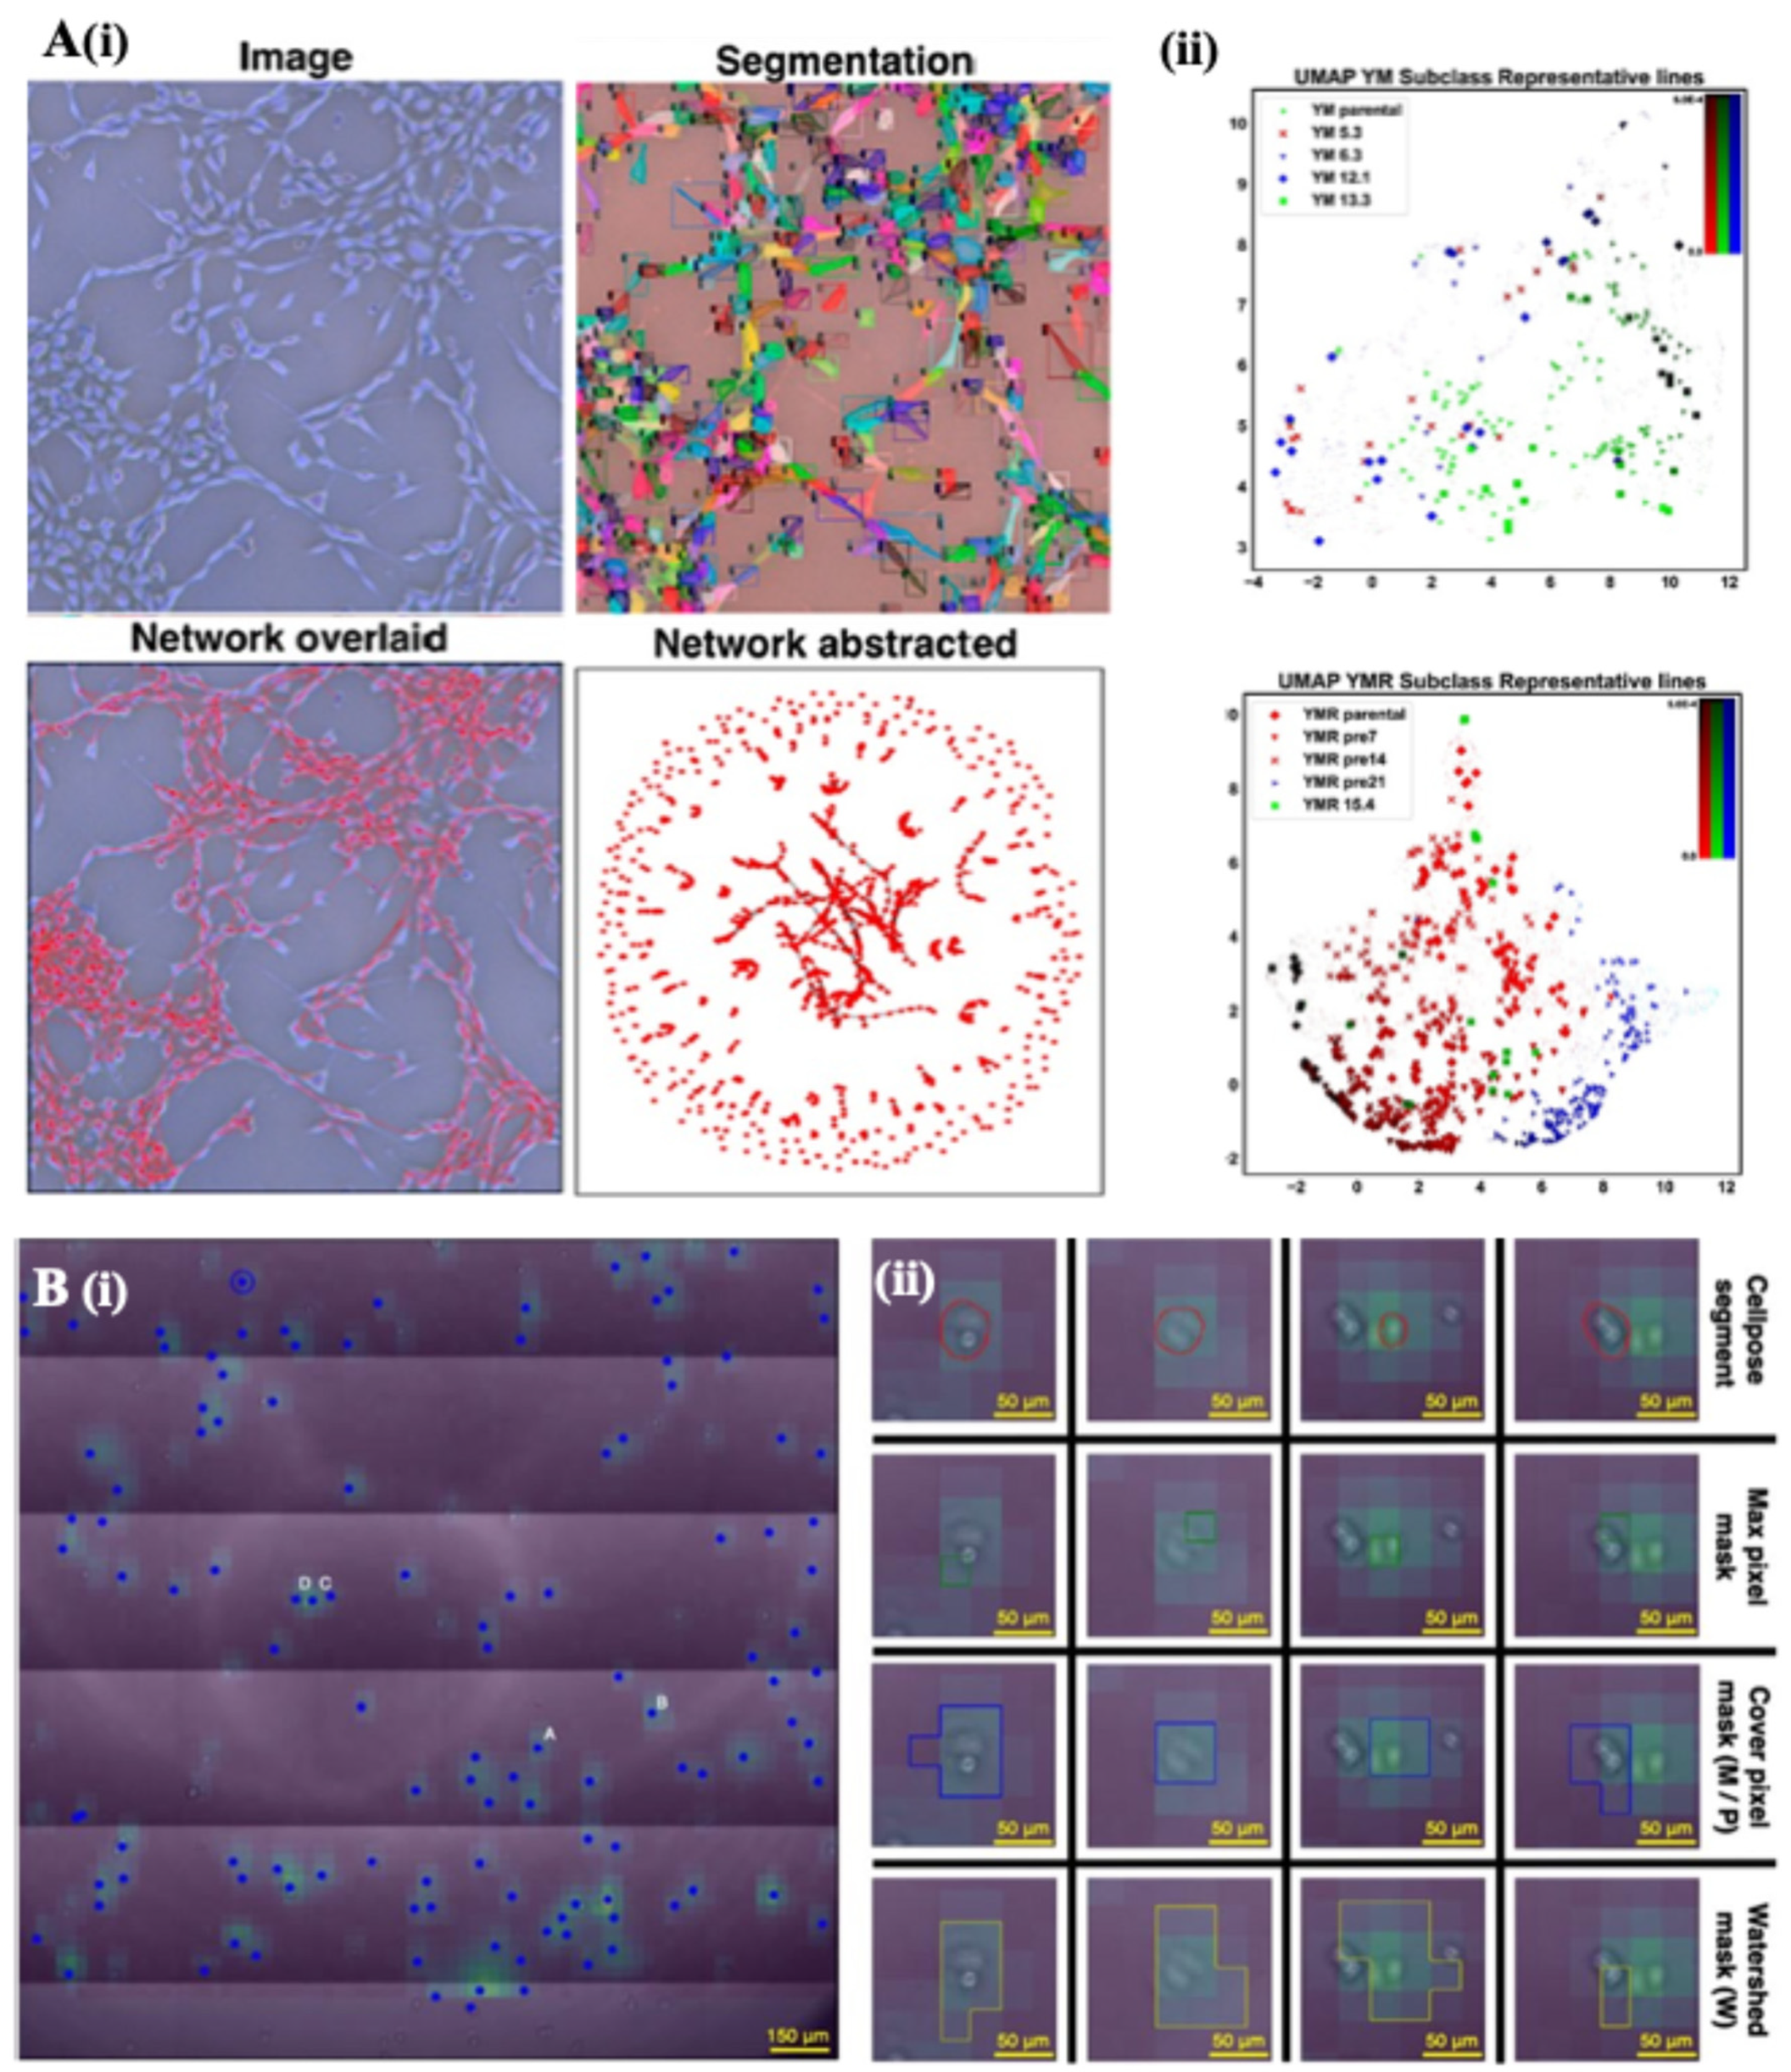
Figure 2.
–Holographic Microscopy-based imaging and analysis. (A) Hologram formation and analysis pipeline. (i) Coherent incident light (light blue) interacts with scattered light from the specimen (dark blue), creating an interference pattern, i.e., the hologram, where the central intensity profile encodes information about the object. (ii) Representative examples of hologram-fitted models, and 3D reconstructions for a single microsphere, a sphere doublet, and a capsule-shaped bacterium. (iii) Hologram analysis enables quantitative extraction of biophysical parameters. Sequential acquisition over time allows tracking of object motion in 3D or monitoring changes in physical properties. Reproduced with permission from [27]; (B) Comparative analysis of invasive and non-invasive HeLa cells. (i–v) 3D holographic cross-sections (50 µm) of individual cells at successive time points: (i) 20 min, (ii) 190 min, (iii) 240 min, (iv) 255 min, and (v) 270 min. Black arrowheads indicate invasive cells; red arrowheads with yellow outlines indicate non-invasive cells. A progressive decline in peak values and an increase in baseline levels suggest cellular infiltration into lacunae. (vi) Quantification of area changes over time, with a decline reflecting invasion progression. Reproduced with permission from [33]. (C) Hematological analysis using optical diffraction tomography (ODT) and a deep learning framework for automated single-cell analysis and classification. (i) Workflow overview of ODT analysis comprising (a) 3D RI tomogram of blood sample; (b) deep learning model and classification into four types: RBC, ARBC, PLT, and WBC; and (c) quantitative analysis based on RI values. (ii) 2D t-SNE plot illustrating the embedding of individual cells based on morphological features extracted from RI data. Cells are color-coded based on model predictions and true labels (RBC vs. ARBC), showing a continuous morphological transition. Representative RI tomographic slices of individual cells along this transition are shown below the plot. (iii) Box plots demonstrate the bias in Mean Corpuscular Volume (MCV) and Mean Corpuscular Hemoglobin (MCH) between conventional Complete Blood Count (CBC) analyzers and the proposed RI-based Quantitative Blood Analyzer (QBA) for RBCs. The RI-based method shows close agreement with standard clinical measurements while providing single-cell resolution. Reproduced with permission, from [44].
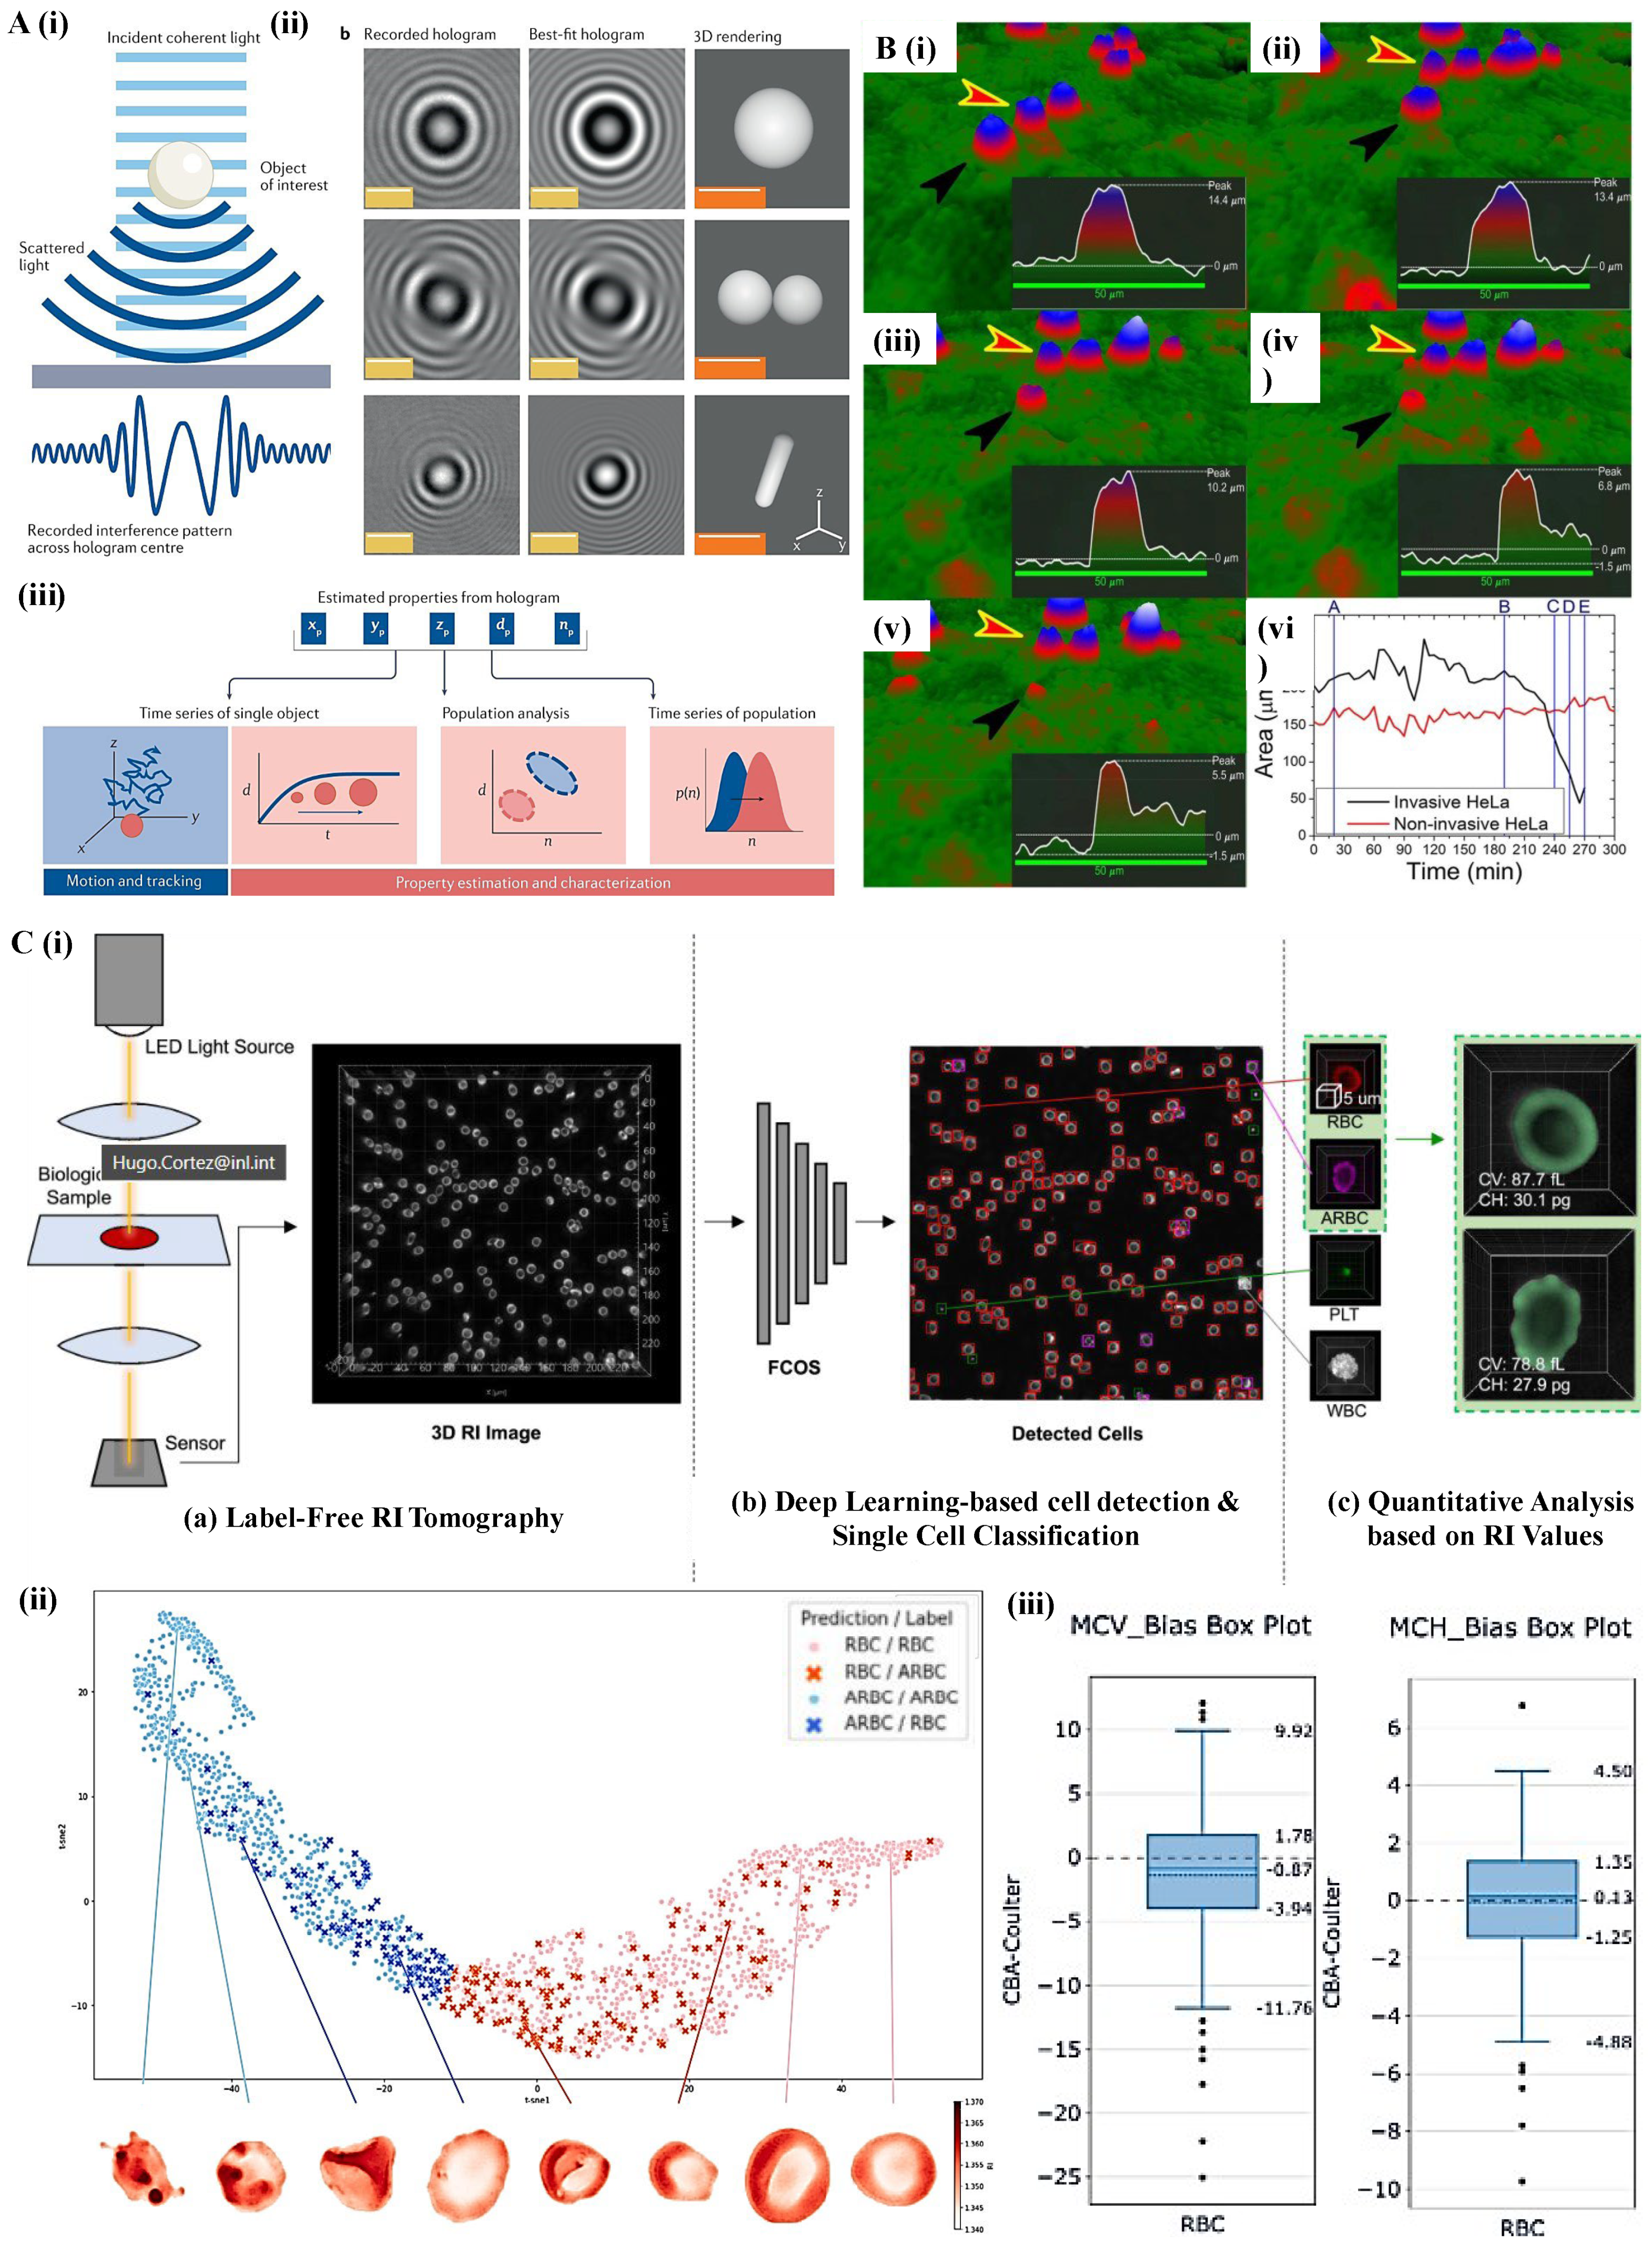
Figure 3.
–Integrated overview of viscoelastic and constriction-based deformability cytometry systems. (A) Schematics of viscoelastic deformability cytometry (i, vDC) device with three functional regions: R1 removes cell aggregates via a micropillar array; R2 aligns cells in parallel microchannels (3 cm, 50 μm × 50 μm) using viscoelastic focusing; R3 deforms cells in narrow constrictions (15 μm × 15 μm × 300 μm). CFD simulation shows wall shear stress (WSS) distribution, and time-lapse images capture cell deformation in R3. Density plots illustrate cell deformability versus size, enabling subtype classification. Reproduced with permission from [49] (B) Constriction-based deformability cytometry (cDC) system integrated with the ATMQcD deep learning framework. (i) Design of microconstriction arrays (10 μm × 30 μm × 60 μm) ensuring uniform velocity; (ii) high-speed imaging and analysis setup; (iii) time-resolved tracking of single-cell deformation. (iv) Quantitative comparison of MCF7 and MDA-MB-231 cells reveals differences in passage time, deformation index, and area-in-constriction, enabling accurate classification of cancer cell types. Reproduced with permission from [50].
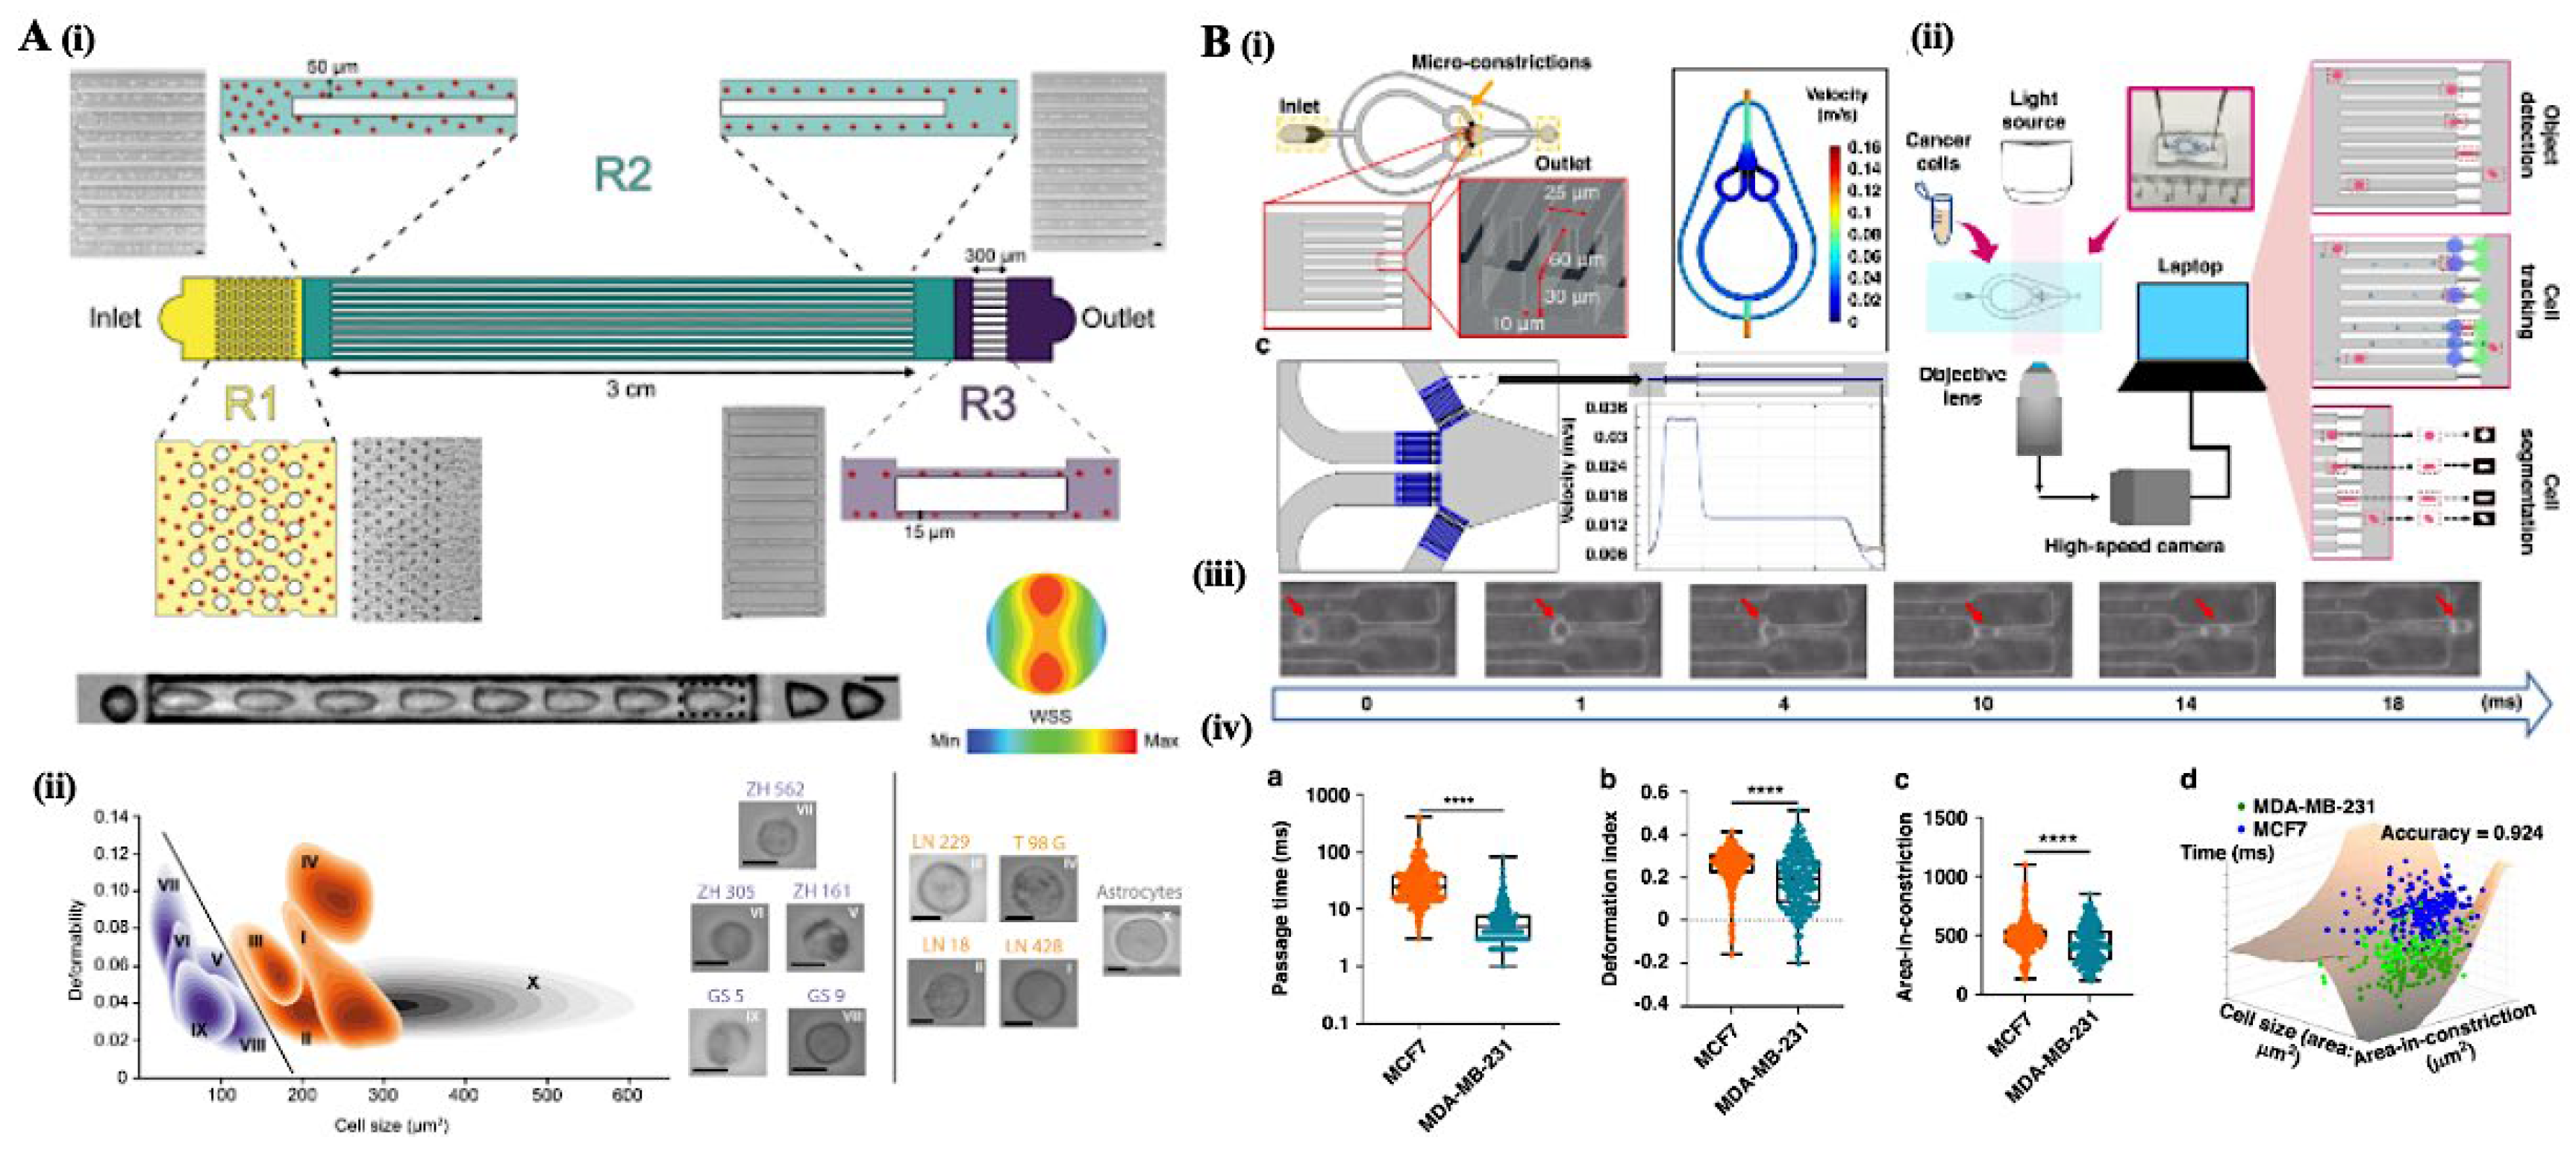
Figure 4.
–Label-free impedance cytometry platforms for assessing cell viability and classifying tumor cell populations. (A) Low-cost impedance cytometry for label-free analysis. (i) Schematic of the double differential impedance cytometry setup using indium tin oxide (ITO) electrodes and PDMS microchannels. The system captures multifrequency impedance signatures (magnitude and phase) as cells flow through the detection zone. (ii) Representative analysis of MCF-7 breast cancer cells showing distinct distributions in electric diameter and opacity between live and dead cells, enabling label-free viability discrimination with high throughput (~1000 cells/s). Reproduced with permission from [52] (B) Multifrequency impedance cytometry with supervised learning to classify pancreatic cancer cells and cancer-associated fibroblasts (CAFs). (i) Workflow: PDAC tumor cells and CAFs derived from patient xenografts are co-cultured and subjected to gemcitabine treatment. Biophysical reprogramming of cancer cells toward drug resistance is assessed. (ii) Impedance phase data at multiple frequencies enables gating of viable versus non-viable cells and comparison across different culture conditions (monoculture vs. co-culture). (iii) Supervised machine learning (SVM) model classifies cancer and CAF populations based on multifrequency impedance data. Scatter plots show predicted class distributions across conditions with increasing drug resistance. Cancer cell prevalence decreases with treatment, while CAFs become dominant in mixed populations. Reproduced with permission of [53].
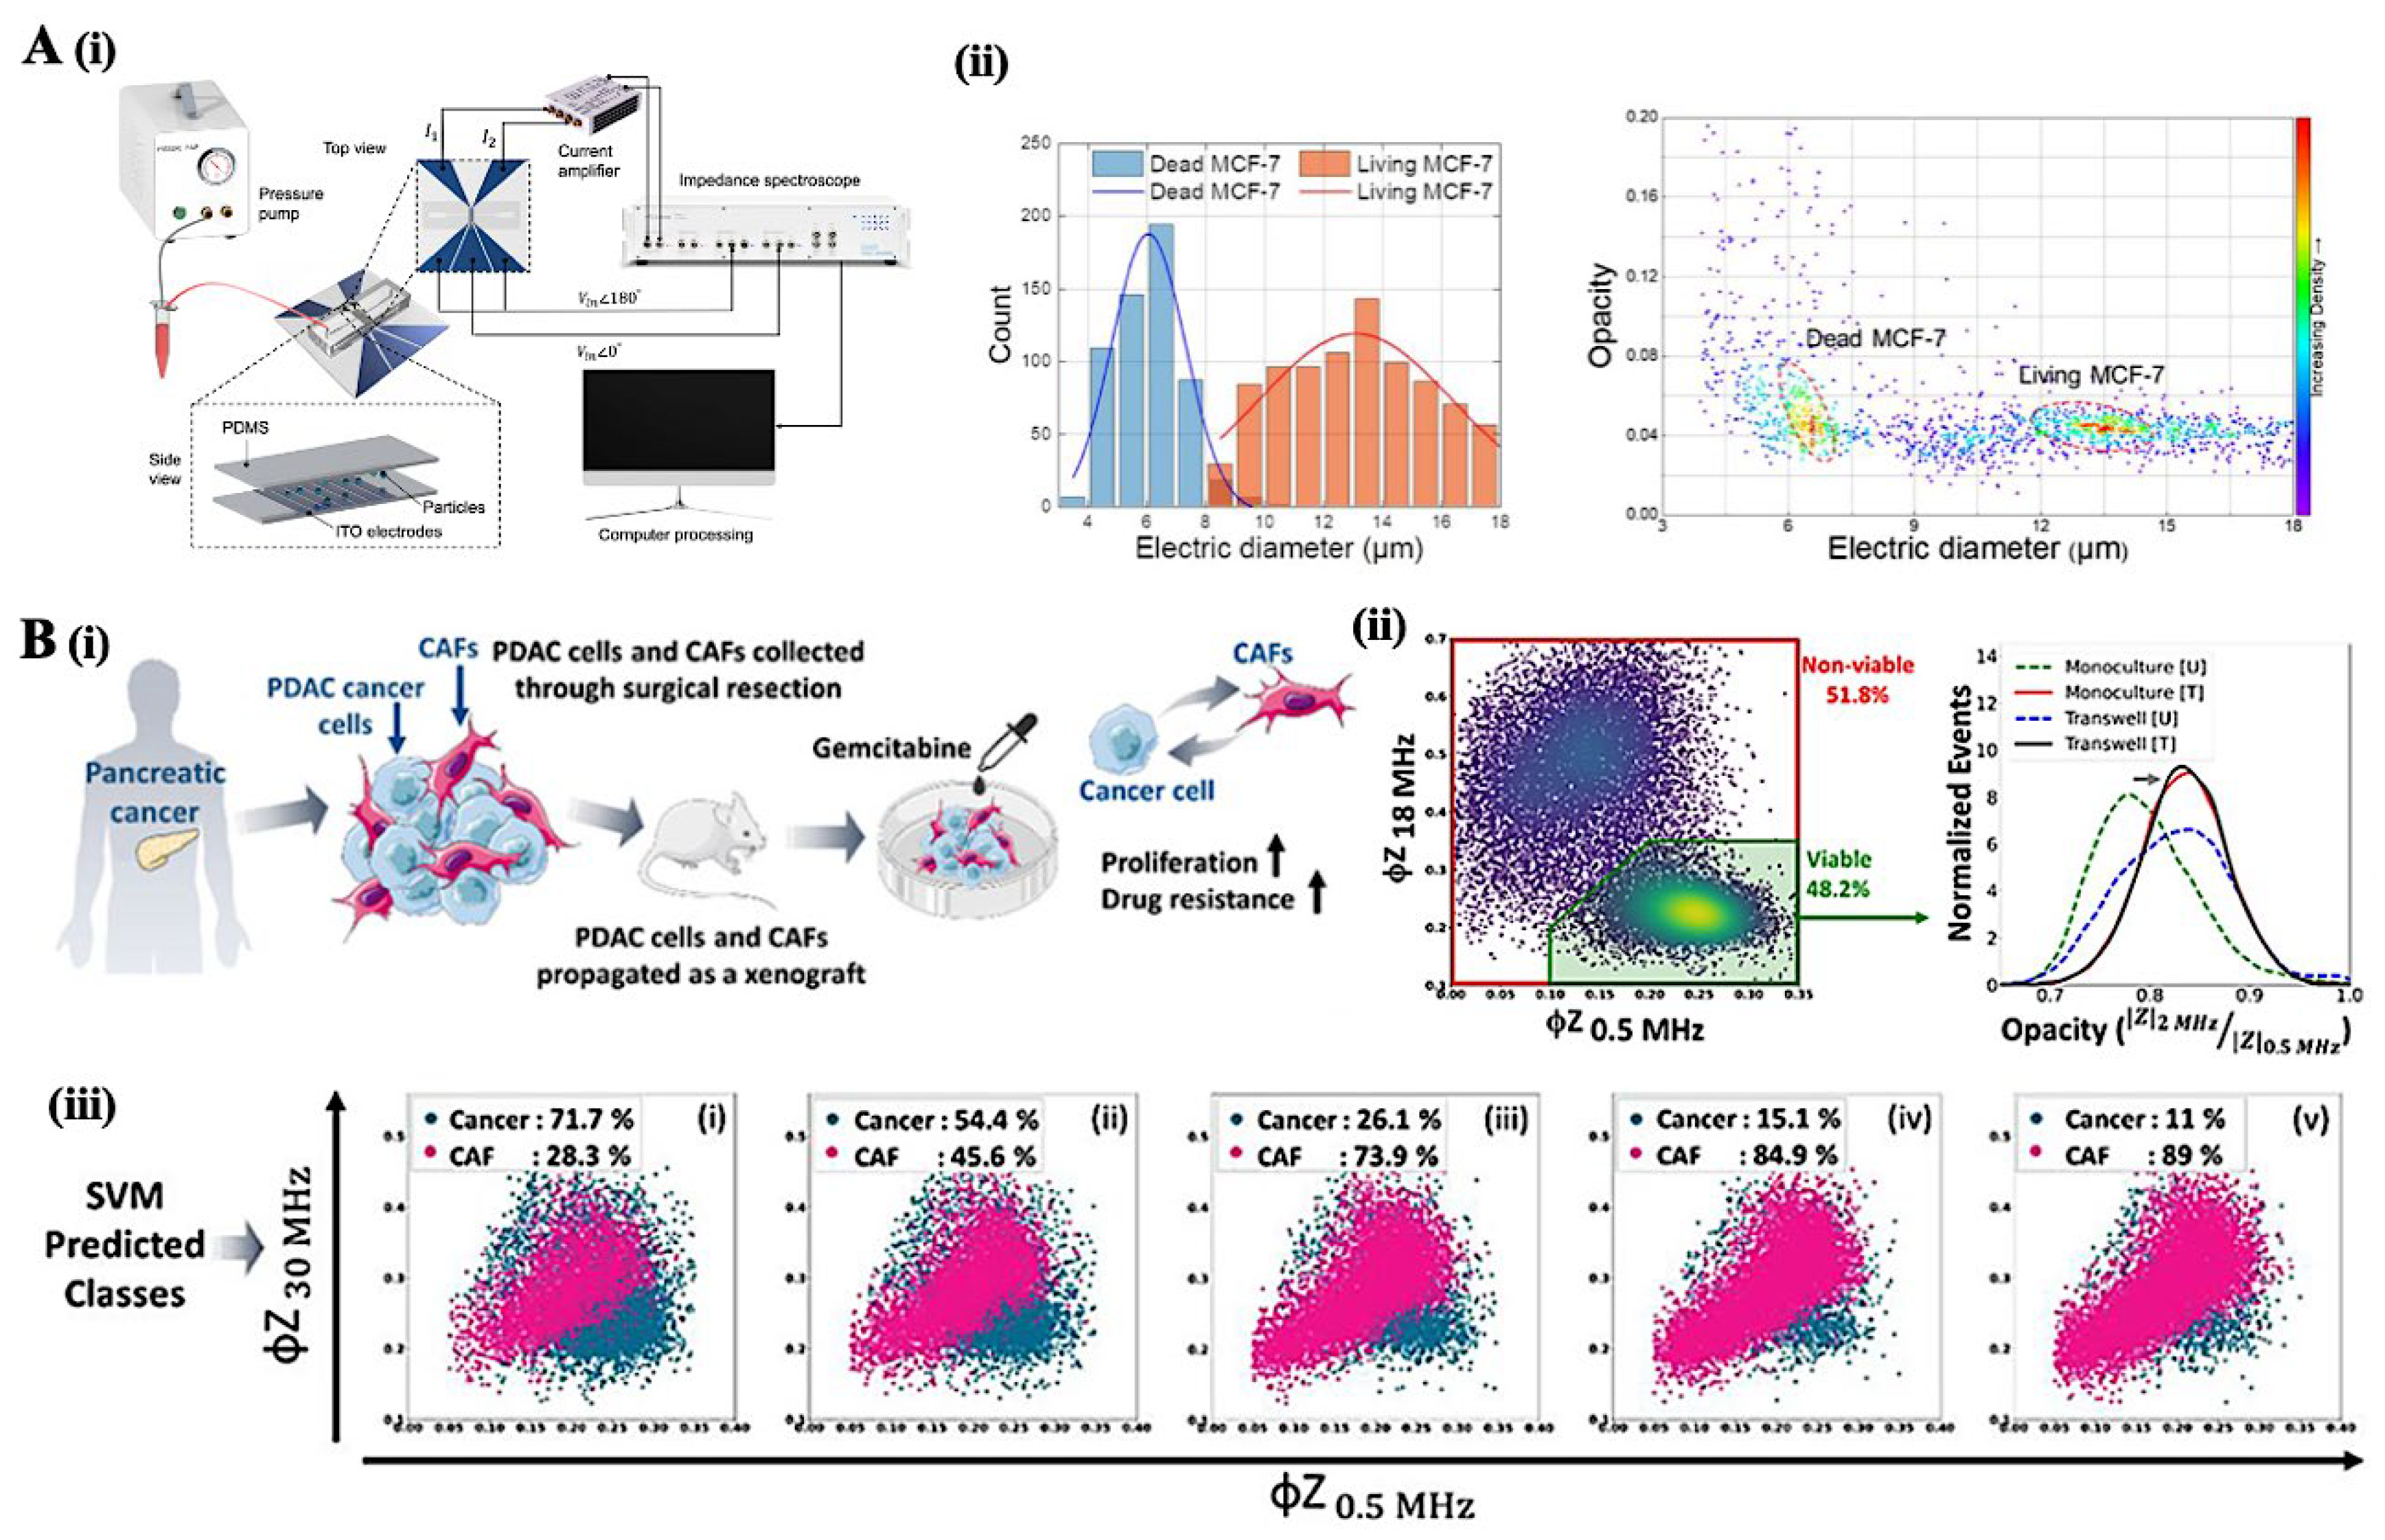
Figure 5.
–Multimodal label-free optical cytometry platforms for biophysical profiling and classification of single cells in cancer diagnostics. (A) Quantitative interferometric imaging flow cytometry for bladder cancer detection. (i) Workflow for single-cell phase image acquisition using interferometric phase microscopy (IPM), followed by deep-learning-based segmentation and feature extraction. Optical path delay (OPD)-based features and morphological descriptors are used for classification. (ii) Representative OPD heatmaps of individual cells from healthy bladder epithelial cells (BdEC), red and white blood cells (RBC, WBC), and multiple bladder cancer cell lines, illustrating differences in biophysical properties like mass and optical thickness. Reproduced with permission of [60]. (B) Deep learning-integrated image cytometry (DLIC) for profiling PBMCs in extranodal NK/T cell lymphoma (ENKTL). (i) Schematic of treatment monitoring: PBMCs are profiled before and after treatment to extract biophysical traits (size, eccentricity, and refractive index, RI). Post-treatment cells exhibit reduced size and heterogeneity, with trends reflecting disease progression. (ii) 3D scatter plots show single-cell distributions of size, eccentricity, and RI in interim (IOT) and end-of-treatment (EOT) stages, revealing reduced cellular heterogeneity and shift toward healthy-like profiles after treatment. Reproduced with permission of [61].
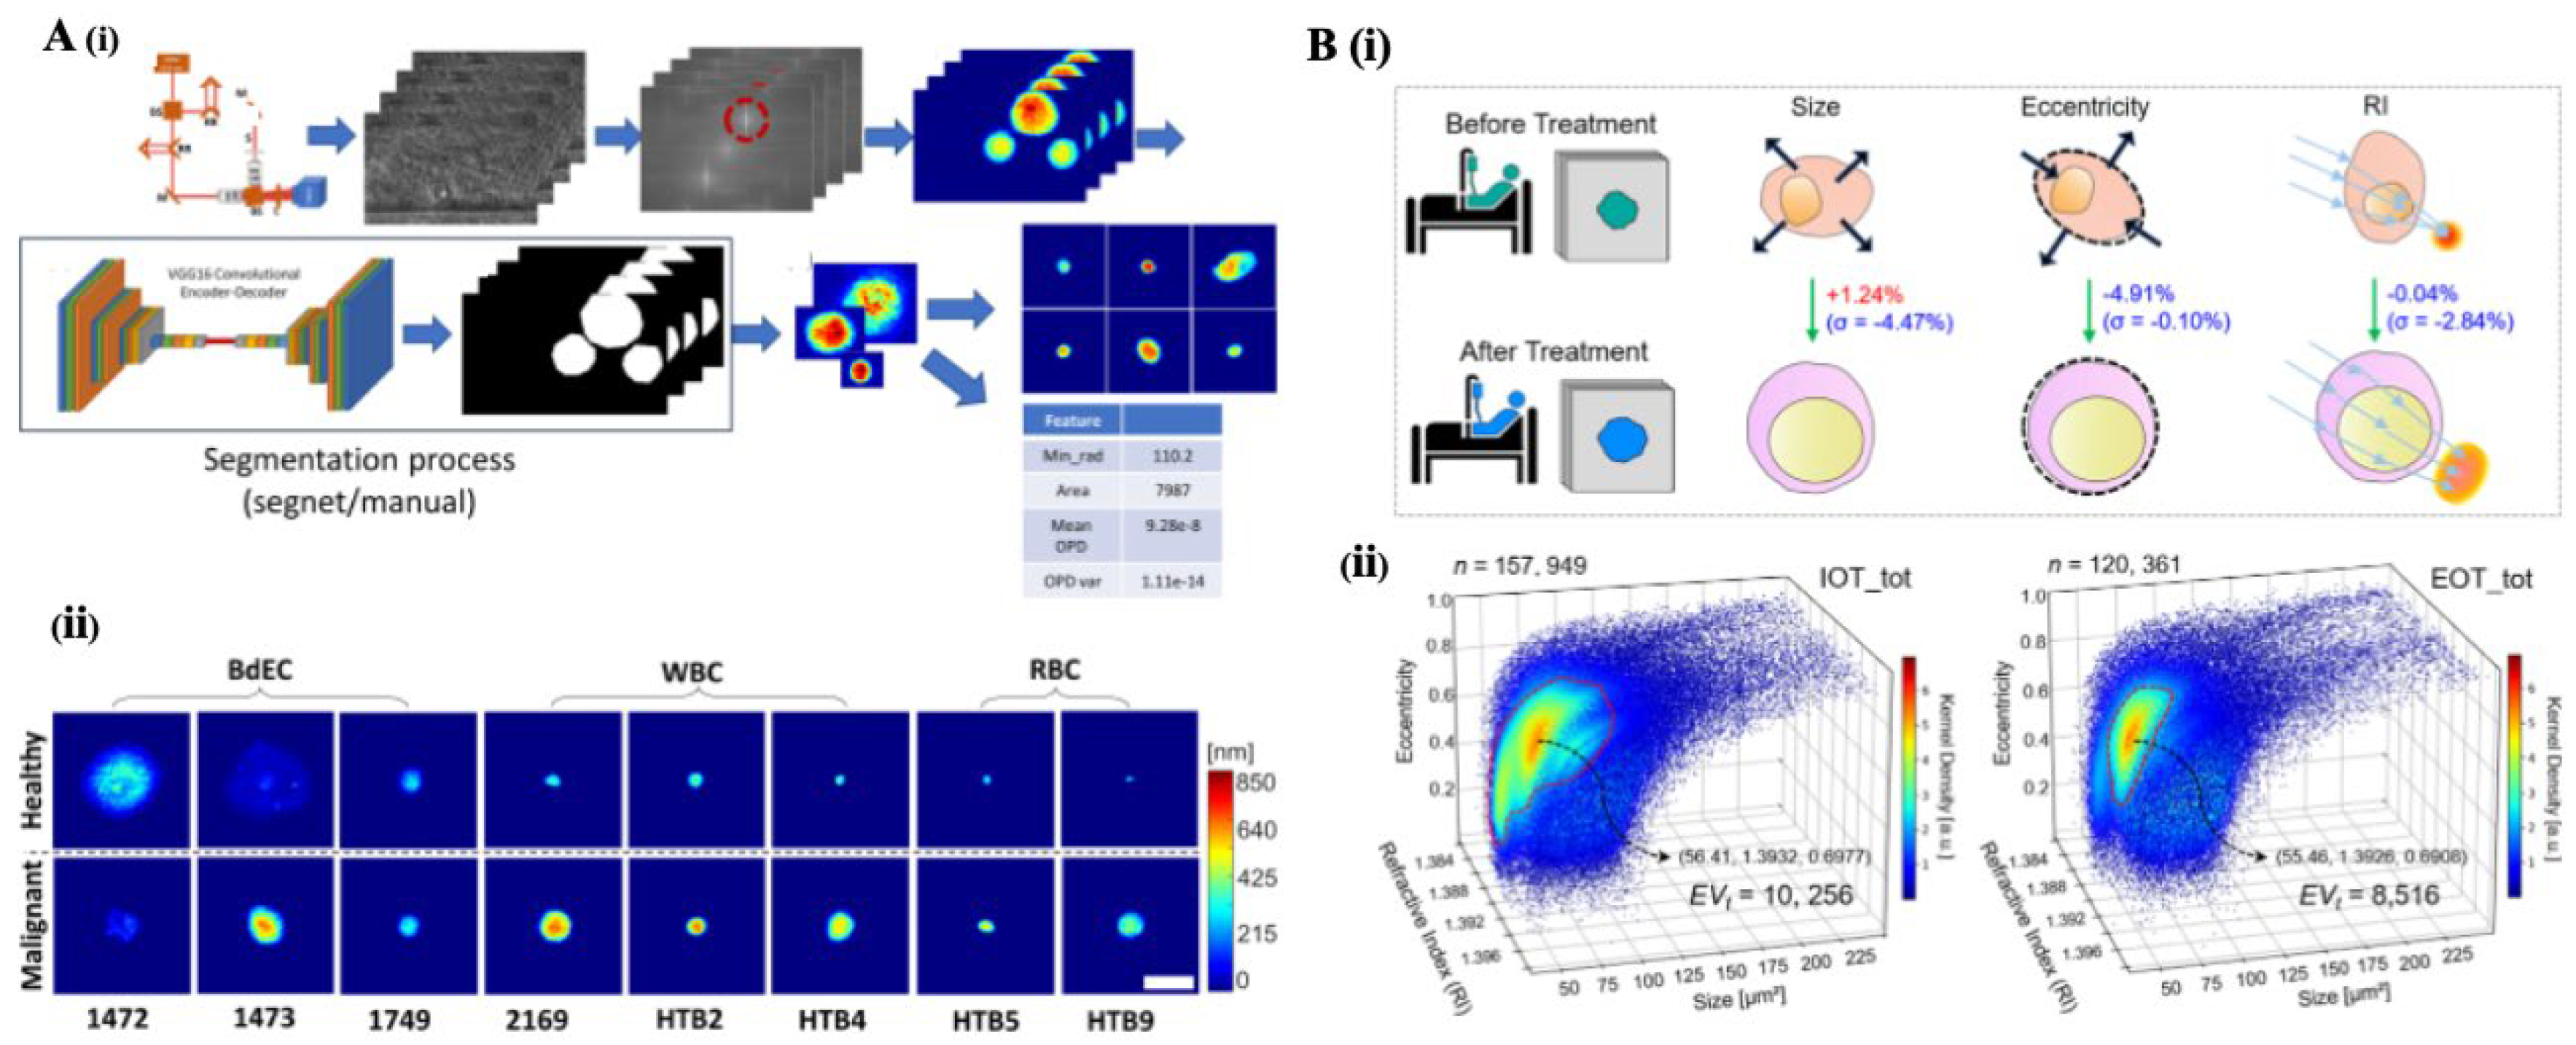
Figure 6.
–Dynamic light scattering (DLS) and zeta potential analyses. (A) Zeta potential (ζ-potential) values of different mammalian cells and bacteria. (i) Suspension cells generally exhibit more depolarized ζ-potentials than adherent ones. Cellular activation (e.g., platelets, macrophages) and transformation (e.g., MCF-10A to MCF-7) are associated with ζ-potential depolarization, while differentiation (e.g., iPSCs to neurons) shows the opposite trend. Among bacteria, ζ-potential varies by species and viability, with dead cells displaying distinct values due to altered surface charge. These variations underscore the potential of ζ-potential as a label-free indicator of cell state and identity. Reproduced with permission from[69]. (B) Zeta potential characterization. (i) Influence of zeta potential on two normal cell lines and breast tumor cells in a Na+ solution with an ionic strength of 10−2 M. Tumor cells exhibit the most negative zeta potential, reaching approximately −15 mV at neutral pH, while normal cells range between −20 mV and −25 mV at the same pH. (ii) Zeta potential of normal and tumor cells in the presence of trivalent ions (iron and aluminum) at pH 4 across three ionic strengths. Tumor cells display less negative zeta potential values than normal cells under all conditions, with iron suggesting lower absorption than aluminum in tumor cells. Reproduced with permission from[66]). (C) DLS-based intracellular dynamics. (i) Time-dependent fluctuations in scattered light intensity at the central point of confocal DLS images for MDA-MB-231 and SKBR3 breast cancer cells. (ii) Average autocorrelation functions derived from DLS images for both cell types. Experimental data points are shown as blue (MDA-MB-231) and red (SKBR3) dots. The slower decay in SKBR3 cells indicates reduced motion of intracellular scattering particles. Reproduced with permission from[64].
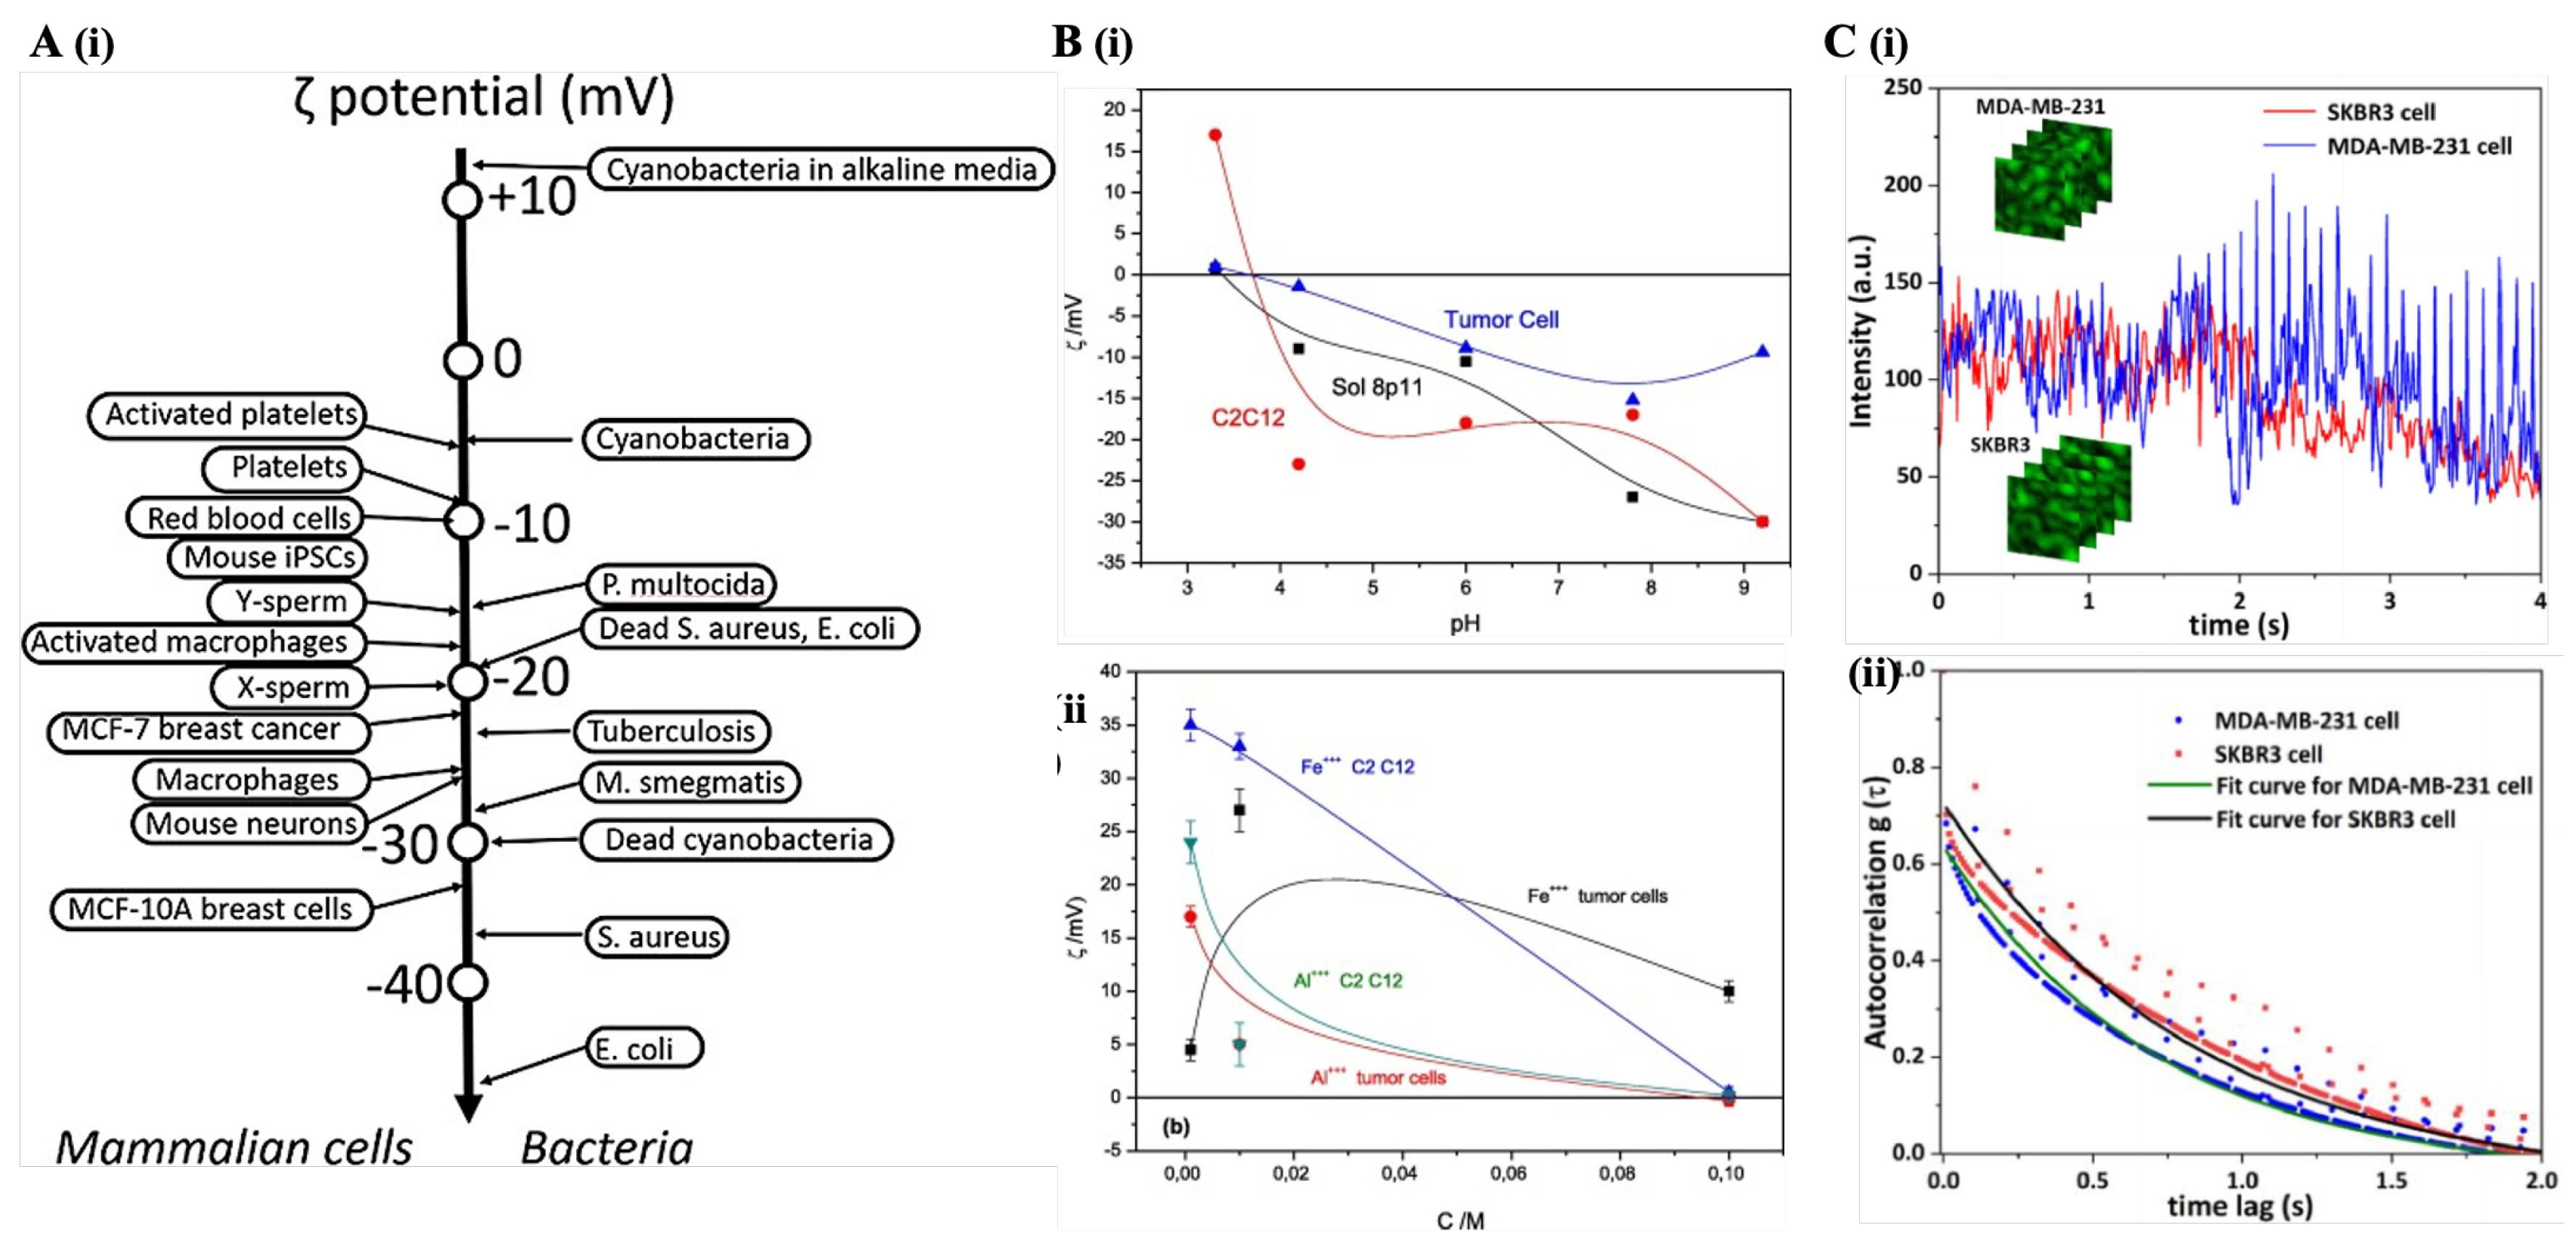
Figure 7.
–Passive microfluidic platforms for cell biophysical separation and enrichment. (A) Size- and affinity-based tumor cluster isolation using a two-layer microfluidic biochip. (i) Top view schematic showing the chip design, including a deterministic lateral displacement (DLD) module in the top layer that isolates large tumor clusters based on size, and a lateral filter section in the bottom layer that captures smaller clusters and individual tumor cells via size and immunoaffinity. (ii) THP-1 cells were effectively washed out, while the number of captured 4T1 cells varied depending on the reverse PBS buffer flow rate, as shown in the accompanying graphs. Qualitative comparison images below demonstrate captured cells before and after purification. Scale bar: 100 µm. Reproduced with permission from [81]. (B) Cell sorting performance in a microfluidic array. (a) Cell size comparison between blood cells and ECA-109 (human esophageal squamous cell carcinoma) cells. (b) Quantification of mean lateral displacement and outlet distribution for RBCs, WBCs, and ECA-109 cells. (c) Outlet distribution comparison between a topology optimized (TO) array (top) and a conventional circular array (bottom), demonstrating improved separation efficiency. Reproduced with permission from[78]. (C) Spiral microfluidic chip for prostate cancer (PCa) cell isolation from urine. (i) Schematic of sample processing through a spiral microchannel, including a magnified view of the bifurcation zone. (ii) At the optimal flow rate of 1.7 mL/min, approximately 85 ± 6% of PCa cells were efficiently collected at the designated outlet. Reproduced with permission from[83]; (D) Application of microfiltration-based CTC isolation. (i) Overview of the microfiltration device used for circulating tumor cell (CTC) isolation from blood. (ii) CTC counts from blood samples of 8 healthy male donors and 8 metastatic prostate cancer patients revealed significantly elevated CTC numbers in the patient group. Reproduced with permission from[86].
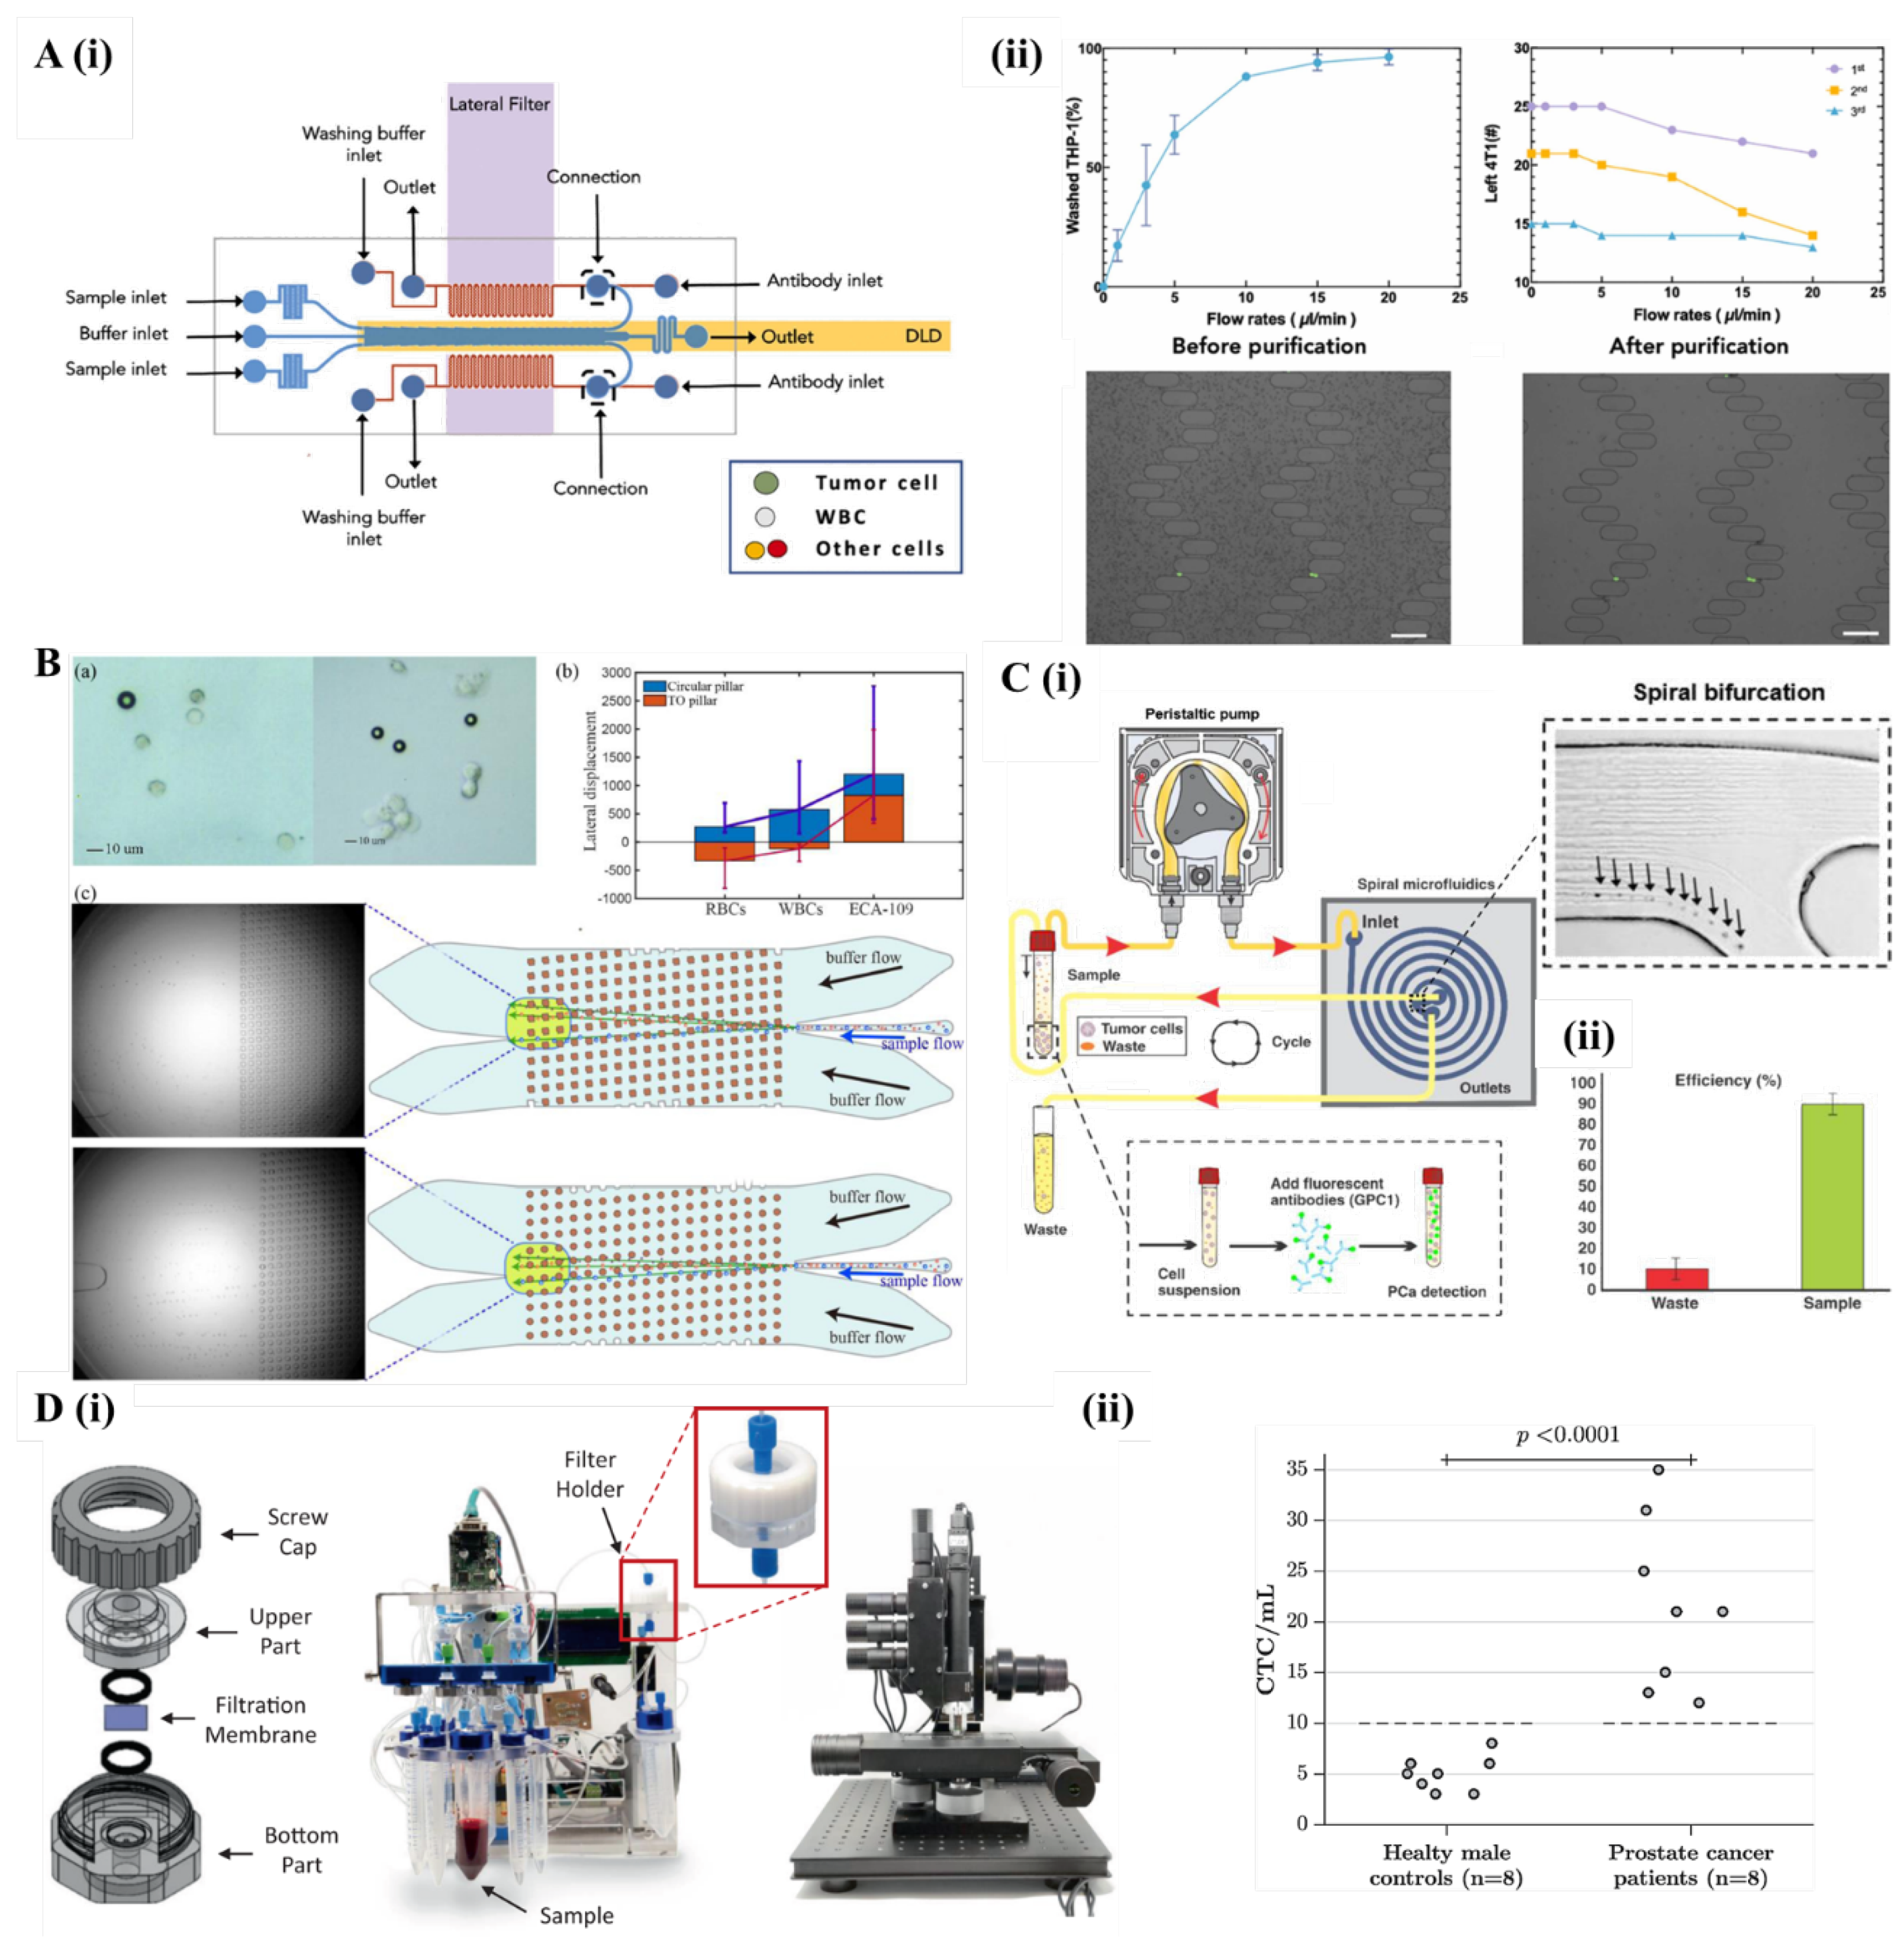
Figure 8.
–Active microfluidic platforms for cell separation using acoustic, magnetic, and electric fields. (A) Acoustophoresis and dielectrophoresis-based cell manipulation. (i) Schematic of the integrated microfluidic device, highlighting the functional zones of the acoustophoresis chip for size-based separation and the dielectrophoresis (DEP) trapping array for cell capture, with key dimensions indicated. (ii) Time-lapse imaging shows the trapping of separated cancer cell clusters (orange) by the DEP array, as indicated by the white arrow. Scale bars: 100 µm. Reproduced with permission from [93]. (B) Ferrofluid-based biocompatible cell separation. (i) Schematic of the microfluidic separation process in which the cell sample, ferrofluid, and buffer are injected without pre-mixing. During operation, cells are only exposed to ferrofluids while being actively separated. Larger cancer cells are deflected into the buffer stream for collection, removing the need for additional washing. (ii) Left: experimental image showing A549 cancer cells (deflected by magnetic fields) reaching the ferrofluid/buffer interface and exiting through outlet 4. Right: fluorescence microscopy image of A549 cells stained with CellTracker Green during sorting; dashed white lines indicate microchannel boundaries. Scale bars: 200 µm. Reproduced with permission from[96]. (C) Dielectrophoresis-based CTC isolation. (i) Design of a microfluidic chip incorporating a facing-electrode configuration (FEC-DEP) for dielectrophoretic separation of circulating tumor cells (CTCs) from blood. (ii) Graph illustrating the influence of the velocity ratio between the buffer and sample inlets on overall separation efficiency. Reproduced with permission from[102].
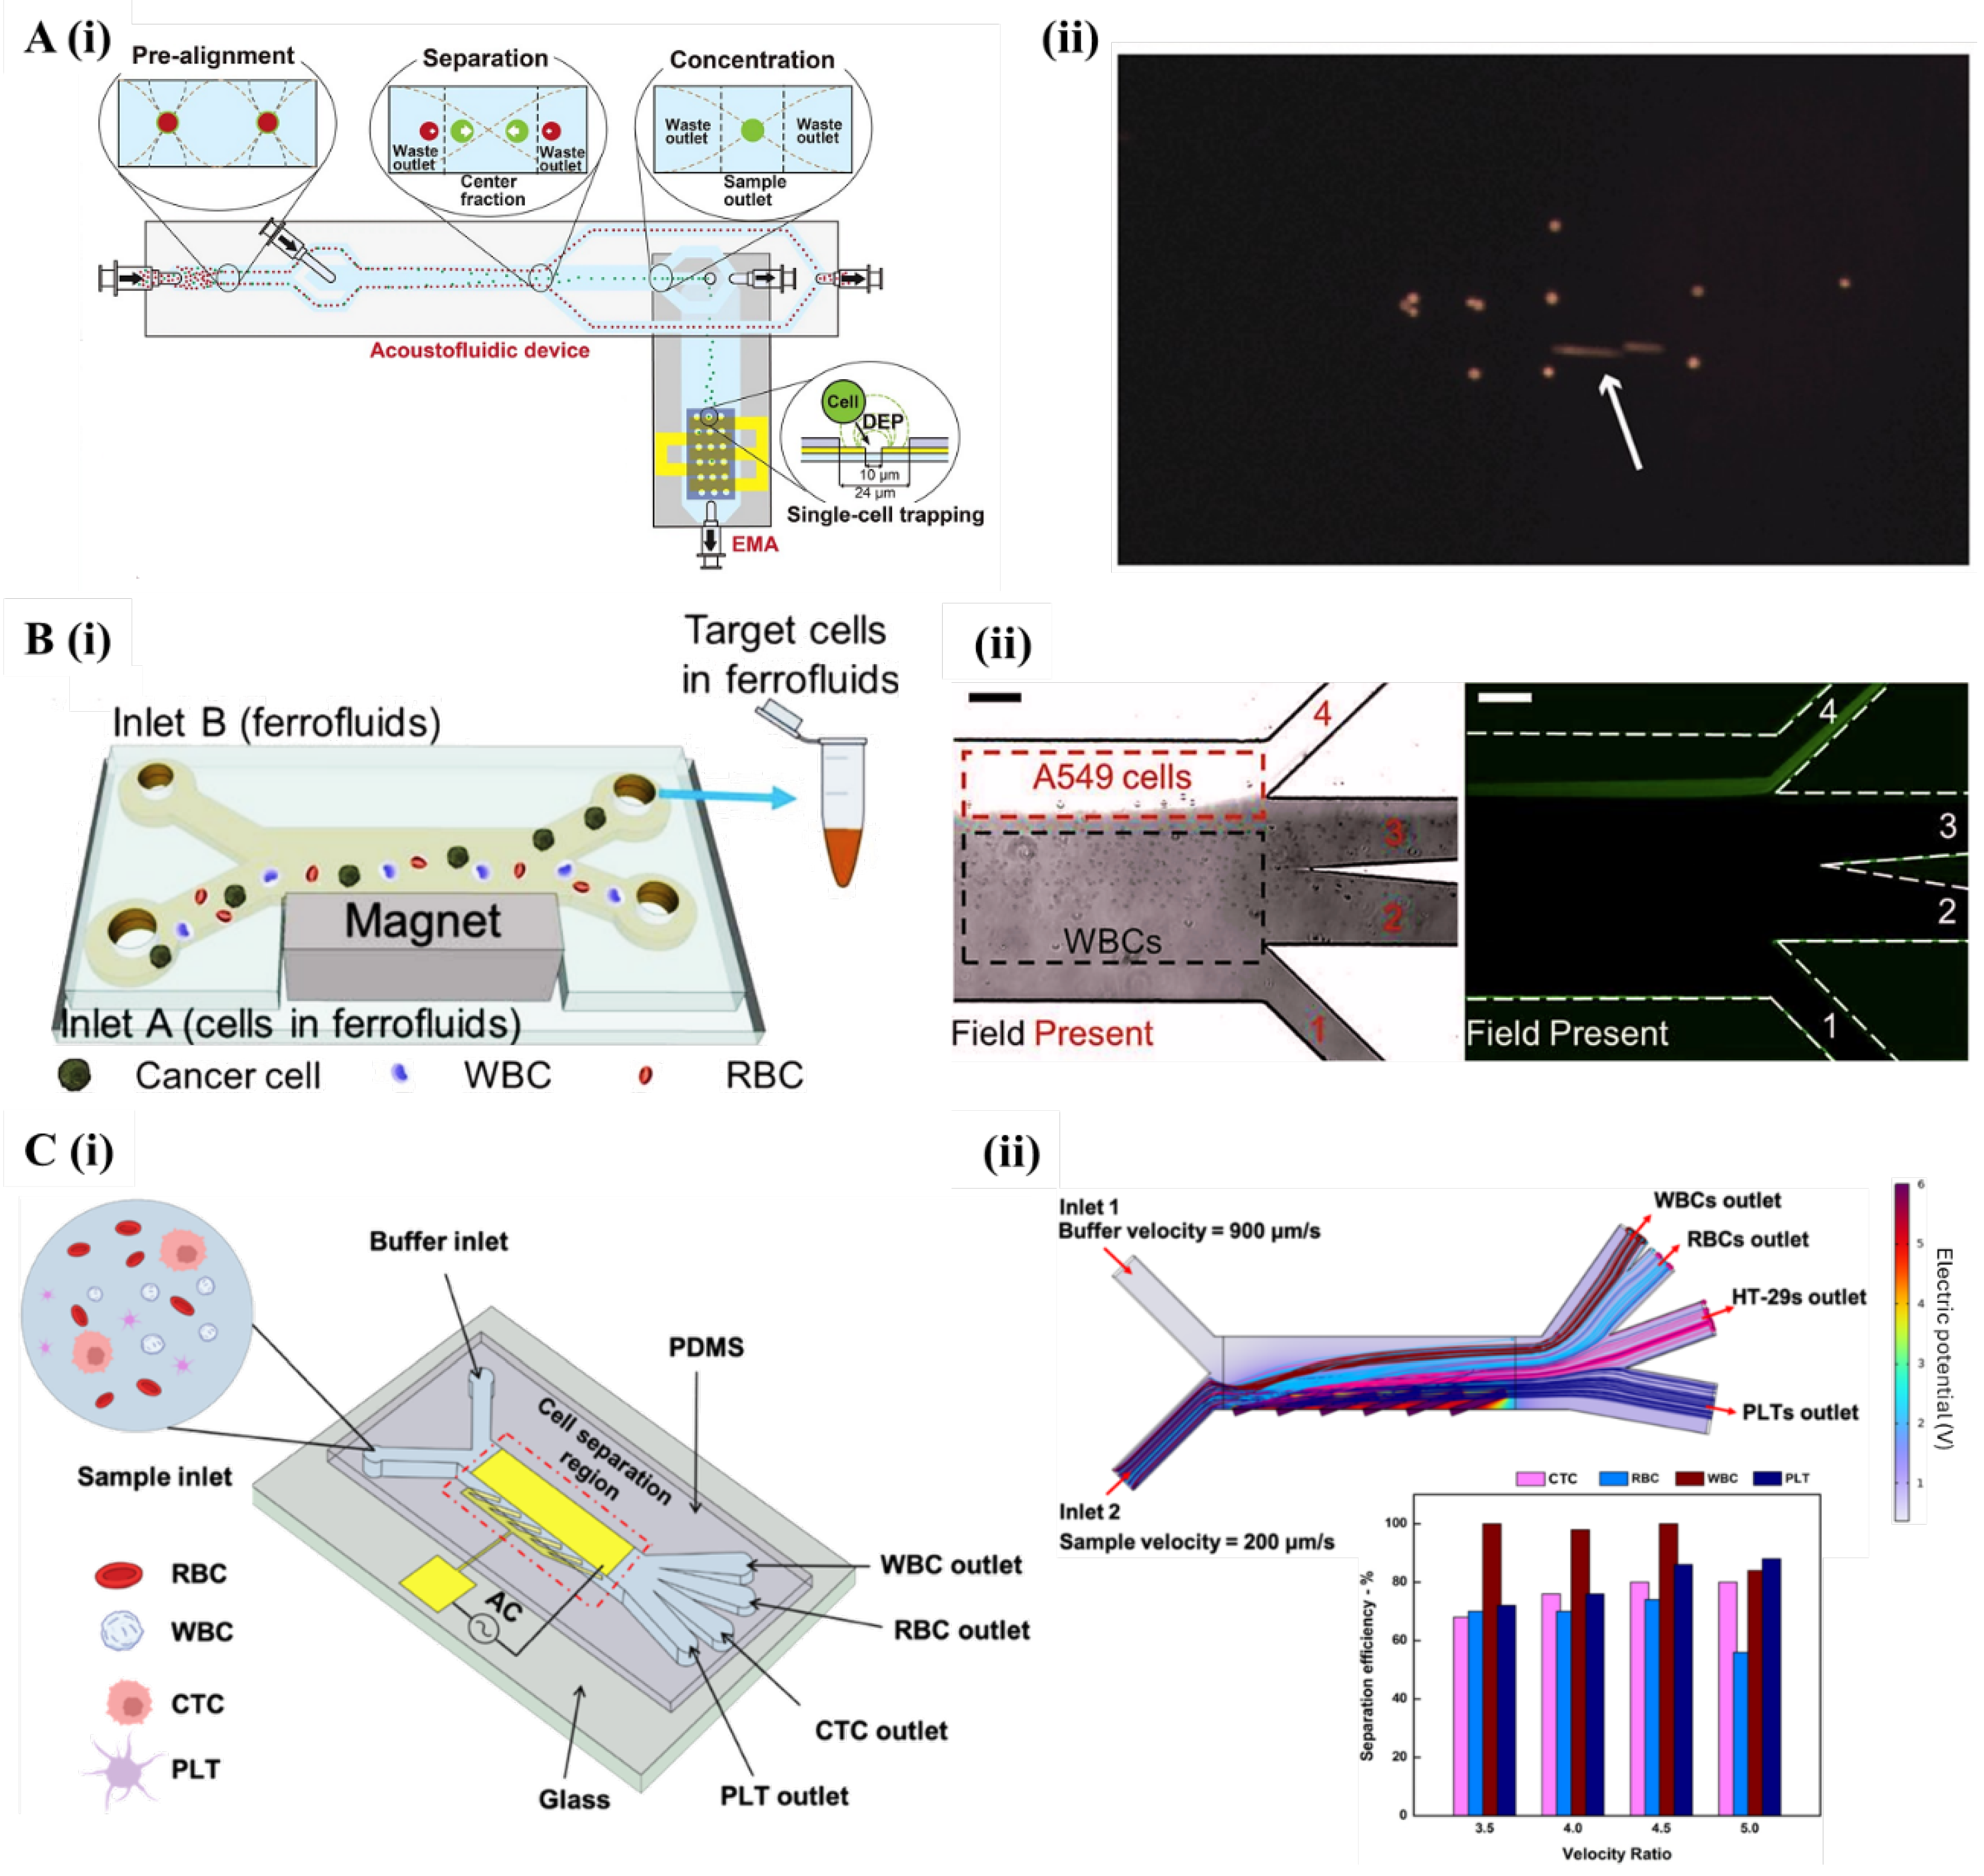
Figure 9.
–Trajectory-based cancer cell enrichment microfluidic platform. (A) The device uses three inlets and five outlets to sort cells. Sheath flow focuses cells to the ridge edge, where angled constrictions force them to deform. Stiff, large cells are deflected toward outlets 1–3, while soft, small cells pass under the ridges to outlets 4–5 (scale bar = 3 mm). (B) i. Representative movement patterns of a metastatic ovarian cancer cell line (HEY) compared to a non-metastatic line (IOSE); ii. Migration assay comparing the invasiveness of HEY and OVCAR-3 cells; iii. Analysis of cell trajectories across ridges for various ovarian cancer cell lines, showing that cells with lower metastatic potential (IOSE, OVCAR-3) experienced greater deflection than highly metastatic cells (HEY, HEY-A8) (Reproduced, with permission, from [104]).
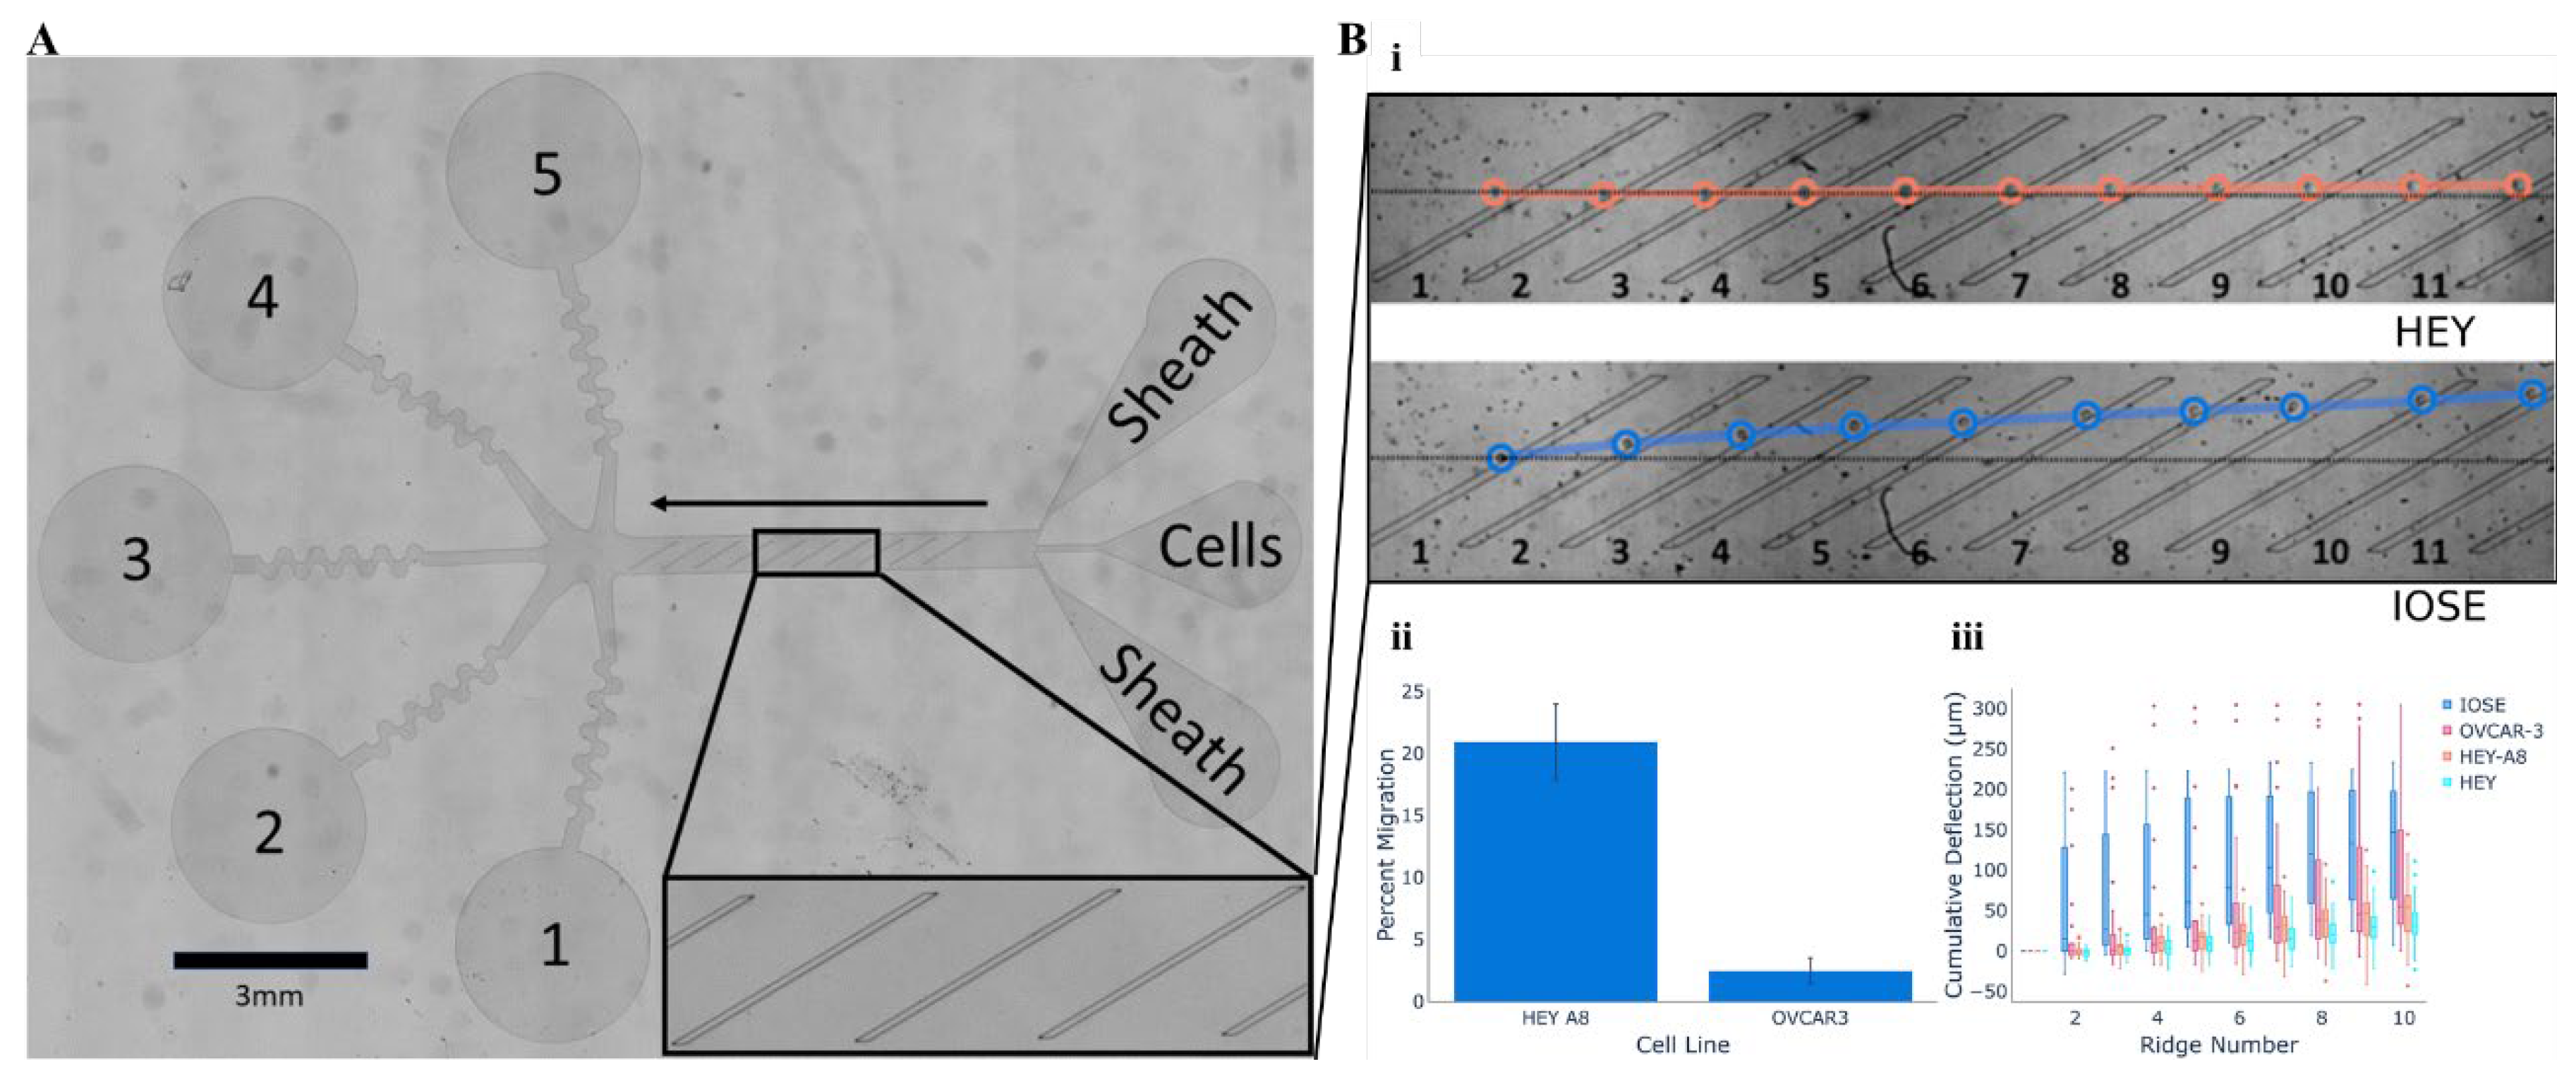
Figure 8.
–Images of electro-mechanical and surface characterization techniques. (A) (i) Scheme of the inverted optical microscope; (ii) Graphical analysis of the elasticity of living bladder cells about indentation depth. Results are expressed as mean ± standard deviation. The elasticity of malignant cells is significantly lower than that of non-malignant cells and, in addition, the indentation depth influences the elasticity measurement; and (iii) Graphical analysis of variation in cell elasticity before and after exposure to cytochalasin D (Cyt-D). Results are expressed as mean ± standard deviation. The treatment resulted in a decrease in Young’s modulus, indicating the predominant influence of actin filaments on the mechanical properties of cells (Reproduced, with permission, from [117] ); (B) (i) High-resolution images showing the distinct contrast patterns observed for each cell line analyzed: MCF-10A (healthy), MCF-7 (cancerous/non-invasive), and MDA-MB-231 (cancerous/invasive). The first column (a, d) of images correspond to healthy cells, while those in the second column (b, e) refer to non-invasive cancer cells, and those in the third column (c, f) to invasive cancer cells. The images in the first row (a, b, c) illustrate the topographic contrast, while those in the second row (d, e, f) highlight the contrast in Young’s modulus. In all cases, the field of view of the images is 25 × 25 μm. The amplitude of topographic variation is 2 μm for MCF-10A, 4 μm for MCF-7 and 6 μm for MDA-MB-231. Images representing Young’s modulus are displayed in logarithmic color scale, covering values between 2.5 and 250 kPa.; and (ii) Comparative analysis of average Young’s modulus values for individual cells obtained by different indentation methods. Low load rate indentations at 1 Hz were used, employing sharp pyramidal tips and large radius spherical tips, in addition to the peak force modulation technique at 250 Hz with sharp pyramidal tips. Each point on the graph corresponds to the average value of the apparent Young’s modulus of a specific cell (Reproduced, with permission, from [118], being B(ii) from supporting information article section).
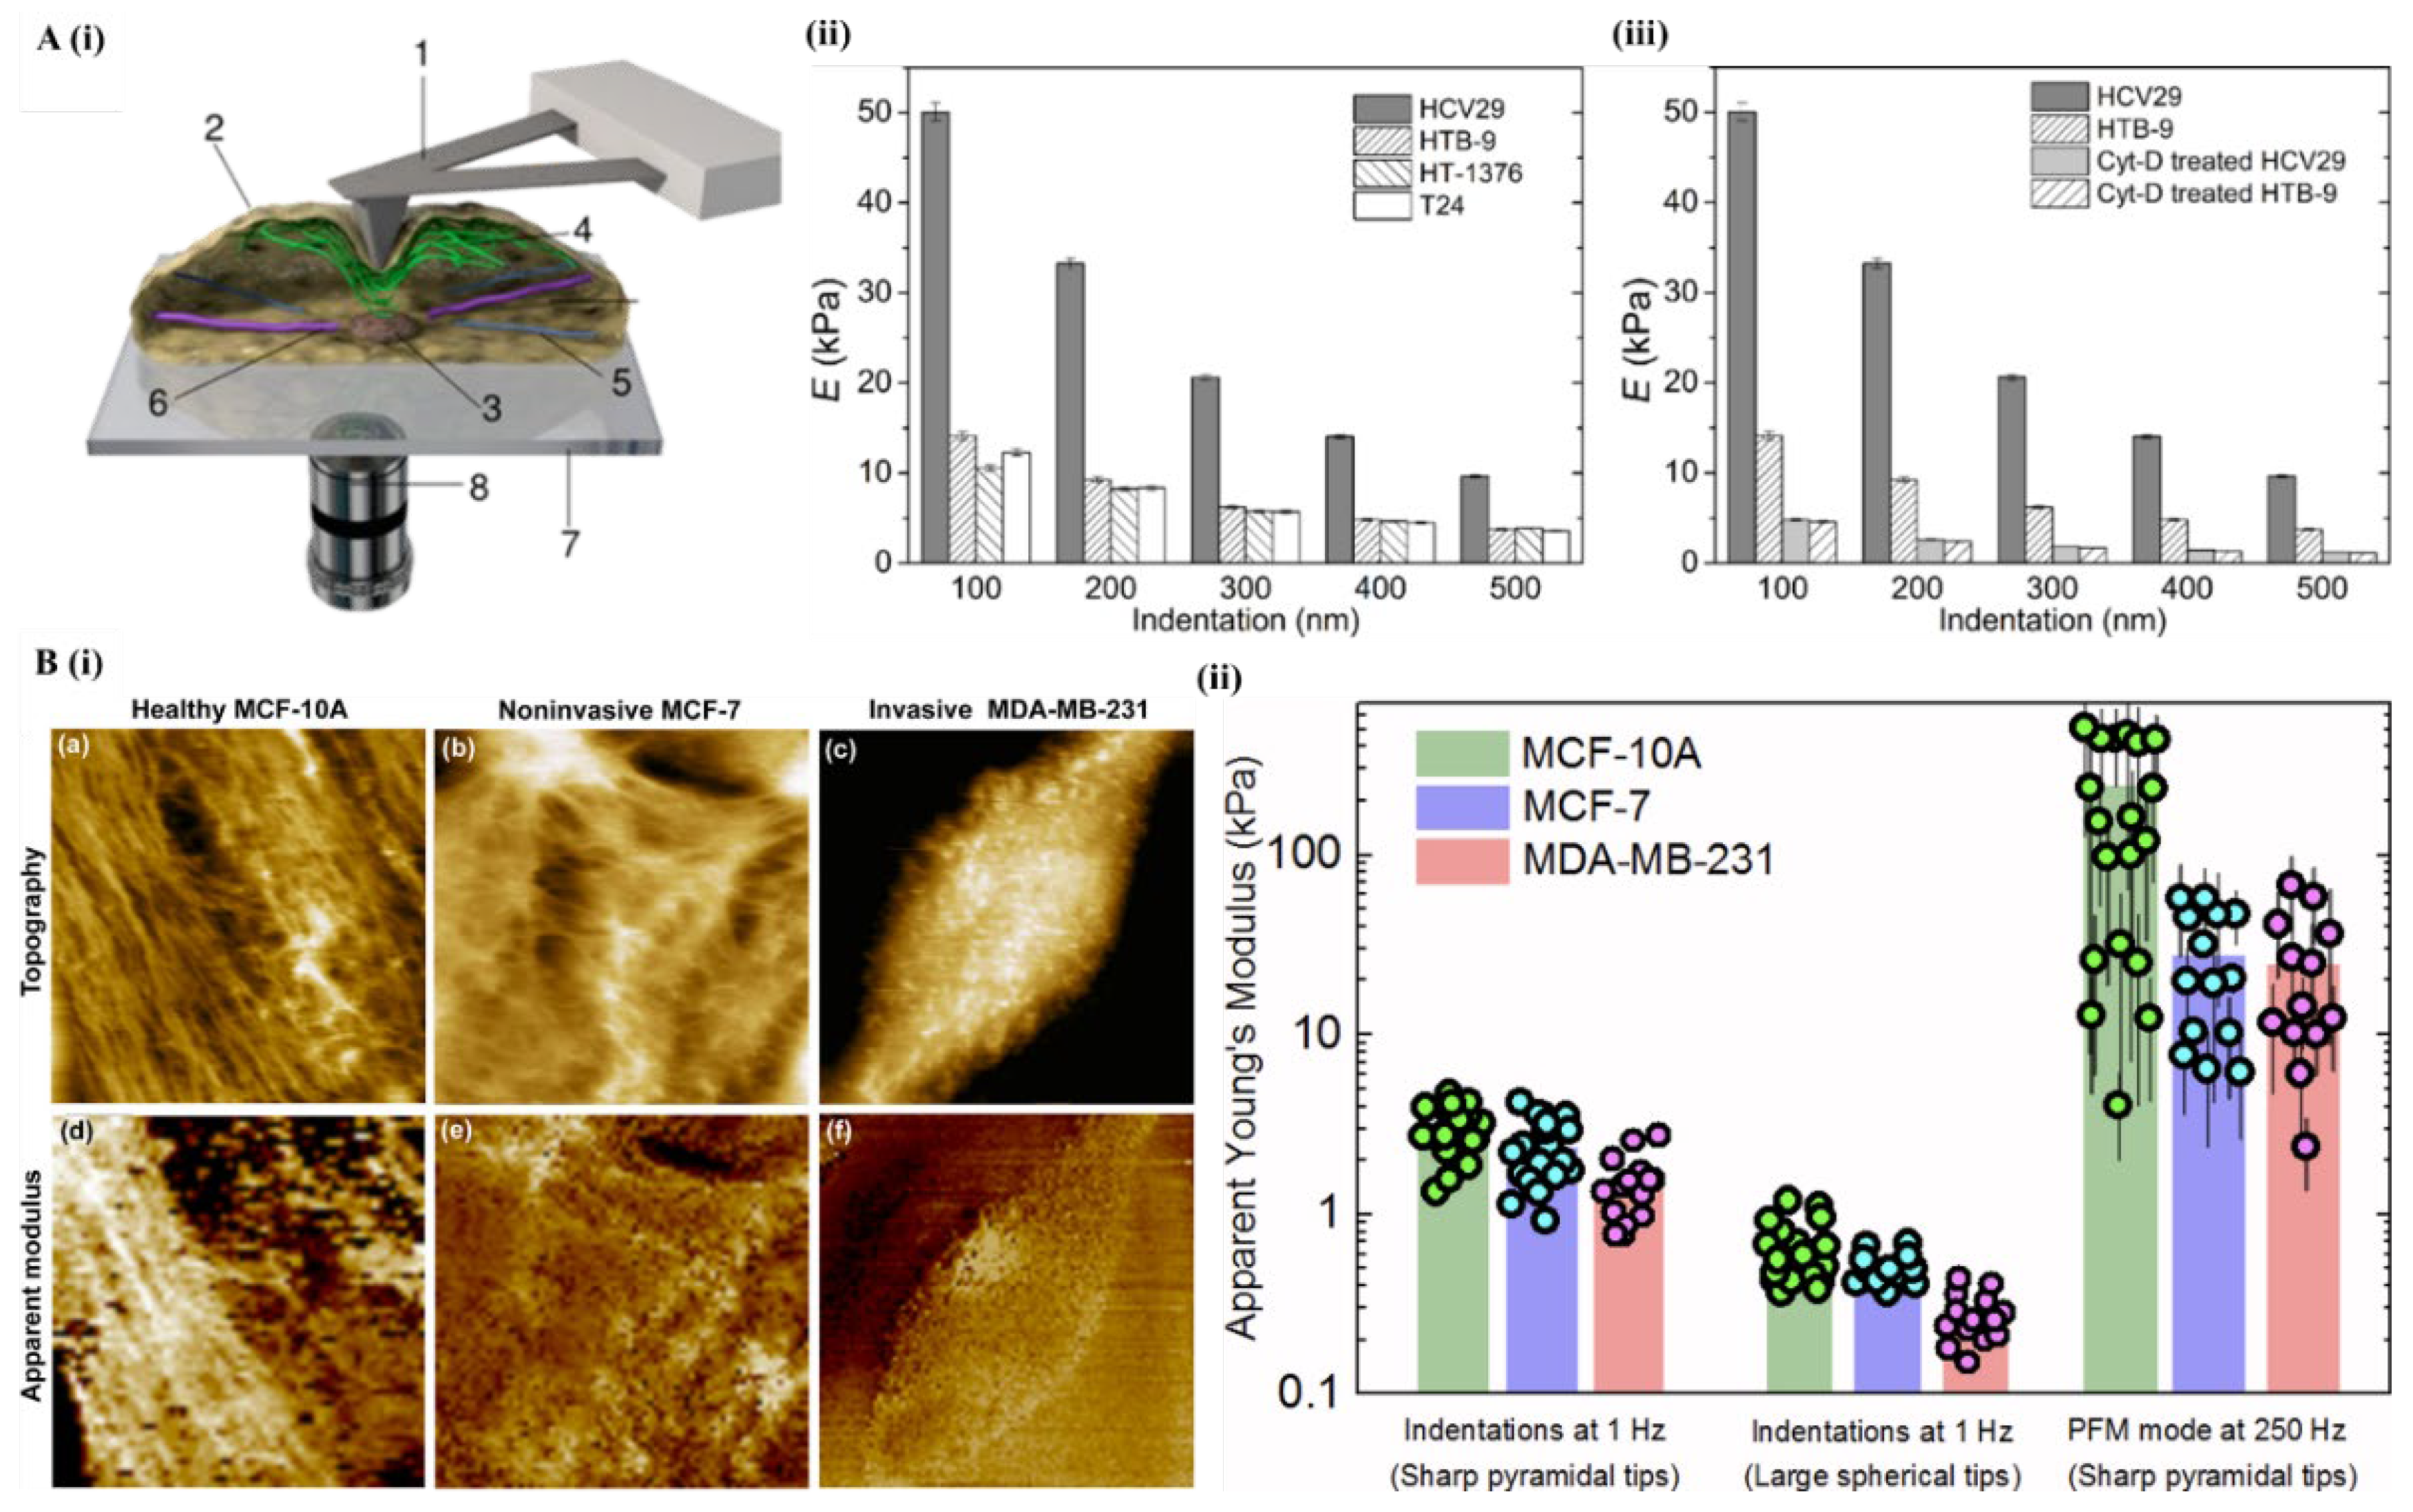
Figure 10.
–Summary of the reviewed techniques, categorizing them by mechanical, electrical, light and morphological phenotypes characterization. The colors used represent the cell type: yellow indicates adherent cells, blue corresponds to cells in suspension, and green represents both. The differentiation of resolution is established by geometric shapes, in which circles correspond to single cells and triangles indicate single cells and subcellular. Furthermore, increased throughput is associated with greater repetition of these symbols, so reduced throughput is represented by a single circle or triangle, while high throughput is indicated by the presence of three circles or triangles (Adapted, with permission, from [47]).
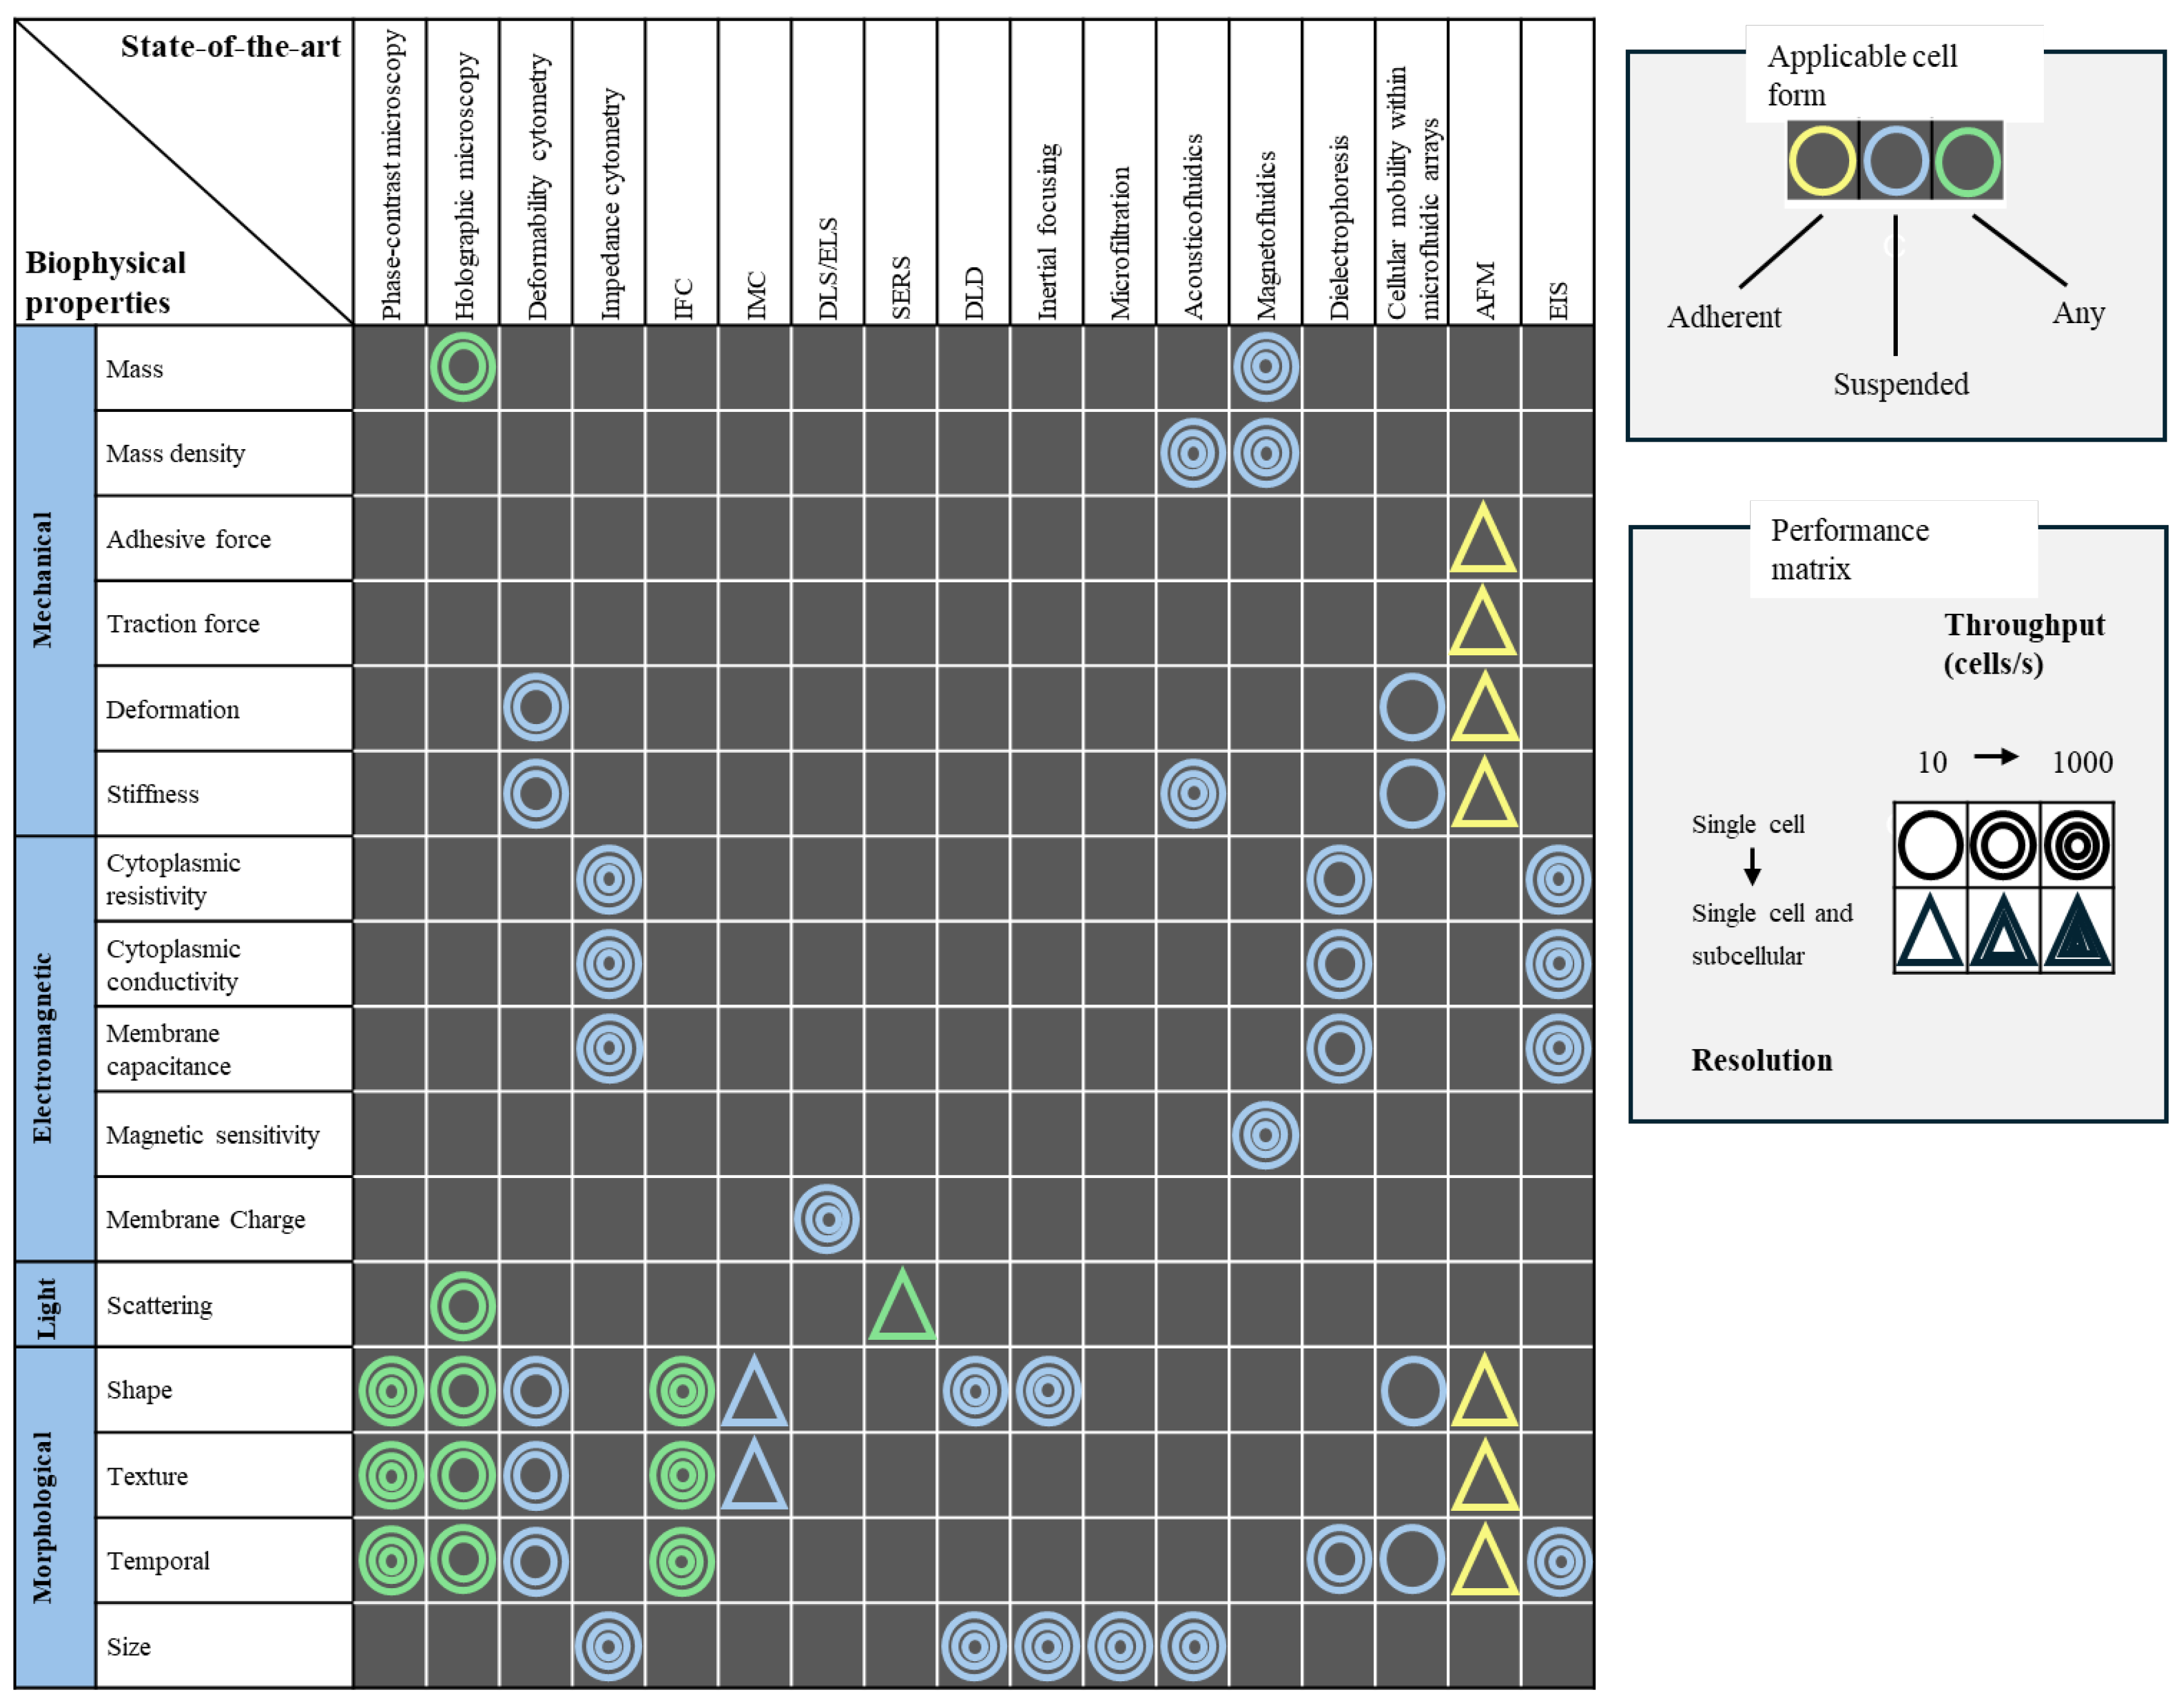
Disclaimer/Publisher’s Note: The statements, opinions and data contained in all publications are solely those of the individual author(s) and contributor(s) and not of MDPI and/or the editor(s). MDPI and/or the editor(s) disclaim responsibility for any injury to people or property resulting from any ideas, methods, instructions or products referred to in the content. |
© 2025 by the authors. Licensee MDPI, Basel, Switzerland. This article is an open access article distributed under the terms and conditions of the Creative Commons Attribution (CC BY) license (https://creativecommons.org/licenses/by/4.0/).
Copyright: This open access article is published under a Creative Commons CC BY 4.0 license, which permit the free download, distribution, and reuse, provided that the author and preprint are cited in any reuse.


