
Submitted:
29 July 2025
Posted:
30 July 2025
You are already at the latest version
Abstract
The adoption of artificial intelligence (AI) and smart technology holds transformative potential in the hospitality sector; however, in emerging markets, uptake remains limited due to structural, organizational, and perceptual barriers. This study evaluates the digital readiness of 1,820 licensed accommodation providers in Albania through a Tri-Lens theoretical framework that integrates the technology-organization-environment (TOE) model, the Technology Acceptance Model (TAM), and Diffusion of Innovations (DOI) theory. A structured, validated survey instrument was used to collect dichotomous and Likert-scale data, which were analyzed using descriptive statistics, exploratory factor analysis, cluster analysis, and structural equation modeling (SEM). The analysis identified two latent readiness constructs: Operational Automation and Environmental Control & Security, both of which are significantly constrained by financial limitations, infrastructural gaps, and insufficient staff preparedness. These readiness dimensions predict the expected benefits across five domains: customer experience, operational efficiency, data security, environmental sustainability, and strategic orientation. Cluster analysis revealed three adopter profiles: Tech Leaders, Budget-Cautious, and Skeptics, each exhibiting distinct patterns of readiness and support requirements. The findings underscore that strategic and organizational preparedness, rather than technological availability alone, determines the extent of inclusive digital transformation. Tailored interventions from policymakers, technology vendors, and educational institutions are essential for addressing these differentiated readiness profiles and fostering sustainable digital innovation in resource-constrained hospitality environments.
Keywords:
AI adoption
; smart technology
; digital readiness
; technology adoption frameworks
; structural equation modeling (SEM)
; TOE model
; TAM
; DOI theory
; hospitality SMEs
; emerging markets
; Albania
; sustainability
1. Introduction
The global hospitality industry is undergoing profound digital transformation, driven by the integration of smart technology and artificial intelligence (AI). These innovations enable automation, real-time optimization, and personalized guest experiences, which are essential for service quality, efficiency, and long term sustainability (Alsharif et al., 2024), (Gursoy et al., 2023), (Kim et al., 2025). Tools such as AI-powered property management systems, keyless entry, automated chat interfaces, and smart energy controls are reshaping operational models across the sector (Wong et al., 2023), (Shin et al., 2025).
However, the diffusion of these technologies is highly variable. In digitally advanced economies, AI and smart technology benefit from supportive ecosystems, robust infrastructure, skilled labor, and digital literacy. By contrast, adoption in emerging markets often lags because of fragmented systems, weak technical capacity, and financial or institutional constraints. These barriers result in an adoption process that is fragmented, short-term oriented, and lacking long term sustainability, particularly among small and medium-sized hospitality enterprises (SMHEs), which constitute the backbone of this sector in many developing countries (Chen et al., 2023), (Ivanov et al., 2022), (Gajić et al., 2024), (Khang et al., 2024).
Albania offers a compelling case for exploring smart and AI readiness within tourism-driven economies. As an emerging Mediterranean destination, the country experienced a 45% increase in accommodation capacity between 2015 and 2023 (INSTAT, 2024), accompanied by policy support for digitalization. However, the majority of SMHEs continue to face barriers ranging from underdeveloped IT infrastructure and limited digital capabilities to cybersecurity concerns and uncertainty over returns on investment. These gaps impede innovation and hinder alignment with sustainability and competitiveness goals (Wong et al., 2023), (Gajić et al., 2024).
Existing research typically explains adoption using isolated models such as the Technology Acceptance Model (TAM) or the technology–organization–environment (TOE) framework (Davis, 1989), (Tornatzky, Louis G. & Fleischer, Mitchell, 1990). Although useful, these frameworks often fail to account for the interplay between cognitive perceptions, organizational capacity, and environmental enablers (Venkatesh & Davis, 2000), (Ifinedo, 2012). Addressing this theoretical limitation, the present study adopts an integrated Tri-Lens Framework that synthesizes the TAM, TOE, and the Diffusion of Innovations (DOI) theory (Rogers, 2003).
The combined framework facilitates a comprehensive analysis of readiness and adoption processes across individual, organizational, and environmental levels. TAM addresses individual-level cognitive and motivational factors, such as perceived usefulness (PU), ease of use, and strategic intent (SI) (Davis, 1989). TOE explains adoption in terms of organizational characteristics, technological fit, and environmental conditions such as policy support and market pressure (Tornatzky, Louis G. & Fleischer, Mitchell, 1990). Additionally, DOI enriches the framework by enabling the segmentation of providers based on innovation behaviors and strategic postures (Rogers, 2003).
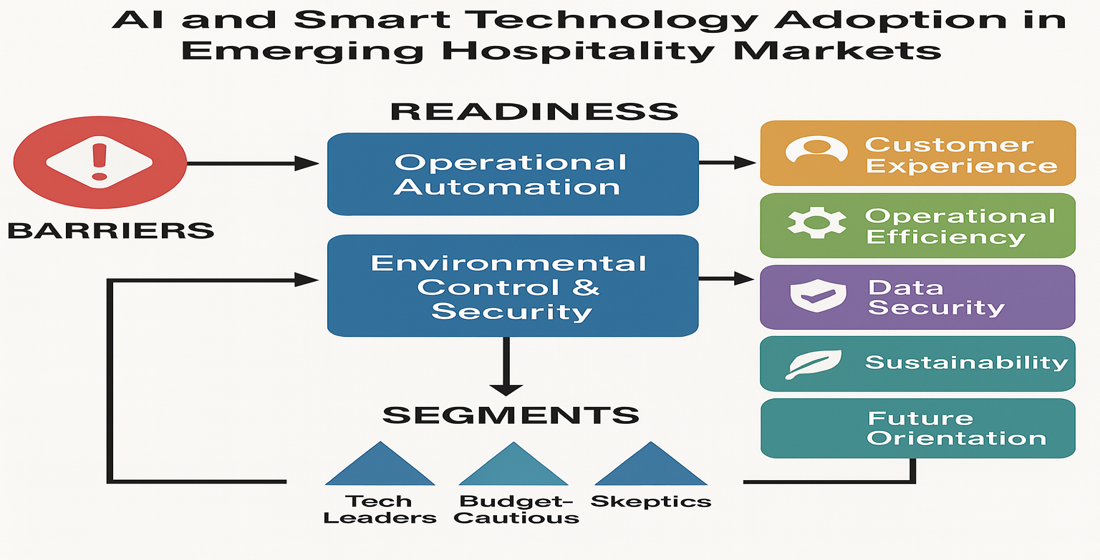
Figure 1 presents the authors’ own visualization of an integrated framework that synthesizes TAM, TOE, and DOI models that align contextual influences with cognitive mediators and adoption outcomes.
To implement this model empirically, we developed a structured and theoretically grounded survey instrument, drawing from validated items across the TAM, TOE, and DOI domains (Davis, 1989), (Tornatzky, Louis G. & Fleischer, Mitchell, 1990), (Rogers, 2003). The questionnaire, available in the Supplementary Materials, included both dichotomous and 5-point Likert-scale items, translated into Albanian, and adapted to the local context. Its reliability was established using Cronbach’s alpha (Nunnally & Bernstein, 20), and its construct validity was confirmed through exploratory factor analysis (Hair, 2023), (Costello & Osborne, n.d.).
In total, 1,820 valid responses were collected from licensed accommodation providers in Albania. This study pursues four interrelated objectives based on a national sample: (i) to map the current levels of adoption of core digital, AI and smart technology, (ii) to identify organizational and contextual barriers influencing adoption readiness, (iii) to segment providers into readiness groups using behavioral and attitudinal indicators, (iv) to apply structural equation modelling (SEM) to analyze the structural relationships among barriers, readiness, intention, and actual usage.
This study contributes to the literature in three ways: First, it offers a robust theoretical framework grounded in cross-disciplinary models. Second, it presents replicable empirical strategies for understanding digital readiness in SMHEs. Third, it provides policy- and practice-relevant insights for inclusive and sustainable digital transformation in emerging hospitality markets.
2. Literature Review
2.1. AI and Smart Technology in Hospitality
The hospitality sector is at the frontier of digital transformation, increasingly shaped by smart systems and artificial intelligence (AI) that extends beyond traditional ICT into integrated, predictive, and autonomous solutions (Ivanov et al., 2022), (Mariani, 2019). These technologies now span back-end functions, such as predictive maintenance, revenue management, and staff scheduling, as well as front-end services, including keyless access, ambient controls, biometric check-ins, and AI-enabled guest communication (Gursoy et al., 2023). Their adoption signifies a shift from static digital infrastructure to adaptive learning systems that reconfigure guest experiences and operations in real-time.
Although AI capabilities in hospitality are advancing rapidly, academic research in this area remains limited in both depth and breadth. A bibliometric review by Peng et al. (Peng et al., 2025) shows that while research activity surged post-2020, it remained narrowly focused on technical affordances or guest-facing innovation, often without critically examining the organizational and systemic dynamics of adoption. This fragmented perspective weakens the field’s ability to explain why technologically promising solutions remain underutilized or fail to scale, especially in resource-constrained settings.
On the demand side, the empirical evidence provides a nuanced picture. Guests appreciate smart features such as automated room environments and mobile check-ins for their efficiency and convenience, yet express ambivalence toward fully “human-less” services, which may lack emotional intelligence, personalization, or cultural sensitivity (Wong et al., 2023). Guest satisfaction is not driven solely by automation but by the seamless, meaningful integration of technology into the hospitality experience, which varies across segments and hotel classes.
On the supply side, providers view AI and smart solutions as levers for operational efficiency, cost control, and workforce optimization. However, adoption remains patchy, especially among small and medium-sized hospitality businesses. Barriers include integration complexity, lack of internal IT capabilities, data privacy concerns, and uncertainty around long term ROI (Ivanov et al., 2022), (Buhalis & Leung, 2018). Crucially, many providers operate reactively, adopting only technologies with proven short-term value and often overlooking the strategic and competitive potential of intelligent systems.
Thus, a more comprehensive framework is needed to explore how technological features intersect with organizational preparedness and environmental pressure, especially in emerging markets.
2.2. Insights from Emerging Hospitality Markets
Emerging markets offer a compelling context for investigating the structural, institutional, and behavioral factors shaping technology adoption. In these settings, tourism often plays an outsized role in economic development, yet providers remain constrained by fragmented infrastructure, informal labor, and limited access to digital capital (Nikopoulou et al., 2023), (Sigala, 2020).
Studies from Serbia, Saudi Arabia, and Vietnam have shown that AI adoption in hospitality is frequently motivated by necessity rather than by strategy. In Serbia, hotels adopt AI for cost efficiency but lack long term planning (Gajić et al., 2024). In Saudi Arabia and other emerging tourism contexts, AI and smart technology integration are often framed as part of a broader smart tourism agenda. However, challenges such as inadequate organizational readiness and limited staff capabilities hinder full-scale implementation (Alsharif et al., 2024). In Vietnam, SMEs limit their investment in tools with clear payback horizons, avoiding advanced systems owing to perceived risk (Trai et al., 2025).
Albania shares several unique characteristics. Despite the growing tourism sector and supportive digitalization policies, smart technology adoption remains uneven and opportunistic. Most providers rely on basic connectivity (e.g., websites and booking engines) but lack integration across front-desk, back-office, and guest service systems. Institutional support exists, but organizational readiness varies widely, especially in rural and family run establishments.
Recent studies have begun to explore the evolving role of digital tools in Albanian tourism. For instance, Muça et al. (Muça et al., 2022) examine how smart technology and e-tourism platforms are gradually influencing service delivery and promotion strategies in the country. Their findings point to emerging practices such as platform-based business solutions (e.g., tel_Business), but also note that these developments are largely promotional rather than operational, with limited attention to strategic or integrated adoption. This underscores the need to move beyond surface-level digital presence toward assessing deeper organizational capabilities.
Prior academic work has largely focused on ICT diffusion or e-tourism platforms (INSTAT 2024), offering limited insight into the multilevel readiness factors and strategic behaviors driving AI-related decisions (Gajić et al., 2024), (Sánchez et al., 2025), (Nikopoulou et al., 2023). There is a need for empirical models that not only document technology presence but also explain how and why providers adopt, delay, or abandon innovation efforts (Kim et al., 2025), (Majid et al., 2023).
2.3. Toward a Tri-Lens Framework: Integrating TOE, TAM, and DOI
Given the complex multilayered nature of AI and smart technology adoption, no single theoretical lens can capture the full scope of influencing factors (Ivanov & Webster, 2020), (Sánchez et al., 2025). This study proposes a Tri-Lens framework that integrates three well-established models to provide a holistic account of readiness, perception, and behavior. Technology Acceptance Model (TAM) explains the cognitive-motivational aspects of adoption, including Perceived Usefulness (PU) and Strategic Intent (SI), which shape behavioral intention (Venkatesh & Davis, 2000), (Nikopoulou et al., 2023). Technology–Organization–Environment (TOE) framework provides the structural and contextual backdrop, highlighting factors such as infrastructure compatibility, resource availability, competitive pressure, and policy alignment (Tornatzky, Louis G. & Fleischer, Mitchell, 1990). Meanwhile, the Diffusion of Innovations (DOI) enables the classification of providers based on adoption timing, strategic posture, and innovation diffusion patterns (Rogers, 2003).
The triangulated model provides a versatile tool for both explaining and analyzing adoption dynamics. It bridges individual-level perception (TAM), firm-level readiness (TOE), and ecosystem-level behavior (DOI), making it well suited for dynamic and under-researched contexts such as Albania.
This study operationalized the framework using a structured instrument mapped to validated constructs. It identifies two key readiness factors, through factor analysis: ML1 (Environmental Control & Data Security) and ML2 (Operational & Staff Automation). It also classifies providers into three adopter segments through cluster analysis: Tech Leaders, Budget-Cautious, and Skeptics, and establish a structural model, using SEM to link perceived barriers, readiness, and adoption outcomes.
This approach generates insights that are relevant to theory, policy, and practice. It highlights the pathways through which technological and contextual factors translate into adoption behavior and offers actionable levers for improving readiness through training, policy incentives, and system integration (Ionescu & Sârbu, 2024). It also informs technology vendors and educators about differential adoption patterns that shape digital transformation in tourism economies (Shin et al., 2025), (Majid et al., 2023).
3. Materials and Methods
3.1. Theoretical Framework and Research Design
This study adopted a tri-lens theoretical framework that integrates three well-established models to examine the adoption of AI and smart technology in Albania’s hospitality sector. TAM (Davis, 1989) addresses individual-level psychological determinants of technology adoption, with a focus on Perceived Usefulness (PU) and Perceived Ease of Use (PEOU). TOE framework (Tornatzky, Louis G. & Fleischer, Mitchell, 1990) considers structural and contextual factors that enable or hinder adoption, including technological infrastructure, staff capabilities, organizational size, and environmental pressures. DOI theory (Rogers, 2003) offers a behavioral lens to classify adopters into categories such as innovators, early adopters, and skeptics, based on their readiness and adoption patterns.
This integrated approach acknowledges the multifaceted nature of innovation decision making, particularly in resource-constrained environments. It is especially well suited for understanding complex adoption dynamics in developing economies and fragmented service sectors, such as hospitality (Ifinedo, 2012), (Majid et al., 2023), (Ivanov & Webster, 2020).
The study addresses three primary research objectives: identifying latent constructs that define organizational readiness for AI and smart technology integration; segmenting accommodation providers based on their current adoption behavior and future intentions; and estimating the structural relationships among barriers, readiness, technology adoption, and perceived benefits using SEM.
3.2. Instrument Development and Operationalization of Constructs
A structured questionnaire was designed based on validated constructs from the TAM, TOE, and DOI models. The instrument was developed in English and translated into Albanian to ensure conceptual and linguistic fidelity (Dillman et al., 2014). It included a mix of item types: 5-point Likert-scale items to measure perceptions and intentions; binary (yes/no) items to assess technology adoption and usage; and categorical questions to capture demographic and organizational characteristics. The full list of questions, codes, and Albanian formulations is available in the Supplementary Materials.
Survey items were mapped to TAM and TOE constructs as follows:

Table 1.
Mapping of TAM Constructs to Survey Items.
| TAM Construct | Survey Items | Description |
|---|---|---|
| Perceived Usefulness (PU) | P44_1, P44_2, P44_3, P48_1 | Belief that technology improves operational efficiency, reduces costs, and enhances the customer experience. |
| Perceived Ease of Use (PEOU) | P34_2, P34_3, P34_5 | Belief that AI and smart technology are easy to understand and use. |
| Attitude Toward Using (ATU) | P35, P36, P37 | Respondents' attitude toward investing in AI technology for personalization, automation, and monitoring. |
| Behavioral Intention (BI) | P40, P48_2, P48_3, P48_5 | Intention to invest in future AI-based technology for service automation and guest experience enhancement. |
| Actual Usage (AU) | P6, P8, P10, P12, P14, P16, P18, P20, P22, P23, P24, P25, P27, P29 | Current use of core systems such as PMS, CRM, Website Builders, Booking Engines, Keyless Entry, Room Control, etc. |
Table 2.
Mapping of TOE Dimensions to Survey Items.
| TOE Dimension | Sub-Dimension | Survey Items | Description |
|---|---|---|---|
| Technological | Existing Technology Use | P6–P8, P10–P12, P14–P16, P18–P20, P22–P25, P27, P29–P33 | Use of smart systems like PMS, CRM, Channel Manager, sensors, plugs, BMS, etc. |
| Innovation Readiness | P35–P40 | Willingness to adopt AI and smart technology for automation, control, and optimization. | |
| Organizational | Size and Resources | Q1, P4, P41 | Structure size (number of rooms), accommodation type, and available budget for tech investment. |
| Internal Capabilities | P34_2, P34_5, P44_4, P48_4 | Internal limitations related to expertise, staff training, and internal improvement needs. | |
| Environmental | Competitive Pressure | P18, P27, P45_1–P45_3, P47_3, P48_6 | Security, reputation management, and the pressure to enhance performance and customer trust. |
| Regulatory & Infrastructure | P34_6, P34_7, P43 | Barriers caused by weak infrastructure, data privacy concerns, and lack of centralized integration. |
3.3. Data Collection and Sampling
Data were gathered between November 2024 and June 2025 using a two-phase mixed method approach.
Phase I – On-Site Collection: Regional workshops were organized into six key tourism destinations (Berat, Shkodër, Pogradec, Gjirokastër, Sarandë, and Tiranë), targeting hotel owners and managers, local government officials, vocational schoolteachers and students, as well as representatives of tour guides and travel agencies. The workshops served as a platform for disseminating questionnaires and fostering discussions on digital transformation in the hospitality sector.
Phase II – Digital Distribution: The questionnaire was disseminated online to licensed accommodation providers across the country. To ensure data quality and accurate interpretation, trained enumerators from INSTAT (the Albanian Institute of Statistics) assisted the respondents during the digital completion process. Their involvement was instrumental in supporting comprehension and consistency across diverse regions. A total of 1,820 valid responses were retained after screening for completeness and eligibility, and respondent verification was conducted using the Ministry of Tourism’s official registry of licensed accommodation providers.
Informed consent was obtained from all participants, with anonymity and data privacy maintained.
3.4. Analytical Strategy
Data analysis was conducted using R software (version 4.x) with key packages, including lavaan, psych, cluster, and factoextra. The analytical strategy involved three stages.
Exploratory Factor Analysis (EFA): To identify the underlying dimensions of readiness, an EFA was conducted on six Likert-scale items (P35–P40) using principal axis factoring. Sampling adequacy was verified (KMO = 0.936), and Bartlett’s test of sphericity confirmed factorability (p < 0.001). The extracted factors were retained for further analysis (Hair, 2023), (Costello & Osborne, n.d.).
Cluster Analysis: Factor scores from the EFA were used as inputs for k-means clustering to segment accommodation providers. The optimal number of clusters (k = 3) was determined based on convergence across the Elbow method, average silhouette width, and Gap statistic (Gentle et al., 1991). The resulting segments were labeled as Tech Leaders, Budget-Cautious, and Skeptics.
Structural Equation Modeling (SEM): The SEM model was estimated using the Weighted Least Squares Mean and Variance adjusted (WLSMV) estimator, suitable for mixed ordinal and binary data (Brown, 2015), (Byrne, 2016). The model structure included one exogenous construct (Barriers), two mediating constructs, ML1 (Environmental Control & Data Security) and ML2 (Operational & Staff Automation) and five endogenous constructs representing latent benefit domains (Customer Experience, Operational Efficiency, Data Security, Sustainability, and Future Orientation).
Model fit was assessed using multiple indices: χ²/df, Comparative Fit Index (CFI), Tucker–Lewis Index (TLI), Root Mean Square Error of Approximation (RMSEA), and Standardized Root Mean Square Residual (SRMR), following recommended thresholds (Hair, 2023), (Kline, 2016).
The study complied with ethical standards for social science research and AI tool usage. AI has been used only for editing and not for generating or analyzing data (Porsdam Mann et al., 2024).
4. Results
4.1. Descriptive Statistics: Adoption, Benefits, and Barriers
4.1.1. Adoption of Core Technologies
As Figure 2 shows, the most widely adopted foundational digital systems among Albanian accommodation providers included Channel Managers (51.28%) and Property Management Systems (37.21%). However, more advanced tools such as revenue managers (6.81%), guest messaging platforms (5.41%), and reputation management systems (8.63%) showed significantly lower uptake.
This distribution reveals that a basic digital infrastructure is in place, but the adoption of tools that enable automation, personalization, and data-driven decision making remains limited. The adoption levels for each core system are listed in Table A1 (see Appendix A).
4.1.2. Adoption of AI and Smart Technology
As shown in Figure 3, the integration of smart and AI-enabled systems remains low. Only four technologies exceeded the 20% adoption rate: security cameras and motion sensors (69.38%), keyless entry systems (29.7%), energy-saving sensors (26.55%), and smart lighting and thermostat controls (21.60%).
Other AI-enhanced or automation-related tools, such as chatbots, building management systems, and water and energy monitoring, were used by less than 15% of respondents, indicating a slow diffusion of intelligent systems outside premium providers (Table A2, Appendix A).
4.1.3. Perceived Benefits of AI and Smart Technology
Despite the low adoption, the perceived value of AI and smart technology is high. Over 70% of the respondents saw improvements in energy sustainability (72.39%), operational efficiency (68.24%), and data security (64.31%) as the expected benefits (Figure 4). Additional gains, including improved guest experiences and future competitiveness, are widely acknowledged (Table A3, Appendix A). This suggests that despite favorable perceptions, actual implementation of smart technology remains limited.
4.1.4. Perceived Barriers to Integration of AI and Smart Technology
Financial and infrastructural constraints dominate perceived barriers. As Figure 5 illustrates, the most frequently cited challenges included a lack of initial financial resources (71.49%), high implementation and maintenance costs (73.06%), and the complexity of integration with existing systems (67.5%). Other critical concerns included limited technical expertise (63.43%) and difficulties in staff training (59.03%). Privacy and data security challenges were acknowledged but with less intensity (49.54%) (Table A4, Appendix A).
4.2. Exploratory Factor Analysis and Adoption Segmentation
4.2.1. Exploratory Factor Analysis (EFA)
To understand the readiness dimensions, an Exploratory Factor Analysis (EFA) was conducted on six Likert-scale items (P35–P40). Sampling adequacy was strong, with a Kaiser–Meyer–Olkin (KMO) value of 0.936, and Bartlett’s test of sphericity confirmed item intercorrelation (χ² = 9891.646, df = 15, p < 0.001 (Table A5, Appendix A).
A two-factor solution was retained based on the results of the parallel analysis (Figure 6) and the Kaiser criterion (eigenvalues > 1, Table A6, Appendix A), jointly explaining 80.7% of the total variance. While only the first eigenvalue exceeded 1 (4.64), the parallel analysis supported the retention of the two factors, as the second observed eigenvalue exceeded its simulated counterpart. This approach aligns with best practices recommended in contemporary psychometric research (Costello & Osborne, n.d.), (Patil et al., 2008).
Varimax-rotated factor loadings (Table A7, Appendix A) were theoretically consistent, with each item demonstrating strong primary loadings on its dominant factor and acceptable cross-loadings, which were conceptually justified. For instance, P36, automated lighting, and temperature control loaded primarily on ML2 (0.83) but also showed a moderate association with ML1 (0.49), reflecting its dual relevance to both operational efficiency and environmental regulation.
All communalities exceeded 0.74 (Table A8, Appendix A), ranging from 0.740 to 0.929, indicating that the two factors jointly explained a substantial portion of the variance for each item. These values are well above the recommended 0.50 threshold (Hair, 2023), confirming strong shared variance and factor reliability.
The two factors were interpreted as: ML1 (Environmental Control & Data Security) and ML2 (Operational and Staff Automation).
The model fit was excellent, with a Root Mean Square Residual (RMSR) of 0.0053, and reliability was high, as shown by Cronbach’s alpha coefficients of 0.91 for ML1 and 0.92 for ML2 (Table A9, Appendix A). These values indicate excellent internal consistency (Nunnally & Bernstein, 20).
4.2.2. Cluster Analysis
To explore the heterogeneity in readiness patterns, K-means clustering was performed using standardized factor scores from two latent readiness dimensions (ML1: Environmental Control & Data Security; ML2: Operational and Staff Automation). The optimal number of clusters (k = 3) was determined using multiple validation methods: the Elbow Method (Figure 9), Average Silhouette Width (Figure 10), and Gap Statistics (Figure 11), all of which consistently supported a three-cluster solution (Tibshirani et al., 2001). The three identified adopter segments include Tech Leaders (n = 689), characterized by high scores on both ML1 and ML2; Budget-Cautious providers (n = 685), with high ML1 and moderate ML2 scores; and Skeptics (n = 297), who score low on both dimensions.
These clusters were interpreted based on their standardized factor score profiles (Table A10, Appendix A) and their stability was further confirmed through confidence intervals (Table A11, Appendix A). Tech Leaders exhibited the most comprehensive readiness across both the dimensions. Skeptics demonstrate limited engagement with AI and smart technology while the Budget-Cautious segment shows selective investment, favoring environmental and security enhancements (ML1), but demonstrates only moderate readiness for operational and automation-related innovations (ML2).
A heatmap (Figure 12) visually confirms the adoption patterns across clusters. The boxplots in Figure 13 and Figure 14 illustrate the distributions of ML1 and ML2 scores across the three groups. Statistically significant differences between segments were confirmed using Dunn’s post-hoc tests (Table A12, Appendix A), following the Kruskal–Wallis test.
For ML1, significant differences were found between Budget-Cautious and Skeptics (Z = 30.05, p.adj < 0.001) and Budget-Cautious and Tech Leaders (Z = 25.01, p.adj < 0.001), whereas Skeptics vs. Tech Leaders did not differ significantly (Z = 1.42, p.adj = 0.46).
For ML2, all pairwise comparisons were significant (p.adj < 0.001), confirming robust segmentation across both the readiness dimensions.
This clustering approach provides a nuanced understanding of digital transformation readiness among accommodation providers and highlights the coexistence of advanced adopters (Tech Leaders), cautious investors (Budget-Cautious), and digital skeptics (Skeptics). These results align with prior segmentation studies on hospitality innovation adoption (Rogers, 2003), (Mariani, 2019), (Guttentag, 2015).
4.3. Structural Equation Modeling (SEM)
4.3.1. Model Specification and Fit
The SEM model was estimated using WLSMV to accommodate the mixed ordinal and binary data. As shown in Table 3, the model demonstrated an excellent fit based on established thresholds (Byrne, 2016), (Schumacker & Lomax, 2015). All fit indices (CFI, TLI, RMSEA, SRMR, and χ²/df) fell within the recommended ranges, indicating strong model adequacy.
4.3.2. Measurement Model
The measurement model included seven reflectively measured latent constructs: Perceived Usefulness (PU), Perceived Ease of Use (PEOU), Readiness to Invest (ATU), Behavioral Intention (BI), Actual Use (AU), Innovation Readiness, and Environmental Pressure
Each latent construct was measured using multiple indicators derived from theory-driven questionnaire items. Standardized factor loadings, presented in Table A13 (Appendix A), demonstrate that most indicators loaded strongly on their respective constructs, with values well above the 0.70 threshold, indicating convergent validity (Hair, 2023).
For instance, Perceived Usefulness showed high loadings, ranging from 0.878 to 0.956, Ease of Use ranged from 0.889 to 0.963, and Environmental Pressure included indicator loadings above 0.89, with one item reaching 0.976.
The construct of Actual Use was measured using seven indicators, five of which had loadings greater than 0.80. One item, Payment Gateway (0.645), fell slightly below the threshold, but was retained because of its conceptual relevance in capturing the core technology infrastructure in accommodation businesses.
Overall, the model demonstrated good measurement properties, supporting the assumption that each observed variable reliably reflected its underlying construct. These findings are aligned with established practices in structural equation modeling and technology adoption studies (Venkatesh & Davis, 2000), (Rogers, 2003), (Byrne, 2016), (Schumacker & Lomax, 2015).
4.3.3. Structural Model Findings
The final structural equation model (Figure 15) revealed strong, theoretically coherent relationships between the constructs, supporting the integrated TAM–TOE framework for understanding AI and smart technology adoption in hospitality.
As presented in Table 4, environmental pressure exerts a substantial positive influence on innovation readiness (β = 0.85), which, in turn, strongly predicts perceived usefulness (β = 0.92). Perceived usefulness emerged as a critical mediator driving readiness to invest (β = 0.89), which subsequently influenced behavioral intention (β = 0.91). Finally, behavioral intention significantly predicted the actual use of AI and smart technology (β = 0.96), highlighting a clear adoption pathway grounded in perceived strategic value.
Interestingly, ease of use showed minimal and statistically insignificant effects on both perceived usefulness (β = 0.04) and readiness to invest (β = 0.02), suggesting that in complex digital environments, ease may be subordinate to factors such as innovation readiness and environmental pressure.
Moreover, innovation readiness has a direct negative effect on actual use (β = –0.37), indicating that its primary role lies in enabling strategic perception and motivation rather than direct implementation behavior. This negative path underscores a mediating role through perceived usefulness and behavioral intention rather than being a direct driver of technology use.
These results confirm the central role of strategic, perceptual, and environmental dimensions in shaping adoption behavior, reinforcing the relevance of the integrated TAM and TOE perspectives in emerging digital hospitality contexts. As previously reported, the model demonstrated an excellent fit, further validating its structural integrity and empirical adequacy.
5. Discussion
This study advances our understanding of AI and smart technology adoption in hospitality by offering a structured theory-driven investigation grounded in the TAM–TOE framework. Through descriptive analysis, exploratory factor segmentation, and structural equation modeling, we provide a multidimensional portrait of digital readiness in Albania’s accommodation sector, an underexplored yet increasingly relevant context for digital transformation research. The integration of environmental, organizational, and attitudinal lenses offers insights that transcend mere adoption rates and emphasizes capability, intention, and constraint-driven behavior.
5.1. Operational Digitalization vs. Strategic AI Readiness
The descriptive results (Section 4.1) reveal the foundational layer of the digital infrastructure. Tools such as Channel Managers (51.28%) and Property Management Systems (37.21%) were relatively widespread, reflecting the minimum integration thresholds driven by operational necessity and OTA market access.
By contrast, advanced AI and smart technology, such as guest messaging platforms (5.41%), revenue managers (6.81%), and intelligent automation systems (e.g., smart thermostats, 21.6%; chatbots, 8.91%), remain significantly underutilized. This confirms a digital maturity gap, consistent with prior studies in developing contexts where technological availability does not automatically translate into adoption. The observed disparity illustrates the classic TAM–TOE dualism: while Perceived Usefulness is acknowledged (e.g., 72.39% see energy sustainability gains), organizational and environmental constraints suppress actual usage.
This bifurcation, widespread operational digitalization versus low-strategic AI adoption, underscores a two-tiered ecosystem. Simple digital systems serve immediate managerial needs, whereas smart and AI-enhanced systems, although valued, are considered aspirational because of structural barriers and capability gaps. These findings mirror adoption constraints identified in tourism SMEs in Serbia and Vietnam (see Section 2.2).
5.2. High Perceived Benefits, Strong Structural Constraints
Despite their limited implementation, providers have expressed broad agreement regarding the potential benefits of smart technology. Over 70% of the respondents reported expected improvements in environmental sustainability (72.39%), operational efficiency (68.24%), and data security (64.31%), indicating strong perceived strategic value. These findings reinforce the TAM’s central construct of Perceived Usefulness (Venkatesh & Davis, 2000), which emerged in SEM as a key mediator of adoption behavior.
Barriers dominated the landscape: 73.06% cited high implementation and maintenance costs, 71.49% reported a lack of financial resources, and 67.5% noted integration complexities. These results reflect the organizational and environmental factors emphasized in TOE and align with Pergelova et al. (Pergelova et al., 2024), who found that socio-technical obstacles frequently derail even willing adopters, particularly in small and medium hospitality enterprises. Similar patterns are observed in tourism SMEs across Central and Eastern Europe, where financial limitations and capability gaps are primary inhibitors of AI adoption (Šakytė-Statnickė & Budrytė-Ausiejienė, 2025). Notably, privacy and security concerns, while often cited in the global discourse, were among the least reported barriers (49.54%), suggesting that functional concerns outweigh ethical and regulatory concerns in this setting.
Together, these findings support a blended adoption model that incorporates both attitudinal readiness (TAM) and structural feasibility (TOE). Behavioral intention alone is insufficient, and financial, infrastructure, and human capital support are necessary preconditions for translating perceived value into action.
5.3. Segmentation Reveals Divergent Digital Pathways
The integration of EFA and cluster analysis (Section 4.2) produced three distinct digital adopter segments: Tech Leaders (n = 689), Budget-Cautious (n = 685), and Skeptics (n = 297). These groups diverged significantly across two readiness dimensions: ML1 (Environmental Control & Data Security), and ML2 (Operational and Staff Automation).
Tech Leaders exhibit high readiness across both ML1 and ML2, reflecting early adopter behavior driven by strategic alignment and organizational capabilities. Budget-Cautious adopters prioritize environmental control but exhibit only moderate readiness for operational automation, suggesting selective investment based on perceived necessity and available resources. Skeptics showed low readiness across both dimensions, indicating deeper systemic limitation.
This nuanced segmentation echoes prior research (Rogers, 2003), (Mariani, 2019) that emphasizes heterogeneity in adoption behavior and supports the TOE framework by showing how technological, organizational, and environmental contexts interact to shape readiness. Statistically significant group differences (e.g., Z = 30.05, p < 0.001 for ML1) confirmed these behavioral distinctions.
From a policy perspective, these segments require different support strategies. Tech Leaders may benefit from advanced AI integration programs, Budget-Cautious adopters from targeted financial incentives and modular solutions, and Skeptics from foundational infrastructure investment and training.
5.4. Innovation Readiness and Environmental Pressure Drive Adoption
The SEM model (section 4.3) provides strong empirical support for the integrated TAM–TOE framework. Environmental Pressure significantly predicted Perceived Usefulness (β = 0.85), and Perceived Usefulness strongly influenced Readiness to Invest (β = 0.89) and Behavioral Intention (β = 0.91). These results affirm the importance of external institutional signals and organizational preparedness in shaping adoption decisions (Chen et al., 2023).
Interestingly, Ease of Use has no significant effect on Perceived Usefulness (β = 0.04) or Readiness to Invest (β = 0.02). This contrasts with classical TAM assumptions and supports emerging perspectives that strategic imperatives outweigh usability concerns in complex, low-resource settings.
Another key finding is the indirect effect of Innovation Readiness. Although it negatively predicted Actual Use (β = –0.37), this counterintuitive result aligns with the notion that readiness alone does not lead to adoption without enabling structures. Its effect is mediated by Perceived Usefulness and Investment Readiness, suggesting a gap between organizational aspirations and operational capacity, which is a well-documented challenge in developing economies. This aligns with recent findings that emphasize the need to address systemic innovation barriers, which remain underexplored in tourism technology research (To & Yu, 2025).
Finally, Actual Use was significantly driven by Behavioral Intention (β = 0.96), affirming TAM’s core logic but only when contextual factors were addressed.
5.5. Policy and Practice Implications
The findings offer clear, actionable implications for different stakeholders. First, tiered digital transformation support should be implemented. Governments and tourism authorities are encouraged to adopt differentiated intervention strategies tailored to the three adopter segments identified in the study. A “one-size-fits-all” approach fails to address varying levels of readiness and infrastructure disparities.
Second, modular and scalable technology solutions are critical. Technology vendors should focus on designing affordable, interoperable platforms that align with fragmented infrastructure realities. Design features such as offline functionality, localized language support, and seamless integration with legacy systems are essential for effective adoption.
Third, targeted capacity building is necessary to close digital skill gaps. Hospitality training institutes and business associations should invest in micro-credentialing programs focused on AI literacy, digital customer service, and data security areas that are simultaneously beneficial and constrained.
Finally, longitudinal tracking of readiness constructs can guide future interventions. The two-factor readiness model (ML1 and ML2) developed in this study offers a replicable framework for monitoring digital transformation over time. Policymakers and researchers can use these indicators to evaluate the long term effects of policy actions, technology diffusion, and shifts in organizational culture.
In summary, this study contributes a theoretically grounded and empirically validated framework for understanding the adoption of AI and smart technology in hospitality. It offers actionable insights for researchers, policymakers, and practitioners seeking to accelerate digital transformation in emerging tourism markets, while remaining attentive to structural, contextual, and behavioral complexity.
6. Conclusions
This study offers a theoretically anchored and empirically robust investigation of AI and smart technology adoption in the hospitality sector of an emerging economy. By integrating the technology–organization–environment (TOE) framework, the Technology Acceptance Model (TAM), and the Diffusion of Innovation (DOI) theory, this study responds to critical gaps in the literature by applying a multi-method approach, combining descriptive statistics, exploratory factor analysis (EFA), cluster-based adoption segmentation, and structural equation modeling (SEM), to a nationally representative sample of 1,820 accommodation providers in Albania.
The results reveal a fragmented digital landscape, marked by the widespread use of basic digital systems (e.g., PMS, channel managers, and booking engines) and the limited adoption of advanced smart and AI-enabled technologies. This dual-speed environment underscores that technological diffusion is shaped less by availability and more by a combination of perceived strategic value, environmental pressure, and institutional readiness. In particular, constructs such as perceived usefulness and readiness to invest emerged as critical drivers of behavioral intention and actual use, whereas ease of use played a negligible role, highlighting the importance of reframing classical adoption models within resource-constrained and transitional contexts.
Segmenting adopters into Tech Leaders, Budget-Cautious, and Skeptics further illuminates the heterogeneity of readiness patterns across infrastructure and operations. These profiles not only offer empirical insight but also provide a practical framework for tailoring interventions in policy, vendor strategies, and capacity-building initiatives.
Importantly, this study moves beyond a descriptive analysis to highlight the interplay between individual attitudes and systemic constraints. This demonstrates that the successful adoption of AI and smart technology in hospitality requires more than just awareness or willingness, which necessitates ecosystems that support investment, interoperability, and human capital development. These insights are particularly relevant to sustainable tourism transformation, where technological innovation must be matched by institutional feasibility and inclusive capacity-building.
In summary, this study advances the theoretical understanding of digital innovation in tourism by validating a multilevel adoption model and offers a transferable framework for assessing and supporting the adoption of AI and smart technology in low-resource hospitality settings. Future research should explore longitudinal dynamics, inter-regional comparisons, and guest-centered perspectives to enrich the system-wide view of sustainable digital transformation.
Supplementary Materials
The following supporting information can be downloaded at the website of this paper posted on Preprints.org, Figure S1: title; Table S1: title; Video S1: title.
Author Contributions
Conceptualization, M.G. and T.T.; methodology, M.G., T.T., and K.S.; formal analysis, M.G.; original draft preparation, M.G. and T.T.; supervision, M.G. and K. S; funding acquisition, K.S. All authors have read and agreed to the published version of the manuscript.
Funding
Please add: This research was funded by the National Agency for Scientific Research and Innovation of Albania (AKKSHI) under Grant PTI 2024.
Informed Consent Statement
Informed consent was obtained from all the subjects involved in the study.
Data Availability Statement
The data supporting the findings of this study are available from the corresponding author upon reasonable request owing to privacy restrictions.
Acknowledgments
The authors gratefully acknowledge the valuable support provided by trained INSTAT enumerators (the Albanian Institute of Statistics) who assisted in the digital data collection phase. Their role in ensuring the accurate interpretation and consistent completion of the questionnaire across all regions of Albania was essential for the quality and representativeness of the dataset. The authors also thank all participants and local stakeholders involved in the regional workshops for their engagement and insights.
Conflicts of Interest
The authors declare no conflict of interest. The funders had no role in the study design; collection, analyses, or interpretation of data; writing of the manuscript; or decision to publish the results.
Abbreviations
The following abbreviations are used in this manuscript:
| AI | Artificial Intelligence |
| ATU | Attitude Toward Using |
| AU | Actual Usage |
| BI | Behavioral Intention |
| CFI | Comparative Fit Index |
| DOI | Diffusion of Innovations |
| EFA | Exploratory Factor Analysis |
| ICT | Information and Communication Technology |
| INSTAT | Albanian Institute of Statistics |
| KMO | Kaiser–Meyer–Olkin |
| ML1 | Environmental Control & Data Security |
| ML2 | Operational & Staff Automation |
| OTA | Online Travel Agency |
| PEOU | Perceived Ease of Use |
| PMS | Property Management System |
| PU | Perceived Usefulness |
| RMSEA | Root Mean Square Error of Approximation |
| RMSR | Root Mean Square Residual |
| ROI | Return on Investment |
| SEM | Structural Equation Modeling |
| SI | Strategic Intent |
| SMHEs | Small and Medium-sized Hospitality Enterprises |
| SRMR | Standardized Root Mean Square Residual |
| TAM | Technology Acceptance Model |
| TLI | Tucker–Lewis Index |
| TOE | Technology–Organization–Environment |
Appendix A
Table A1.
The adoption levels for core digital system.
| Yes (%) | No (%) | Technology |
|---|---|---|
| 37.21 | 62.79 | PMS System |
| 51.28 | 48.72 | Channel Manager |
| 7.87 | 92.13 | CRM System |
| 14.83 | 85.17 | Website Builder |
| 24.97 | 75.03 | Booking Engine |
| 23.44 | 76.56 | Payment Gateway |
| 6.81 | 93.19 | Revenue Manager |
| 5.45 | 94.55 | Guest Messaging |
| 8.63 | 91.37 | Reputation System |
Table A2.
The adoption levels for AI and smart technology.
| Yes (%) | No (%) | Technology |
|---|---|---|
| 6.41 | 93.59 | Self Check-in |
| 1.89 | 98.11 | Upsell System |
| 13.22 | 86.78 | Reputation Management |
| 21.60 | 78.40 | Smart Lighting & Thermostat Control |
| 69.38 | 30.62 | Security Cameras & Motion Sensors |
| 1.97 | 98.03 | Cleaning Robots |
| 8.91 | 91.09 | Virtual Assistants / Chatbots |
| 29.70 | 70.30 | Keyless Door Management |
| 3.38 | 96.62 | Building Management System (BMS) |
| 6.93 | 93.07 | Smart Plugs for Device Control |
| 26.55 | 73.45 | Energy-saving Sensors |
| 12.20 | 87.80 | Water & Energy Monitoring |
| 11.66 | 88.34 | Air Quality Management |
Table A3.
Perceived Benefits of AI and Smart Technology.
| Construct | No | Yes |
|---|---|---|
| Data security | 35.69 | 64.31 |
| Energy sustainability | 27.61 | 72.39 |
| Future orientation | 36.57 | 63.43 |
| Guest experience | 39.42 | 60.58 |
| Integration readiness | 37.00 | 63.00 |
| Operational efficiency | 31.76 | 68.24 |
Table A4.
Perceived Barriers to AI and Smart Technology.
| Yes (%) | No (%) | Barrier |
|---|---|---|
| 73.06 | 26.94 | High implementation and maintenance costs |
| 63.43 | 36.57 | Lack of technical expertise |
| 67.50 | 32.50 | Complexity of integration with existing systems |
| 71.49 | 28.51 | Lack of financial resources for initial investments |
| 59.03 | 40.97 | Difficulties in staff training |
| 49.54 | 50.46 | Data security and privacy concerns |
| 62.83 | 37.17 | Limitations of existing infrastructure |
Table A5.
Summary of KMO and Bartlett's Test.
| MSA | Chi_Square | p_value | df |
|---|---|---|---|
| 0.9356 | 9891.646 | 0 | 15 |
Table A6.
Eigenvalues from Parallel Analysis for Readiness Dimensions.
| X | |
|---|---|
| 1 | 4.644703078 |
| 2 | 0.063521379 |
| 3 | 0.017492325 |
| 4 | -0.010249528 |
| 5 | -0.026412613 |
| 6 | -0.044338337 |
Table A7.
Varimax-Rotated Factor Loadings for Items P35–P40 Across the Two Extracted Readiness Dimensions.
Table A7.
Varimax-Rotated Factor Loadings for Items P35–P40 Across the Two Extracted Readiness Dimensions.
| ML1 | ML2 | |
|---|---|---|
| P35 | 0.699808946 | 0.552202707 |
| P36 | 0.490956489 | 0.829174966 |
| P37 | 0.65972855 | 0.55243769 |
| P38 | 0.764063402 | 0.457576166 |
| P39 | 0.773001455 | 0.455379784 |
| P40 | 0.767841266 | 0.438929547 |
Table A8.
Communalities for Items P35–P40 After EFA Extraction.
| Item | Description | Communality |
|---|---|---|
| P35 | Willingness to invest in AI systems for customer data analysis and personalization | 0.795 |
| P36 | Willingness to invest in automated lighting and temperature control systems | 0.929 |
| P37 | Willingness to invest in automation of booking and customer service processes | 0.740 |
| P38 | Willingness to invest in intelligent security monitoring solutions | 0.793 |
| P39 | Willingness to invest in staff and operational process optimization technologies | 0.805 |
| P40 | Willingness to invest in AI-based systems for demand forecasting and resource planning | 0.782 |
Table A9.
Reliability and Model Fit.
| Construct | Cronbach's Alpha | RMSR |
|---|---|---|
| ML1: Environmental Control & Data Security | 0.915 | 0.0053 |
| ML2: Operational and Staff Automation | 0.92 | 0.0053 |
Table A10.
Descriptive Statistics of ML1 and ML2 Factor Scores Across Adopter Segments.
| ClusterLabel | ML1 mean | ML1 sd | ML2 mean | ML2 sd |
|---|---|---|---|---|
| Tech Leaders | -0.770886157 | 0.678627566 | 1.363419457 | 0.739512631 |
| Budget-Cautious | 0.963529923 | 0.671737491 | 0.158933928 | 0.792195232 |
| Skeptics | -0.596191436 | 0.501358872 | -0.757469491 | 0.377752324 |
Table A11.
Estimated Means, Standard Errors, and 95% Confidence Intervals for ML1 and ML2 by Adopter Segment.
Table A11.
Estimated Means, Standard Errors, and 95% Confidence Intervals for ML1 and ML2 by Adopter Segment.
| Cluster Label | ML1 mean | ML1 se | ML1 lower | ML1 upper | ML2 mean | ML2 se | ML2 lower | ML2 upper |
|---|---|---|---|---|---|---|---|---|
| Tech Leaders | -0.770886157 | 0.038794556 | -0.846922089 | -0.694850225 | 1.363419457 | 0.042275123 | 1.280561738 | 1.446277176 |
| Budget-Cautious | 0.963529923 | 0.025893577 | 0.912779443 | 1.014280402 | 0.158933928 | 0.030536882 | 0.099082739 | 0.218785118 |
| Skeptics | -0.596191436 | 0.019058805 | -0.633546007 | -0.558836866 | -0.757469491 | 0.014359989 | -0.785614551 | -0.72932443 |
Table A12.
Dunn’s Post-Hoc Test Results For ML1 And ML2.
| Comparison | Z | P.unadj | P.adj | Factor |
|---|---|---|---|---|
| Budget-Cautious - Skeptics | 30.05155568 | 2.0835E-198 | 6.2504E-198 | ML1 |
| Budget-Cautious - Tech Leaders | 25.01464513 | 4.2362E-138 | 1.2709E-137 | ML1 |
| Skeptics - Tech Leaders | 1.424159869 | 0.154400199 | 0.463200597 | ML1 |
| Budget-Cautious - Skeptics | 21.27344245 | 2.0005E-100 | 6.0014E-100 | ML2 |
| Budget-Cautious - Tech Leaders | -13.78776359 | 3.01977E-43 | 9.05931E-43 | ML2 |
| Skeptics - Tech Leaders | -30.62344886 | 5.9661E-206 | 1.7898E-205 | ML2 |
Table A13.
Standardized Factor Loadings for Reflective Latent Variables in the SEM Model.
| Latent Variable | Indicator | Standardized Loading |
|---|---|---|
| Perceived Usefulness | Operational Efficiency | 0.895 |
| Perceived Usefulness | Cost Reduction | 0.878 |
| Perceived Usefulness | Customer Experience | 0.956 |
| Ease of Use | Tech Expertise | 0.963 |
| Ease of Use | Integration Complexity | 0.889 |
| Ease of Use | Staff Training | 0.896 |
| Readiness to Invest | AI for Customer Data | 0.892 |
| Readiness to Invest | Smart Environment | 0.853 |
| Readiness to Invest | Reservation Automation | 0.899 |
| Behavioral Intention | Single Platform | 0.963 |
| Behavioral Intention | AI Personalization | 0.948 |
| Actual Use | PMS Use | 0.751 |
| Actual Use | CRM | 0.881 |
| Actual Use | Website Builder | 0.914 |
| Actual Use | Booking Engine | 0.831 |
| Actual Use | Payment Gateway | 0.645 |
| Actual Use | Revenue Manager | 0.961 |
| Actual Use | Guest Messaging | 0.927 |
| Innovation Readiness | Security Innovation | 0.912 |
| Innovation Readiness | Operational Innovation | 0.92 |
| Environmental Pressure | Improve Security | 0.897 |
| Environmental Pressure | Certified Tech | 0.976 |
| Environmental Pressure | Cyber Training | 0.925 |
References
- Alsharif, A., Isa, S. M., & Alqudah, M. N. (2024). Smart Tourism, Hospitality, and Destination: A Systematic Review and Future Directions. Journal of Tourism and Services, 15(29), 72–110. [CrossRef]
- Brown, T. A. (2015). Confirmatory factor analysis for applied research (Second edition). The Guilford Press.
- Buhalis, D., & Leung, R. (2018). Smart hospitality—Interconnectivity and interoperability towards an ecosystem. International Journal of Hospitality Management, 71, 41–50. [CrossRef]
- Byrne, B. M. (2016). Structural Equation Modeling With AMOS: Basic Concepts, Applications, and Programming, Third Edition (0 ed.). Routledge. [CrossRef]
- Chen, Y., Hu, Y., Zhou, S., & Yang, S. (2023). Investigating the determinants of performance of artificial intelligence adoption in hospitality industry during COVID-19. International Journal of Contemporary Hospitality Management, 35(8), 2868–2889. [CrossRef]
- Costello, A. B., & Osborne, J. (n.d.). Best practices in exploratory factor analysis: Four recommendations for getting the most from your analysis. [CrossRef]
- Davis, F. D. (1989). Perceived Usefulness, Perceived Ease of Use, and User Acceptance of Information Technology. MIS Quarterly, 13(3), 319. [CrossRef]
- Dillman, D. A., Smyth, J. D., & Christian, L. M. (2014). Internet, phone, mail, and mixed-mode surveys: The tailored design method (4th edition). Wiley.
- Gajić, T., Vukolić, D., Bugarčić, J., Đoković, F., Spasojević, A., Knežević, S., Đorđević Boljanović, J., Glišić, S., Matović, S., & Dávid, L. D. (2024). The Adoption of Artificial Intelligence in Serbian Hospitality: A Potential Path to Sustainable Practice. Sus-tainability, 16(8), 3172. [CrossRef]
- Gentle, J. E., Kaufman, L., & Rousseuw, P. J. (1991). Finding Groups in Data: An Introduction to Cluster Analysis. Biometrics, 47(2), 788. [CrossRef]
- Gursoy, D., Li, Y., & Song, H. (2023). ChatGPT and the hospitality and tourism industry: An overview of current trends and future research directions. Journal of Hospitality Marketing & Management, 32(5), 579–592. [CrossRef]
- Guttentag, D. (2015). Airbnb: Disruptive innovation and the rise of an informal tourism accommodation sector. Current Issues in Tourism, 18(12), 1192–1217. [CrossRef]
- Hair, J. F. (2023). Multivariate data analysis (8th ed). Cengage Learning India.
- Ifinedo, P. (2012). Technology Acceptance by Health Professionals in Canada: An Analysis with a Modified UTAUT Model. 2012 45th Hawaii International Conference on System Sciences, 2937–2946. [CrossRef]
- INSTAT. (2024). Tourism Statistics. https://www.instat.gov.al/en/themes/industry-trade-and-services/tourism-statistics/#tab3.
- Ionescu, A.-M., & Sârbu, F. A. (2024). Exploring the Impact of Smart Technologies on the Tourism Industry. Sustainability, 16(8), 3318. [CrossRef]
- Ivanov, S., Webster, C., Berezina, K. (2022). Robotics in Tourism and Hospitality. In: Xiang, Z., Fuchs, M., Gretzel, U., Höpken, W. (eds) Handbook of e-Tourism. Springer, Cham. [CrossRef]
- Ivanov, S., & Webster, C. (2020). Robots in tourism: A research agenda for tourism economics. Tourism Economics, 26(7), 1065–1085. [CrossRef]
- Khang, A., Dutta, P. K., Gupta, S., Ayedee, N., & Chatterjee, S. (2024). Revolutionizing the AI-Digital Landscape: A Guide to Sustainable Emerging Technologies for Marketing Professionals (1st ed.). Productivity Press. [CrossRef]
- Kim, H., So, K. K. F., Shin, S., & Li, J. (2025). Artificial Intelligence in Hospitality and Tourism: Insights From Industry Practices, Research Literature, and Expert Opinions. Journal of Hospitality & Tourism Research, 49(2), 366–385. [CrossRef]
- Kline, R. B. (2016). Principles and practice of structural equation modeling (Fourth edition). The Guilford Press.
- Majid, G. M., Tussyadiah, I., Kim, Y. R., & Pal, A. (2023). Intelligent automation for sustainable tourism: A systematic review. Journal of Sustainable Tourism, 31(11), 2421–2440. [CrossRef]
- Mariani, M. (2019). Big Data and analytics in tourism and hospitality: A perspective article. Tourism Review, 75(1), 299–303. [CrossRef]
- Muça, E., Boboli, I., Kapaj, I., & Kapaj Mane, A. (2022). Smart Technology Effecting Tourism Development in Albania. Journal of Environmental Management and Tourism, 13(8), 2113. [CrossRef]
- Nikopoulou, M., Kourouthanassis, P., Chasapi, G., Pateli, A., & Mylonas, N. (2023). Determinants of Digital Transformation in the Hospitality Industry: Technological, Organizational, and Environmental Drivers. Sustainability, 15(3), 2736. [CrossRef]
- Nunnally, J. C., & Bernstein, I. H. (20). Psychometric theory (3. ed., [Nachdr.]). McGraw-Hill.
- Patil, V. H., Singh, S. N., Mishra, S., & Todd Donavan, D. (2008). Efficient theory development and factor retention criteria: Abandon the ‘eigenvalue greater than one’ criterion. Journal of Business Research, 61(2), 162–170. [CrossRef]
- Pergelova, A., Beck, S., Zwiegelaar, J., & Stylos, N. (2024). Smart technologies use by SMEs in the hospitality industry: Implications for customer interactions and organizational resilience. In N. Stylos, R. Rahimi, & P. Robinson (Eds.), Contemporary marketing management for tourism and hospitality (pp. xx–xx). Palgrave Macmillan. [CrossRef]
- Peng, X., Zhang, L., Lee, S., Song, W., & Shou, K. (2025). Navigating hospitality innovation (1995–2023): A bibliometric review and forward outlook. Journal of Hospitality and Tourism Technology, 16(1), 91–123. [CrossRef]
- Porsdam Mann, S., Vazirani, A. A., Aboy, M., Earp, B. D., Minssen, T., Cohen, I. G., & Savulescu, J. (2024). Guidelines for ethical use and acknowledgement of large language models in academic writing. Nature Machine Intelligence, 6(11), 1272–1274. [CrossRef]
- Rogers, E. M. (2003). Diffusion of innovations (Fifth edition). Free Press.
- Šakytė-Statnickė, G., & Budrytė-Ausiejienė, L. (2025). Application of Artificial Intelligence in the Tourism Sector: Benefits and Challenges of AI-Based Digital Tools in Tourism Organizations of Lithuania, Latvia, and Sweden. Tourism and Hospitality, 6(2), 67. [CrossRef]
- Sánchez, E., Calderón, R., & Herrera, F. (2025). Artificial Intelligence Adoption in SMEs: Survey Based on TOE–DOI Framework, Primary Methodology and Challenges. Applied Sciences, 15(12), 6465. [CrossRef]
- Schumacker, R. E., & Lomax, R. G. (2015). A Beginner’s Guide to Structural Equation Modeling: Fourth Edition (0 ed.). Routledge. [CrossRef]
- Shin, H., Ryu, J., & Jo, Y. (2025). Navigating artificial intelligence adoption in hospitality and tourism: Managerial insights, workforce transformation, and a future research agenda. International Journal of Hospitality Management, 128, 104187. [CrossRef]
- Sigala, M. (2020). Tourism and COVID-19: Impacts and implications for advancing and resetting industry and research. Journal of Business Research, 117, 312–321. [CrossRef]
- Tibshirani, R., Walther, G., & Hastie, T. (2001). Estimating the Number of Clusters in a Data Set Via the Gap Statistic. Journal of the Royal Statistical Society Series B: Statistical Methodology, 63(2), 411–423. [CrossRef]
- To, W. M., & Yu, B. T. W. (2025). Artificial Intelligence Research in Tourism and Hospitality Journals: Trends, Emerging Themes, and the Rise of Generative AI. Tourism and Hospitality, 6(2), 63. [CrossRef]
- Tornatzky, Louis G. & Fleischer, Mitchell. (1990). The Processes of Technological Innovation. Lexington Books.
- Trai, D. V., Tien, N. H., & Quyet, N. X. (2025). The impact of digital transformation on tourism sustainable development: A case of SMEs in Vietnam. International Journal of Entrepreneurship and Small Business, 1(1). [CrossRef]
- Venkatesh, V., & Davis, F. D. (2000). A Theoretical Extension of the Technology Acceptance Model: Four Longitudinal Field Studies. Management Science, 46(2), 186–204. [CrossRef]
- Wong, I. A., Zhang, T., Lin, Z. (Cj), & Peng, Q. (2023). Hotel AI service: Are employees still needed? Journal of Hospitality and Tourism Management, 55, 416–424. [CrossRef]
Figure 1.
Integrated TOE–TAM–Diffusion Framework for AI and Smart Technology Adoption in Emerging Hospitality Markets.
Figure 1.
Integrated TOE–TAM–Diffusion Framework for AI and Smart Technology Adoption in Emerging Hospitality Markets.
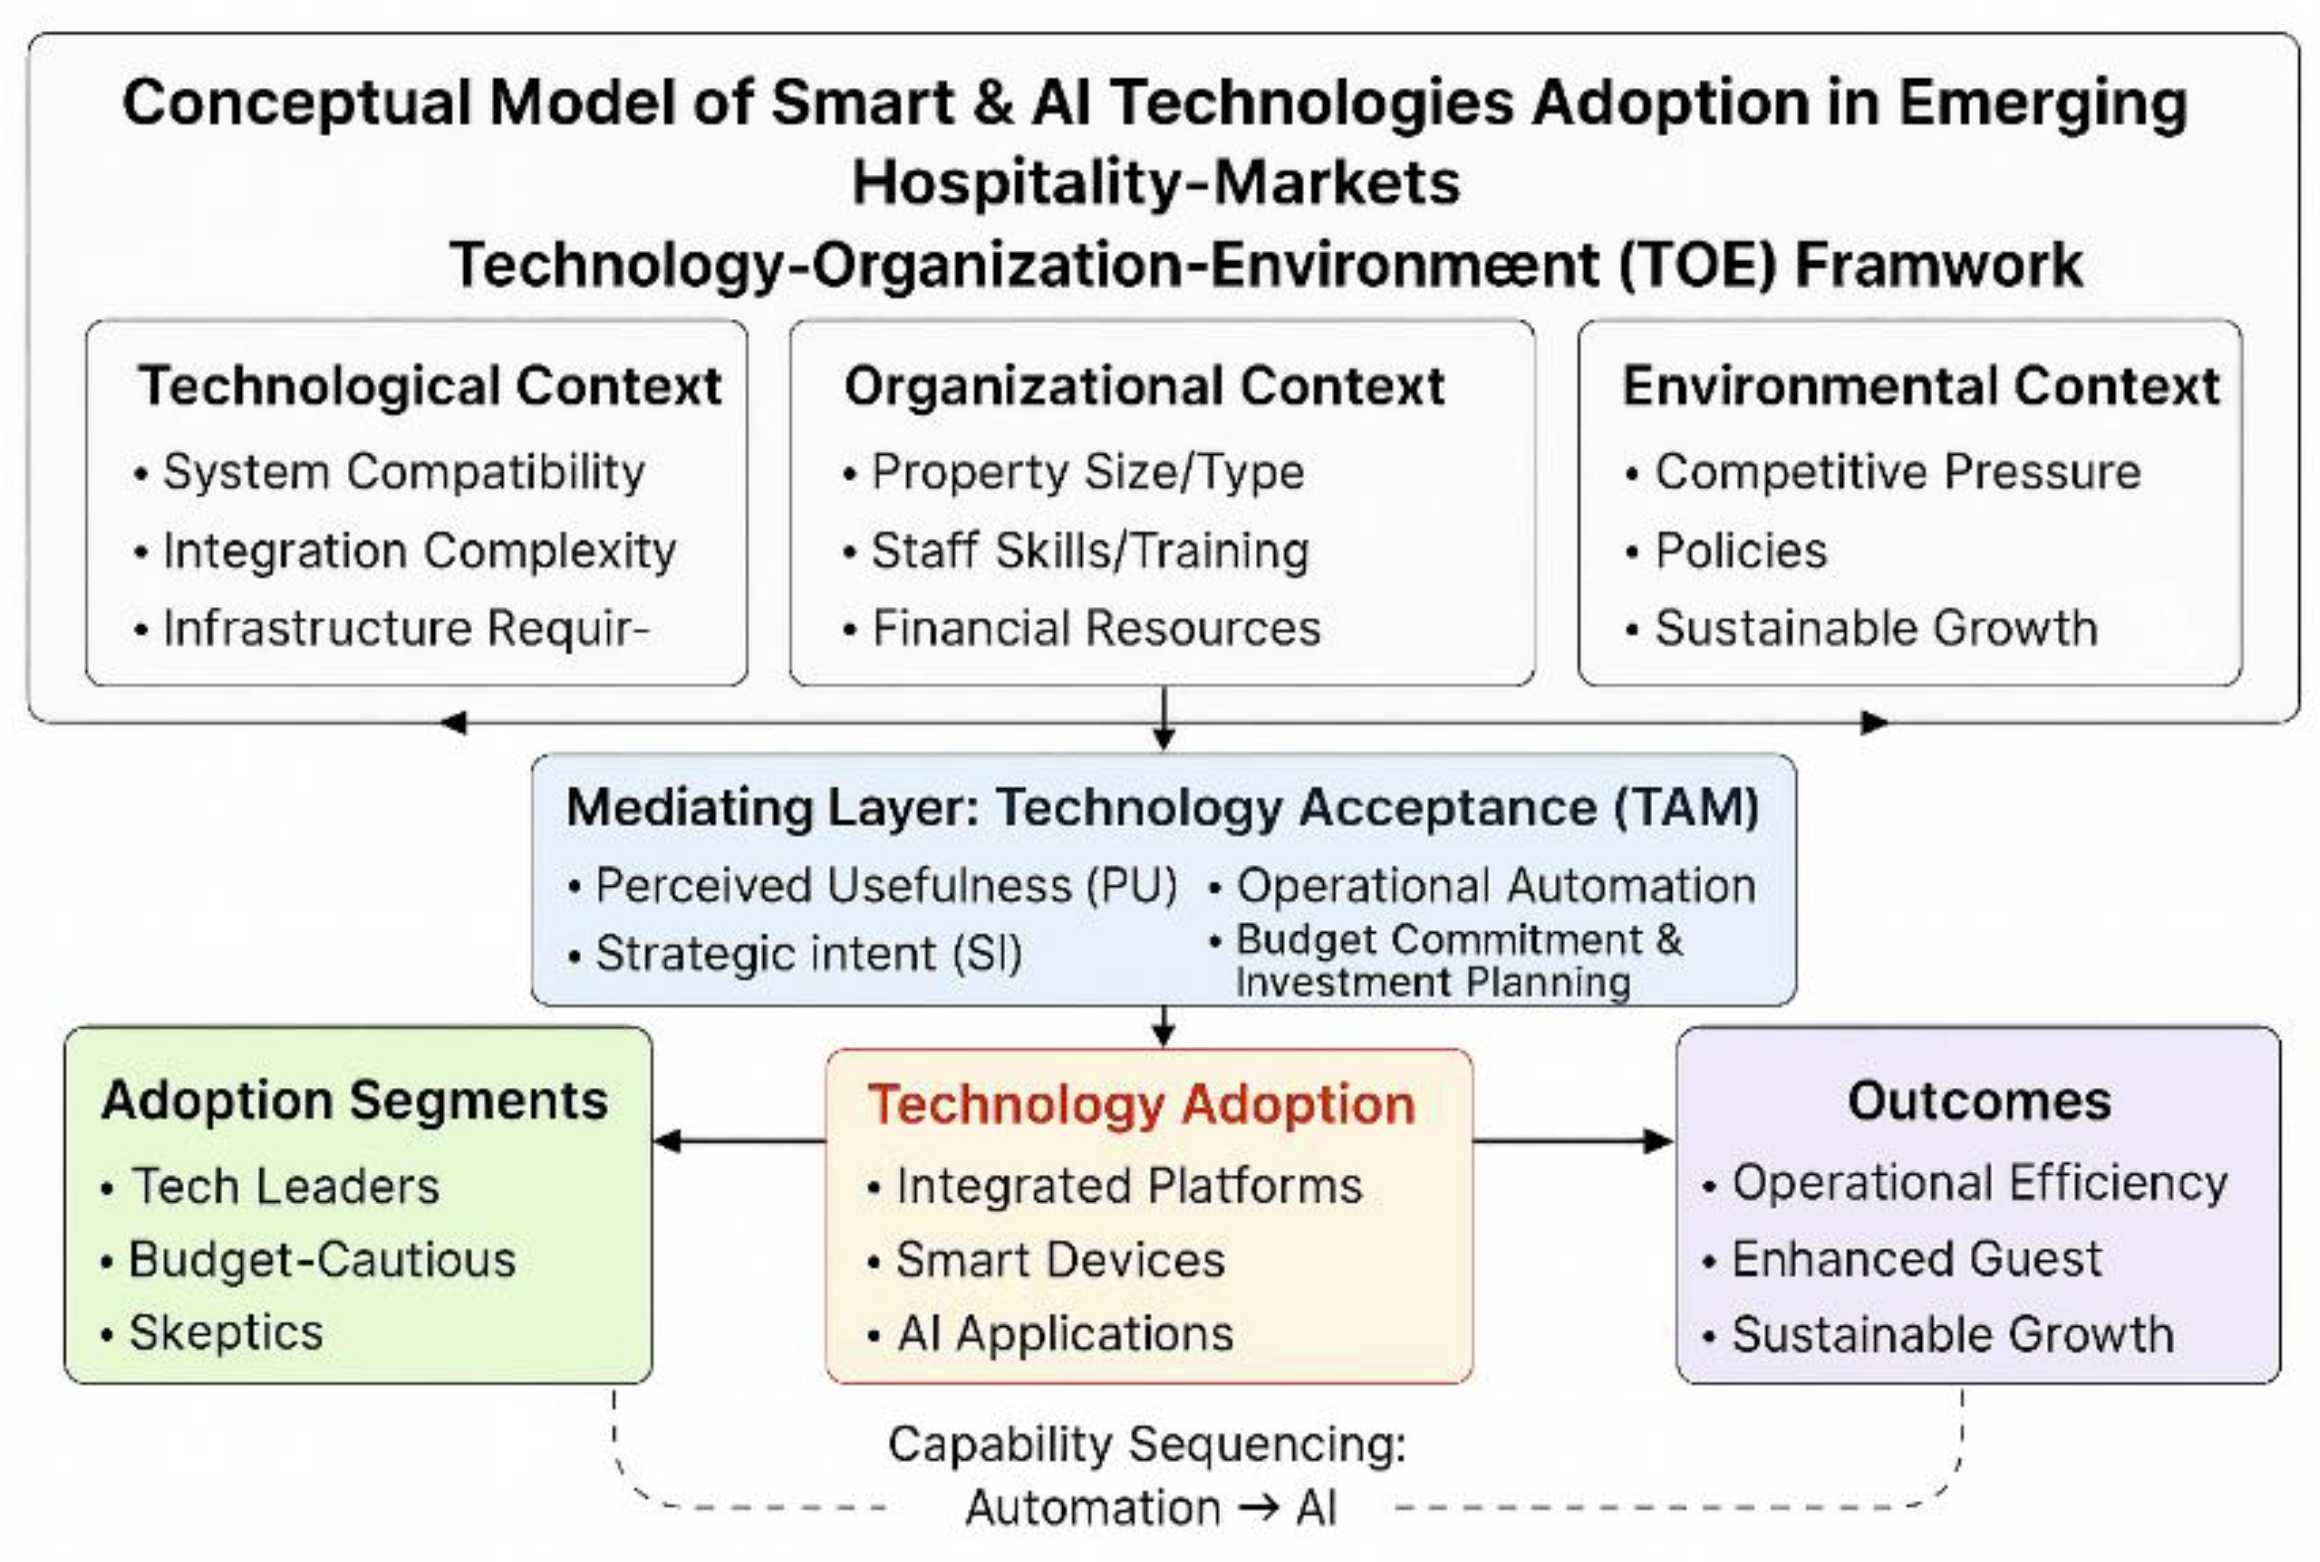
Figure 2.
The adoption of Core Digital Technologies.
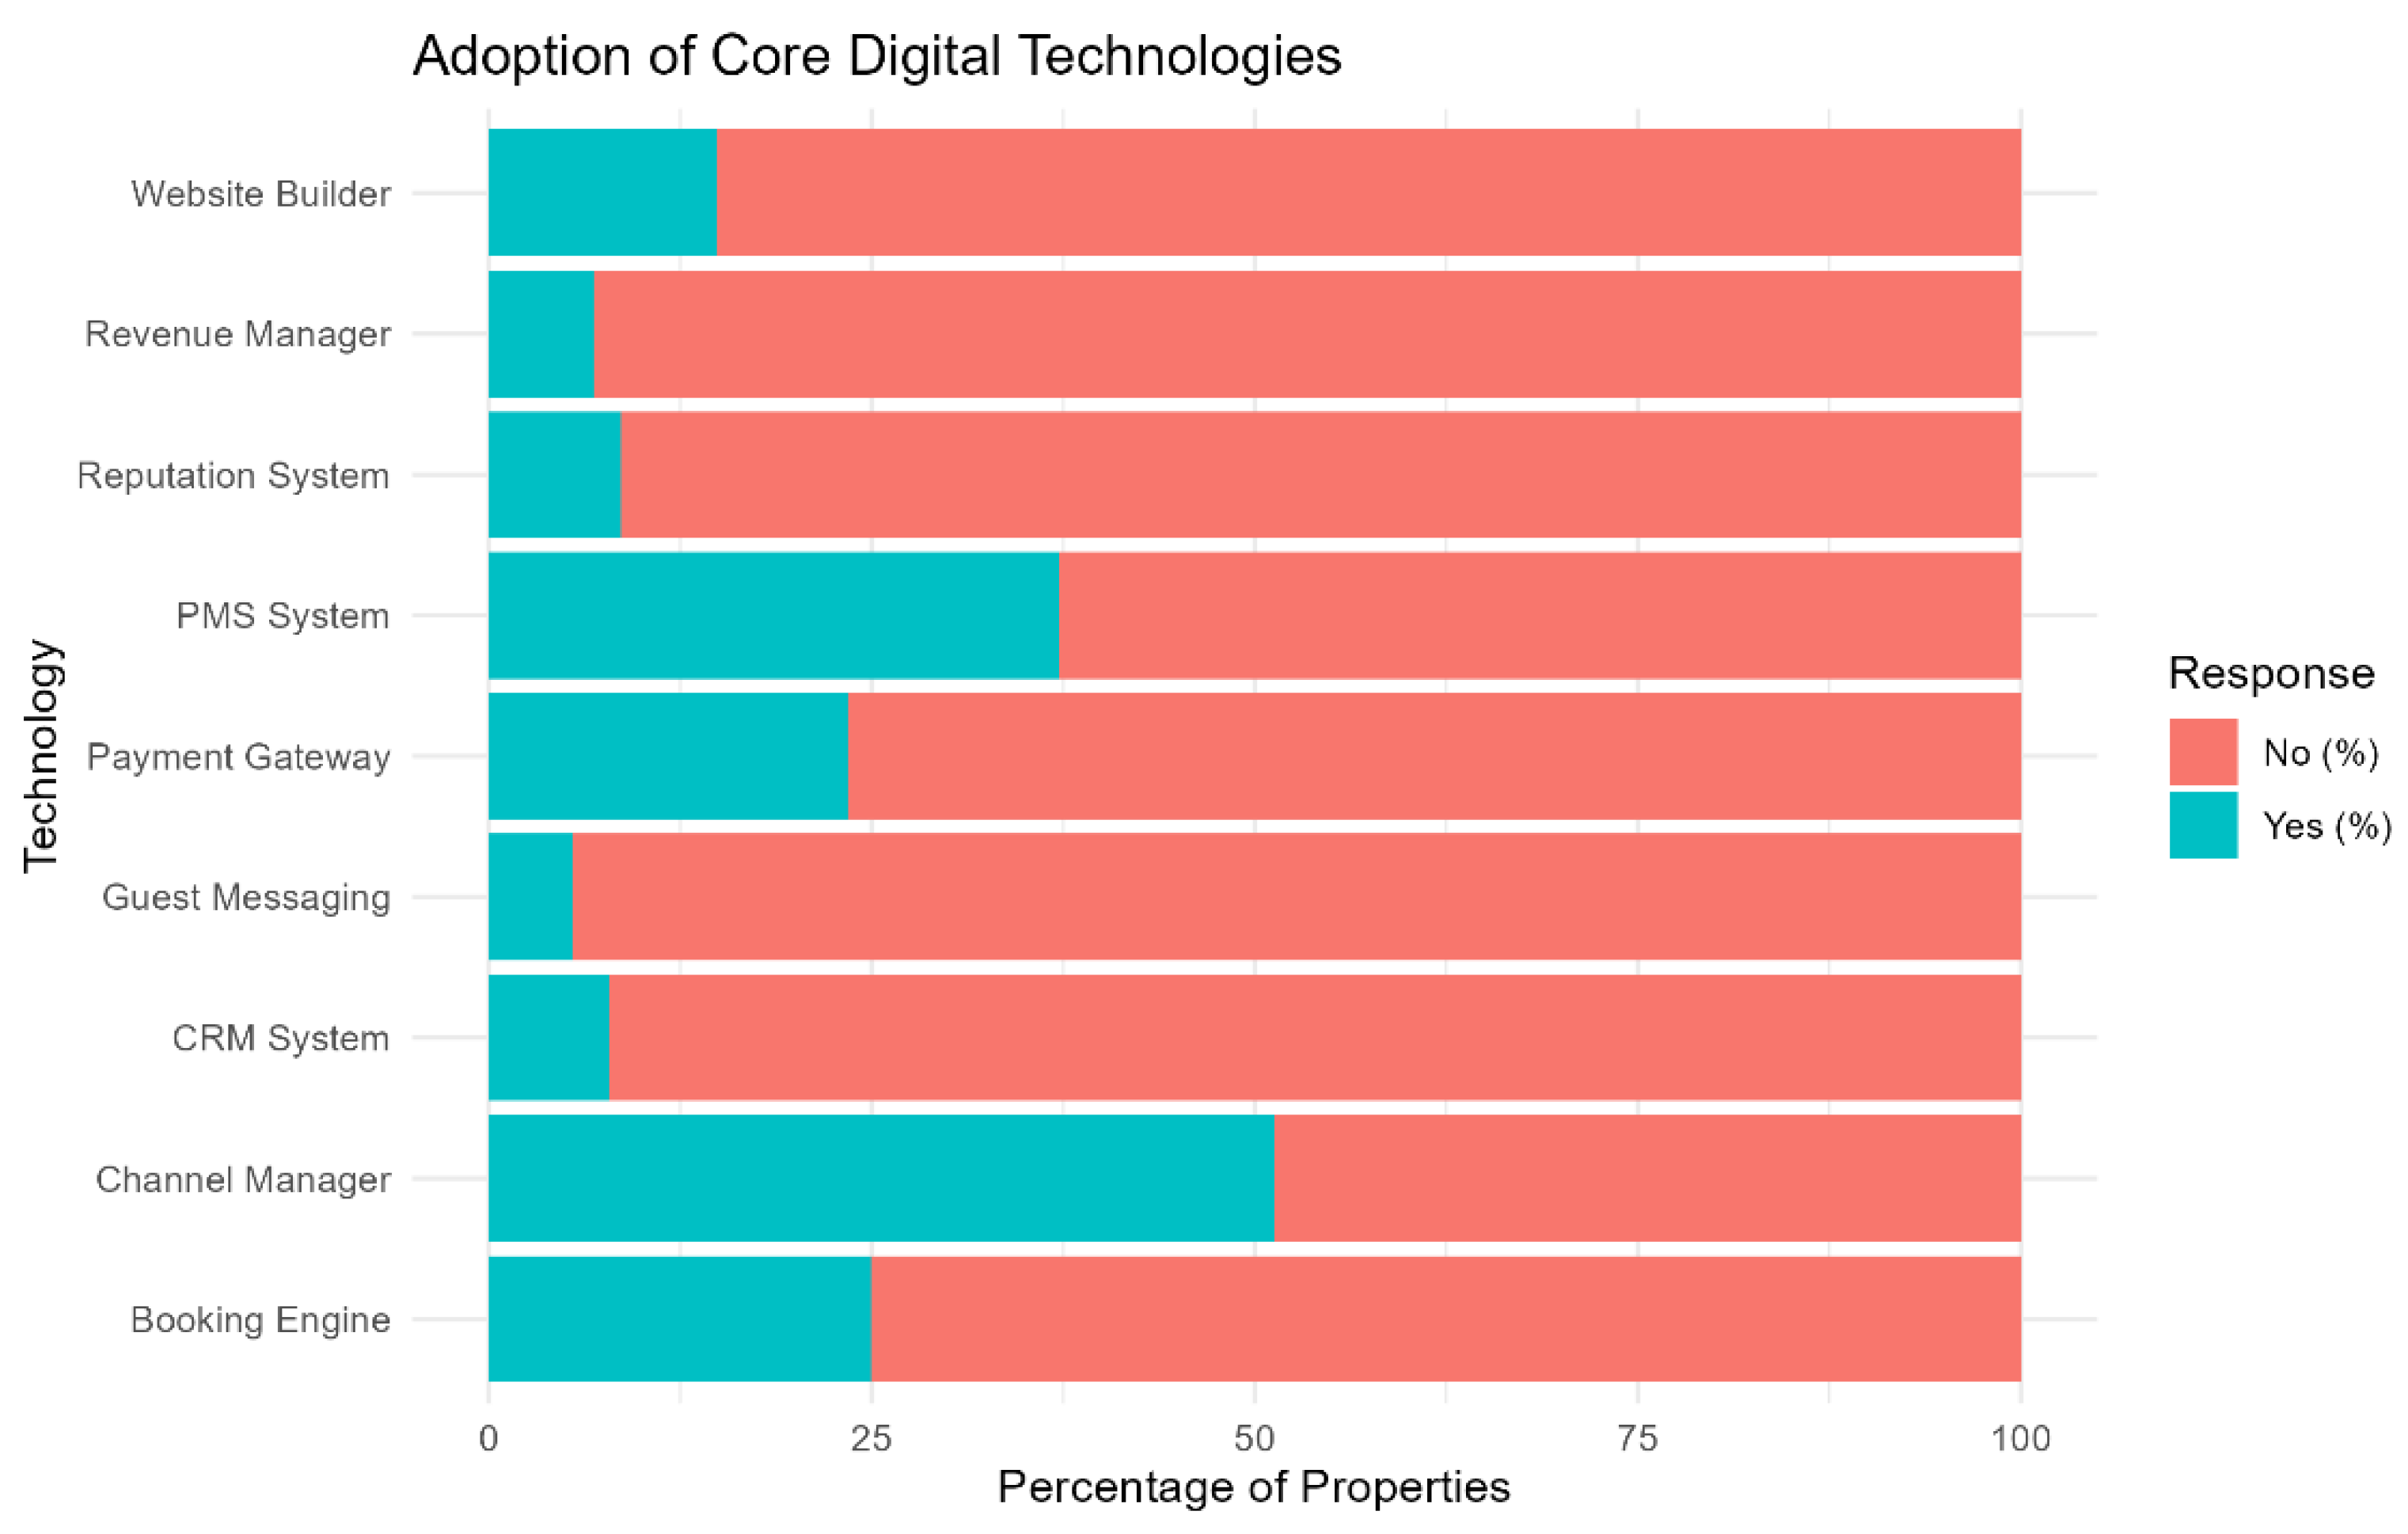
Figure 3.
The adoption of AI and Smart Technology.
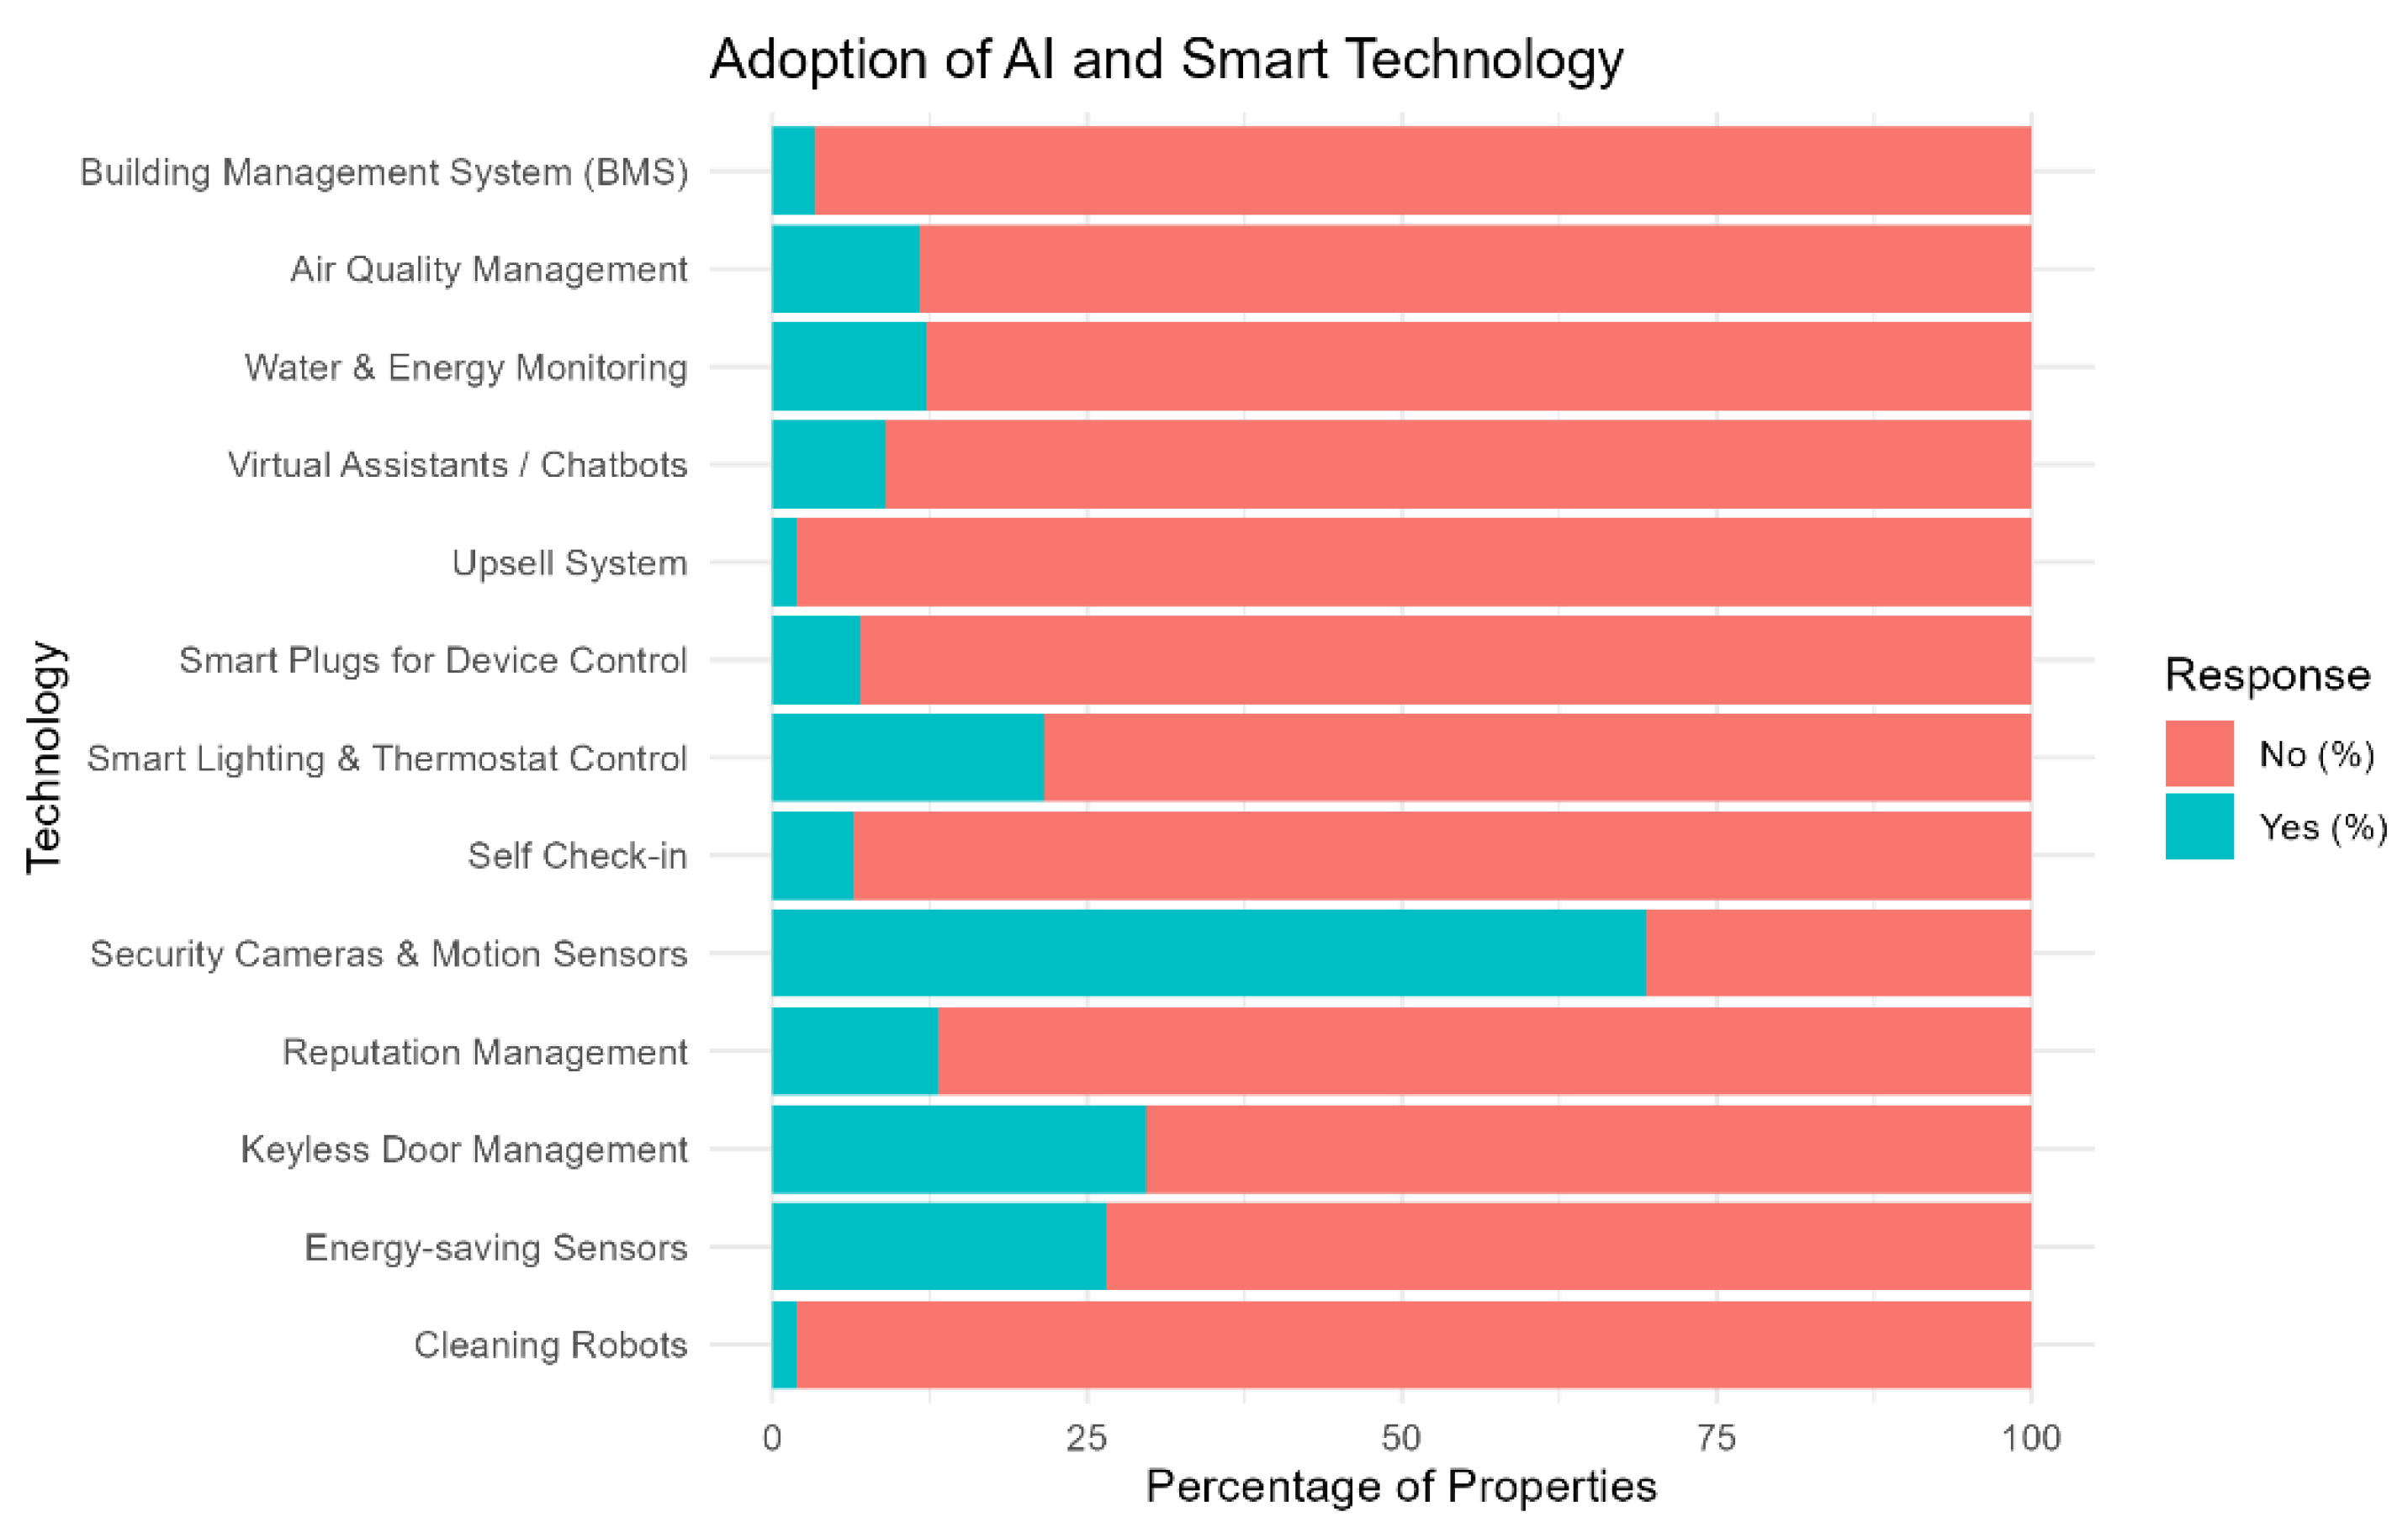
Figure 4.
Perceived Benefits of AI and Smart Technology.
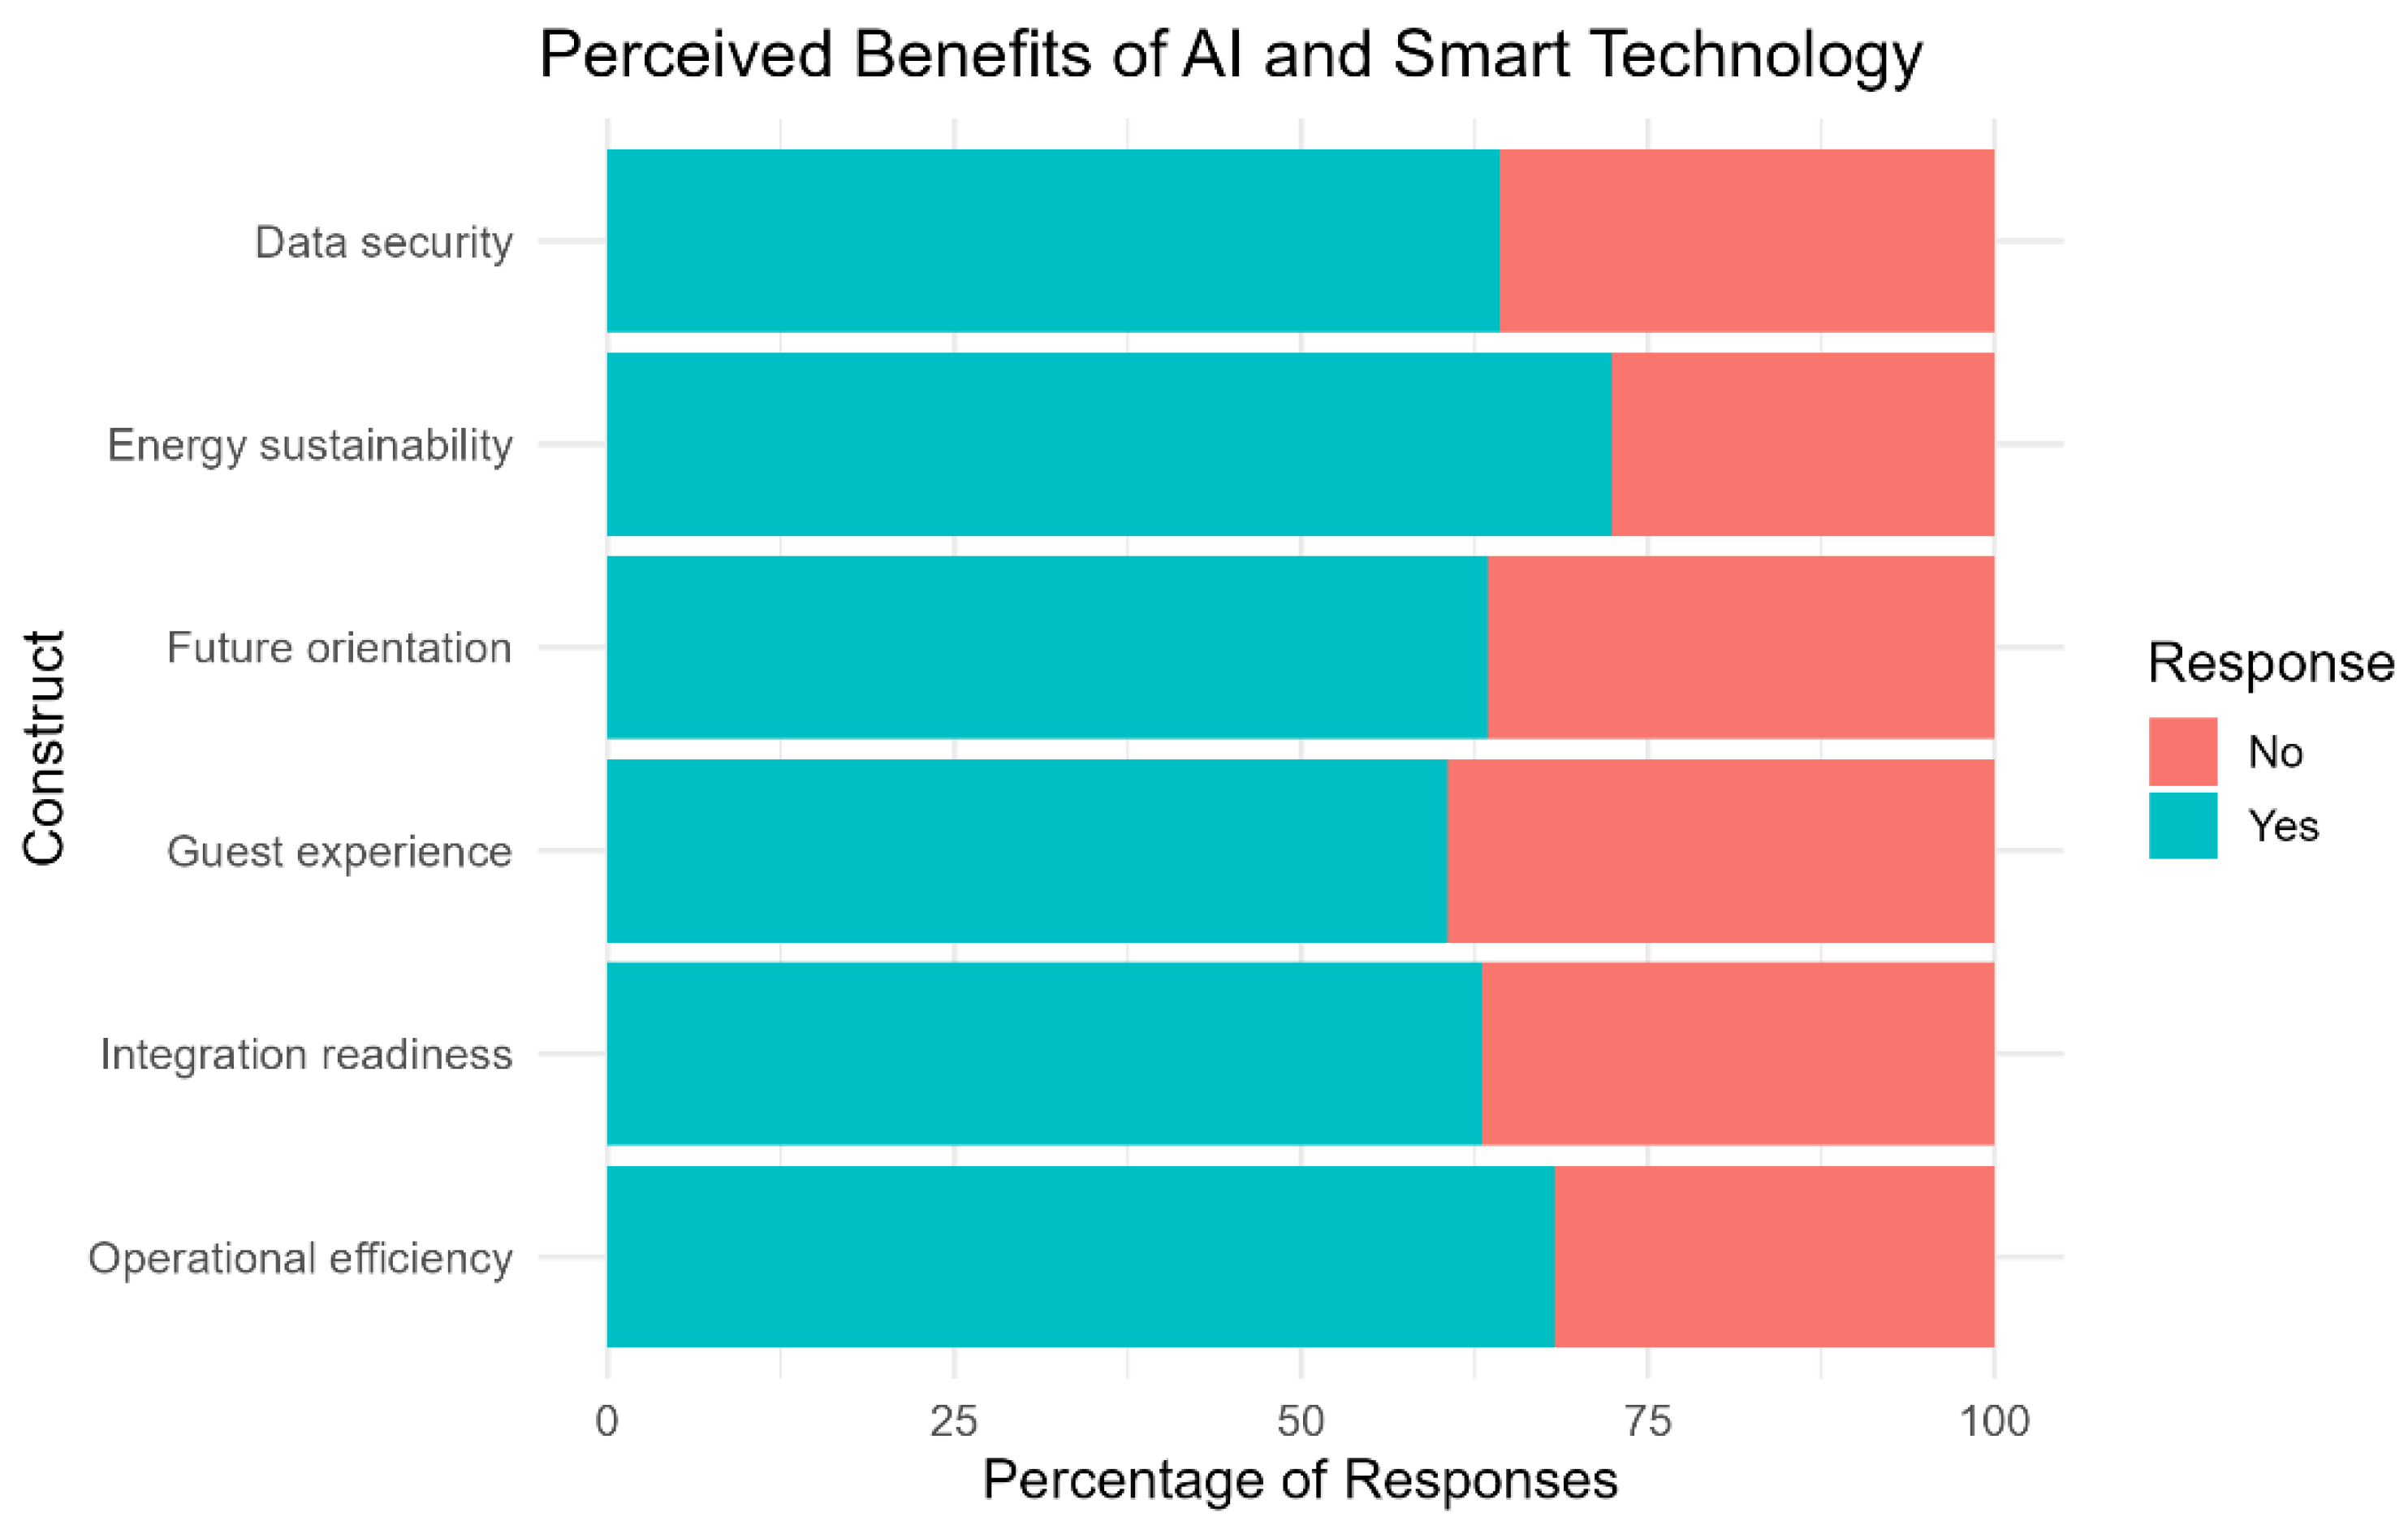
Figure 5.
Perceived Barriers to AI and Smart Technology.
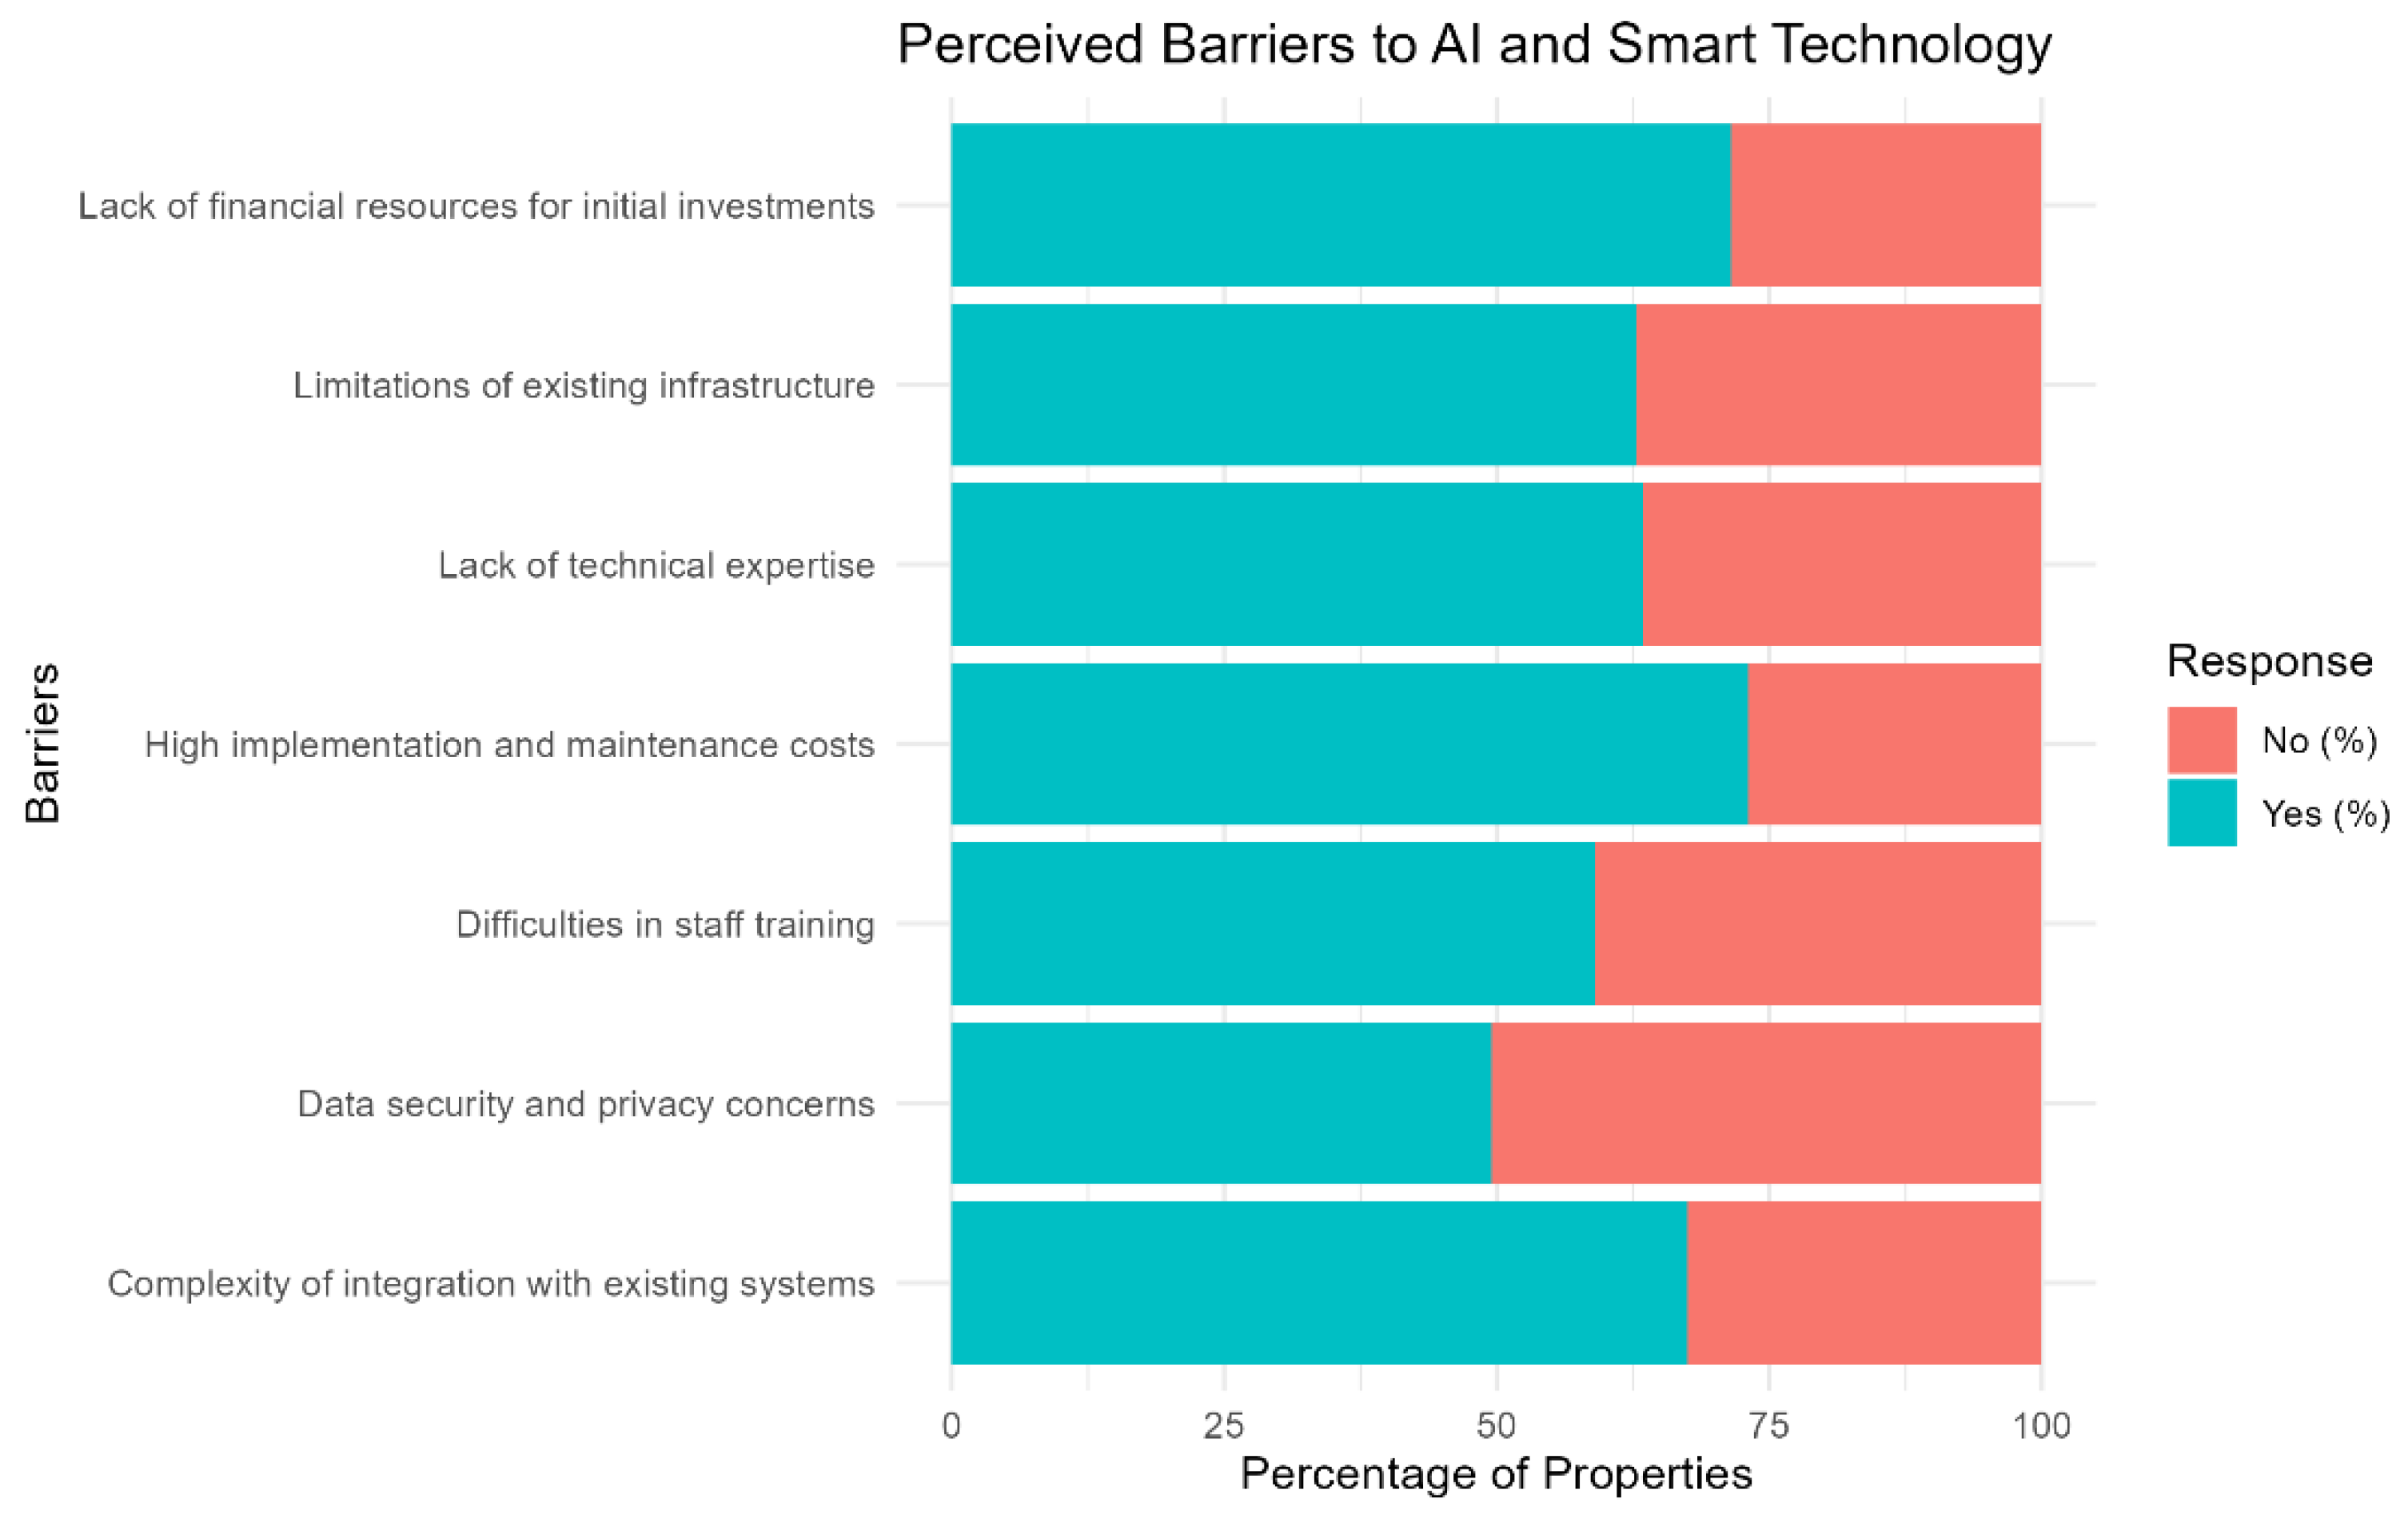
Figure 6.
EFA Scree Plot.
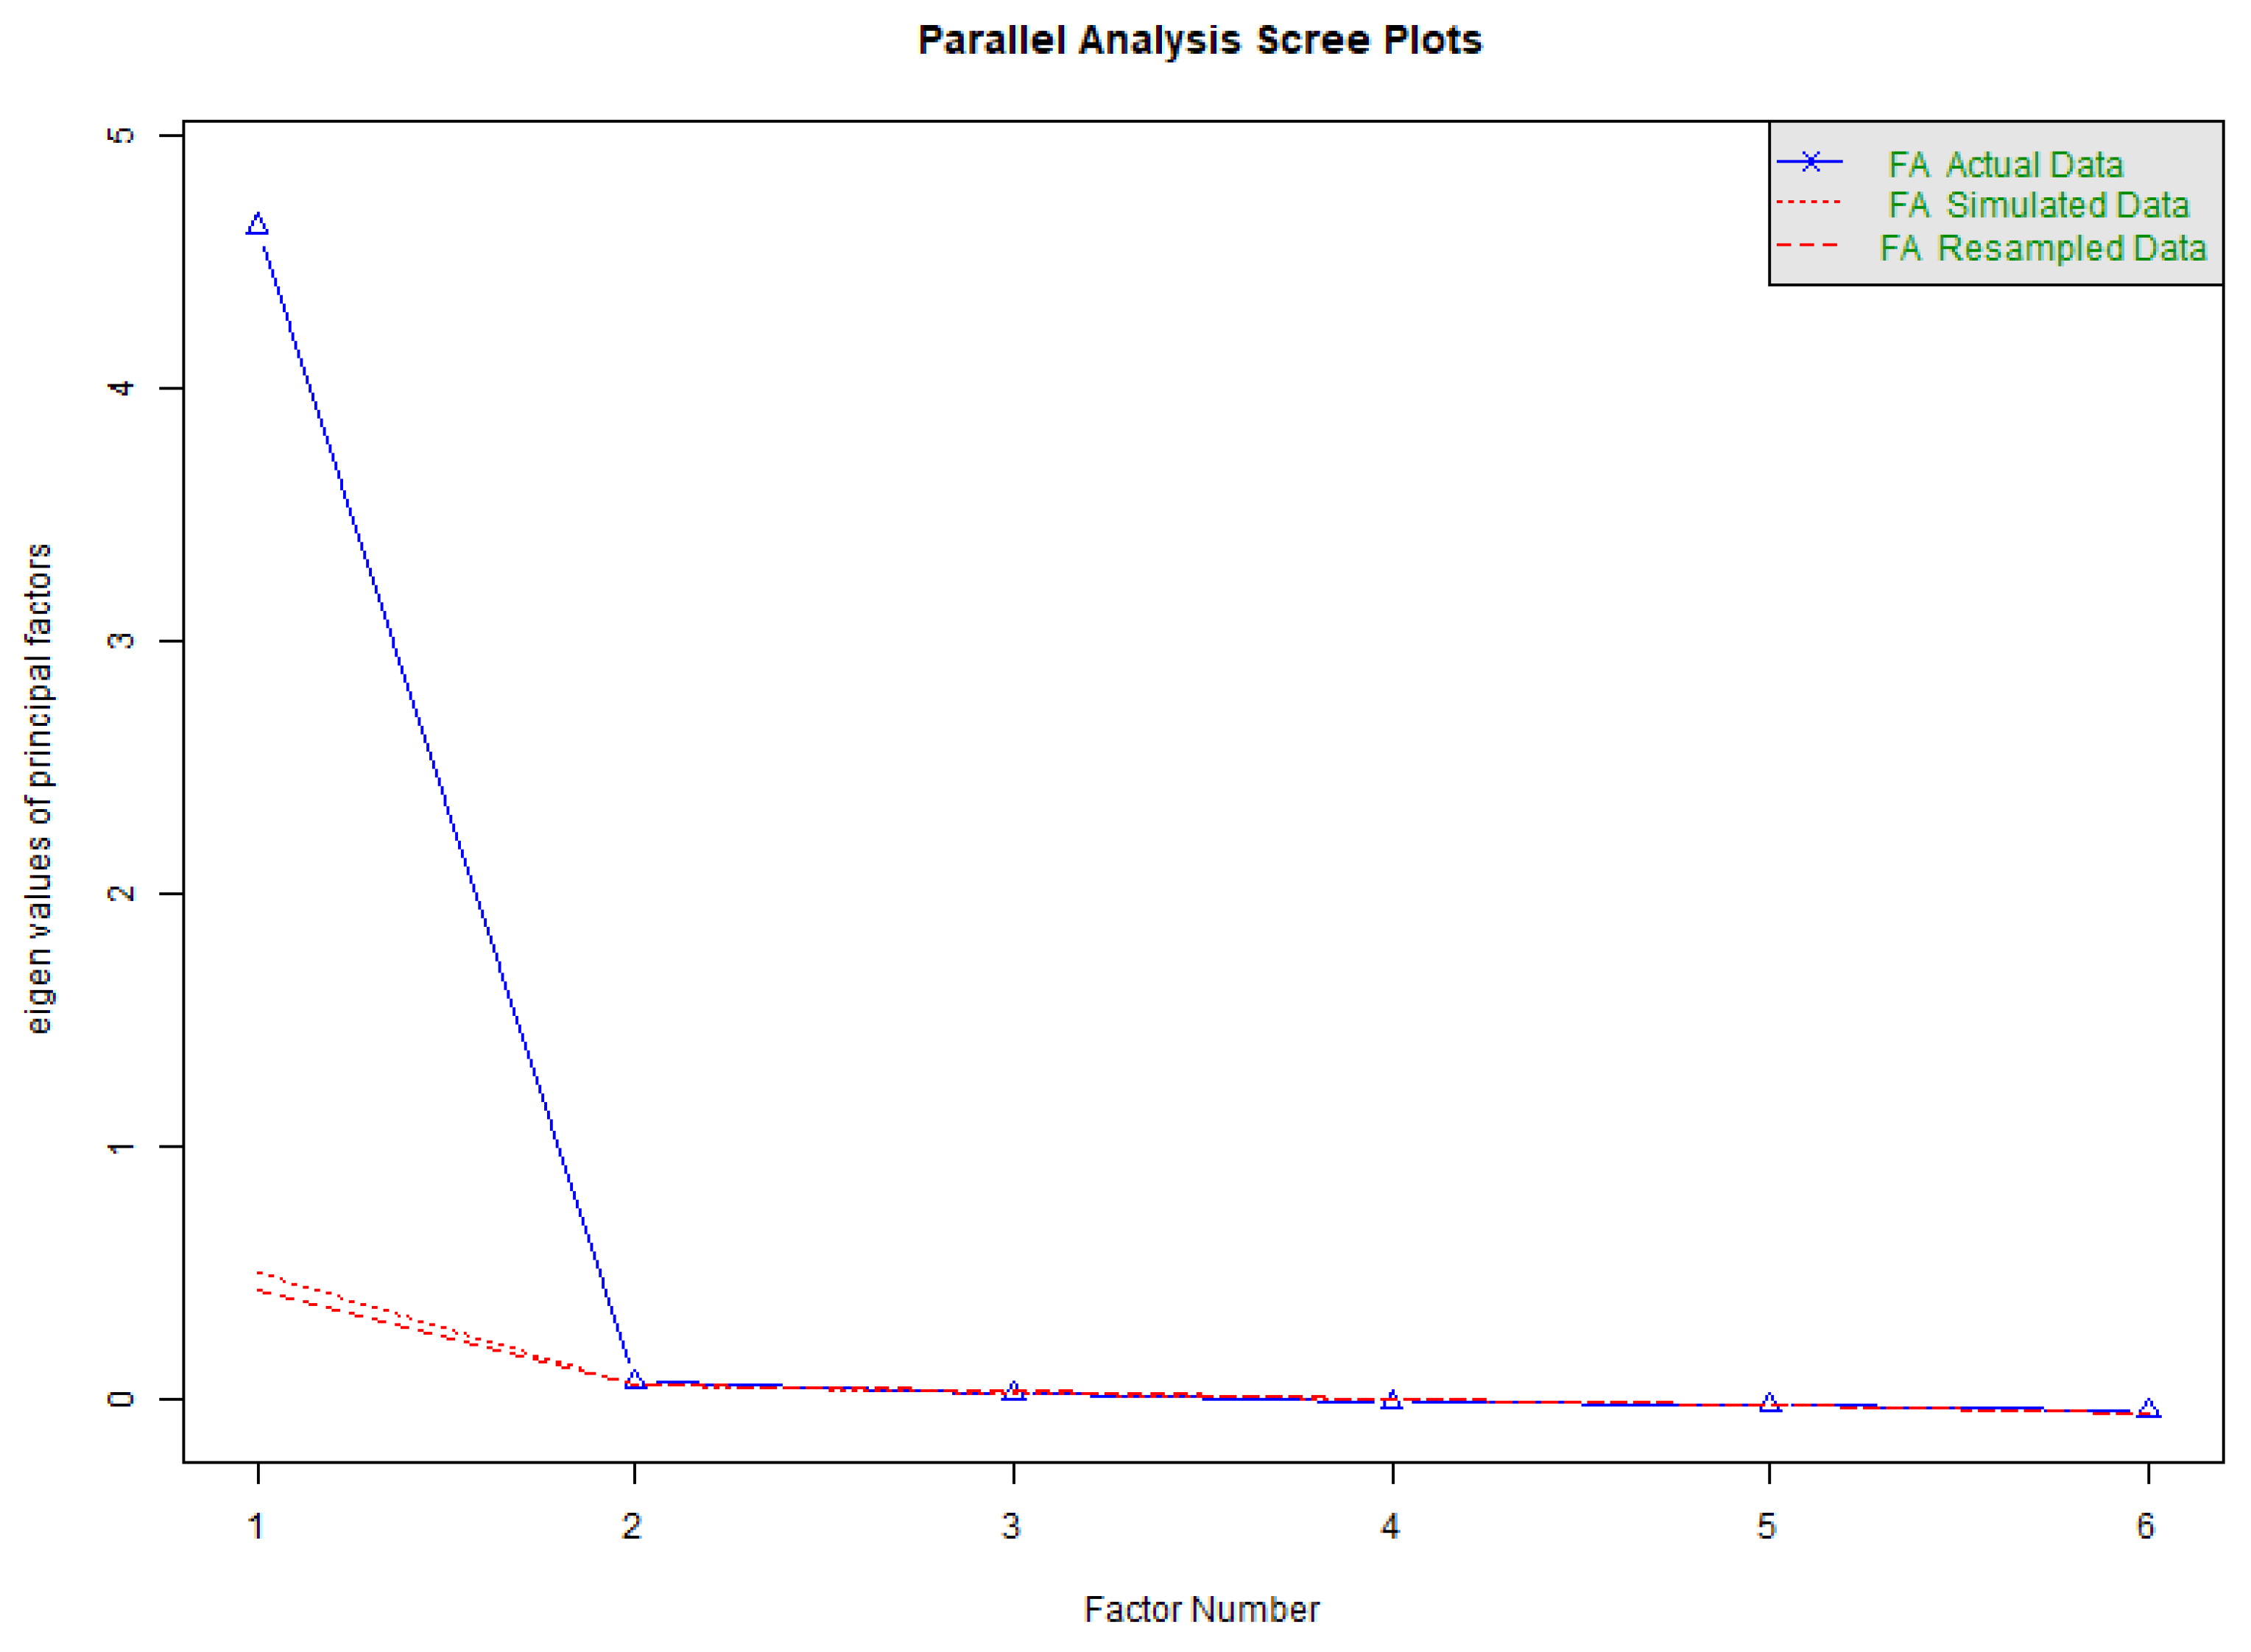
Figure 7.
Residual Correlation Matrix for Items P35–P40 After Exploratory Factor Analysis.
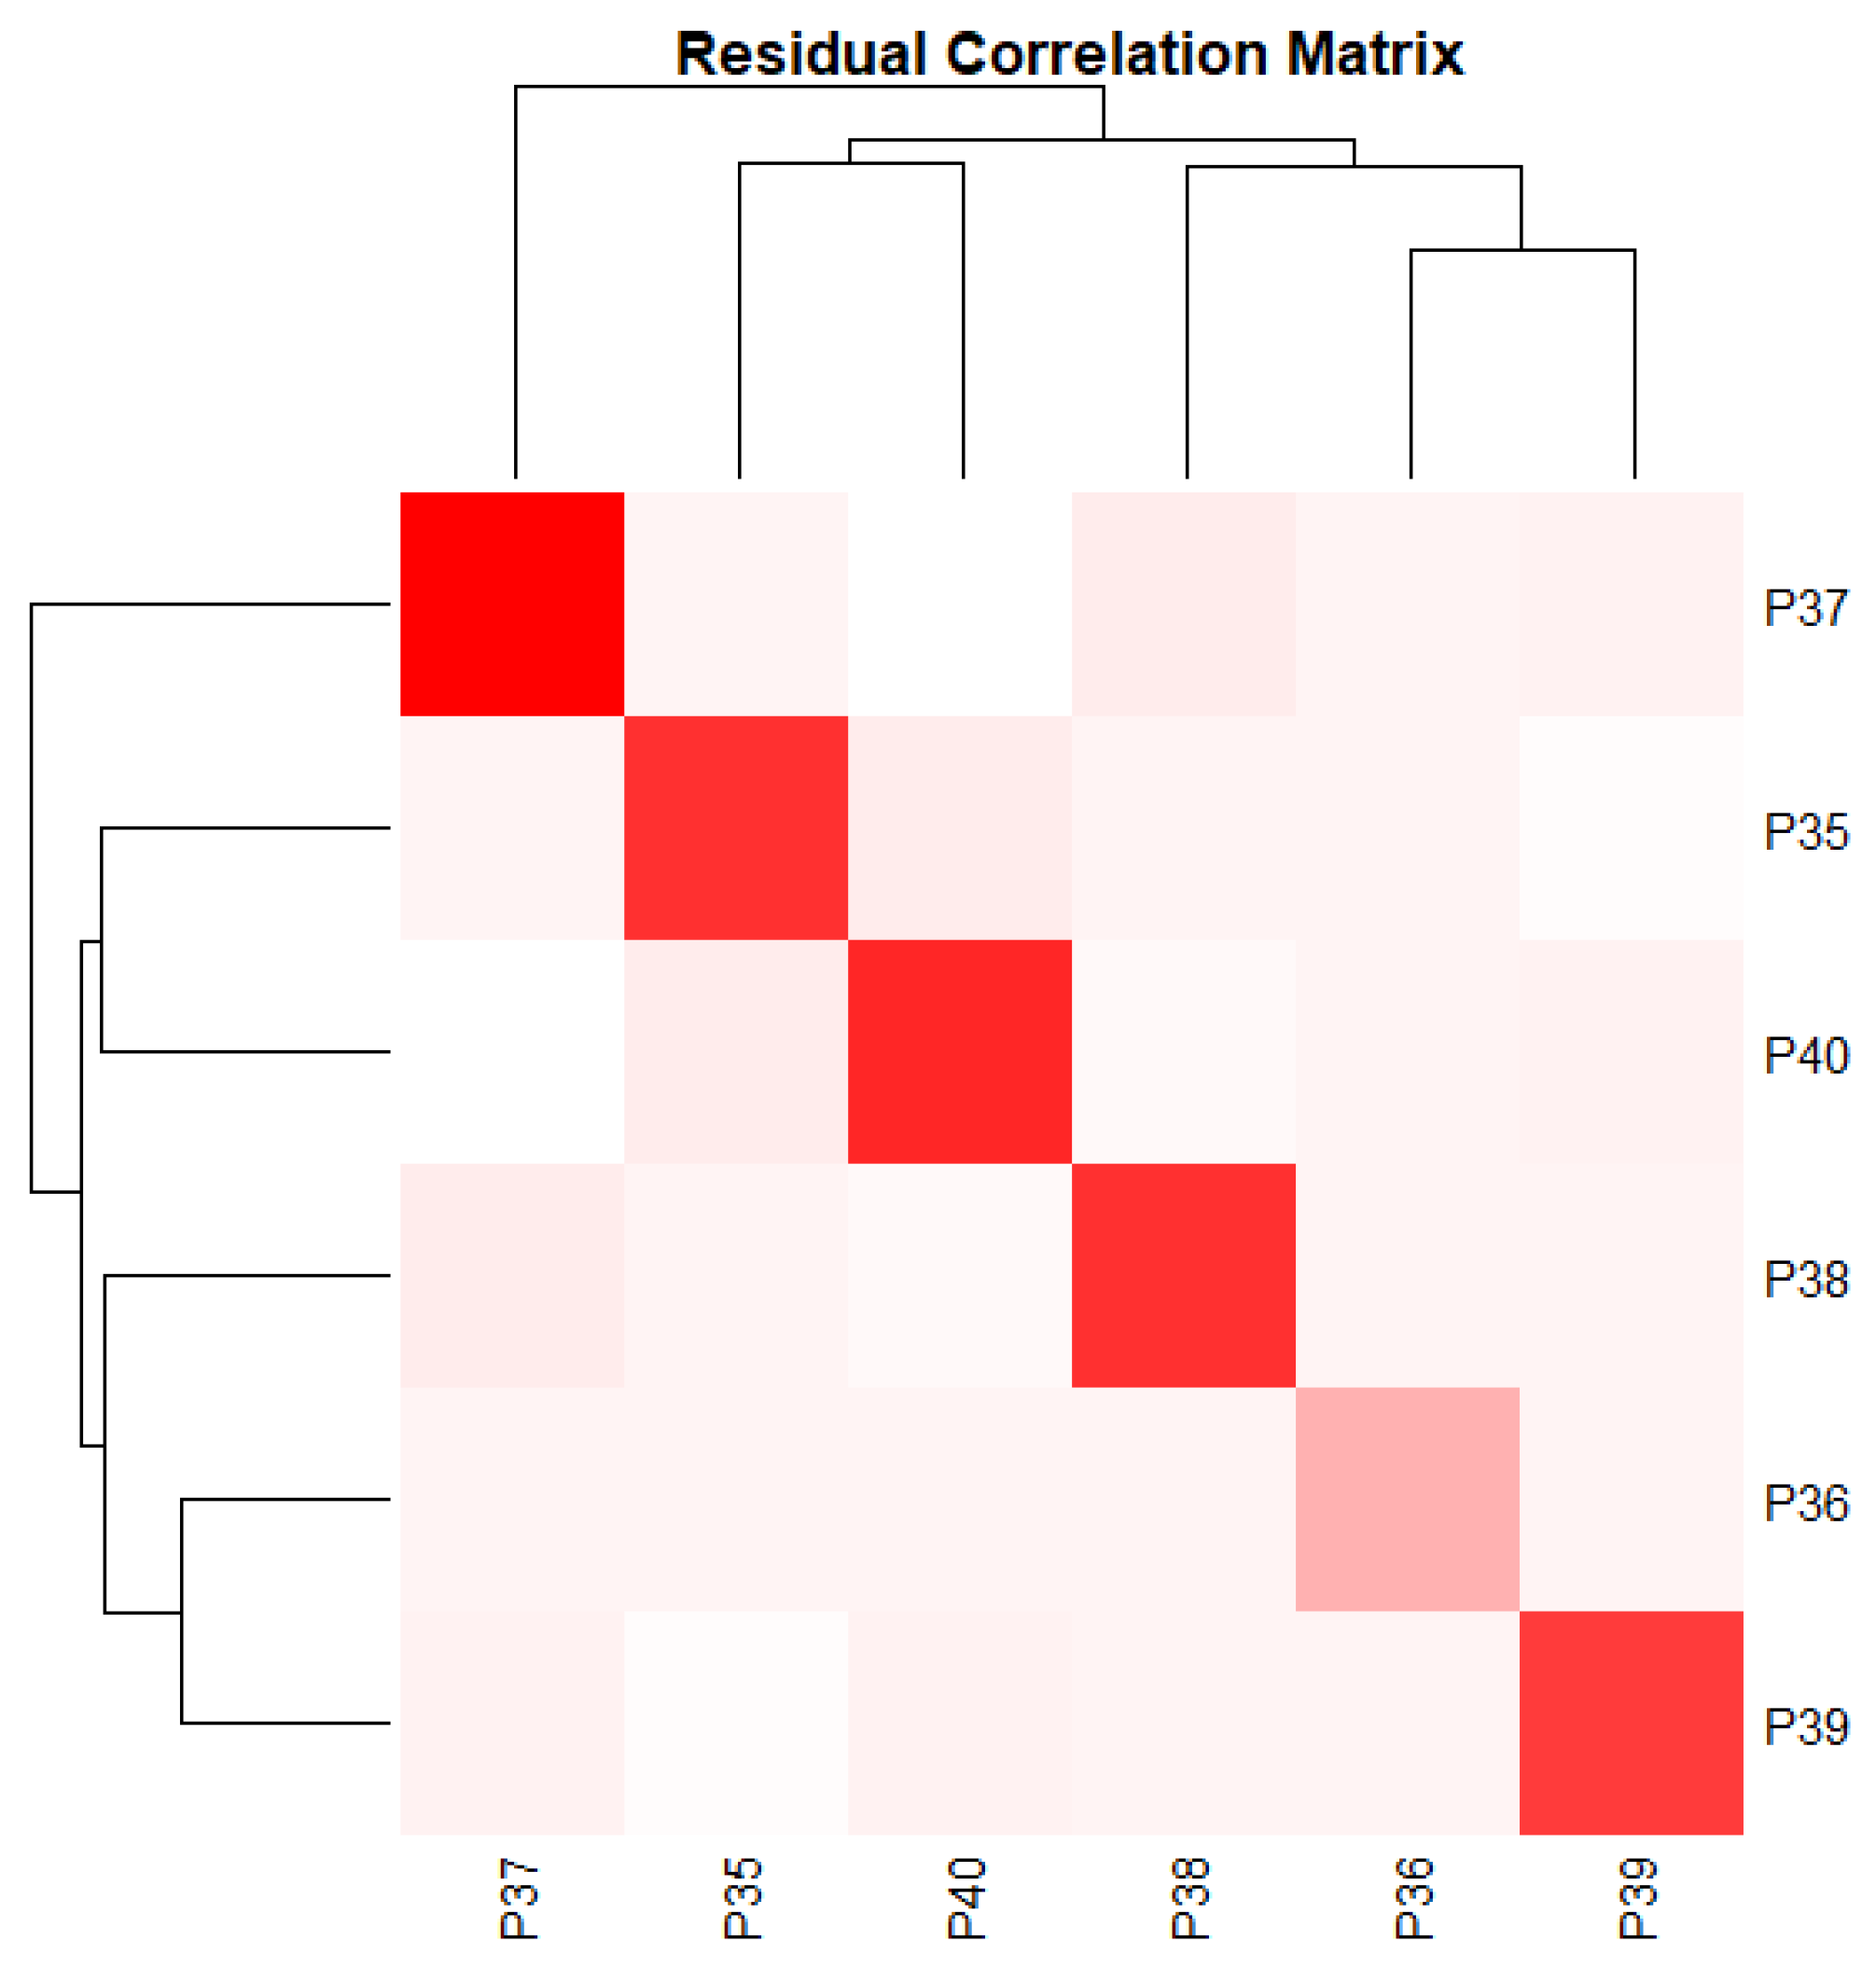
Figure 8.
Correlation Heatmap of Items P35–P40 Supporting the Two-Factor Readiness Structure.
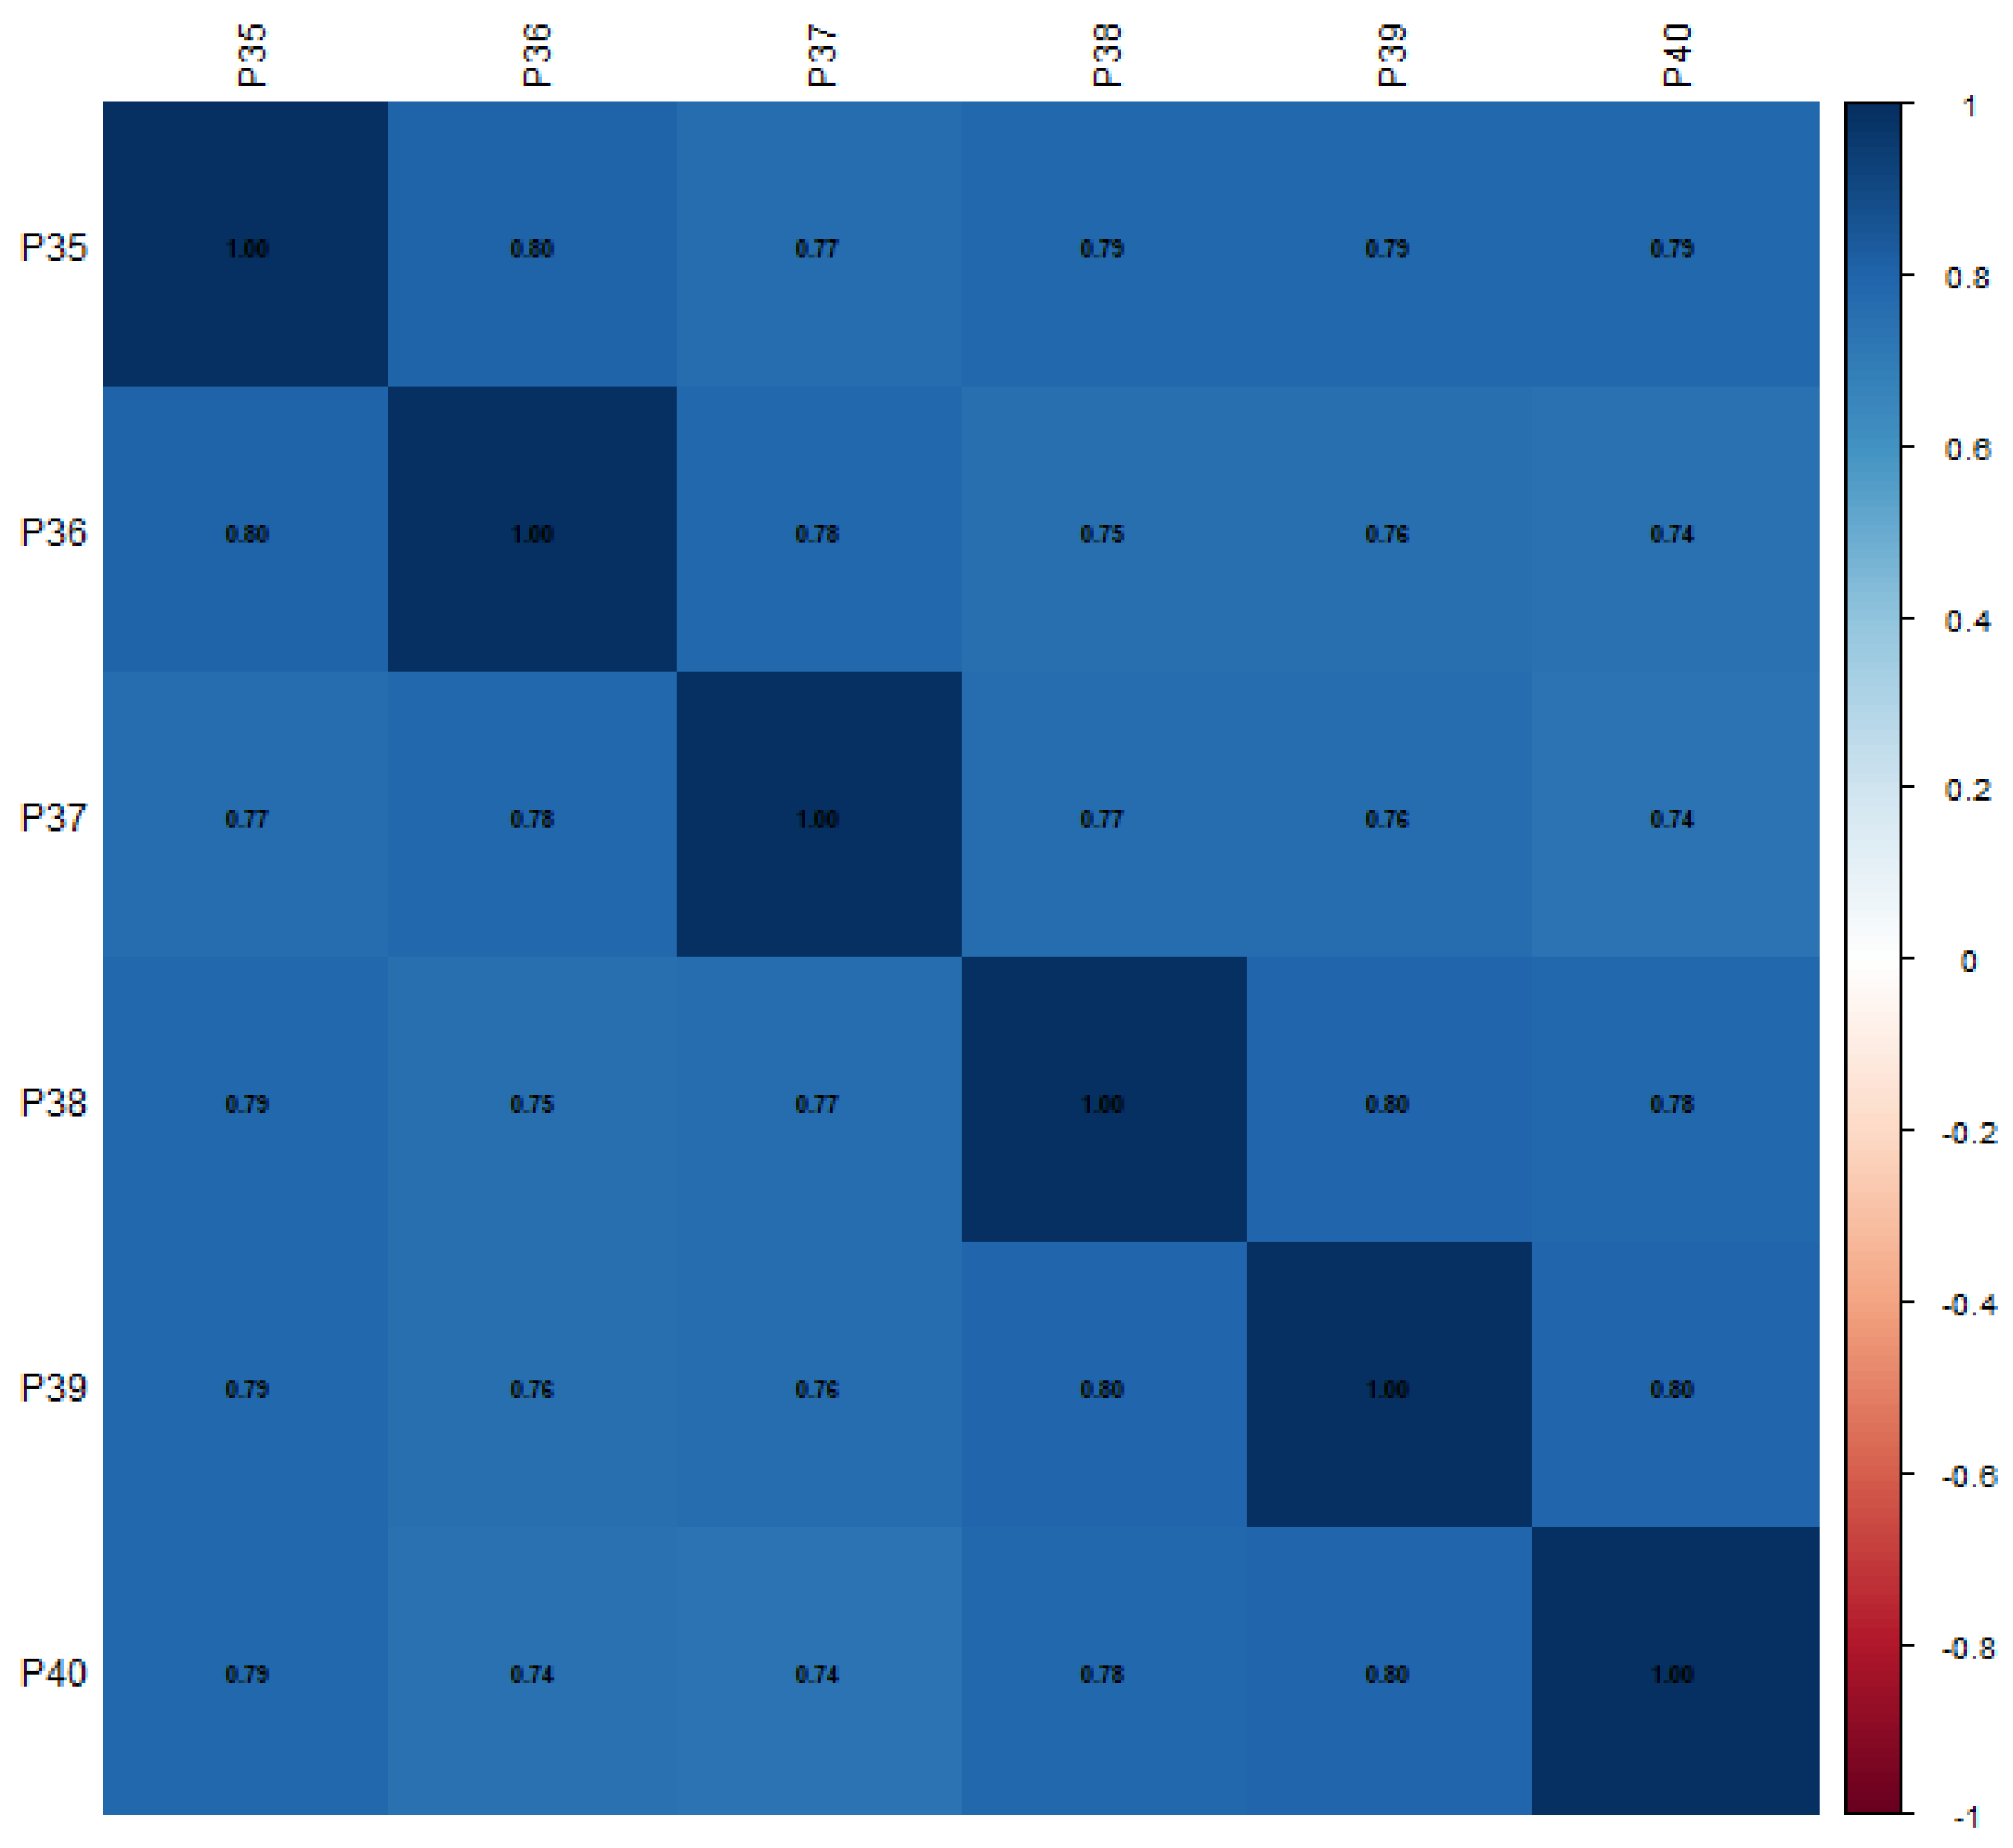
Figure 9.
Elbow Method to Determine Optimal Number of Clusters Based on Readiness Dimensions.
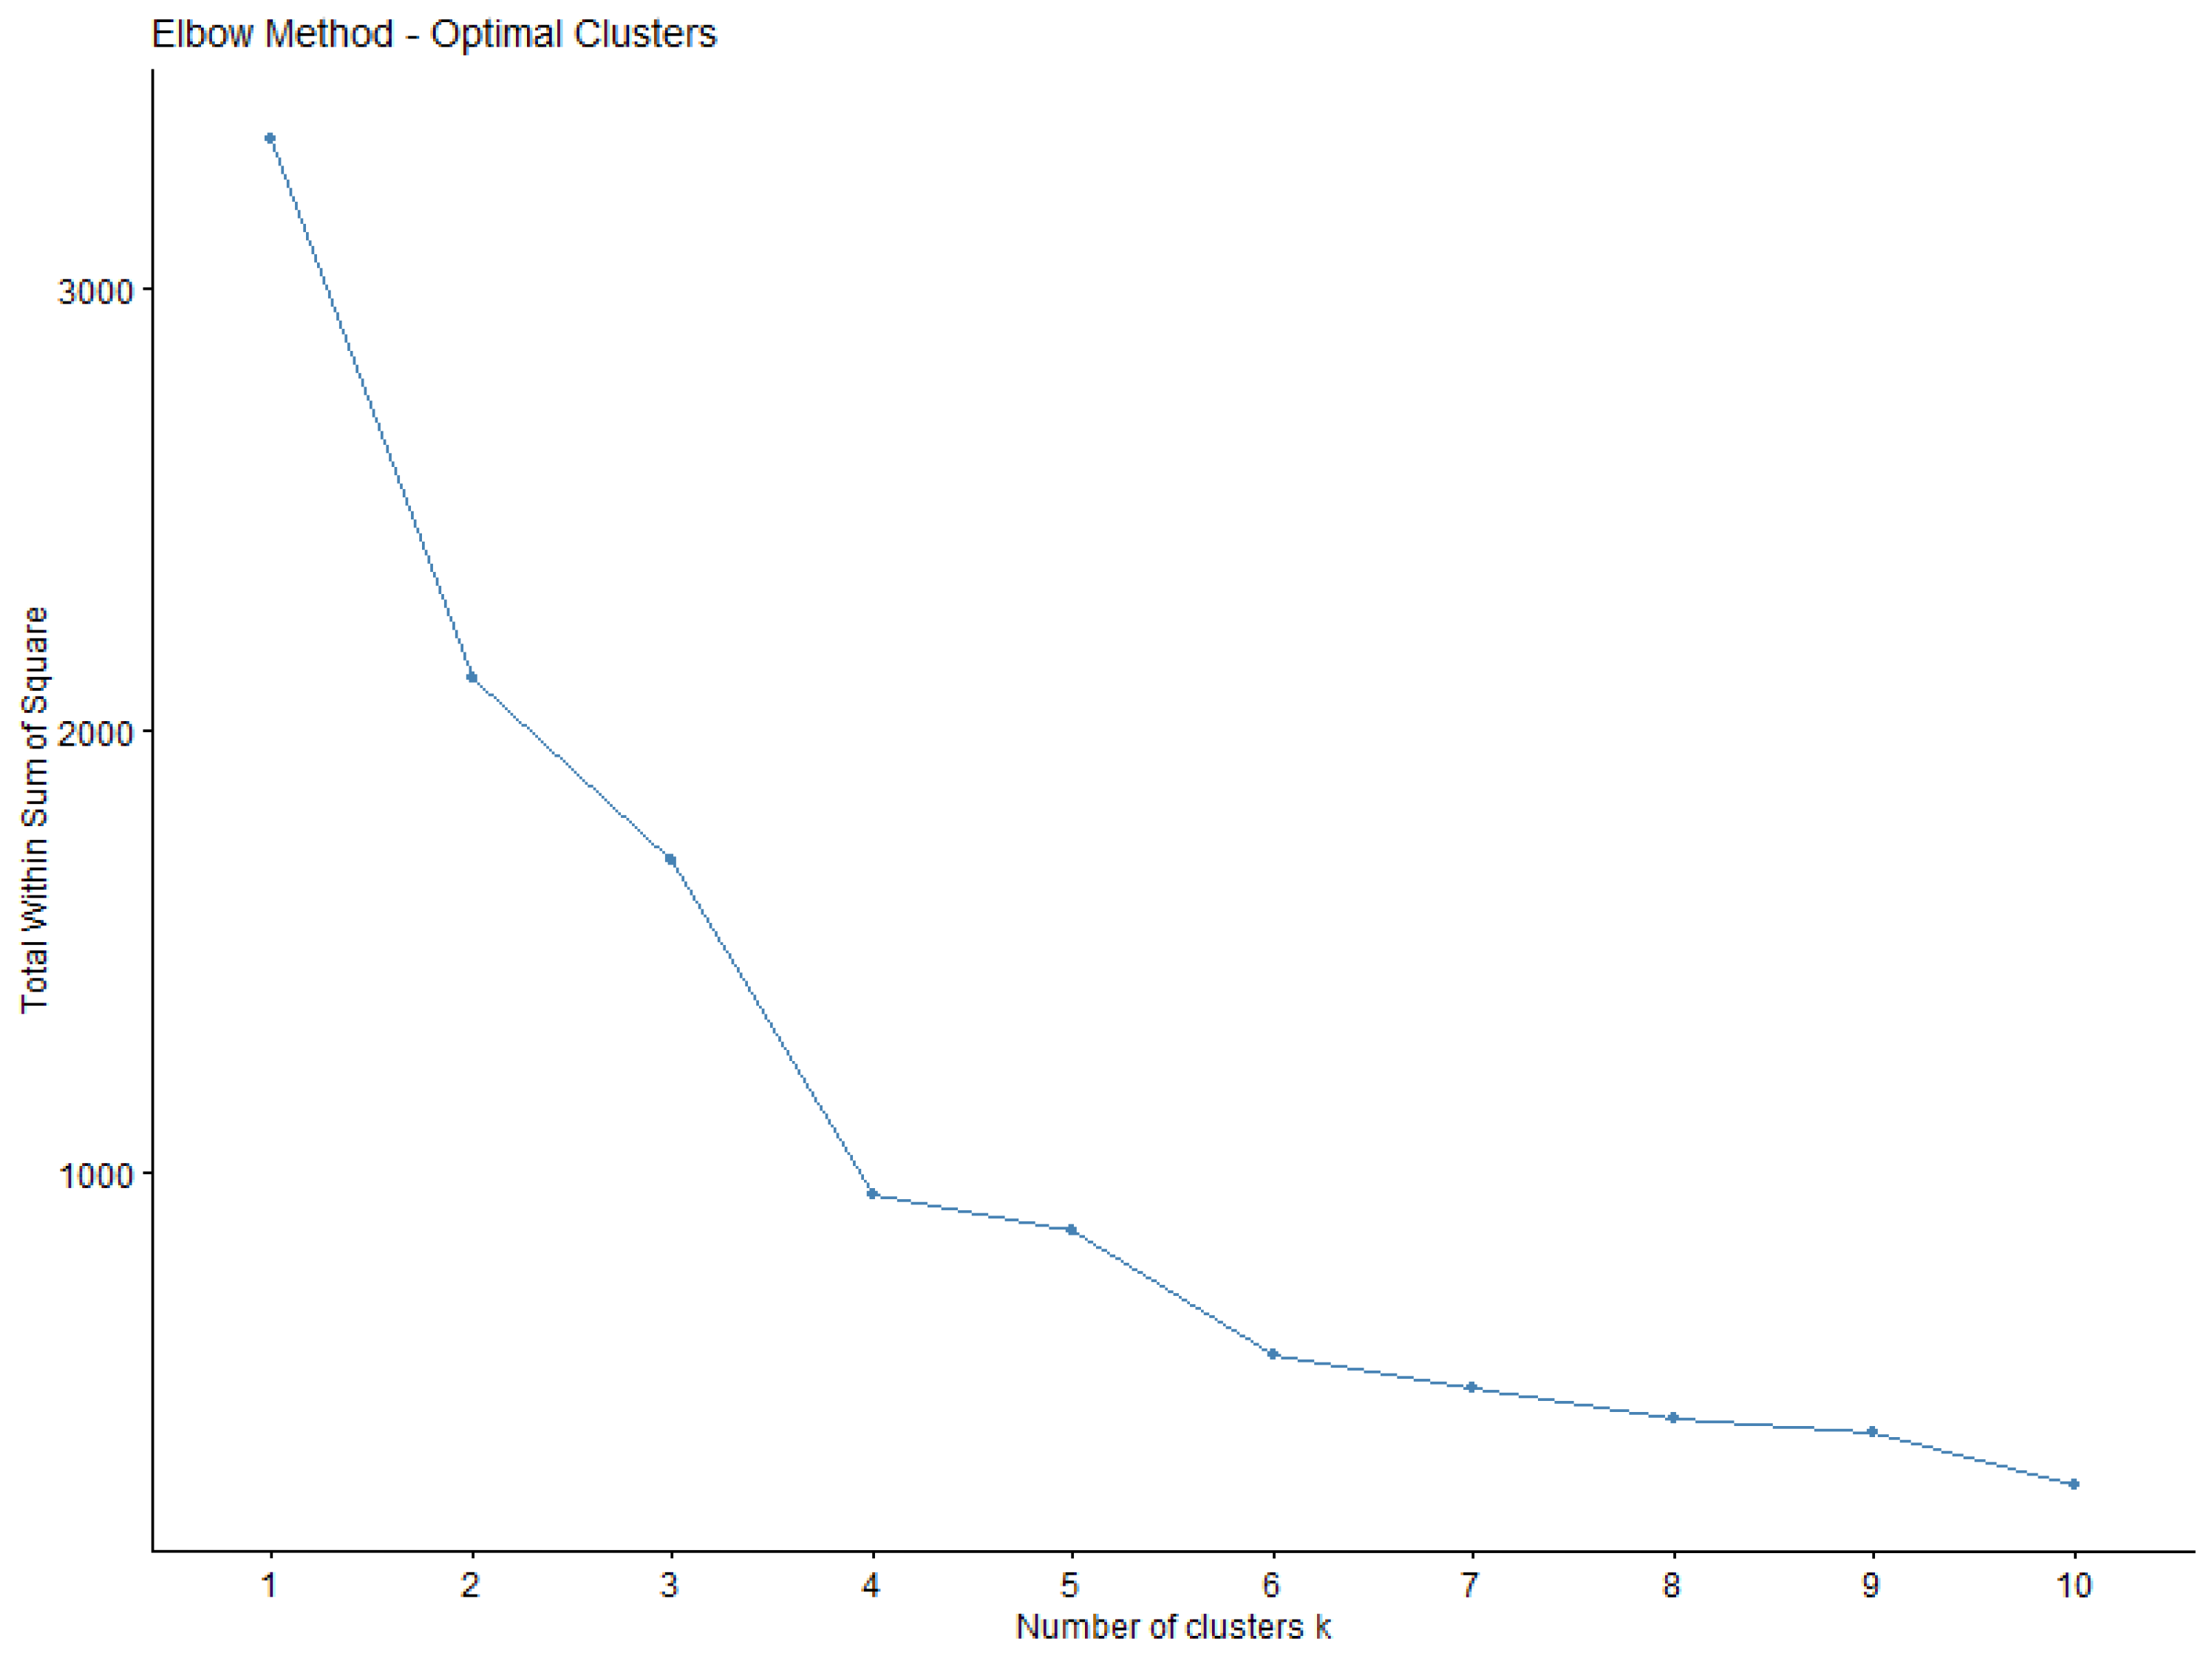
Figure 10.
Silhouette Analysis to Determine Optimal Number of Clusters Based on Readiness Dimensions.
Figure 10.
Silhouette Analysis to Determine Optimal Number of Clusters Based on Readiness Dimensions.
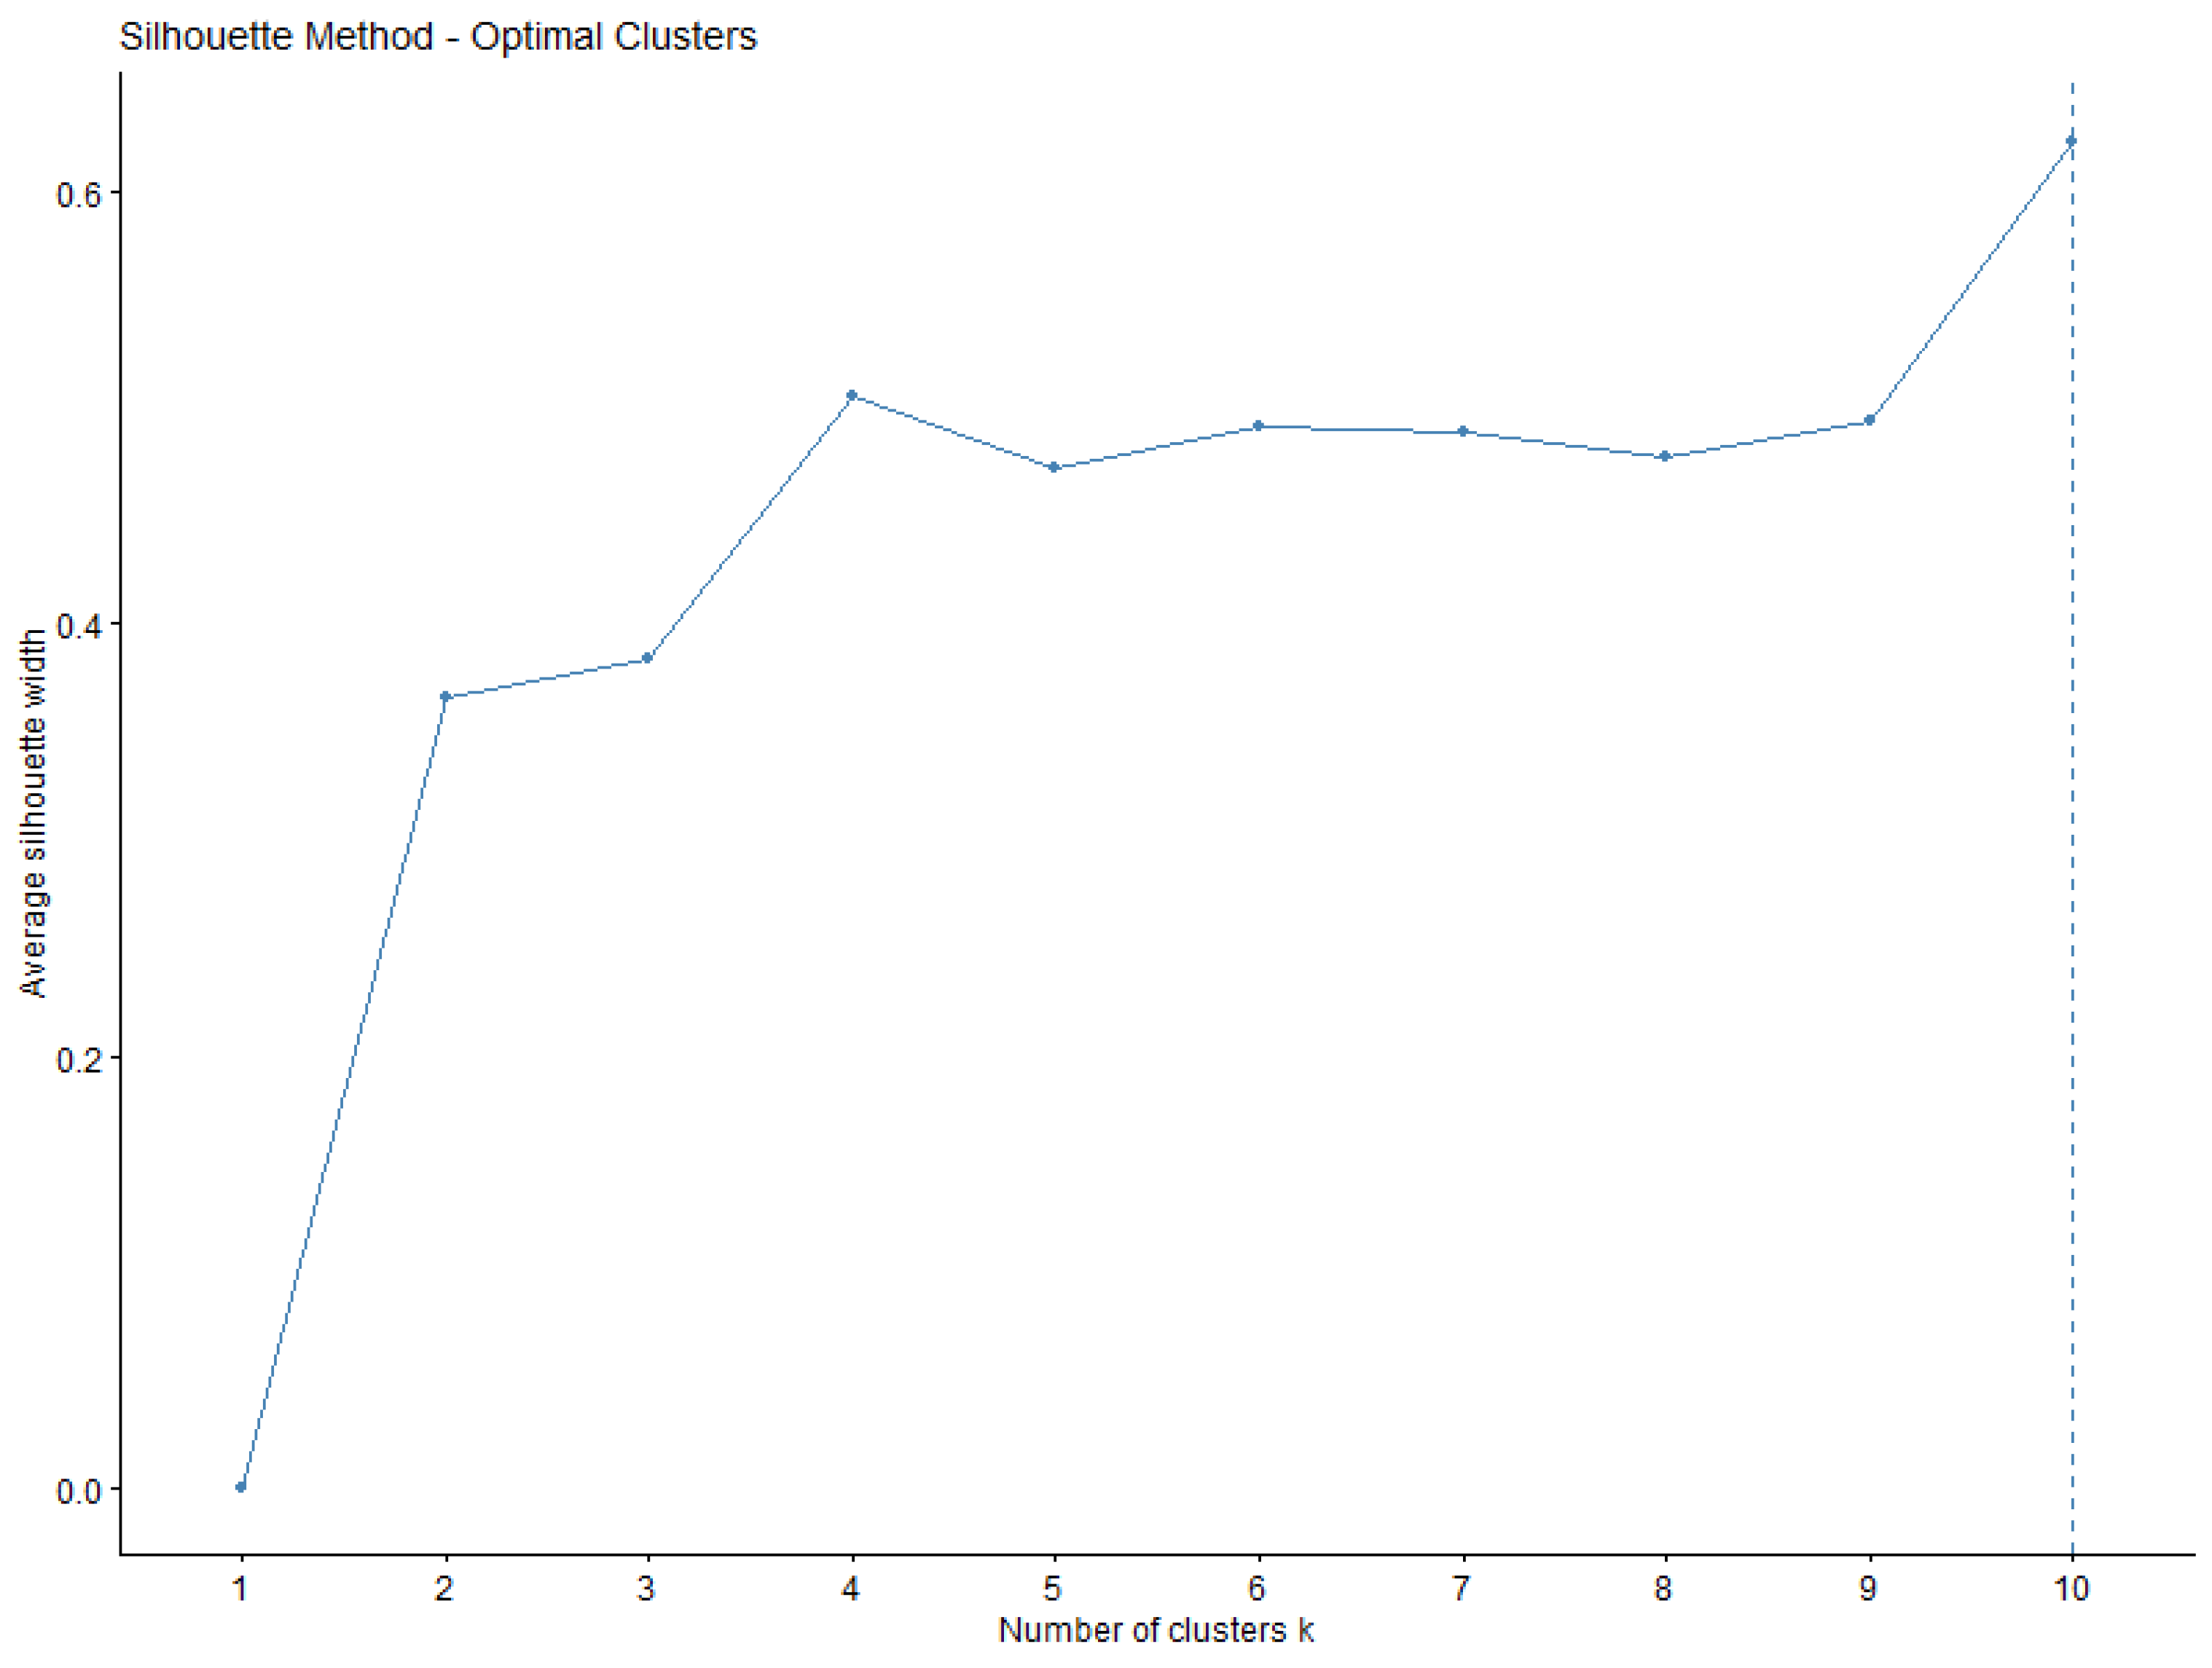
Figure 11.
Gap Statistic for Determining the Optimal Number of Clusters Based on Readiness Dimensions.
Figure 11.
Gap Statistic for Determining the Optimal Number of Clusters Based on Readiness Dimensions.
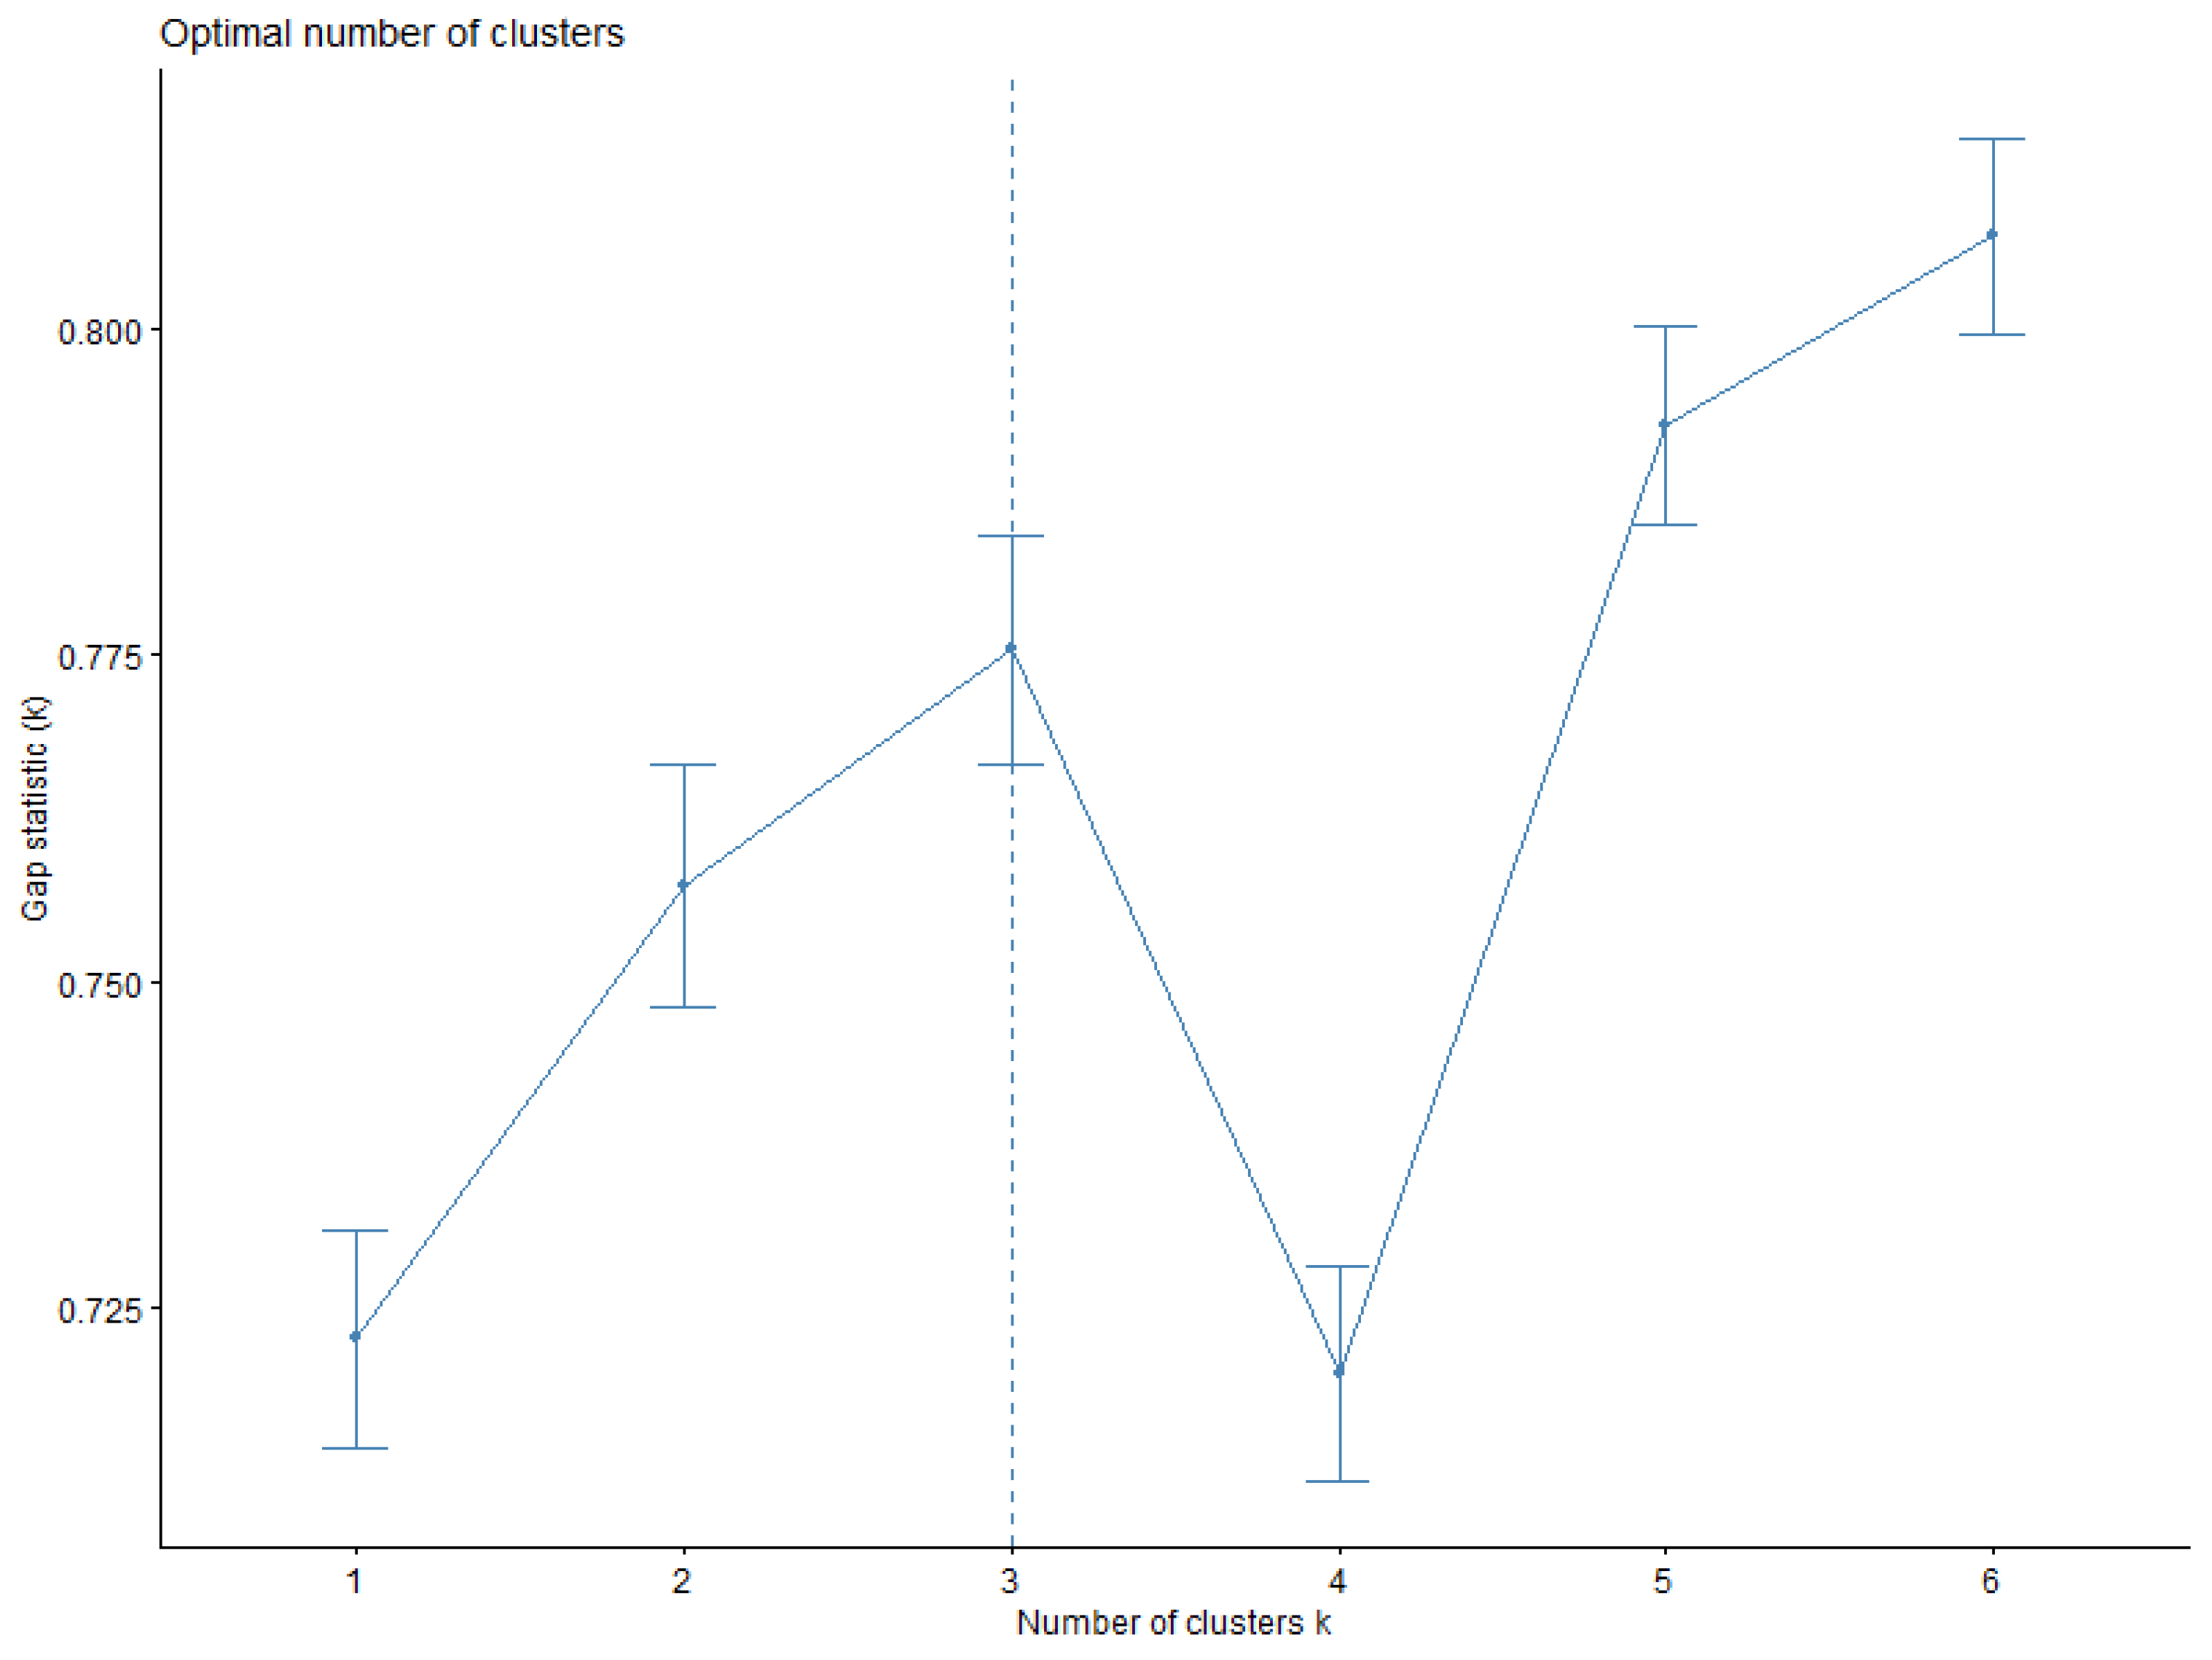
Figure 12.
Heatmap of AI and Smart Technology Adoption Across Identified Adopter Segments.
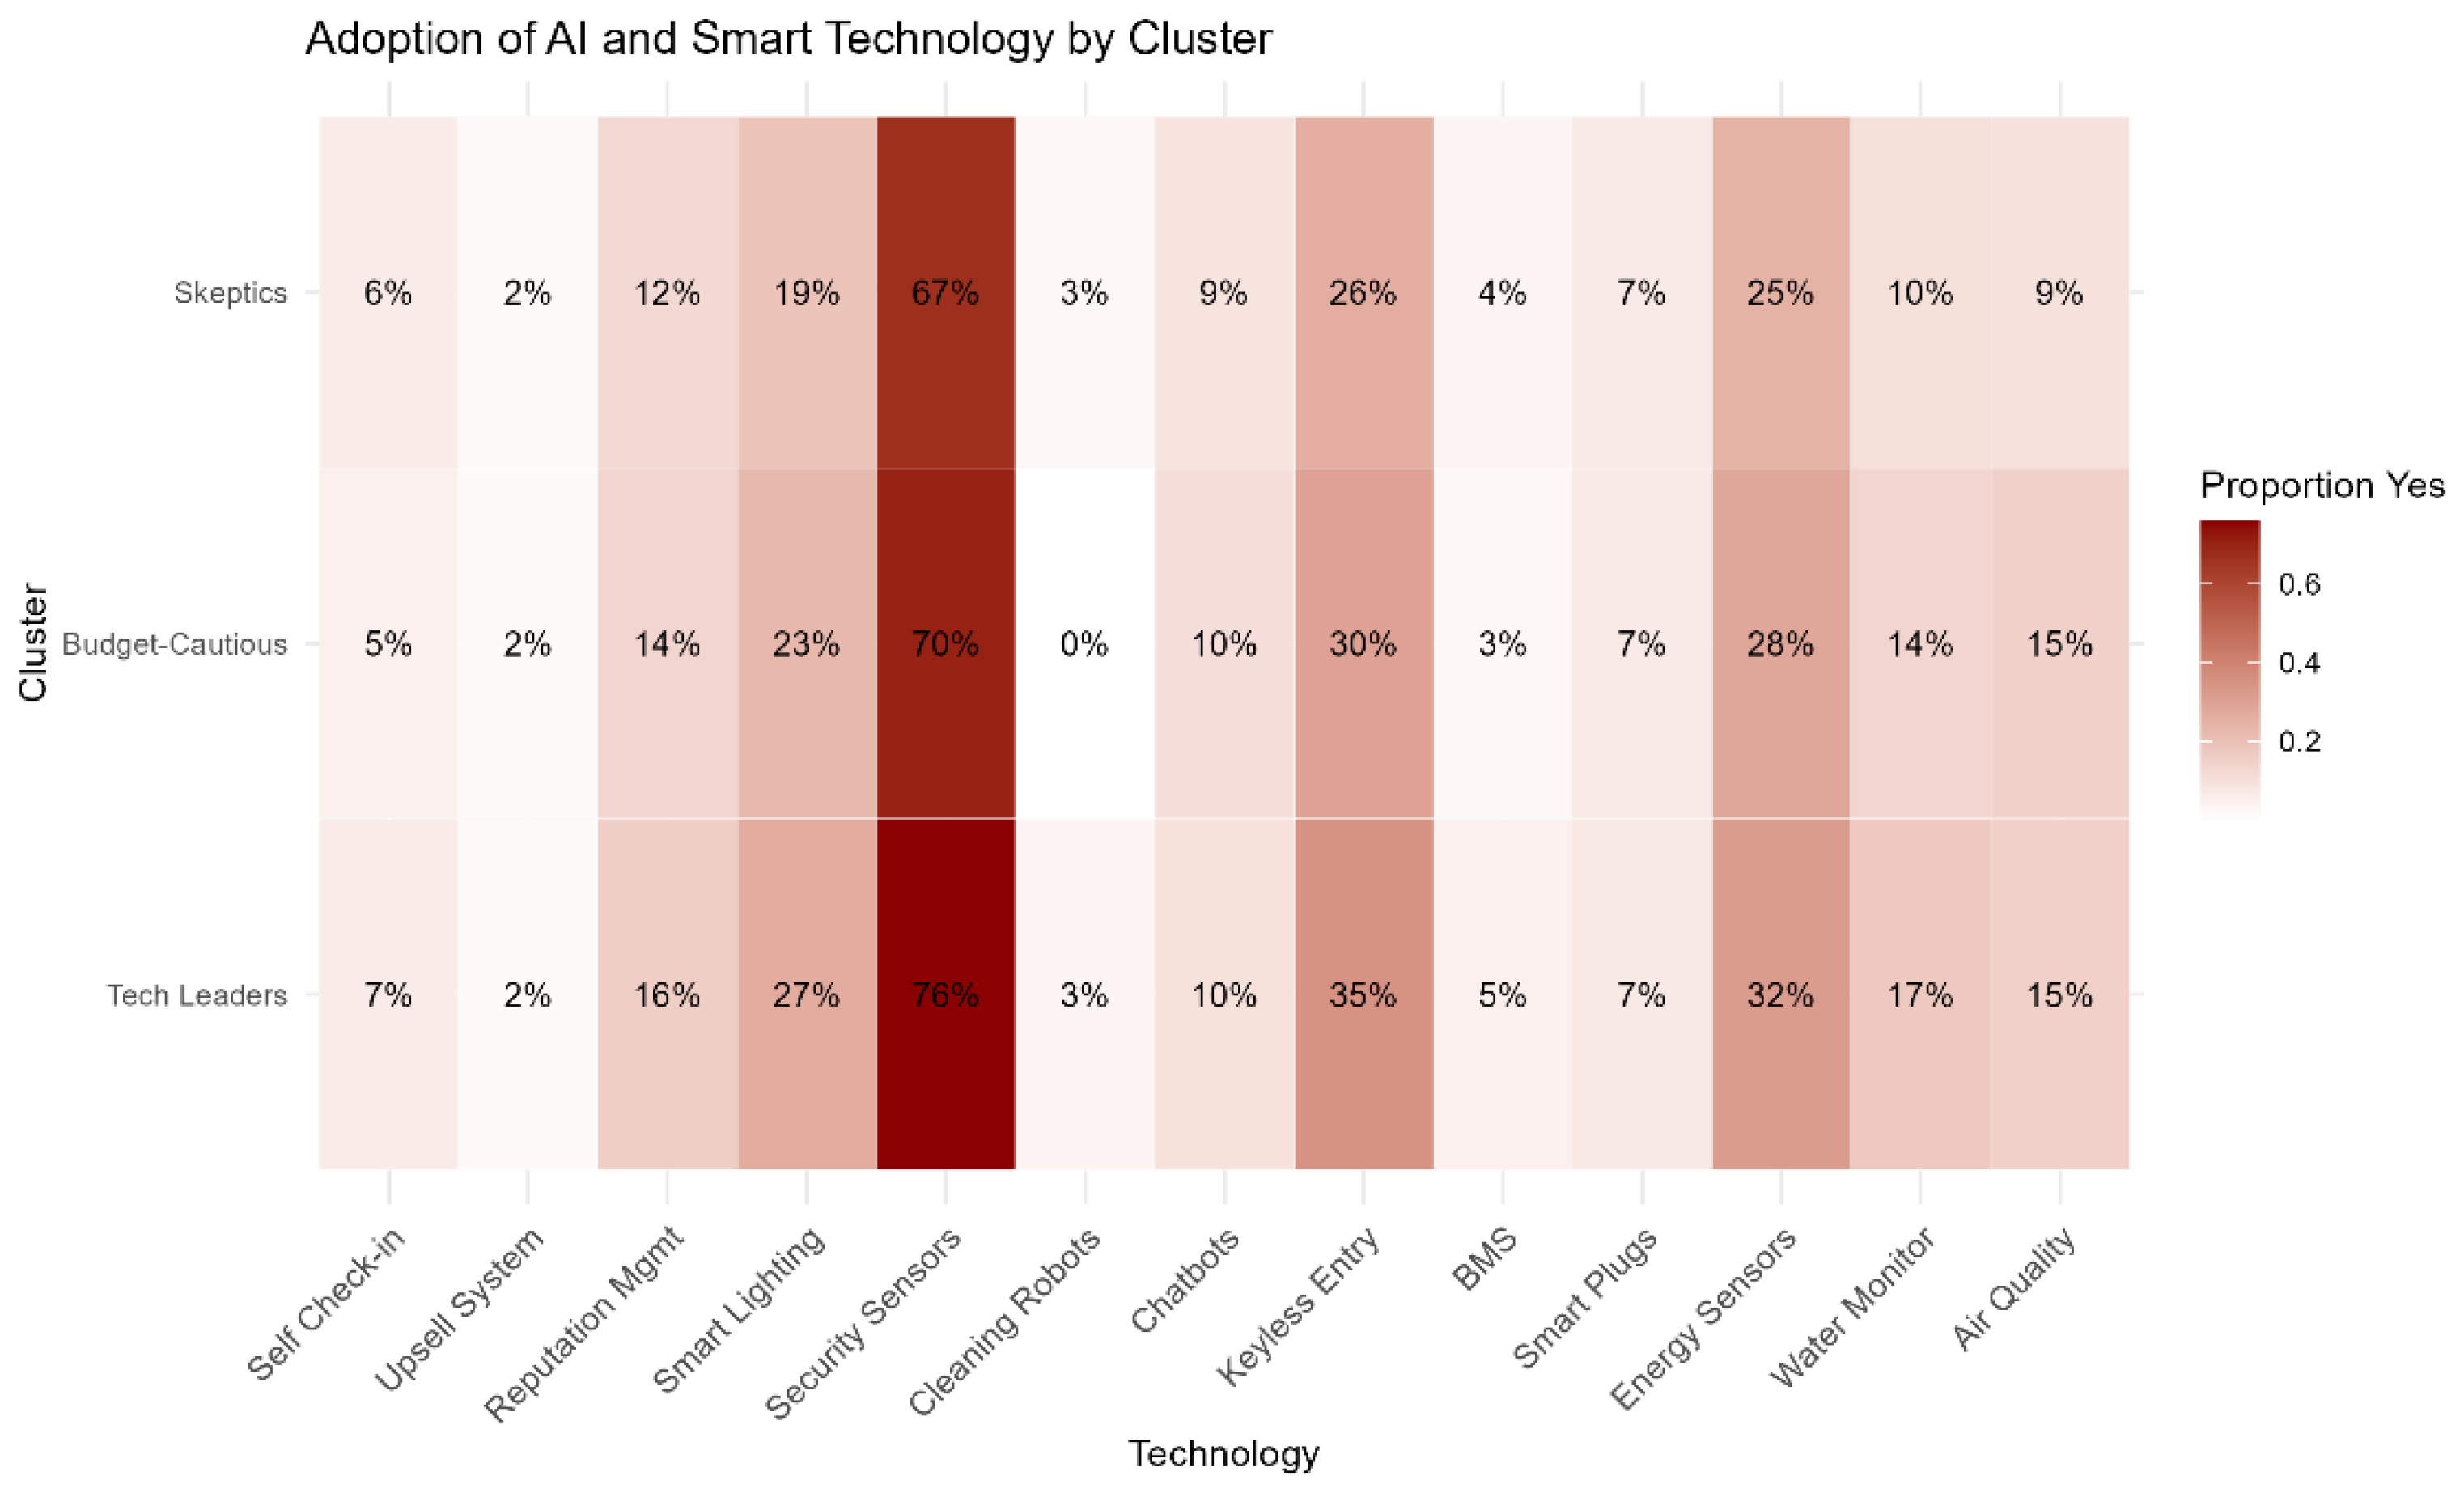
Figure 13.
Differences in ML1 Scores Across the Three Adopter Segments.
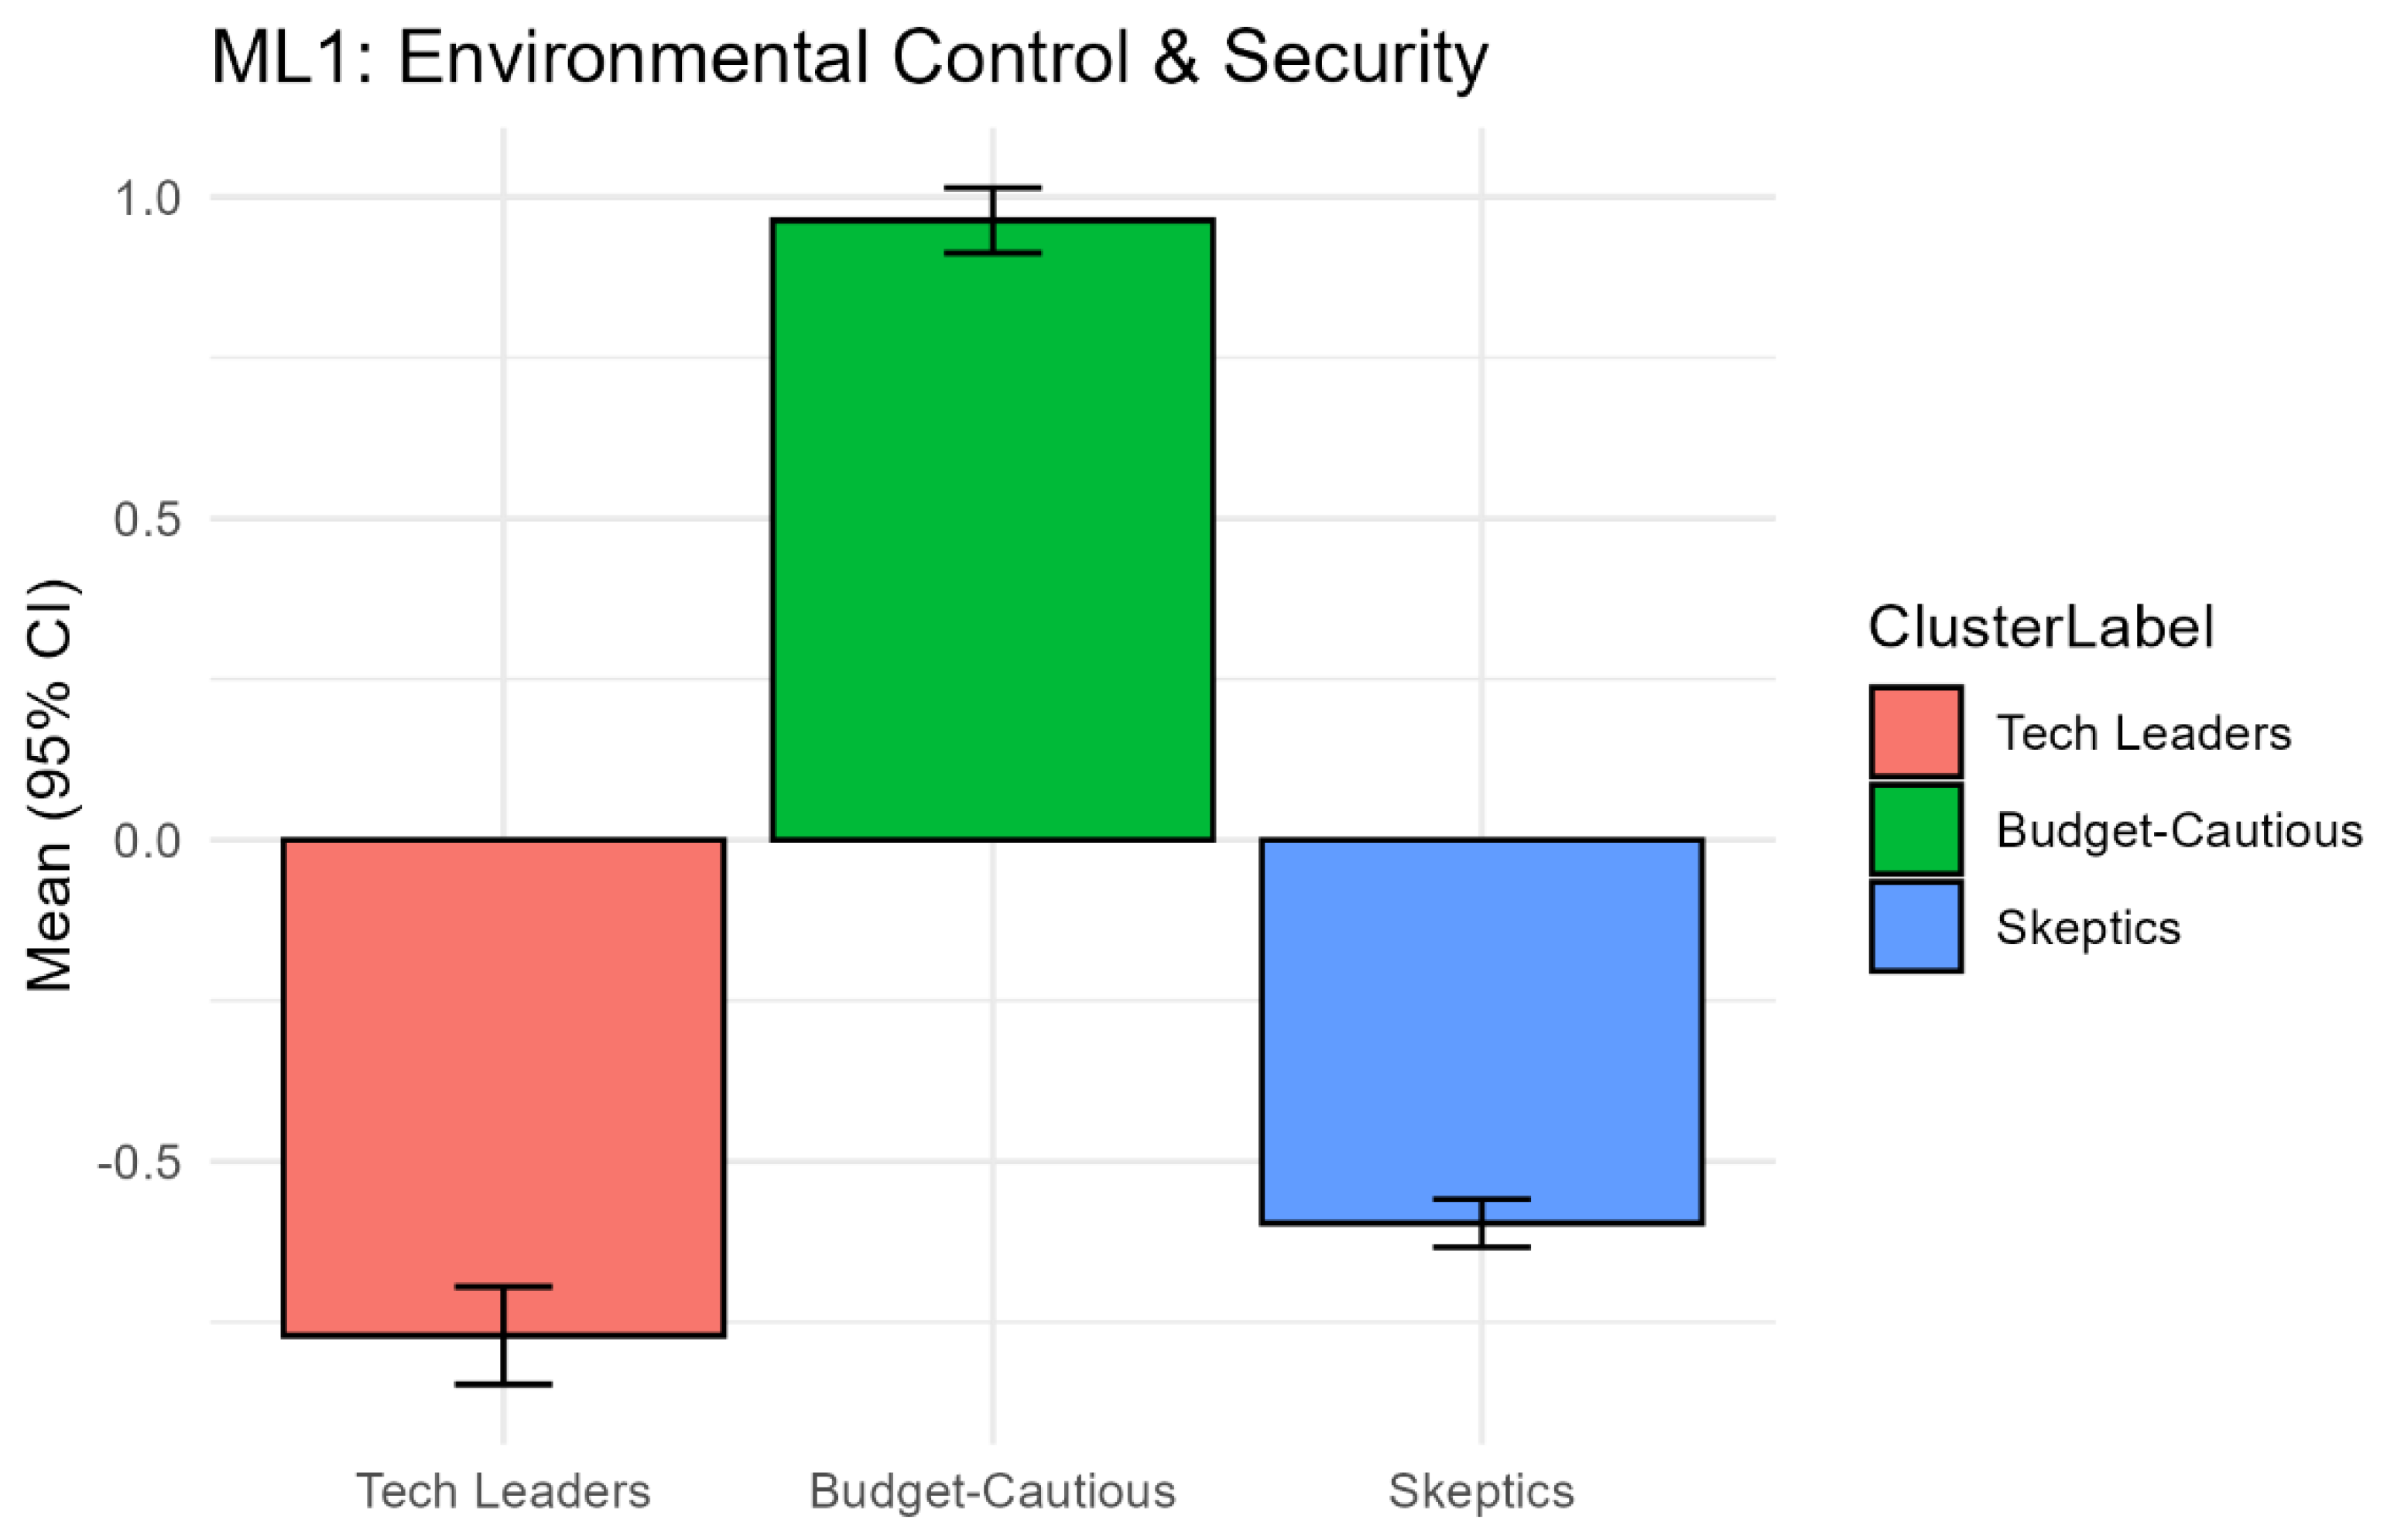
Figure 14.
Differences in ML2 Scores Across the Three Adopter Segments.
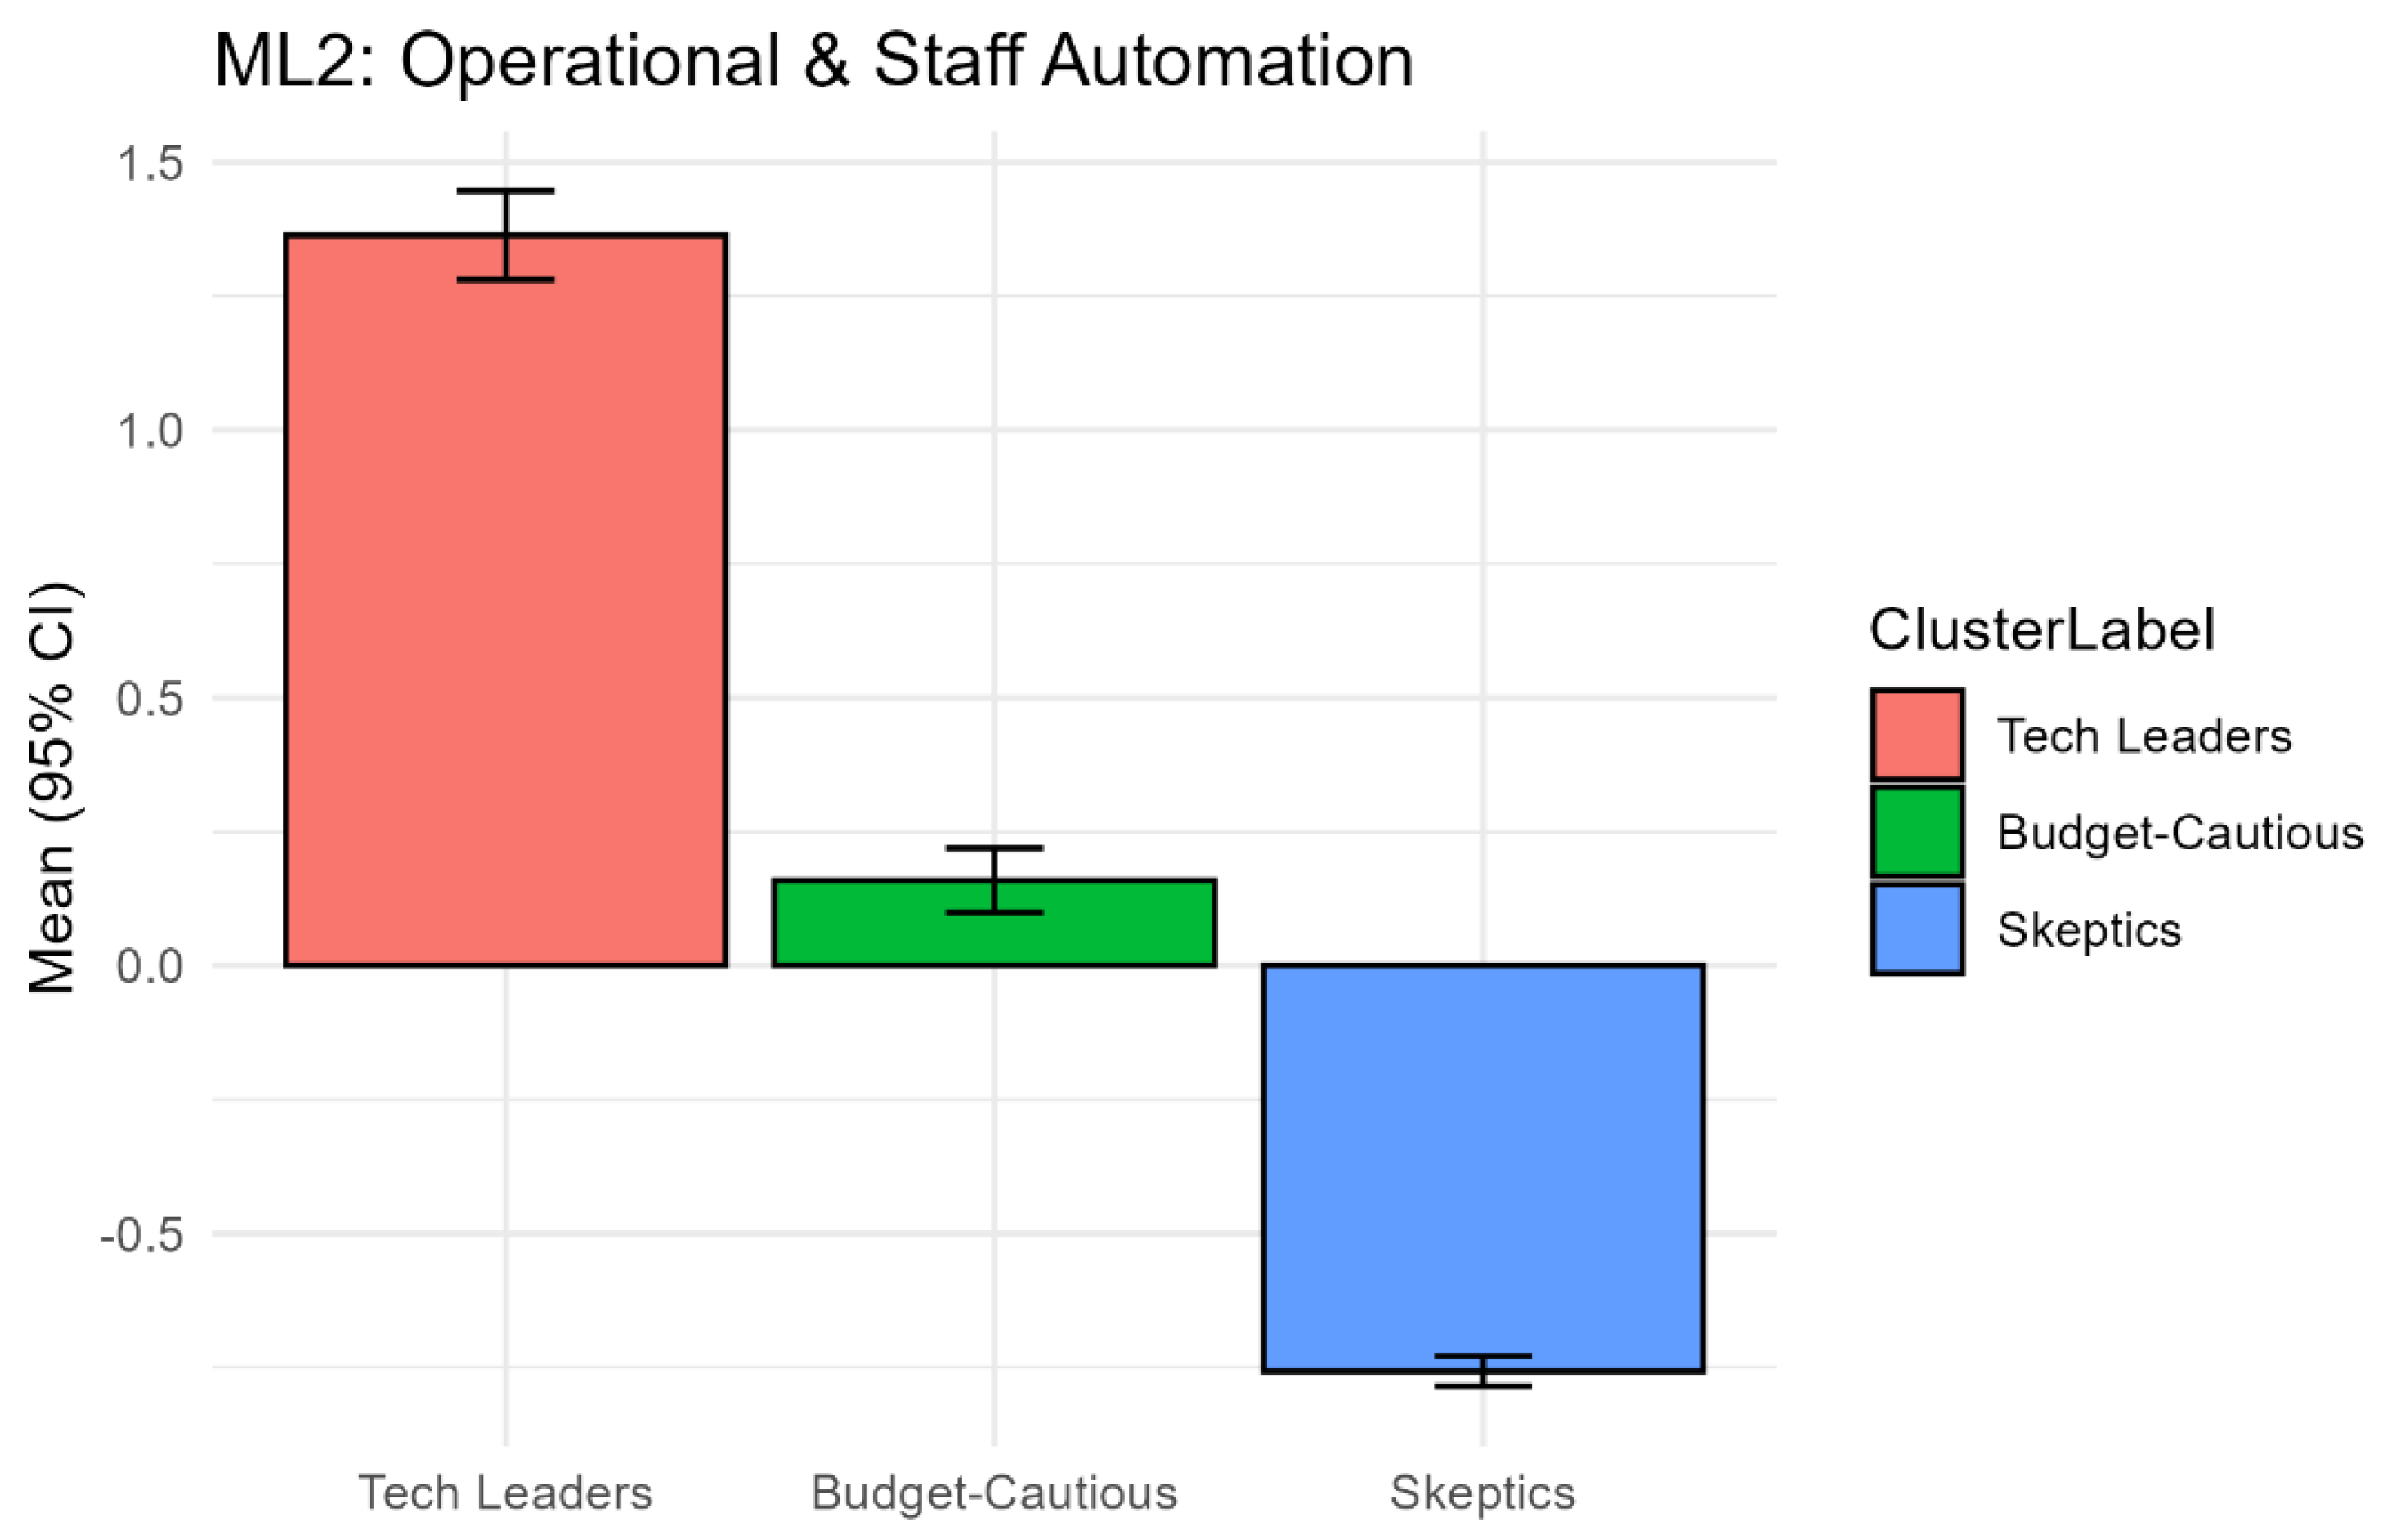
Figure 15.
Final Structural Path Model of AI and Smart Technology Adoption.
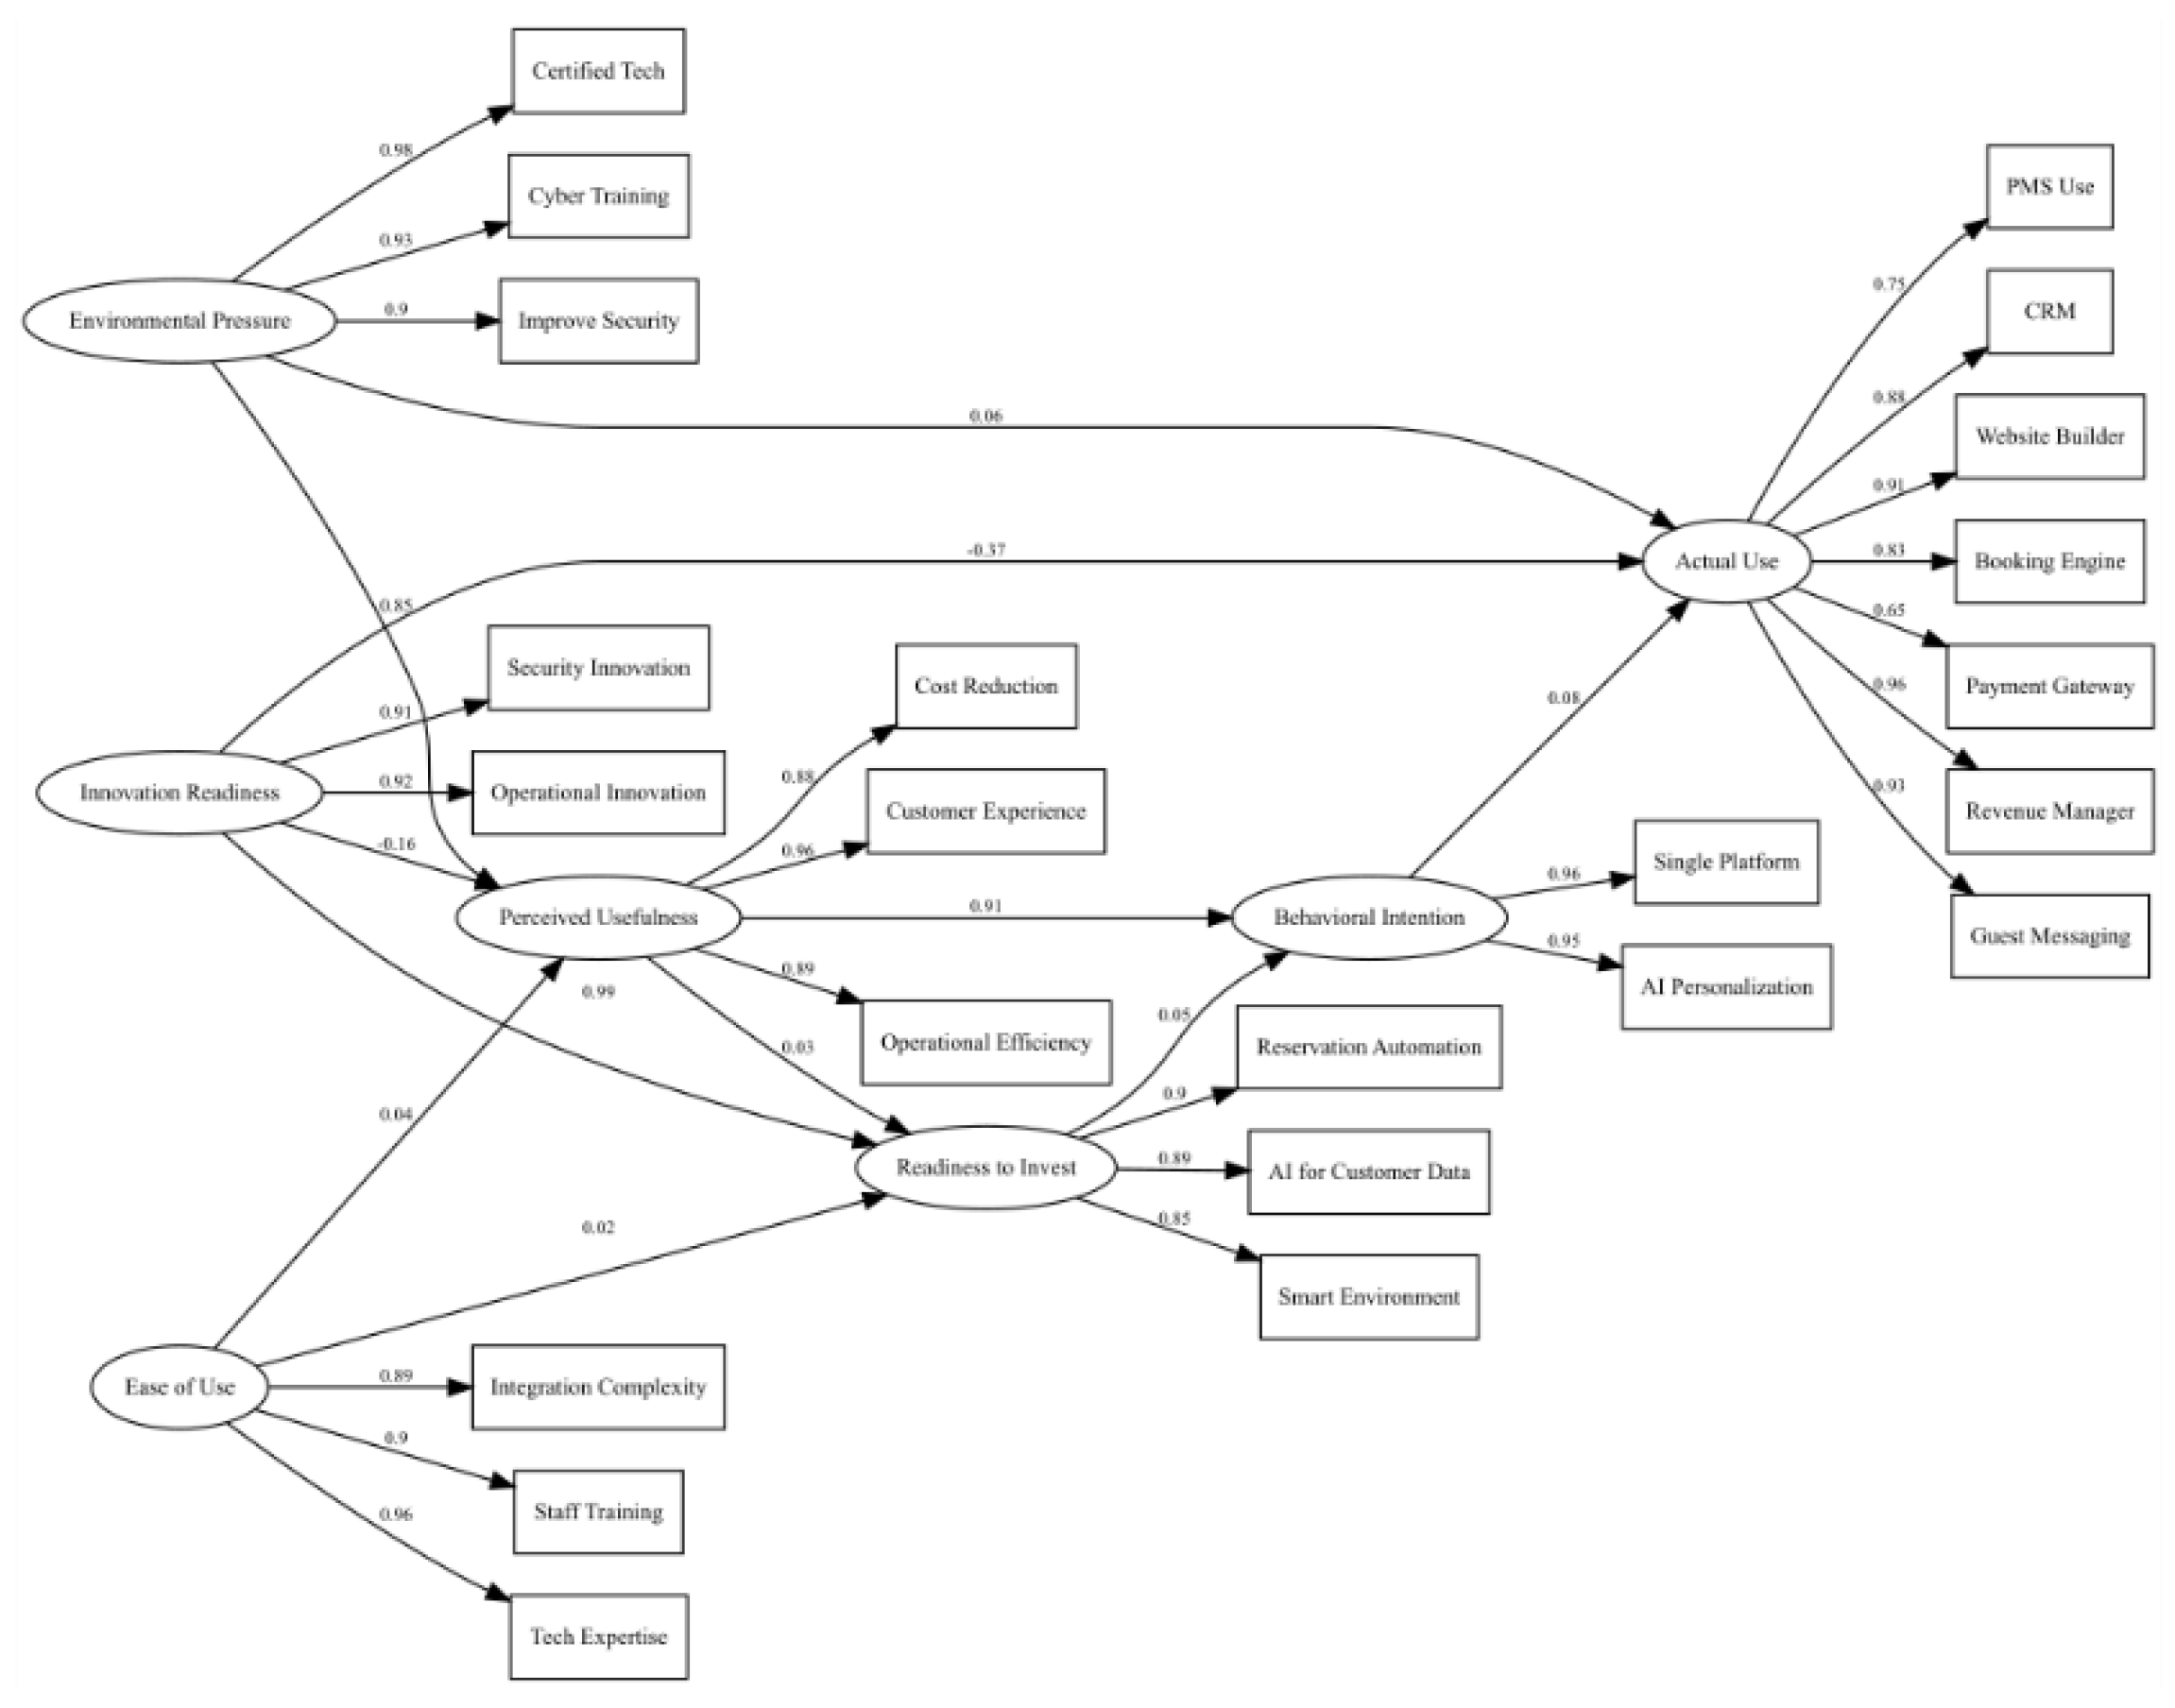
Table 3.
Structural Equation Model Fit Indices (WLSMV Estimation).
| Fit Index | Value |
|---|---|
| CFI | 0.997 |
| TLI | 0.996 |
| RMSEA | 0.029 |
| SRMR | 0.057 |
| χ²/df | 2.71 |
Table 4.
Standardized Path Coefficients for the Final SEM Model.
| From | To | Std.Path |
|---|---|---|
| PEOU | PU | 0.043 |
| Innovation_Red | PU | -0.162 |
| Env_CompPress | PU | 0.849 |
| PU | ATU | 0.034 |
| PEOU | ATU | 0.021 |
| Innovation_Red | ATU | 0.993 |
| PU | BI | 0.913 |
| ATU | BI | 0.053 |
| BI | AU | 0.077 |
| Innovation_Red | AU | -0.368 |
| Env_CompPress | AU | 0.059 |
Disclaimer/Publisher’s Note: The statements, opinions and data contained in all publications are solely those of the individual author(s) and contributor(s) and not of MDPI and/or the editor(s). MDPI and/or the editor(s) disclaim responsibility for any injury to people or property resulting from any ideas, methods, instructions or products referred to in the content. |
© 2025 by the authors. Licensee MDPI, Basel, Switzerland. This article is an open access article distributed under the terms and conditions of the Creative Commons Attribution (CC BY) license (http://creativecommons.org/licenses/by/4.0/).
Copyright: This open access article is published under a Creative Commons CC BY 4.0 license, which permit the free download, distribution, and reuse, provided that the author and preprint are cited in any reuse.


