
Submitted:
29 July 2025
Posted:
31 July 2025
You are already at the latest version
Abstract
Data is needed to understand local air quality, reduce exposure, and mitigate the neg-ative impacts on human health. Measuring local air quality often requires a hybrid monitoring approach consisting of the national air monitoring network and one or more networks of air sensors. However, it can be challenging to combine this data to produce a consistent picture of air quality largely because sensor data is produced in a variety of formats. Users may have difficulty reformatting, performing basic quality control steps, and using the data for their intended purpose. We developed an R-Shiny application that allows users to import text-based air sensor data, describe the format, do basic quality control, and export the data to standard formats through a us-er-friendly interface. Format information can be saved to speed up processing of addi-tional sensors of the same type. This tool can be used by air quality professionals (e.g., state, local, tribal air agency staff, consultants, researchers) to more efficiently work with data and do further analysis in the Air Sensor Network Analysis Tool (ASNAT), Google Earth or Geographic Information System (GIS) programs, the Real Time Geo-spatial Data Viewer (RETIGO), or other applications they already use for air quality analysis and management.
Keywords:
air quality
; air sensor
; open source
; R
; data
; format
; standard format
; re-format
1. Introduction
Poor air quality contributes to the burden of disease globally [1]. Air quality measurements are critical to provide information to adequately protect human health [2,3]. In addition to conventional air monitors, air sensors are becoming more widely used for a variety of applications [4,5]. These sensors are often lower in upfront cost, easier to site, straight forward to operate, and require less maintenance than conventional monitors allowing them to be deployed by a wider range of users. Many networks contain dozens or more sensors reporting data every few minutes or faster.
Air sensors have been used to advance science, better understand local air quality, and further protect human health. For example, PM2.5 sensors have been used to understand the impacts of short-term wildfire exposure on reduced attention span [6]. Air sensors can provide helpful information to make decisions about outdoor activities and indoor air pollution [7,8] and can help to better understand infiltration of outdoor particles into the indoor air [9]. Gas and particle air sensors have been used to determine source apportionment [10], develop emissions factors [11], and refine emission inventories [12].
Before drawing conclusions and protecting public health, users must perform in depth analysis on air sensor data. Raw data reported by air sensor networks can have issues that require careful analysis to produce credible processed data [13]. Many sensors have biases out of the box and must be co-located or operated nearby conventional air monitors to understand performance and correct for any bias or the influence of relative humidity or other factors [14,15,16]. Analyzing and comparing a wide variety of datasets can be challenging due to large data volume, variable formats, and a variety of unique features and issues requiring extensive data analysis skills.
In fall of 2019, EPA staff conducted dialogues with EPA Regions, state, local, and Tribal air monitoring organizations to understand and document their technical needs associated with using air sensors and air sensor data as part of the “Air Sensors Data Dialogues” project [17,18]. These dialogues revealed technical challenges related to data management, analysis, and visualization, as well as the need for standardized data formats and increased technical information sharing. Subsequently the “Air Sensor Data Solutions” project and report [19,20] outlined potential solutions to support these organizations who are increasingly using air sensor data but who are also experiencing technical and capacity constraints. Potential solutions included data hosting support, establishing data quality objectives and indicators for sensors, code sharing and development support, and development of rapid data analysis and visualization tools. Potential near-term actions identified included development of interoperable data formats and enhanced data visualization tools.
There are a variety of existing tools to help analyze air quality and air sensor data using different software platforms and requiring different levels of user expertise. EPA’s excel-based macro Analysis Tool allows users to compare air sensor data to air monitor data [21]. EPA’s Real-Time Geospatial Viewer (RETIGO) is a web-based application that allows users to map spatial air sensor data alongside data from other sources [22]. AirSensor R package allows users to visualize and understand local air quality using air sensors [23,24]. The Dataviewer application incorporates the functionality of the AirSensor R package into a web application that allows data to be used by community organizations and citizen scientists [23,24]. Openair is an R package that allows users to import, manipulate, and perform a variety of analysis to understand air pollution data [25]. aiRe is a web-based R-Shiny application that allows users to load, clean and explore air quality datasets and is designed for the needs of Colombian environmental authorities [26]. Sensortoolkit a python-based library [27] developed at EPA to allow users to generate air sensor performance targets reports in the same format as those outlined in EPA’s air sensor performance targets documents [28,29,30,31]. These tools are designed for a variety of users including R and python packages requiring coding expertise and excel and web-based tools for less experienced users.
For many of these tools just discussed, variation in sensor data formatting limits their use to just a few sensor types or users face a significant initial coding hurdle at the data import step. For example, the macro analysis tool requires the user to paste in their data one sensor monitor pair only and there are size limitations. For RETIGO import is limited to data in a specified time format and specified header labels, all sensor data needs to look the same and be in a single file. AirSensor is limited to certain sensor types and for OpenAir import needs to be customized for each data format. Many of these tools could become more useful if sensor data formats were standardized.
Efforts to make sensor data formats more consistent could greatly expand the usefulness of these tools and enable users to gather air quality insights more quickly. Some work is ongoing to establish standard formats for air quality data including work in Colorado (https://cdphe.colorado.gov/air-quality-data-exchange, last accessed 1 July 2025). However, at the time of this writing, no common format has been widely adopted, and it is likely that there will always be a need for different common formats depending on application objectives.
This paper describes the Air Sensor Data Unifier (ASDU), an RShiny-based tool we developed to quickly and efficiently reformat air sensor data through a user-friendly interface. This tool has the added functionality of exporting the streamlined data into a variety of formats for easier import into some of the previously mentioned tools. This paper provides some examples of how it can reformat different types of air sensor data. This tool leverages and improves on some previous software [27,32]. It is designed to meet the specific needs of U.S. state, local, and tribal air agencies and EPA regional staff in efficiently reformatting air sensor data so that it can be used to understand air sensor performance and localized air pollution.
2. Materials and Methods
Through our experience working with a variety of air sensors, we realized that air sensor data comes in a variety of data formats. Some are saved as comma-separated values, tab-separated values, or plain text files. Some include metadata, others do not. Some have header rows that describe the data well, others are missing information (e.g., units), or are missing headers all together. Timestamps are provided in a number of formats, time zones, and 1-2 column formats. Although sensors of the same make and model often have similar data formats, this is not always the case. These variations were considered in the conceptualization of this tool.
Input was solicited from U.S. Environmental Protection Agency (EPA) Regional staff and state, local, and tribal agency staff to catalog their needs around air sensor data use. Staff shared their frustrations, most time-consuming tasks, needs, information about sensors being used in their jurisdictions, and provided sample data for tool testing and design. It was clear that significant time and effort was being spent on reformatting data and that insights could be achieved more quickly if this burden could be reduced.
To provide that support, we developed the Air Sensor Data Unifier (ASDU, an RShiny based tool [32,33] to allow users to more easily reformat sensor data into standard formats. ASDU includes a dataset dashboard, format wizard, data check, data flagging, and data export functionality. ASDU uses some similar logic to the sensortoolkit python library [27], but uses a streamlined user interface with interactive options through RShiny. The code is written in R and leverages several existing packages including shiny [32], shinyjs [34], bslib [35], and DT [36].
3. Results
3.1. Specific User Needs
From the 2019 discussions with EPA regions and state, local, and Tribal air monitoring agencies, EPA learned that organizations were in various phases of air sensor and air sensor data adoption. Thus, their air sensor data analysis needs and familiarity with commercially available sensors were highly variable. Some agency needs were focused on understanding the performance of air sensors in different locations while others wanted to use sensor data to understand local air quality conditions. The available data sources and popular sensor types were variable by organization.
These conversations made it immediately clear that the first step of combining data sources was time consuming and laborious and often delayed or impeded the more substantive analyses the agencies wished to do. With limited staff time and technical programming knowledge, agencies repeatedly requested data tools that supported efforts to combine various sources of air pollution and meteorological data that could be used by non-programmers, supported offline data files present on the user’s computer, and which included data screening protocols including data flagging and outlier detection. Agencies also requested tools that supported sensor evaluation, geospatial exploratory analysis, and air pollution and meteorology analysis. Ultimately, we decided to address these overall needs with two tools: the Air Sensor Network Analysis Tool (ASNAT) and ASDU. This paper focuses on ASDU and getting data from a variety of sources into a similar format before proceeding to analysis in a wide variety of other tools.
To begin, we asked EPA research and program offices, EPA regions, and state, local, and Tribal air monitoring agency staff to submit a list of air sensors commonly used in their projects or geographical locations. Example data files were compiled for tool development and testing. The file types submitted are listed in Table 1. After discussion of the priority functionality of this tool, txt and csv file types were prioritized. PurpleAir data is different than many other sensor types since as most models have duplicate PM2.5 measurements (i.e., two Plantower sensors). Raw data from the PurpleAir public API is brought into EPA’s RSIG database and a processed version similar to that available on EPA’s fire and smoke map is accessible through ASNAT (i.e., exclude duplicate measurements that disagree, average, apply US-wide correction) [37]. We decided to load raw PurpleAir csv data directly in ASNAT instead of through ASDU so that the methods would match exactly. Users can use ASNAT to process and export PurpleAir SD card files instead of ASDU.
Some additional instrumentation in use by EPA and partners was de-prioritized primarily because they were conventional air monitors, higher cost research equipment (e.g., Met One Beta Attenuation Monitor (BAM) (Grants Pass, OR, U.S.), Environmental-BAM (E-BAM), Aethalometer, Teledyne monitors (Thousand Oaks, CA, U.S.)), and/or had much more complex measurement output (e.g., metals including Xact 652i cooper environmental, chemical speciation, scanning mobility particle size and condensation particle counter). Although not used specifically for designing the functionality of these tools, some of these types of data may still be able to be reformatted with ASDU.
Some EPA and external users were interested in direct application programming interface (API) import from a variety of sources including AirNow, EPA’s air quality system (AQS), PurpleAir (all columns), Clarity, Quant AQ, Aeroqual, and AQMesh. After discussing the priorities of the project, the team decided to focus on locally saved data in text formats since most APIs allow users to download data locally and users could then upload it into ASDU for formatting.
Based on the needs and priorities identified, ASDU was developed with the functionality outlined in the following sections.
3.2. Dataset Dashboard
Launching the tool opens the Dataset Dashboard. It allows users to upload raw air sensor data files and displays a summary of files already loaded (Figure 1). The browse button can be used to navigate to comma-separated values, tab-separated values, and plain text data files (i.e., file extensions .csv, .tsv, and .txt) located on the user’s computer. Files that are uploaded together should be of the same format. The Air Sensor Data Unifier will check that all the file extensions for a batch are the same. Each dataset’s status is tracked across the application.
3.3. Format Wizard
The Format Wizard tab, found across the top of the screen, allows users to describe the format of their sensor data files. The first (optional) step is to define the data header row. Sensor data comes in many formats; the first row may contain column headers, the first few rows may contain a variety of metadata, or there may be no column headers. The Format Wizard displays the first 10 lines of the file and users can specify the header row and the column delimiter for the files. If the header row is not found in the first 10 rows, a button allows you to view additional rows. In the next subtab called Columns, the user can identify the data type and units for the data in each column. The timestamp format can be further described within the Timestamps subtab. When setting up a new sensor format, the Air Sensor Data Unifier will try to detect the components of any timestamp column(s) and the user can adjust them as needed (Figure 2). The user can also specify the time zone. Finally, the user can save the format information as a JavaScript Object Notation (JSON) file within the Summary subtab. This file can be loaded in subsequent, future runs with data of the same format, so the user does not have to re-specify the format information.
Lastly, the Data Check subtab scans the full data file and provides the starting and ending timestamps. Plots of the first 10 sensor data values are also shown. This can give users an idea of whether they have loaded and described the data as anticipated.
Figure 3 shows that the file loaded for this example spanned from March 11 until 1 April 2020. If this is not the time period the user expected to load, they could go back and modify the data they loaded before proceeding and/or double check their description of the timestamp. The plot shows the first few values of ozone (O3) data from this example file. This can help the user ensure the values are reasonable and there was no misalignment in the column that was selected. However, it is important to note that many air sensors have bias, influence from environmental conditions, or interferences from other pollutants so these values may need further correction to be more comparable to true concentration values.
3.4. Location Config
Latitude and longitude may be specified within the data file or may have been recorded separately. The user can add the location for each sensor within the Location Config main level tab across the top of the screen. A single sensor ID may have multiple locations listed in the file but only one location can be specified in the location configuration tab.
3.5. Data Flagging
The Data Flagging tab allows users to set up rules for checking the data and to specify how those conditions should be handled (Figure 4). Flags can be set up for each data column in the dataset. There are five data flags that can be applied: 1) handling of a missing value, 2) below minimum value, 3) above maximum value, 4) repeated value for a user specified number of datapoints, and 5) outlier value by user-specified number of standard deviations away from the mean. Each flag has an identifier based on the data column’s index (starting with 1) and the flag (letters A through E). This identifier is reported in a new “flags” column when the flags are applied to the dataset to identify which flags matched each record. Missing values are always dropped and timestamps without data are not saved in the final file. The Data Flagging Summary will list how many records from the dataset were flagged, how many records will be dropped when the data is exported, and how many records will have replacement values when exported. The user can export the dataset with or without the flagged data.
In this example (Figure 4), missing values are excluded, high outliers (>999 µg/m3) are excluded, and values that repeat more than three times are excluded. This leads to 26% of the data being excluded. This would be an example where the user may want to open their data file and further explore any issues before proceeding since 26% is a large amount of data to exclude. While it is unlikely that true PM2.5 concentrations are stable in an area for 3 hours, in this example there are some periods of repeat zeros likely due to concentrations being below the sensor’s limit of detection. Depending on the objectives of the analysis, the user may not want to remove the repeat zeros from the analysis as it may bias their hourly or 24-hour averages high and the user would want to uncheck this option before proceeding to exporting their averaged dataset. However, it is important to understand typical failure patterns of the sensor used as repeat zeros can indicate a failure, as opposed to concentrations below the detection limit for some sensor types [38].
Users who take the data set generated in the ASDU and use it in the Air Sensor Network Analysis Tool (ASNAT) will have another opportunity to remove outliers from the dataset in ASNAT. However, some issues may be clearer in the recorded time resolution but may be obscured at the longer averages (e.g., minute spikes to a very high value indicating sensor blockage). In some cases, users may identify issues in ASNAT and realize that it would be helpful to go back and adjust the flagging in the recorded resolution data in ASDU before averaging again.
3.6. Export Options
The Export Options tab allows the user to select how they want the data to be exported and will create the reformatted data files. ASDU can export data in the following formats: the ASNAT Standard Format File, Keyhole Markup Language (KML) (for use in Google Earth or Geographic Information System (GIS) programs), and in the format used by RETIGO (https://www.epa.gov/hesc/real-time-geospatial-data-viewer-retigo, last accessed 20 February 2025). Data averaging can also be applied to the file. The current output options are “raw” where no averaging is done, “hourly”, or “daily” (currently 24-hour averages in coordinated universal time (UTC)).
3.7. Feedback and Improvements So Far
Before public release on github, the tool was beta tested by several EPA and external users in fall of 2024. Feedback was summarized and addressed before public release in Spring 2025 and, since public release, additional feedback has come in and been addressed. Most feedback on ASDU was provided by staff at three state and local agencies from different regions of the U.S. This feedback is summarized in Table 2. Although most of the feedback has been addressed, remaining concerns will be prioritized in future updates which are dependent on the resources available for the project. Testing and feedback from partners have been incredibly valuable as many agencies tested using data file formats that were not included in our original development dataset (e.g., QuantAQ datasets) or with data formats that have been updated by the manufacturer since the time of testing. In addition, they highlighted key features that we were not aware were priorities or did not consider in the original development.
4. Discussion
This work has resulted in a user-friendly, RShiny-based, sensor data reformatting tool capable of reducing the considerable burden of harmonizing data formats. This work enables national, state, local, and Tribal air agencies, consultants, academics, and others to quickly and efficiently combine data from several sensor networks so that the data can be used for sensor performance testing and air quality analysis and decision making.
While the tool has been designed to be relatively sensor agnostic, there are still some formatting requirements. The tool currently works with datasets where there is one row of data (any number of columns) per timestamp. In addition, data must be associated by column (e.g., PM2.5 data in column X) and be saved as .txt, .csv, or .tsv file types. The data must include a timestamp column and at least one observation column for ozone (O3), nitrogen dioxide (NO2), carbon monoxide (CO), particulate matter (PM), particle count, or meteorology data. The size of data that can be loaded and processed at the same time is also limited by local computing resources. Some of these limitations may be improved in later versions of this tool depending on the priorities of users and the availability of funding.
Existing air sensor and air quality data tools are often focused on a single manufacturer’s sensor [23,24], may require coding experience [23,25,39], or may require data in a specific format [22,23,26]. ASDU allows users to load data from a wide variety of sensor types, does not require coding experience, and has very limited requirements for specific input format. In addition, ASDU allows users to load data from local download and does not require the data to be online, reporting to the cloud, or publicly available. This functionality may be especially important in areas without Wi-Fi or cellular reception and in areas where data is sensitive and groups prefer to keep data private and only share once the results are finalized.
A variety of different data formatting conventions and standards exist for air quality data and metadata. It is challenging to identify a universal data format since all formats have strengths and limitations and may be more or less ideal for different applications. For example, some formats are better for efficient data transmission while others may minimize data storage size requirements. With so many different common formats, a tool like the air sensor data unifier is essential to help efficiently move data from one format to the other. Interoperability is critical as many users may be interested in using air sensor data in multiple different tools simultaneously to achieve their data analysis goals and produce project results.
Past research has shown the value of R-Shiny based tools as they allow diverse users to efficiently employ complex methodologies without requiring extensive training [40]. More than two hundred air quality professionals have attended trainings on this tool. Training a new user takes approximately 30 minutes, which is significantly shorter than the time required to train staff in reformatting data using software like R or Python, especially for those without prior experience. Dedicated office hours have allowed users to discuss roadblocks and obtain support. Users currently include staff from air agencies (such as state, local, tribal, and EPA), other federal agencies, academia, consulting firms, and various other organizations.
One of the challenges in developing air quality data tools is targeting the right user base. As illustrated in our air sensor data dialogue discussions [17,18,19,20], different state and local agencies have different capacities and levels of expertise. Some local agencies feel that they are not the target audience for a tool like ASDU since they have so much in house data analysis expertise but feel that it is a tool for them to pass on to the community groups they work with. Community groups also have a wide range of capacities and desires. Some groups desire professional level reports prepared by technical experts (e.g., contract staff) while other groups are focused on education (e.g., middle school groups) and are not interested in the data beyond colors and screen outputs and there are many groups that fall somewhere in between where data tools like ASDU may help. Our dialogues also found that there may be some regional differences in the engagement with air sensors (e.g., from east coast and west coast agencies). Some west coast agencies have advanced sensor programs including custom built state sensor networks (e.g., Oregon, Washington), sensor evaluation programs (e.g., South Coast Air Quality Management District Air Quality Sensor Performance Evaluation Center), and custom-built air sensor software (e.g., South Coast Air Quality Management District, Puget Sound Clean Air Agency). These agencies with extensive technical staff may be more likely to use custom data analysis to accomplish agency or community agency partnership goals. Some regional differences may be due to increased knowledge and engagement of the public after wildfires [41]. Continued work is needed to advertise these tools to suitable audiences, update the tools to better meet real-world needs, and provide tailored trainings to varied audiences.
So far, users have reported using this tool to quickly reformat data from a short-term city-wide network to then further explore the dataset in ASNAT. This tool streamlines the analysis pipeline allowing similar data formatting steps to be quickly repeated. The simplicity of the R-Shiny interface can allow for less disruption when staffing changes occurred requiring and new staff to be trained to take over analysis.
With the wide variety of users trained and engaged with this tool, a number of suggested improvements have already come in and the tool has been improved since its initial release. This work is ongoing, and we hope to continue improving the functionality based on the feedback from initial users. In addition, the code is publicly available so that others may modify it for their specific use cases and/or integrate it into existing data analysis tools as needed.
This tool contributes to increased accessibility of air quality monitoring data. Reducing the time needed to reformat air sensor data reduces the barrier to entry and allows more users to use air sensors for a variety of uses. This can allow for further democratization of air quality monitoring. In addition, this saves resources that can be put into further analysis, data communication, or other critical programs.
Much has been learned about air quality and air pollution in recent decades. However, many questions remain especially at local and individual levels and in low resources settings where air quality data and information about air pollution have been less available. More efficient processing of air sensor data allows for more time to be spent digging into pressing public health questions. In addition, expanded access to air quality sensors and data can generate greater motivation and awareness of air pollution [42]. The implications of air sensor use to improve public health is an area of ongoing research [43].
5. Conclusions
The development and public release of ASDU represents a significant advancement in the management and use of air sensor data. By addressing the challenges of data format variability and providing a streamlined, user-friendly interface for data processing, ASDU empowers air quality professionals to efficiently integrate sensor data into their workflows. This tool not only facilitates basic quality control and data export into standard formats but also enhances the interoperability of air sensor data across various applications, including ASNAT, Google Earth, and GIS programs. It decreases the amount of time and energy spent data wrangling and allows non-programmers to assist with this task and allows users to spend more project time gaining insights from the data.
By understanding the diverse needs and constraints faced by US EPA, state, local, and tribal air quality organizations, ASDU is designed to meet their specific requirements, enabling more effective air quality analysis. The tool’s adaptability to various sensor types and its open-source nature further democratizes the use of air quality sensors, providing broader access to high-resolution air quality data.
Looking forward, continued collaboration with air quality professionals and stakeholders will be essential to refine ASDU’s functionalities and expand its capabilities. Since the tool is opensource and available on github external users can improve and make public their own versions of the code set. By fostering an environment of shared learning and innovation, the ASDU development team aims to contribute to the ongoing efforts to improve air quality monitoring and public health outcomes. As air sensor technology continues to evolve, tools like ASDU will play a pivotal role in leveraging these advancements to address complex environmental challenges.
Author Contributions
Conceptualization, K.K.B.; formal analysis, C.S.; software, C.S.; validation, C.S. and K.K.B.; methodology K.K.B., C.S., S.A., S.K., C.M. and A.L.C.; data curation, K.K.B, and A.L.C.; writing—original draft preparation, K.K.B.; writing—review and editing, C.S., S.A., S.K., C.M. and A.L.C.; visualization, C.S.; project administration, K.K.B., S.A., and A.L.C.; funding acquisition, K.K.B., S.K. and A.L.C. All authors have read and agreed to the published version of the manuscript.
Funding
This research received no external funding. This work was supported by US Environmental Protection Agency internal funding (Air Climate and Energy National Research Program and Regional—Office of Research and Development (ORD) Applied Research Program).
Institutional Review Board Statement
Not applicable.
Informed Consent Statement
Not applicable.
Data Availability Statement
The code is available on github https://github.com/USEPA/air-sensor-data-unifier.
Use of Artificial Intelligence
AI tools were used to support outlining the discussion, drafting the conclusions, and drafting the introduction paragraph on the data solutions projects and were used for minor grammatical and sentence structure improvements to improve readability.
Acknowledgments
Thank you to Sedona Ryan (UNC) and Eliodora Chamberlain (EPA Region 7) for their project management and other support of this project. Thank you to those who provided input, example datasets, and testing feedback including: U.S. EPA Amara Holder (ORD), Megan MacDonald (ORD), Ryan Brown (Region 4), Daniel Garver (Region 4), Chelsey Laurencin (Region 4), Rachel Kirpes (Region 5), Dena Vallano (Region 9), Laura Barry (Region 9), Nicole Briggs (Region 10), and Elizabeth Good (Office of Air Quality Planning and Standards); South Coast Air Quality Management District Wilton Mui, Vasileios Papapostolou, Randy Lam, Namrata Shanmukh Panji, Ashley Collier-Oxandale (former); Washington Department of Ecology Nate May; Puget Sound Clean Air Agency Graeme Carvlin; New Jersey Department of Environmental Protection Luis Lim; Desert Research Institute: Jonathan Callahan; and Pennsylvania Department of Environmental Protection: Hallie Weiss. Thank you to Samuel Frederick (former student contractor to EPA) for his initial work on sensortoolkit that was the starting point for the functionality of this tool.
Conflicts of Interest
The authors declare no conflicts of interest.
EPA Disclaimer
The mention of trade names, products, or services does not imply an endorsement by the U.S. Government or the U.S. Environmental Protection Agency. The views expressed in this paper are those of the author(s) and do not necessarily represent the views or policies of the U.S. Environmental Protection Agency.
Abbreviations
The following abbreviations and acronyms are used in this manuscript:
| AI | Artificial Intelligence |
| API | Application Programming Interface |
| AQS | Air Quality System |
| ASDU | Air Sensor Data Unifier |
| ASNAT | Air Sensor Network Analysis Tool |
| BAM | Beta Attenuation Monitor |
| CO | carbon monoxide |
| csv | comma-separated values |
| E-BAM | Environmental-Beta Attenuation Monitor |
| EPA | Environmental Protection Agency |
| GIS | Geographic Information System |
| JSON | JavaScript Object Notation |
| KML | Keyhole Markup Language |
| MDPI | Multidisciplinary Digital Publishing Institute |
| NO2 | nitrogen dioxide |
| O3 | ozone |
| ORD | Office of Research and Development |
| PM | particulate matter |
| RETIGO | Real Time Geospatial Data Viewer |
| tsv | tab-separated values |
| txt | plain text files |
| UNC | University of North Carolina at Chapel Hill |
| U.S. | United States |
| UTC | coordinated universal time |
| Wi-Fi | wireless fidelity |
References
- Cohen, A.J., et al., Estimates and 25-year trends of the global burden of disease attributable to ambient air pollution: an analysis of data from the Global Burden of Diseases Study 2015. Lancet, 2017. 389(10082): p. 1907-1918. [CrossRef]
- Pinder, R.W., et al., Opportunities and challenges for filling the air quality data gap in low- and middle-income countries. Atmospheric Environment, 2019. 215: p. 116794. [CrossRef]
- Singh, D., et al., Sensors and systems for air quality assessment monitoring and management: A review. Journal of Environmental Management, 2021. 289. [CrossRef]
- Kumar, P., et al., The rise of low-cost sensing for managing air pollution in cities. Environment International, 2015. 75: p. 199-205. [CrossRef]
- Snyder, E.G., et al., The Changing Paradigm of Air Pollution Monitoring. Environmental Science & Technology, 2013. 47(20): p. 11369-11377. [CrossRef]
- Cleland Stephanie, E., et al., Short-Term Exposure to Wildfire Smoke and PM2.5 and Cognitive Performance in a Brain-Training Game: A Longitudinal Study of U.S. Adults. Environmental Health Perspectives, 2022. 130(6): p. 067005. [CrossRef]
- Stampfer, O., et al., School and childcare facility air quality decision-makers’ perspectives on using low-cost sensors for wildfire smoke response. BMC Public Health, 2023. 23(1): p. 2167. [CrossRef]
- Stampfer, O., et al., Practical considerations for using low-cost sensors to assess wildfire smoke exposure in school and childcare settings. Journal of Exposure Science & Environmental Epidemiology, 2025. 35(2): p. 157-168. [CrossRef]
- Mangin, T., et al., Understanding the effect of outdoor pollution episodes and HVAC type on indoor air quality. Building and Environment, 2025. 278: p. 112978. [CrossRef]
- Yang, L.H., et al., Investigating the Sources of Urban Air Pollution Using Low-Cost Air Quality Sensors at an Urban Atlanta Site. Environmental Science & Technology, 2022. 56(11): p. 7063-7073. [CrossRef]
- Chu, M., et al., Kerbside NOx and CO concentrations and emission factors of vehicles on a busy road. Atmospheric Environment, 2022. 271: p. 118878. [CrossRef]
- Carruthers, D., et al., Urban emission inventory optimisation using sensor data, an urban air quality model and inversion techniques. International Journal of Environment and Pollution, 2019. 66(4): p. 252-266. [CrossRef]
- Barkjohn, K.K., et al., Air Quality Sensor Experts Convene: Current Quality Assurance Considerations for Credible Data. ACS ES&T Air, 2024. [CrossRef]
- Feenstra, B., et al., Performance evaluation of twelve low-cost PM2.5 sensors at an ambient air monitoring site. Atmospheric Environment, 2019. 216: p. 116946. [CrossRef]
- Collier-Oxandale, A., et al., Field and laboratory performance evaluations of 28 gas-phase air quality sensors by the AQ-SPEC program. Atmospheric Environment, 2020. [CrossRef]
- Barkjohn, K.K., et al., Correction and Accuracy of PurpleAir PM2.5 Measurements for Extreme Wildfire Smoke. Sensors, 2022. 22(24): p. 9669. [CrossRef]
- Hagler, G., A. Clements, and J. Masters, Air Sensor Data Dialogues (Internal Report), EPA Office of Research and Development, Editor. 2020.
- Hagler, G.A.A.C., Air sensor data—What are the current technical practices and unmet needs of the EPA, state, local, and tribal air monitoring agencies? National Ambient Air Monitoring Conference, Pittsburgh, PA, 2020.
- Hagler, G., A. Clements, C. Mocka, C. Barrette, R. Evans, E. McMahon, D. Smith, R. Brown, D. Garver, R. Judge, D. Vallano, A. Mebust, S. Waldo, W. Wallace, Air Sensor Data Solutions. Internal Report, US EPA Office of Research and Development, Editor. 2022.
- Clements, A., et al., Understanding the air sensor data management, visualization, and analysis needs of government air quality organizations in the United States, in National Ambient Air Monitoring Conference. 2022: Pittsburgh, PA.
- Conner, T., et al., Macro Analysis Tool—MAT, US EPA, Editor. 2018: Washington, DC.
- Clements, A. EPA Tools and Resources Webinar: Web-Based Data Visualization of Air Sensor Data with RETIGO Version 4. in Tools and Resources Webinar. 2024. Research Triangle Park, NC.
- Collier-Oxandale, A., et al., AirSensor v1.0: Enhancements to the open-source R package to enable deep understanding of the long-term performance and reliability of PurpleAir sensors. Environmental Modelling & Software, 2022. 148: p. 105256. [CrossRef]
- Feenstra, B., et al., The AirSensor open-source R-package and DataViewer web application for interpreting community data collected by low-cost sensor networks. Environmental Modelling & Software, 2020. 134: p. 104832. [CrossRef]
- Carslaw, D.C. and K. Ropkins, openair—An R package for air quality data analysis. Environmental Modelling & Software, 2012. 27-28: p. 52-61. [CrossRef]
- Díaz, J.J., et al., aiRe—A web-based R application for simple, accessible and repeatable analysis of urban air quality data. Environmental Modelling & Software, 2021. 138: p. 104976. [CrossRef]
- Frederick, S. and M. Kumar, Sensortoolkit. 2024: https://github.com/USEPA/sensortoolkit.
- Duvall, R., et al., NO2, CO, and SO2 Supplement to the 2021 Report on Performance Testing Protocols, Metrics, and Target Values for Ozone Air Sensors, U.S. Environmental Protection Agency, Editor. 2024: Washington, DC.
- Duvall, R., et al., PM10 Supplement to the 2021 Report on Performance Testing Protocols, Metrics, and Target Values for Fine Particulate Matter Air Sensors, U.S.E.P. Agency, Editor. 2023: Washington, DC.
- Duvall, R., et al., Performance testing protocols, metrics, and target values for fine particulate matter air sensors: Use in ambient, outdoor, fixed site, non-regulatory supplemental and informational monitoring applications. 2021, U.S. Environmental Protection Agency, Office of Research and Development: Washington, DC.
- Duvall, R.M., et al., Performance Testing Protocols, Metrics, and Target Values for Ozone Air Sensors: USE IN AMBIENT, OUTDOOR, FIXED SITE, NON-REGULATORY SUPPLEMENTAL AND INFORMATIONAL MONITORING APPLICATIONS. 2021.
- Chang W, et al., shiny: Web Application Framework for R. 2025.
- R Core Team, R: A Language and Environment for Statistical Computing, in R Foundation for Statistical Computing. 2024: Vienna, Austria.
- Attali, D., shinyjs: Easily Improve the User Experience of Your Shiny Apps in Seconds. 2022.
- Sievert, C., J. Cheng, and G. Aden-Buie, bslib: Custom ‘Bootstrap’ ‘Sass’ Themes for ‘shiny’ and ‘rmarkdown’. 2025.
- Xie, Y., J. Cheng, and X. Tan, DT: A Wrapper of the JavaScript Library ‘DataTables’. 2025.
- Johnson Barkjohn, K., et al. Sensor data cleaning and correction: Application on the AirNow Fire and Smoke Map. in American Association for Aerosol Research. 2021. Albuquerque, NM.
- Barkjohn, K.K., et al., Evaluation of Long-Term Performance of Six PM2.5 Sensor Types. Sensors, 2025. 25(4): p. 1265. [CrossRef]
- Yang, C.-T., et al., An implementation of cloud-based platform with R packages for spatiotemporal analysis of air pollution. The Journal of Supercomputing, 2020. 76(3): p. 1416-1437. [CrossRef]
- Kasprzak, P., et al., Six Years of Shiny in Resear ears of Shiny in Research:Collaborative Development of Web Tools in R The R Journal, 2020. 12. [CrossRef]
- Del Ponte, A., et al., Change of air quality knowledge, perceptions, attitudes, and practices during and post-wildfires in the United States. Science of The Total Environment, 2022. 836: p. 155432. [CrossRef]
- Oltra, C., et al., Public engagement on urban air pollution: an exploratory study of two interventions. Environmental Monitoring and Assessment, 2017. 189(6): p. 296. [CrossRef]
- Hubbell, B.J., et al., Understanding social and behavioral drivers and impacts of air quality sensor use. Science of The Total Environment, 2018. 621: p. 886-894. [CrossRef]
Figure 1.
Dataset Dashboard, the first step of the Air Sensor Data Unifier, where batches of air sensor data can be loaded.
Figure 1.
Dataset Dashboard, the first step of the Air Sensor Data Unifier, where batches of air sensor data can be loaded.

Figure 2.
Format Wizard timestamp formatting and time zone options. Timestamp component type is auto populated, and users can update from the drop downs as needed.
Figure 2.
Format Wizard timestamp formatting and time zone options. Timestamp component type is auto populated, and users can update from the drop downs as needed.
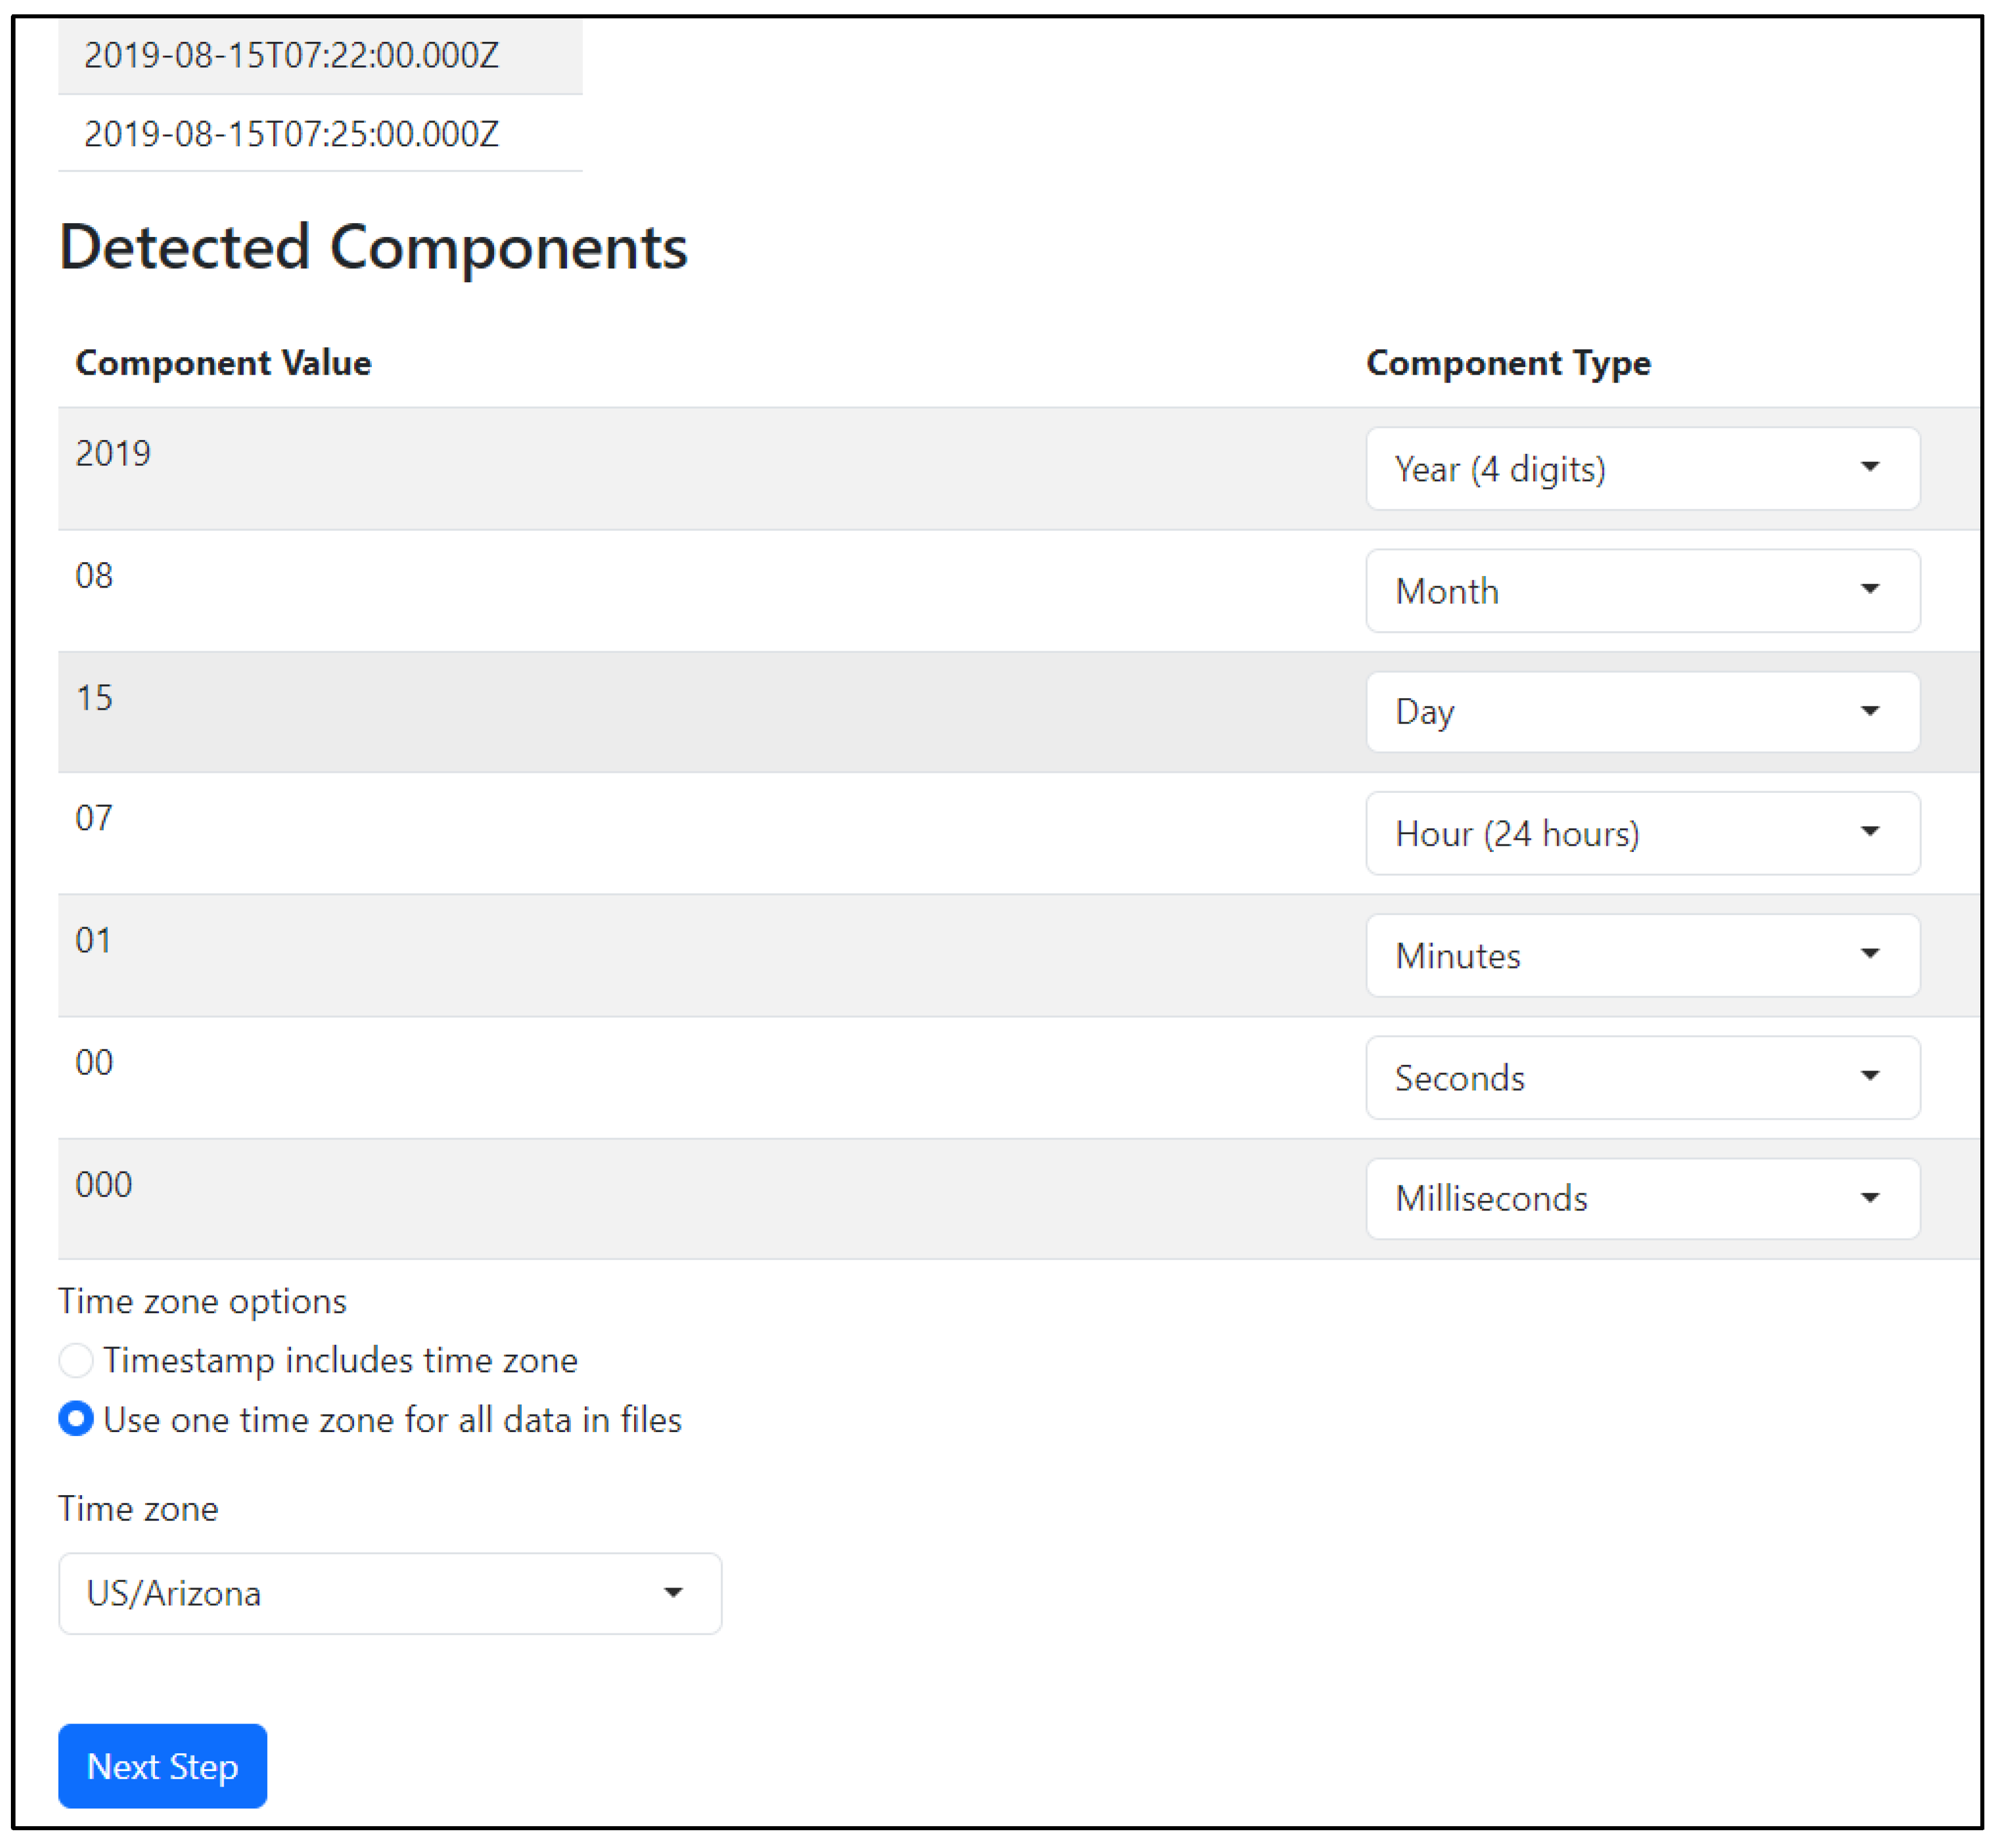
Figure 3.
Sensor data check showing the timestamp range and the values of the first ten observations plotted.
Figure 3.
Sensor data check showing the timestamp range and the values of the first ten observations plotted.
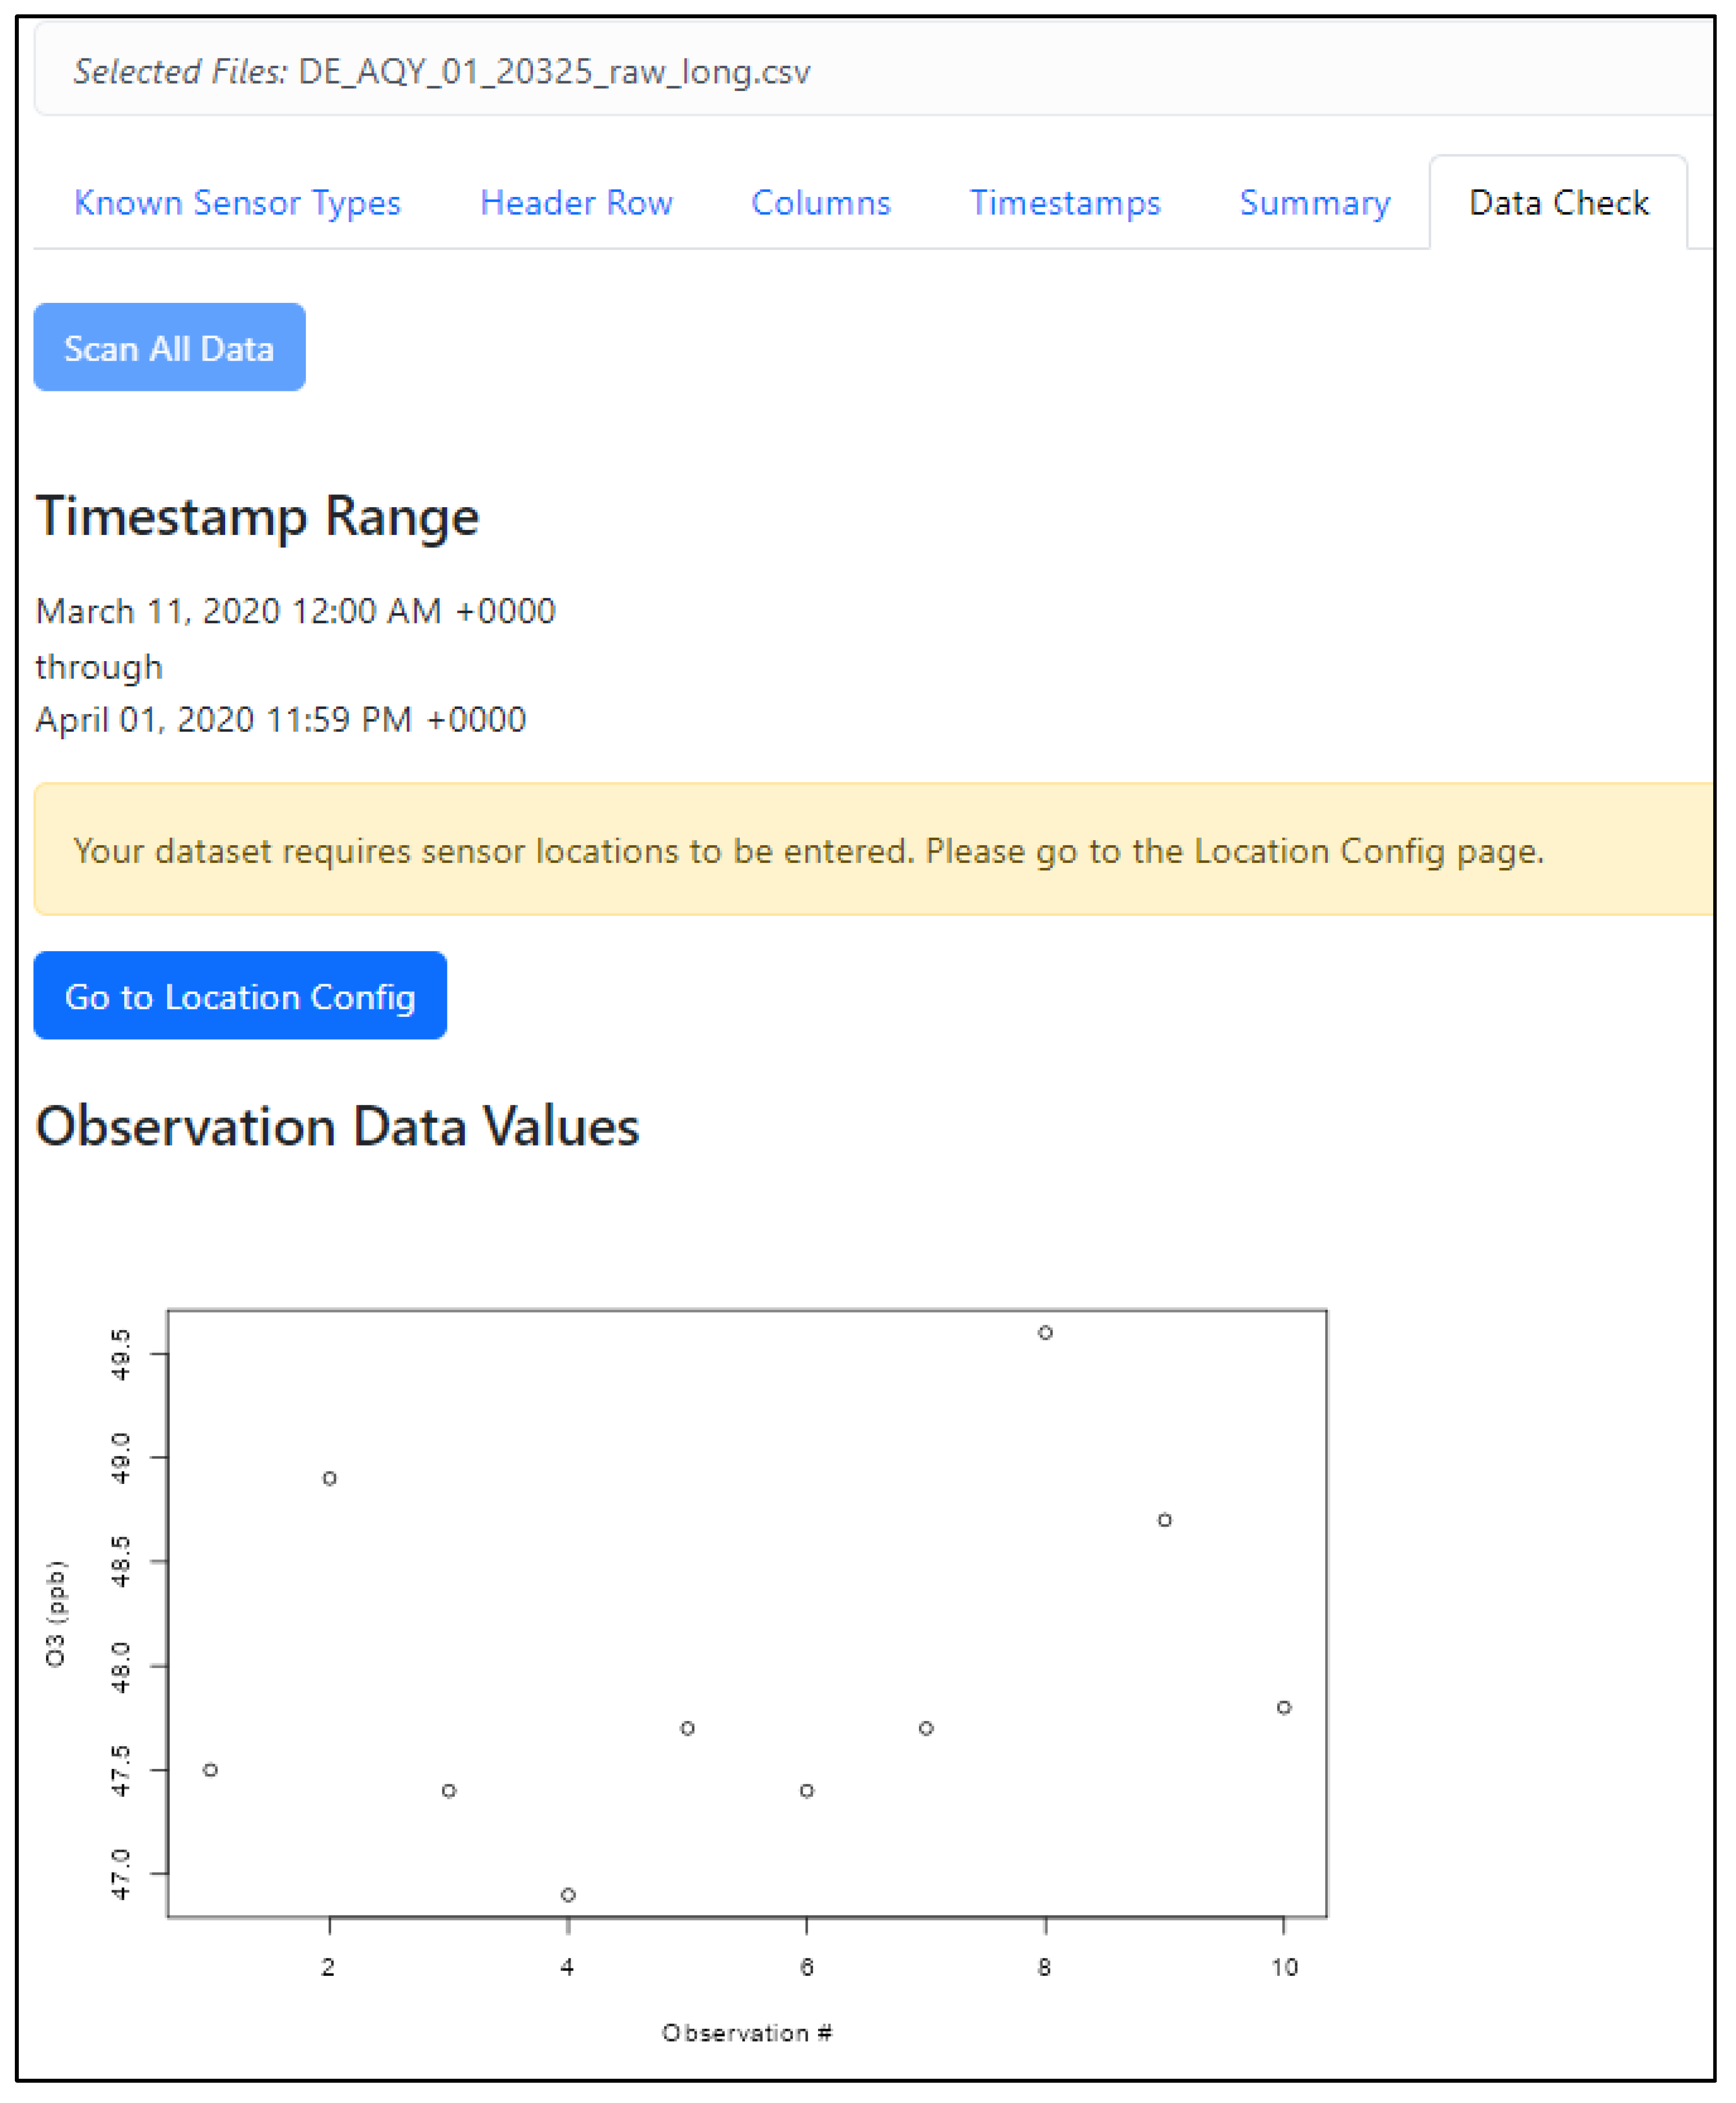
Figure 4.
Data Flagging functionality including the ability to apply flags and then see how much data and which points will be removed.
Figure 4.
Data Flagging functionality including the ability to apply flags and then see how much data and which points will be removed.
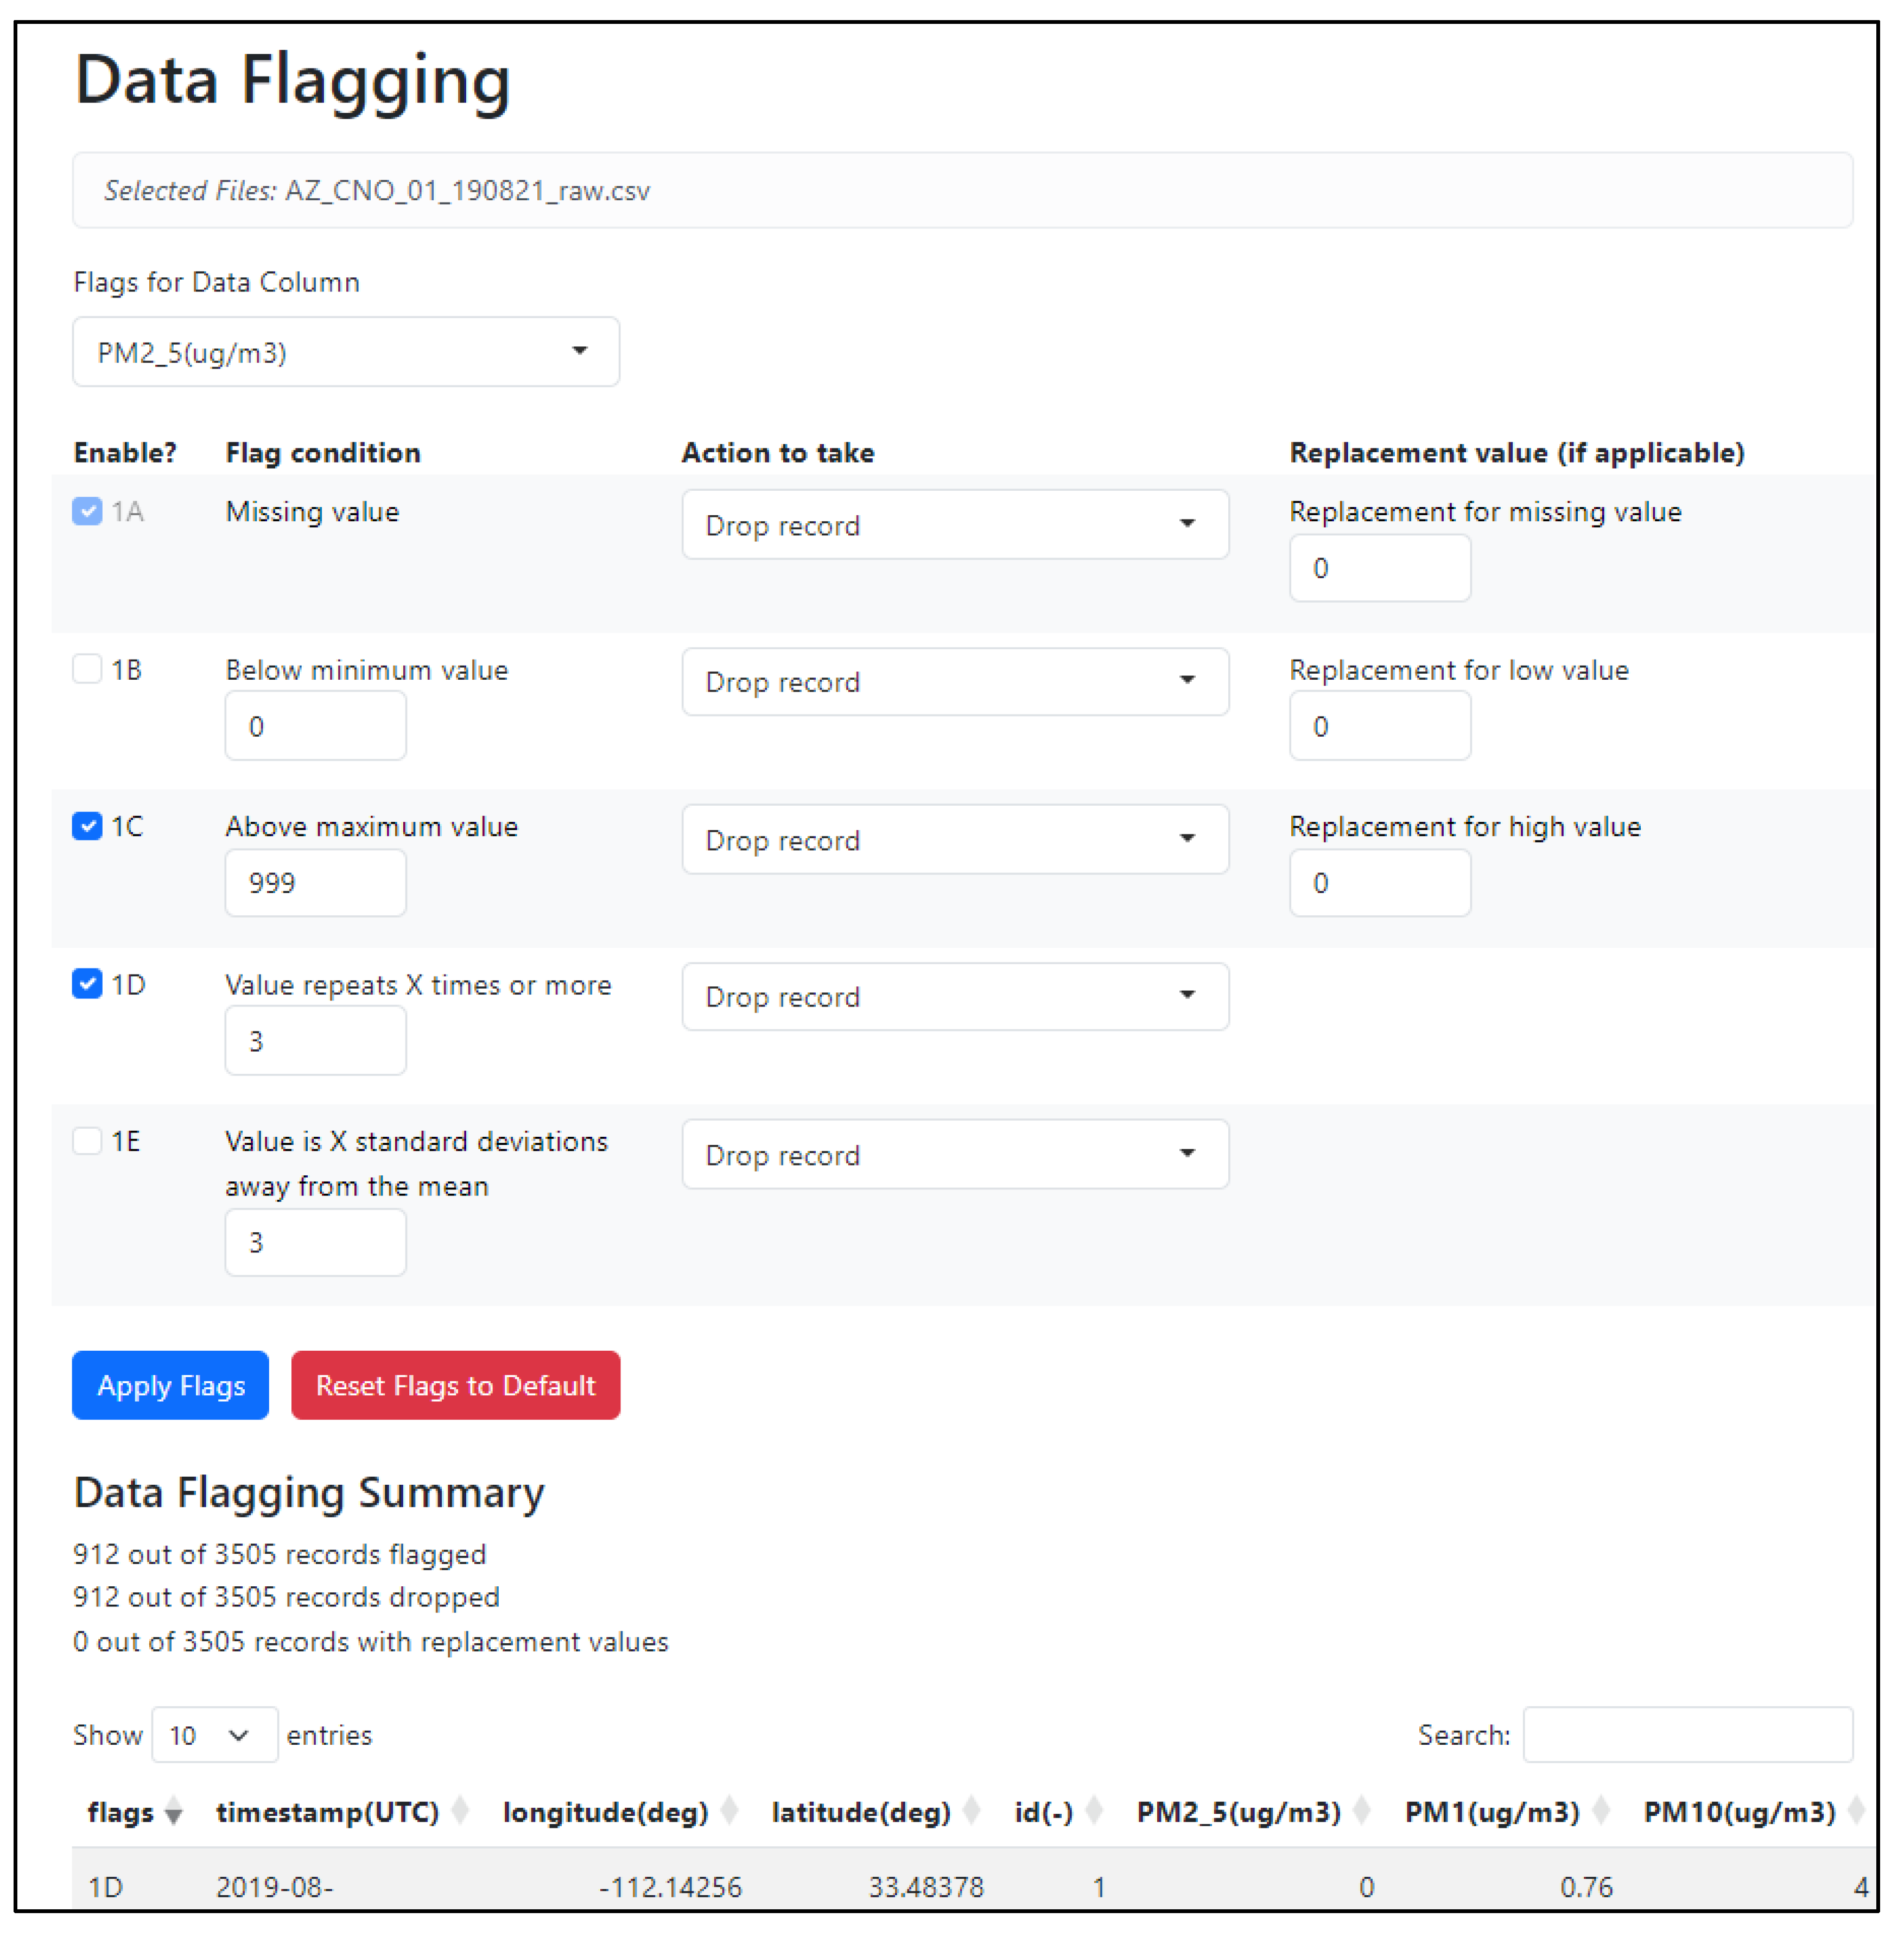

Table 1.
Priority datasets for inclusion into ASDU.
| Manufacturer | Model | File Format |
|---|---|---|
| Aeroqual (Auckland, New Zealand) | AQY | csv |
| Aeroqual (Auckland, New Zealand) | AQY-R | csv |
| Airly Inc. (Palo Alto, CA, U.S.) | Airly | csv |
| APIS (Grants Pass, OR, U.S.) | APIS | csv |
| Applied Particle Technology (Boise, ID, U.S.) | Maxima | csv |
| Clarity Movement Co. (Berkeley, CA, U.S.) | Node-S | csv |
| Davis Instruments (Hayward, CA U.S.) | AirLink | xlsx |
| Dylos corporation (Riverside, CA, U.S.) | Dylos | txt |
| Ecomeasure (Saclay, France) | Ecomeasure_SGS | xlsx |
| Habitat Map (Brookly, NY, U.S.) | AirBeam2 | csv |
| Habitat Map (Brookly, NY, U.S.) | AirBeam1 | csv |
| Habitat Map (Brookly, NY, U.S.) | AirBeam3 | csv |
| IQAir (Goldach, Switzerland) | AirVisual Pro | csv |
| Kunak (Navarra, Spain) | Air Pro | csv |
| Myriad Sensors (Brentwood, TN, U.S.) | Pocket Lab Air | csv |
| PurpleAir (Draper, UT, U.S.) | PA-II-SD | csv |
| Sensirion (Stäfa, Switzerland) | SEN44 | xlsx |
| Sensit Technologies (Valparaiso, IN, U.S.) | RAMP | txt |
| TSI (Shoreview, MN, U.S.) | BlueSky | csv |
| Washington Department of Ecology (WA, U.S.) | Custom build with Sensiron 1 | csv |
1 Downloaded through Envista ARM, DR DAS Granville, OH, U.S.
Table 2.
User feedback and updates to ASDU.
| Feedback | Reason | Version | Addressed |
|---|---|---|---|
| Better timezone handling | Although daylight savings time is not preferred for most air monitoring applications some data may still come in in daylight time and need adjustment | Beta test version | Yes |
| Better time format detection and error handling | Some example datasets were not correctly loaded | Beta test version | Yes |
| Consider more than 10 header rows | Some datasets have many rows before the header | Beta test version | User can now advance through subsequent rows |
| Improved error handling on latitude and longitude | Backwards latitude and longitude crashes ASNAT | Beta test version | Yes |
| Better documentation needed on averaging method | Beta test version | Added documentation (e.g., 11:00 to 11:59 labeled as 11:00) | |
| Add pressure data type | Beta test version | Yes | |
| Allow user to remove problematic data | Beta test version | Data flagging added | |
| Data rounding | Too many decimal places included on the sensor data. Not enough decimal places included on the latitude and longitude. | Beta test version, Public version |
Yes |
| Allow larger file uploads | High time resolution data (e.g., minutes) can generate large files quickly | Public version | 100 MB max file size |
| Improve installation error | Library version conflict | Public version | Yes |
| Assign unique sensor IDs if location changes | Sensors may be stationary but rotate through multiple sites for quality assurance or other reasons throughout a project | Public version | Yes |
| Ensure output data is sorted by timestamp and sensor ID | Needed if multiple sensors are then loaded to ASNAT | Public version | Yes |
| Sensor API direct import (e.g., Clarity, QuantAQ) | Save users the step from API download then ASDU upload. | Public version | Potential future priority |
| Have a publicly hosted tool | Save users from needing to install R and dependent libraries | Beta test version, Public version |
Potential future priority |
| Allow user to create custom Data Types, Extensions, and Units | Beta test version | Potential future priority |
Disclaimer/Publisher’s Note: The statements, opinions and data contained in all publications are solely those of the individual author(s) and contributor(s) and not of MDPI and/or the editor(s). MDPI and/or the editor(s) disclaim responsibility for any injury to people or property resulting from any ideas, methods, instructions or products referred to in the content. |
© 2025 by the authors. Licensee MDPI, Basel, Switzerland. This article is an open access article distributed under the terms and conditions of the Creative Commons Attribution (CC BY) license (http://creativecommons.org/licenses/by/4.0/).
Copyright: This open access article is published under a Creative Commons CC BY 4.0 license, which permit the free download, distribution, and reuse, provided that the author and preprint are cited in any reuse.


