Submitted:
28 July 2025
Posted:
30 July 2025
You are already at the latest version
Abstract
This study presents a uniquely comprehensive and deployment-ready framework for predicting cybersecurity incidents through item-level behavioral, cognitive, and dispositional indicators. Based on survey data from 453 professionals across countries and sectors, we developed 72 logistic regression models across twelve self-reported incident outcomes—from account lockouts to full device compromise—within six analytically stratified layers (Education, IT, Hungary, UK, USA, and full sample). Drawing on five theoretically grounded domains—cybersecurity behavior, digital literacy, personality traits, risk rationalization, and work–life boundary blurring—our models preserve the full granularity of individual responses rather than relying on aggregated scores, offering rare transparency and interpretability for real-world applications. This approach reveals how stratified models, despite smaller sample sizes, often outperform general ones by capturing behavioral and contextual specificity. Moderately prevalent outcomes (e.g., suspicious logins, multiple mild incidents) yielded the most robust predictions, while rare-event models, though occasionally high in AUC, suffered from overfitting under cross-validation. Beyond model construction, we introduce threshold calibration and fairness-aware integration of demographic variables, enabling ethically grounded deployment in diverse organizational contexts. By unifying theoretical depth, item-level precision, multilayer stratification, and operational guidance, this study establishes a scalable blueprint for human-centric cybersecurity. It bridges the gap between behavioral science and risk analytics, offering the tools and insights needed to detect, predict, and mitigate user-level threats in increasingly blurred digital environments.
Keywords:
human-centered cybersecurity
; item-level modeling
; cybersecurity behavior
; risk rationalization
; work–life boundary blurring
; logistic regression
; digital literacy
; personality traits
; cybersecurity risk prediction
1. Introduction
Cybersecurity risk refers to the potential for harm, loss, or disruption resulting from malicious digital activity. In both workplace and personal contexts, such risk can manifest as either objective harm—such as unauthorized access, data breaches, financial loss, or device malfunction—or as behavioral vulnerability, characterized by risky user practices that increase exposure to threats. Measuring objective cybersecurity incidents remains challenging in general populations, given the relatively low frequency and frequent invisibility of such attacks. However, survey-based self-reports provide a valuable window into the lived experiences of users, capturing a broad spectrum of events—from account lockouts and password resets to identity theft, financial fraud, and ransomware-related system failures. These events form the foundation for the present study, which distinguishes between six types of self-reported cybersecurity incidents to investigate their behavioral and psychological predictors. In doing so, we emphasize not just whether individuals have been victimized, but how everyday behaviors and dispositions systematically elevate their risk, especially as personal and professional digital boundaries become increasingly entangled.
The ongoing convergence of personal and professional digital domains has profoundly reshaped the cybersecurity landscape. As hybrid work arrangements, flexible schedules, and Bring-Your-Own-Device (BYOD) policies become the norm, individuals now navigate increasingly digitally entangled environments, where traditional boundaries between work and home have eroded (Barlette et al., 2021; Borkovich & Skovira, 2020). This phenomenon—commonly referred to as boundary collapse—has introduced new layers of vulnerability that challenge the effectiveness of conventional security measures (Hasan et al., 2021; Pollini et al., 2022). Employees, particularly knowledge workers, are now central actors in organizational risk exposure, as their personal digital behaviors—once peripheral—are directly implicated in enterprise-level security outcomes (Dalal et al., 2022; Zimmermann & Renaud, 2019). These developments have prompted calls for a more human-centered understanding of cybersecurity, one that accounts for not only technical infrastructure but also individual behaviors, cognitive patterns, and contextual pressures (Diesch et al., 2020; Glaspie & Karwowski, 2018).
Motivated by this shift, the present study initially focused on Work–Life Blurring (WLB) as a theoretically salient antecedent of cybersecurity risk. WLB has been linked to digital overload, psychological detachment failure, and the diffusion of personal accountability across work and non-work roles (Derks et al., 2014; Kossek et al., 2012; Thilagavathy and Geetha, 2023). From a conceptual standpoint, WLB offered a compelling lens for anticipating cybersecurity incidents: as workers fluidly alternate between private and professional use of devices, the likelihood of behavioral lapses and policy violations was presumed to increase. Accordingly, the research was initially aimed at demonstrating that Work–Life Blurring (WLB) is a strong and distinctive theoretical domain for predicting cybersecurity incident risk. However, exploratory analyses of responses from the pilot survey indicated that WLB alone lacked sufficient predictive strength to account for variance in incident occurrence. Instead, other theoretical domains—such as specific cybersecurity behaviours, cognitive rationalizations, and personality traits—emerged as stronger predictors of incidents.
This empirical redirection aligns with a growing body of research emphasizing individual-level behavioral and dispositional risk factors over environmental constructs. For example, Baltuttis et al. (2024) demonstrated that indicators such as attention and diligence, resilience, and trusting mindset better predicted susceptibility to phishing attempts than contextual dimensions like WLB. Similarly, prior studies have shown that traits such as impulsiveness, low conscientiousness, and high general trust are reliably associated with poor cybersecurity practices (Gratian et al., 2018; McCormac et al., 2017; Shappie et al., 2020). The use of cognitive rationalizations—such as justifying unsafe behavior due to time pressure or convenience—also reflects known mechanisms of moral disengagement and policy violation (Cheng et al., 2014; Siponen & Vance, 2010). These findings suggest that while WLB may function as a situational amplifier, it is the behavioral choices, cognitive framing, and personality-linked dispositions of users that most directly shape the likelihood of cybersecurity incidents.
Building on these insights, the present study aims to predict cybersecurity incidents using a five-domain conceptual framework encompassing Work–Life Blurring, Risk Rationalization, Cybersecurity Behavior, Digital Literacy, and Personality. Each domain captures a distinct facet of individual vulnerability, ranging from contextual role diffusion to cognitive justifications, practical skills, and trait-level predispositions (McCormac et al., 2017; Siponen & Vance, 2010; Thilagavathy and Geetha, 2023). The study specifically distinguishes between mild incidents (e.g., account lockouts, password resets) and serious incidents (e.g., financial loss, impersonation, or device compromise), reflecting the real-world variability in outcome severity (Baltuttis et al., 2024; Redmiles et al., 2016).
In designing the study, the survey items for each of the five domains were initially intended to represent a distinct underlying construct, with the expectation that this structure would be supported by Exploratory and Confirmatory Factor Analysis. However, preliminary analyses revealed that not all five domain show sufficient unidimensionality to support latent variable modeling (Glaspie & Karwowski, 2018; Maalem Lahcen et al., 2020). Moreover, predictive models using domain-level factor scores consistently underperformed compared to those using individual survey items, as measured by area under the curve (AUC) in logistic regression. While factor scores are valuable for construct validation, they tend to average out item-specific variance that may carry unique predictive signal. In contrast, item-level models preserve this granular behavioral information, which is essential for accurate incident forecasting and actionable risk profiling. Based on these findings, we adopted an item-level logistic regression approach, prioritizing interpretability and maximizing predictive accuracy. This method also enables survey items to serve as direct, transparent inputs for cybersecurity training and self-assessment tools (Pollini et al., 2022).
This study contributes to cybersecurity research in three key ways. First, it introduces a theoretically grounded and empirically optimized framework for predicting cybersecurity incident risk through five complementary domains—spanning contextual, behavioral, cognitive, and dispositional dimensions. Second, it advances human-centered modeling techniques by demonstrating the utility of interpretable, item-level models in hybrid digital ecosystems. Third, it provides actionable insights for policy and training by modeling predictors across blurred work–life environments and differentiating incident severity. These findings support targeted interventions—from user-level self-assessment tools to behavior-specific workplace protocols—positioning predictive behavioral modeling as a cornerstone of next-generation cybersecurity in digitally integrated, boundary-dissolved environments.
2. Literature Review
While cybersecurity behavior is shaped by a wide range of organizational, cultural, and infrastructural influences, our focus is restricted to individual-level predictors. In line with the study’s goal—to build interpretable models from user-reported data—we exclude factors such as organizational security culture, policy enforcement, and community-level deterrents, which, though important (e.g., Glaspie & Karwowski, 2018; Lahcen et al., 2020), fall outside the scope of our end-user-centered framework.
This section is organized into three parts.
Section 2.1 introduces the five thematic domains that served as predictors in our modeling framework: Work–Life Blurring, Risk Rationalization, Cybersecurity Behavior, Digital Literacy, and Personality Traits. These domains were selected for their conceptual distinctiveness, empirical grounding, and applicability in behaviorally driven cybersecurity research. Each domain reflects a specific pathway through which users may become vulnerable to digital threats, and their operationalization in the survey enabled interpretable, item-level analysis.
Section 2.2 turns to the outcome side of our model: the typology of cybersecurity incidents reported by participants. Drawing on prior work in digital behavior research, we classify incidents into mild and serious categories to capture the full spectrum of consequences. We also introduce composite outcome variables designed to improve robustness in classification.
Finally, Section 2.3 reviews prior approaches to predictive modeling in cybersecurity, focusing on how user-level vulnerability has been estimated using survey-based scoring tools, real-time behavioral analytics, and hybrid systems that combine static and dynamic inputs. Despite growing calls for human-centered cybersecurity, surprisingly little is known about the actual predictive power of behavioral and psychological variables in forecasting real-world incidents. Much of the existing literature offers conceptual frameworks or retrospective accounts but stops short of rigorously testing whether behavioral indicators meaningfully outperform—or even complement—technical or organizational predictors. As such, the empirical strength of the behavioral perspective remains an open question. This study seeks to address that gap by evaluating the predictive contributions of multiple behavioral, cognitive, and dispositional domains in explaining incident occurrence. This context provides a methodological foundation for our use of logistic regression and situates our approach within ongoing efforts to operationalize human-centered cybersecurity through scalable and adaptive predictive tools.
Together, these three sections provide the conceptual and empirical basis for the predictive models presented in the remainder of the paper.
2.1. Behavioral-Cognitive Domains of Cyber Risk
This section presents the five-domain conceptual framework that underpins our predictive modeling of cybersecurity incident risk.
Although Work–Life Blurring (WLB) emerged in this study as a weaker direct predictor of cybersecurity incidents, its theoretical relevance as a contextual amplifier of digital risk remains compelling. WLB refers to the erosion of traditional boundaries between professional and personal domains, often driven by ubiquitous connectivity, mobile technologies, and flexible work arrangements. Drawing from boundary theory and segmentation–integration models (Ashforth et al., 2000; Kossek et al., 2012; Nippert-Eng, 1996), WLB captures individuals’ capacity—or lack thereof—to maintain psychological detachment and role clarity in hybrid environments. Prior studies have linked WLB to increased technostress, digital fatigue, and self-regulatory depletion, all of which are hypothesized precursors to risky digital behavior (Derks et al., 2014; Mazmanian et al., 2013; Wajcman et al., 2010). Recent conceptual reviews employing the Antecedents–Decisions–Outcomes (ADO) framework further underscore the multidimensionality of WLB, highlighting how various antecedents—including organizational expectations and digital norms—interact with individual coping strategies and behavioral outcomes (Singh et al., 2022). Other empirical evidence suggests that WLB may not directly cause security lapses but instead creates gray zones in which secure and insecure behaviors coexist without clear norms or oversight (Borkovich & Skovira, 2020; Thilagavathy and Geetha, 2023).
In operational terms, our survey captured WLB through items measuring difficulty in detachment from work-related communications, frequency of cross-domain device sharing, and perceived expectations of constant availability.
Risk Rationalization (RR) refers to cognitive mechanisms by which individuals justify their security-compromising actions. This concept extends Bandura’s (1999) theory of moral disengagement and is aligned with neutralization theory from criminology, as applied in information systems security contexts (Siponen & Vance, 2010; Willison et al., 2018). Users may, for instance, rationalize bypassing a security step as a necessity due to work urgency or consider it harmless if no immediate consequence follows (Cheng et al., 2014; Posey et al., 2011). Recent studies have reframed such justifications as a form of “cybersecurity hygiene discounting,” wherein individuals diminish the perceived importance of routine protective behaviours—such as software updates or secure password use—based on convenience or perceived irrelevance (Siponen et al., 2024). This reframing builds on and expands traditional neutralization theory by emphasizing not only post-hoc rationalizations but also proactive cognitive shortcuts that devalue protective norms. Empirical work further confirms that specific rationalization techniques, such as denial of responsibility and metaphor of the ledger, significantly predict misuse of organizational information systems, even when policy awareness and deterrence are present (Mohammed et al., 2025). These developments highlight RR not merely as a residual factor but as a central cognitive mechanism actively shaping security compliance and noncompliance in workplace settings.
Our survey included RR items reflecting common justifications: blaming inconvenience, shifting responsibility, or citing lack of clarity in policy requirements.
Cybersecurity Behaviour (CB) encompasses tangible user actions that either mitigate or amplify digital risk exposure. Foundational research has linked insecure practices—such as habitual password reuse, neglecting software updates, and sharing personal devices—to elevated organizational vulnerabilities (Hadlington, 2018; Pfleeger et al., 2014; Vance et al., 2012). Parallel findings have also emerged in higher education, where survey-based models have revealed distinct behavioral dimensions shaping students’ cybersecurity awareness and practices (Bognár & Bottyán, 2024). Conversely, secure behaviours like enabling multi-factor authentication (MFA) and regularly updating credentials have been shown to significantly reduce breach likelihood (Bulgurcu et al., 2010; Ng et al., 2009). Later empirical work continues to support these findings. Zwilling et al. (2020), in a cross-national survey, found that despite relatively high awareness, individuals often failed to adopt protective behaviours such as using strong and unique passwords or enabling MFA. Recent studies reinforce the continued importance of cybersecurity behaviours. A 2025 systematic review of multi-factor authentication (MFA) in digital payment systems found that, despite its clear protective benefits, MFA remains underutilized due to usability challenges and misalignment with NIST standards (Tran-Truong et al., 2025). In parallel, usage trends show many small and medium-sized businesses still lagging—65% reported not implementing MFA, often citing cost and lack of awareness. Regarding password hygiene, Radwan and Zejnilovic (2025) reported that nearly half of observed user logins are compromised due to password reuse. Complementary data from JumpCloud (Blanton, S. 2024) revealed that up to 30% of organizational breaches involve password sharing, reuse, or phishing—highlighting how user behaviour continues to drive risk. These findings underscore the persistent relevance of secure digital habits and the necessity of tracking them at the user level for effective cybersecurity risk assessment.
Our behavioural scale was designed to reflect these ongoing risks by including both negatively and positively framed items that capture users' actual digital practices—such as MFA usage and password management—rather than relying solely on self-perceived awareness.
Digital Literacy (DL) incorporates both general digital skills and cybersecurity-specific awareness. Foundational scholarship by Paul Gilster (1997) first described digital literacy as the capacity to “…understand and use information from a variety of digital sources,” establishing early recognition of its multifaceted nature. Subsequent work by DiMaggio and Hargittai (2001) expanded this to include both access to technology and the skills to use it effectively. Hargittai (2005) further refined the concept, emphasizing users’ navigational competence and evaluative judgment online. Park (2011) showed that knowing how the internet works, how companies use data, and what privacy policies mean helps people take better control of their online privacy—highlighting why digital literacy matters for cybersecurity behaviour. Later, van Deursen and van Dijk (2014) introduced a layered model of digital literacy encompassing operational, formal, and critical dimensions—areas crucial for interpreting security-related signals. Recent studies reinforce DL’s role in cybersecurity resilience. A qualitative study found that low digital literacy increases the vulnerability of both individuals and organizations to cyberattacks (Ramadhany et al., 2025). In Vietnam, Phan et al. (2025) reported that higher digital literacy predicts better personal information security behaviors, indicating stronger technical and policy awareness leads to safer online actions. Broader evidence also shows that people with higher digital literacy are significantly better at spotting phishing scams and other online threats (Ismael, 2025). These findings underscore that DL is not just theoretical, they confirm it is a measurable and trainable asset essential for reducing cybersecurity risk.
Our DL scale thus captures confidence and competence in managing digital risk—evaluating email legitimacy, interpreting URLs, and identifying secure connections. Items also reflect functional digital fluency, procedural autonomy, and emotional self-regulation, including technostress.
Personality Traits (P) have long been recognized as foundational predictors of individual behaviour across domains, including cybersecurity. The Big Five model (McCrae & Costa, 1999) remains the most widely adopted framework in this context, encompassing five dimensions: Openness to Experience, Conscientiousness, Extraversion, Agreeableness, and Neuroticism. Several other traits frequently investigated in cybersecurity research—such as Impulsivity, Vigilance, or Trust Propensity—can be understood as facets or behavioural expressions rooted in these five broader domains. Impulsivity often conceptualized as a facet of low Conscientiousness (e.g., lack of discipline, poor self-control) or high Neuroticism (e.g., emotional reactivity, stress-driven decisions). Its inclusion in cybersecurity research reflects its strong predictive value for risky behaviour (Gratian et al., 2018; Hadlington, 2017; McCormac et al., 2017). Research on personality and privacy suggests that individuals high in Agreeableness and Openness to Experience often show heightened concern for personal data and privacy-preserving behavior. For example, they tend to value ethical norms and communal responsibility, which motivates cautious sharing and adherence to privacy settings (Junglas et al., 2008; Li et al., 2012; Shappie et al., 2020). Conversely, empirical findings in online behavior indicate that higher Openness is sometimes associated with more extensive information disclosure—such as increased posting activity and less restrictive privacy settings on social platforms—suggesting a complex, context-dependent relationship (Halevi et al., 2013). So, while the theoretical expectation is that Agreeableness and Openness promote privacy-conscious behavior, actual outcomes may vary depending on context and manifestation of the trait.
Our measurement of personality traits reflects a behaviorally grounded adaptation of the Big Five. Openness was assessed through items reflecting curiosity toward new technologies and willingness to explore digital tools. Conscientiousness captured attention to digital organization and task follow-through. Extraversion was reflected in social media participation and online community engagement, while Agreeableness focused on conflict aversion and valuing others' digital privacy. Neuroticism was indexed by anxiety about unpredictability and loss of digital control.
2.2. Self-Reported Cybersecurity Incidents: Typology and Prior Research
To model cybersecurity risk effectively, it is essential not only to identify predictive factors but also to define meaningful outcome variables. In our study, we classify six self-reported incident types into two severity categories. Mild incidents (INC1–INC3) include account lockouts, forced password resets, or unauthorized login notifications, while Serious incidents (INC4–INC6) refer to financial loss, impersonation or total device compromise. This two-tiered typology reflects both user-level consequences and broader systemic risks. It aligns with existing empirical categorizations that distinguish digital harms by severity, user awareness, and operational disruption (Buil-Gil et al., 2023; Redmiles et al., 2016; Wash & Cooper, 2018). Although self-reports are susceptible to recall bias and semantic variability, structured survey instruments grounded in concrete behavioral language can yield valid insights into cybersecurity exposure—especially when log data are unavailable (Buil-Gil et al., 2023). These instruments are particularly effective when paired with typological frameworks that make distinctions users can easily understand and recall. Recent conceptual advances also support the importance of severity-based models. Conard (2024) proposed the Cybersecurity Incident Severity Scale (CISS), a multidimensional framework that formalizes severity by integrating technical, operational, and human-centric impact factors. Drawing on analogies from emergency response and public health (e.g., Richter and NIH stroke scales), the CISS model allows researchers and practitioners to assign meaningful weight to diverse outcomes, including disruptions to workflow, psychological distress, or reputational damage. While our study does not adopt CISS scoring directly, it shares the foundational aim of quantifying cyber harm beyond a single binary breach/no-breach outcomes.
In our survey, participants responded to six binary (yes/no) items indicating whether they had experienced specific cybersecurity incidents in the past. In addition to analysing these individual outcomes, we also constructed composite variables—for example AtLeastOneMild and AtLeastOneSerious, to improve statistical robustness and capture the breadth of user-reported experiences. This approach allows us to map behavioural predictors to cybersecurity consequences with greater granularity and practical relevance.
2.3. Predictive Modeling in Cybersecurity Research
Historically, much cybersecurity research has focused on predicting behavioural intentions or compliance-related patterns—such as willingness to follow security policies, password reuse, or responses to phishing simulations (Hanus & Wu, 2016; McCormac et al., 2017). While such models are valuable for understanding user psychology and identifying risk-prone behaviour, they are often limited in practical application, as their response variables typically reflect proxy measures—like self-reported intentions or isolated behavioural tendencies—rather than actual, user-reported security incidents. The challenge, then, is how to bridge the gap between theoretically grounded survey constructs and the operational prediction of real-world security events that carry tangible consequences for users and organizations alike.
Our study addresses this gap by using actual self-reported incidents as outcome variables, including both mild and serious events. This approach is conceptually consistent with the call for human-centered modeling in cybersecurity (Diesch et al., 2020; Glaspie & Karwowski, 2018) yet methodologically optimized for operational application: each predictor reflects a directly observable, interpretable, and potentially modifiable aspect of individual digital behavior.
While some may argue that survey-based models lack the immediacy or behavioral granularity of telemetry-based systems, recent work has demonstrated that well-constructed surveys can yield meaningful and predictive insights into incident susceptibility. Notably, de Bruin (2022) developed multilevel models using survey data from over 27,000 EU citizens and 9,000 enterprise users, linking individual characteristics—such as prior incident experience, digital confidence, and national cultural context—to actual phishing simulation outcomes and configuration behaviors. Although the study focused on behavioral outcomes rather than incident labels per se, its integration of cultural, organizational, and psychological predictors showed that survey-derived data can approximate real-world risk conditions when designed thoughtfully.
Our approach builds on and extends this logic. Rather than predicting behavioral proxy outcomes (e.g., clicks in phishing simulations), we directly model self-reported security incidents—a more ecologically valid and practically relevant endpoint. The use of logistic regression on item-level survey data offers two core advantages. First, it circumvents the need for strict unidimensionality, which, as our factor analysis showed, was lacking in domains based on diverse behavioral indicators (Lahcen et al., 2020). Second, it allows each survey item to serve as a transparent predictor, which can be immediately interpreted, acted upon, and potentially integrated into personalized risk assessments or training interventions.
In operational contexts, survey-based predictive models can be transformed into practical scoring tools. These scores—whether expressed numerically or categorized into levels such as low, medium, or high—enable organizations to identify users with elevated susceptibility to cybersecurity incidents based solely on self-reported inputs. When integrated into onboarding procedures, periodic training, or targeted assessments, such tools allow for scalable, privacy-preserving interventions, including just-in-time prompts, personalized awareness campaigns, or access restrictions. Importantly, this approach maintains interpretability and transparency, distinguishing it from opaque machine learning systems often embedded in security infrastructure. However, survey-based models may lack temporal sensitivity, prompting researchers and practitioners to explore hybrid approaches that combine static user characteristics with real-time telemetry. One increasingly adopted solution is User and Entity Behaviour Analytics (UEBA), which enhances detection by linking baseline profiles with dynamic activity patterns such as login behaviour, device usage, or authentication anomalies (Khaliq et al., 2020). In such frameworks, survey-based scores can function as front-end risk indicators or baseline inputs that are subsequently refined through behavioural monitoring (Diesch et al., 2020; Danish, 2024). These developments reflect a growing consensus that predictive human-risk modelling is most effective when embedded within adaptive, multi-channel security architectures that integrate cognitive, dispositional, and behavioural dimensions in real time.
3. Methodology
This section outlines the study’s methodological framework, covering data collection procedures, survey design, outcome definitions, and the modeling strategy. We also detail our approach to model evaluation, including cross-validation, overfitting checks, and threshold optimization for selected models.
3.1. Participants and Procedure
Data Collection Challenges in Cybersecurity Research
Collecting reliable data on cybersecurity behavior presents unique methodological and ethical challenges. Participants may underreport risky actions or overstate their awareness due to social desirability bias, forgetfulness, or lack of self-awareness. Experimental designs, such as phishing simulations, can yield more realistic insights but often raise ethical concerns, particularly when deception is involved. As a result, large-scale self-reported surveys—despite their limitations—remain one of the most practical and ethically sound approaches for investigating individual risk patterns across diverse populations. In this study, we opted for an indirect measurement strategy using self-report survey items, balancing feasibility, ethical standards, and the need for behavioral detail.
Two-Phase Recruitment Strategy
To ensure both depth and diversity in the responses, data collection occurred in two phases. The first phase involved convenience sampling within the researcher’s own academic and professional network, including friends, colleagues, and some university students. This approach yielded 197 cleaned responses, providing an initial foundation of cybersecurity-related experiences and behavioral profiles. However, early analyses revealed demographic and occupational homogeneity in the initial sample, prompting a second phase of data collection via the Prolific platform. Data from Prolific were collected in five sequential rounds. After each round, the sample was reviewed to assess underrepresented sectors, countries, or demographic layers. This adaptive, layer-filling approach allowed for a more balanced representation of professional domains, national contexts, age groups, and gender identities, improving the generalizability of the findings.
Phase 1: Pilot Sample (N = 197)
The initial data collection relied on convenience sampling among the researcher's acquaintances, students, and colleagues. After cleaning, this sample included 197 valid responses, largely from Hungary (73%) and Romania (18%). Participants were fairly evenly split by gender (54% female, 46% male) and represented a wide age range, skewed toward the 35–54 age group. Educational attainment ranged from high school (34%) to doctoral degrees (12%), and the most common employment sectors were Education (26%), IT/Technology (23%), and Finance/Business (10%).
Phase 2: Prolific Sample (5 Rounds, Total N = 256 Cleaned)
To diversify the sample across countries, sectors, and demographic strata, data collection was conducted in five adaptive rounds on Prolific.
Round 1 (N = 6 cleaned): Trial Deployment
This round served as a technical trial to confirm instrument compatibility with the Prolific platform. Basic demographic filters were applied.
Round 2 (N = 130 cleaned): Main Data Collection Launch
This round aimed to expand beyond Central-Eastern Europe by targeting respondents from six Western countries (UK, USA, Ireland, Germany, Austria, Netherlands). Filters ensured participants were actively employed (full-time or part-time) and used digital devices for at least 25% of their work tasks. Education levels were diverse, spanning from secondary to graduate degrees. However, sector information was not yet included, limiting interpretation of occupational vulnerability.
Round 3 (N = 40 cleaned): Country and Education Balancing
This round refined geographic targeting to four underrepresented countries from Round 2 (Ireland, Germany, Austria, Netherlands) while maintaining the same work and education filters. The goal was to address geographic imbalances and add mid-range education categories (technical/community college).
Round 4 (N = 40 cleaned): Occupational Layer Expansion (STEM/IT)
With core demographic balance achieved, Round 4 focused on occupational diversification by explicitly recruiting participants from STEM and IT-related sectors (Information Technology; Science, Technology, Engineering & Mathematics). Country coverage was expanded to include Australia and Sweden, further enhancing geographic diversity. All key filters were applied: digital work engagement, education, and exclusion of earlier participants.
Round 5 (N = 40 cleaned): Sectoral Balancing (Education)
The final round aimed to balance occupational
representation by specifically targeting professionals in Education &
Training—a group underrepresented in the Prolific dataset relative to the
pilot. Filters mirrored those of Round 4, ensuring consistent standards.
Duplicate participants from prior rounds were excluded to prevent overlap and
contamination.
The diversity of the final sample (N = 453) is
summarized in Table 1.
While the resulting dataset is non-representative in a statistical sense, it reflects a diversified convenience sample with improved balance across gender, age, education, sector, and geographic region. Such a design is well suited for the study’s primary aim: to build and internally validate binary logistic regression models that predict self-reported cybersecurity incidents. Given the behavioral focus and the predictive (rather than inferential) goals of the analysis, the emphasis was placed on sampling diversity, methodological transparency, and model performance metrics (e.g., AUC, calibration, and cross-validation), in line with best practices for exploratory modeling in applied behavioral research. The dataset’s heterogeneity also enables comparative analysis across subgroups, making it possible to evaluate whether predictive models built within specific demographic or occupational layers perform better or worse than those trained on the full sample—thereby shedding light on the contextual robustness and generalizability of model-based risk profiling.
3.2. Survey Design and Item Construction
The survey was designed to capture both individual-level predictors of cybersecurity incidents and the incidents themselves. Predictors were organized into five theoretical domains—Work–Life Blurring (WLB), Risk Rationalization (RR), Cybersecurity Behavior (CB), Digital Literacy (DL), and Personality Traits (P)—each represented by multiple item-level questions. The outcome variables included six self-reported incident items (INC1–INC6), along with composite indicators reflecting the occurrence of at least one, two, or all three mild or serious incidents. A complete list of all items, grouped by domain and item ID, is provided in Appendix A Table A1.
3.2.1. Item Development and Theoretical Alignment
Items were designed to reflect distinct behavioral, cognitive, and dispositional factors associated with digital risk. Most were phrased as first-person statements grounded in everyday digital experiences, increasing interpretability and user relevance. Each domain included at least one reverse-coded item to help reduce acquiescence bias and support internal consistency evaluation.
WLB items reflect the degree of digital boundary overlap between personal and professional life (e.g., WLB1: "I use my work and personal accounts interchangeably throughout the day").
RR items assess rationalizations for risky digital behavior under pressure or social influence (e.g., RR5: "Time pressure makes me more likely to overlook security procedures").
CB items include both protective behaviors (e.g., CB1: "I use two-factor authentication") and known vulnerabilities (e.g., CB2_R: "I use the same password on multiple sites").
DL items capture digital skills and self-efficacy (e.g., DL2: "I am confident in spotting suspicious links in emails").
P items reflect behaviorally grounded indicators of the Big Five personality traits: Openness to Experience (P1, P2), Conscientiousness (P3, P4), Extraversion (P5, P6), Agreeableness (P7, P8), and Neuroticism (P9, P10).
Theoretical domains were derived from prior empirical studies and cybersecurity behavior models, and items were crafted to span both attitudinal and behavioral aspects of digital risk. Items were originally designed to represent distinct theoretical domains; however, item-level predictors were ultimately used in modeling due to the multidimensional nature of several domains, as confirmed by factor analytic results discussed later in the paper.
3.2.2. Demographic and Work-Style Variables
The survey also included demographic and contextual items: age group (D1), gender (D2), education level (D3), field of work (D4), and country of residence (D5), along with job type (JR1), remote work possibility (JR2), and use of personal devices for work (JR3). These variables were not used to define analytic layers or stratify the data but were retained for exploratory and post hoc inclusion in the best-performing models.
3.2.3. Incident Outcome Variables
The six incident items (INC1–INC6) captured self-reported experiences with cybersecurity problems, ranging from general digital disruptions to serious events such as financial loss or device failure. Each of these six items was treated as a separate binary response variable (Yes vs. No), allowing for incident-specific modeling. In addition, the items were grouped into two severity-based composite categories:
Mild incidents: INC1–INC3 (e.g., account lockout, suspicious login alerts, password resets)
Serious incidents: INC4–INC6 (e.g., financial loss, impersonation, ransomware/device failure)
For each severity group, three binary composite variables were created to capture cumulative incident exposure:
AtLeastOneMild: Respondent reported at least one mild incident (INC1, INC2, or INC3),
AtLeastTwoMild: Respondent reported two or more mild incidents,
AllThreeMild: Respondent reported all three mild incidents,
AtLeastOneSerious: Respondent reported at least one serious incident (INC4, INC5, or INC6),
AtLeastTwoSerious: Respondent reported two or more serious incidents,
AllThreeSerious: Respondent reported all three serious incidents.
Altogether, these 12 binary outcomes served as dependent variables in the logistic regression models. This structure enabled the analysis of both specific and aggregated cybersecurity risk experiences across varying levels of severity.
3.3. Predictive Modeling Strategy
To ensure both predictive utility and practical relevance, we adopted a layered modeling strategy only for subgroups with real-world operational significance—specifically, participants working in Education, IT/Technology, and those from countries with sufficient sample size (Hungary, UK, and USA). These layers correspond to contexts where organizational or institutional interventions are actionable. In contrast, individual characteristics such as gender, age, and remote work status were not used to split the data or train separate models. Instead, these variables were retained for a later analytic phase, where their inclusion or interaction effects were tested within some illustrative models to explore explanatory enhancement without fragmenting the modelling pipeline.
As described in Section 1 and Section 2.3, item-level logistic regression was selected due to insufficient unidimensionality in several domains and the superior predictive performance of item-based models compared to domain-level factor scores. Although each model was estimated using stepwise logistic regression with item-level predictors, we intentionally refrained from reporting only statistically significant predictors in the model goodness tables. In predictive modeling, significance is not the primary criterion; rather, model performance metrics such as 10-fold AUC and 10-fold deviance R² take precedence. Due to multicollinearity and redundancy within theoretical domains (e.g., multiple items capturing the same behavioral construct), stepwise procedures may exclude some variables even if they carry predictive value in alternate combinations. Listing only the retained variables could misleadingly suggest their unique causal importance, which is not the objective in prediction-focused modeling. Instead, we summarize model composition at the level of contributing theoretical domains, highlighting whether predictors from areas such as risk rationalization or cybersecurity behavior were selected, without overinterpreting individual item inclusion.
Additionally, we limited the inclusion of demographic variables—such as gender, age, remote work, and device sharing—to post hoc analyses in all-data sample or in large-sample layers (e.g., UK, USA, Hungary). This decision reflects both methodological and practical constraints: including such categorical variables in smaller subgroups can lead to overfitting, unstable estimates, or complete separation in logistic regression. By restricting their inclusion to robust models and treating them as explanatory enrichments rather than primary segmentation tools, we aimed to balance model complexity, generalizability, and fairness.
To ensure interpretability and reliability, we applied a strict model categorization protocol based on five criteria: 10-fold AUC, 10-fold deviance R², AUC drop, R² drop ratio, and minimum event count. The 10-fold AUC (Area Under the ROC Curve) evaluates how well a model distinguishes between cases and non-cases across repeated cross-validation folds, providing a robust measure of discriminatory performance. The 10-fold deviance R² captures how much variance the model explains in the outcome variable under cross-validation, serving as a goodness-of-fit indicator. The AUC drop, calculated as the difference between the in-sample and 10-fold AUC, reflects potential overfitting; larger drops suggest that model performance does not generalize well to unseen data. Similarly, the R² drop ratio, which compares in-sample and cross-validated deviance R², quantifies overfitting in model fit. Finally, the minimum event count rule ensures statistical stability by requiring at least 10 cases and 10 non-cases per model; models below this threshold are automatically flagged as weak due to estimation instability.
Models were classified as Good, Moderate, or Weak based on threshold combinations (see Table 2). In addition to absolute performance, the classification protocol incorporated overfitting diagnostics: models with extreme discrepancies between in-sample and cross-validated performance (e.g., large AUC or R² drops) or insufficient class balance (fewer than 10 events or non-events) were automatically downgraded to "Weak", regardless of their nominal AUC or deviance R² values.
Once the best-performing models were identified we proceeded to determine the optimal classification probability thresholds for some of the models as illustrative examples. While 10-fold AUC is effective for comparing models based on their ability to discriminate between outcomes across all possible thresholds, it does not specify which threshold yields the most useful binary classification for real-world decision-making. In practical applications such as cybersecurity risk detection, the threshold determines how sensitive or specific a model will be—affecting the trade-off between false positives and false negatives. For this reason, we optimized thresholds only after selecting the final models, using criteria tailored to our analytic goals (e.g., balancing sensitivity and specificity).
4. Results
This section presents the empirical findings of the
study in four parts. First, we assess the internal consistency and
dimensionality of items assigned to five theoretical domains using Cronbach’s
alpha and exploratory factor analysis (EFA). These
psychometric analyses inform our decision to model predictors at the item level
rather than by aggregated domain scores. Second, we report the performance of logistic
regression models estimated on the full dataset across twelve cybersecurity
incident outcomes. Third, we evaluate layered models stratified by
sector (Education, IT) and country (Hungary, UK, USA), comparing their
performance against the corresponding full-sample models to assess potential
gains in fit and generalizability. Finally, we conduct a post hoc evaluation by
(1) incorporating selected individual-level demographic and contextual
variables (e.g., gender, age, remote work status) into a subset of models
chosen for their illustrative value, and (2) analyzing optimal probability
thresholds for binary classification in selected models to explore the practical
implications of deployment and the potential risk of overfitting,
especially in rare-event outcomes.
4.1. Internal Consistency and Dimensionality of Domain Items
Before fitting predictive models, we assessed the reliability and latent structure of survey items grouped into five theoretically defined domains: Work–Life Blurring (WLB), Risk Rationalization (RR), Digital Literacy (DL), Cybersecurity Behavior (CB), and Personality (P). Internal consistency was evaluated using Cronbach’s alpha, and latent dimensionality was assessed through exploratory factor analysis (EFA) with Varimax rotation. The number of factors retained for each domain was determined using the Kaiser criterion, whereby only factors with eigenvalues greater than 1 were extracted. Table 3 summarizes the reliability coefficients, number of extracted factors, and brief remarks for each domain.
Although internal consistency was acceptable for WLB, RR, and DL (α > 0.70), the Cybersecurity Behavior and Personality domains showed lower alpha values, reflecting the conceptual and behavioral diversity of their items. Below we try to interpret the dimensional structure found in four of the five domains.
Work–Life Blurring (WLB): Two Latent Dimensions
The WLB domain demonstrated high internal consistency (α = 0.8292), indicating strong overall cohesion. However, EFA revealed a two-factor structure:
Factor 1 reflected mental and temporal interference, including work encroaching on personal time or space, such as WLB3 (work tasks interrupt personal time), WLB6_R (difficulty maintaining separation), WLB8 (checking work emails during personal time), WLB10 (mental detachment difficulties), and WLB4 (blended digital identity).
Factor 2 captured platform and device overlap, including the use of shared tools and accounts across work and personal domains, as in WLB2 (checking personal accounts on work devices), WLB5 (using work platforms for personal tasks), WLB7 (shared platforms), WLB9 (shared physical space), and WLB1 (interchangeable accounts).
These findings suggest that work–life blurring spans both cognitive spillover and practical integration, which may independently contribute to digital risk.
Risk Rationalization (RR): Conceptual Refinement Improves Structure
With a Cronbach’s alpha of 0.7224, the RR domain initially showed acceptable reliability. However, EFA identified one item, RR7_R (“I believe it is my responsibility to recognize serious threats before relying on IT”), as loading strongly on a separate factor. This item reflects normative commitment rather than rationalization and runs counter to the self-justifying tone of the other items.
Once RR7_R was excluded, the remaining items clustered cleanly onto a single component with a Cronbach’s alpha of 0.7589, supporting their use as a unidimensional measure of pragmatic justifications for neglecting security practices.
Cybersecurity Behavior (CB): Behavioral Diversity Drives Factor Split
The CB domain showed weaker internal consistency (α = 0.6300), and EFA identified two distinct components:
Factor 1 captured credential-related risks, including password reuse (CB2), skipping software security checks (CB3), and underestimating personal responsibility for account protection (CB6).
Factor 2 reflected proactive and protective behaviors, such as creating backups (CB4), using two-factor authentication (CB1), storing passwords in a password manager (CB5), and regularly checking for threats (CB7).
This factor structure illustrates the dual nature of cybersecurity behavior: users may engage in protective actions while simultaneously neglecting basic credential hygiene, or vice versa. However, even when these two factors were treated separately, internal consistency remained low. Cronbach’s alpha values for both subgroups failed to exceed conventional reliability thresholds, with values for Factor 1 items (e.g., CB2–CB6) ranging between 0.51 and 0.61, and even lower alpha estimates for Factor 2 items, particularly for CB5 (α = 0.398 when omitted), indicating weak item-total correlations.
These results suggest that cybersecurity behaviors, although conceptually grouped, may reflect multiple loosely connected habits rather than a single coherent behavioral trait.
Personality (P): Multi-Trait Structure Confirmed
As expected, the ten personality items fragmented into five components, aligning closely with the Big Five trait model. The internal consistency was relatively low (α = 0.6117), which is not surprising given the heterogeneity of the traits:
- Openness (P1, P2): Interest in technology and innovation.
- Conscientiousness (P3, P4): Attention to detail, organization.
- Extraversion (P5, P6): Social engagement.
- Agreeableness (P7, P8): Conflict avoidance, empathy.
- Neuroticism (P9, P10): Anxiety and control concerns.
This confirms that these items reflect distinct personality traits rather than a unified latent construct.
Although several domains demonstrated acceptable to strong internal consistency, the EFA results showed that unidimensional scores were not justified in most cases. Based on this, we chose to retain individual items as predictors in the logistic regression models, using domain membership only as a labeling tool for interpretability. This approach respects both the empirical structure of the data and the theoretical diversity of digital risk-related behaviors.
4.2. Model Results—All Data
Table 4
presents the performance of logistic regression models estimated on the full
dataset for twelve binary outcome variables. These include six
incident-specific outcomes (INC1–INC6) and six composite indicators capturing
cumulative exposure to mild or serious incidents.
Model performance was assessed using four key
metrics: AUC and deviance R², both in-sample and under 10-fold
cross-validation. Model strength was categorized as Good, Moderate, or Weak
based on the criteria outlined in Section 3.3.
Key results include the following: The AllThreeSerious model achieved the strongest performance, with high discrimination (10-fold AUC = 0.829) and cross-validated fit (10-fold Deviance R² = 15.75%), despite the low number of positive cases. The AtLeastOneMild model also performed well (10-fold AUC = 0.759; 10-fold Deviance R² = 7.77%), demonstrating solid generalizability across a well-populated outcome. AtLeastTwoMild and INC2 reached the moderate performance range, while all other models were categorized as Weak, either due to low discrimination, limited variance explained, or unstable event distributions.
Across the twelve full-sample models, Cybersecurity Behavior (CB) appeared most consistently, included in 11 out of 12 models. Risk Rationalization (RR) and Personality (P) were each retained in 10 models, while Digital Literacy (DL) and Work–Life Blurring (WLB) were present in 7 models each. Stronger-performing models (e.g., AtLeastOneMild, AtLeastTwoMild, AllThreeSerious) tended to incorporate predictors from multiple domains, suggesting the added value of diverse theoretical inputs.
These results establish a full-sample baseline and will serve as a comparison point for the stratified models presented in the next section.
4.3. Model Results—Layered Models
This section examines whether stratifying the sample by organizationally meaningful subgroups improves model performance. Logistic regression models were re-estimated within five analytically motivated layers: Education, IT and Technology, and three country-based groups (Hungary, UK, and USA). The structure of the outcome variables remained unchanged, allowing direct comparison of model fit metrics with those from the full-sample models.
4.3.1. Education Layer
Table 5 summarizes model performance for participants working in the Education sector (N = 104). Overall, stratification yielded notable improvements in discrimination and generalization across several outcomes.
Several incident-specific models (e.g., INC1–INC3) achieved higher 10-fold AUCs and 10-fold deviance R² values than their full-data counterparts. Notably: INC2 improved from a 10-fold AUC of 0.691 in the full data to 0.8208 in the Education layer, with 10-fold deviance R² rising from 7.61% to 19.43%. INC1 and INC3 also moved from the weak range into the good category, showing marked gains in both discrimination and fit. While some models still exhibited limitations—particularly for rare outcomes like AllThreeSerious or INC5—the overall pattern suggests performance benefits from sector-specific modeling, especially in moderately prevalent outcomes.
4.3.2. IT and Technology Layer
Table 6
summarizes model performance for participants working in the IT or Technology
sector (N = 133).
Several models achieved notably high discrimination and cross-validated deviance R², particularly: AtLeastTwoMild and AllThreeMild, with 10-fold AUCs of 0.8005 and 0.7483 respectively, and 10-fold R² values of 15.83% and 12.70%. INC2 and INC5 also achieved strong results, with cross-validated AUCs above 0.76 and R² values above 12%.
As in the Education layer, some models showed performance drops associated with low event counts or potential overfitting (e.g., AllThreeSerious and AtLeastOneMild), despite high in-sample AUCs.
4.3.3. Country-Specific Layers: Hungary, UK, and USA
To evaluate geographic variation in model performance, logistic regression models were re-estimated for respondents from three countries with sufficient sample sizes: Hungary, the United Kingdom (UK), and the United States (USA). Table 7, Table 8 and Table 9. summarize model results across the 12 outcomes for each country.
Across all three national layers: The UK models showed particularly strong performance for multiple outcomes, including INC1, INC3, and AllThreeMild. The USA layer produced some of the highest discrimination and R² values in AtLeastTwoMild, AtLeastTwoSerious, and INC6. The Hungary layer exhibited mostly moderate performance, with no Good models and several cases of weak generalization or overfitting. The most probable reason is that many Hungarian participants came from the convenience sample in the pilot phase, which likely biased the model outcomes. This subsample skewed toward academics and students who may exhibit higher cybersecurity awareness and lower incident variability. Additionally, socially desirable responding cannot be ruled out. As a result, the Hungarian models may suffer from structural bias and reduced generalizability, despite a relatively large sample size.
As in prior layers, rare-event outcomes (e.g., AllThreeSerious) were often either non-analyzable or produced overfitted models, even when discrimination appeared high.
Domain-level inclusion was broad in the full-sample models, with CB, RR, and P appearing in most outcomes. In layered models, domain involvement shifted: WLB appeared more frequently in the Education and UK layers, while DL was retained more often in IT-layer models.
4.4. Post Hoc Evaluation: Individual-Level Predictors and Threshold Performance
4.4.1. Inclusion of Categorical Variables
To evaluate and illustrate whether demographic and contextual information improves prediction beyond behavioral and psychological indicators, we extended the IT-layer model for the AtLeastOneSerious outcome by incorporating age group (D1: young ≤35, older >35) and gender (D2: male vs. female). These variables were added to a model that already included item-level predictors from the five theoretical domains. Table 10 compares model performance and composition before and after the inclusion of categorical and interaction terms.
The extended model demonstrated clear performance
gains:
- AUC increased from 0.8100 to 0.8841.
- 10-fold AUC improved from 0.6765 to 0.7897.
- 10-fold deviance R² rose from 0.00% to 9.20%.
These improvements suggest that carefully chosen
demographic variables, especially when used in interaction terms, can enhance
generalizability and sensitivity without inflating overfitting risk. However,
this should not be interpreted as a general recommendation for categorical
variable expansion. In many other models tested across different outcomes and
layers, the inclusion of demographic predictors led to clear signs of
overfitting—such as large discrepancies between in-sample and
cross-validated metrics—or even complete separation, a statistical issue
where the outcome can be perfectly predicted by one or more variables, leading
to infinite or unstable coefficient estimates. To avoid these pitfalls, we
should limit such expansions to models with sufficiently large event counts and
ensure that all additional predictors are supported by theoretical relevance
and statistical prudence.
Domain Stability and Item Variation
Notably, while both models drew predictors from the same theoretical domains (e.g., WLB, RR, CB, DL, P), they selected different items within each domain. This variation is neither surprising nor problematic. In stepwise logistic regression—particularly in predictive rather than explanatory modeling—item selection is influenced by redundancy, collinearity, and local data interactions. Several items within the same domain may carry overlapping signal, and only one or two may be retained depending on the statistical context and co-variates included.
This is precisely why, throughout our model goodness summary tables, we reported only the contributing domains rather than listing specific item-level predictors. Doing so preserves interpretability and avoids overemphasizing what may be arbitrary or unstable item selections across similar models with equivalent predictive power.
Interaction Effects and Contextual Nuance
The extended model included interaction terms that revealed nuanced effects of behavioral predictors depending on age and gender:
- WLB4 × Gender (D2): WLB4 (“My personal and professional digital lives are intertwined”) was a strong positive predictor overall. However, the negative interaction for men (−1.69, p = 0.034) indicates that this risk factor is more predictive for women and may be weaker or non-significant in male respondents.
- WLB9 × Age (D1): WLB9 (“My work and personal activities often take place in the same physical space”) became a significant risk factor only among younger individuals (interaction = +0.83, p = 0.050), possibly due to their more fluid work–life boundaries and domestic work setups.
- CB6 × Age (D1): CB6 (“I could probably do more to protect my online accounts”) was not significant overall but became a negative predictor among older users (−0.90, p = 0.078), suggesting that self-perceived vulnerability predicts actual risk more clearly in this group.
- P10 × Age (D1): P10 (“I’m worried about losing control of my data”) had a protective effect overall, but the interaction term (+0.77, p = 0.071) suggests that younger users may not translate this concern into protective action, diluting its effect.
These findings support the case for contextual enrichment of models through post hoc variable inclusion, particularly when supported by adequate sample size, balanced class distribution, and theoretical justification.
4.4.2. Optimal Probability Threshold Selection for Classification
In binary classification, selecting an optimal threshold—the probability cutoff for predicting a positive outcome—critically influences the trade-off between false positives and false negatives, two error types with markedly different implications in cybersecurity contexts. While Receiver Operating Characteristic (ROC) curves are constructed by varying this threshold, they provide a threshold-agnostic view of model behavior. Ultimately, however, operational deployment requires fixing a specific cutoff value to decide whether a user is labeled as “at risk.”
Defining a Positive Event in Cybersecurity Risk Prediction
In our study, a positive event is defined as the self-reported occurrence of a cybersecurity incident. Depending on the specific outcome variable (e.g., INC1, AtLeastOneSerious), this may refer to mild disruptions (e.g., account lockouts, unauthorized login notifications) or severe incidents (e.g., financial loss, device compromise). A predicted positive case thus represents a user that the model identifies as likely to have experienced such an incident.
Classification Metrics and Threshold Sensitivity
Model performance is evaluated by comparing predicted classifications to actual outcomes, based on a chosen threshold. These comparisons yield:
True Positives (TP): Cases correctly predicted as having experienced a cybersecurity incident.
True Negatives (TN): Cases correctly predicted as not having experienced an incident.
False Positives (FP): Cases incorrectly predicted as positive.
False Negatives (FN): Cases incorrectly predicted as negative.
From these quantities, we derive key metrics:
Precision (Positive Predictive Value): TP / (TP + FP)
Recall (Sensitivity or True Positive Rate): TP / (TP + FN)
Specificity (True Negative Rate): TN / (TN + FP)
F1 Score: 2 * (Precision * Recall) / (Precision + Recall)
Youden’s J Statistic: Sensitivity + Specificity - 1
Accuracy = (TP + TN) / (TP + FP + TN + FN)
ROC Curves and Threshold-Agnostic Evaluation
The ROC curve plots the model’s true positive rate (sensitivity) against the false positive rate (1 – specificity) as the classification threshold is varied from 0 to 1. This provides a complete picture of the trade-off between detection and false alarms across the entire range of possible thresholds.
Although the ROC curve is constructed by sweeping through thresholds, it provides a threshold-agnostic representation of model performance. The Area Under the Curve (AUC) condenses this information into a single number, representing the model’s average ability to discriminate between positive and negative cases regardless of the threshold. AUC values range from 0.5 (random guessing) to 1.0 (perfect discrimination).
Error Asymmetry in Cybersecurity Risk Prediction
In cybersecurity applications, false negatives—cases where real threats are missed—are often more damaging than false positives, which may merely trigger unnecessary warnings. A missed detection can lead to serious harm, such as financial fraud or system compromise, while an excessive warning may only result in minor inconvenience or user fatigue.
Consequently, threshold selection frequently emphasizes high recall, ensuring that at-risk individuals are detected, even if it results in more false positives. Yet overly sensitive thresholds can overwhelm response teams or erode user trust due to frequent false alarms.
Toward Informed Threshold Selection
Rather than relying on a single cutoff, we present multiple thresholding strategies tailored to different operational needs:
- Maximum Youden’s J Statistic: A balance between sensitivity and specificity.
- Maximum F1 Score: Best for rare-event detection when precision and recall must be balanced.
- High Recall value: Trying to avoid the most dangerous situations.
The selection of a classification threshold in predictive models is not merely a statistical exercise, it has direct operational implications in real-world cybersecurity. Choosing when to flag a user or event as "at risk" determines the scope and effectiveness of interventions, the burden on response teams, and the credibility of the alert system itself.
Using the Hungary AllThreeMild model as an example, we outline practical threshold selection strategies suited for different operational objectives. ROC curves and Detection Error Trade-off (DET) curves in Figure 1 and Figure 2 and Confusion Matrices for the three optimization criterium in Table 11 enable nuanced understanding of performance trade-offs and support context-aware decision-making.
From this, we observe:
- The Youden’s J and F1 Score thresholds (both at 0.47) offer a balanced trade-off, catching ~75% of real incidents with moderate false alarms.
- The High Recall threshold (0.17) catches 95.4% of true incidents but misclassifies many safe users as risky (68 false positives vs. only 9 true negatives).
In practice, the choice of a classification threshold should reflect a careful balance between detection effectiveness and operational feasibility. While statistical criteria such as Youden’s J and the F1 score offer valuable guidance, they must be interpreted in light of the specific priorities and constraints of the cybersecurity environment. For high-risk settings where the cost of missing a true incident is unacceptable, a more aggressive threshold favoring recall may be appropriate, even at the expense of increased false positives. Conversely, in resource-constrained scenarios where every alert carries a cost, a more conservative threshold may be warranted.
It is also important to recognize that threshold tuning—especially when based heavily on observed data—can introduce overfitting, making the model appear more effective in evaluation than it may be in deployment. Therefore, effective threshold selection is not a one-time decision but an adaptive process that benefits from cross-validation, independent testing, and continual alignment with real-world outcomes.
5. Discussion
This section interprets the empirical findings considering the study’s objectives and broader implications. First, we summarize the main patterns observed across the full-sample and stratified models. We then consider why layered modeling improved performance in specific subgroups and reflect on the practical value of different types of models for organizational or policy applications. Finally, we address key limitations—particularly those related to rare events and generalization in small samples—and outline priorities for future research, including opportunities for external validation and temporal modeling.
5.1. Summary of Findings
This study assessed the predictive performance of logistic regression models across twelve cybersecurity incident outcomes using both full-sample and stratified modeling approaches. Predictors were drawn from five theoretically grounded domains and evaluated using cross-validated AUC and deviance R².
In the full-sample models, predictive strength was highly variable. Only two models met the criteria for strong performance:
- AtLeastOneMild showed consistent generalizability (10-fold AUC = 0.759; 10-fold deviance R² = 7.77%) and remained the most robust model overall.
- AllThreeSerious, despite a very low number of positive cases (n = 13), achieved a high 10-fold AUC (0.829) and 10-fold deviance R² (15.75%), though its reliability was limited by sparse data and the risk of overfitting.
Most other full-data models were classified as moderate or weak, particularly incident-specific models such as INC1, INC3, and INC5, which exhibited limited generalization and low explanatory power.
In contrast, stratified models built within organizational or geographic layers often showed substantial improvements:
- In the Education layer, several outcomes (e.g., INC1, INC2, AtLeastTwoMild) shifted from weak to strong or moderate categories, indicating better internal coherence within this group.
- The IT layer produced some of the strongest results overall, with high-performing models for AllThreeMild, AtLeastTwoMild, and INC5, supported by stable R² and AUC values.
- Among country-specific layers, both the UK and USA yielded consistently high AUC and deviance R² across multiple outcomes. In contrast, the Hungary layer produced mostly moderate results, with fewer strong models and more signs of overfitting or generalization risk.
A key pattern across all layers was that moderately prevalent outcomes (e.g., AtLeastTwoMild, INC2) yielded the most reliable and generalizable models. In contrast, rare-event outcomes (e.g., AllThreeSerious) often produced fragile or non-analyzable models, even when stratified.
In addition to model performance, the composition of predictors offers insight into the mechanisms underlying digital risk. Across full-sample models, Cybersecurity Behavior (CB), Risk Rationalization (RR), and Personality (P) were the most consistently retained domains, suggesting these dimensions contribute broadly to explaining incident vulnerability. Digital Literacy (DL) and Work–Life Blurring (WLB) appeared in roughly half the models and showed more context-sensitive patterns. In stratified layers, domain selection varied by context: WLB gained salience in the Education and UK layers, likely reflecting domain-specific boundary challenges, while DL emerged as more predictive in IT models, aligning with technical skill variation. These results affirm the value of a multi-domain predictive framework, while highlighting the benefit of contextual tailoring for optimal domain selection.
5.2. Interpretation and Practical Implications
5.2.1. Why Layered Models Outperform General Models
The consistent performance gains observed in Education, IT, UK, and USA layers likely result from greater behavioral and contextual homogeneity within these subgroups. When data are stratified by occupation or country, the resulting models are less affected by competing norms, structural inconsistencies, and unmeasured sources of variation. For example, digital practices, access policies, and boundary management differ substantially between an IT professional and a university teacher. Modeling them together may obscure domain-specific patterns, leading to lower generalizability. By contrast, layered models benefit from tighter signal-to-noise ratios and more consistent predictor-outcome relationships. Even with smaller sample sizes, these advantages can outweigh the risks of overfitting, especially when combined with rigorous cross-validation.
The implication is clear: when actionable insights are needed for specific organizational environments, layered models should be prioritized, provided that the subgroup presents a coherent behavioral or structural context (e.g., same profession or country), and has sufficient sample size and event counts to support stable estimation.
General models remain valuable in broad monitoring, exploratory screening, or policy design, where overfitting concerns are lower and the need for wide applicability is higher.
5.2.2. What Incident Outcomes Are Viable for Modeling
Another key finding is that not all incident outcomes are equally amenable to modeling—even within stratified layers. Models built on moderately prevalent outcomes (e.g., AtLeastTwoMild, INC2) consistently achieved better discrimination and generalization. These outcomes strike a balance: they are neither so common as to lack variation, nor so rare that they lead to sparse events.
In contrast, serious low-frequency events (e.g., AllThreeSerious) often produced unstable or overfitted models, despite showing superficially high AUC. These models are vulnerable to complete separation or inflated R² values under cross-validation.
Based on these results, incident selection should consider:
- Event count thresholds: At least 10–20 positive cases per model, with a recommended 10:1 or greater case-to-predictor ratio for basic logistic regression.
- Outcome reliability: Composites that combine multiple similar items (e.g., AtLeastTwoMild) generally perform better than single-item outcomes, due to increased signal strength.
- Actionability: Outcomes used for modeling should have practical relevance for intervention or monitoring.
5.2.3. When to Use Contextual or Demographic Variables or to Optimize Classification Thresholds
Demographic and contextual variables (e.g., age, gender, education, remote work status) can improve model fit when added post hoc. However, their use should be carefully timed and justified.
We recommend only incorporating contextual variables:
- After base models have been trained and cross-validated,
- In layers with sufficient sample size and event count to prevent overfitting,
- When the case-to-variable ratio exceeds 10:1, or when stepwise regularization is used to manage redundancy.
Critically, these variables should not drive model segmentation unless strong theoretical or practical justification exists. Instead, they should be treated as:
- Fairness audit variables (e.g., checking if model performance differs by gender),
- Personalization enrichments (e.g., adapting alert thresholds based on age or device-sharing),
- Exploratory factors for hypothesis generation, not primary model drivers.
5.2.4. Threshold Selection and the Risk of Overfitting
While model discrimination (AUC) is important, effective deployment requires converting probabilistic predictions into actionable decisions—typically by applying a fixed classification threshold. This threshold determines which users are flagged as "at risk" and directly impacts operational outcomes such as false positives, false negatives, and resource allocation. As shown in Section 4.4.2, threshold choice is not trivial: small adjustments can drastically alter sensitivity and specificity, especially in imbalanced or low-frequency outcomes.
For example, a threshold optimized for high recall may flag nearly all true positives but overwhelm administrators with false alarms. Conversely, a conservative threshold may miss serious risks. These trade-offs are context-dependent: educational institutions might tolerate higher false positives for early intervention, while overburdened IT teams may require stricter thresholds to avoid alert fatigue.
To manage this, we recommend:
- Using cross-validated Youden’s J or F1 score to identify balanced thresholds,
- Visualizing ROC and DET curves to understand trade-offs under different operating points,
- Calibrating thresholds per outcome and layer, rather than applying a universal cutoff,
- Monitoring model performance over time to detect threshold drift as digital behaviors change.
It is also important to note that threshold tuning itself can introduce overfitting if overly tailored to the training data. Organizations should therefore validate selected thresholds on new data or through simulation before deploying high-stakes interventions.
In sum, threshold setting is a critical design decision that should be grounded not only in statistical optimization but also in practical constraints, resource availability, and ethical considerations. Predictive models without carefully tuned thresholds risk being either ineffective or damaging in real-world settings.
5.2.5. Model Deployment in Organizational Settings
First, organizations must determine which incident outcomes are appropriate for modeling. Models targeting moderately prevalent outcomes (e.g., AtLeastTwoMild, INC2) offer a good balance of statistical stability and practical relevance. Rare outcomes (e.g., AllThreeSerious) may produce inflated scores or unstable predictions and are best avoided for individual-level classification—particularly in small teams.
Second, model scope should match operational context. Stratified models tailored to a specific sector (e.g., Education or IT) offer better performance than generalized models. For instance, an educational institution may train its own model using Education-layer coefficients from this study as a template, refining them with internal data over time.
Third, scoring implementation must be transparent and proportionate. Employees identified as high risk should not face punitive action but rather be offered low-friction interventions—such as personalized training prompts, optional toolkits (e.g., password managers), or temporary monitoring. Risk scores may be expressed in simple tiers (e.g., low/medium/high) and updated periodically as part of onboarding, annual assessments, or organizational audits.
Organizations should adopt minimum safeguards for ethical deployment, such as:
- Clear documentation of scoring logic,
- Minimum event and sample size thresholds,
- Options for employee opt-in or feedback,
- Routine fairness checks across demographic groups.
Used thoughtfully, survey-based models can serve as an interpretable and actionable layer within broader cybersecurity strategies, especially when real-time behavioral data are not available or ethically permissible.
Those aiming for more dynamic, real-time detection can integrate survey-based scores into User and Entity Behavior Analytics (UEBA) systems. In such configurations, the survey-based risk score serves as a static baseline, helping to calibrate UEBA sensitivity for different users. For instance, an employee flagged as high risk through survey responses might trigger lower behavioral thresholds for login anomalies or privilege escalation. Over time, the system refines its model by combining static traits (e.g., digital literacy, personality) with behavioral telemetry (e.g., login times, device switches, location anomalies). This hybrid approach balances early-stage interpretability with adaptive learning and reflects a growing best practice in human-centric cybersecurity architectures.
5.3. Limitations and Future Work
This study offers new insights into the predictive modeling of cybersecurity incident experiences using self-reported behavioral, cognitive, and dispositional data. However, several limitations should be acknowledged, and these inform clear directions for future research.
5.3.1. Rare Event Limitations
A consistent limitation across multiple layers was the challenge of modeling rare serious outcomes, such as financial loss, identity theft, or ransomware attacks. These outcomes suffered from low event counts, particularly in subgroup analyses, leading to unstable estimates, overfitting risks, and in some cases, models that could not be analyzed at all. Although some rare-event models (e.g., AllThreeSerious) showed high AUC, these metrics were often misleading due to near-complete separation or extreme class imbalance.
Future work should consider oversampling, data augmentation, or case–control study designs when targeting rare cybersecurity outcomes. Alternatively, aggregating related events into composite categories may improve model stability while retaining interpretability.
5.3.2. Generalization Risks in Small Subgroups
While layered models showed substantial performance gains, they also carry risks of overfitting, especially when trained on small subgroups with limited variability. Some stratified models produced strong in-sample metrics but displayed large drops under cross-validation or flagged remarks related to instability (e.g., event counts <10). This highlights the need for cautious interpretation and replication in larger or external samples.
To improve generalizability, future studies should aim to: Maintain a 10:1 ratio of cases to predictors wherever feasible, apply regularization techniques or ensemble models to minimize overfitting, report cross-validated metrics (as done here) rather than relying solely on in-sample fit.
5.3.3. Future Research Directions
Several avenues are open for advancing this line of work:
External validation: Models should be tested on new samples or in longitudinal follow-ups to assess real-world stability and transferability across contexts.
Temporal modeling: Longitudinal or event history approaches could capture sequences of risk behavior, rather than static snapshots, improving predictive precision.
Causal inference: While this study focused on prediction, future designs (e.g., experiments, natural experiments, or instrumental variable approaches) could investigate causal mechanisms behind digital risk exposure.
Adaptive deployment: Dynamic models that incorporate ongoing behavioral data (e.g., from digital platforms or organizational logs) could support real-time risk profiling and context-aware interventions.
6. Conclusions
This study introduces a novel, interpretable framework for predicting cybersecurity incidents through item-level behavioral, cognitive, and dispositional indicators. By modeling twelve outcomes across stratified subgroups and a full international sample, we demonstrate that granular, domain-specific predictors—rather than aggregated scores or behavioral intentions—can effectively anticipate real-world incidents, especially those of moderate frequency such as suspicious logins and password resets.
Our findings offer both methodological and applied value. The item-level modeling approach preserves behavioral specificity and enhances transparency, making the results readily actionable for cybersecurity training, user-level risk scoring, and early-warning systems. Stratified models outperform general ones in several layers, underscoring the importance of contextualized modeling in human-centric cybersecurity. We also show how threshold optimization and fairness-aware demographic inclusion can improve practical decision-making while maintaining interpretability.
Conceptually, the study integrates five theoretical domains—Work–Life Blurring, Risk Rationalization, Cybersecurity Behavior, Digital Literacy, and Personality—into a unified predictive architecture. No single domain dominates; rather, incident risk emerges from their interaction, revealing the multifaceted nature of digital vulnerability in blurred work–life environments.
This work reframes cybersecurity as a behavioral challenge—where everyday digital choices carry measurable risk. It offers a scalable and ethically grounded framework for organizations seeking to detect, predict, and mitigate human-driven cybersecurity threats. By bridging theory, analytics, and deployment relevance, the study contributes a durable foundation for the next generation of adaptive, user-aware cybersecurity systems.
Funding
No funding was received to assist with the preparation of this manuscript.
Institutional Review Board Statement
Institutional Review Board Statement: The Ethical Committee of the University of Dunaújváros, Hungary has granted approval for this study on 25 July 2025 (Ref. No. DUE-EC/2025/002).
Informed Consent Statement
Prior to participation, all individuals were informed about the study’s aims and the anonymous and voluntary nature of the survey through an initial statement in the questionnaire. This statement also made clear that by participating, they consent to the anonymized use of their data solely for statistical analysis. We have ensured that it is technically impossible to identify any participant from the data collected, maintaining the strictest levels of confidentiality and data protection.
Data Availability Statement
Data available through the link: https://drive.google.com/file/d/1ie2TP1yuUQiiZq-fp55YMx3HGK8mnxXM/view?usp=sharing (accessed on 27 July 2025).
Conflicts of Interest
The authors have no competing interests to declare that are relevant to the content of this article.
Appendix A

Table A1.
Survey Items by Domain with Response Options.
| Item ID | Question Text | Domain | Response Options |
|---|---|---|---|
| D1 | What is your age range? | Demographics | Under 18; 18–24; 25–34; 35–44; 45–54; 55–64; 65 or older |
| D2 | What is your gender? | Demographics | Male; Female; Prefer not to say |
| D3 | What is your highest level of education? | Demographics | High school; Some college; Bachelor’s degree; Master’s degree; Doctorate |
| D4 | Which field do you work in? | Demographics | IT/Technology; Education; Healthcare; Finance/Business; Other |
| D5 | In which country do you currently reside? | Demographics | Open text |
| JR1 | What is your job type? | Work Style | Company employee; Freelancer/Contractor; Academic/Research; Student; Other |
| JR2 | Is remote work an option for you? | Work Style | Yes; No |
| JR3 | Are you required or expected to perform any work-related tasks using your personal devices? | Work Style | Yes; No |
| WLB1 | I use my work and personal accounts interchangeably throughout the day. | Work–Life Blurring | 1–5 Likert scale: Not at all typical of me – Completely typical of me |
| WLB2 | I check personal accounts for social media or other apps using my work computer or work phone. | Work–Life Blurring | 1–5 Likert scale: Not at all typical of me – Completely typical of me |
| WLB3 | Work tasks often interrupt my personal time. | Work–Life Blurring | 1–5 Likert scale: Not at all typical of me – Completely typical of me |
| WLB4 | My personal and professional digital lives are intertwined. | Work–Life Blurring | 1–5 Likert scale: Not at all typical of me – Completely typical of me |
| WLB5 | I often use work-related platforms to manage personal tasks. | Work–Life Blurring | 1–5 Likert scale: Not at all typical of me – Completely typical of me |
| WLB6_R | I strictly separate my work and personal activities. (R) | Work–Life Blurring | 1–5 Likert scale: Not at all typical of me – Completely typical of me |
| WLB7 | I use the same online platforms for both work and personal purposes, such as Google, Microsoft Teams, or Zoom. | Work–Life Blurring | 1–5 Likert scale: Not at all typical of me – Completely typical of me |
| WLB8 | I check work emails while doing personal things. | Work–Life Blurring | 1–5 Likert scale: Not at all typical of me – Completely typical of me |
| WLB9 | My work and personal activities often take place in the same physical space. | Work–Life Blurring | 1–5 Likert scale: Not at all typical of me – Completely typical of me |
| WLB10 | It is hard to mentally disconnect from work during my free time. | Work–Life Blurring | 1–5 Likert scale: Not at all typical of me – Completely typical of me |
| RR1 | Sometimes sharing passwords with coworkers can save time. | Risk Rationalization | 1–5 Likert scale: Not at all typical of me – Completely typical of me |
| RR2 | Sometimes I ignore security threats if they interrupt my work. | Risk Rationalization | 1–5 Likert scale: Not at all typical of me – Completely typical of me |
| RR3 | Sometimes I feel that certain cybersecurity rules don’t really apply to me. | Risk Rationalization | 1–5 Likert scale: Not at all typical of me – Completely typical of me |
| RR4 | Sometimes I take security risks because others around me do the same. | Risk Rationalization | 1–5 Likert scale: Not at all typical of me – Completely typical of me |
| RR5 | Time pressure makes me more likely to overlook security procedures. | Risk Rationalization | 1–5 Likert scale: Not at all typical of me – Completely typical of me |
| RR6 | Following every security prompt sometimes feels like it slows down important work. | Risk Rationalization | 1–5 Likert scale: Not at all typical of me – Completely typical of me |
| RR7_R | I believe it is my responsibility to recognize serious threats before relying on IT. (R) | Risk Rationalization | 1–5 Likert scale: Not at all typical of me – Completely typical of me |
| RR8 | Most shortcuts I take online feel harmless and unlikely to cause real problems. | Risk Rationalization | 1–5 Likert scale: Not at all typical of me – Completely typical of me |
| CB1 | I use two-factor authentication when it’s available. | Cybersecurity Behavior | 1–5 Likert scale: Not at all typical of me – Completely typical of me |
| CB2_R | I use the same password on multiple sites. (R) | Cybersecurity Behavior | 1–5 Likert scale: Not at all typical of me – Completely typical of me |
| CB3_R | I sometimes skip software security checks. (R) | Cybersecurity Behavior | 1–5 Likert scale: Not at all typical of me – Completely typical of me |
| CB4 | I always create backups of my important files. | Cybersecurity Behavior | 1–5 Likert scale: Not at all typical of me – Completely typical of me |
| CB5 | I store passwords in a password manager. | Cybersecurity Behavior | 1–5 Likert scale: Not at all typical of me – Completely typical of me |
| CB6_R | I could probably do more to protect my online accounts. (R) | Cybersecurity Behavior | 1–5 Likert scale: Not at all typical of me – Completely typical of me |
| CB7 | I regularly check my accounts or devices for potential security issues. | Cybersecurity Behavior | 1–5 Likert scale: Not at all typical of me – Completely typical of me |
| DL1 | I am comfortable using various digital platforms. | Digital Literacy | 1–5 Likert scale: Not at all typical of me – Completely typical of me |
| DL2 | I am confident in spotting suspicious links in emails. | Digital Literacy | 1–5 Likert scale: Not at all typical of me – Completely typical of me |
| DL3 | I can recognize when a website or login page may be fake. | Digital Literacy | 1–5 Likert scale: Not at all typical of me – Completely typical of me |
| DL4 | I help others fix issues with digital tools. | Digital Literacy | 1–5 Likert scale: Not at all typical of me – Completely typical of me |
| DL5 | I adjust privacy settings on new apps easily. | Digital Literacy | 1–5 Likert scale: Not at all typical of me – Completely typical of me |
| DL6 | I can solve common tech problems on my own. | Digital Literacy | 1–5 Likert scale: Not at all typical of me – Completely typical of me |
| DL7_R | New tech stresses me out. (R) | Digital Literacy | 1–5 Likert scale: Not at all typical of me – Completely typical of me |
| P1 | I'm curious about how tech works. | Personality Traits | 1–5 Likert scale: Not at all typical of me – Completely typical of me |
| P2 | I enjoy trying new digital tools. | Personality Traits | 1–5 Likert scale: Not at all typical of me – Completely typical of me |
| P3 | I pay attention to details in tasks. | Personality Traits | 1–5 Likert scale: Not at all typical of me – Completely typical of me |
| P4 | I keep my digital life organized. | Personality Traits | 1–5 Likert scale: Not at all typical of me – Completely typical of me |
| P5 | I participate in online communities. | Personality Traits | 1–5 Likert scale: Not at all typical of me – Completely typical of me |
| P6 | I frequently post or share on social media. | Personality Traits | 1–5 Likert scale: Not at all typical of me – Completely typical of me |
| P7 | I avoid conflict in online discussions. | Personality Traits | 1–5 Likert scale: Not at all typical of me – Completely typical of me |
| P8 | I value others' digital privacy like my own. | Personality Traits | 1–5 Likert scale: Not at all typical of me – Completely typical of me |
| P9 | It makes me anxious to go off-plan. | Personality Traits | 1–5 Likert scale: Not at all typical of me – Completely typical of me |
| P10 | I’m worried about losing control of my data. | Personality Traits | 1–5 Likert scale: Not at all typical of me – Completely typical of me |
| INC1 | Have you ever personally experienced a cybersecurity-related problem (e.g., virus, account breach, account lockout, unauthorized access)? | Incident Outcomes | Yes; No; Not sure / Don’t know |
| INC2 | Have you ever received a notification from a service (e.g., email provider, bank, company) about suspicious login activity? | Incident Outcomes | Yes; No; Not sure / Don’t know |
| INC3 | Have you ever had to reset your password due to a suspected security issue? | Incident Outcomes | Yes; No; Not sure / Don’t know |
| INC4 | Have you ever lost money or access to a paid service due to a cybersecurity issue? | Incident Outcomes | Yes; No; Not sure / Don’t know |
| INC5 | Has someone ever used your personal or work account without your permission due to a cybersecurity incident? | Incident Outcomes | Yes; No; Not sure / Don’t know |
| INC6 | Has a cybersecurity problem ever caused your computer or other device to stop working properly? | Incident Outcomes | Yes; No; Not sure / Don’t know |
References
- Ashforth, B. E. , Kreiner, G. E., & Fugate, M. (2000). All in a day's work: Boundaries and micro role transitions. Academy of Management Review, 25(3), 472–491. [CrossRef]
- Baltuttis, D. , Teubner, T., & Adam, M. T. P. (2024). A typology of cybersecurity behavior among knowledge workers. Computers & Security, 140, 103741. [CrossRef]
- Bandura, A. (1999). Moral disengagement in the perpetration of inhumanities. Personality and Social Psychology Review, 3(3), 193–209. [CrossRef]
- Bognár, L. , & Bottyán, L. (2024). Evaluating online security behavior: Development and validation of a personal cybersecurity awareness scale for university students. Education Sciences, 14(6), 588. [CrossRef]
- Barlette, Y. , Jaouen, A., & Baillette, P. (2021). Bring your own device (BYOD) as reversed IT adoption: Insights into managers’ coping strategies. International Journal of Information Management, 56, 102212. [CrossRef]
- Borkovich, D. J. , & Skovira, R. J. (2020). Working from home: Cybersecurity in the age of COVID-19. Issues in Information Systems, 21(4). [CrossRef]
- Blanton, S. (2024, October 24). 50+ password statistics & trends to know in 2024. JumpCloud. Available online: https://jumpcloud.com/blog/password-statistics-trends.
- Buil-Gil, D. , Kemp, S., Kuenzel, S., Coventry, L., Zakhary, S., Tilley, D., & Nicholson, J. (2023). The digital harms of smart home devices: A systematic literature review. Computers in Human Behavior, 145, Article 107770. [CrossRef]
- Bulgurcu, B., Cavusoglu, H., & Benbasat, I. (2010). Information security policy compliance: An empirical study of rationality-based beliefs and information security awareness. MIS Quarterly, 34(3), 523–548.
- Cheng, L. , Li, W., Zhai, Q., & Smyth, R. (2014). Understanding personal use of the internet at work: An integrated model of neutralization techniques and general deterrence theory. Computers in Human Behavior, 38, 220–228. [CrossRef]
- Conard, C. F. (2024). Quantifying the severity of a cybersecurity incident for incident reporting (Master’s thesis, Massachusetts Institute of Technology). MIT Theses.
- Dalal, R. S. , Howard, D. J., Bennett, R. J., Posey, C., Zaccaro, S. J., & Brummel, B. J. (2022). Organizational science and cybersecurity: Abundant opportunities for research at the interface. Journal of Business and Psychology, 37(1), 1–29. [CrossRef]
- de Bruin, M. (2022). Individual and Contextual Variables of Cyber Security Behaviour. MSc Thesis, University of London. Available online: https://arxiv.org/abs/2405.16215.
- Danish, M. (2024). Enhancing cyber security through predictive analytics: Real-time threat detection and response [Preprint]. arXiv. [CrossRef]
- Derks, D. , van Mierlo, H., & Schmitz, E. B. (2014). A diary study on work-related smartphone use, psychological detachment and exhaustion: Examining the role of the perceived segmentation norm. Journal of Occupational Health Psychology, 19(1), 74–84. [CrossRef]
- Diesch, R. , Pfaff, M., & Krcmar, H. (2020). A comprehensive model of information security factors for decision-makers. Computers & Security, 92, 101747. [CrossRef]
- DiMaggio, P. , & Hargittai, E. (2001). From the 'digital divide' to 'digital inequality': Studying Internet use as penetration increases. Princeton University Center for Arts and Cultural Policy Studies Working Paper Series, 15, 1–23.
- Gilster, P. (1997). Digital literacy. Wiley Computer Pub.
- Glaspie, H. W. , & Karwowski, W. (2018). Human factors in information security culture: A literature review. In J. Kantola, T. Barath, S. Nazir, & T. Andre (Eds.), Advances in human factors in cybersecurity (pp. 269–280). Springer. [CrossRef]
- Gratian, M. , Bandi, S., Cukier, M., Dykstra, J., & Ginther, A. (2018). Correlating human traits and cyber security behavior intentions. Computers & Security, 73, 345–358. [CrossRef]
- Halevi, T., Lewis, J., & Memon, N. (2013). A closer look at the self-reported behaviors of users on social networks. arXiv. Available online: https://arxiv.org/abs/1301.7643.
- Hanus, B. & Wu, Y. 1: (2016) Impact of Users’ Security Awareness on Desktop Security Behavior: A Protection Motivation Theory Perspective, Information Systems Management, 33, 2016; 1. [Google Scholar] [CrossRef]
- Hargittai, E. (2005). Survey measures of web-oriented digital literacy. Social Science Computer Review, 23(3), 371–379. [CrossRef]
- Hasan, S., Ali, M., Kurnia, S., & Thurasamy, R. (2021). Evaluating the cyber security readiness of organizations and its influence on performance. Journal of Information Security and Applications, 58, 102726. [CrossRef]
- Hadlington, L. (2017). Human factors in cybersecurity: Examining the link between Internet addiction, impulsivity, attitudes towards cybersecurity, and risky cybersecurity behaviours. Heliyon, 3(7), e00346. [CrossRef]
- Hadlington, L. (2018). Employees Attitude towards Cyber Security and Risky Online Behaviours: An Empirical Assessment in the United Kingdom. International Journal of Cyber Criminology, 12(1), 269–281. [CrossRef]
- Ismaeel, S. (2025). The impact of digital literacy on cybercrime awareness, victimization, and prevention measures: A study of cyberbullying in Saudi Arabia. Pakistan Journal of Criminology, 17(1), 77–96.
- Junglas, I. , Johnson, N. A., & Spitzmüller, C. (2008). Personality traits and concern for privacy: An empirical study in the context of location-based services. European Journal of Information Systems, 17(4), 387–402. [CrossRef]
- Khaliq, S., Abideen Tariq, Z. U., & Masood, A. (2020). Role of user and entity behavior analytics in detecting insider attacks. In Proceedings of the 2020 International Conference on Cyber Warfare and Security (ICCWS) (pp. 1–6). IEEE. [CrossRef]
- Kossek, E. E. , Ruderman, M. N., Braddy, P. W., & Hannum, K. M. (2012). Work–nonwork boundary management profiles: A person-centered approach. Journal of Vocational Behavior, 81(1), 112–128. [CrossRef]
- Lahcen, A. A. , Caulkins, B., Mohapatra, R. N., & Maharaja, R. (2020). A survey and research direction toward user-centric cybersecurity. Computers & Security, 92, 101747. [CrossRef]
- Li, H. , Sarathy, R., & Xu, H. (2011). The role of affect and cognition on online consumers' decision to disclose personal information to unfamiliar online vendors. Decision Support Systems, 51(3), 434–445. [CrossRef]
- Maalem Lahcen, R. A., Caulkins, B., Mohapatra, R., & Kumar, M. (2020). Review and insight on the behavioral aspects of cybersecurity. Cybersecurity, 3(1), 10. [CrossRef]
- Mazmanian, M. , Orlikowski, W. J., & Yates, J. (2013). The autonomy paradox: The implications of mobile email devices for knowledge professionals. Organization Science, 24(5), 1337–1357. [CrossRef]
- McCormac, A., Zwaans, T., Parsons, K., Calic, D., Butavicius, M., & Pattinson, M. (2017). Individual differences and information security awareness. Computers in Human Behavior, 69, 151–156. [CrossRef]
- McCrae, R. R. , & Costa, P. T. (1999). A five-factor theory of personality. In L. A. Pervin & O. P. John (Eds.), Handbook of personality: Theory and research (2nd ed., pp. 139–153). Guilford Press.
- Microsoft Security Blog. (2024).
- Mohammed, Y. , Warkentin, M., Nehme, A. and Beshah, T. (2025), "Testing a comprehensive model of employee IS misuse in a developing economy context", Journal of Knowledge Management, Vol. ahead-of-print No. ahead-of-print. [CrossRef]
- Nippert-Eng, C. E. (1996). Home and work: Negotiating boundaries through everyday life. University of Chicago Press.
- Ng, B.-Y. , Kankanhalli, A., & Xu, Y. (2009). Studying users' computer security behavior: A health belief perspective. Decision Support Systems, 46(4), 815–825. [CrossRef]
- Park, Y. J. (2011). Digital Literacy and Privacy Behavior Online. Communication Research, 40(2), 215-236. (Original work published 2013). [CrossRef]
- Pfleeger, S. , Sasse, M. & Furnham, A. (2014). From Weakest Link to Security Hero: Transforming Staff Security Behavior. Journal of Homeland Security and Emergency Management, 11(4), 489-510. [CrossRef]
- Phan, B. T., Do, P. H., & Le, D. Q. (2025). The impact of digital literacy on personal information security: Evidence from Vietnam. In Proceedings of the International Conference on Emerging Challenges: Sustainable Strategies in the Data-driven Economy (ICECH 2024) (pp. 475–489). Atlantis Press. [CrossRef]
- Pollini, A. , Callari, T. C., Tedeschi, A., Ruscio, D., Save, L., Chiarugi, F., & Guerri, D. (2022). Leveraging human factors in cybersecurity: An integrated methodological approach. Cognition, Technology & Work, 24(2), 371–390. [CrossRef]
- Posey, C. , Bennett, R. J., & Roberts, T. L. (2011). Understanding the mindset of the abusive insider: An examination of insiders’ causal reasoning following internal security changes. Computers & Security, 30(6–7), 486–497. [CrossRef]
- Radwan, R., & Zejnilovic, S. (2025, March 17). Password reuse is rampant: Nearly half of observed user logins are compromised. Cloudflare Blog. Available online: https://blog.cloudflare.com/password-reuse-rampant-half-user-logins-compromised/.
- Ramadhany, A. F., Damayanti, N. E., Rahmania, L. A., & Inawati. (2025). Digital Literacy as a Cyber Crime Defense and Prevention Strategy. Nusantara Science and Technology Proceedings, 2024(47), 778-785. [CrossRef]
- Redmiles, E. M. , Kross, S., & Mazurek, M. L. (2016). How I learned to be secure: A census-representative survey of security advice sources and behavior. Proceedings of the 2016 ACM SIGSAC Conference on Computer and Communications Security, 666–677. [CrossRef]
- Singh, R. , Aggarwal, S., & Sahni, S. (2022). A systematic literature review of work–life balance using ADO model. FIIB Business Review, 12(3), 243–258. [CrossRef]
- Shappie, A. T., Dawson, C. A., & Debb, S. M. (2020). Personality as a predictor of cybersecurity behavior. Psychology of Popular Media, 9(4), 475–480. [CrossRef]
- Siponen, M. , & Vance, A. (2010). Neutralization: New insights into the problem of employee information systems security policy violations. MIS Quarterly, 34(3), 487–502. [CrossRef]
- Siponen, M. , Soliman, W., Topalli, V., & Vestman, T. (2024). Reconsidering neutralization techniques in behavioral cybersecurity as cybersecurity hygiene discounting. SSRN. [CrossRef]
- Thilagavathy, S. , & Geetha, S. N. (2023). Work-life balance – A systematic review. Vilakshan – XIMB Journal of Management, 20(2), 258–276. [CrossRef]
- Tran-Truong, P. T. , Pham, M. Q., Son, H. X., Nguyen, D. L. T., Nguyen, M. B., Tran, K. L., Van, L. C. P., Le, K. T., Vo, K. H., Kim, N. N. T., Nguyen, T. M., & Nguyen, A. T. (2025). A systematic review of multi-factor authentication in digital payment systems: NIST standards alignment and industry implementation analysis. Journal of Systems Architecture, 162, 103402. [CrossRef]
- Vance, A. , Siponen, M., & Pahnila, S. (2012). Motivating IS security compliance: Insights from habit and protection motivation theory. Information & Management, 49(3–4), 190–198. [CrossRef]
- van Deursen, A. J. A. M. , & van Dijk, J. A. G. M. (2014). The digital divide shifts to differences in usage. New Media & Society, 16(3), 507–526. [CrossRef]
- Wash, R., & Cooper, M. M. (2018). Who provides phishing training? Facts, stories, and people like me. Proceedings of the 2018 ACM CHI Conference on Human Factors in Computing Systems (CHI ’18), 1–12.
- Wajcman, J., Rose, E., Brown, J. E., & Bittman, M. (2010). Enacting virtual connections between work and home. Journal of Sociology, 46(3), 257–275. [CrossRef]
- Willison, R., Warkentin, M., & Johnston, A. C. (2018). Examining employee computer abuse intentions: Insights from justice, deterrence and neutralization perspectives. Information Systems Journal, 28(2), 266–293.
- Zimmermann, V. , & Renaud, K. (2019). Moving from a “human-as-problem” to a “human-as-solution” cybersecurity mindset. International Journal of Human-Computer Studies, 131, 169–187. [CrossRef]
- Zwilling, M. , Klien, G., Lesjak, D., Wiechetek, Ł., Cetin, F., & Basim, H. N. (2020). Cyber security awareness, knowledge and behavior: A comparative study. Journal of Computer Information Systems, 62(1), 82–97. [CrossRef]
Figure 1.
ROC curve for the Hungary-layer model predicting AllThreeMild incidents.
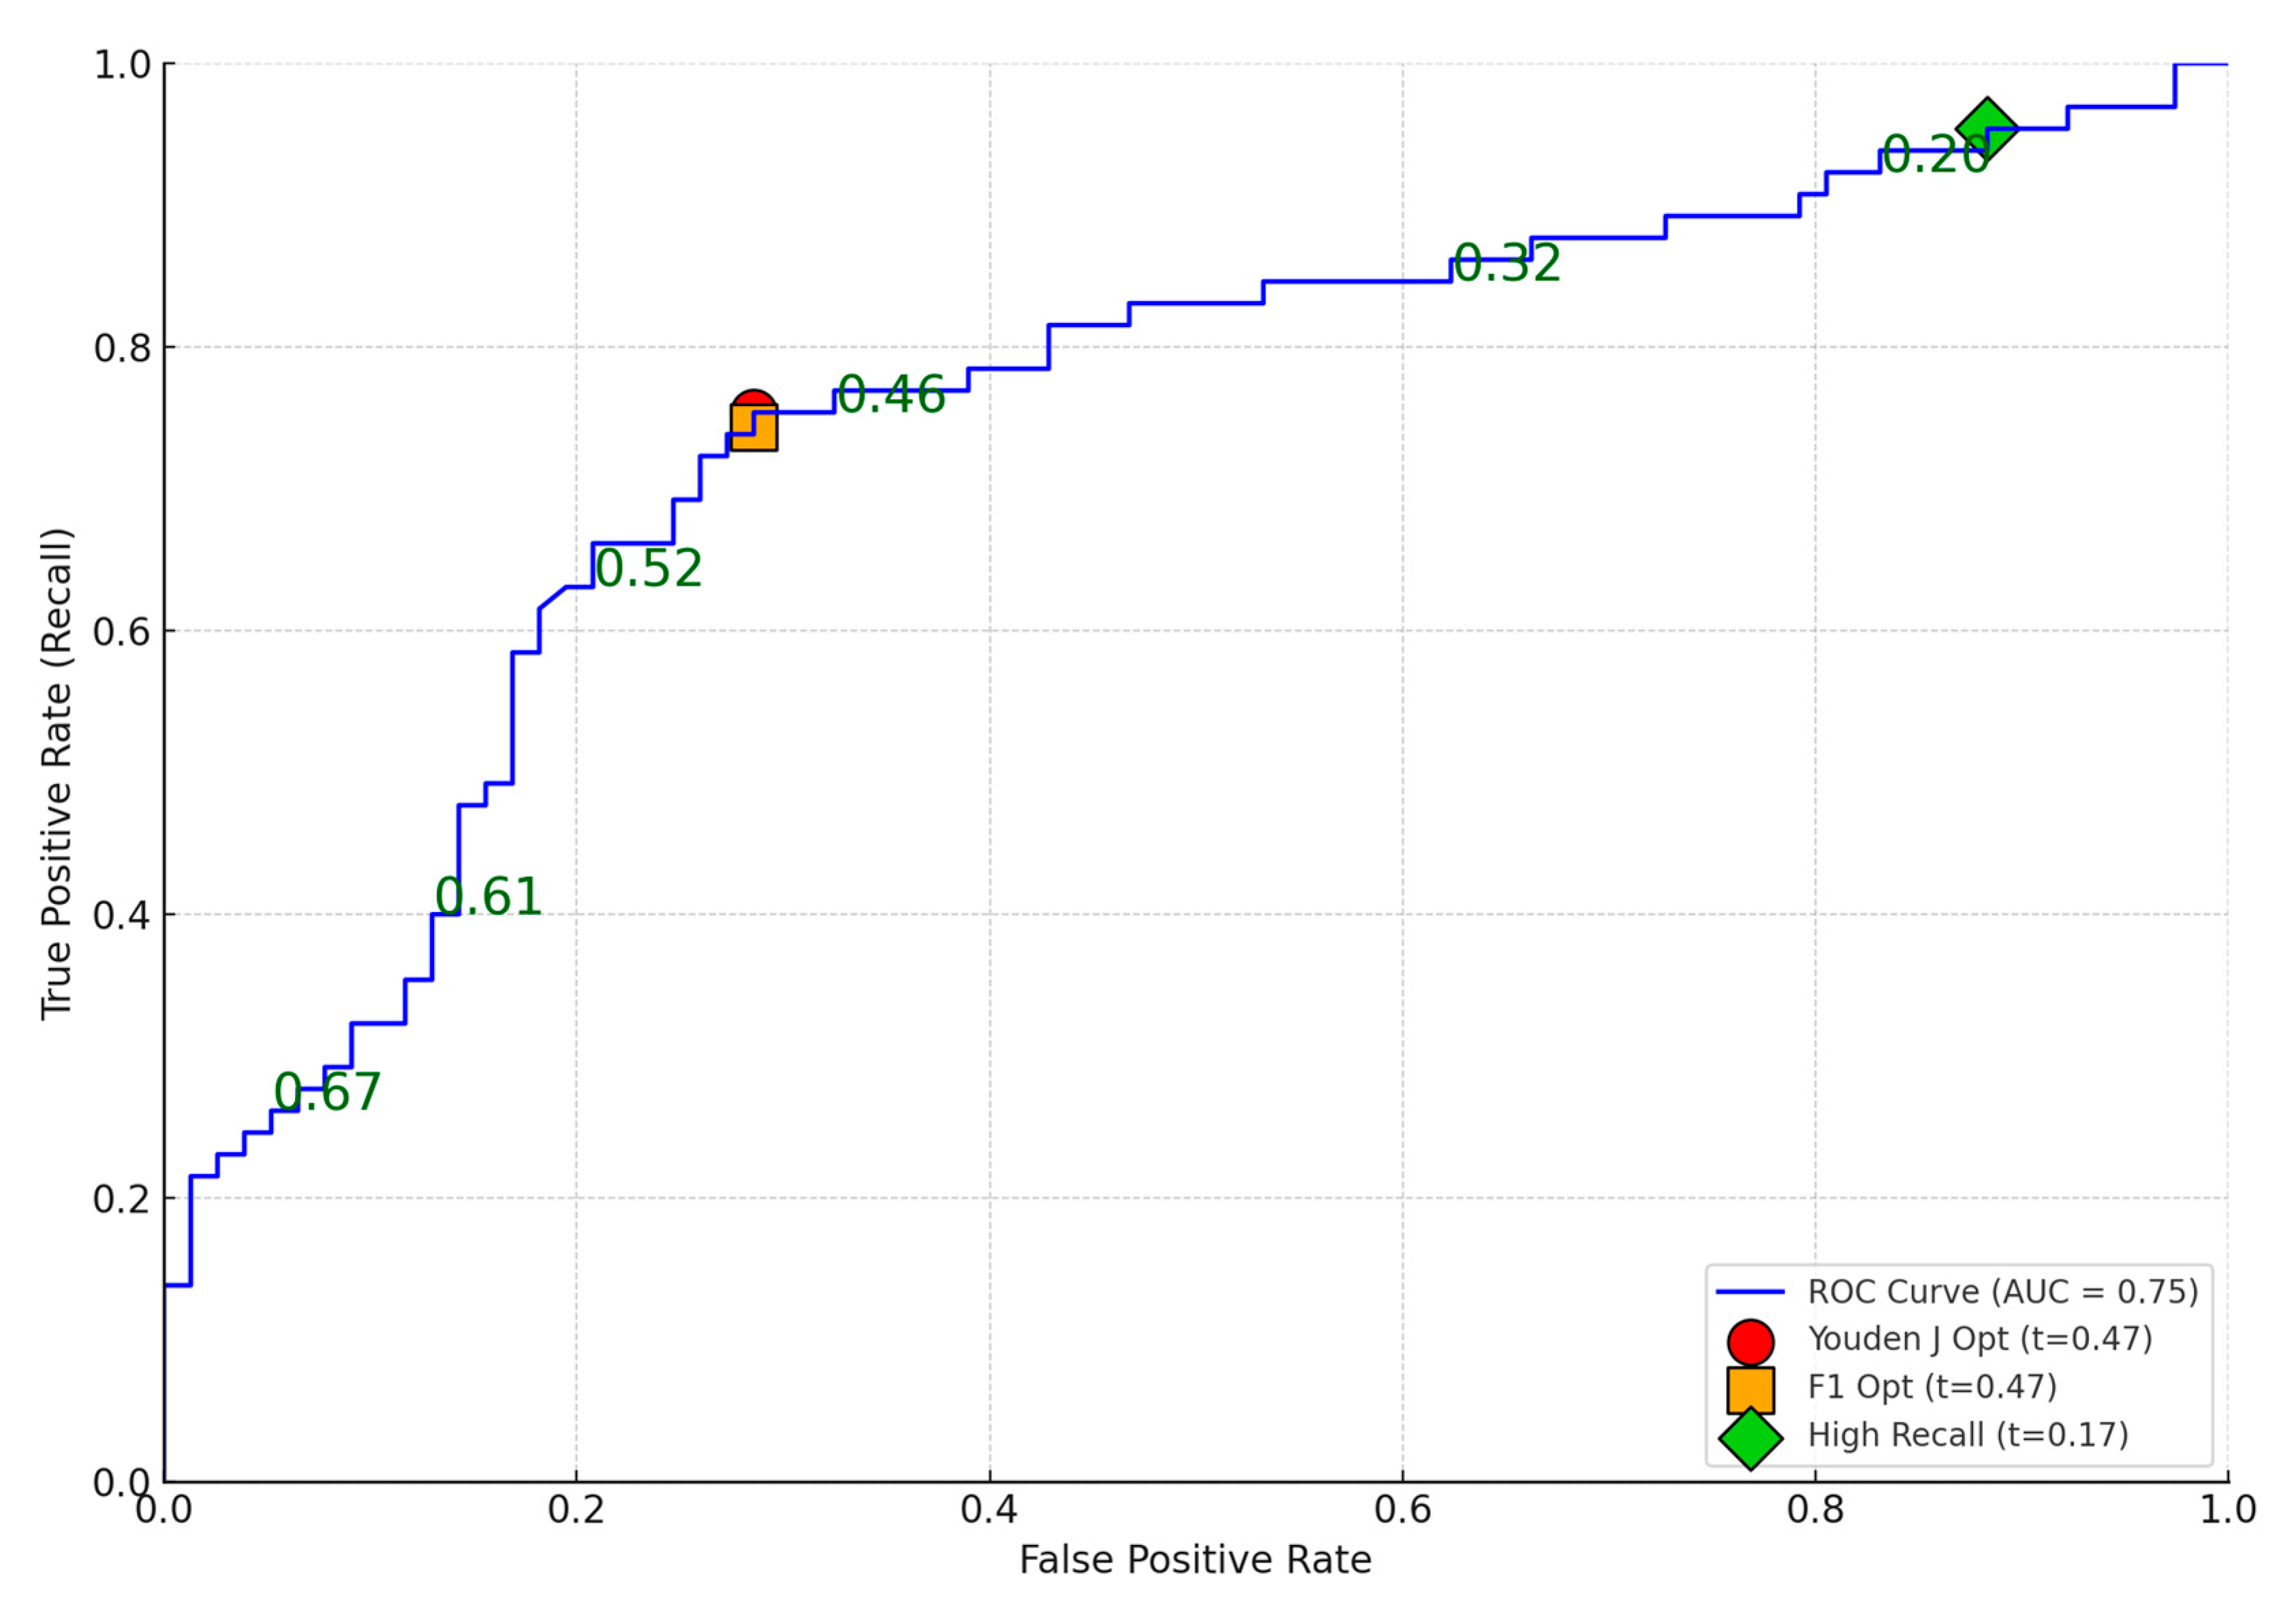
Figure 2.
DET curve for the Hungary-layer model predicting AllThreeMild incidents.
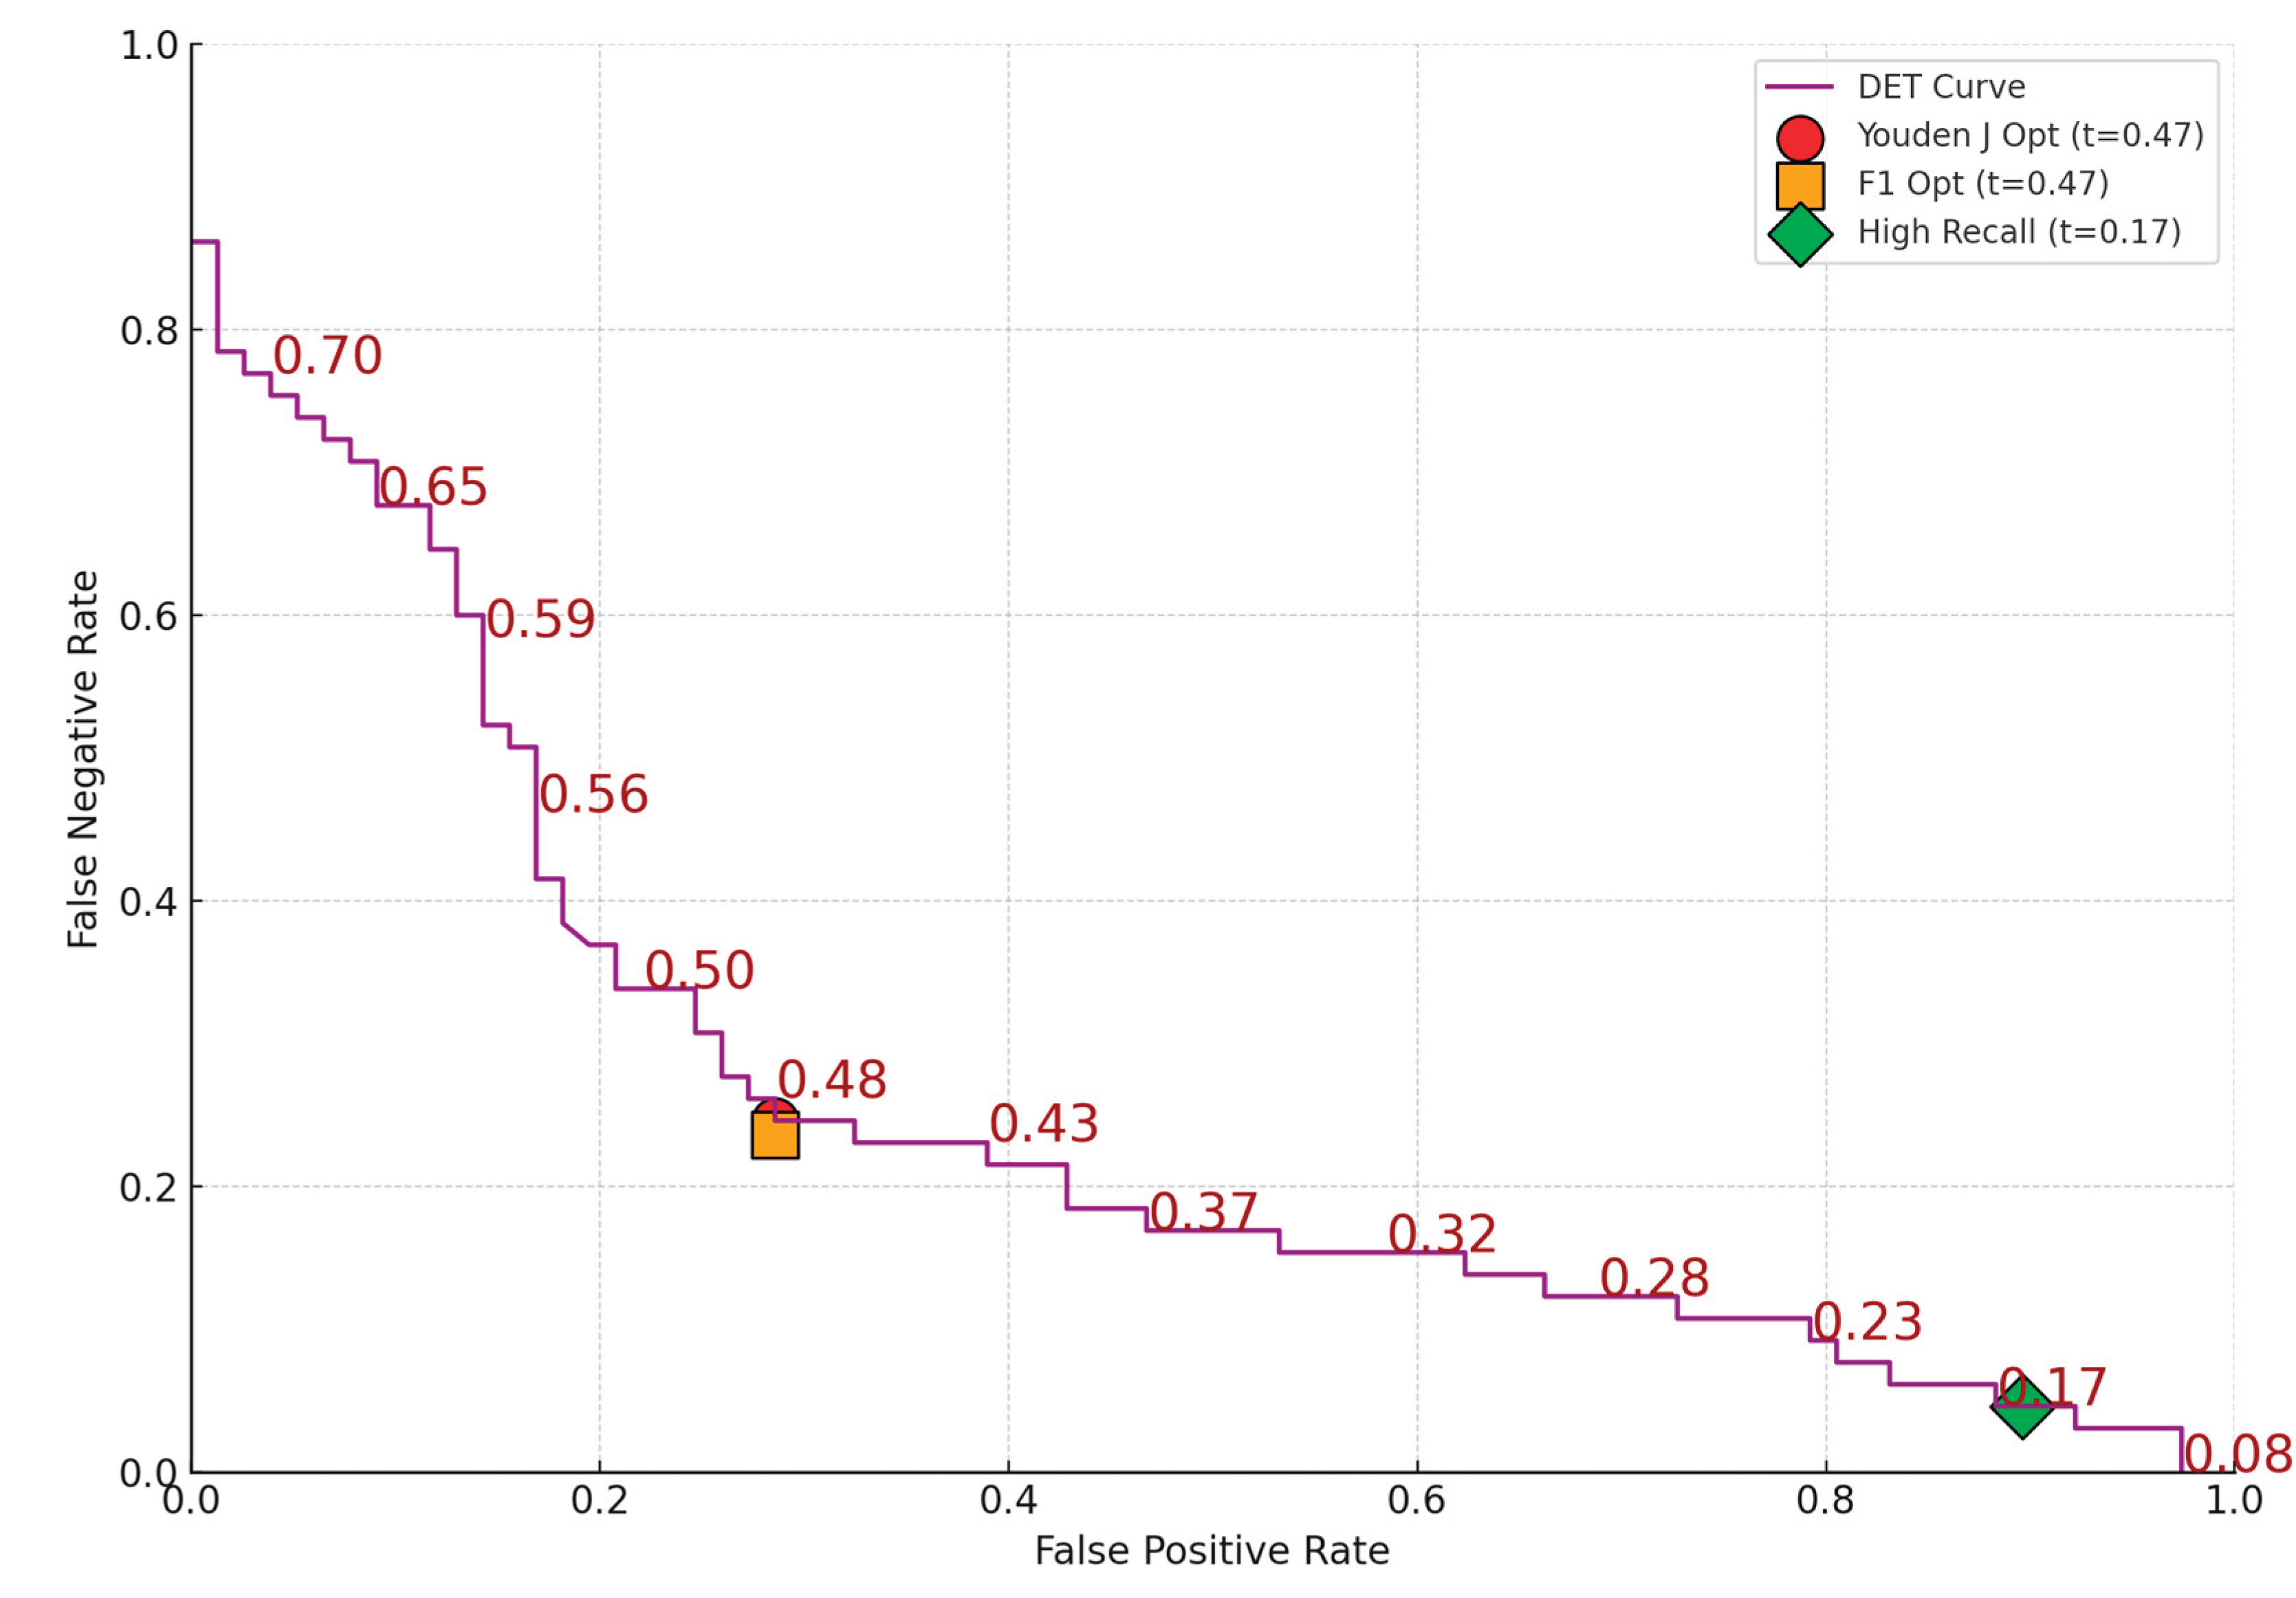
Table 1.
Distribution of the Responses in the Layers of the Final Sample.
| Layers | Category | Number of Responses |
|---|---|---|
| Age Group | 18-24 | 68 |
| 25-34 | 100 | |
| 35-44 | 103 | |
| 45-54 | 121 | |
| 55-64 | 44 | |
| 65 or older | 17 | |
| Gender | Female | 220 |
| Male | 233 | |
| Education Level | High school | 92 |
| Some college | 74 | |
| Bachelor's degree | 160 | |
| Master's degree | 103 | |
| Doctorate | 24 | |
| Employment Sector | Education | 104 |
| Finance/Business | 48 | |
| Healthcare | 26 | |
| IT/Technology | 133 | |
| Other | 142 | |
| Employment Status | Academic/Research | 27 |
| Company employee | 284 | |
| Freelancer/Contractor | 58 | |
| Student | 50 | |
| Other | 34 | |
| Country of Residence | Germany | 40 |
| Hungary | 142 | |
| Ireland | 10 | |
| Romania | 36 | |
| The Netherlands | 13 | |
| UK | 86 | |
| USA | 103 | |
| Other (Austria, Australia, Brazil, Malta, Spain, UAE) | 23 |
Table 2.
Model Categorization Criteria.
| Metric | Threshold for Concern | Impact on Category |
|---|---|---|
| 10-fold AUC | < 0.68 → Weak≥ 0.74 → Good | Directly influences category |
| 10-fold Deviance R² | < 3% → Weak≥ 7.5% → Good | Directly influences category |
| AUC Drop | > 0.10 (in-sample AUC – 10-fold AUC) | Triggers downgrade to Weak |
| R² Drop Ratio | > 0.50 (in-sample R² – 10-fold R²) / in-sample R² | Triggers downgrade to Weak |
| Minimum Events / Non-events | < 10 events or < 10 non-events | Automatically classified as Weak |
Table 3.
Summary of Reliability and Dimensionality of Theoretical Domains.
| Domain | Cronbach’s Alpha | No. of Factors (EFA) | Remark |
|---|---|---|---|
| Work–Life Blurring (WLB) | 0.8292 | 2 | High reliability; multidimensionality |
| Risk Rationalization (RR) | 0.7589 | 1 (excluding RR7_R) | Acceptable reliability; RR7_R forms a distinct normative factor |
| Digital Literacy (DL) | 0.8237 | 1 | High reliability and unidimensional structure |
| Cybersecurity Behavior (CB) | 0.63 | 2 | Low reliability; distinct behavioral subdimensions |
| Personality (P) | 0.6117 | 5 | Low reliability; reflects multiple psychological traits |
Table 4.
Logistic Regression Summary – All Data.
| Model | Events / Non-Events | AUC | 10-fold AUC | Deviance R² % | 10-fold Deviance R² % | Domains | Category |
|---|---|---|---|---|---|---|---|
| INC1 | 268 / 185 | 0.623 | 0.573 | 3.63 | 0.74 | CB, DL, P, WLB | Weak |
| INC2 | 355 / 98 | 0.736 | 0.691 | 12.04 | 7.61 | CB, P, RR, WLB | Moderate |
| INC3 | 207 / 246 | 0.725 | 0.671 | 8.39 | 3.66 | CB, DL, P, RR, WLB | Weak |
| AtLeastOneMild | 421 / 32 | 0.839 | 0.759 | 19.45 | 7.77 | CB, DL, P, RR, WLB | Good |
| AtLeastTwoMild | 288 / 165 | 0.745 | 0.704 | 13.33 | 8.2 | CB, DL, P, RR, WLB | Moderate |
| AllThreeMild | 121 / 332 | 0.684 | 0.644 | 7.62 | 4.2 | CB, P, RR, WLB | Weak |
| INC4 | 112 / 341 | 0.694 | 0.633 | 7.34 | 1.53 | CB, P, RR, WLB | Weak |
| INC5 | 84 / 369 | 0.662 | 0.609 | 4.5 | 0.7 | CB, P, RR | Weak |
| INC6 | 156 / 297 | 0.721 | 0.658 | 10.46 | 3.25 | CB, DL, P, RR | Weak |
| AtLeastOneSerious | 202 / 251 | 0.632 | 0.586 | 3.87 | 1.12 | CB, DL, P, RR, WLB | Weak |
| AtLeastTwoSerious | 100 / 353 | 0.68 | 0.65 | 6.0 | 3.46 | P, RR | Weak |
| AllThreeSerious | 13 / 403 | 0.864 | 0.829 | 21.73 | 15.75 | CB, DL, RR | Good |
Table 5.
Logistic Regression Summary – Education Layer.
| Model | Events / Non-Events | AUC | 10-fold AUC | Deviance R² | 10-fold Deviance R² | Domains | Category |
|---|---|---|---|---|---|---|---|
| INC1 | 56 / 48 | 0.8188 | 0.747 | 24.63 | 9.72 | WLB, RR, CB, DL, P | Good |
| INC2 | 84 / 20 | 0.8845 | 0.8208 | 37.95 | 19.43 | WLB, RR, CB, DL, P | Good |
| INC3 | 87 / 17 | 0.904 | 0.7985 | 44.64 | 12.8 | WLB, RR, CB, DL, P | Good |
| AtLeastOneMild | 94 / 10 | 0.9872 | 0.9638 | 72.18 | 3.81 | RR, P | Moderate |
| AtLeastTwoMild | 85 / 19 | 0.865 | 0.7746 | 35.3 | 10.97 | RR, CB, DL, P | Good |
| AllThreeMild | 48 / 56 | 0.7612 | 0.6626 | 17.24 | 2.71 | WLB, RR, CB, P | Weak |
| INC4 | 15 / 77 | 0.9861 | 0.8511 | 76.42 | 0.0 | RR, CB, DL, P | Weak |
| INC5 | 9 / 83 | 0.9076 | 0.7369 | 44.87 | 0.0 | RR, CB, P | Weak |
| INC6 | 21 / 71 | 0.7954 | 0.7676 | 19.92 | 14.12 | RR, CB, P | Good |
| AtLeastOneSerious | 38 / 54 | 0.8694 | 0.7719 | 35.56 | 10.95 | WLB, RR, CB, DL | Good |
| AtLeastTwoSerious | 7 / 85 | 0.8294 | 0.7916 | 16.93 | 9.98 | RR | Weak |
| AllThreeSerious | 0 / 92 | nan | nan | nan | nan | – | Weak |
Table 6.
Logistic Regression Summary – IT or Technology Layer.
| Model | Events / Non-Events | AUC | 10-fold AUC | Deviance R² | 10-fold Deviance R² | Domains | Category |
|---|---|---|---|---|---|---|---|
| INC1 | 91 / 42 | 0.8017 | 0.6886 | 23.74 | 0.14 | WLB, RR, CB, DL, P | Weak |
| INC2 | 104 / 29 | 0.8652 | 0.7818 | 31.95 | 13.11 | WLB, RR, CB, P | Good |
| INC3 | 120 / 13 | 0.7785 | 0.6907 | 14.98 | 4.99 | RR, P | Moderate |
| AtLeastOneMild | 128 / 5 | 0.8859 | 0.7227 | 28.49 | 0.0 | WLB, RR, CB | Weak |
| AtLeastTwoMild | 116 / 17 | 0.8841 | 0.8005 | 35.88 | 15.83 | WLB, RR, P | Good |
| AllThreeMild | 71 / 62 | 0.8303 | 0.7483 | 26.14 | 12.7 | WLB, RR, CB, DL, P | Good |
| INC4 | 20 / 104 | 0.8262 | 0.7406 | 22.82 | 4.98 | WLB, RR, CB, DL, P | Moderate |
| INC5 | 24 / 100 | 0.8121 | 0.76 | 23.46 | 12.65 | WLB, RR, CB, P | Good |
| INC6 | 30 / 94 | 0.8138 | 0.7362 | 25.37 | 9.41 | RR, CB, DL, P | Moderate |
| AtLeastOneSerious | 50 / 74 | 0.8100 | 0.6765 | 23.76 | 0.0 | WLB, RR, CB, DL, P | Weak |
| AtLeastTwoSerious | 17 / 107 | 0.8455 | 0.7763 | 29.66 | 10.49 | RR, DL, P | Good |
| AllThreeSerious | 7 / 117 | 0.9646 | 0.8376 | 53.82 | 0.0 | WLB, RR, CB, P | Weak |
Table 7.
Logistic Regression Summary – Hungary Layer.
| Model | Events / Non-Events | AUC | 10-fold AUC | Deviance R² | 10-fold Deviance R² | Domains | Category |
|---|---|---|---|---|---|---|---|
| INC1 | 86 / 56 | 0.7591 | 0.6804 | 17.97 | 6.11 | WLB, RR, CB, DL, P | Moderate |
| INC2 | 101 / 41 | 0.7892 | 0.7061 | 21.25 | 7.43 | WLB, RR, CB, DL, P | Moderate |
| INC3 | 110 / 32 | 0.7696 | 0.7107 | 16.53 | 7.23 | RR, CB, DL, P | Moderate |
| AtLeastOneMild | 127 / 15 | 0.7446 | 0.6478 | 12.59 | 1.61 | WLB, DL, P | Weak |
| AtLeastTwoMild | 105 / 37 | 0.718 | 0.6239 | 9.16 | 0.0 | RR, CB, DL, P | Weak |
| AllThreeMild | 65 / 77 | 0.749 | 0.6939 | 13.13 | 5.93 | WLB, RR, CB, DL, P | Moderate |
| INC4 | 17 / 93 | 0.8235 | 0.7046 | 26.79 | 3.78 | WLB, RR, CB, DL | Moderate |
| INC5 | 8 / 102 | 0.9216 | 0.7267 | 44.65 | 0.0 | WLB, CB, P | Weak |
| INC6 | 25 / 85 | 0.9064 | 0.7939 | 37.7 | 4.96 | WLB, RR, CB, DL, P | Moderate |
| AtLeastOneSerious | 39 / 71 | 0.7633 | 0.6645 | 15.94 | 1.99 | WLB, CB, DL, P | Weak |
| AtLeastTwoSerious | 10 / 100 | 0.976 | 0.848 | 65.91 | 0.0 | WLB, RR, CB, DL, P | Weak |
| AllThreeSerious | 1 / 109 | nan | nan | nan | nan | – | Weak |
Table 8.
Logistic Regression Summary – UK Layer.
| Model | Events / Non-Events | AUC | 10-fold AUC | Deviance R² | 10-fold Deviance R² | Domains | Category |
|---|---|---|---|---|---|---|---|
| INC1 | 38 / 48 | 0.8961 | 0.8152 | 41.86 | 18.22 | WLB, RR, P | Good |
| INC2 | 64 / 22 | 0.8175 | 0.7756 | 20.54 | 7.3 | WLB, P | Moderate |
| INC3 | 76 / 10 | 0.9395 | 0.8276 | 48.34 | 10.14 | WLB, P | Good |
| AtLeastOneMild | 78 / 8 | 0.9631 | 0.8846 | 61.21 | 0.0 | WLB, RR, P | Weak |
| AtLeastTwoMild | 69 / 17 | 0.9812 | 0.9309 | 72.22 | 12.38 | WLB, RR, CB, DL, P | Good |
| AllThreeMild | 31 / 55 | 0.9205 | 0.8322 | 49.61 | 21.64 | WLB, RR, CB, DL, P | Good |
| INC4 | 13 / 73 | 0.7903 | 0.6691 | 20.98 | 0.0 | RR, CB, DL | Weak |
| INC5 | 6 / 80 | 0.9323 | 0.8635 | 41.06 | 12.47 | DL, P | Weak |
| INC6 | 17 / 69 | 0.8086 | 0.7379 | 21.76 | 12.04 | WLB, RR, DL | Moderate |
| AtLeastOneSerious | 27 / 59 | 0.7009 | 0.6557 | 9.56 | 4.23 | WLB, RR, DL | Weak |
| AtLeastTwoSerious | 8 / 78 | 0.9776 | 0.6675 | 66.27 | 0.0 | WLB, RR, CB, DL | Weak |
| AllThreeSerious | 1 / 85 | nan | nan | nan | nan | nan | Weak |
Table 9.
Logistic Regression Summary – USA Layer.
| Model | Events / Non-Events | AUC | 10-fold AUC | Deviance R² | 10-fold Deviance R² | Domains | Category |
|---|---|---|---|---|---|---|---|
| INC1 | 69 / 34 | 0.7432 | 0.7006 | 14.79 | 8.76 | WLB, RR, DL | Moderate |
| INC2 | 91 / 12 | 0.8457 | 0.7747 | 27.71 | 11.46 | WLB, RR, DL | Good |
| INC3 | 96 / 7 | 0.8772 | 0.7589 | 36.35 | 0.0 | WLB, CB, DL | Weak |
| AtLeastOneMild | 99 / 4 | 0.9407 | 0.7462 | 50.45 | 0.0 | WLB, DL | Weak |
| AtLeastTwoMild | 92 / 11 | 0.9862 | 0.9516 | 69.7 | 19.53 | WLB, RR, CB, DL, P | Good |
| AllThreeMild | 65 / 38 | 0.7555 | 0.6905 | 16.93 | 5.39 | WLB, CB, DL | Moderate |
| INC4 | 24 / 78 | 0.7672 | 0.7118 | 15.25 | 7.52 | WLB, RR, P | Moderate |
| INC5 | 21 / 81 | 0.739 | 0.6711 | 13.34 | 5.25 | RR | Weak |
| INC6 | 34 / 68 | 0.8385 | 0.7587 | 24.74 | 9.06 | WLB, RR, CB, DL, P | Good |
| AtLeastOneSerious | 53 / 49 | 0.799 | 0.7405 | 21.23 | 10.25 | WLB, RR, P | Good |
| AtLeastTwoSerious | 18 / 84 | 0.913 | 0.8128 | 38.18 | 9.94 | RR, CB, DL, P | Good |
| AllThreeSerious | 8 / 94 | 0.9029 | 0.8072 | 37.88 | 7.54 | WLB, RR, CB, P | Weak |
Table 10.
Comparison of IT-Layer Models Predicting AtLeastOneSerious Incident With and Without Categorical Variables.
Table 10.
Comparison of IT-Layer Models Predicting AtLeastOneSerious Incident With and Without Categorical Variables.
| Model Type | AUC | Deviance R² | 10-fold AUC | 10-fold Deviance R² % | Included Predictors | Model Classification |
|---|---|---|---|---|---|---|
| Without Categorical Variables | 0.81 | 23.76 | 0.6765 | 0 | WLB6, WLB7, WLB9, RR6, RR8, CB1, CB3, DL1, DL2, DL5, DL6, P5 | Weak |
| With Categorical Variables | 0.8841 | 39.19 | 0.7897 | 9.2 | WLB4, WLB9, RR2, RR6, CB1, CB6, DL5, DL6, P5, P7, P10, D1, D2, WLB4×D2, WLB9×D1, CB6×D1, P10×D1 | Moderate-to-Strong |
Table 11.
Confusion Matrices for the Three Optimization Criterium.
| Criterion | Threshold | TP | FP | TN | FN | Precision | Recall | Specificity |
|---|---|---|---|---|---|---|---|---|
| Youden J | 0.47 | 49 | 22 | 55 | 16 | 0.69 | 0.754 | 0.714 |
| F1 Score | 0.47 | 49 | 22 | 55 | 16 | 0.69 | 0.754 | 0.714 |
| High Recall | 0.17 | 62 | 68 | 9 | 3 | 0.477 | 0.954 | 0.117 |
Disclaimer/Publisher’s Note: The statements, opinions and data contained in all publications are solely those of the individual author(s) and contributor(s) and not of MDPI and/or the editor(s). MDPI and/or the editor(s) disclaim responsibility for any injury to people or property resulting from any ideas, methods, instructions or products referred to in the content. |
© 2025 by the authors. Licensee MDPI, Basel, Switzerland. This article is an open access article distributed under the terms and conditions of the Creative Commons Attribution (CC BY) license (http://creativecommons.org/licenses/by/4.0/).
Copyright: This open access article is published under a Creative Commons CC BY 4.0 license, which permit the free download, distribution, and reuse, provided that the author and preprint are cited in any reuse.


