
Submitted:
29 July 2025
Posted:
29 July 2025
You are already at the latest version
Abstract
Henan Province, characterized by hills and mountains in its western, northern and southern region, is a high-risk area for geohazards in China. In this paper, we firstly investigated the geohazards over Henan using the basic deformation products of LuTan-1 and provided the minimum detectable deformation gradients of the products. The basic products consist of deformation field products generated by differential interferometric synthetic aperture radar (InSAR, DInSAR), and time-series deformation products derived from multi-temporal InSAR (MT-InSAR). They were produced using the images from June 2023 to February 2025. We identified 1620 potential geohazards, including 1340 landslides located in western and southern Henan, 139 ground collapses due to underground mining concentrated in the coal-rich central and eastern regions, and 141 cases of ground subsidence mainly in the agricultural areas of central and northern Henan. DInSAR detected 1470 hazards while MT-InSAR found 150 more. Deformation gradients of the 150 geohazards were less than 0.061 mm, which is not detectable by DInSAR. While the deformation gradients were greater than 0.017 mm/yr and was discovered by MT-InSAR. The overall distribution exhibits a certain pattern, offering a basis for geohazard monitoring.
Keywords:
LuTan-1
; deformation product
; Henan province
; geohazard
; DInSAR
; MT-InSAR
1. Introduction
Henan Province is located in the transitional zone between the North China Plain and the Qinling-Funiu Mountain ranges, featuring complex geological structures and widespread loess strata distribution. Coupled with human activities such as mineral resource extraction and agricultural irrigation, it ranks among China’s provinces with the high frequency of geohazards. Statistics indicate that the hazards in Henan directly threaten over 2 million residents and entail potential economic losses amounting to 12 billion yuan. Influenced by a monsoon climate, the annual average rainfall ranges from 600 to 1,200 mm, while extreme rainfall events like the catastrophic July 20, 2021 Zhengzhou rainstorm have further heightened risks of rock and soil instability. Henan Province is in the strategic transition of disaster management approach from passive emergency response to proactive prevention and control.
LuTan-1 (LT-1)[1] is China's first satellite dedicated to geohazard monitoring. Its advantages include strong vegetation penetration capability enabled by L-band long-wavelength, a short revisit cycle of 4 days through its pursuit monostatic formation, and a 3-meter high-resolution imaging mode. These features allow it to effectively overcome data decoherence issues in cloudy and rainy environments, providing a reliable data source for deformation monitoring in complex terrains such as the loess hilly areas of western Henan Province. To fully leverage LT-1's[2] deformation monitoring capabilities, we have developed a foundational deformation product system tailored to operational production requirements.
The foundational deformation products consist of deformation field products generated by DInSAR technology, and time-series deformation products derived from MT-InSAR technology[3]. Deformation field products are raster datasets created using Differential Interferometric SAR (DInSAR) technology applied to two co-registered SLC images, where line-of-sight (LOS) deformation measurements directly visualize surface displacement. These products are primarily used for rapid detection of large-scale ground deformation, locating the sites of geohazards effectively. By monitoring medium-to-high geohazard-prone zones and adjacent areas, DInSAR detects over 80% of newly emerging geohazards occurring beyond known risk regions. Time-series deformation products are developed through time-series modeling using multiple geometrically calibrated SLC images, presented as scatter plots where each point contains LOS deformation time series within the interferometric period, thus we can assess the stability of the geohazards. To address the complexity and methodological diversity inherent in MT-InSAR systems, the small baseline subset (SBAS) approach is uniformly adopted for on-demand production of these time-series products, ensuring streamlined operational workflows and enhanced compatibility with geohazard monitoring requirements across diverse terrains.
Based on L-band LT-1 data, this study generated two kinds of basic deformation products for Henan Province using DInSAR and SBAS techniques. Utilizing these deformation results, we interpreted and analyzed the spatial distribution, magnitude, and types of identified geohazards[4]. To validate the InSAR-derived deformation information and investigate the underlying mechanisms of geological hazards in high-risk areas, we conducted a detailed investigation in Lingbao City, a known disaster-prone region in western Henan, employing an integrated interpretation approach. Subsequently, based on the validation results from this comprehensive investigation, we discuss the capabilities of the DInSAR method in detecting surface deformation associated with geological hazards.
Section 2 introduces the geohazard background of the study area and describes the datasets used for both methods. Section 3 presents the processing methodologies for DInSAR and SBAS techniques, including an analysis of their minimum detectable deformation velocity gradients. Section 4 details the InSAR-derived results, provides their interpretation, and further discusses the minimum detectable deformation gradients for both DInSAR and SBAS methods. Finally, Section 5 summarizes the key findings and conclusions.
2. Study Area and Datasets
2.1. Study Area
Henan Province, with 44.3% of its land being mountainous and hilly, is highly vulnerable, particularly in its western, northern, and southern highlands, as well as the northern plains and eastern areas. Geohazards in Henan have increased, especially before the flood season from June to September, and now occur year-round due to climate change and human activities. Heavy rainfall and snow-melt significantly raise the risk of debris flows and landslides.
Geohazards in Henan province predominantly occur in known hazard-prone areas and concentrate during flood season, primarily triggered by heavy rainfall[5]. What’s more, human activities also serve as a contributing factor. These hazards mainly manifest as collapses, landslides[6], and human-induced ground subsidence[7]. From 2011 to 2022, Henan Province experienced nearly 880 geohazards, resulting in 18 deaths. Currently, there are thousands of known geohazards in Henan Province, threatening 165,200 people and property valued at 6.611 billion yuan. Based on the stage of gully evolution, the geohazard susceptibility of Henan Province was zoned into four regions. The extremely high susceptibility area is mainly distributed in the mountainous and hilly areas of the Taihang Mountains in northern Henan, the mountainous and hilly areas of the Xiaoshan, Xiong'ershan, Funiu Mountains, Songshan and Wai Fangshan in western Henan, as well as the mountainous and hilly areas of the Tongbai Mountains and Dabie Mountains in southern Henan. A total of 1,080 small watersheds were delineated, covering a total area of 33,074.51 square kilometers.[8]
Lingbao City, a representative geohazard hot spot in western Henan Province, is located at the southeastern edge of the Loess Plateau. It is bordered by the Xiaoqinling-Xiaoshan Mountains to the south and the Yellow River valley to the north. The significant geohazard in this region results from the interplay of three critical factors: thick, erosion-prone loess deposits, ongoing tectonic uplift along the Qinling orogenic belt, and extensive landform changes induced by mining. This natural-humanity synergy makes Lingbao an ideal model for investigating hazard dynamics within provincial-scale disaster corridors.
2.2. Datasets
Firstly, we utilized 2,800 LT-1 scenes with 3-meter resolution acquired from July 2023 to Dec. 2024 across Henan Province, encompassing 1,428 ascending-orbit and 1,372 descending-orbit scenes, along with the 30-meter resolution TanDEM-DEM as external DEM data, to perform DInSAR processing.
Secondly, to mitigate the influence of noise, atmospheric phase delays, and topographic errors on geological hazard interpretation in DInSAR results, we applied the SBAS technique to process 1716 LT-1 scenes including 540 ascending-orbit and 1176 descending-orbit data acquired from July 2023 to February 2025. These datasets, with a 3-meter spatial resolution, were processed to derive deformation rate fields. Furthermore, we integrated mining area boundaries into our deformation screening method and overlaid optical imagery and topographic data to facilitate a three-dimensional integrated interpretation. This approach allowed us to preliminary identify the types of geological hazards and gather basic information about the disaster-prone elements during the screening process.
Thirdly, during the deformation interpretation process, we conducted a detailed investigation and field survey in Lingbao City.

Table 1.
Main parameters of LT-1 and data usage of the two methods.
| Parameter | DInSAR | SBAS | ||
|---|---|---|---|---|
| Band | L | |||
| Wavelength (cm) | 23.8cm | |||
| Azimuth/Range pixel spacing | 4.65m/1.67m | |||
| Polarization | HH | |||
| Acquisition time | June 2023-Dec. 2024 | July 2023- Feb. 2025 | ||
| Orbit direction | Ascending | Descending | Ascending | Descending |
| Number of data | 1,428 | 1,372 | 540 | 1,176 |
3. Production Methods and Minimum Detectable Deformation Velocity Gradients
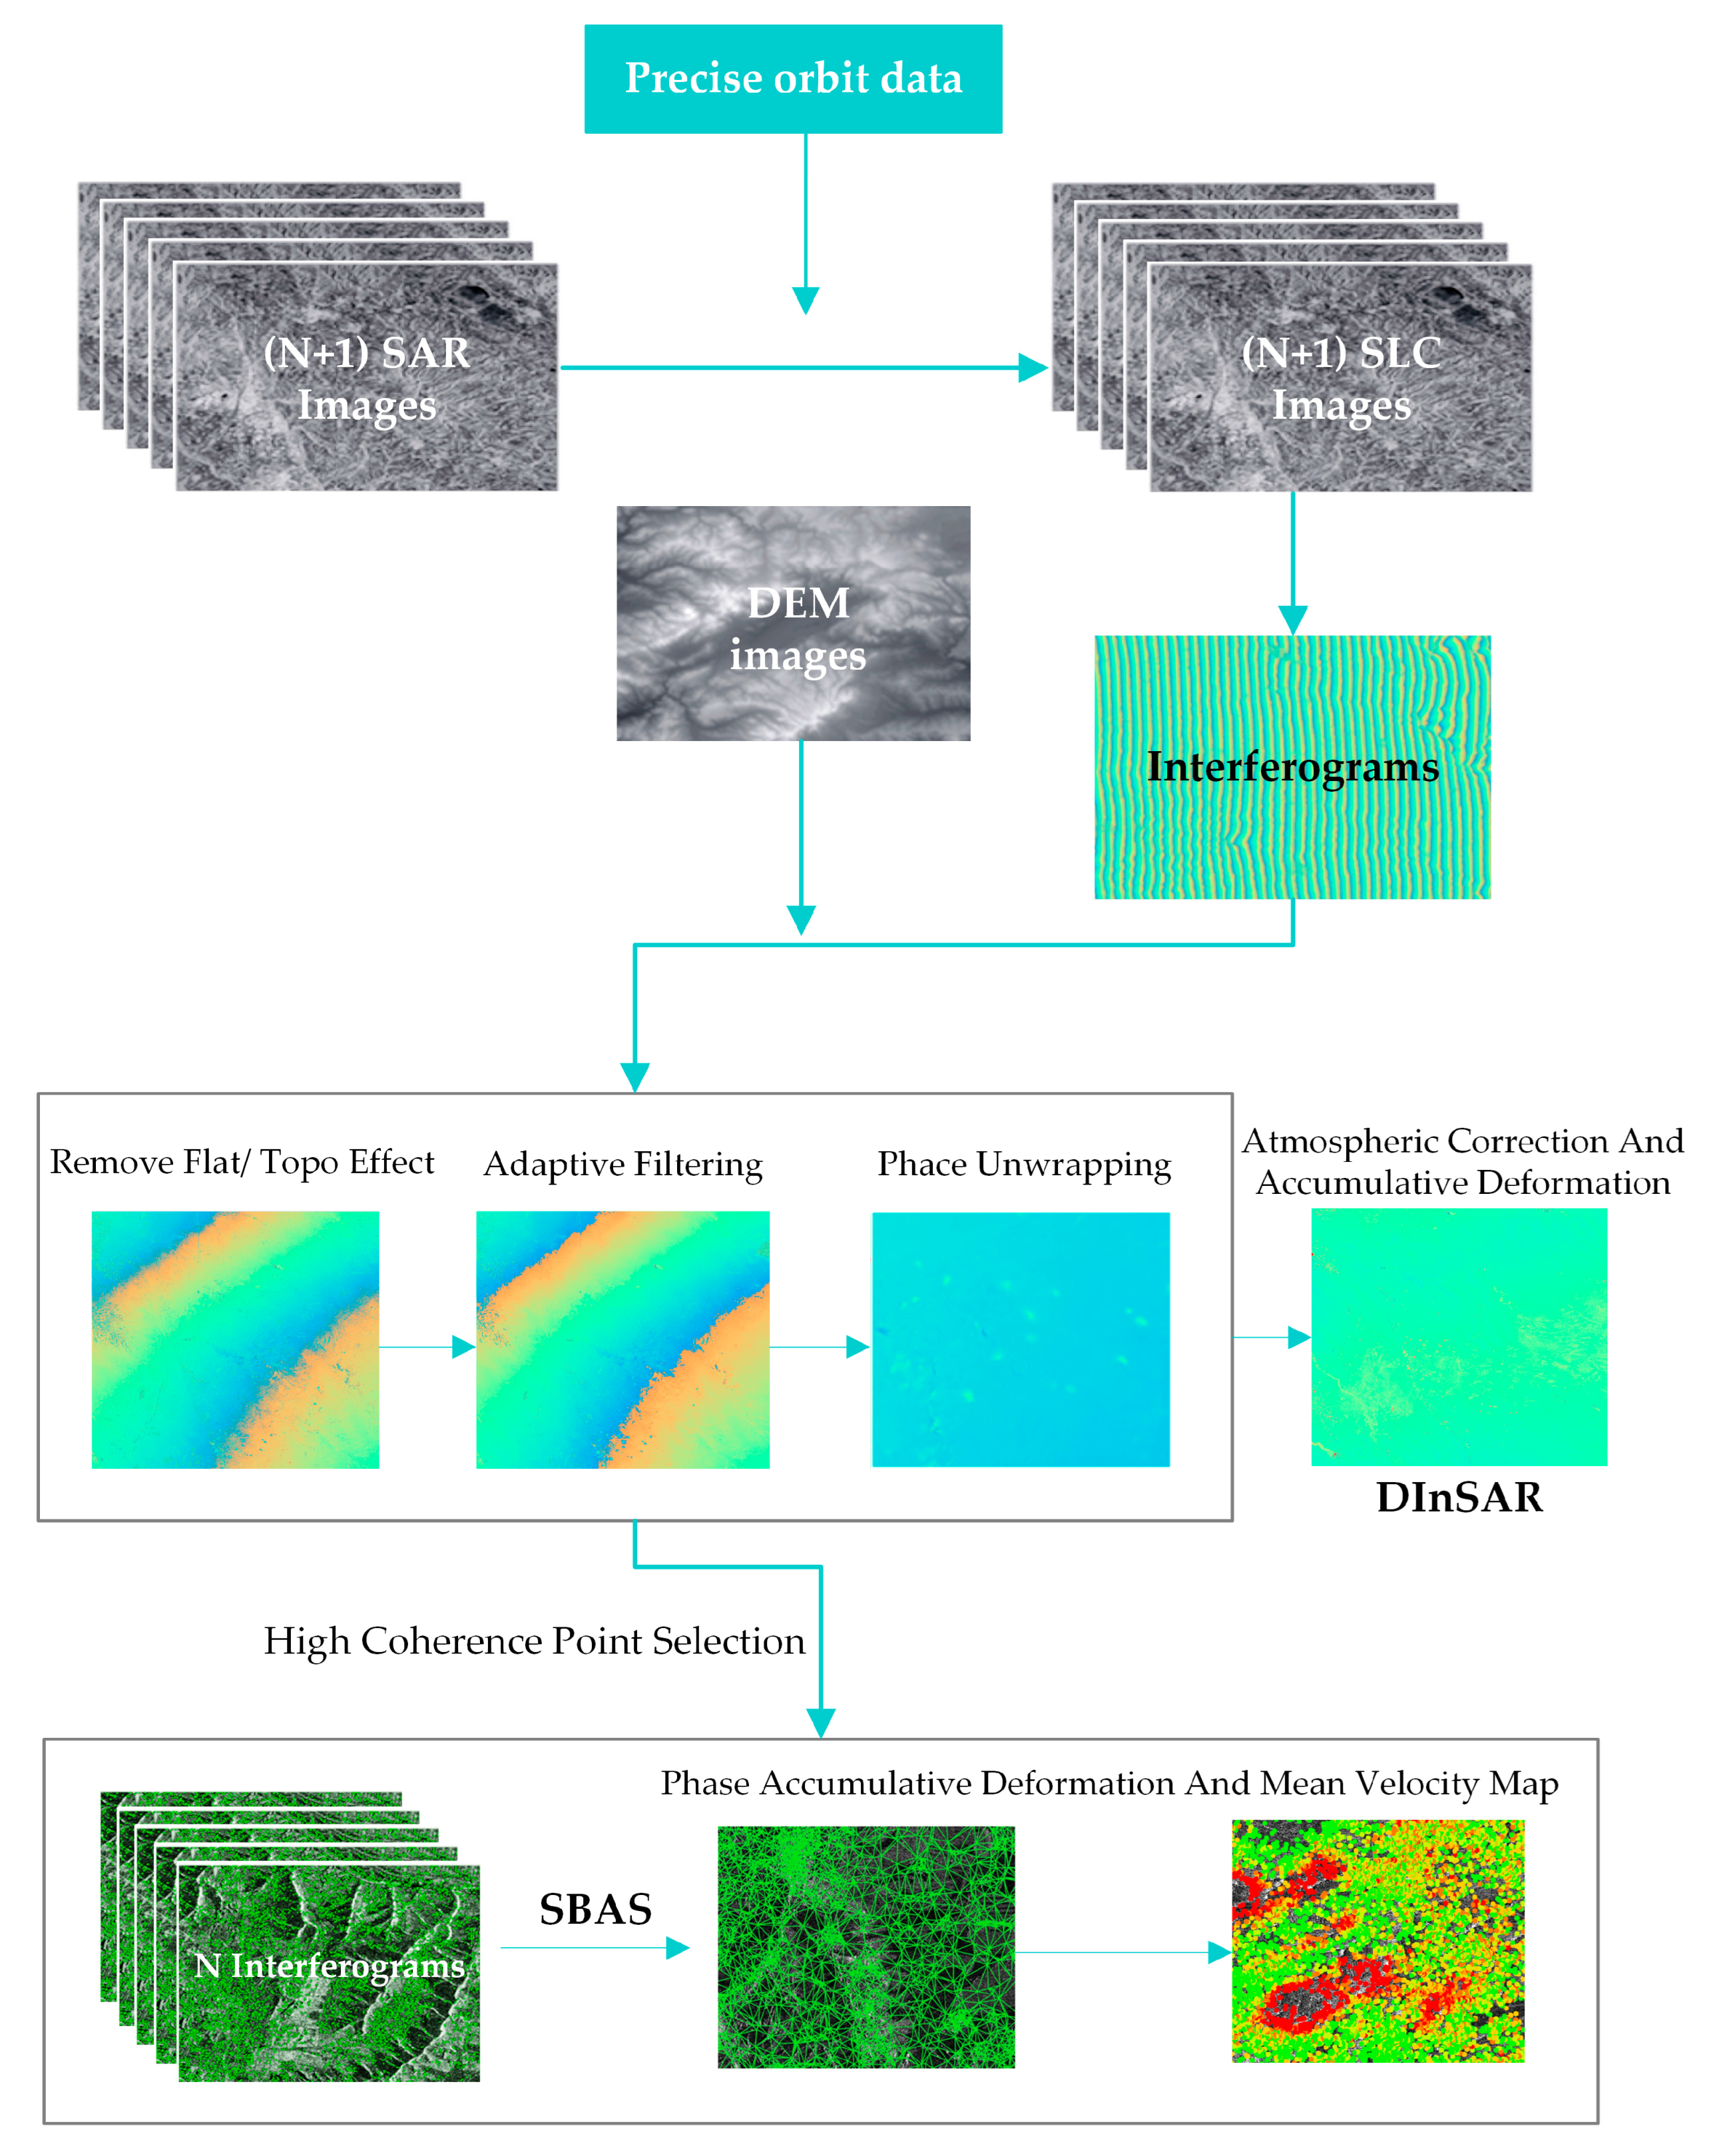
In this study, DInSAR and SBAS[9] processing were performed using LandSAR software, which was developed by our team. Interferograms were generated using the constraints on the vertical and temporal baselines, importing the precise orbit data to remove the orbit error. The flattening and topographic effects were removed with the TanDEM-DEM. Then, adaptive filtering and phase unwrapping were used to obtain a series of unwrapped differential interferograms. The influence of decoherence / thermal noise phase can be weakened by filtering. Because the study area is located in a mountainous area, a simple linear model was employed to remove the topography-dependent atmospheric phase.
In this formula, ϕdef, ϕflat, ϕatm, ϕorb, ϕtopo, ϕnoise represent deformation phase, flat phase, atmospheric phase, orbit error phase, terrain phase and noise phase, respectively. We calculate the deformation phase by removing all other components. That also means DInSAR is affected by those four components, the data are not as robust as SBAS are. We need to remove all the systematic error such as the flat phase, orbital phase, topographic phase[10], and GACOS is used to remove the atmospheric phase. Finally, the coherence value is used to assess the minimum detectable deformation gradient [11,12], i.e.,
where μ is the resolution, N is the multi-looking factor, γ is the coherence.
The SBAS[13] technique uses all the interferograms that satisfying the conditions of temporal-spatial baseline thresholds. When analyzing the capability of SBAS, we need to use the relative phase observation along arcs connecting persistent scatterer (PS),i.e.,
Then we convert the phase gradient along arcs into the relative deformation rate by using
where ω is the phase residues along arcs, it is expressed by using
whereis the temporal coherence. During the least square estimation, we expect that the error is not greater than the observations. If we assume that the elevation error is 0, the temporal baseline is 28 days. Then we obtain the deformation gradient along arcs for SBAS. We calculated the arc length of the results and found that the average value was 209.03 m. Therefore the minimum detectable deformation gradient along arcs for SBAS were calculated and shown in Figure 1. The minimum detectable deformation gradient of DInSAR decreases from its maximum of 0.1 mm at zero coherence to zero at maximum coherence. The similar phenomenon was observed by SBAS. However, within the coherence range of 0.05 to 0.6, SBAS achieves a lower minimum detectable deformation gradient than DInSAR. This indicates that SBAS is superior for regions with low coherence, which are primarily natural areas. Thus SBAS is useful to detect geohazards. When coherence falls below 0.05 or exceed 0.6, the minimum detectable deformation of DInSAR is lower than that of SBAS. Thus, DInSAR is preferable when coherence is high enough. This is the case for LT-1. Therefore in areas that the terrain types are not complex, and the vegetation is thin enough, this advantage makes DInSAR more suitable than SBAS.
Figure 1.
Relationship between deformation gradient and temporal coherence of both methods.
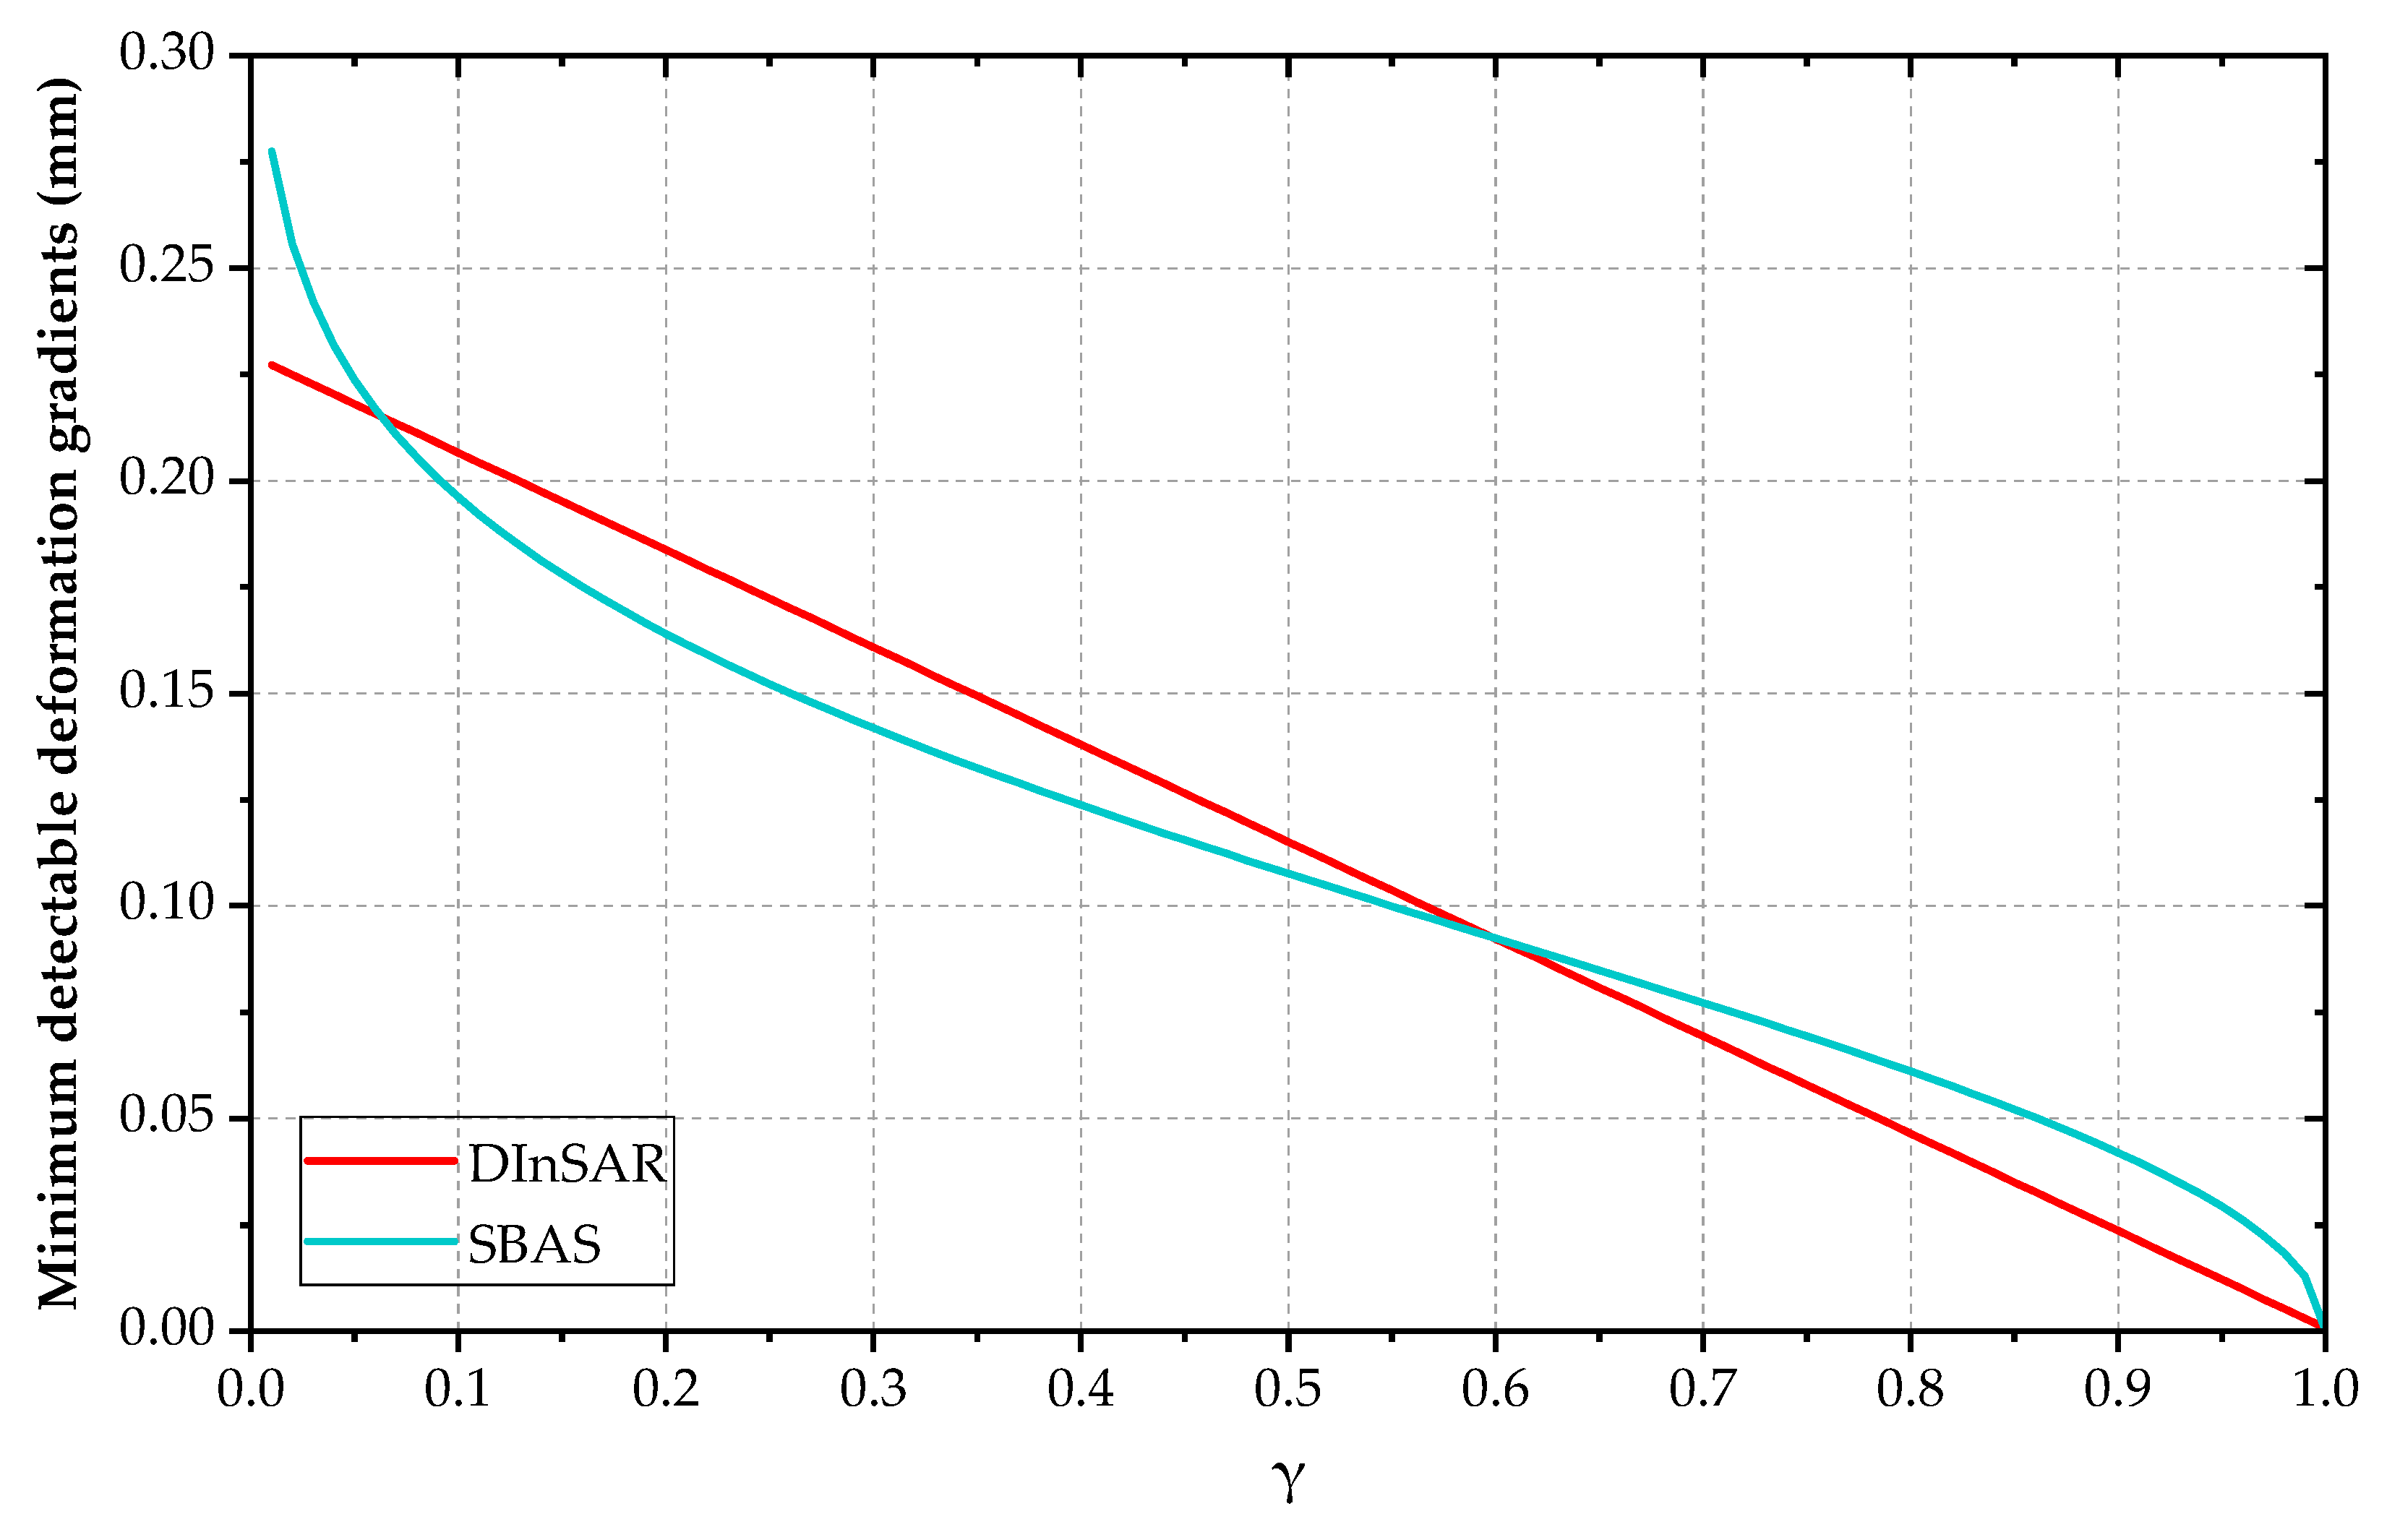
Figure 2.
DInSAR and SBAS processing chains.
4. Results and Discussion
4.1. Analysis of DInSAR and SBAS Results
We combined DInSAR and SBAS to identify 1,620 potential geohazards in Henan Province, of which 1,470 detected by both methods and 150 exclusive to SBAS (Figure 3). The 150 hazards comprise 141 land subsidence sites and 9 slow-evolving landslide risks. Geohazards identified by both techniques are marked with filled circles, color-coded by type, of that purple for ground collapse, green for land subsidence, gray for rockfall, orange for mud-rock flow, and bright red for landslide. Triangles represent geohazards detected only by SBAS method.
The results revealed distinct spatial patterns of geohazards province-wide. Firstly, 1340 are located in western and southern Henan, predominantly landslides. Secondly, 139 are ground collapses due to underground mining, mainly in the coal-rich central and eastern regions. Thirdly, 141 are land subsidence, mostly in the grain-growing areas of central and northern Henan. Provincial deformation results reveal significant surface displacement signals in western Henan, correlating with heightened geohazards[14].
The three circled points highlight significant deformation. Point a marks the province's most severe subsidence, measuring -296 mm. In contrast, Point b shows the greatest uplift across the region at 212 mm. Point c represents the most substantial settlement in Lingbao City (-87 mm). The SBAS results provide further insight into the deformation trends at these points, revealing high annual deformation velocities: -1470 mm/yr at point a, +499 mm/yr at point b, and -273 mm/yr at point c. These velocities indicate persistent and ongoing subsidence or uplift processes.
Figure 4-1, 4-2, and 4-3 present the DInSAR and SBAS analysis results for areas a, b, and c, respectively. Each figure comprises four components: (a) DInSAR interferograms, (b) deformation velocity rate map generated by SBAS, (c) optical image, and (d) cumulative deformation line chart. Area a, situated within an active coal mining area [13], displays continuous and extensive ground subsidence resulting from long-term mining operations. Analysis of the deformation time series reveals distinct temporal patterns, see the line chart. Subsidence rates were low with small magnitudes during August-November 2023 and April-October 2024, suggesting reduced or halted mining activity. In contrast, significantly accelerated subsidence occurred from November 2023 to April 2024, attributable to active mining. Subsidence resumed from October to December 2024, consistent with renewed mining operations. Area b, situated at a tailing dam, exhibits the most prominent uplift signal in the region. This persistent uplift is interpreted as resulting from the continuous accumulation of mine waste material, primarily occurring during August 2023-May 2024 and August-October 2024. Conversely, localized settlement features observed from May-August 2024 and October-December 2024 are likely caused by the periodic cleaning of tailing reservoir. Area c, identified as a potential landslide hazard in Lingbao City, shows significant subsidence. This deformation is likely associated with rainfall events, which can trigger maximum subsidence[14] in such unstable slopes.
Table 2.
Comparison of the hazards number identified by DInSAR and SBAS methods.
| Hazards identified by DInSAR | Hazards identified by SBAS | Hazards identified only by SBAS |
|---|---|---|
| 1470 | 1620 | 150 |
Figure 4-1.
DInSAR and SBAS results of area a.
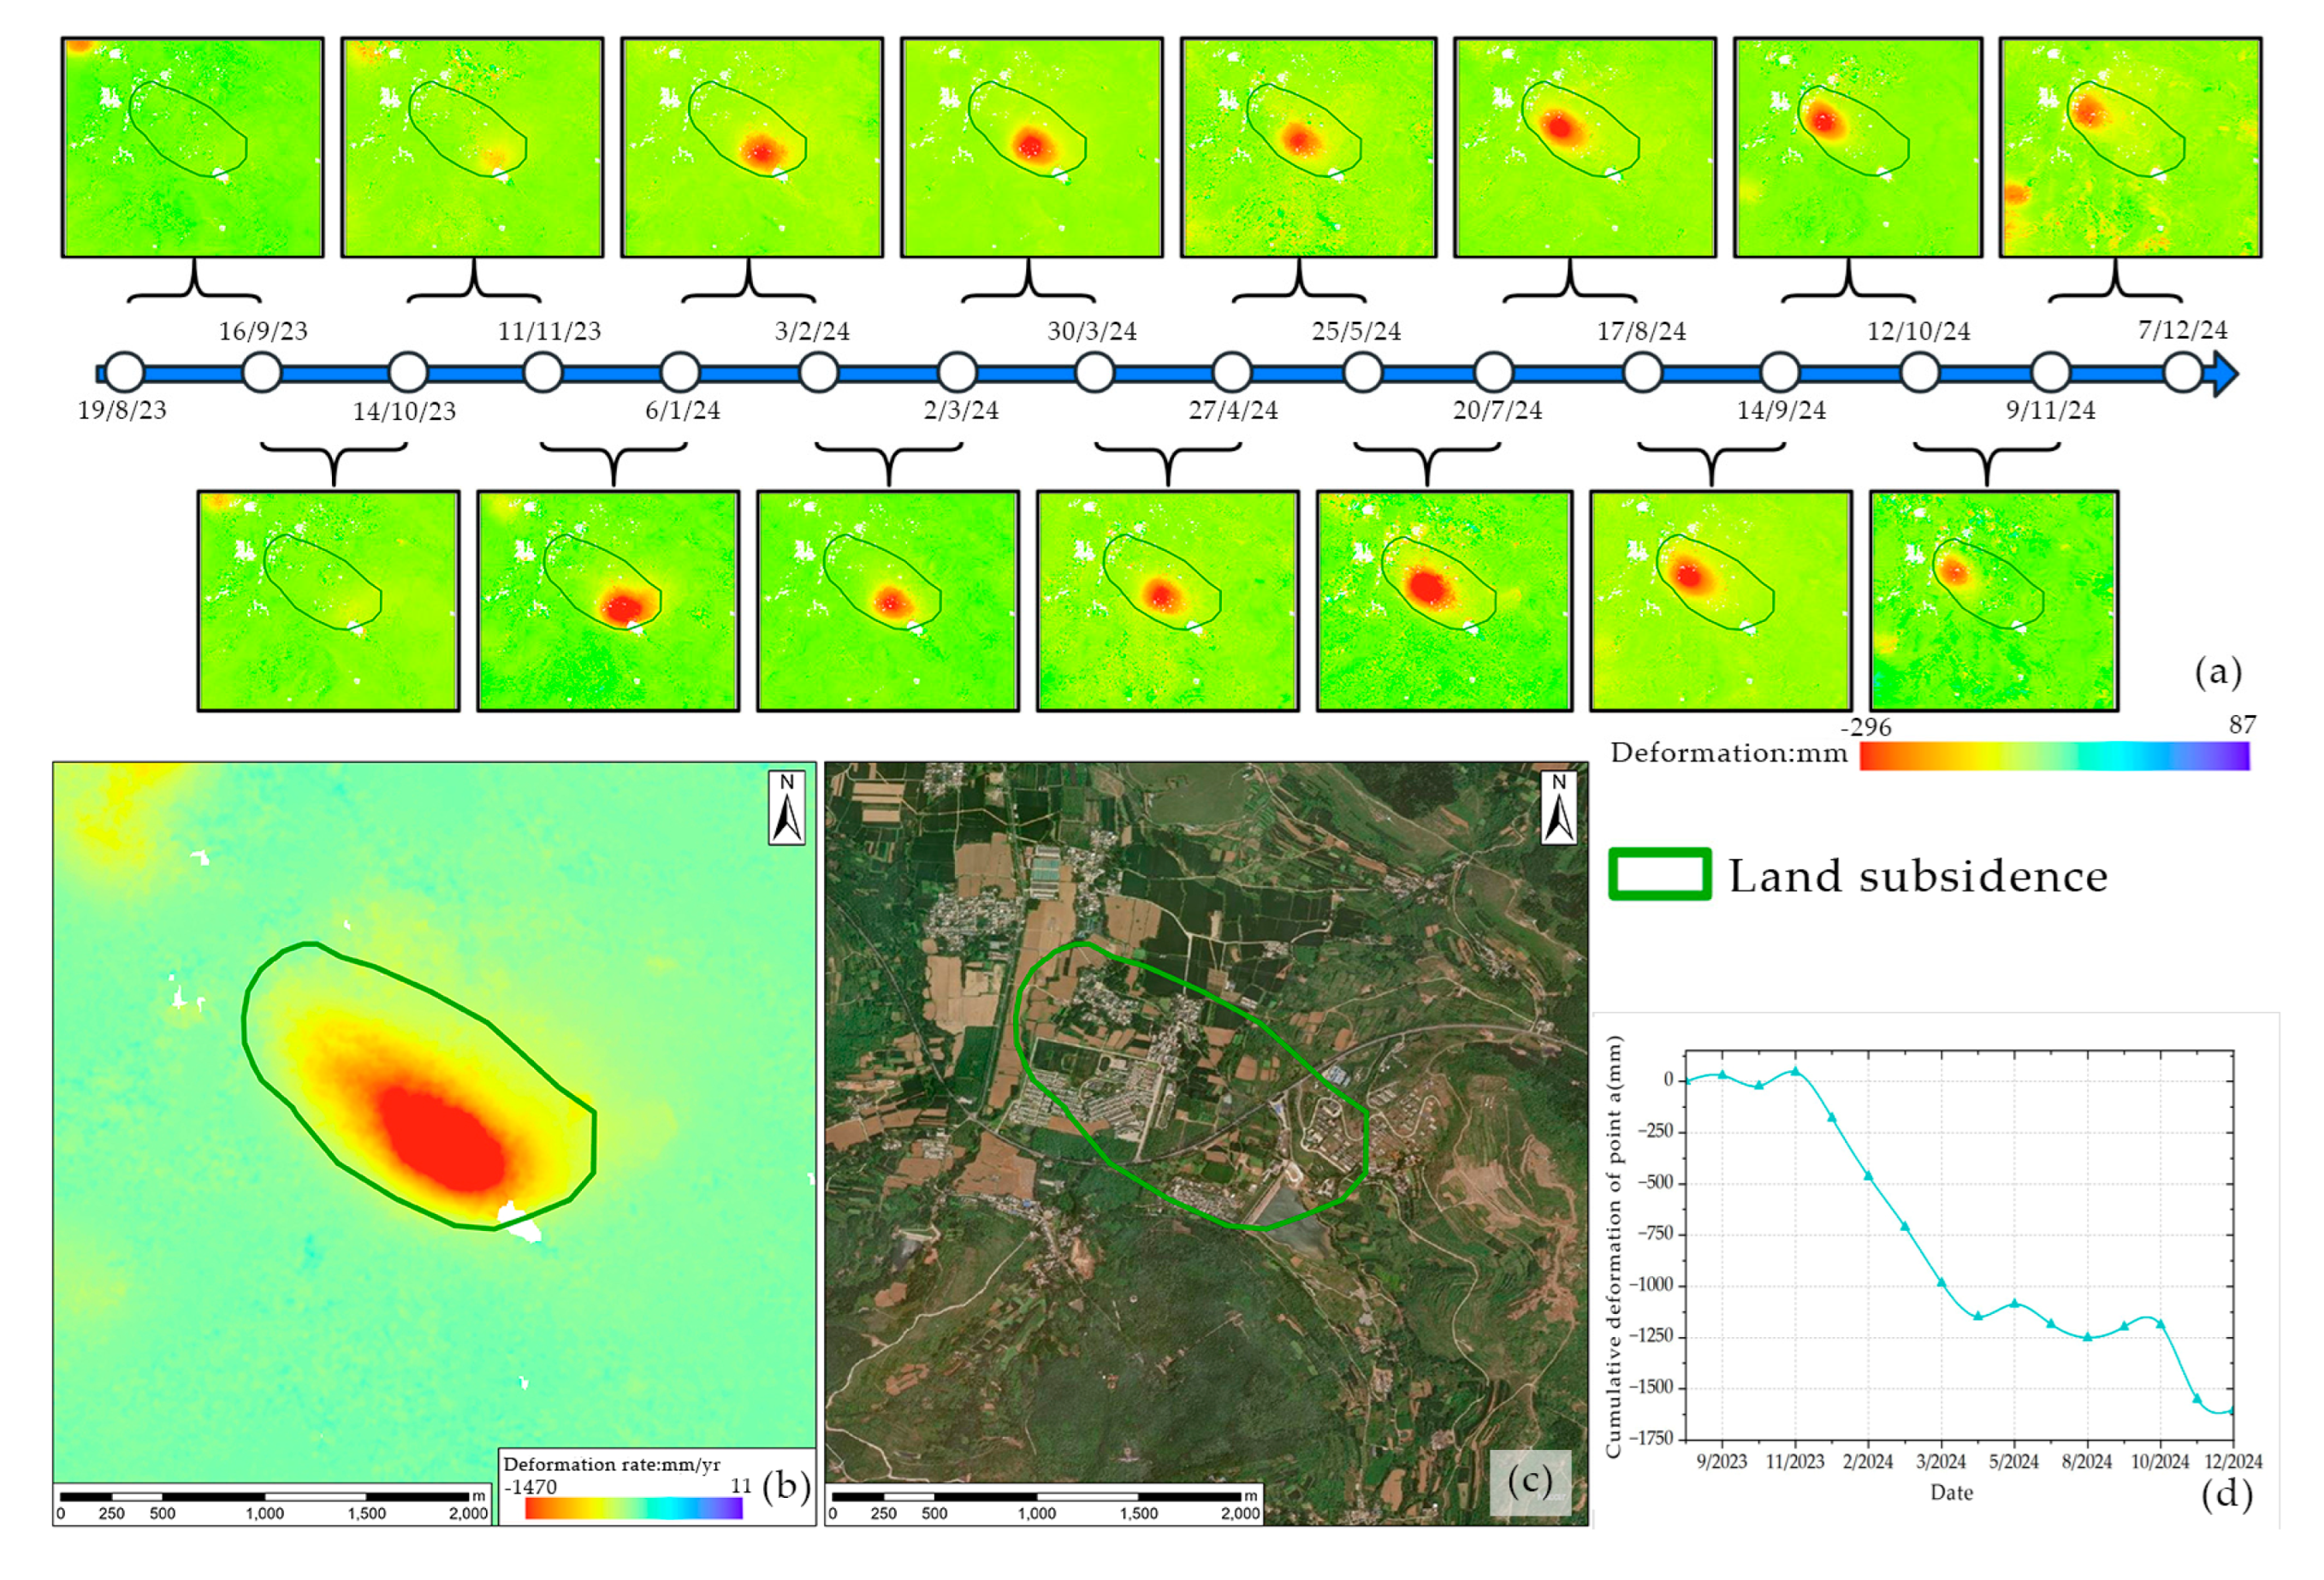
Figure 4-2.
DInSAR and SBAS results of area b.
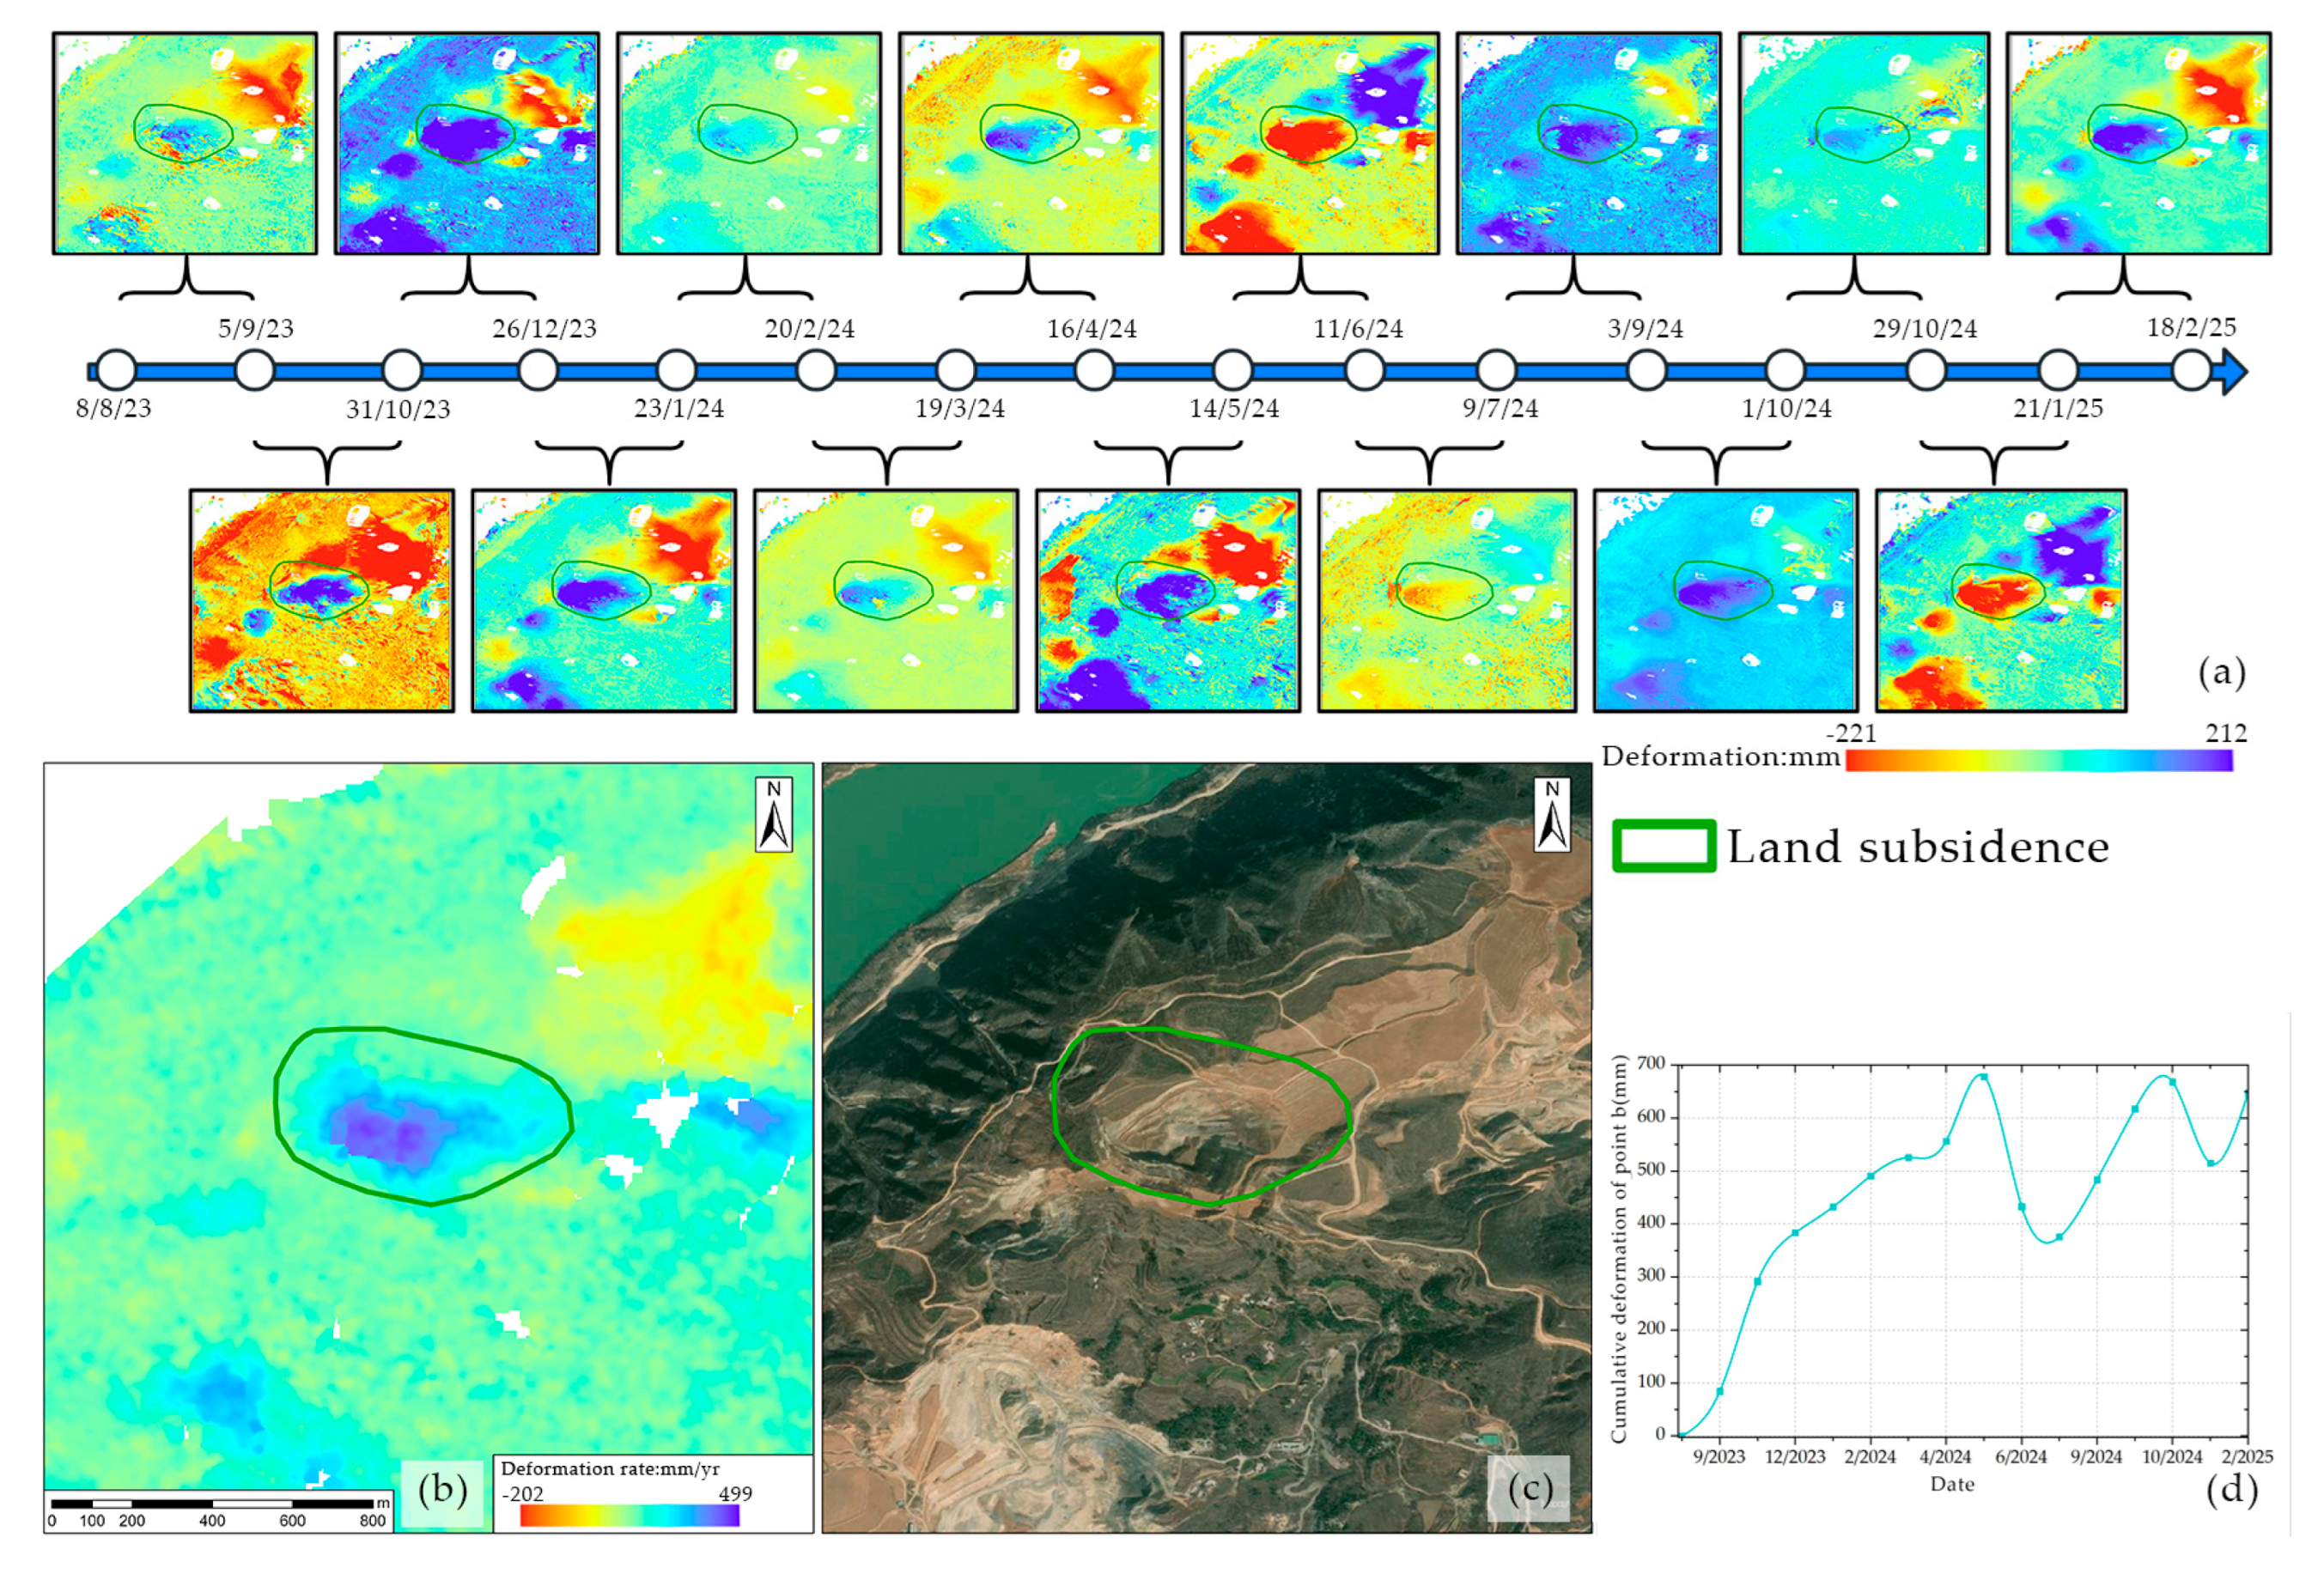
Figure 4-3.
DInSAR and SBAS results of area c.
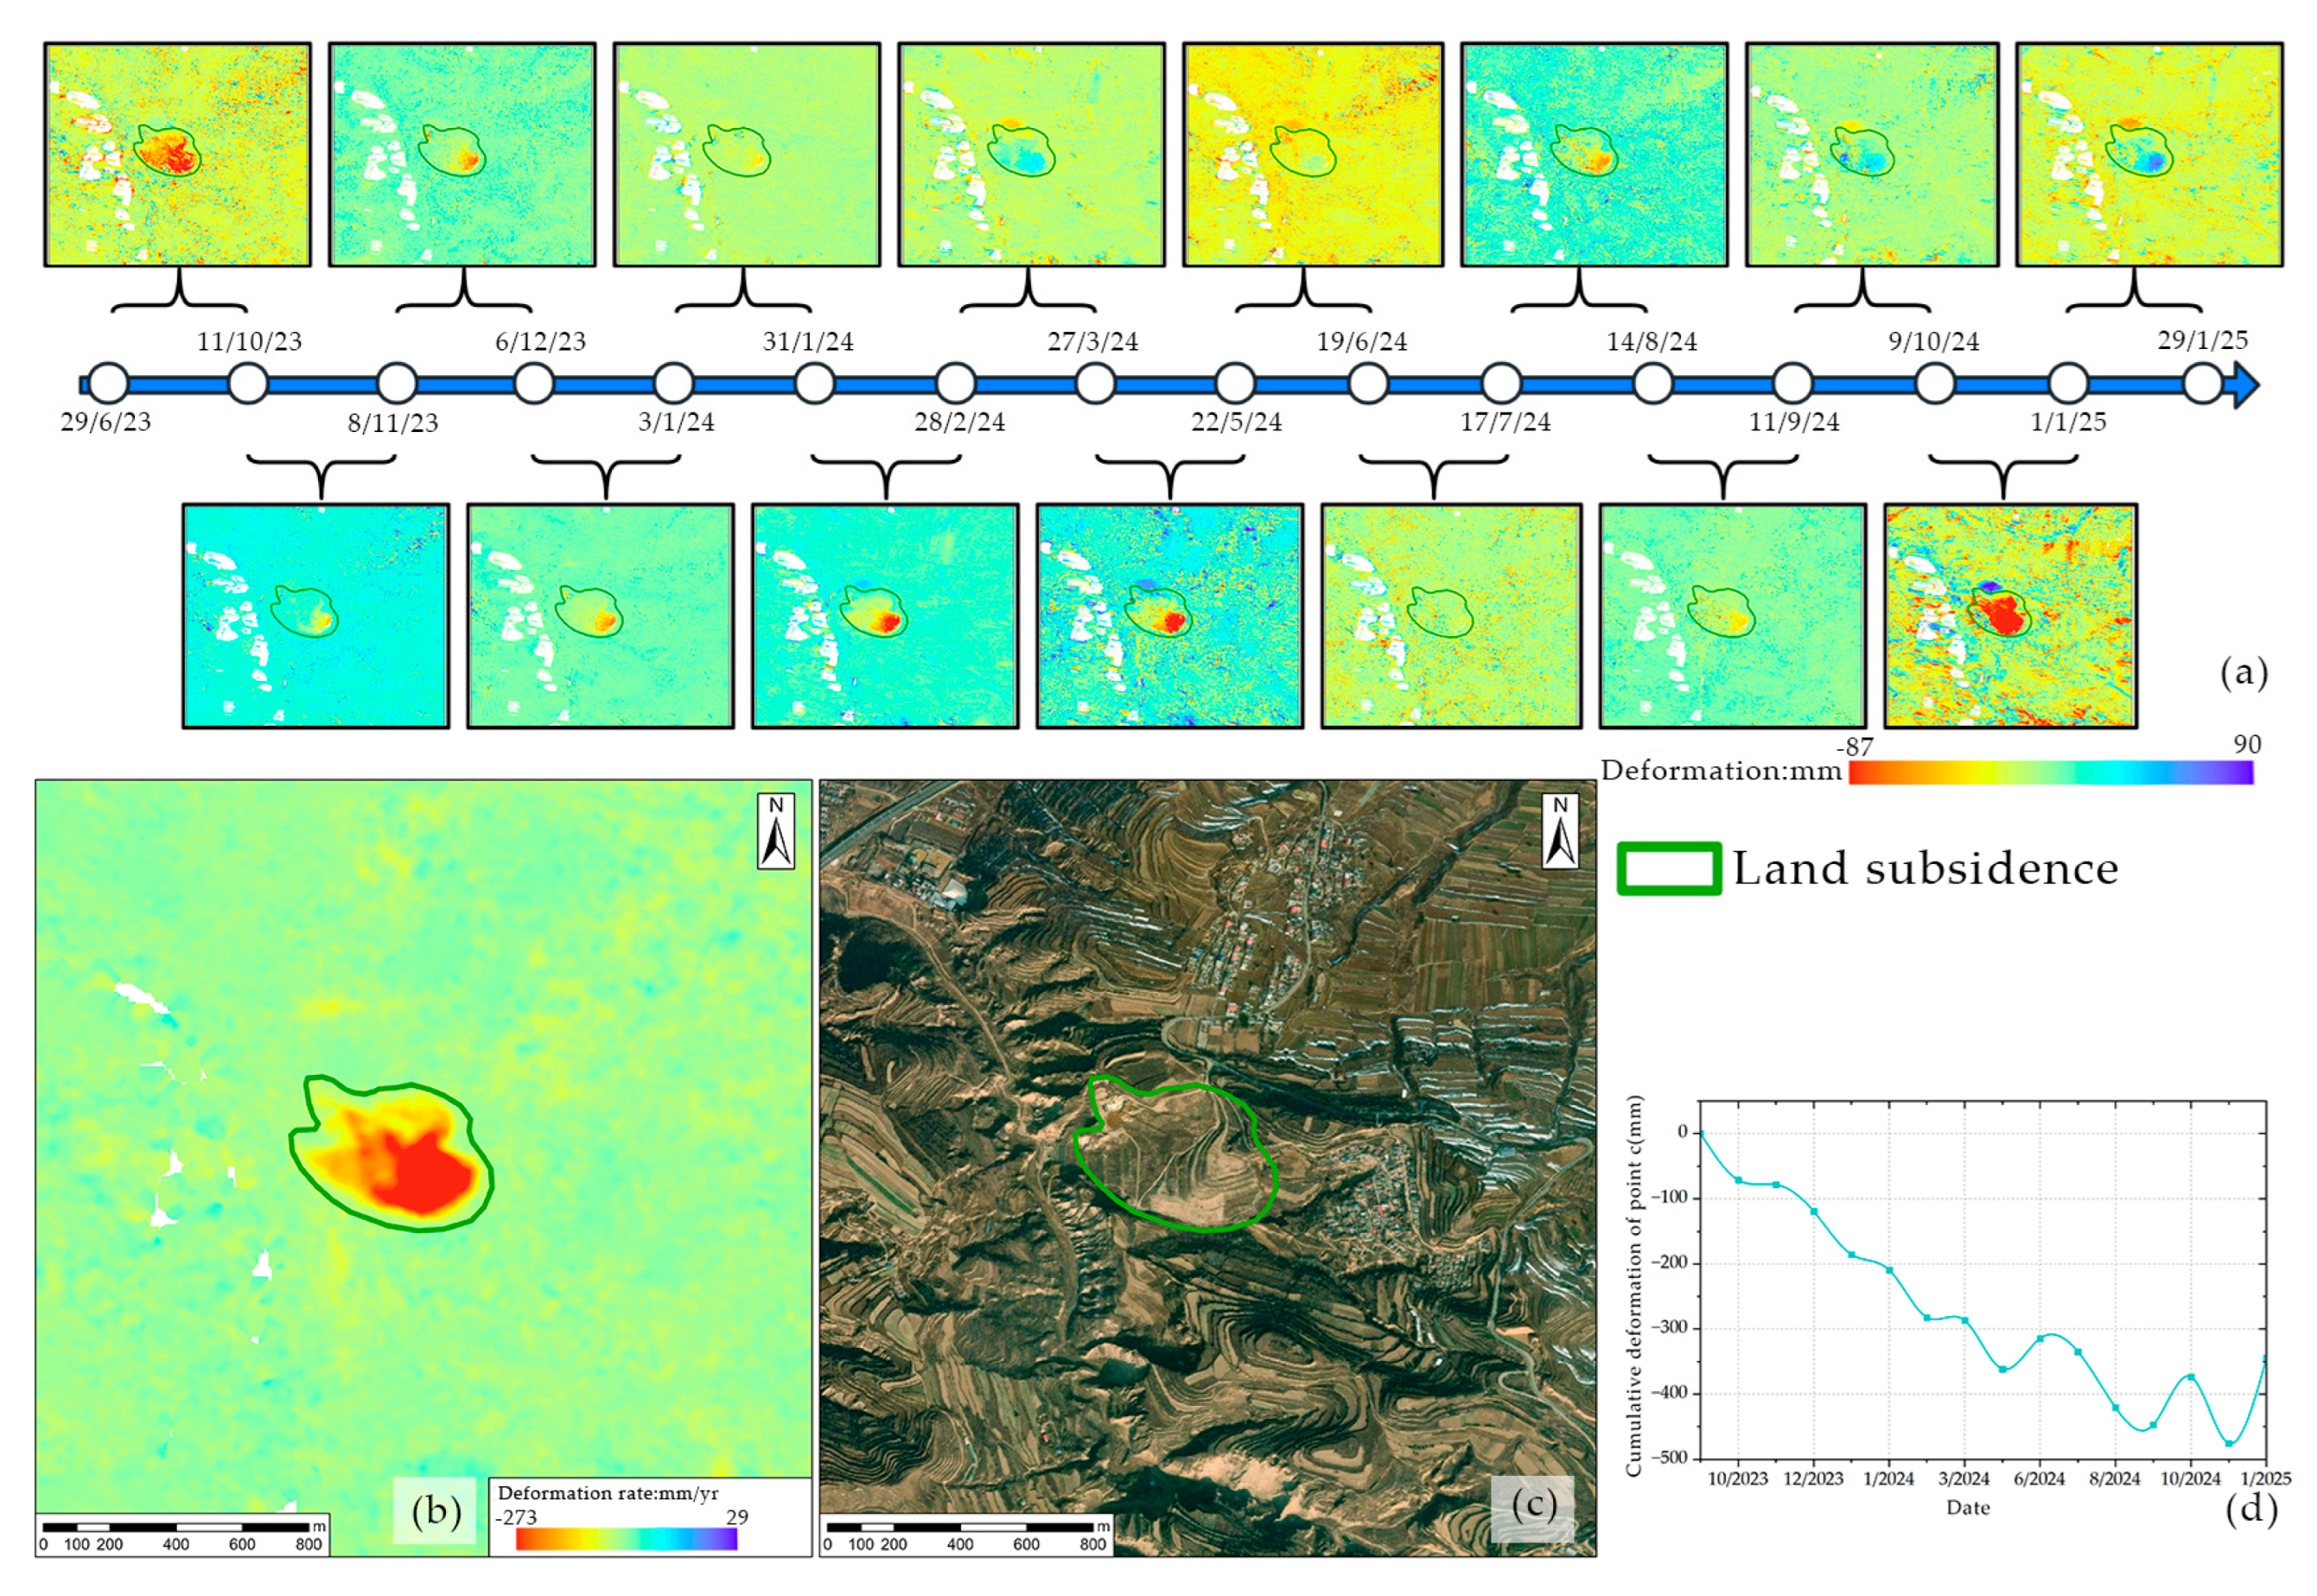
Figure 5 depicts ground subsidence areas identified only by SBAS results. Areas d, e, f, and g resulted from mining-related human activities at the open-pit mine, including tailing ponds, waste dumps, and activities in non-mining operational zones. Area h exhibits residual deformation from historical underground mining activities[15]. Areas i, j, k, l, m, n, and o are primarily caused by groundwater extraction[16] for agricultural irrigation, domestic use, or industrial purposes. What’s more, distinct deformation features were successfully interpreted by both DInSAR and SBAS in two areas: the active mining face around area d (open-pit mine), and the other one around area h, where deformation is driven by ongoing underground mining operations.
Figure 6 shows the nine landslide hazards only identified by SBAS[17] results province-wide. Except for r, s and v, the other six hazards are scattered and the settlement amount is relatively small, which are difficult to identify even in the velocity results. The maximum values of deformation velocity is -157 mm/yr.
Figure 7 shows a case of land subsidence monitoring results. Part a displays DInSAR results for each time period. In contrast, b and c present SBAS results and optical image respectively, where the deformation field within the same green circles is significantly more pronounced. The maximum settlement of DInSAR and SBAS is −119 mm and −145 mm/yr respectively. Deformation within the green circles is difficult to discern in these results. This enhanced visibility is due to SBAS's ability to account for accumulated subsidence over time. The observed land subsidence[18] at this location is consistent with the pattern shown in Figure 5 and is attributed to groundwater extraction for domestic and industrial use, resulting in gradual land subsidence.
Figure 8 provides a case comparing DInSAR and SBAS results for abandoned underground mining monitoring. Part a, b and c are DInSAR results, SBAS results and optical image respectively. The maximum settlement of DInSAR and SBAS is −89 mm and −95 mm/yr respectively. Following mine closure, residual subsidence persists over the mined-out area for an extended period. Unlike the significant, rapid collapse during active mining, this residual deformation exhibits lower deformation rates and occurs gradually over a longer timescale. Consequently, DInSAR often struggles to detect this subtle, long-term subsidence. If we enlarge the temporal baseline to a year, the temporal decoherence would be too serious to provide useful deformation information.
4.2. Detailed Investigation of Typical Geohazards
Based on InSAR results, Lingbao City was selected as a key area for detailed geohazard interpretation[19]due to its diverse disaster types, high disaster density, and distinctive deformation characteristics. The terrain of Lingbao is higher in the south and lower in the north, descending in a stepwise manner with a natural gradient of 34.4%. Six landform types develop sequentially from south to north: high mountain area, low mountain area, loess plateau, piedmont alluvial fan, river terrace, and riverbed floodplain[20]. The city has a warm temperate continental semi-humid monsoon climate. The annual average precipitation shows significant spatial differences, reaching 988.2 mm in the southern mountainous area and only 616.4 mm in the northern river valley plain, with 80% of the precipitation concentrated from May to October[21]. There are more than 10 major rivers in the area. Geologically, it is located on the southern margin of the Central Chinese Precambrian basement, with a double-layer structure of crystalline basement and sedimentary cover. The main fault systems are near east-west, northwest, and northeast. The basic seismic intensity is Grade 7.
May 2024 survey data identified 79 geohazards in Lingbao City: 36 collapses accounting for 45.6%, 18 landslides for 22.8%, 12 debris flows for 15.2%, 2 ground collapses for 2.5%, and 1 ground fissure for 1.3%[22]. Heavy rainfall triggers over 90% of sudden collapses, landslides and debris flows[23], while mining activities directly induce ground subsidence and fissures[24]. Spatially, geohazards are distributed in a belt along river valleys such as the Zongyang River and Hongnong River[20], with a high density in areas of intense human activity, such as Zongyang Town mining area[25] and Wumu Township’s cultivated slopes. 70% geohazards are located at 300–1000m elevations. Temporally, 90% of hazards happened in July-September during peak rainfall, exhibiting delayed effect under sustained precipitation. Disaster mechanisms demonstrate geohazards characterized by suddenness, with a short deformation–instability duration and a crack propagation rate of over 5 mm/h are influenced by local micro-climates. In addition, debris flows triggered by mining waste have blurred source–transport boundaries, increasing the risk of mobility-related disasters[24].
Figure 9 demonstrates the deformation velocity results of Lingbao City using LT-1 descending orbit data. We conducted a detailed investigation and field survey in Lingbao City, identifying 51 landslide hazards (No. LB1-51), of which 14 hazards are newly discovered this time. The deformation rate values range from -410 mm/yr to 210 mm/yr. This figure only shows the results of the descending orbit SBAS, and the hazards include both ascending and descending orbit deformation interpretation results.
Figure 10 presents the interpretation results of Slope LB1. Part a, b, c, d and e are SBAS, GF-2 imagery, UAV oblique photography, LiDAR and cumulative deformation map respectively. LB1 is a newly identified hazard located in Zhouyu Village, Lingbao City, with a maximum deformation rate of -105 mm/yr. Based on the SBAS results, three points (P1, P2, and P3) were selected from the deformation center to the periphery to plot the cumulative deformation line chart. It is evident that the hazard exhibits significant deformation from June to October each year, primarily influenced by the heavy rainfall during the flood season. The approximate range of the landslide was delineated by superimposing a GF-2 optical satellite image. A 3D model of the hazard was constructed using UAV oblique photography, which facilitated the detailed interpretation of ground objects. Additionally, a digital elevation model was created with UAV LiDAR data, allowing for the interpretation of landslide characteristics such as cracks, gullies, and slopes.
As is shown in Figure 11, LB2, LB3, and LB47 are three registered landslides, all located within the scope of mining rights, with a maximum deformation rate of -187 mm/yr. Part a, b, c, d and e are SBAS, GF-2 imagery, UAV oblique photography, LiDAR and cumulative deformation respectively. In this investigation, signs of deformation were identified at these sites. Three points (LB2-P1, LB3-P2, and LB47-P3) were selected for each landslide hazard to plot the cumulative deformation line chart. The line charts show that the deformation at these points generally follows a linear pattern, indicating that the landslides are primarily influenced by human mining activities and less affected by rainfall. The extent of the landslides was delineated using GF-2 satellite imagery. UAV oblique photography was employed to construct 3D models for identifying ground objects, while UAV LiDAR data were used to create digital elevation models, which facilitated the interpretation of features such as cracks, gullies, and small slope units.
The time-span of five new landslide hazards identified in Lingbao based on ascending orbit data is from March 2024 to February 2025, see Figure 12-1. Part a-b, c-d, e-f, g-h, i-j are SBAS result, GF-2 imagery of each hazard respectively. k is the cumulative deformation chart of the five hazards. Analysis of the cumulative deformation line charts for each point indicates that the deformation is predominantly linear. LB6, LB12 and LB17 are terraced fields, which are easy to be ignored in previous investigations. LB19 and LB21 are high-elevation hazards, which are not easy to reach by investigators in the past[26].
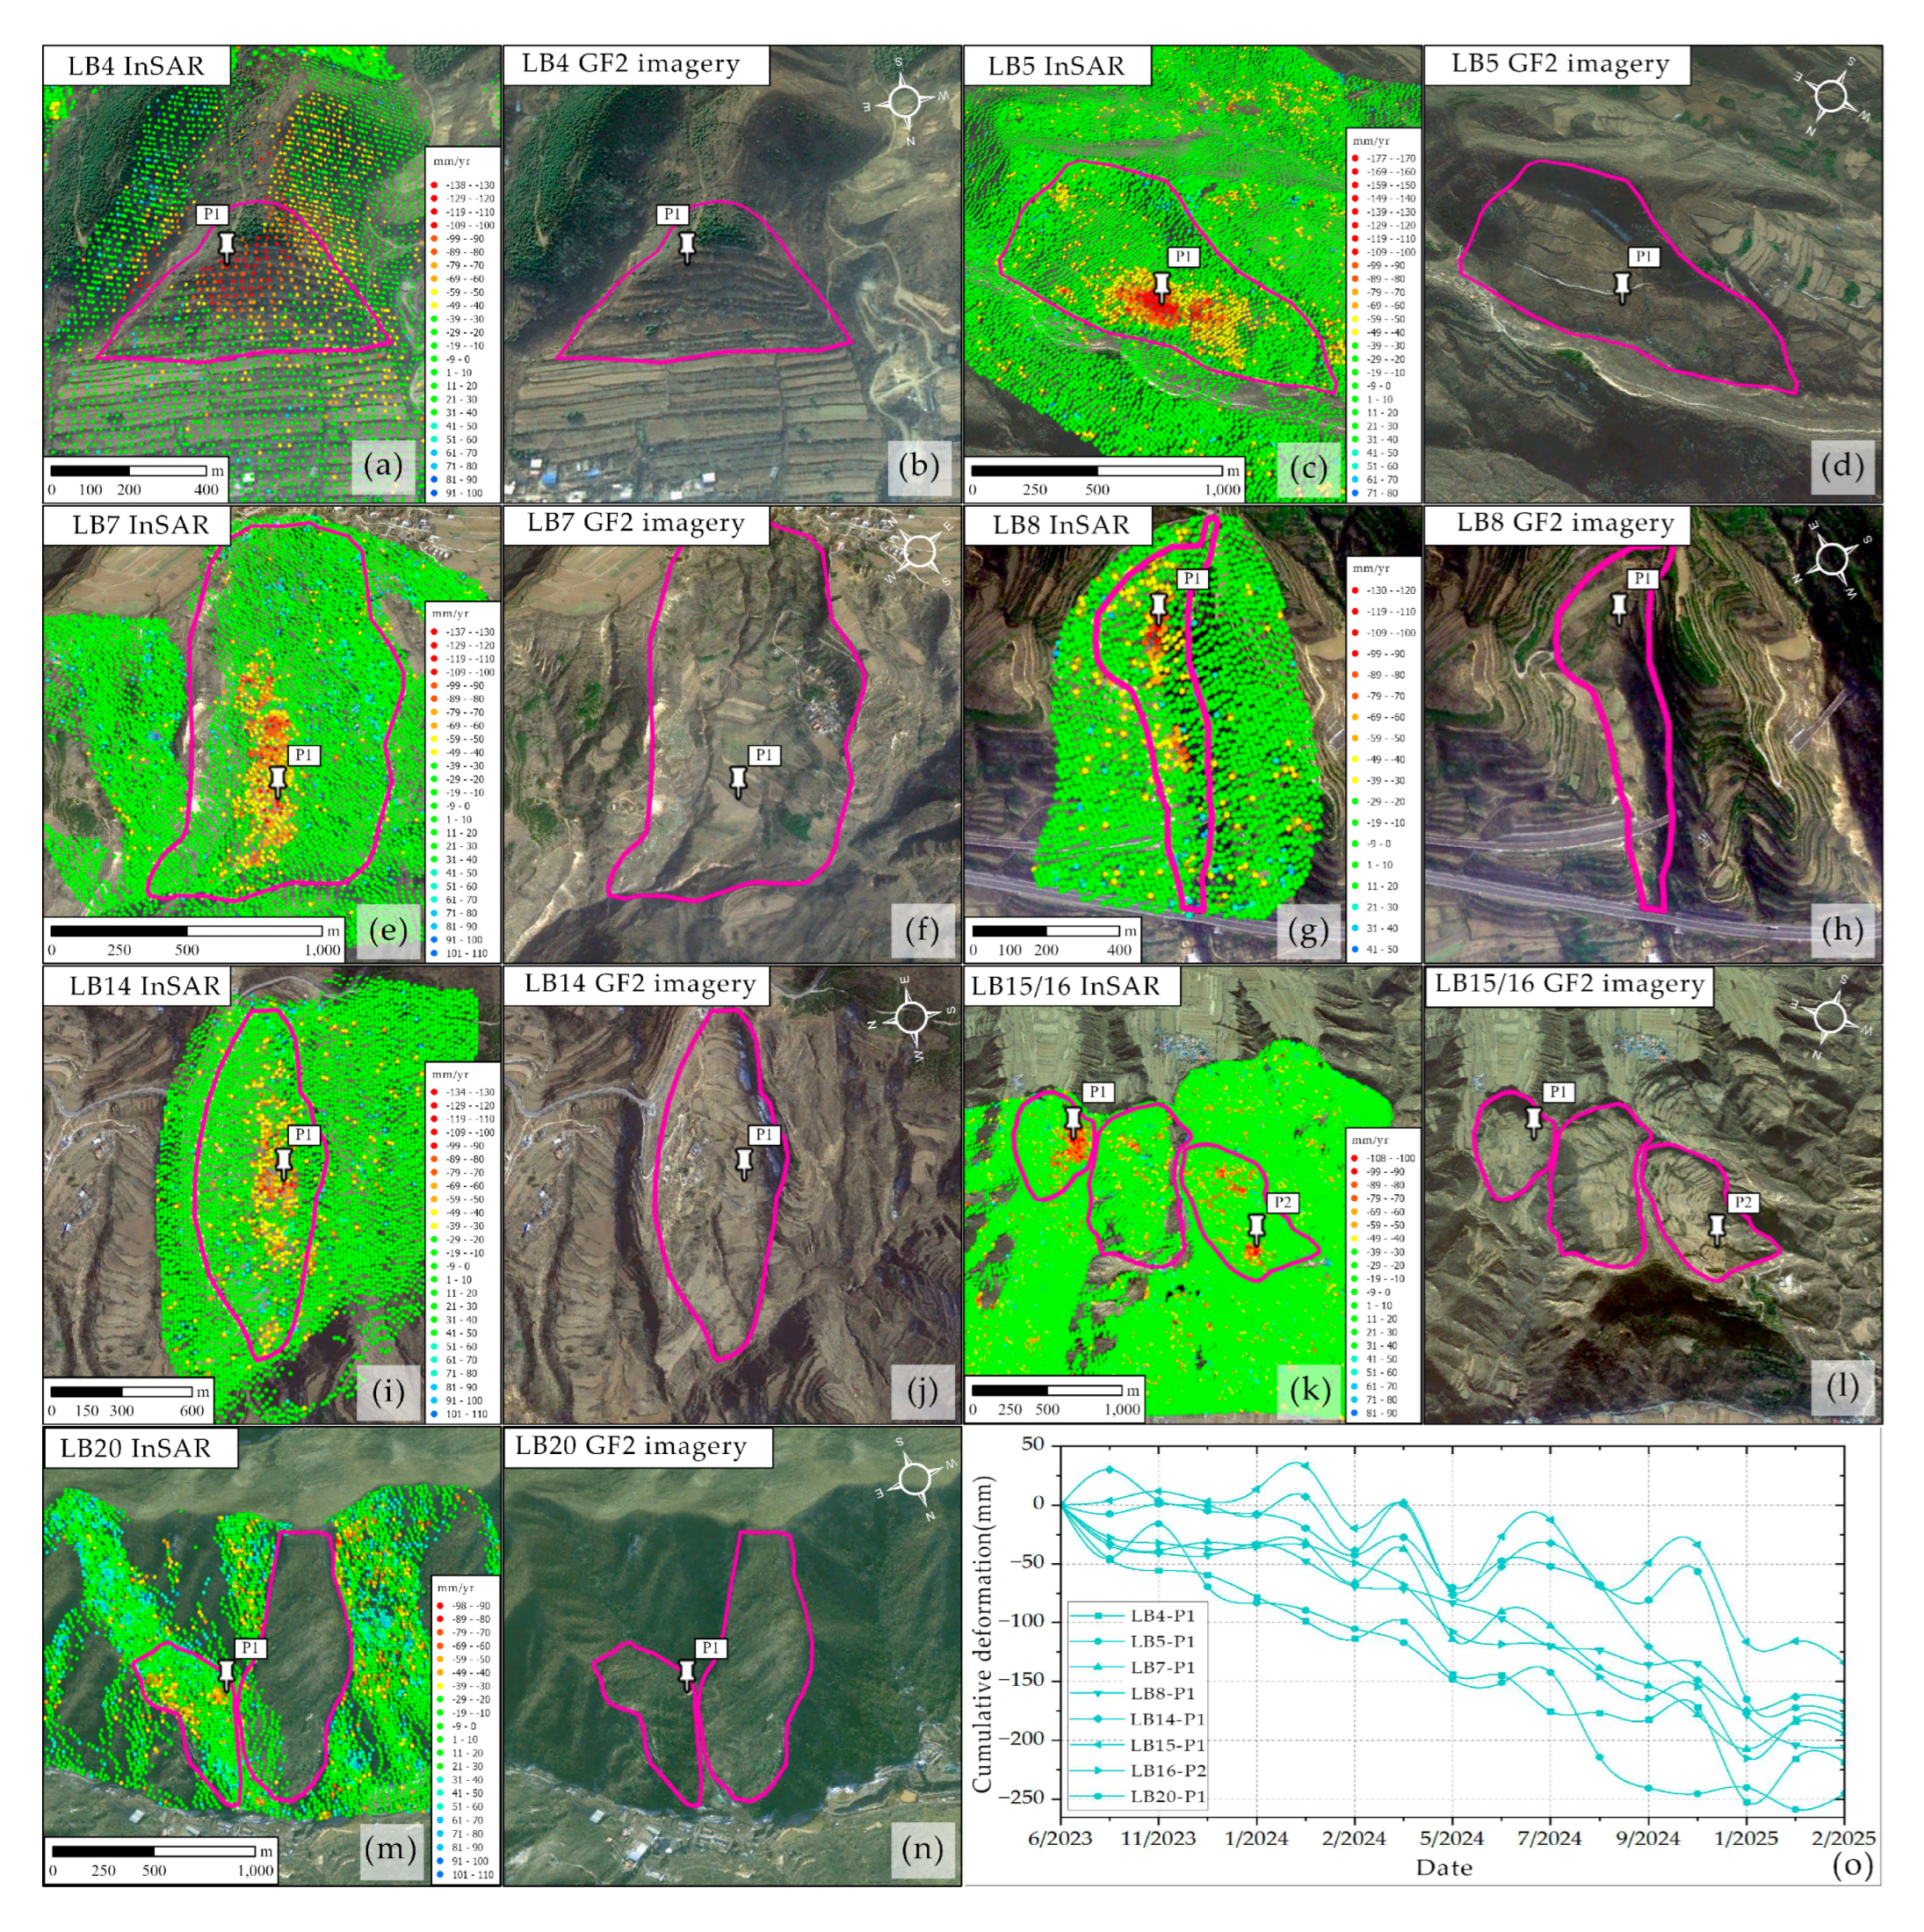
The descending orbit images for Lingbao City acquired from June 2023 to February 2025, identifying eight previously undetected hazards, including LB4, LB5, LB7, LB8, LB14, LB15, LB16 and LB20 ( Figure 12-2). Part a-b, c-d, e-f, g-h, i-j, k-l, m-n are SBAS result, GF-2 imagery of each hazard respectively. Part o is the cumulative deformation chart of the eight hazards. Analysis of the cumulative deformation line chart for each point indicates that the deformation is predominantly linear. Utilizing optical imagery and UAV technology, it was revealed that the surfaces of LB4, LB5, LB7, LB14, LB15, and LB16 are terraced fields, which were often overlooked in previous investigations. Meanwhile, LB8 and LB20 are classified as high-elevation hazards that were previously difficult for investigators to access.
Figure 12-2.
New landslide hazards identified in Lingbao City based on ascending orbit data.
4.3. The Minimum Detectable Deformation Gradients of DInSAR and SBAS
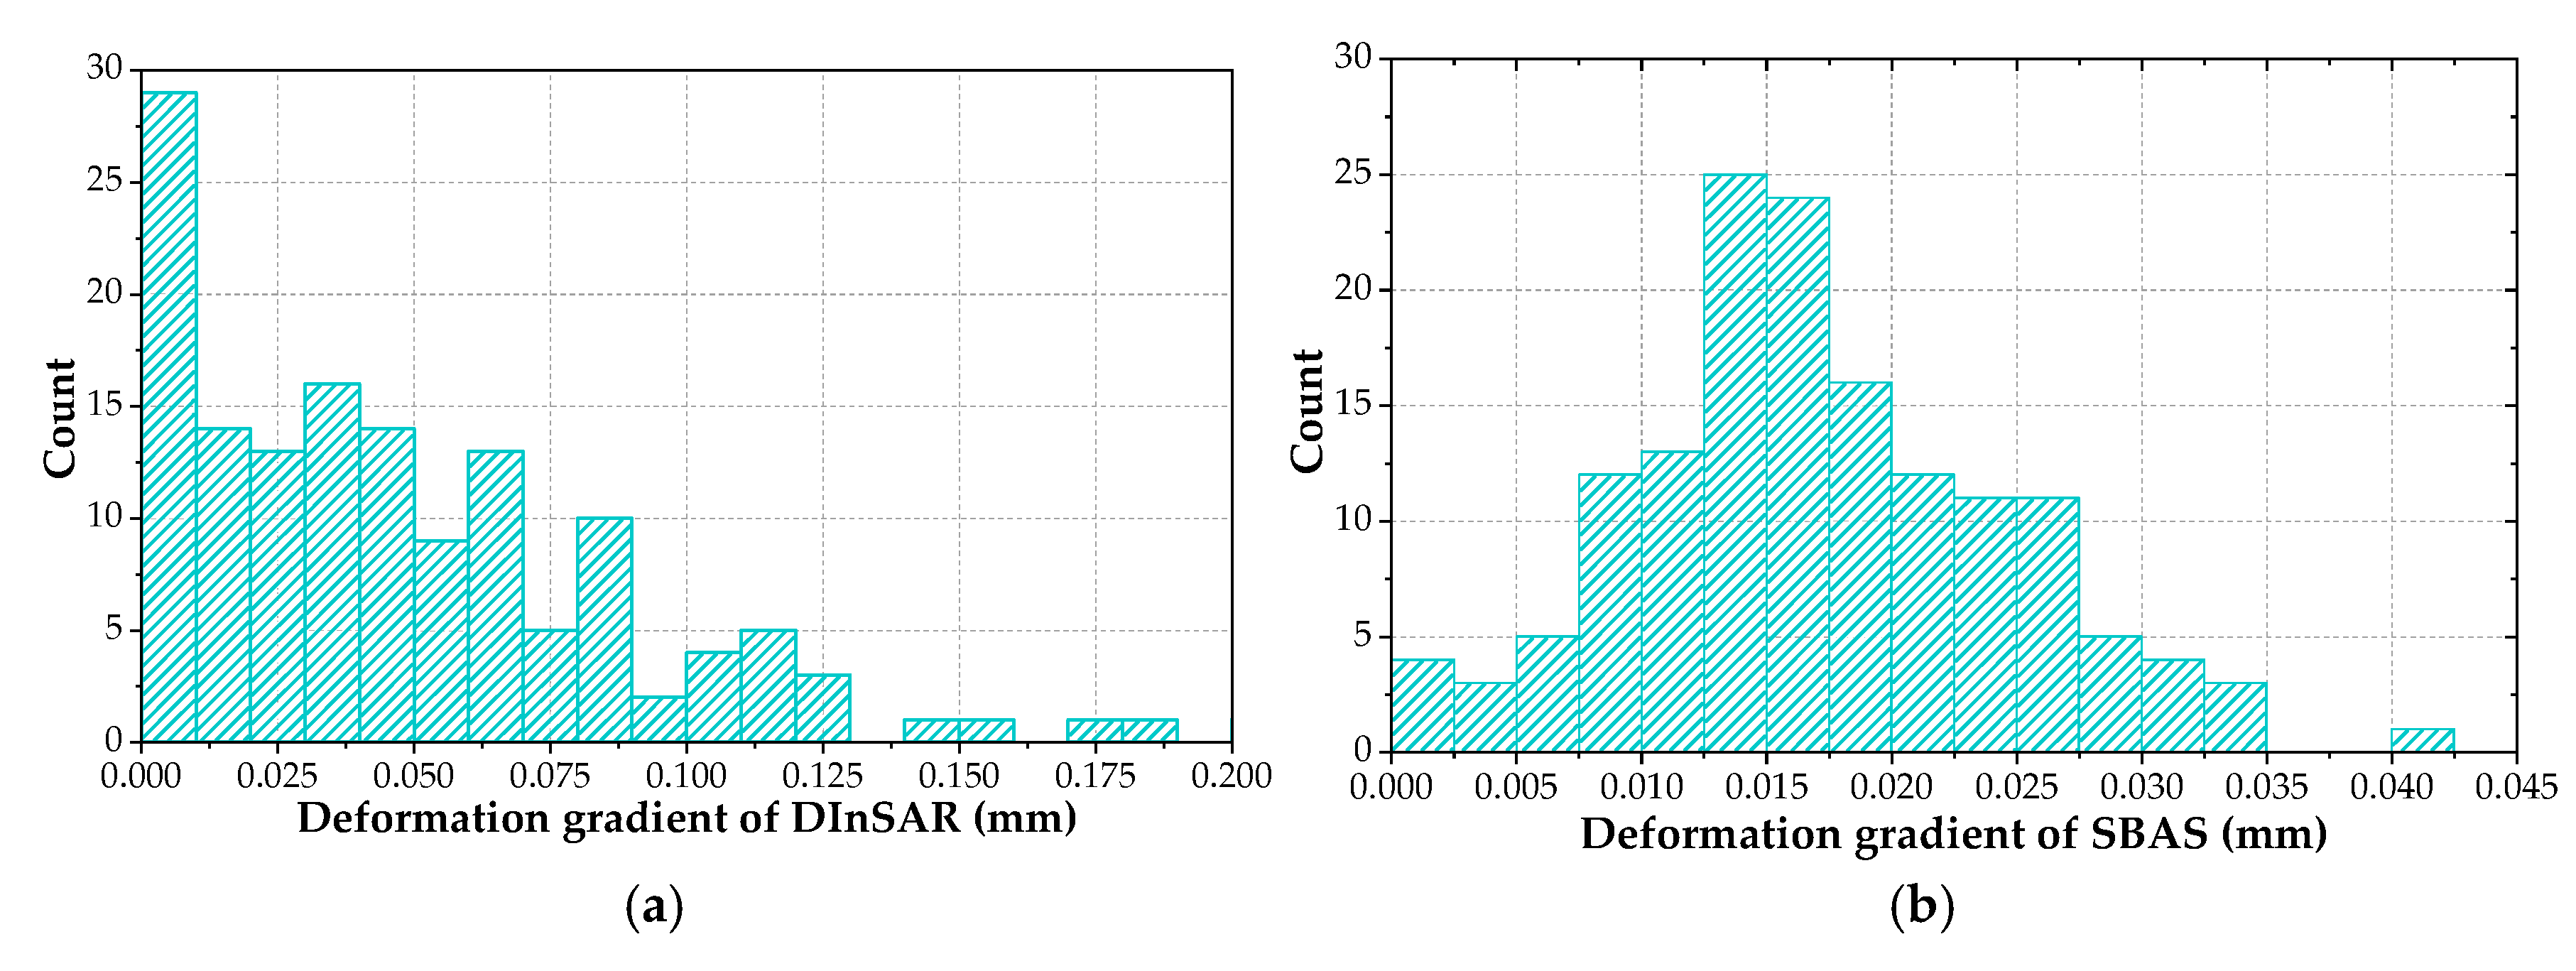
SBAS uniquely identified 150 hazards exhibiting predominantly continuous, slow subsidence. For these hazards, the minimum detectable deformation gradient of both methods calculated using Eqs. (2)-(5) in Section 3 follow concentrated distributions (Figure 13). Statistical analysis reveals that SBAS achieves a significantly higher average coherence of 0.945, compared to DInSAR’s 0.5. This enhanced SBAS coherence results from effective noise suppression through short baseline interferogram combinations and multi-temporal averaging, facilitating the identification of stable targets over long time series and the successful extraction of cumulative subsidence. Crucially, the measured minimum deformation gradients are 0.017 mm/yr for SBAS versus 0.061 mm for DInSAR. At the respective mean coherence levels of 0.945 for SBAS and 0.5 for DInSAR, the minimum deformation gradients are 0.03 mm/yr for SBAS and 0.115 mm for DInSAR. The smaller absolute values achieved by SBAS indicate its superior ability to detect subtle deformation signals, components often obscured in DInSAR by temporal decoherence and atmospheric phase errors that suppress measurable displacement amplitudes. Consequently, DInSAR's inability to detect these slow-moving hazards is attributed to their minimal short-term deformation accumulation falling below its detection threshold. This quantifies the fundamental advantage of SBAS: its temporal processing improves coherence, leading to a smaller detectable deformation limit and making it indispensable for monitoring subtle, long-term millimeter-scale deformation.
5. Conclusions
This study used the basic deformation products derived from LT-1 data, employing both DInSAR and SBAS techniques to conduct a comprehensive geohazard survey across Henan Province. Landslides, predominantly located in western and southern Henan, constitute the largest proportion of identified hazards. Ground collapse, mainly occurring in the coal-rich central and eastern regions, represents the secondary type. Ground subsidence, mostly found in the grain-growing areas of central and northern Henan, accounts for the tertiary share. Analysis identified a total of 1,620 potential geohazards. Cross-validation showed that 1,470 hazards were detected by both techniques, while SBAS uniquely identified 150 ones. Detailed investigation and field validation in Lingbao City identified 51 landslide hazards with the maximum deformation of -410mm/yr, of which 14 hazards are newly discovered.
Statistical analysis of 150 slow-moving geohazards exclusively detected by SBAS confirms that DInSAR fails to identify these features because their average deformation gradient (0.061 mm) falls below DInSAR's detection threshold. Therefore, the applicability of SBAS and DInSAR are obvious during our analysis. First of all, DInSAR outperforms SBAS when the coherence is higher than 0.6. Secondly, SBAS outperforms DInSAR when the coherence is between 0.05 and 0.6. Thirdly, when the coherence is lower than 0.05, DInSAR seems better but they all lose their reliability. During the usage of the two kinds of deformation products, we find that actually DInSAR works better than SBAS in the high coherent regions due to its simpler data processing flow. We always choose DInSAR to balance the data processing cost and the geohazards identification success rates. For geohazards detailed investigation, SBAS is more appropriate than DInSAR because we have to identify the potential geohazards as many as possible. These findings establish a practical framework for InSAR method selection and provide critical data supporting sustainable development and disaster mitigation in Henan Province, with significant implications for regional geohazard monitoring.
Author Contributions
All the authors participated in editing and reviewing the manuscript. Conceptualization, Jing Lu and Tao Li; methodology, Jing Lu and Tao Li ; statistical analysis, Lei Wei and Lingfei Guo; visualization, Jing Lu and Xuefei Zhang ; software, Tao Li, Xuefei Zhang, and Xiang Zhang; review and editing Xinming Tang, Tao Li and Xiang Zhang; supervision, Xinming Tang and Tao Li.. All authors have read and agreed to the published version of the manuscript.
Funding
This work was supported by National Key R&D Programme of China (2023YFB3904905).
Acknowledgments
The authors thank to the Henan Institute of Remote Sensing, China, for its invaluable support during the experiment.
Conflicts of Interest
The authors declare no conflict of interest.
References
- Tang, X.; Li, T.; Chen, J.; Wei, C.; Zhang, X.; Liu, Y.; Liu, D.; Zhang, X.; Zhou, X.; Lu, J.; et al. Twin-Satellite Constellation Design and Realization for Terrain Mapping and Deformation Monitoring: LuTan-1. IEEE Transactions on Geoscience and Remote Sensing 2025, vol. 63, pp. 1-14. [CrossRef]
- Wang, R.; Liu, K.; Liu, D.; Ou, N.; Yue, H.; Chen, Y.; Yu, W.; Liang, D.; Cai, Y. LuTan-1: An Innovative L-band Spaceborne Bistatic Interferometric Synthetic Aperture Radar Mission. IEEE Geoscience And Remote Sensing Magazine 2024. [CrossRef]
- Li, T.; Tang, X.; Li, S.; Zhou, X.; Zhang, X.; Xu, Y. Classification of foundational deformation products for L - band differential interferometric SAR satellites[J]. Journal of Surveying and Mapping 2023, 52(5), 770 - 779.
- Tomás, R.; Li, Z. Earth Observations for Geohazards: Present and Future Challenges. Remote Sensing 2017, 9, 194. [Google Scholar] [CrossRef]
- Zhang, Y.; Ci, H.; Yang, H.; Wang, R.; Yan, Z. Rainfall-Induced Geological Hazand Susceptibility Assessmentin the Henan Section ofthe Yellow River Basin: Multi-Model Approaches Supporting Disaster Mitigation and Sustainable Development. Sustainability 2025, 17, 4348. [Google Scholar] [CrossRef]
- Dong, J.; Liao, M.; Xu, Q.; Zhang, L.; Tang, M.; Gong, J. Detection and displacement characterization of landslides using multi-temporal satellite SAR interferometry: A case study of Danba County in the Dadu River Basin. Engineering Geology 2018, 240, 95–109. [Google Scholar] [CrossRef]
- Yang, W.; Niu, R.; Si, R.; Li, J. Geological Hazard Susceptibility Analysis and Developmental Characteristics Based on Slope Unit, Using the Xinxian County, Henan Province as an Example. Sensors 2024, 24, 2457. [Google Scholar] [CrossRef] [PubMed]
- Zhou, B.; Xie, H.; Wen, G. The susceptibility zoning of rainfall - type geological hazards in Henan Province based on erosion cycle theory[J]. Journal of North China University of Water Resources and Electric Power (Natural Science Edition) 2024, 45(4), 92-101. [CrossRef]
- Casu, F.; Manzo, M.; Lanari, R. A quantitative assessment of the SBAS algorithm performance for surface deformation retrieval from DInSAR data. Remote Sensing of Environment 2006, 102, 195–210. [Google Scholar] [CrossRef]
- Gaber, A.; Darwish, N.; Koch, M. Minimizing the Residual Topography Effect on Interferograms to Improve DInSAR Results: Estimating Land Subsidence in Port-Said City, Egypt. Remote Sensing 2017, 9, 752. [Google Scholar] [CrossRef]
- Baran, I.; Stewart, M.; Claessens, S. A new functional model for determining minimum and maximum detectable deformation gradient resolved by satellite radar interferometry. IEEE Transactions on Geoscience and Remote Sensing 2005, 43, 675–682. [Google Scholar] [CrossRef]
- Jiang, M.; Li, Z.W.; Ding, X.L.; Zhu, J.J.; Feng, G.C. Modeling minimum and maximum detectable deformation gradients of interferometric SAR measurements. International Journal of Applied Earth Observation and Geoinformation 2011, 13, 766–777. [Google Scholar] [CrossRef]
- Ferretti, A.; Prati, C.; Rocca, F. Permanent scatterers in SAR interferometry. IEEE Transactions on Geoscience and Remote Sensing 2001, 39, 8−20. [Google Scholar] [CrossRef]
- Xu, Q. Understanding and Consideration of Related Issues in Early Identification of Potential Geohazards. Geomatics and Information Science of Wuhan University 2020, 45, 1651–1659. [Google Scholar]
- Ji, Y.; Zhang, X.; Li, T.; Fan, H.; Xu, Y.; Li, P.; Tian, Z. Mining Deformation Monitoring Based on Lutan-1 Monostatic and Bistatic Data. Remote Sensing 2023, 15, 5668. [Google Scholar] [CrossRef]
- Calò, F.; Ardizzone, F.; Castaldo, R.; Lollino, P.; Tizzani, P.; Guzzetti, F.; Lanari, R.; Angeli, M.-G.; Pontoni, F.; Manunta, M. Enhanced landslide investigations through advanced DInSAR techniques: The Ivancich case study, Assisi, Italy. Remote Sensing of Environment 2014, 142, 69–82. [Google Scholar] [CrossRef]
- Dong, J.; Zhang, L.; Tang, M.; Liao, M.; Xu, Q.; Gong, J.; Ao, M. Mapping landslide surface displacements with time series SAR interferometry by combining persistent and distributed scatterers: A case study of Jiaju landslide in Danba, China. Remote Sensing of Environment 2018, 205, 180–198. [Google Scholar] [CrossRef]
- Li, G.; Zhao, C.; Wang, B.; Peng, M.; Bai, L. Evolution of spatiotemporal ground deformation over 30 years in Xi’an, China, with multi-sensor SAR interferometry. Journal of Hydrology 2023, 616. [Google Scholar] [CrossRef]
- Dai, K.; Shen, Y.; Wu, M.; Feng, W.; Dong, X.; Zhuo, G.; Yi, X. ldentification of potential landslides in Baihetan Dam area before theimpoundment by combining InSAR and UAV survey. Acta Geodaetica et Cartographica Sinica 2022, 51, 2069–2082. [Google Scholar] [CrossRef]
- Zhang, M.; Xu, G. Study on the development characteristics and distribution law of geological hazards in Lingbao City. Chinese Journal of Soil and Water Conservation 2017, 47–50. [Google Scholar] [CrossRef]
- Xing, Y.; Zhang, Y. Characteristics, distribution and prevention countermeasures of geological hazards in Lingbao City, Henan Province. Journal Of Henan Polytechnic University 2006, Vol.25 No. [CrossRef]
- Bureau., L.N.R.a.P. Bureau., L.N.R.a.P. Lingbao Natural Resources and Planning Bureau Announces Existing Geological Disaster Hazard Points. Available online: https://www.lingbao.gov.cn/21820/616970880/1883707.html.
- Zhou, B.; Xie, H.; Wen, G. The susceptibility zoning of rainfall type geological hazardsin henan province based on erosion cycle theory. Joumal of North China University of Water Resources and Eleetrie Power ( Natural Seience Edition) 2024, 45 (4), 92-101. [CrossRef]
- Zhenbo, N. Exploration of Mine Geological Environment Control Scheme in Xiaoqinling Mining Area of Henan Province. World nonferrous metals 2019, 1002-5065(2019)01-0170-2.
- Hu, L.; Tomás, R.; Tang, X.; Vinielles, J.L.; Herrera, G.; Li, T.; Liu, Z. Updating Active Deformation Inventory Maps in Mining Areas by Integrating InSAR and LiDAR Datasets. Remote Sens. 2023, 15, 996. [Google Scholar] [CrossRef]
- Xu, Q.; Dong, X.; Li, W. Early identification and monitoring and early warning of major geological hazards based on space-air-ground integration. Geomatics and Information Science of Wuhan University 2019, Vol.44 No.7. [CrossRef]
Figure 3.
Types and distribution of hazards of both methods using descending orbit data.
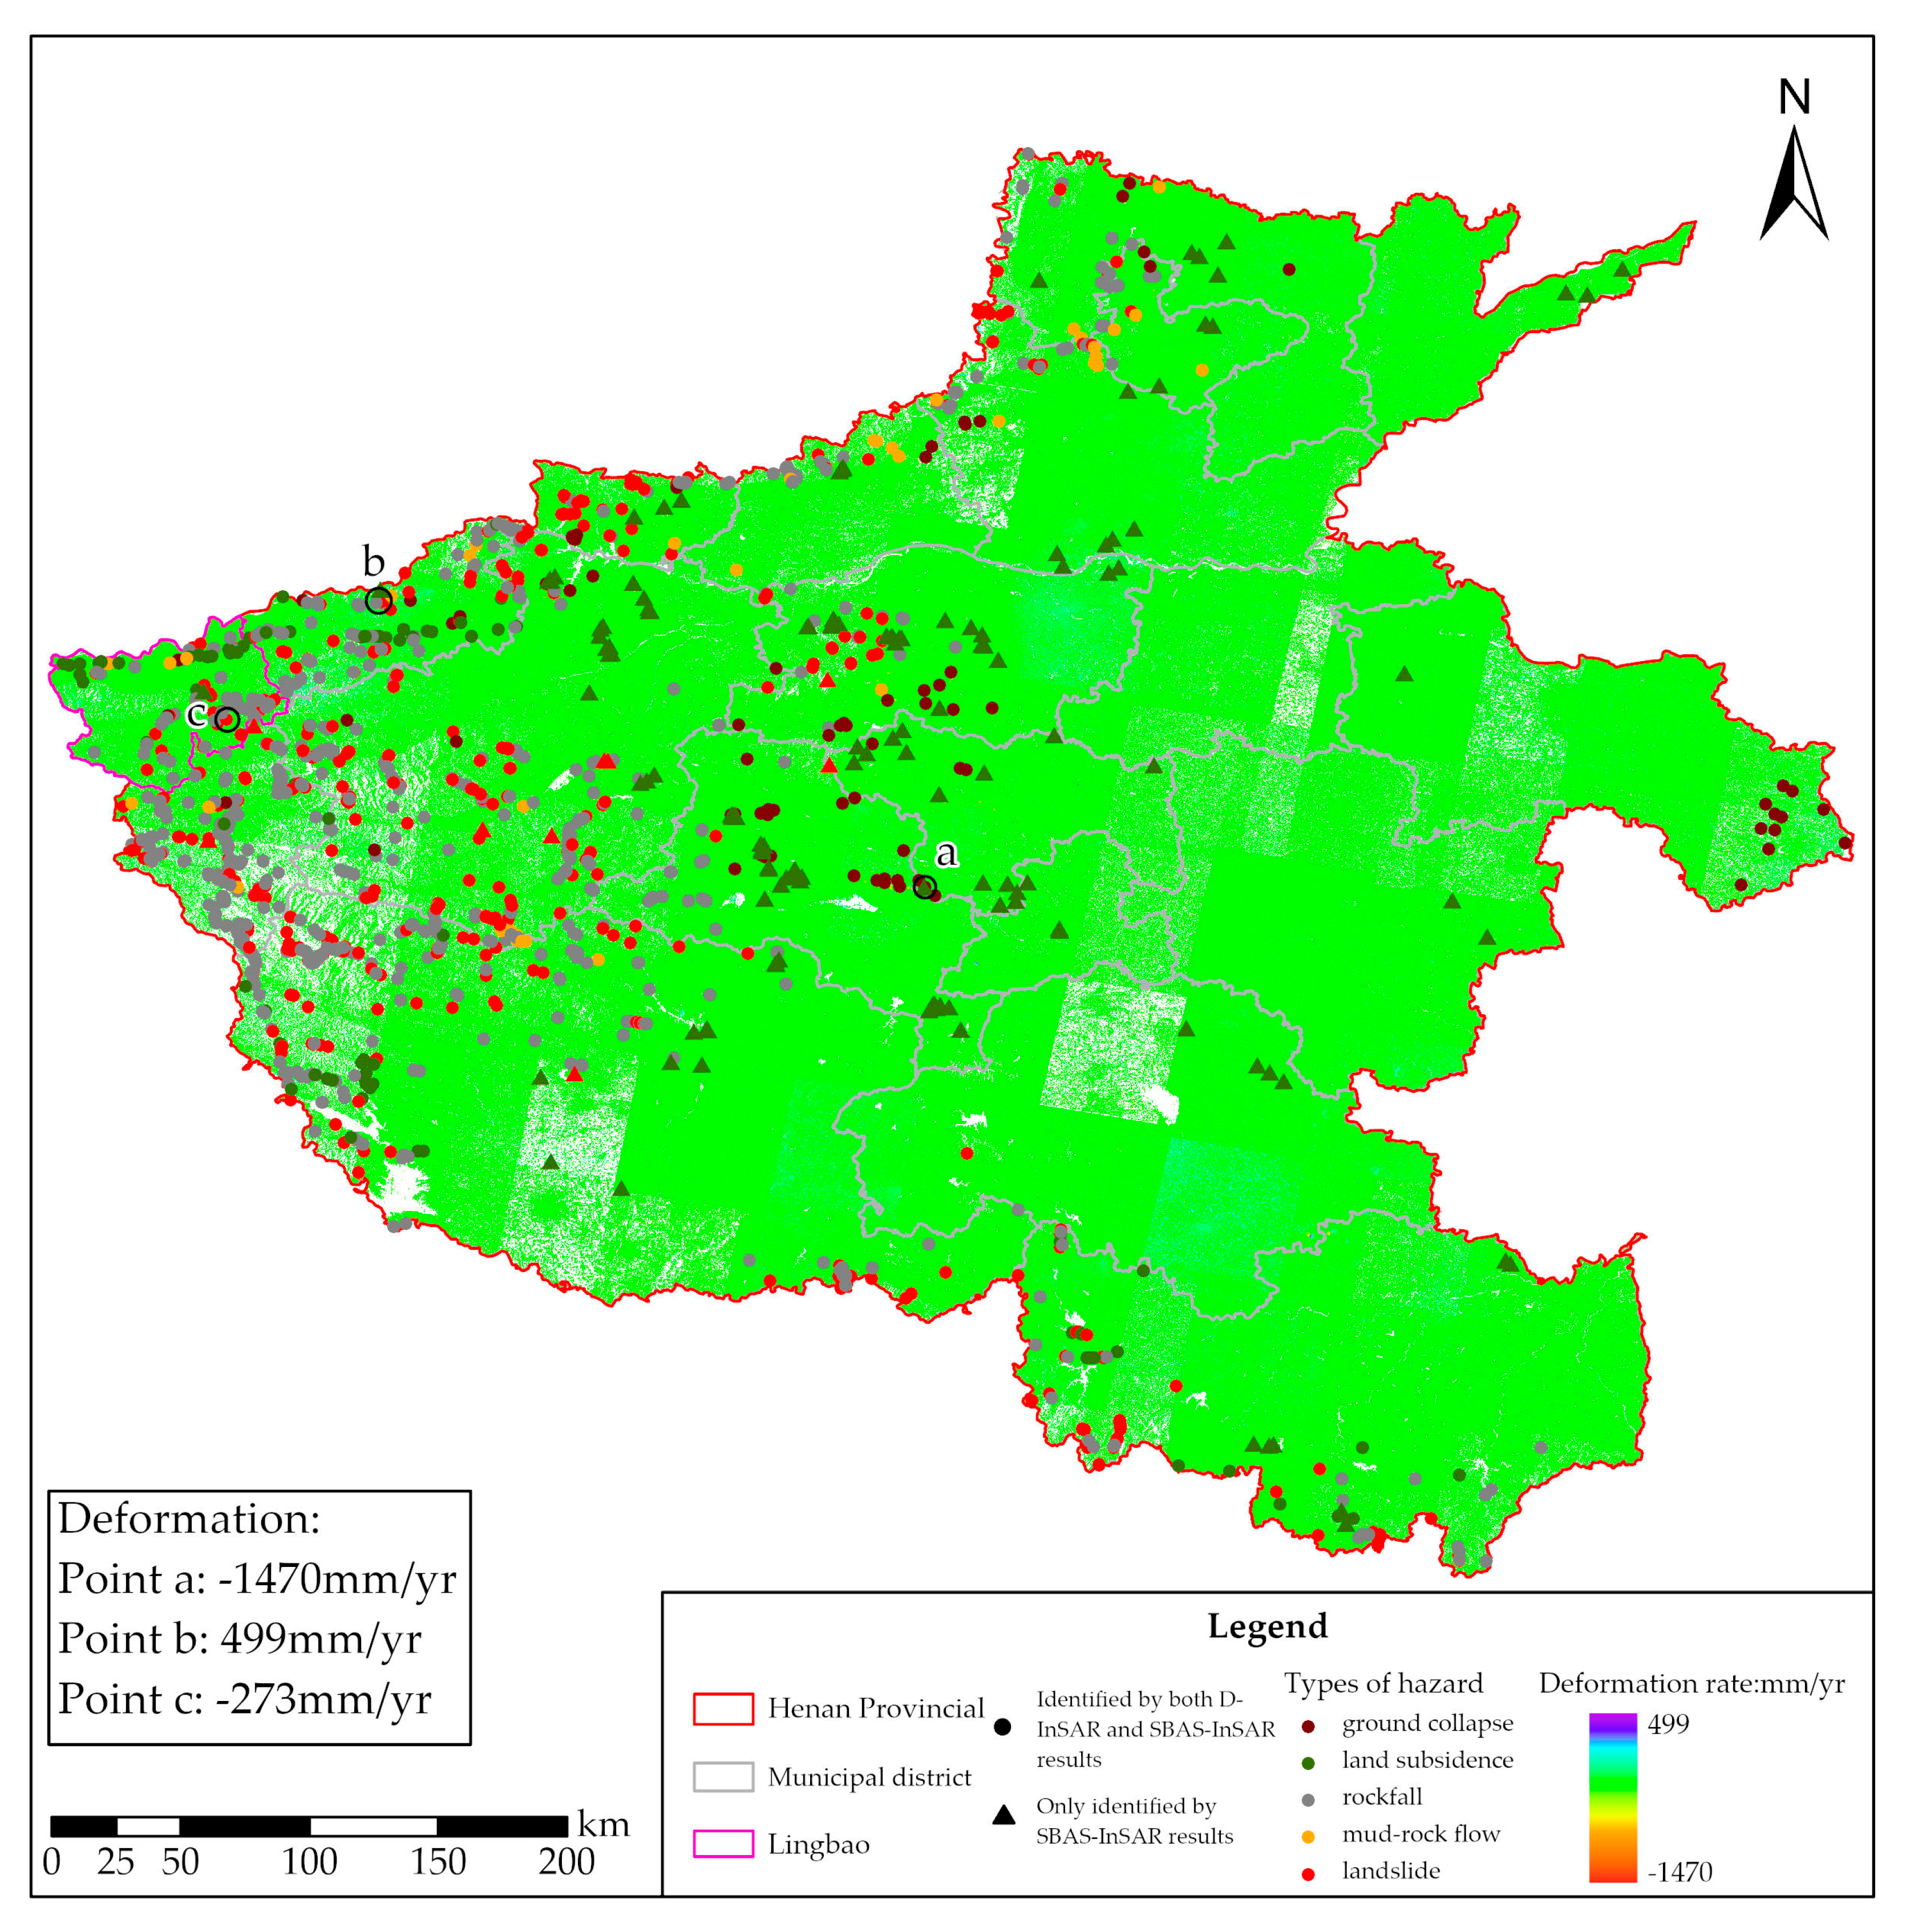
Figure 5.
Deformation results of land subsidence areas only identified by SBAS.
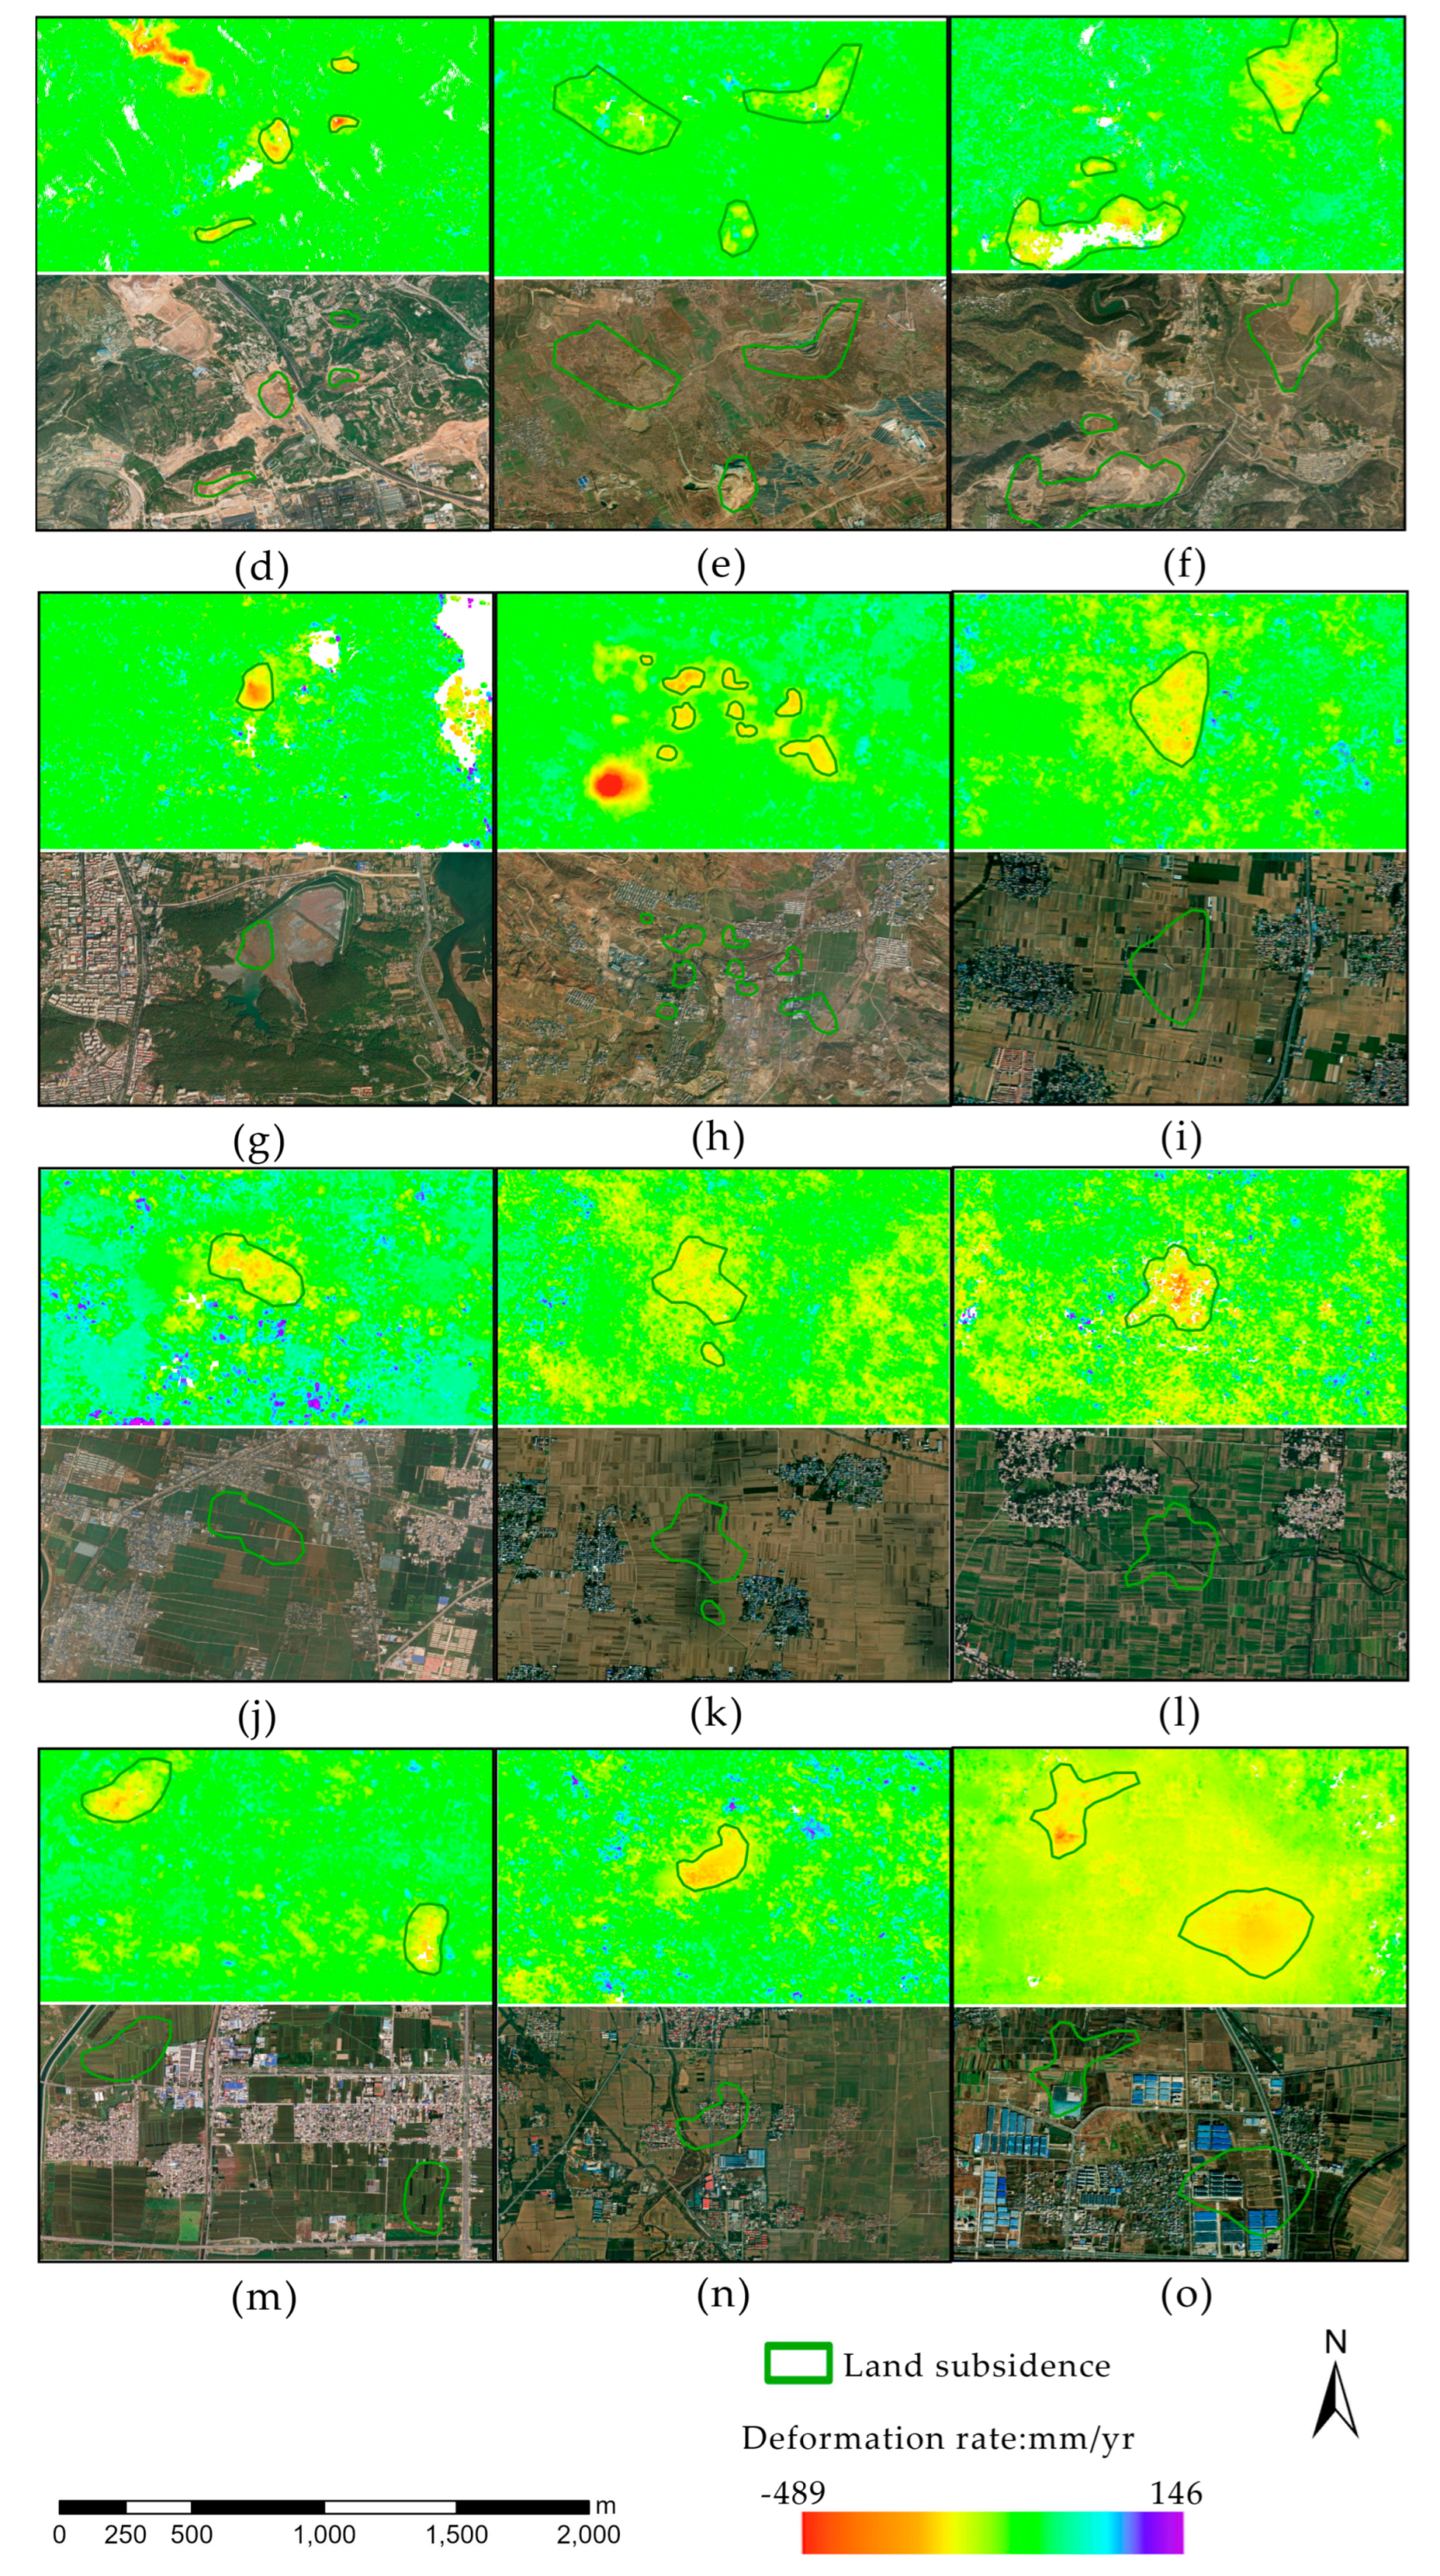
Figure 6.
The nine landslide hazards only identified by SBAS results province-wide.
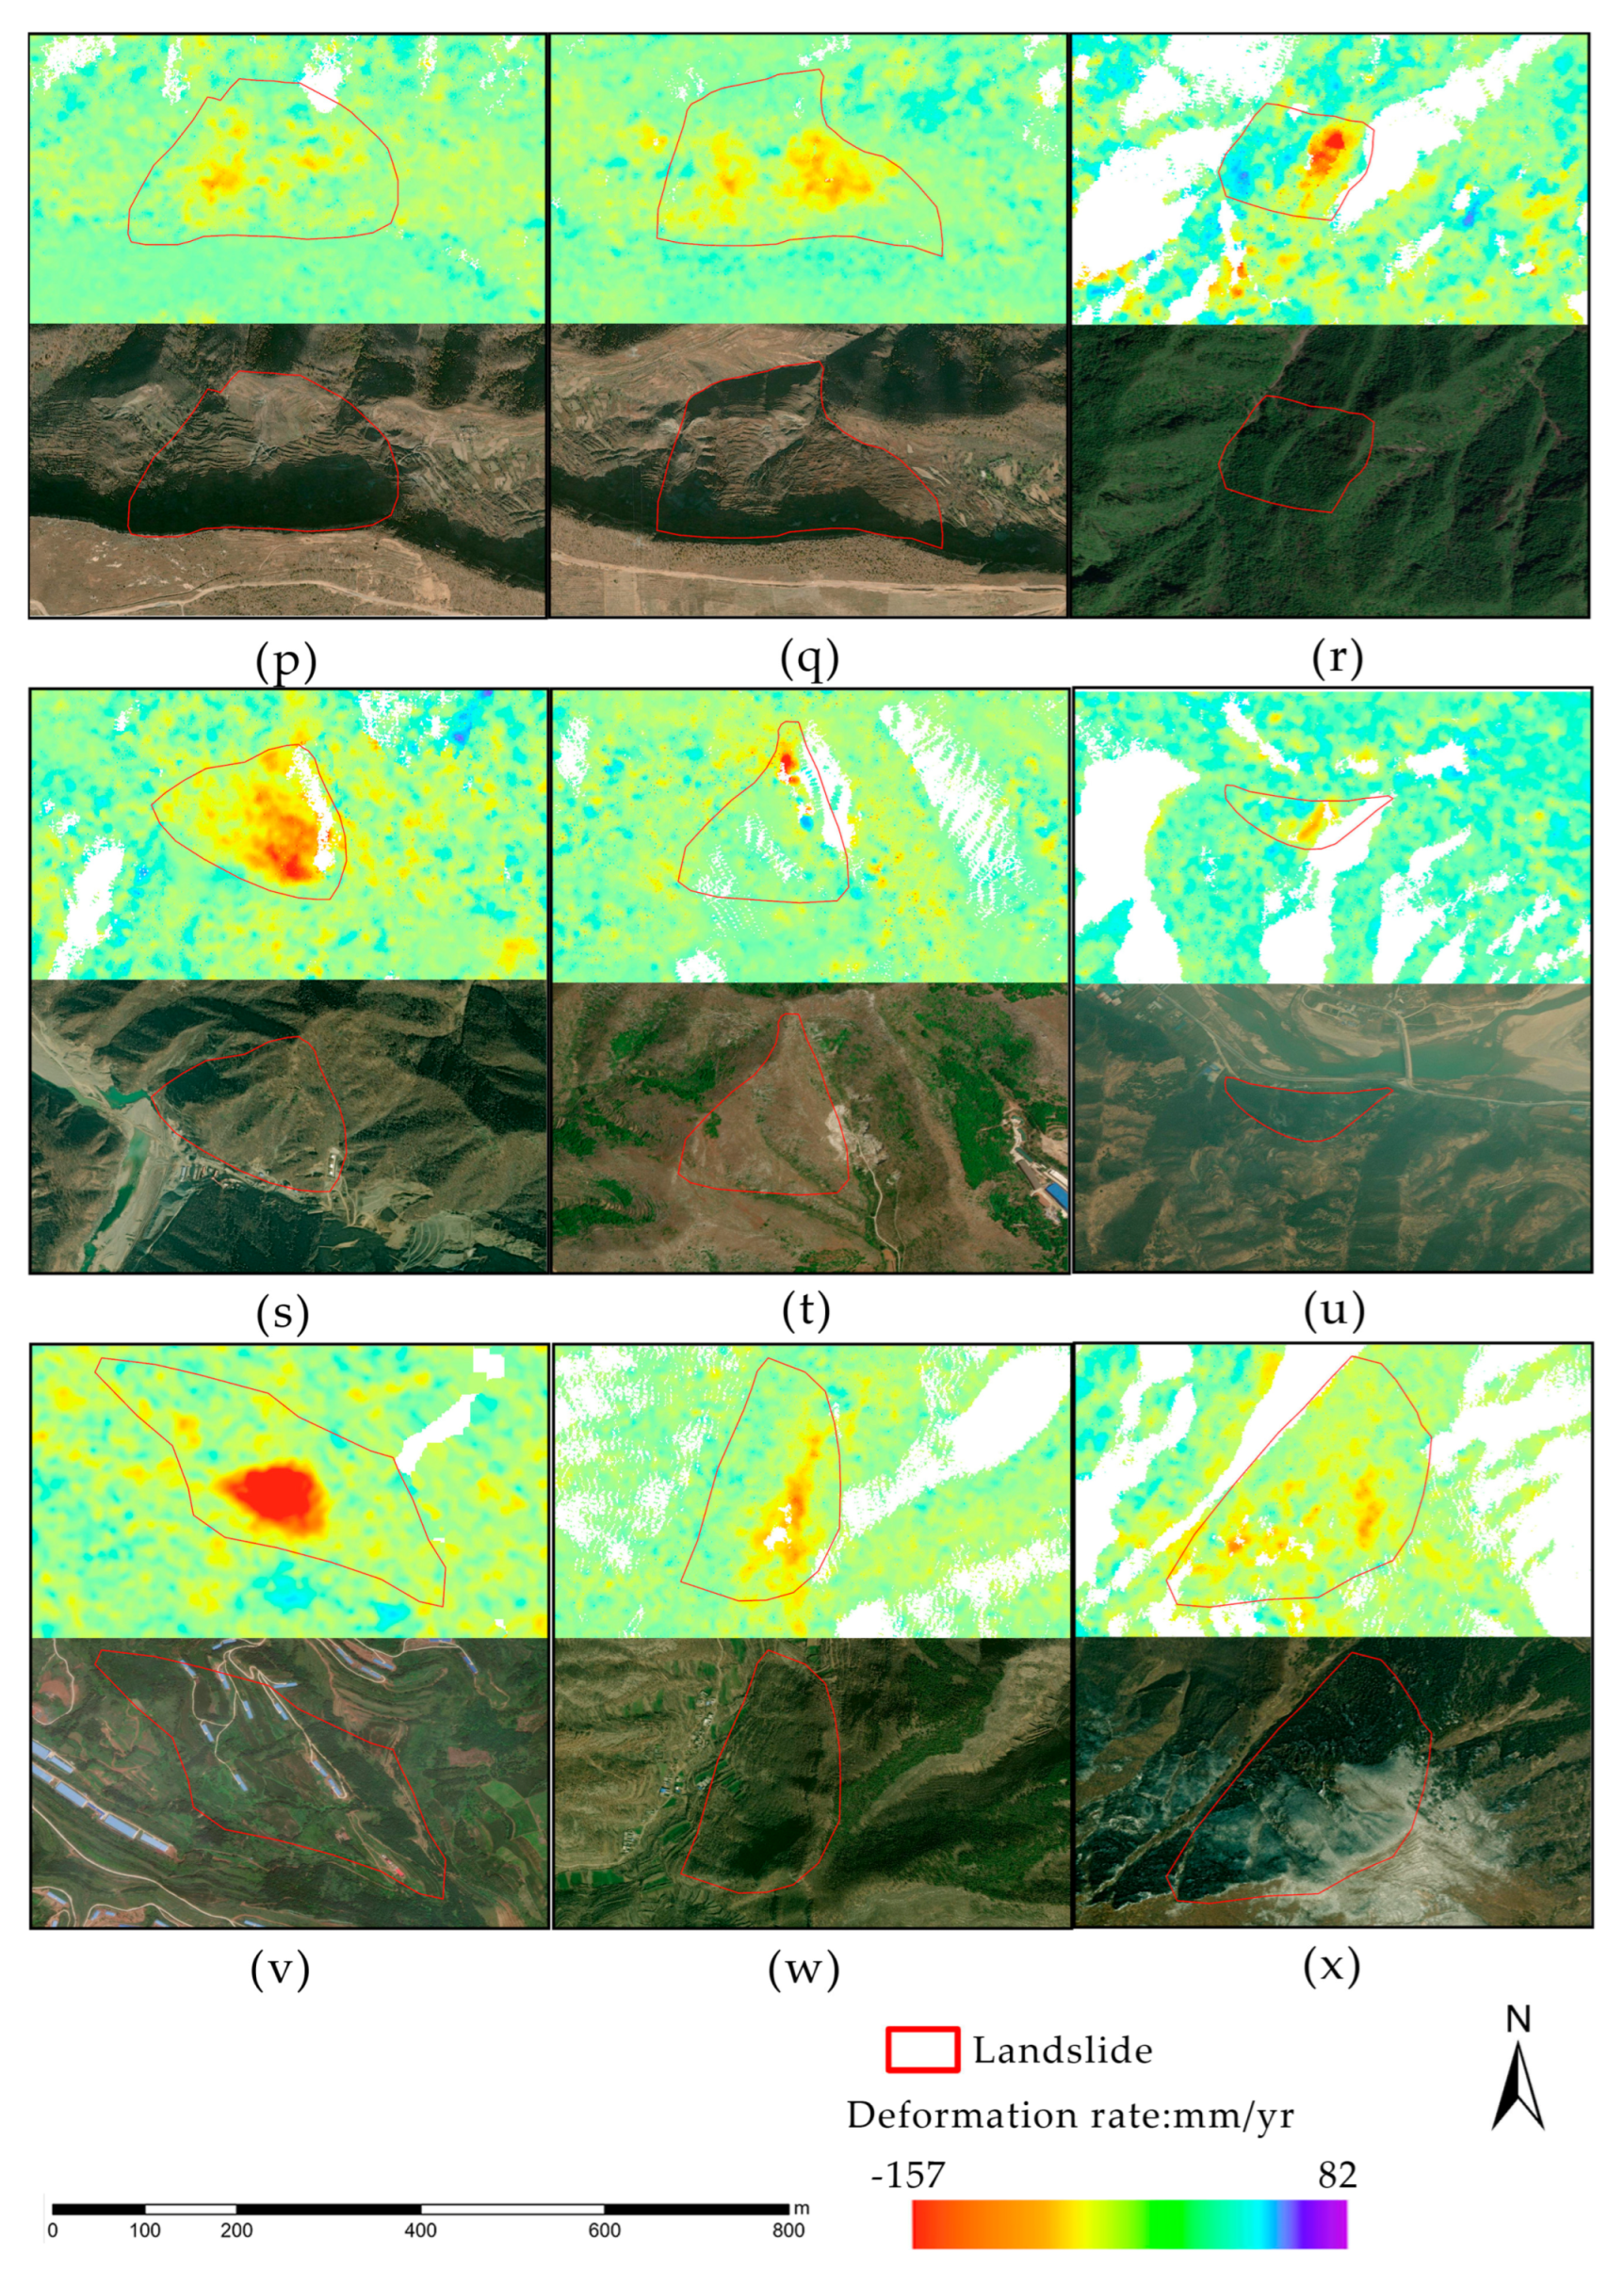
Figure 7.
A case comparing DInSAR and SBAS results of land subsidence.
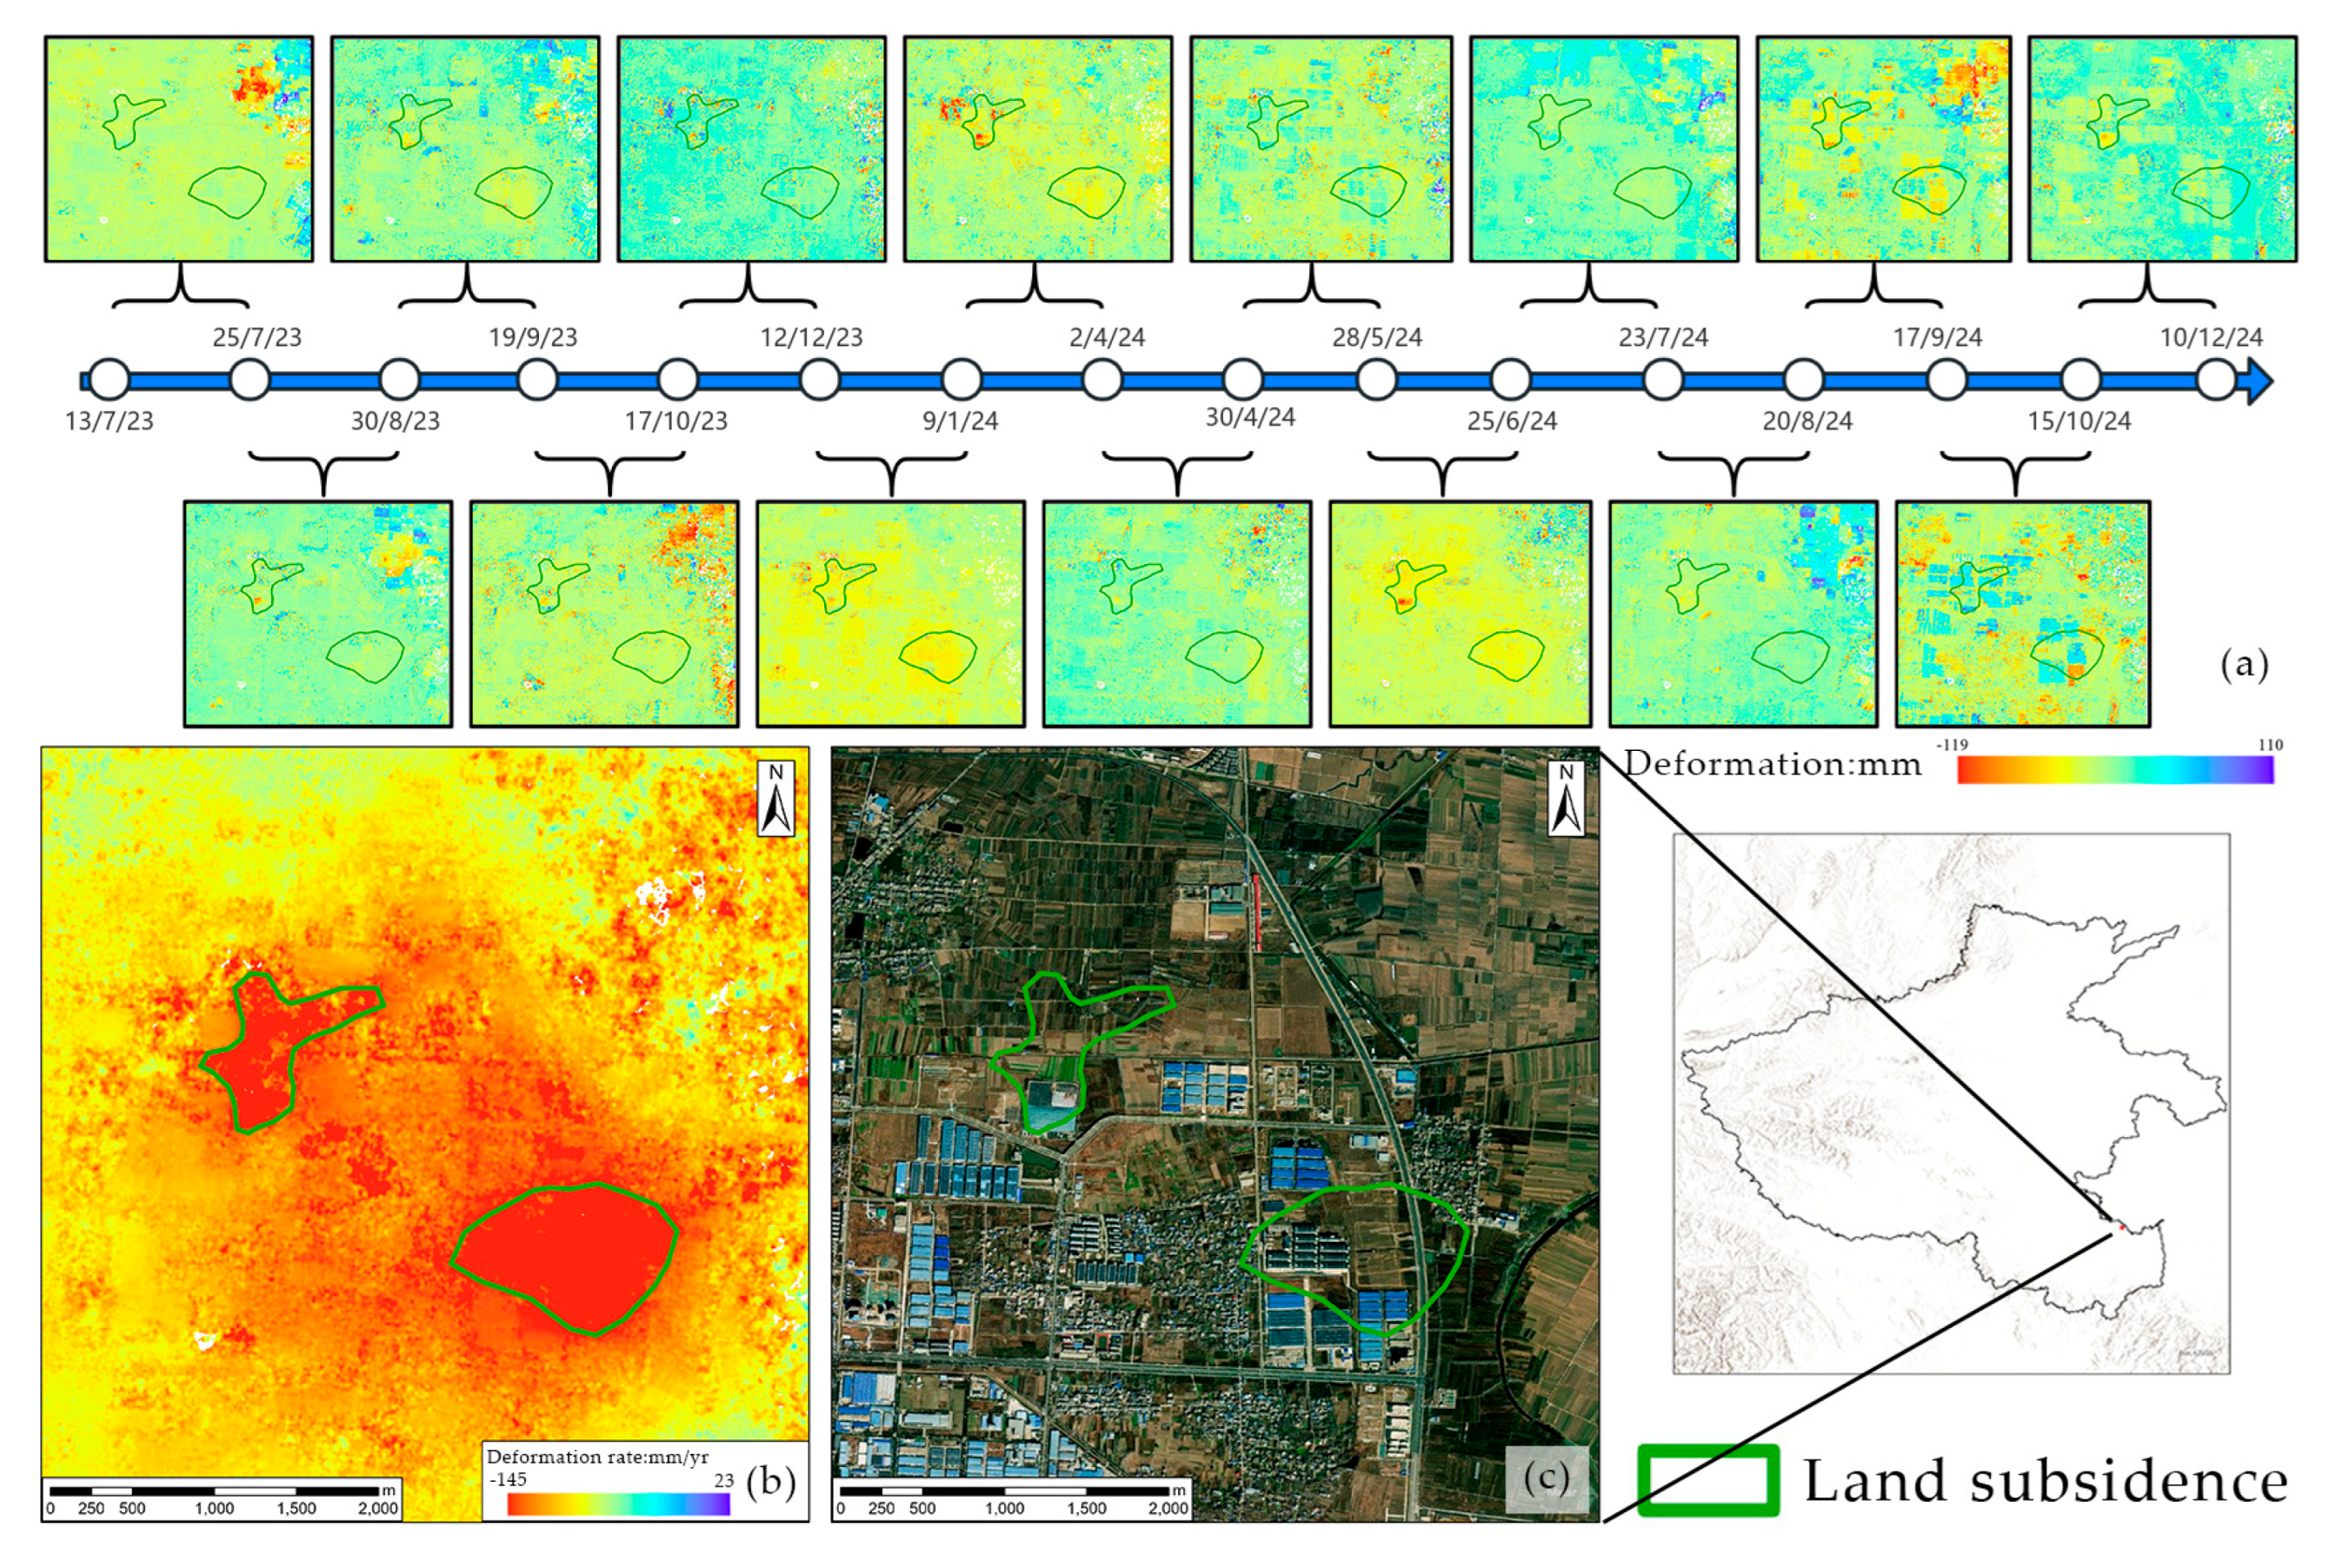
Figure 8.
A case comparing DInSAR and SBAS results for underground mining monitoring.
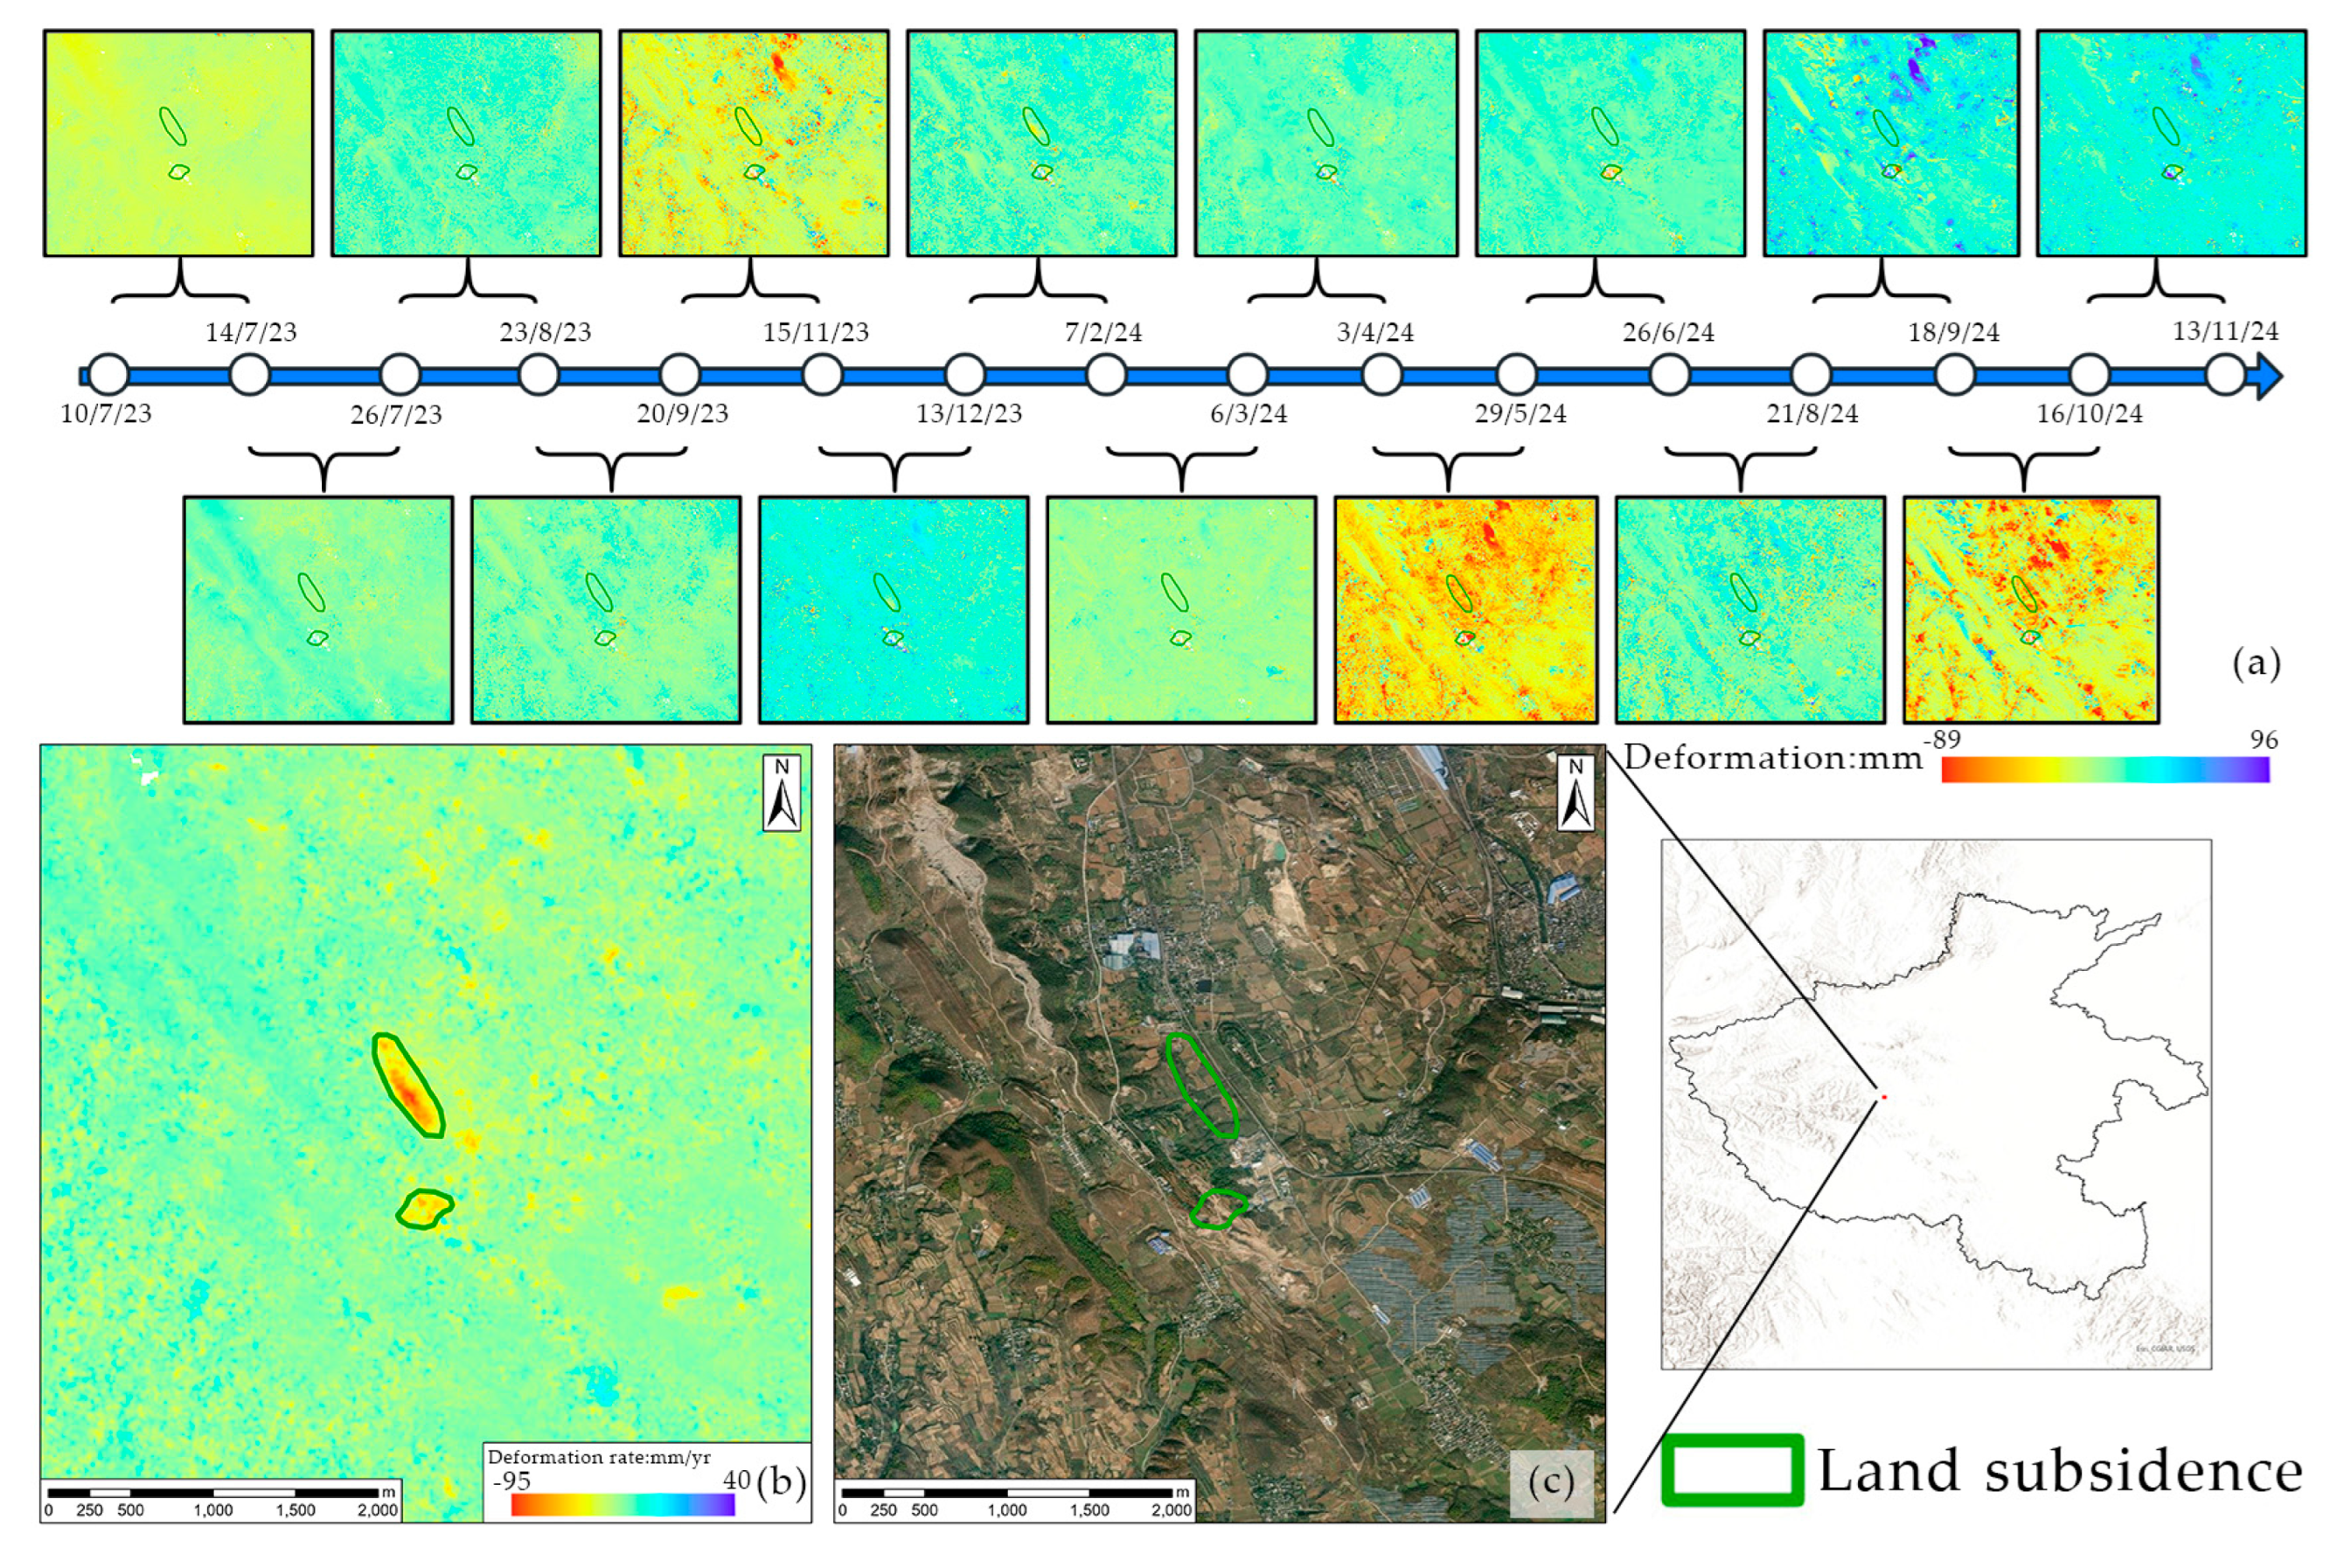
Figure 9.
SBAS results of Lingbao city using LT-1 descending orbit data. The purple circle marks the newly discovered hazards by this investigation.
Figure 9.
SBAS results of Lingbao city using LT-1 descending orbit data. The purple circle marks the newly discovered hazards by this investigation.
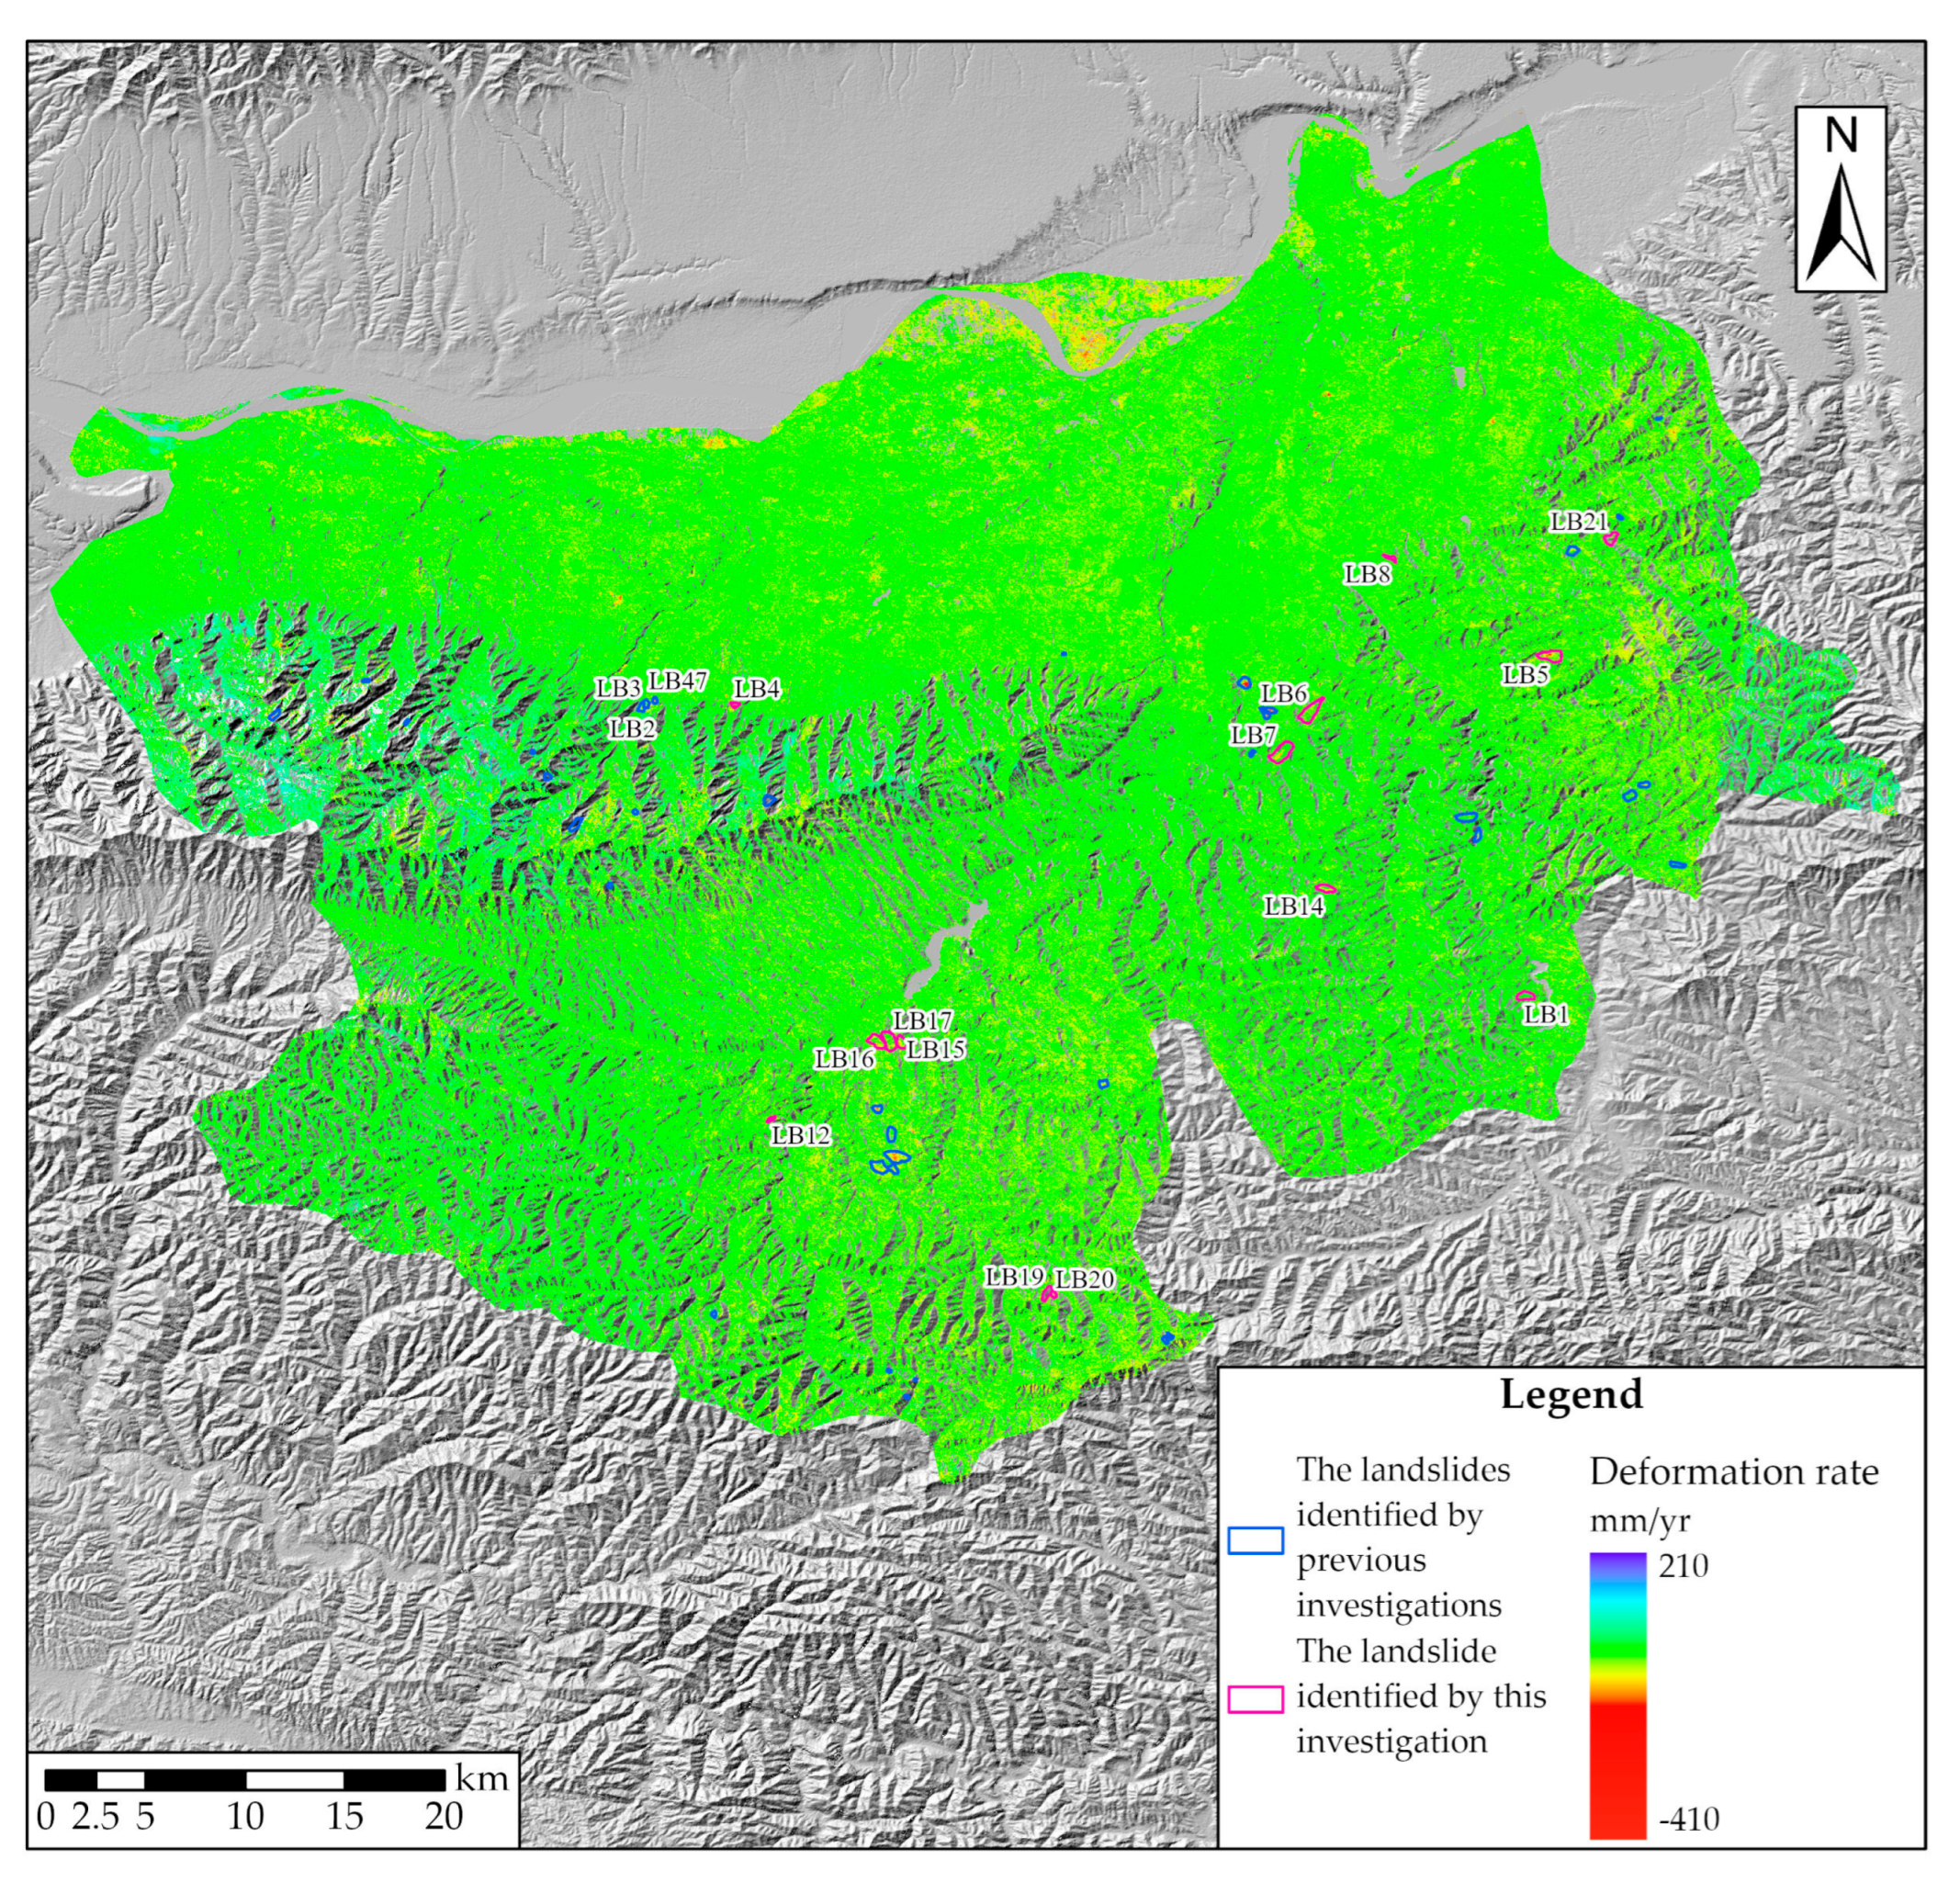
Figure 10.
Interpretation results of three points in Slope LB1.
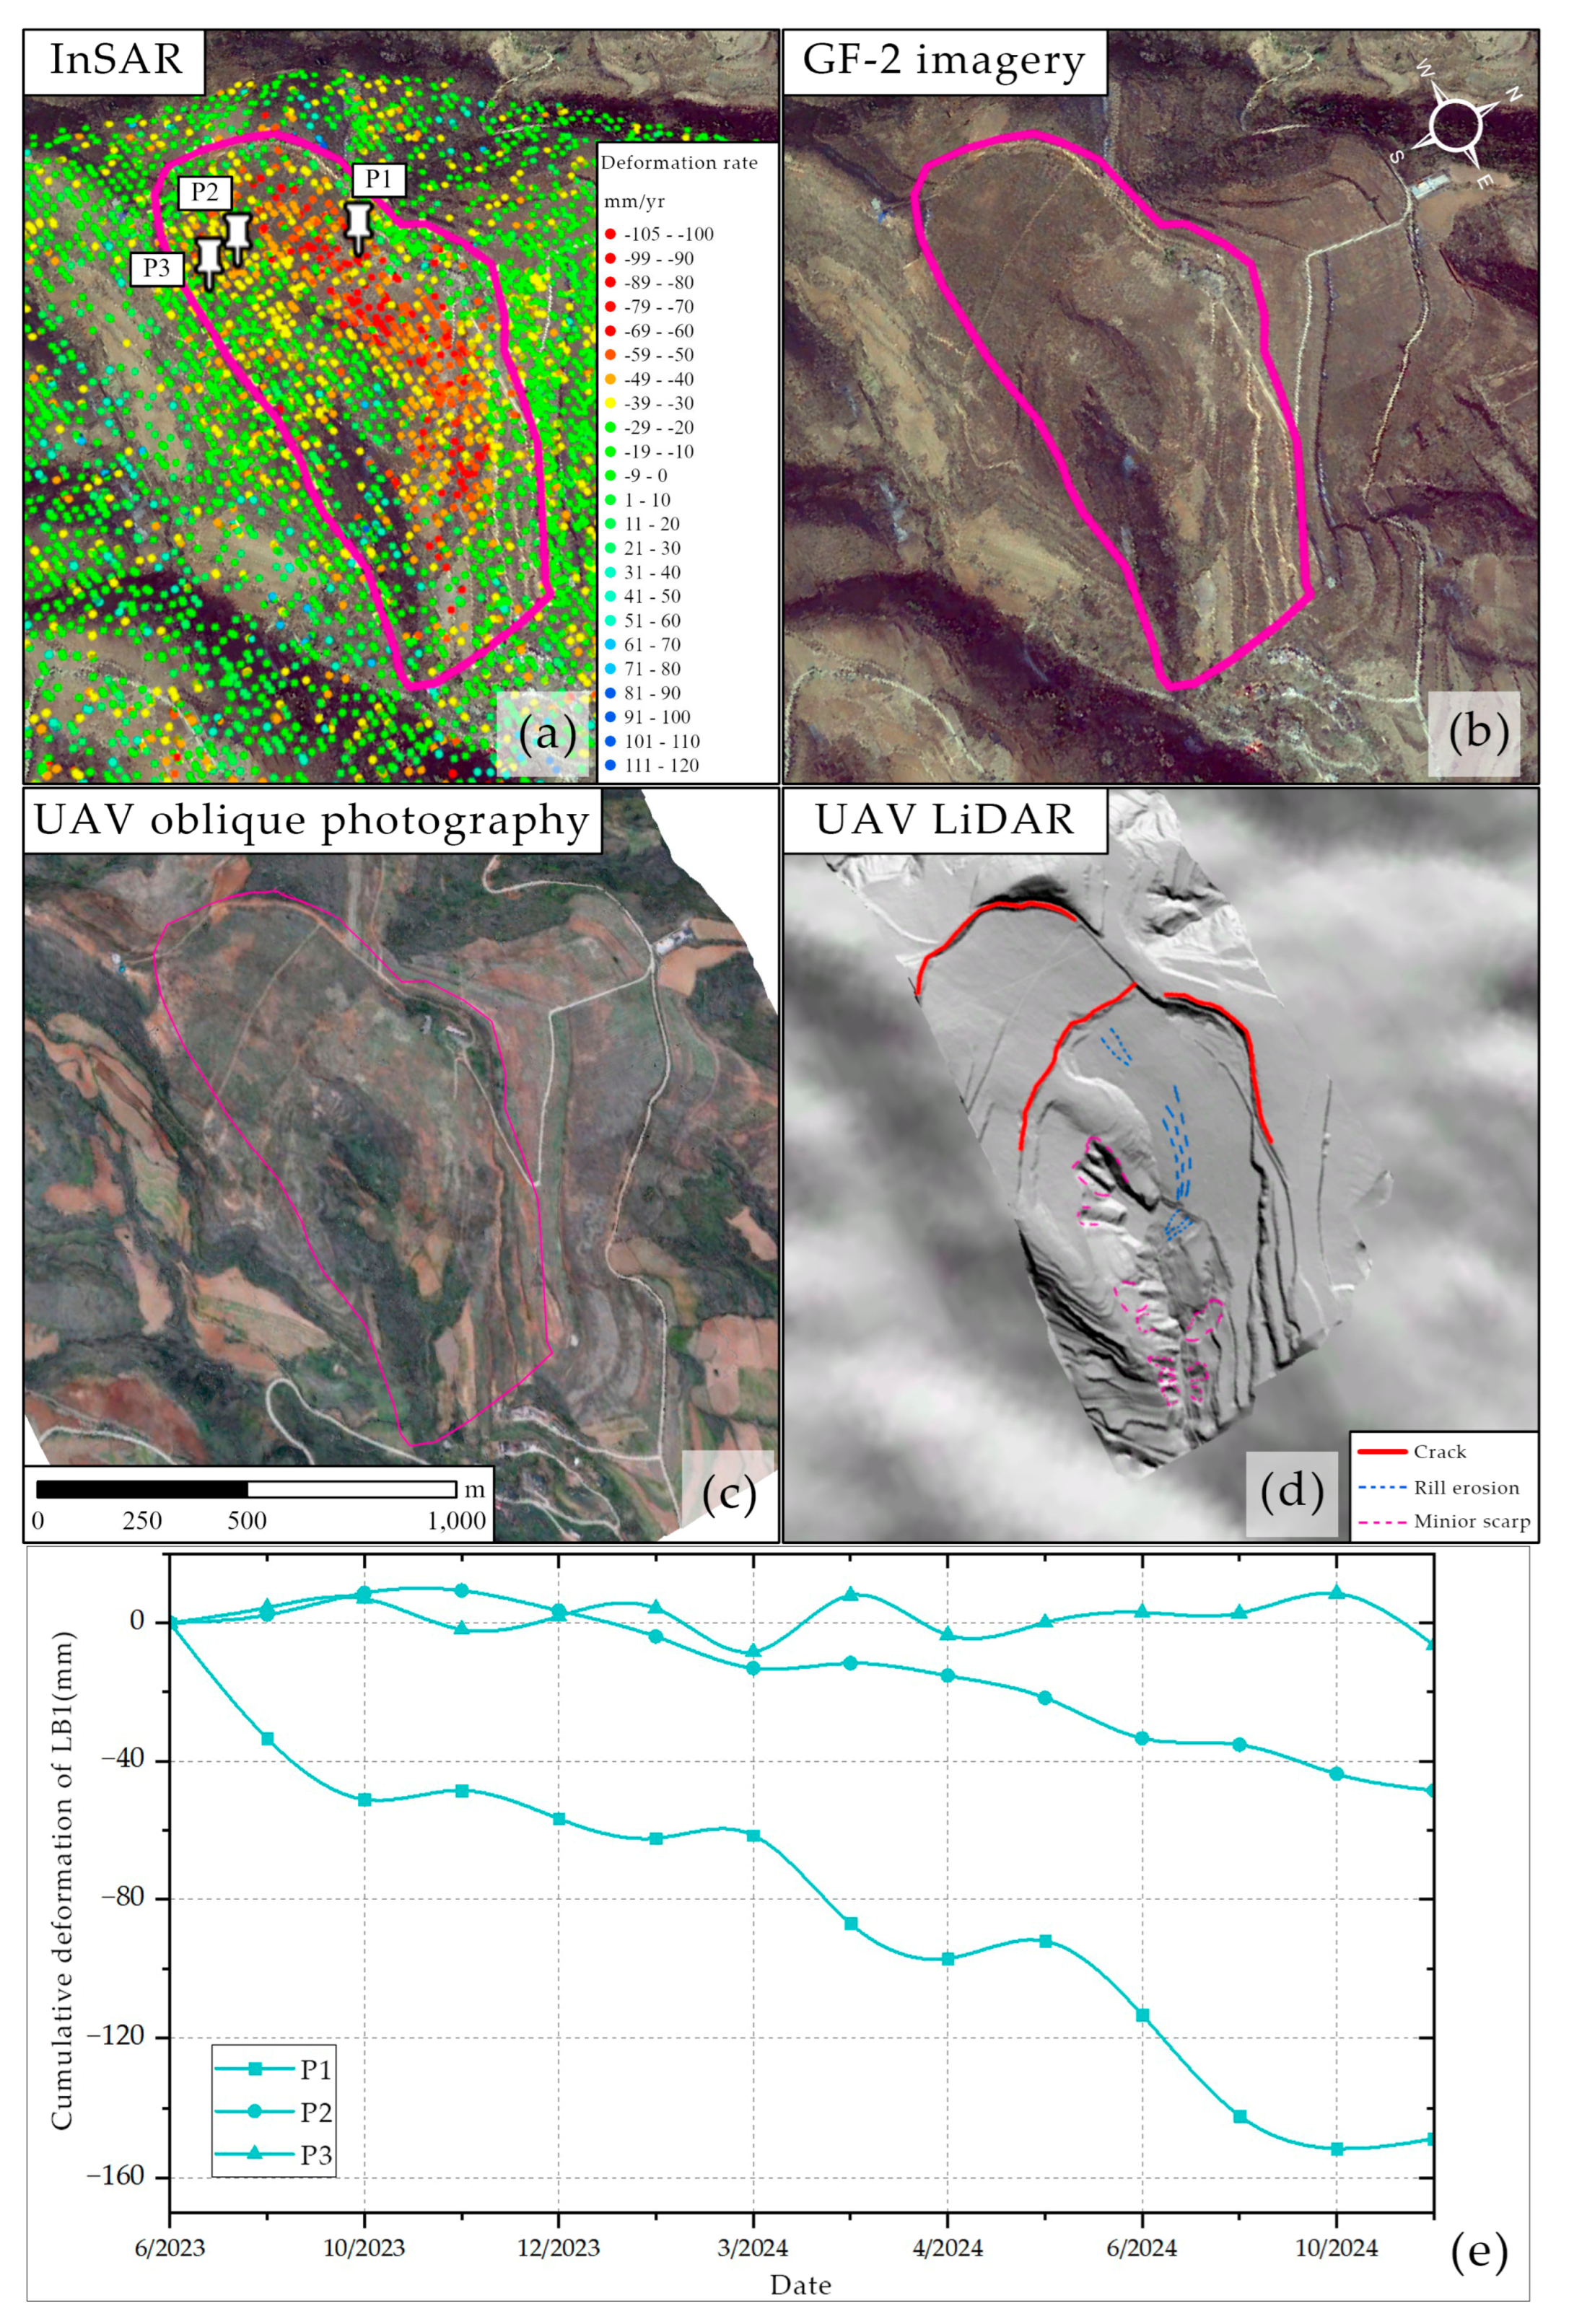
Figure 11.
Interpretation results of LB2, LB3, LB47.
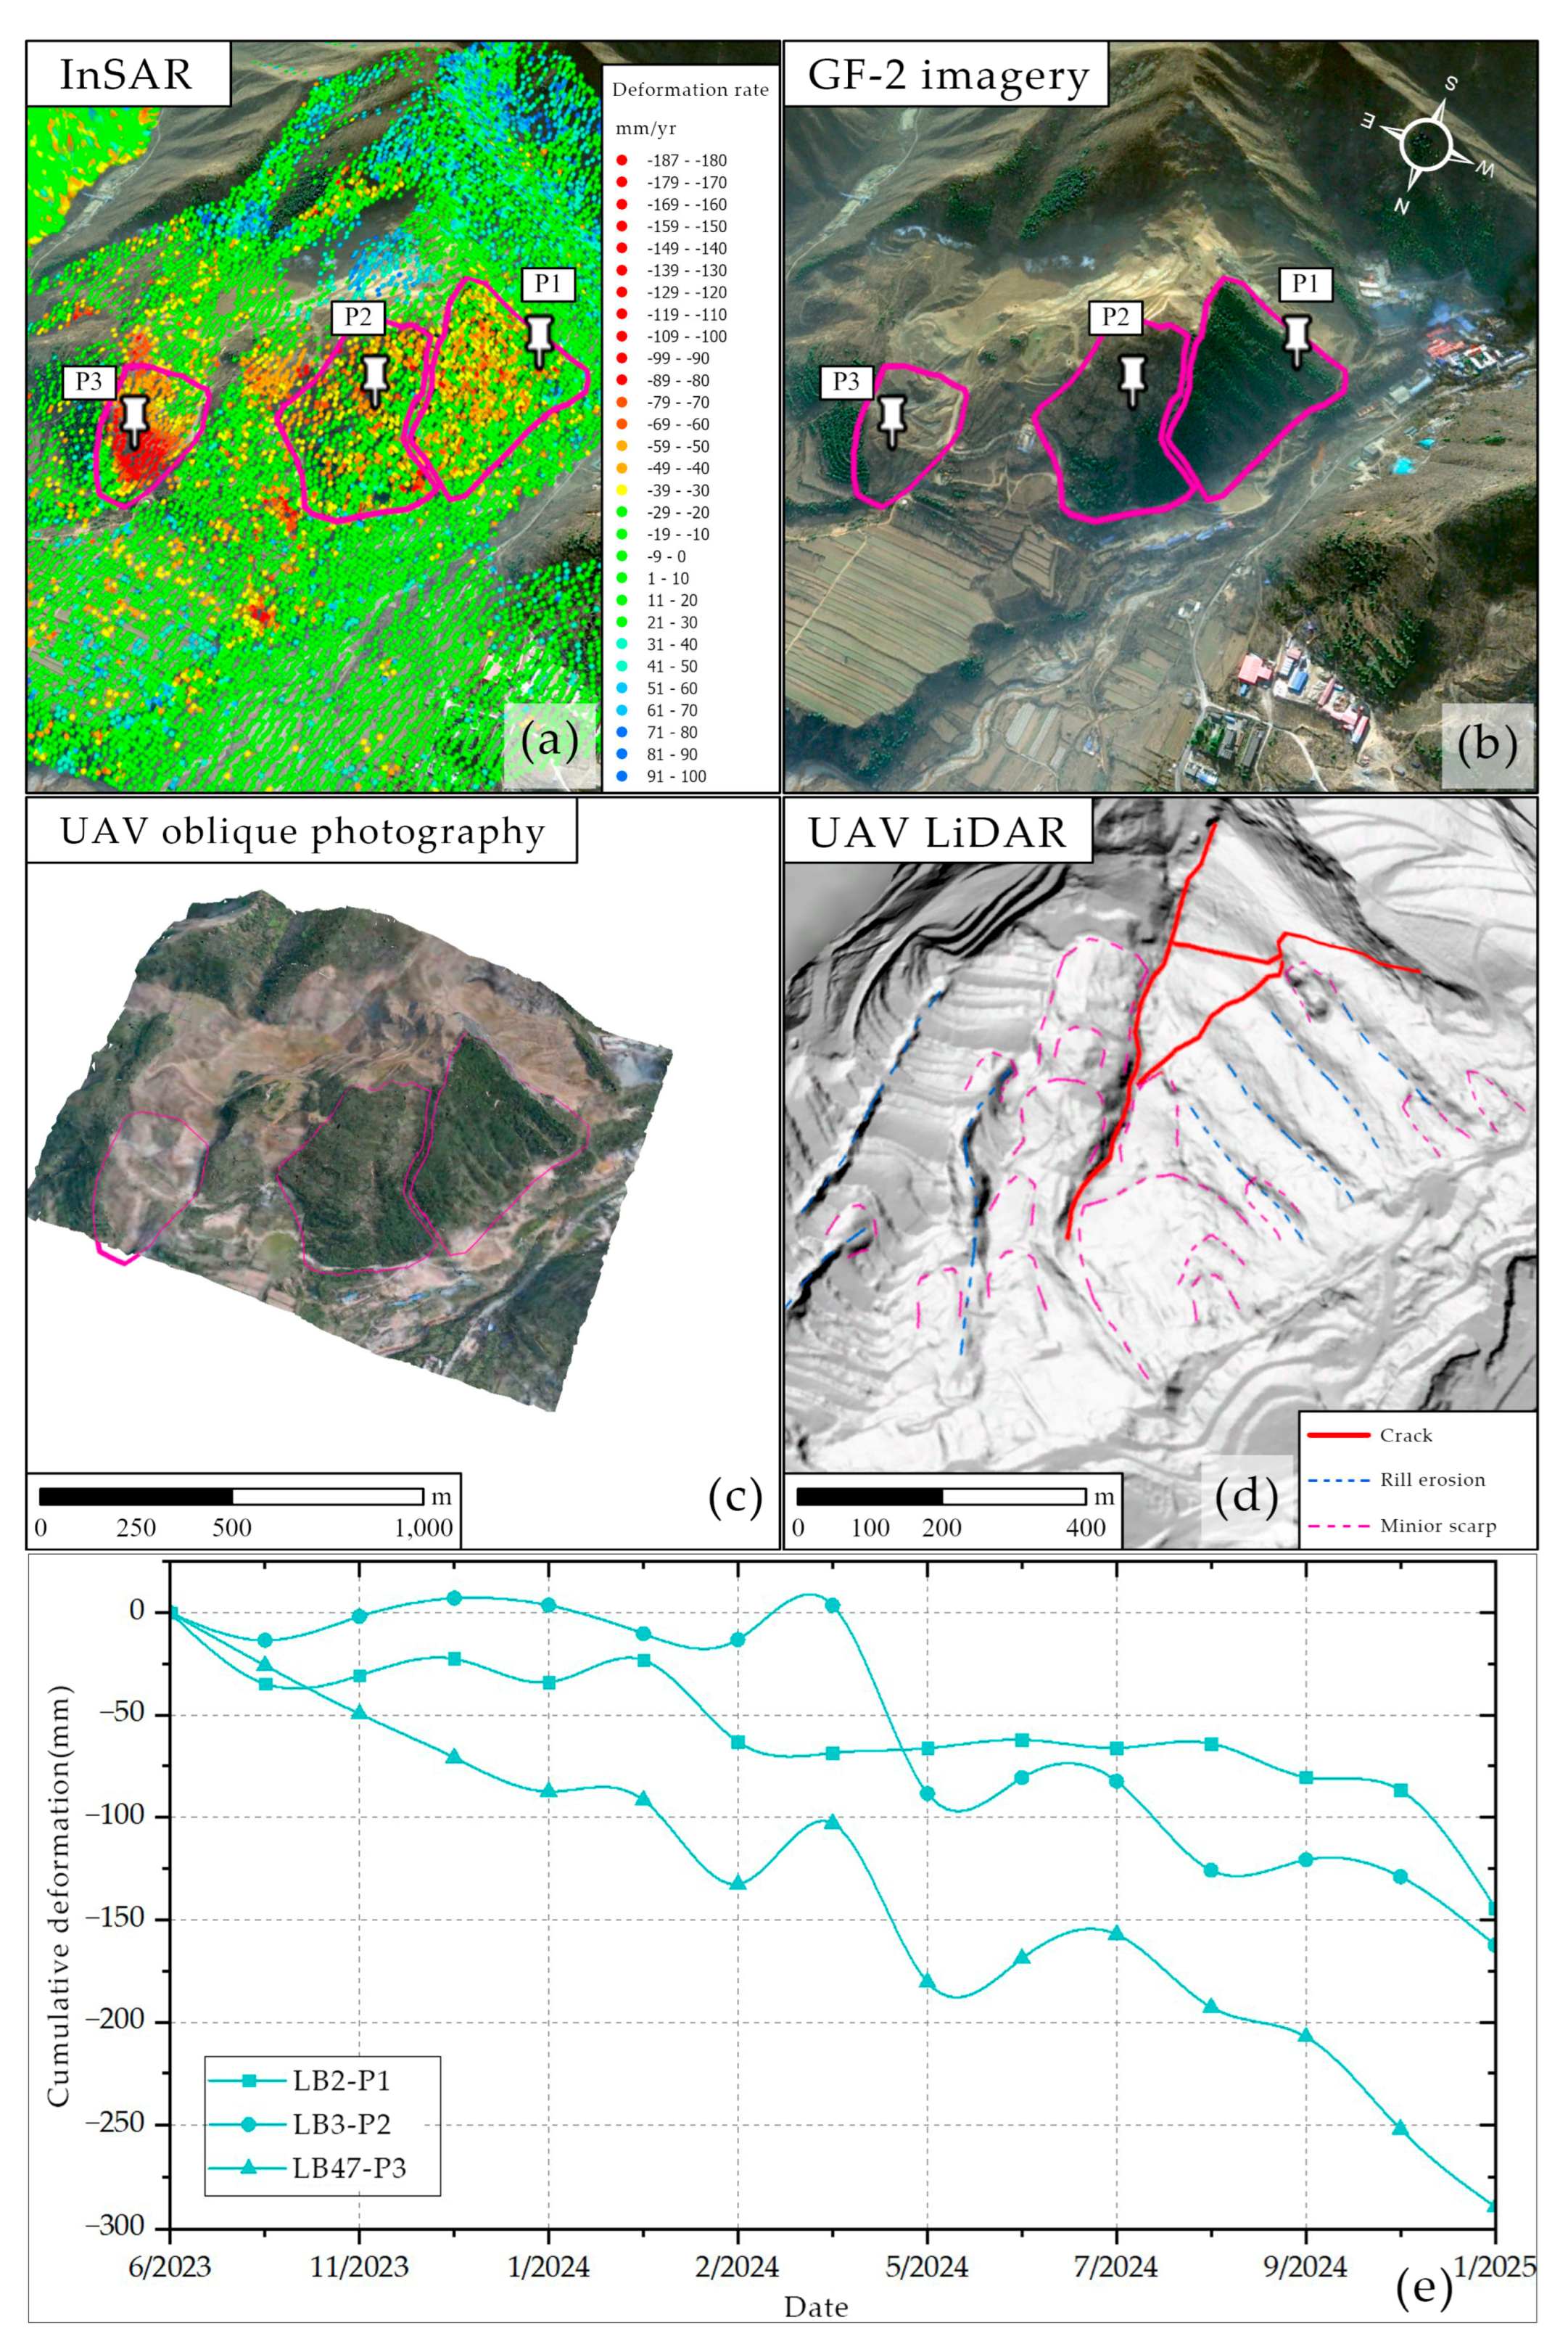
Figure 12-1.
New landslide hazards identified in Lingbao City based on ascending orbit data.

Figure 13.
Deformation gradients and Average coherence of DInSAR and SBAS results. (a) and (b) are the deformation gradient calculated from DInSAR and SBAS results respectively.
Figure 13.
Deformation gradients and Average coherence of DInSAR and SBAS results. (a) and (b) are the deformation gradient calculated from DInSAR and SBAS results respectively.
Disclaimer/Publisher’s Note: The statements, opinions and data contained in all publications are solely those of the individual author(s) and contributor(s) and not of MDPI and/or the editor(s). MDPI and/or the editor(s) disclaim responsibility for any injury to people or property resulting from any ideas, methods, instructions or products referred to in the content. |
© 2025 by the authors. Licensee MDPI, Basel, Switzerland. This article is an open access article distributed under the terms and conditions of the Creative Commons Attribution (CC BY) license (http://creativecommons.org/licenses/by/4.0/).
Copyright: This open access article is published under a Creative Commons CC BY 4.0 license, which permit the free download, distribution, and reuse, provided that the author and preprint are cited in any reuse.


