Submitted:
25 July 2025
Posted:
29 July 2025
You are already at the latest version
Abstract
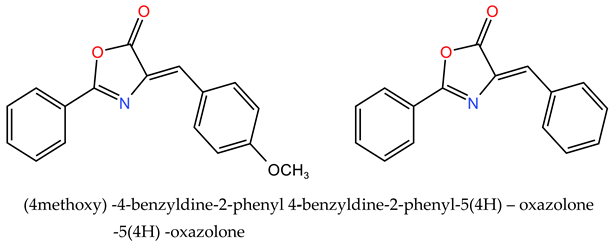
The compounds 4-benzyldine-2-phenyl-5(4H)-oxazolone and (4-methoxy)-4-benzyldine-2-phenyl-5(4H)-oxazolone were prepared. Infrared spectroscopy and mass spectra were used to confirm the structures of the two compounds. The dipole moment values of the ground electronic states were experimentally studied in benzene solution, where the results indicated that the methoxy-substituted compound reduced dielectric values, meaning it aided in forming double layers compared to the unsubstituted compound. However, at the same time, it had no clear effect on the results of the permanent dipole moment values, indicating that the electron-donating methoxy group did not noticeably affect the electronic and geometric structures of the compounds because its molar mass is much smaller than the molar mass of the entire compound. The fluorescence spectra of the two prepared compounds were measured in the wavelength range (200–900) nm in solvents of different polarities (acetonitrile, acetic acid, and ethyl acetate). The measured spectra indicated red-shifts in fluorescence emission peaks, any toward longer wavelengths as solvent polarity increased. The study showed that the dipole moment values of the excited state did not exhibit significant differences between the two compounds. The results of Stokes shift less than 100 nm indicated that the geometric shape of the compounds did not change, meaning that the presence of the electron-donating group in the compound, despite differences in its electrical properties, did not cause any disturbances in the compound’s energy levels overall. The electronic absorption spectra were measured in hexane and methanol, where no clear spectral shifts were observed when transitioning from a polar to a nonpolar solvent. The experimentally measured spectra in hexane were analyzed into ten linearly overlapping spectral bands using Gaussian fitting. To determine the nature of the electronic transitions, molecular orbital calculations were performed using the PM3 wavefunction, which was considered the best mathematical function for determining the geometric shape corresponding to the lowest energy.
Keywords:
oxazolone
; dipole moment
; red shift
; hyperchromic
; ground electronic state
; excited electronic state
1. Introduction
Oxazolone derivatives are considered heterocyclic compounds containing nitrogen and oxygen, playing a vital role as antibacterial, antiviral agents, in addition to their role in manufacturing pain relievers, anti-inflammatory, antidepressant, and anticancer drugs. They have been used in treating some types of diabetes [1]. They are used in manufacturing semiconductors that convert light into electrical charges, such as laser printers and photocopying machines, and in manufacturing nonlinear optical materials that depend on optical refractive coefficients [2]. Oxazolone derivatives contain many active sites that make them chemically modifiable, but due to their important applications, they are considered excellent raw materials for developing medical probes. They are also used as catalysts in preparing chromophore analogs based on imidazolin-5-one and green fluorescent protein, and in many applications such as micro-environmental sensors, molecular switching, microfabrication, early-stage corrosion detection, and photodynamic therapy [3]. The study showed that oxazolone derivatives are fluorescent molecules, especially when linked to electron-donating groups, and that fluorescence emission depends on solvent polarity, where it was observed that as solvent polarity increases, fluorescence shifts toward the long-wavelength region. The study also showed that the excited state is more polarizable than the ground state [4]. Recent studies indicate that modified oxazolone derivatives possess multiple potentials in various applications, as they can be used as monomers to produce light-conducting polymers, improving photoconversion efficiency to reach 15% [5]. Research has also proven that these compounds have a positive effect on polymerization processes, enhancing polyethylene polymerization speed by 30% when used as catalysts, contributing to improving the industrial performance of this process [6]. Additionally, polymer membranes containing oxazolone derivatives have been developed for use in gas sensors, characterized by high sensitivity reaching 0.1 PPM, making them an ideal choice in advanced detection technologies. These discoveries enhance the potential of oxazolone derivatives in optical, catalytic, and sensing industries, opening new horizons for their use in future applications [7].
2. Research Importance and Objectives
- Synthesize two oxazolone derivatives and confirm their structures using IR and mass spectroscopy.
- Calculate the permanent dipole moment of the ground electronic state using a benzene solution in a capacitor.
- Determine the dipole moment of the excited electronic state using fluorescence and absorption spectra in solvents of varying polarity.
- Study Stokes shifts in solvents with different dielectric constants.
- Analyze electronic absorption spectra in hexane and methanol to investigate the electronic effects of substituents on energy levels and charge transfer mechanisms.
- Data deconvolution in hexane using Gaussian analysis.
- Compute geometric configurations and energetic constants using the PM3 wavefunction in MOPAC.
3. Instruments Used
- FS-2 fluorescence spectrophotometer (SCINCO).
- LCR meter for capacitance measurement.
- UV-VIS double-beam spectrophotometer (PG Instruments Ltd., Model T90).
- FT-IR spectrometer (JASCO, Model 4200).
4. Materials Used
- Hippuric acid (Alfa Aesar, 99% purity).
- Benzaldehyde (SCP, 97% purity).
- 4-Chlorobenzaldehyde (SIGMA-ALDRICH, 97% purity).
- 4-Methoxybenzaldehyde (Alfa Aesar, 98% purity).
- 4-Nitrobenzaldehyde (Alfa Aesar, 99% purity).
- Glacial acetic acid (99% purity).
- Acetic acid (95% purity).
- Acetonitrile (Lap-Scan, 99.8% purity).
- Ethanol (SIGMA-ALDRICH, 99.8% purity).
- Ethyl acetate (99% purity).
- Chloroform (95% purity).
- n-Hexane (Acros Organics, 99% purity).
- Methanol (Laboratory Rasayan, 99.5% purity).
4-1-. Synthesis of Compounds
The two compounds with the following general formula were prepared:
Step 1: Added to a 50 mL round-bottom flask: 0.01 mol of hippuric acid, 0.01 mol of benzaldehyde derivative, 20 mL of glacial acetic acid, and 5 mL of pure acetic acid as a reaction medium. The mixture was heated under reflux at 80°C for four hours. Afterward, the mixture transformed from liquid to solid with a yellow color.
Step 2: The mixture was cooled to room temperature. If the prepared compound was in liquid form, the mixture was placed in an ice bath with stirring for half an hour until precipitates formed. The mixture was then slowly filtered to obtain a yellow precipitate.
Step 3: Recrystallization of the compounds was performed by dissolving them in the minimum possible amount of hot ethanol, then filtering the hot solution and leaving the samples in a refrigerator to cool well. The cold solution was filtered, the crystals were washed with ethanol, and then dried for 4 hours in an oven at 100°C, yielding pure yellow crystals [8].
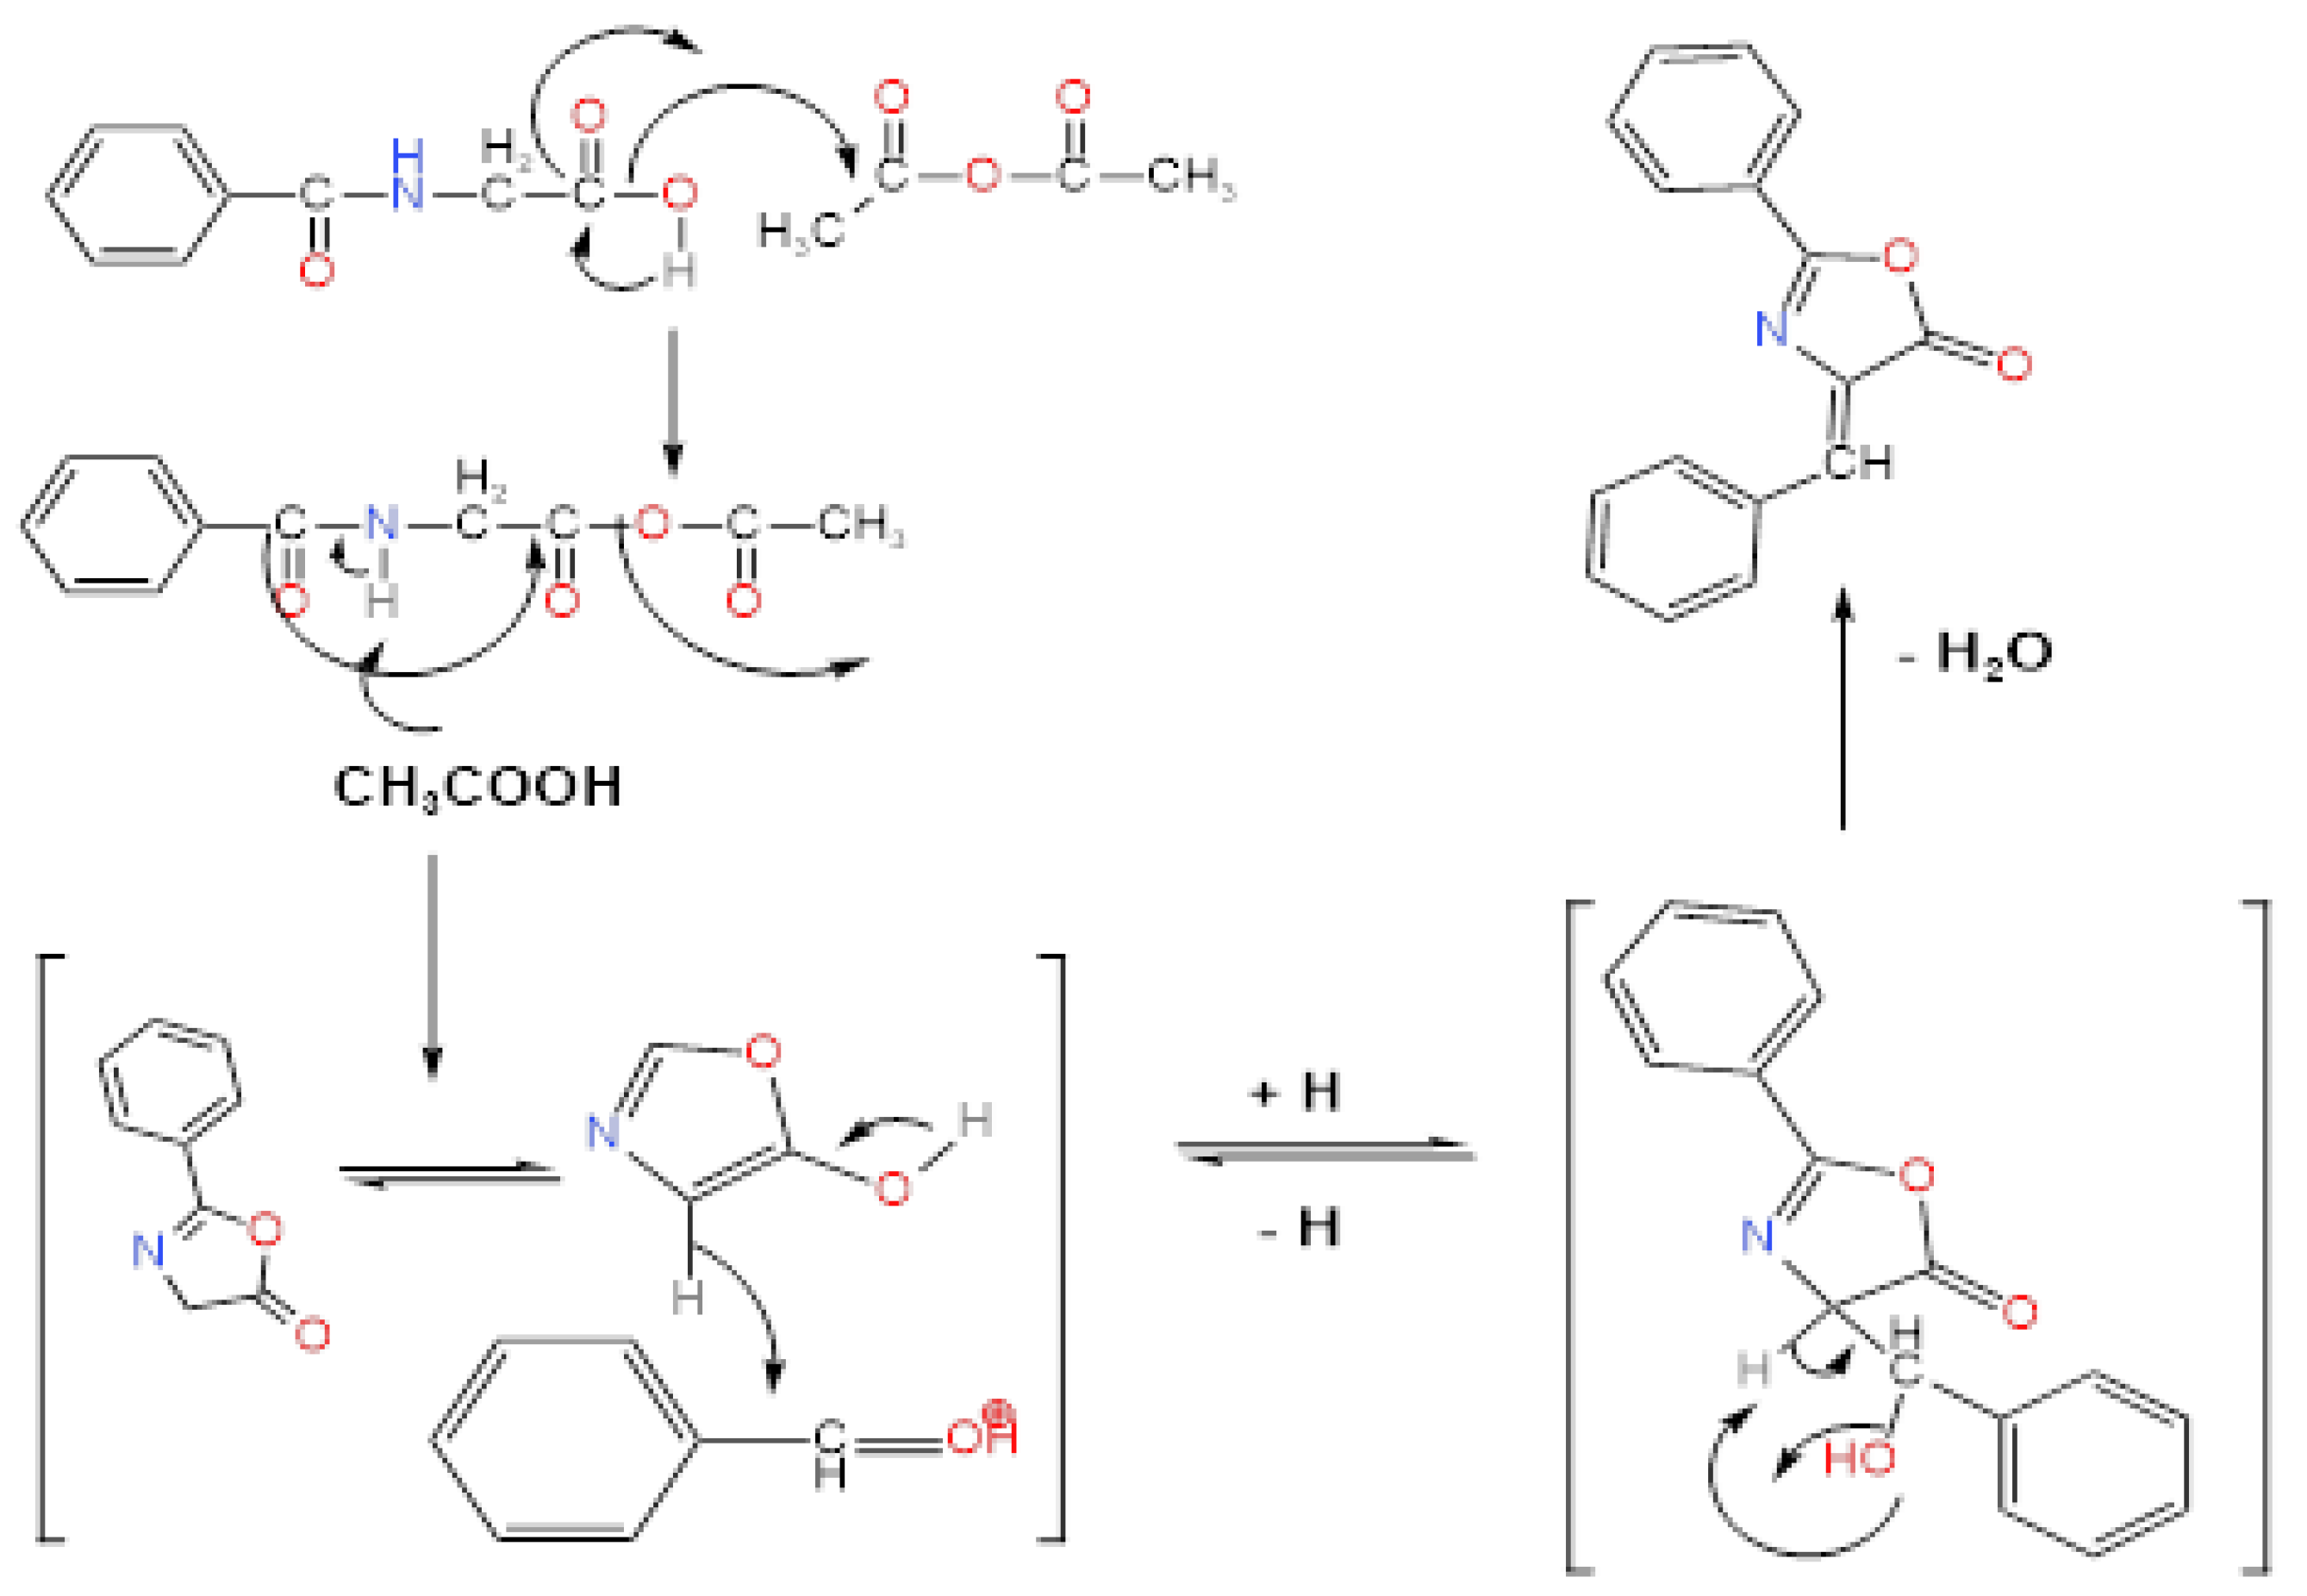
4-2-. Mechanism:
- Deprotonation: Hippuric acid reacts with acetic anhydride, undergoing deprotonation of the amide group (–NH–) to form a reactive carboxylate anion.
- Cyclization: The nucleophilic oxygen attacks the adjacent carbonyl carbon, leading to ring closure and formation of an unstable oxazolone intermediate.
- Benzaldehyde addition: The intermediate reacts with benzaldehyde in acetic acid medium, with subsequent proton abstraction to generate a new intermediate compound.
- Dehydration: Water elimination occurs via condensation, yielding the final stable oxazolone derivative product.
Figure 1.
Formation mechanism of oxazolones derivative [8].
5-. Physical Properties of Synthesized Compounds:
The prepared compounds differed in the intensity of their yellow color depending on the substituent, as shown in Table 1 [9].
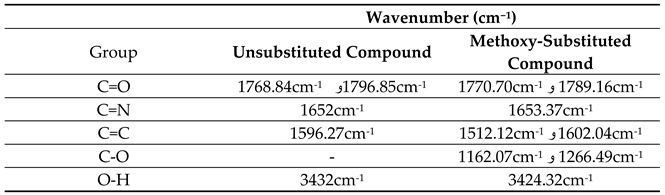
5. -1-IR Spectra
The infrared spectra (IR) were recorded to confirm the structures of the two prepared compounds using KBr disks in the spectral range of 450–3500 cm⁻¹.
For the unsubstituted compound (Figure 2):
- A peak at 3432 cm⁻¹ corresponds to the O-H stretching vibration, indicating free or hydrogen-bonded hydroxyl groups.
- Peaks at 1796.85 cm⁻¹ and 1768.84 cm⁻¹ correspond to C=O stretching, characteristic of the oxazolone ring. The presence of two peaks suggests multiple tautomeric forms or interactions with the environment.
- A peak at 1652 cm⁻¹ corresponds to C=N stretching, part of the heterocyclic oxazolone ring.
- A peak at 1596.27 cm⁻¹ corresponds to C=C stretching in aromatic rings (benzene rings).
For the methoxy-substituted compound (Figure 3):
- A peak at 3424.32 cm⁻¹ corresponds to O-H stretching, with a slight shift compared to the unsubstituted compound due to the methoxy group's effect.
- Peaks at 1789.16 cm⁻¹ and 1770.7 cm⁻¹ correspond to C=O stretching, with slight shifts due to the methoxy group.
- A peak at 1653.37 cm⁻¹ corresponds to C=N stretching, with a small positional change compared to the unsubstituted compound.
- Peaks at 1602.04 cm⁻¹ and 1512.12 cm⁻¹ correspond to C=C stretching in aromatic rings, with shifts due to the methoxy group.
- Distinctive peaks at 1266.49 cm⁻¹ and 1162.07 cm⁻¹ correspond to C-O stretching in the methoxy group, a hallmark of this substituent [9].

Table 2.
Interpretation of IR Spectra.
5. -2-Mass Spectra
The mass spectra (Figure 4 and Figure 5) demonstrate a clear relationship between molecular structure and fragmentation patterns, confirming the successful synthesis of both target compounds.
The key difference is evidenced by the m/z=279 peak in Figure 5 compared to m/z=249 in Figure 4, reflecting the impact of the additional methoxy group on molecular mass.
The peaks at m/z=172 and 202 indicate molecular fragment stability following phenyl group loss in both compounds, supporting the molecular design.
The m/z=248 peak in Figure 5 is characteristic of the methoxy group, representing its loss (OCH₃) during fragmentation.
The spectra confirm the shared core structure through the consistent m/z=77 peak in both compounds, representing the phenyl ion.
The more complex fragmentation pattern in Figure 5 reflects the methoxy group's influence on molecular stability and ionization behavior.
These results provide strong experimental evidence supporting the theoretical analyses and conclusions regarding the properties of these oxazolone derivatives presented in the study.
6-. Calculation of Dipole Moment for Ground Electronic State
A 25 mL benzene solution containing 0.02 g of each compound was prepared. From this, 1 mL was taken and diluted again with benzene to 25 mL. The solution was placed between the plates of a capacitor with specific dimensions (Figure 4), connected to an LCR meter to measure its capacitance under a low-voltage DC electric field (0.5 V). [[10–13]
The dipole moment (µ) was calculated using the following equations:
 Where:
Figure 4.
Parallel plate capacitor.
- M: Molar mass
- ρ: Density
- k: Dielectric constant
- NA: Avogadro's number
- ε0: Vacuum permittivity
- K: Boltzmann constant
- T: Absolute temperature
Table 3.
Some physical and electrical constants for oxazolone derivatives.
| -H | -OCH3 | |
|---|---|---|
| CP (Pico. farad) | 6.2095 | 6.7 |
| PM.10-4 (m3.mol-1) | 1.61 | 1.887 |
| µ(Debye) | 2.807 | 3.039 |
The methoxy group, as an electron-donating group, reduced the dielectric value and increased the capacitor's capacitance compared to the unsubstituted oxazolone. However, no significant changes were observed in the permanent dipole moment of the ground electronic state due to the substituent's small molar mass relative to the entire compound. The table shows no significant differences between the dipole moment values, indicating similarity in geometric structure despite the presence of different substituents [14].
7-. Calculation of Dipole Moment for Excited Electronic State Using Fluorescence
7-1-. Fluorescence Spectra of Unsubstituted Oxazolone
Fluorescence spectra of the unsubstituted oxazolone were recorded in solvents of different polarities (acetonitrile, acetic acid, and ethyl acetate) in the spectral range of 200–900 nm.
- In ethyl acetate: Excitation at 405 nm yielded a fluorescence peak at 435 nm, with a Stokes shift of 30 nm (Figure 7).
- In acetic acid: Excitation at 410 nm yielded a fluorescence peak at 441 nm, with a Stokes shift of 31 nm (Figure 8).
- In acetonitrile: Excitation at 415 nm yielded a fluorescence peak at 480 nm, with a Stokes shift of 65 nm (Figure 9).
The table shows a red shift in fluorescence spectra when transitioning from ethyl acetate to acetic acid to acetonitrile, corresponding to increasing dielectric constants (6.02, 6.15, and 37.5, respectively) [15,16].
The results indicated that the excited electronic state is more stable in polar solvents, confirming its higher polarity compared to the ground state. The increased interaction between the excited state's polarity and the solvent's polarity led to a physical stabilization of the excited state, accompanied by a red shift in fluorescence spectra [17].
The study also observed Solvatochromism, where fluorescence spectra shifted toward longer wavelengths when moving from less polar to more polar solvents. The dielectric constant played a key role in Solvatochromism and the morphology of the studied compounds. The red shift in fluorescence spectra resulted from the coupling of the two benzene rings (electron-donating groups) with the heterocyclic oxazolone ring, leading to intramolecular charge transfer (ICT) when the compound is in the excited electronic state [18].
7-2-. Fluorescence Spectra of Methoxy-Substituted Oxazolone
Similarly, fluorescence spectra of the methoxy-substituted oxazolone were recorded. Excitation wavelengths were 461 nm, 458 nm, and 457 nm, yielding Stokes shifts of 35 nm, 31 nm, and 25 nm in ethyl acetate, acetic acid, and acetonitrile, respectively (Figure 10, Figure 11 and Figure 12).
No clear changes were observed in excitation wavelengths, but a red shift and band broadening were noted when transitioning from less polar to more polar solvents. The excited state's polarity was evident, similar to the unsubstituted oxazolone, due to the strong electron-donating nature of the methoxy group.
Table 4.
Spectral values of fluorescence of unsubstituted and methoxy-substituted.
|
Solvent |
unsubstituted | methoxy-substituted | ||||
|---|---|---|---|---|---|---|
|
EXλ (nm) |
FLλ (nm) |
Stokes shift Δλ(nm) |
EXλ (nm) |
FLλ (nm) |
Stokes shift Δλ(nm) |
|
| ETHYL ACETATE | 405 | 435 | 30 | 457 | 450 | 25 |
| ACETIC ACID | 410 | 441 | 31 | 458 | 489 | 31 |
| ACETONITRIL | 415 | 480 | 65 | 461 | 496 | 35 |
λEX: excitation wavelength in nanometers (nm). λFL: Fluorescence wavelength in nanometers (nm).
8-. Calculation of Dipole Moment for the Excited Electronic State:
Different solvents of varying polarity were employed to perturb the first excited electronic state for the determination of m₂ and m₁ values. To calculate m₂, the relationship was plotted as a function of F₃(ε,n), while form₁, the relationship was plotted against F₂(ε,n) (Figure 13, Figure 14, Figure 15 and Figure 16).
The dipole moment of the excited electronic state (μ*) was calculated using equations (2-5):
where μ* and μ represent the dipole moments of the excited and ground states, respectively; h is Planck's constant, c is the speed of light in vacuum, and a₀ is a constant known as the Onsager cavity radius.
A fundamental requirement for applying equation (5) is that m₂ > m₁, as the ground state must be in equilibrium with the excited state. The obtained results are presented in Table 5 and Table 6.
The table reveals a slight increase in dipole moment for both compounds, attributed to the greater polarity of the excited electronic state compared to the ground state. This enhancement stems primarily from hydrogen bond formation, along with two key contributing factors:
First: The photophysical transition in these molecules is of the localized excitation (LE) type, where excited electrons remain confined to their original molecular region without significant redistribution of overall charge density [19].
Second: The methoxy group exerts a dual opposing influence - while its electron-donating capability increases the dipole moment, steric constraints simultaneously limit this effect by impeding complete charge reorganization during excitation [20].
9. -Electronic Absorption Spectra Analysis:
9-1-. For 4-Benzylidene-2-phenyl-5(4H)-oxazolone:
The electronic absorption spectra of 4-benzylidene-2-phenyl-5(4H)-oxazolone were measured in methanol and n-hexane across the 200–500 nm wavelength range. The spectra exhibited similar overall profiles in both solvents, despite their differing polarities, with no significant shifts in spectral band positions. This indicates that the conjugated π-system remains largely unaffected by solvent polarity.
However, the spectrum in methanol showed hyperchromic effects (increased molar absorptivity) at key absorption bands. This enhancement arises from hydrogen bonding between methanol’s Auxochromic –OH group and the carbonyl oxygen of the oxazolone ring, which bridges the phenyl and hydrocarbon moieties [21].
Spectroscopic measurements revealed two distinct absorption bands:
- A primary peak at 360 nm (attributed to the π→π* transition of the conjugated system)
- A secondary peak at 260 nm (likely due to localized aromatic transitions), as shown in Figure 17 for the n-hexane spectrum.
The spectral features can be explained by two resonance structures:
- −
- The primary resonance form (extended conjugation) corresponds to the main absorption band at 360 nm, exhibiting a redshift due to decreased energy transition.
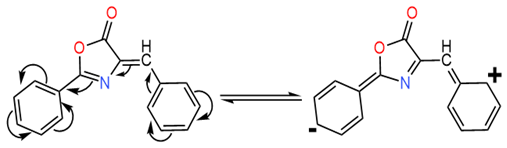
- −
- The secondary resonance form (shorter conjugation) corresponds to the 260 nm band, showing a blueshift from reduced conjugation length.
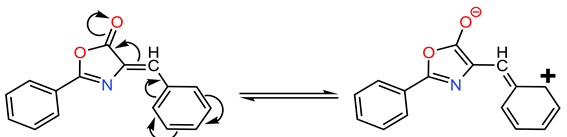
Figure 17 reveals three intense absorption bands at 380, 360, and 342 nm (π→π* transitions), along with three weaker bands at 260, 247, and 239 nm (n→π* transitions) that were more distinct in n-hexane. These features arise from hydrogen bonding interactions in methanol and the compound's electronic structure.
Gaussian deconvolution of the n-hexane spectrum (Figure 18) revealed ten linearly superimposed absorption bands with varying intensities, resulting from multiple electronic transitions of different chromophores within the molecular framework [22,23].
To interpret the Gaussian deconvolution results for the studied compound, we used the MOPAC-2016 program, which specializes in investigating excited electronic states, calculating certain geometric constants for the ground state, and studying the computed electronic transitions that simulate the Gaussian deconvolution results. To conduct this study, it was necessary to determine the optimal molecular geometry corresponding to the lowest energy state, based on the experimentally measured permanent dipole moment value of 2.807 Debye provided in Table 5. We employed a set of parameterized wavefunctions programmed within the MOPAC software to calculate the dipole moment value of the studied compound, including AM1, PM6, STO-3G, PM7, and PM3 [24]. The results are presented in Table 7.
Table 7 demonstrates that the PM3 calculation method yielded a dipole moment value of 2.707 Debye, which is the closest to the experimentally measured value of 2.807 Debye. Consequently, this method was employed to perform structural calculations on the ground electronic state in order to obtain the optimal molecular geometry corresponding to the lowest energy state, as shown in Figure 19.
The excited electronic states were studied to interpret the Gaussian deconvolution results using the optimal geometric configuration corresponding to the lowest energy state, which was calculated via the PM3 wavefunction within the MOPAC 2016 program. For this study, four filled molecular orbitals (HOMO) and four empty molecular orbitals (LUMO) were selected (after multiple calculations employing various combinations of filled and empty molecular orbitals) to investigate the theoretical spectral transitions corresponding to singlet states (Singlet). The results are presented in Table 8 and Table 9.
From Table 9, we observe the following:
- The spectral band resulting from Gaussian deconvolution at 4.79 eV (theoretically calculated at 4.86 eV) shows a charge transfer percentage of approximately 25%. This represents the highest electronic charge transfer within the compound, occurring from the heterocyclic ring to the benzene ring on the right side of the heterocyclic ring. This transition results from the electronic excitation from bonding molecular orbital type number 44 (HOMO) to antibonding molecular orbital number 49 (LUMO).
- Another electronic transition with 15% contribution originates from the oxazolone ring which connected to the carbonyl group towards the benzene ring in the right section.
- Additionally, a relatively minor electronic transition of 5% occurs from the oxazolone ring connected to the carbonyl group towards the benzene ring. Notably, a 2% contribution indicates negligible electronic transition. This pattern explains the remaining electronic transitions, where most transitions occur from bonding orbitals 44, 45, and 46 to antibonding orbitals 47, 48, 49, and 50, representing the predominant contribution of these transitions.
- The table further demonstrates that most electronic transitions are not localized to specific functional groups but rather delocalized across the entire molecular framework. This observation aligns with the resonance structures interpreted through spectroscopic measurements of the compound, indicating significant electron delocalization throughout the molecular components.
- The theoretical computational results show excellent agreement with the measured spectra of the compound in solvents of varying polarity (methanol and n-hexane).
9. -2-The Absorption Spectrum and Electronic Structural Properties of the Compound (4-Methoxy)-4-benzylidene-2-phenyl-5(4H)-oxazolone:
The electronic absorption spectra of the compound (4-methoxy)-4-benzylidene-2-phenyl-5(4H)-oxazolone were measured using the same previous method in methanol and hexane solvents within the wavelength range of 200–500 nm. The measured spectra show a similarity in their general appearance in both methanol and hexane. However, a shift in the main peak was observed in the spectrum recorded in methanol by 20 nm in the 380–400 nm wavelength region and by 40 nm in the 260–300 nm wavelength region, along with an increase in molar absorption coefficient values compared to the spectrum measured in hexane (Figure 20). This is attributed to the formation of some hydrogen bonds between the studied compound and methanol, due to the presence of the Auxochromic (-OH) group of methanol, which forms a hydrogen bond with the oxygen in the carbonyl group linking the benzene ring and the hydrocarbon chain with the benzene ring [25].
The spectroscopic measurements indicated the presence of two absorption peaks: a main peak at 380 nm and a secondary peak at 260 nm in the spectrum recorded in hexane (Figure 20).
Comparison of Figure 20 with the absorption spectrum of 4-benzylidene-2-phenyl-5(4H)-oxazolone reveals a red shift of 45 nm. This shift is attributed to the electron-donating contribution of the methoxy group through resonance effects, resulting in an extended conjugated system. A Gaussian analysis was performed for the studied compound in hexane. The fitting results demonstrated the appearance of ten linearly superimposed absorption bands with varying intensities and positions. These bands arise from electronic transitions associated with multiple chromophores within the compound, along with the additive influence of the methoxy group (Table 11 and Figure 21).
Table 10 shows that the PM3 calculation method yielded a dipole moment value of 3.863 Debye, which is closest to the experimentally measured value of 3.039 Debye. Based on this, it was used to perform structural calculations at the natural electron population level to obtain the optimal geometric configuration corresponding to the lowest energy state, as shown in Figure 22.
To interpret the Gaussian deconvolution results, excited electronic states were studied using the PM3 wavefunction within MOPAC 2016 software. For this study, four filled molecular orbitals Ψ50 Ψ52, Ψ51, and four empty molecular orbitals Ψ53 Ψ56, Ψ55, Ψ54, were selected (after multiple calculations using various combinations of filled and empty molecular orbitals) to investigate theoretical electronic transitions corresponding to singlet spin states. The results are presented in Table 11 and Table 12.
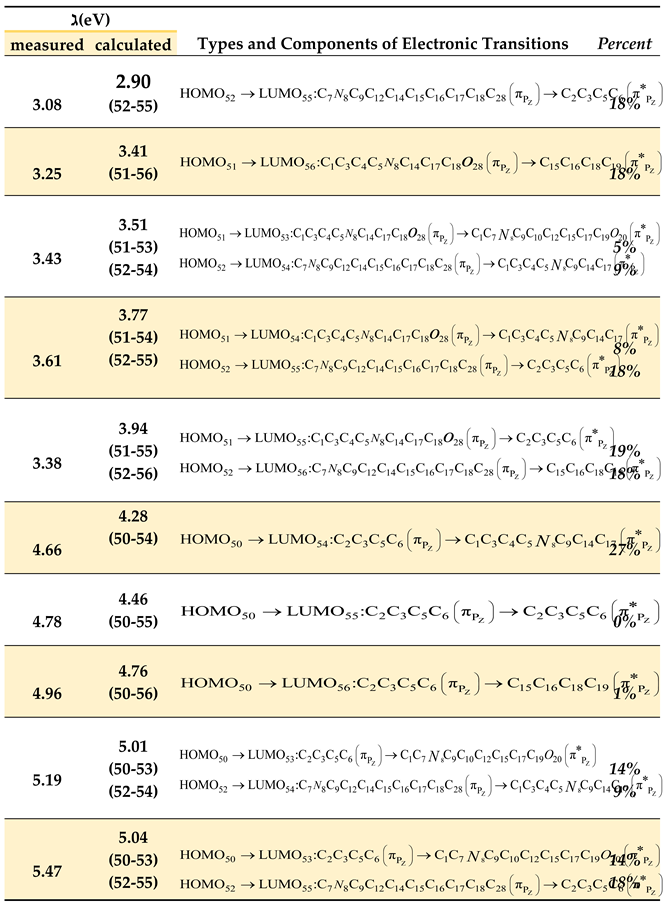
From Table 12, we observe the following:
- The spectral band obtained from Gaussian deconvolution at 3.08 eV (theoretically calculated at 2.90 eV) exhibits a charge transfer ratio of approximately 18%, directed toward the right side of the compound (bearing the methoxy group) from the oxazolone ring. This transition arises from the electronic excitation from bonding molecular orbital No. 52 (HOMO) to antibonding molecular orbital No. 55 (LUMO). Additionally, a 15% electronic transfer occurs from the oxazolone ring (linked to the carbonyl group) toward the benzene ring on the right side.
- The spectral band from Gaussian deconvolution at 4.66 eV (theoretically calculated at 4.28 eV) is localized by 27% on the left side of the compound, originating from the left benzene ring directly connected to the oxazolone ring and extending toward the benzene ring on the right terminus. This transition results from the excitation from bonding molecular orbital No. 50 (HOMO) to antibonding molecular orbital No. 54 (LUMO).
- A minor electronic transfer (5%) is observed from the left benzene ring (attached to the oxazolone) toward the benzene ring on the right terminus. Notably, a 1% contribution indicates negligible electronic transfer. Similar interpretations apply to other transitions, where most electronic excitations occur from bonding orbitals 50, 51, and 52 to antibonding orbitals 53, 54, 55, and 56, representing the dominant contributions.
- The table further reveals that most electronic transitions are not localized on specific functional groups but rather delocalized across the entire molecule, consistent with the resonance structures inferred from spectroscopic measurements. This suggests electron delocalization throughout the molecular framework.
- Experimental results demonstrate that the absorption spectra of the compound in solvents of different polarities (methanol and hexane) show no significant shift in spectral band positions (Figure 20). This behavior indicates that solvent polarity has no pronounced effect on the electronic properties of the compound, supporting the hypothesis that the oxazolone ring inhibits resonance effects.
Conclusions
- The methoxy-substituted oxazolone did not significantly alter dipole moments.
- Three primary spectral bands were observed at 380 nm, 360 nm, and 342 nm, indicating π→π* transitions.
- Three low-intensity bands at 260 nm, 247 nm, and 239 nm in methanol were attributed to n→π* transitions.
- A red shift was observed in methoxy-substituted oxazolone due to extended conjugation.
- No major geometric changes were observed, as confirmed by small Stokes shifts.
- calculations accurately predicted dipole moments and electronic transitions.
References
- Mehra, M.; Singh, R.; Kaker, S. Review on Chemistry of Oxazole Derivatives: Current to Future Therapeutic Prospective. Egypt. J. Basic Appl. Sci. 2023, 10, 218–239. [Google Scholar] [CrossRef]
- Szukalski, A.; Krawczyk, P.; Sahraoui, B.; Jędrzejewska, B. Multifunctional Oxazolone Derivative as an Optical Amplifier, Generator, and Modulator. J. Phys. Chem. B 2022, 126, 1742–1757. [Google Scholar] [CrossRef] [PubMed]
- Gowri, M.R.; Ranganathan, M.; Ramanathan, G. Solvent Polarity Induces Significant Bathochromic Shift on (4Z,4'Z)-4,4'-(((Phenylazanediyl)bis(4,1-phenylene))bis(methaneylylidene))bis(2-phenyloxazol-5(4H)-one). Res. Sq. 2023, 2–16. [Google Scholar]
- Jędrzejewska, B.; Krawczyk, P.; Józefowicz, M. Experimental and Theoretical Studies of the Influence of Solvent Polarity on the Spectral Properties of Two Push-Pull Oxazol-5-(4H)-one Compounds. Spectrochim. Acta A Mol. Biomol. Spectrosc. 2017, 171, 258–267. [Google Scholar] [CrossRef] [PubMed]
- Pal, A.; Wong, A.R.; Lamb, J.R. Chemically Recyclable, High Molar Mass Polyoxazolidinones via Ring-Opening Metathesis Polymerization. ACS Macro Lett. 2024, 13, 1655–1661. [Google Scholar] [CrossRef]
- Siragusa, F.; Crane, L.; Stiernet, P. Continuous Flow Synthesis of Functional Isocyanate-Free Poly(oxazolidone)s by Step-Growth Polymerization. ACS Macro Lett. 2024, 13, 1785–1792. [Google Scholar] [CrossRef]
- Cao, L.C.T.; Zhou, M.-H.; Tseng, S.-F. Facile Fabrication of Oxygen-Enriched MXene-Based Sensor and Their Ammonia Gas-Sensing Enhancement. Adv. Mater. Interfaces 2023, 10, 254–261. [Google Scholar] [CrossRef]
- Kadhim, Z.Y.; Magtoof, M.S. Synthesis, Characterization of Novel 4-Arylidene-2-Phenyl-5(4H) Oxazolones. Eur. Chem. Bull. 2022, 8, 146–151. [Google Scholar]
- Fahmy, A.F.M.; El-Sayed, A.A.; Hemdan, M.M. Multicomponent Synthesis of 4-Arylidene-2-Phenyl-5(4H)-Oxazolones (Azlactones) Using a Mechanochemical Approach. BMC Chem. 2016, 10, 59. [Google Scholar] [CrossRef]
- Davari, N.; Daub, C.D.; Åstrand, P.-O.; Unge, M. Local Field Factors and Dielectric Properties of Liquid Benzene. J. Phys. Chem. B 2023, 127, 11839–11845. [Google Scholar] [CrossRef]
- Zhang, Y.; Jiang, J.; Jiang, B. Learning Dipole Moments and Polarizabilities. arXiv 2021. [Google Scholar] [CrossRef]
- Ligorio, R.F.; Rodrigues, J.L.; Zuev, A.; Dos Santos, L.H.R.; Krawczuk, A. Benchmark of a Functional-Group Database for Distributed Polarizability and Dipole Moment in Biomolecules. Phys. Chem. Chem. Phys. 2022, 24, 29495–29504. [Google Scholar] [CrossRef]
- Jędrzejewska, B.; Krawczyk, P.; Józefowicz, M. Experimental and Theoretical Studies of the Influence of Solvent Polarity on the Spectral Properties of Two Push-Pull Oxazol-5-(4H)-one Compounds. Spectrochim. Acta A Mol. Biomol. Spectrosc. 2017, 171, 258–267. [Google Scholar] [CrossRef]
- Santana, L.X.; Flores, B.M.M.; Pérez, V.M.J. Microwave Assisted Organic Syntheses (MAOS): The Green Synthetic Method. Res. Gate 2021. [Google Scholar]
- Suresha, S.; Shilpa, G.M.; Vijayalakshmi, A.R.; et al. Photophysical Studies on Quinoline-Substituted Oxazole Analogues for Optoelectronic Application: An Experimental and DFT Approach. J. Electron. Mater. 2025, 78, 11993–12005. [Google Scholar] [CrossRef]
- Mannopantar, S.R.; Patil, V.S.; Prabhala, P.; et al. Systematic Photophysical Interaction Studies Between Newly Synthesised Oxazole Derivatives and Silver Nanoparticles: Experimental and DFT Approach. J. Fluoresc. 2024, 34, 1655–1670. [Google Scholar] [CrossRef] [PubMed]
- Morimoto, M.; Takagi, Y.; Hioki, K.; Nagasaka, T.; Sotome, H.; Ito, S.; Miyasaka, H.; Irie, M. A Turn-on Mode Fluorescent Diarylethene: Solvatochromism of Fluorescence. Dyes Pigm. 2018, 153, 144–149. [Google Scholar] [CrossRef]
- Homocianu, M.; Airinei, A.; Matica, O.T.; Cristea, M.; Ungureanu, E.M. Solvent Effects and Metal Ion Recognition in Several Azulenyl-Vinyl-Oxazolones. Symmetry 2023, 15, 327. [Google Scholar] [CrossRef]
- Zhang, Y.; Li, X.; Wang, J. Localized Electronic Excitations in π-Conjugated Systems: Spectroscopic and Computational Insights. J. Phys. Chem. A 2023, 127, 3320–3335. [Google Scholar]
- Müller, T.; Schmidt, R.; Chen, L. Steric and Electronic Balancing in Methoxy-Substituted Fluorophores: A Molecular Dynamics Study. Chem. Sci. 2022, 13, 8255–8268. [Google Scholar]
- Reichardt, C.; Welton, T. Solvents and Solvent Effects in Organic Chemistry, 4th ed.; Wiley-VCH: Weinheim, Germany, 2011. [Google Scholar]
- Kupriyanov, G.A.; Isaev, I.V.; Plastinin, I.V.; Dolenko, T.A.; Dolenko, S.A. Decomposition of Spectral Band into Gaussian Contours Using an Improved Modification of the Gender Genetic Algorithm. Moscow Univ. Phys. Bull. 2024, 78, S236–S242. [Google Scholar] [CrossRef]
- Zeng, R.; Mannaerts, C.M.; Lievens, C. Assessment of UV-VIS Spectra Analysis Methods for Quantifying the Absorption Properties of Chromophoric Dissolved Organic Matter (CDOM). Front. Environ. Sci. 2023, 11. [Google Scholar] [CrossRef]
- Li, X.; Zhang, Y. Comparative Study of Semi-Empirical Methods (AM1, PM3, PM6, PM7) for Predicting Electronic Spectra of Conjugated Systems. J. Mol. Struct. 2020, 1205, 127591. [Google Scholar]
- Zhang, Y.; et al. Solvent-Dependent Spectral Shifts in 5(4H)-Oxazolones: Experimental and Theoretical Insights. J. Phys. Chem. A 2021, 125, 2542–2551. [Google Scholar]
Figure 2.
IR of the substituent -H.
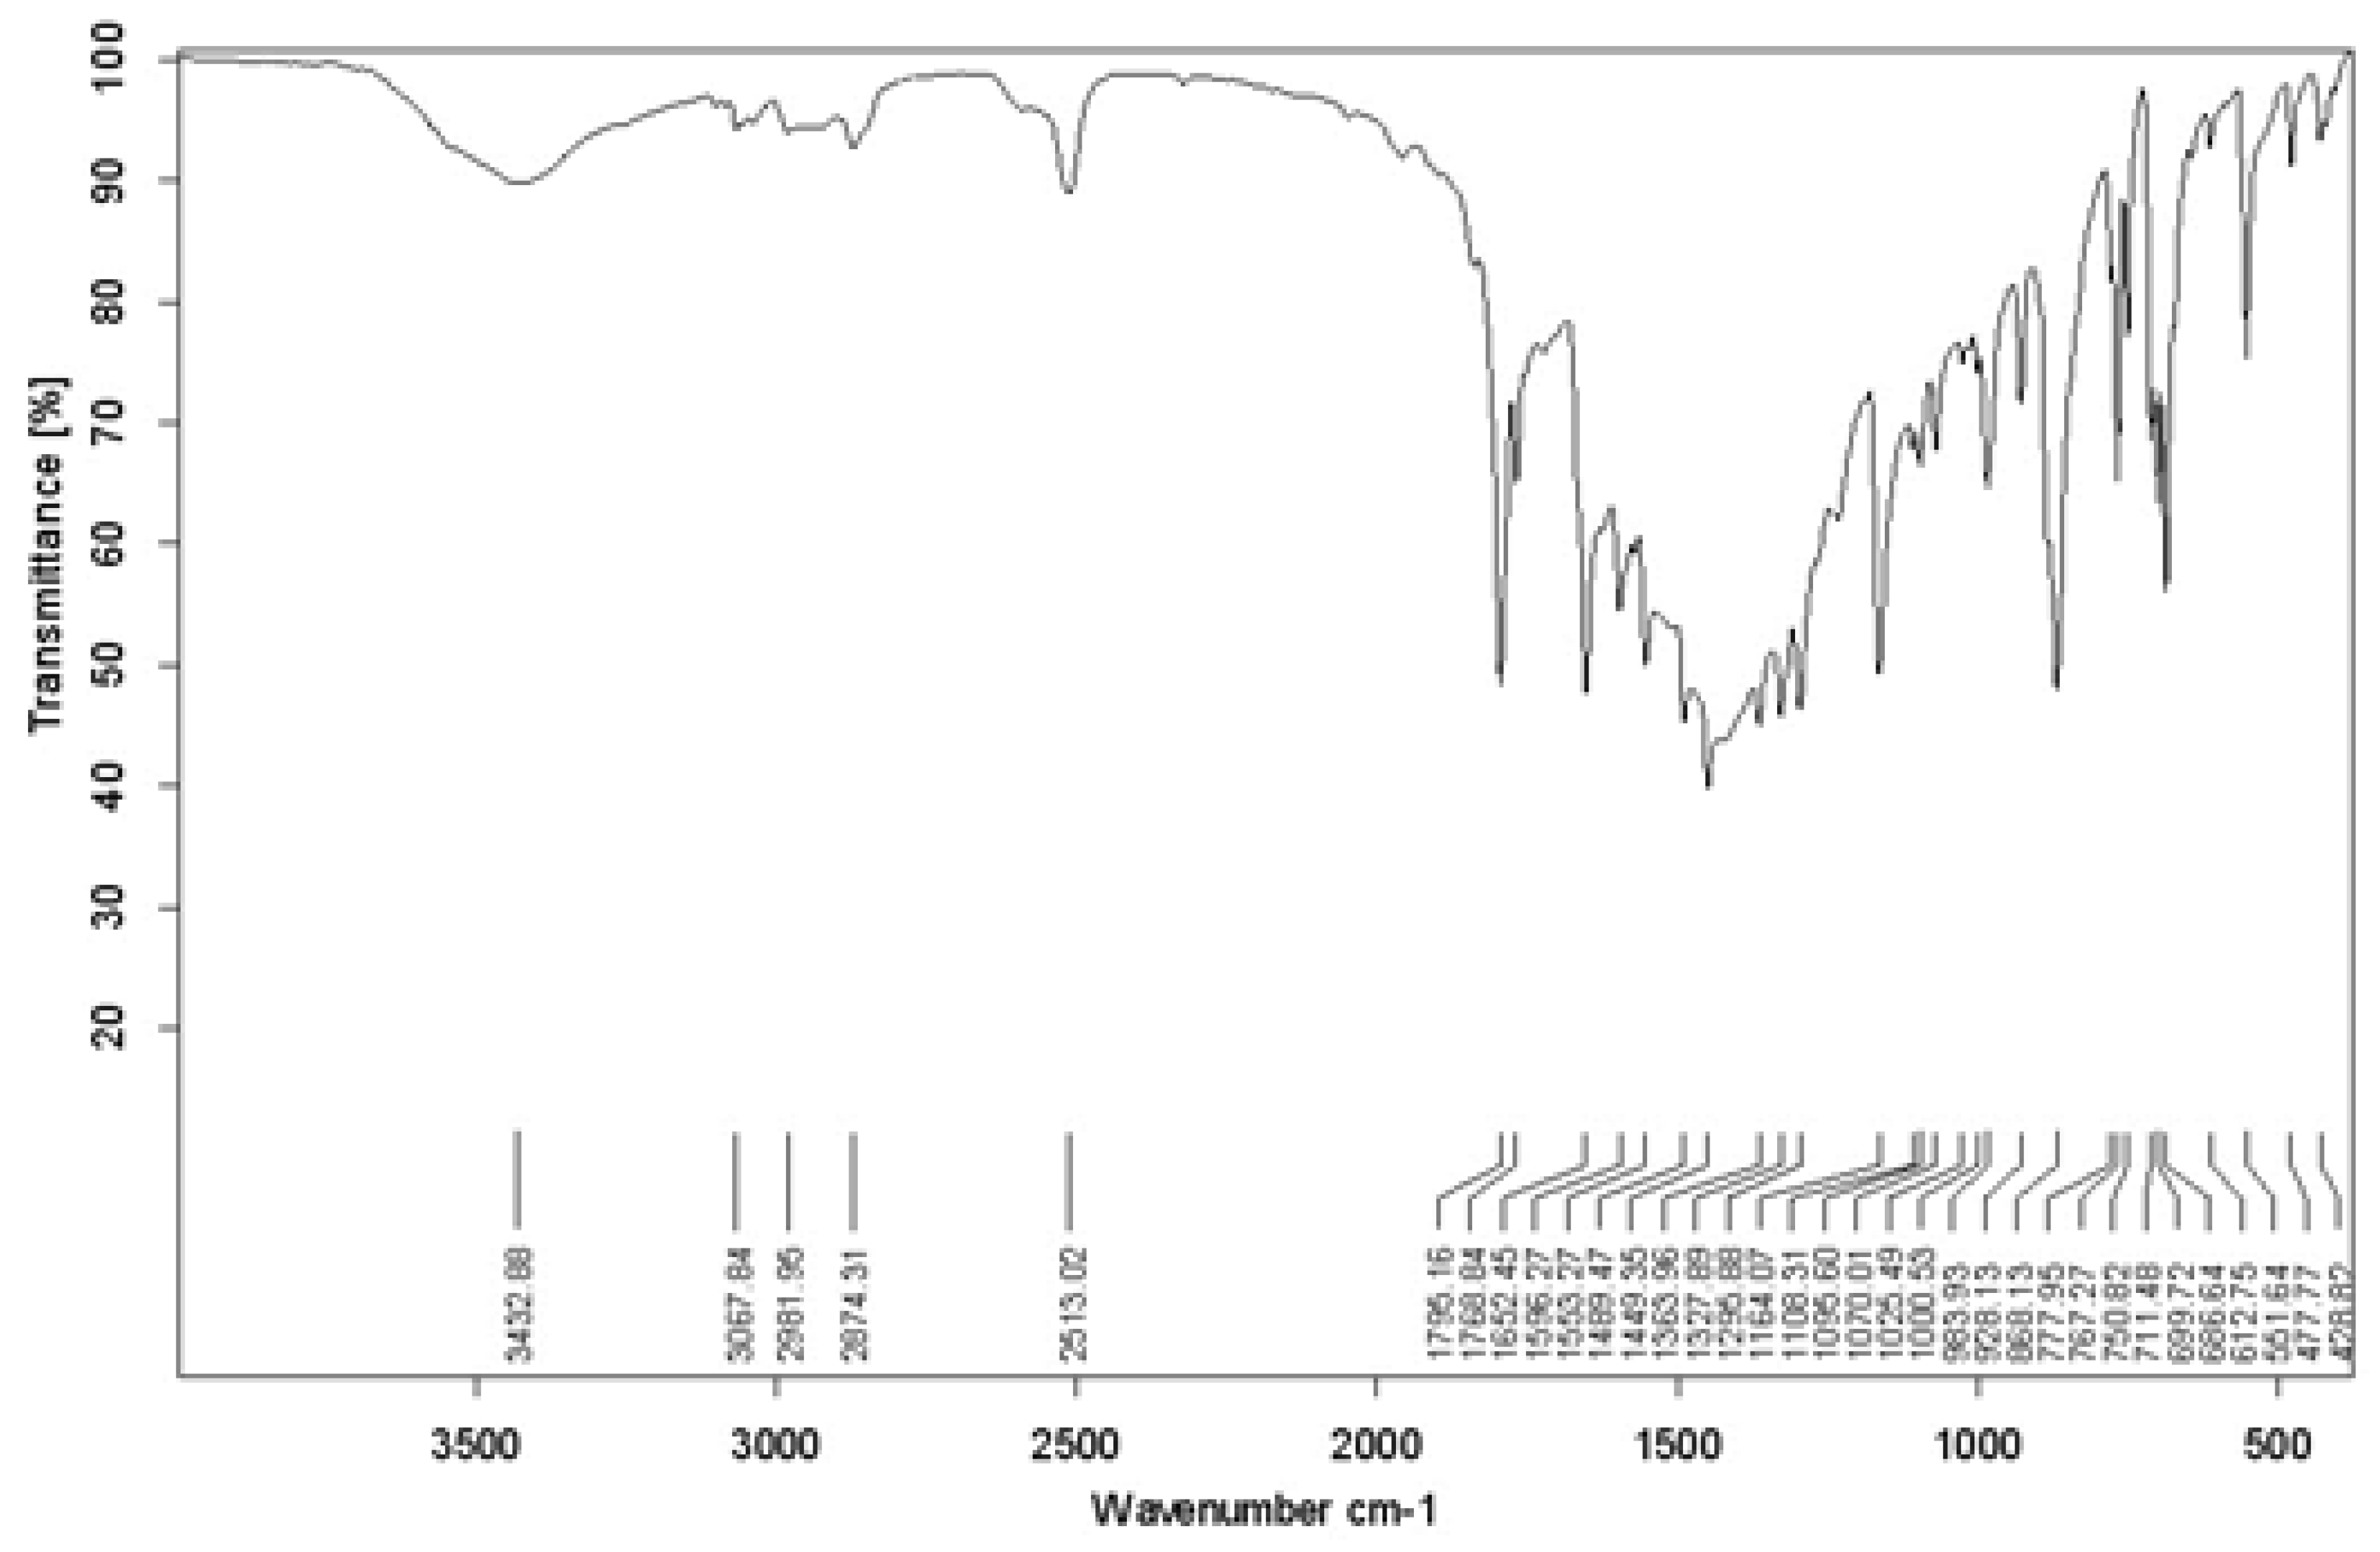
Figure 3.
IR of the substituent -OCH3.
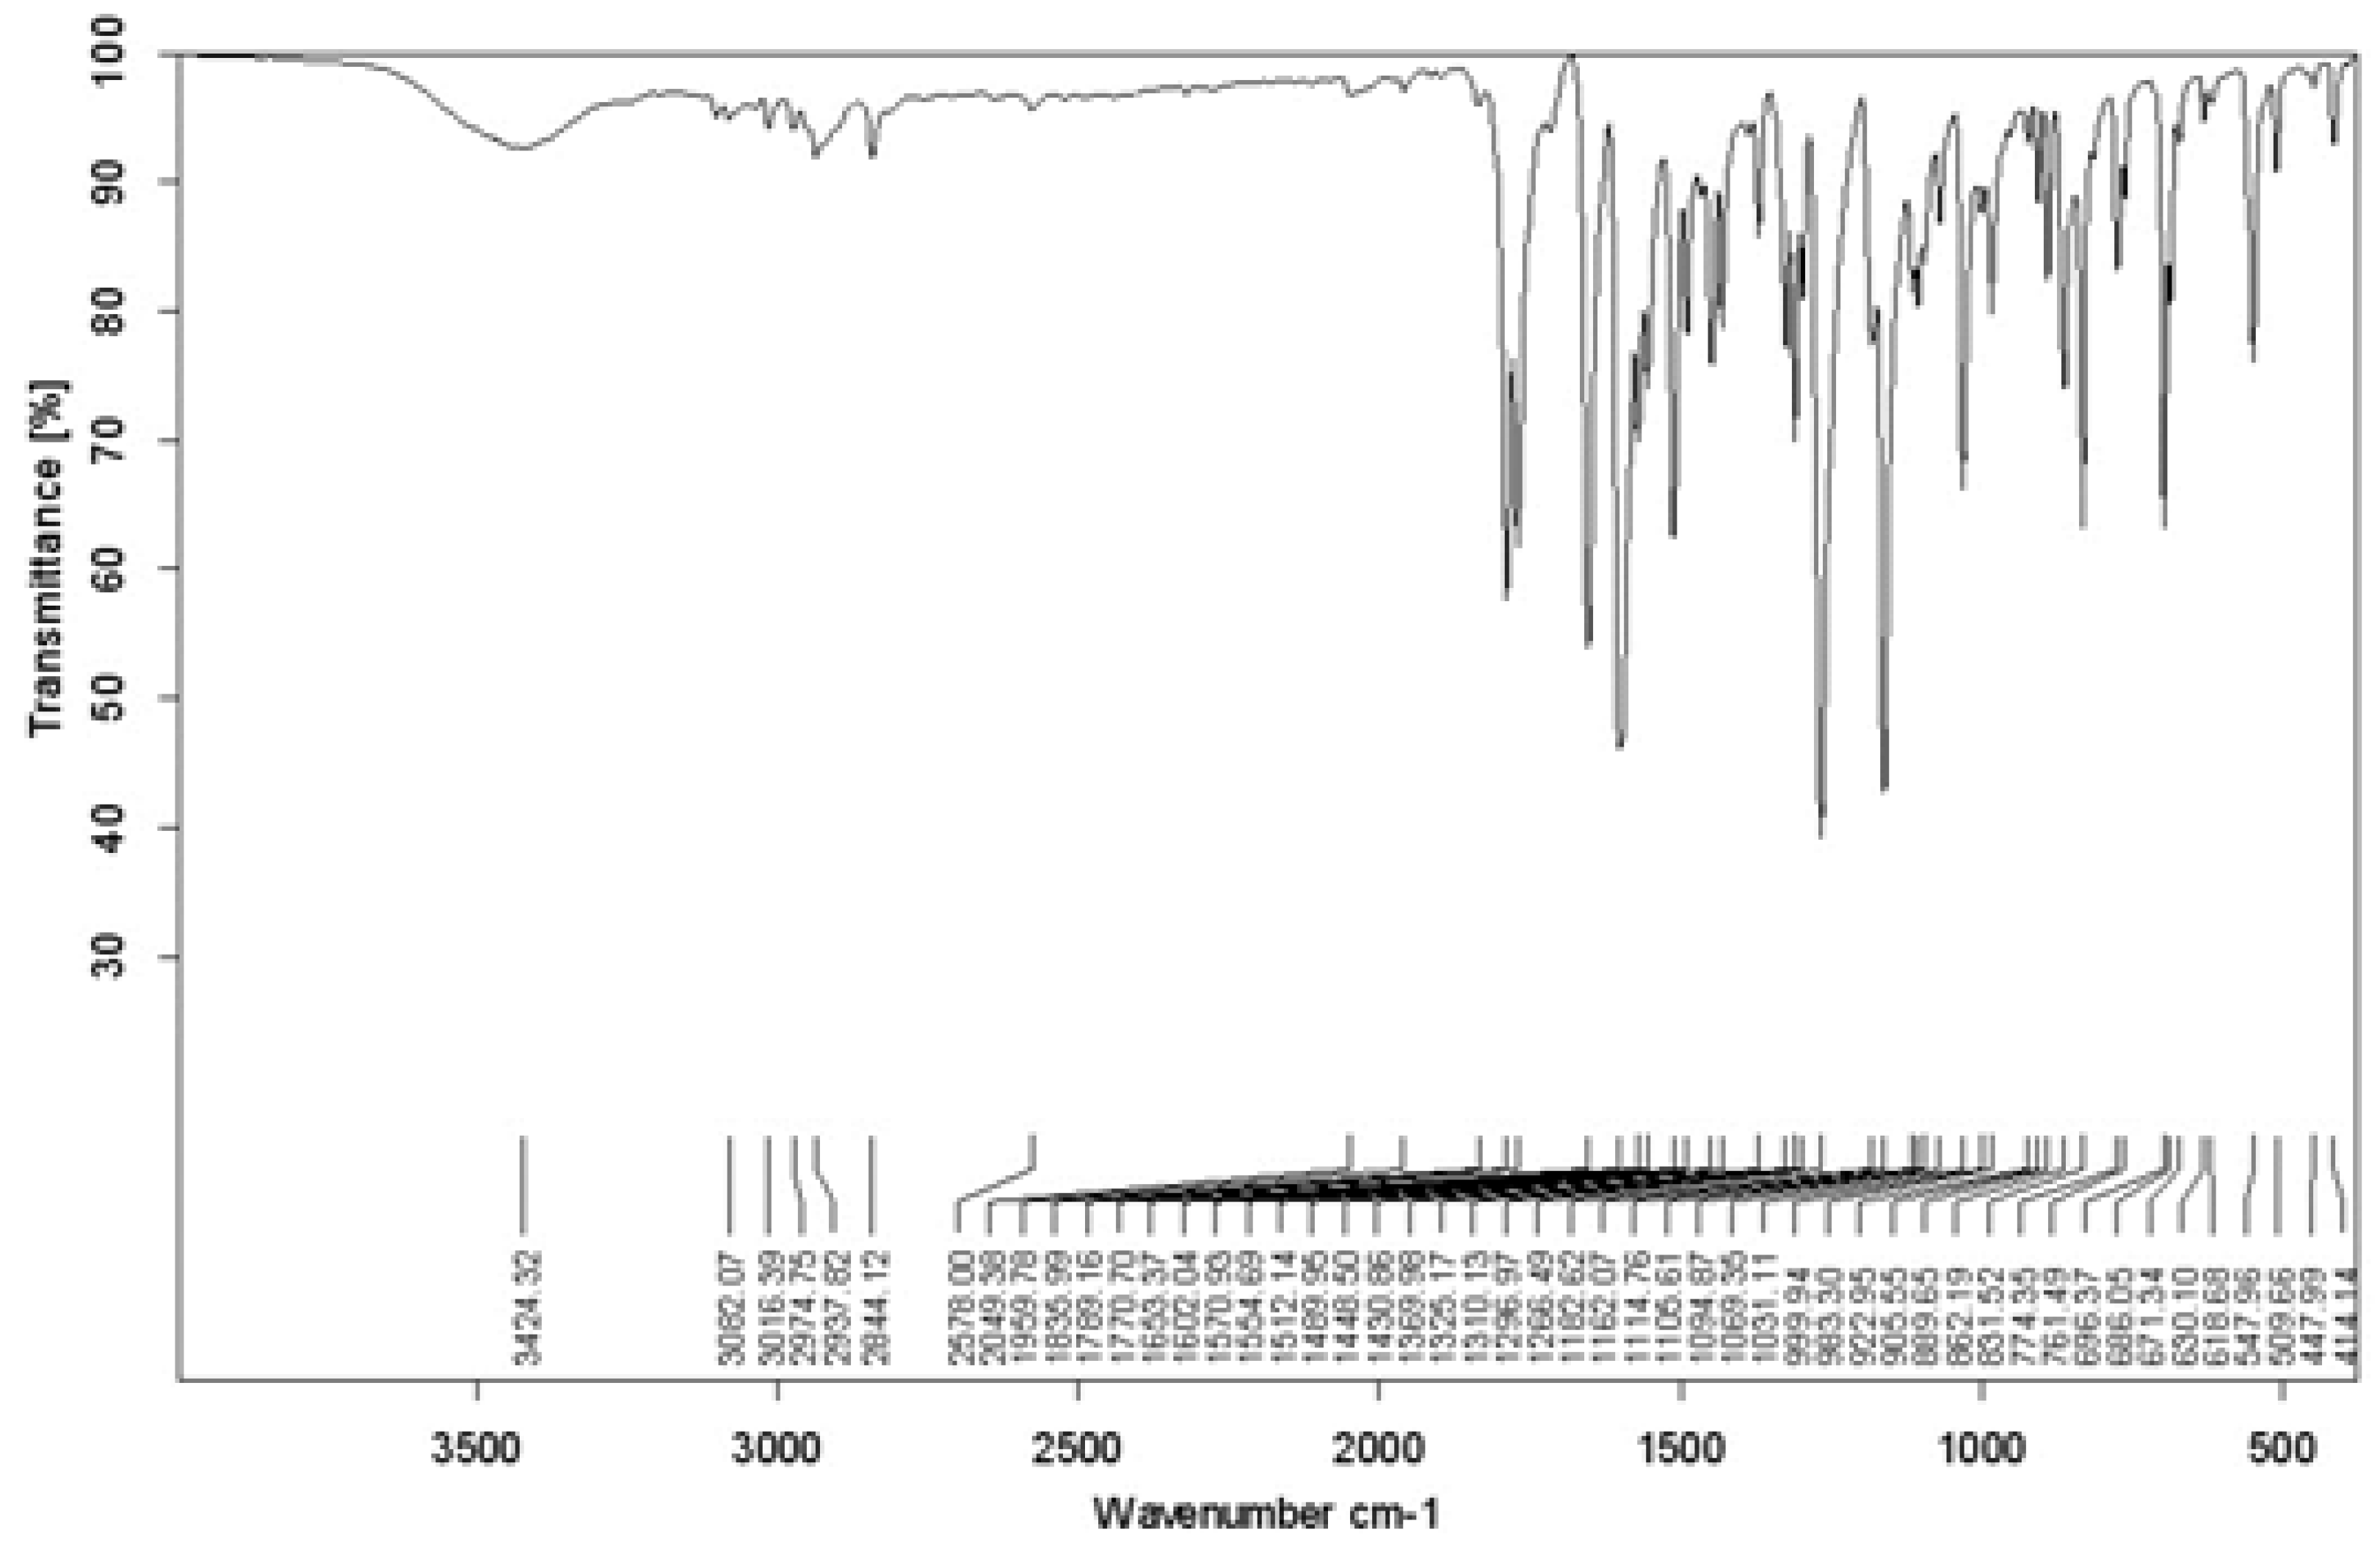
Figure 4.
Spectrum of the substituent -H.

Figure 5.
Spectrum of the substituent -OCH3.
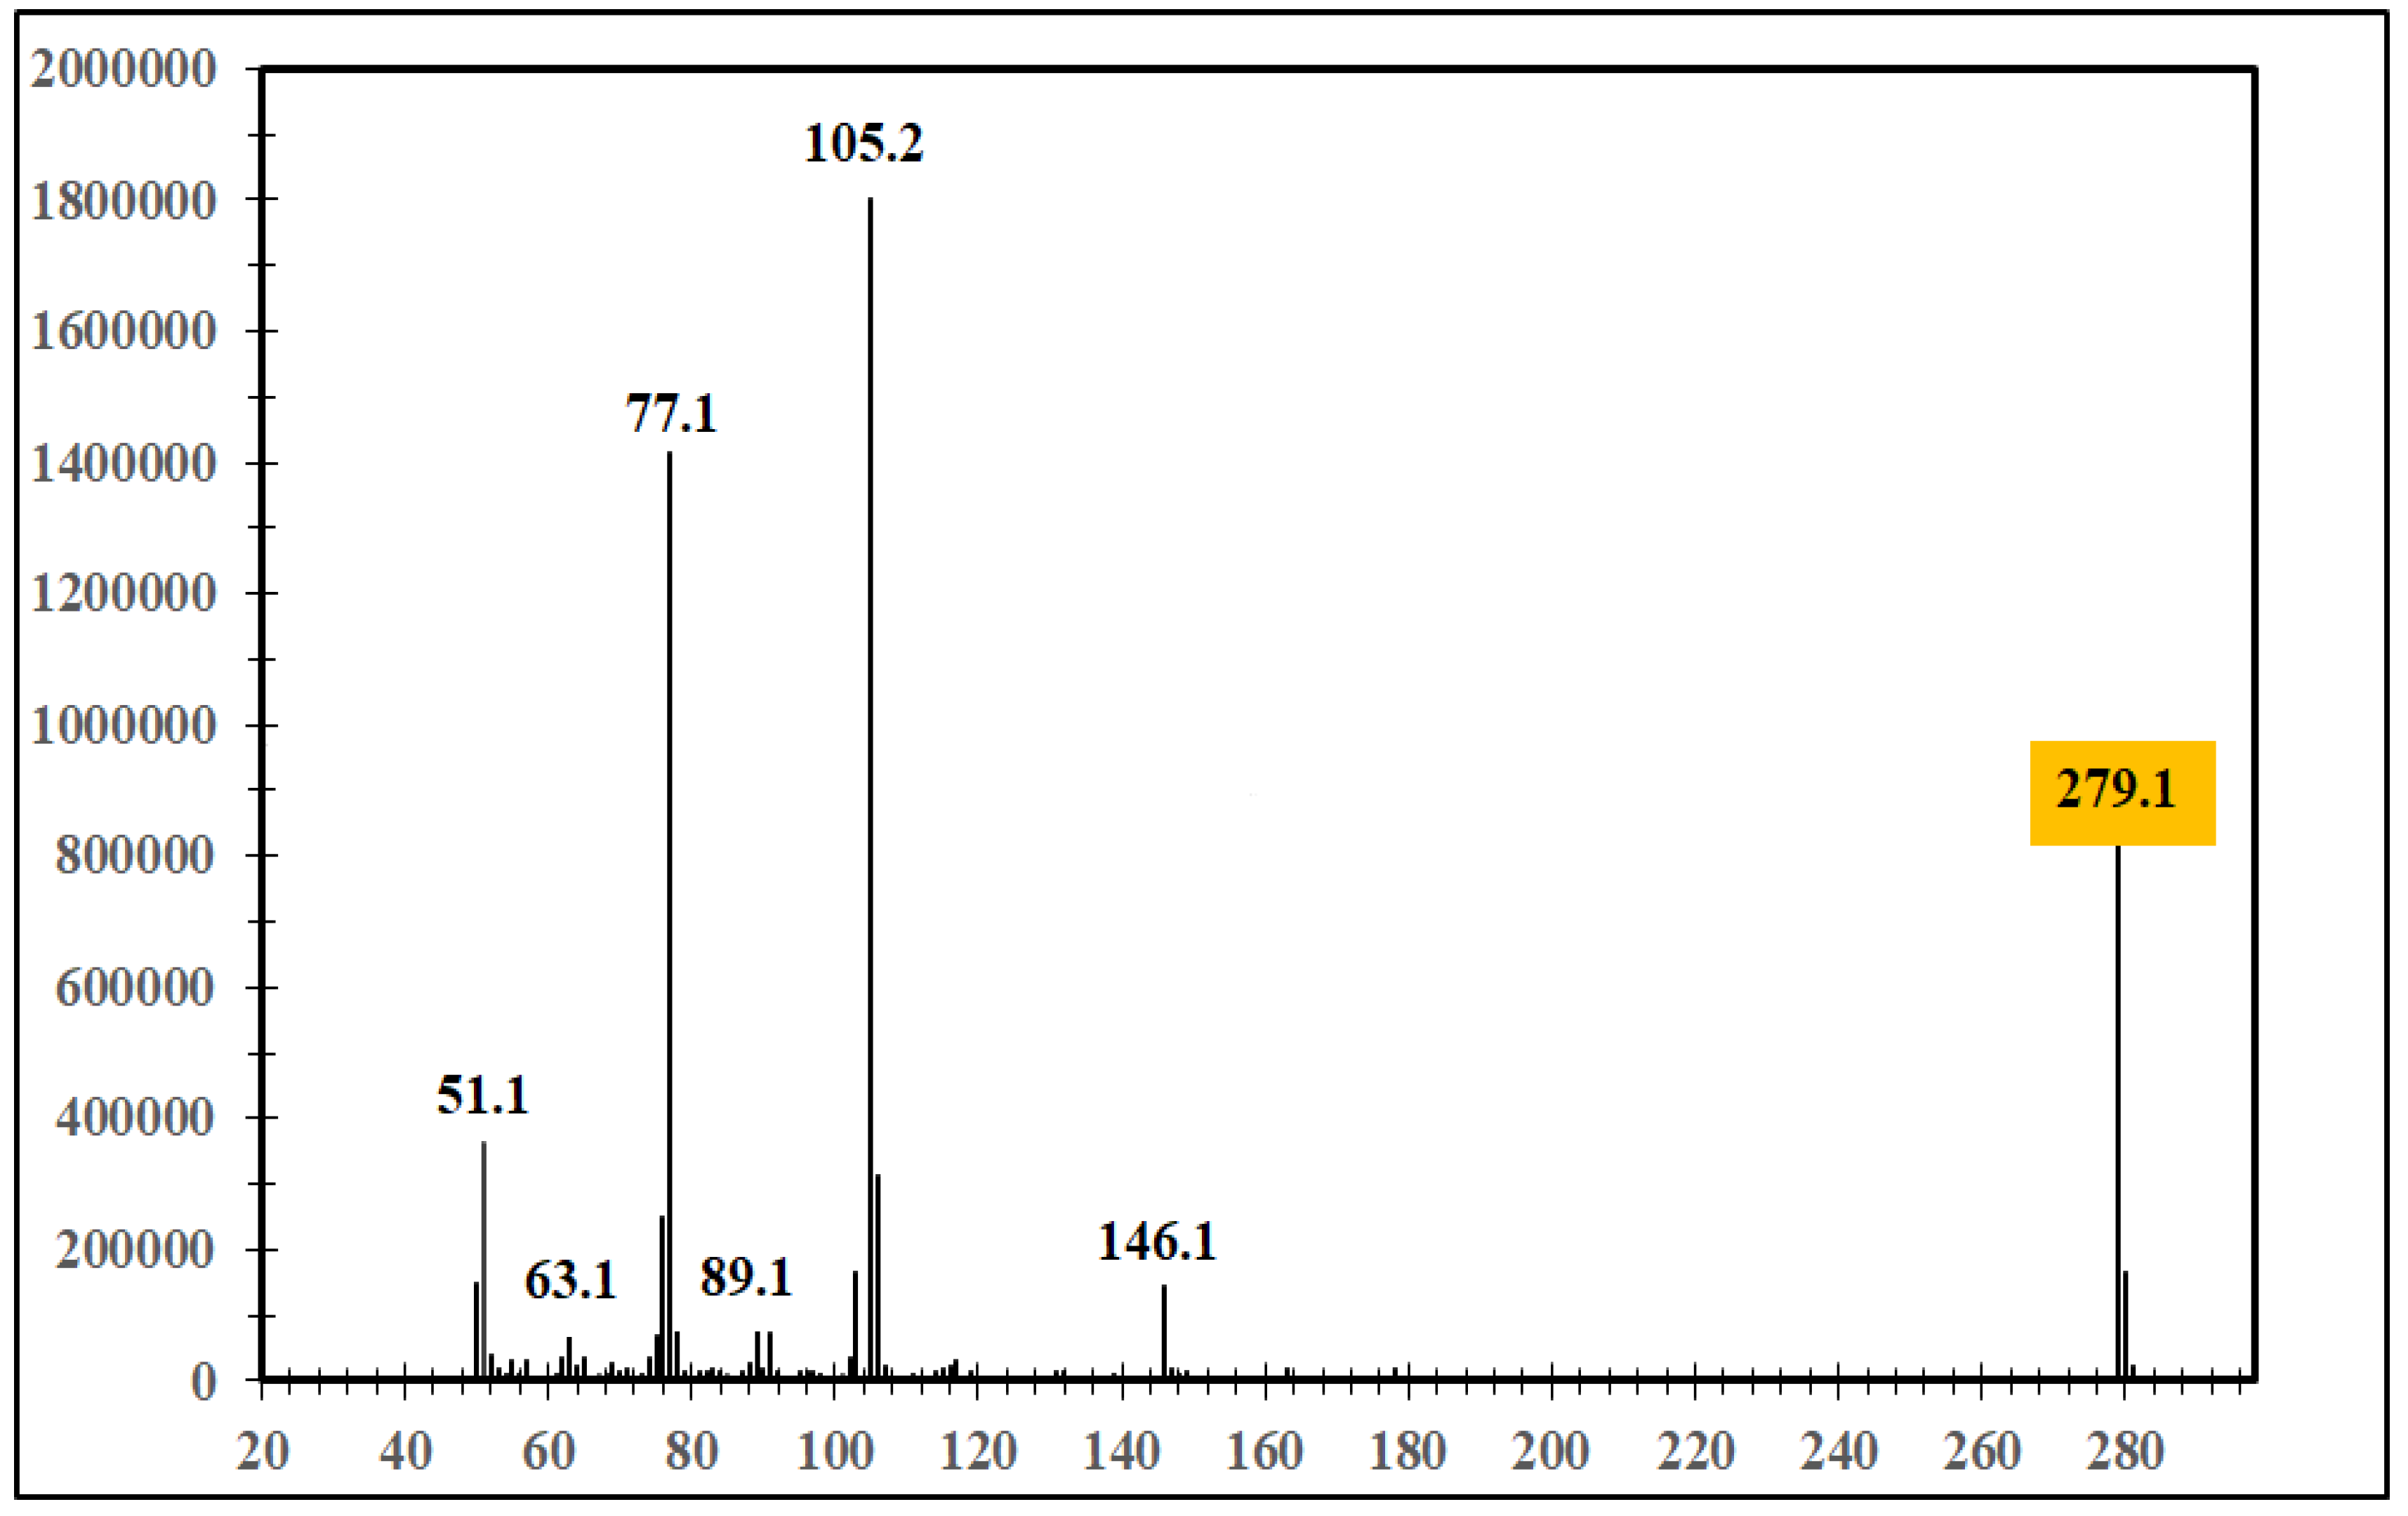
Figure 7.
Fluorescence and excitation spectrum of unsubstituted oxazolone in ethyl acetate.
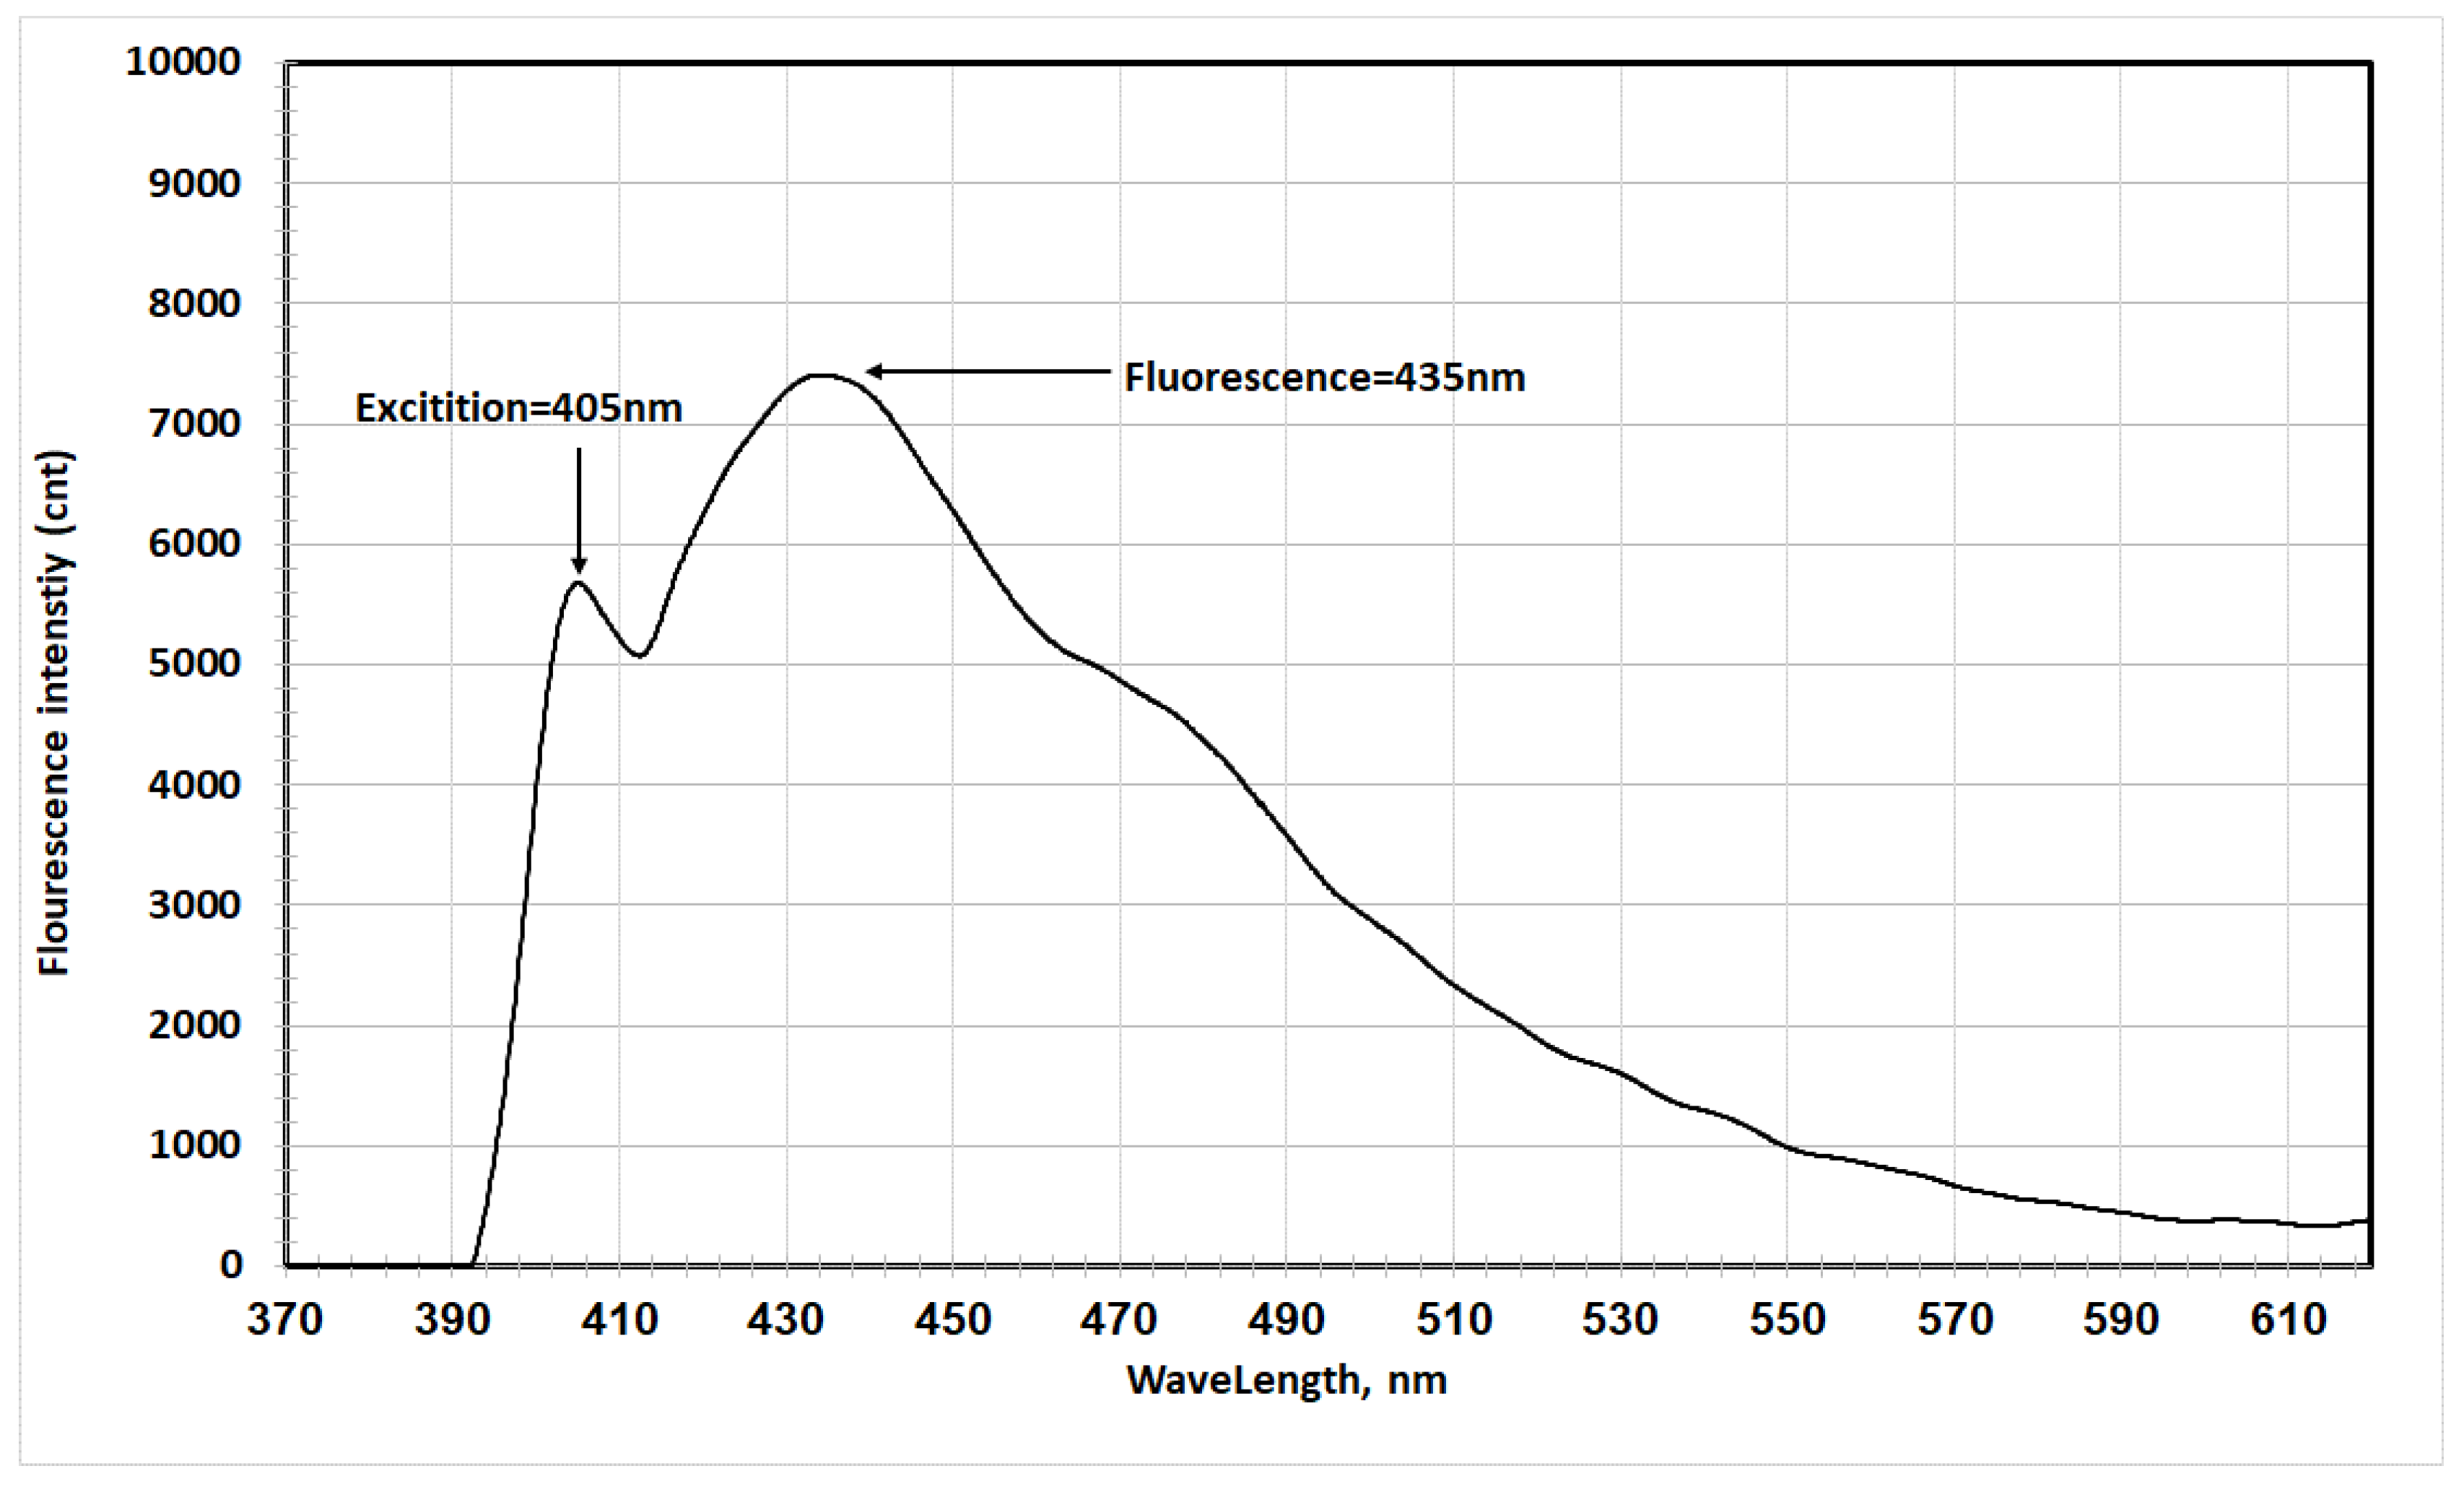
Figure 8.
Fluorescence and excitation spectrum of unsubstituted oxazolone in acetic acid.
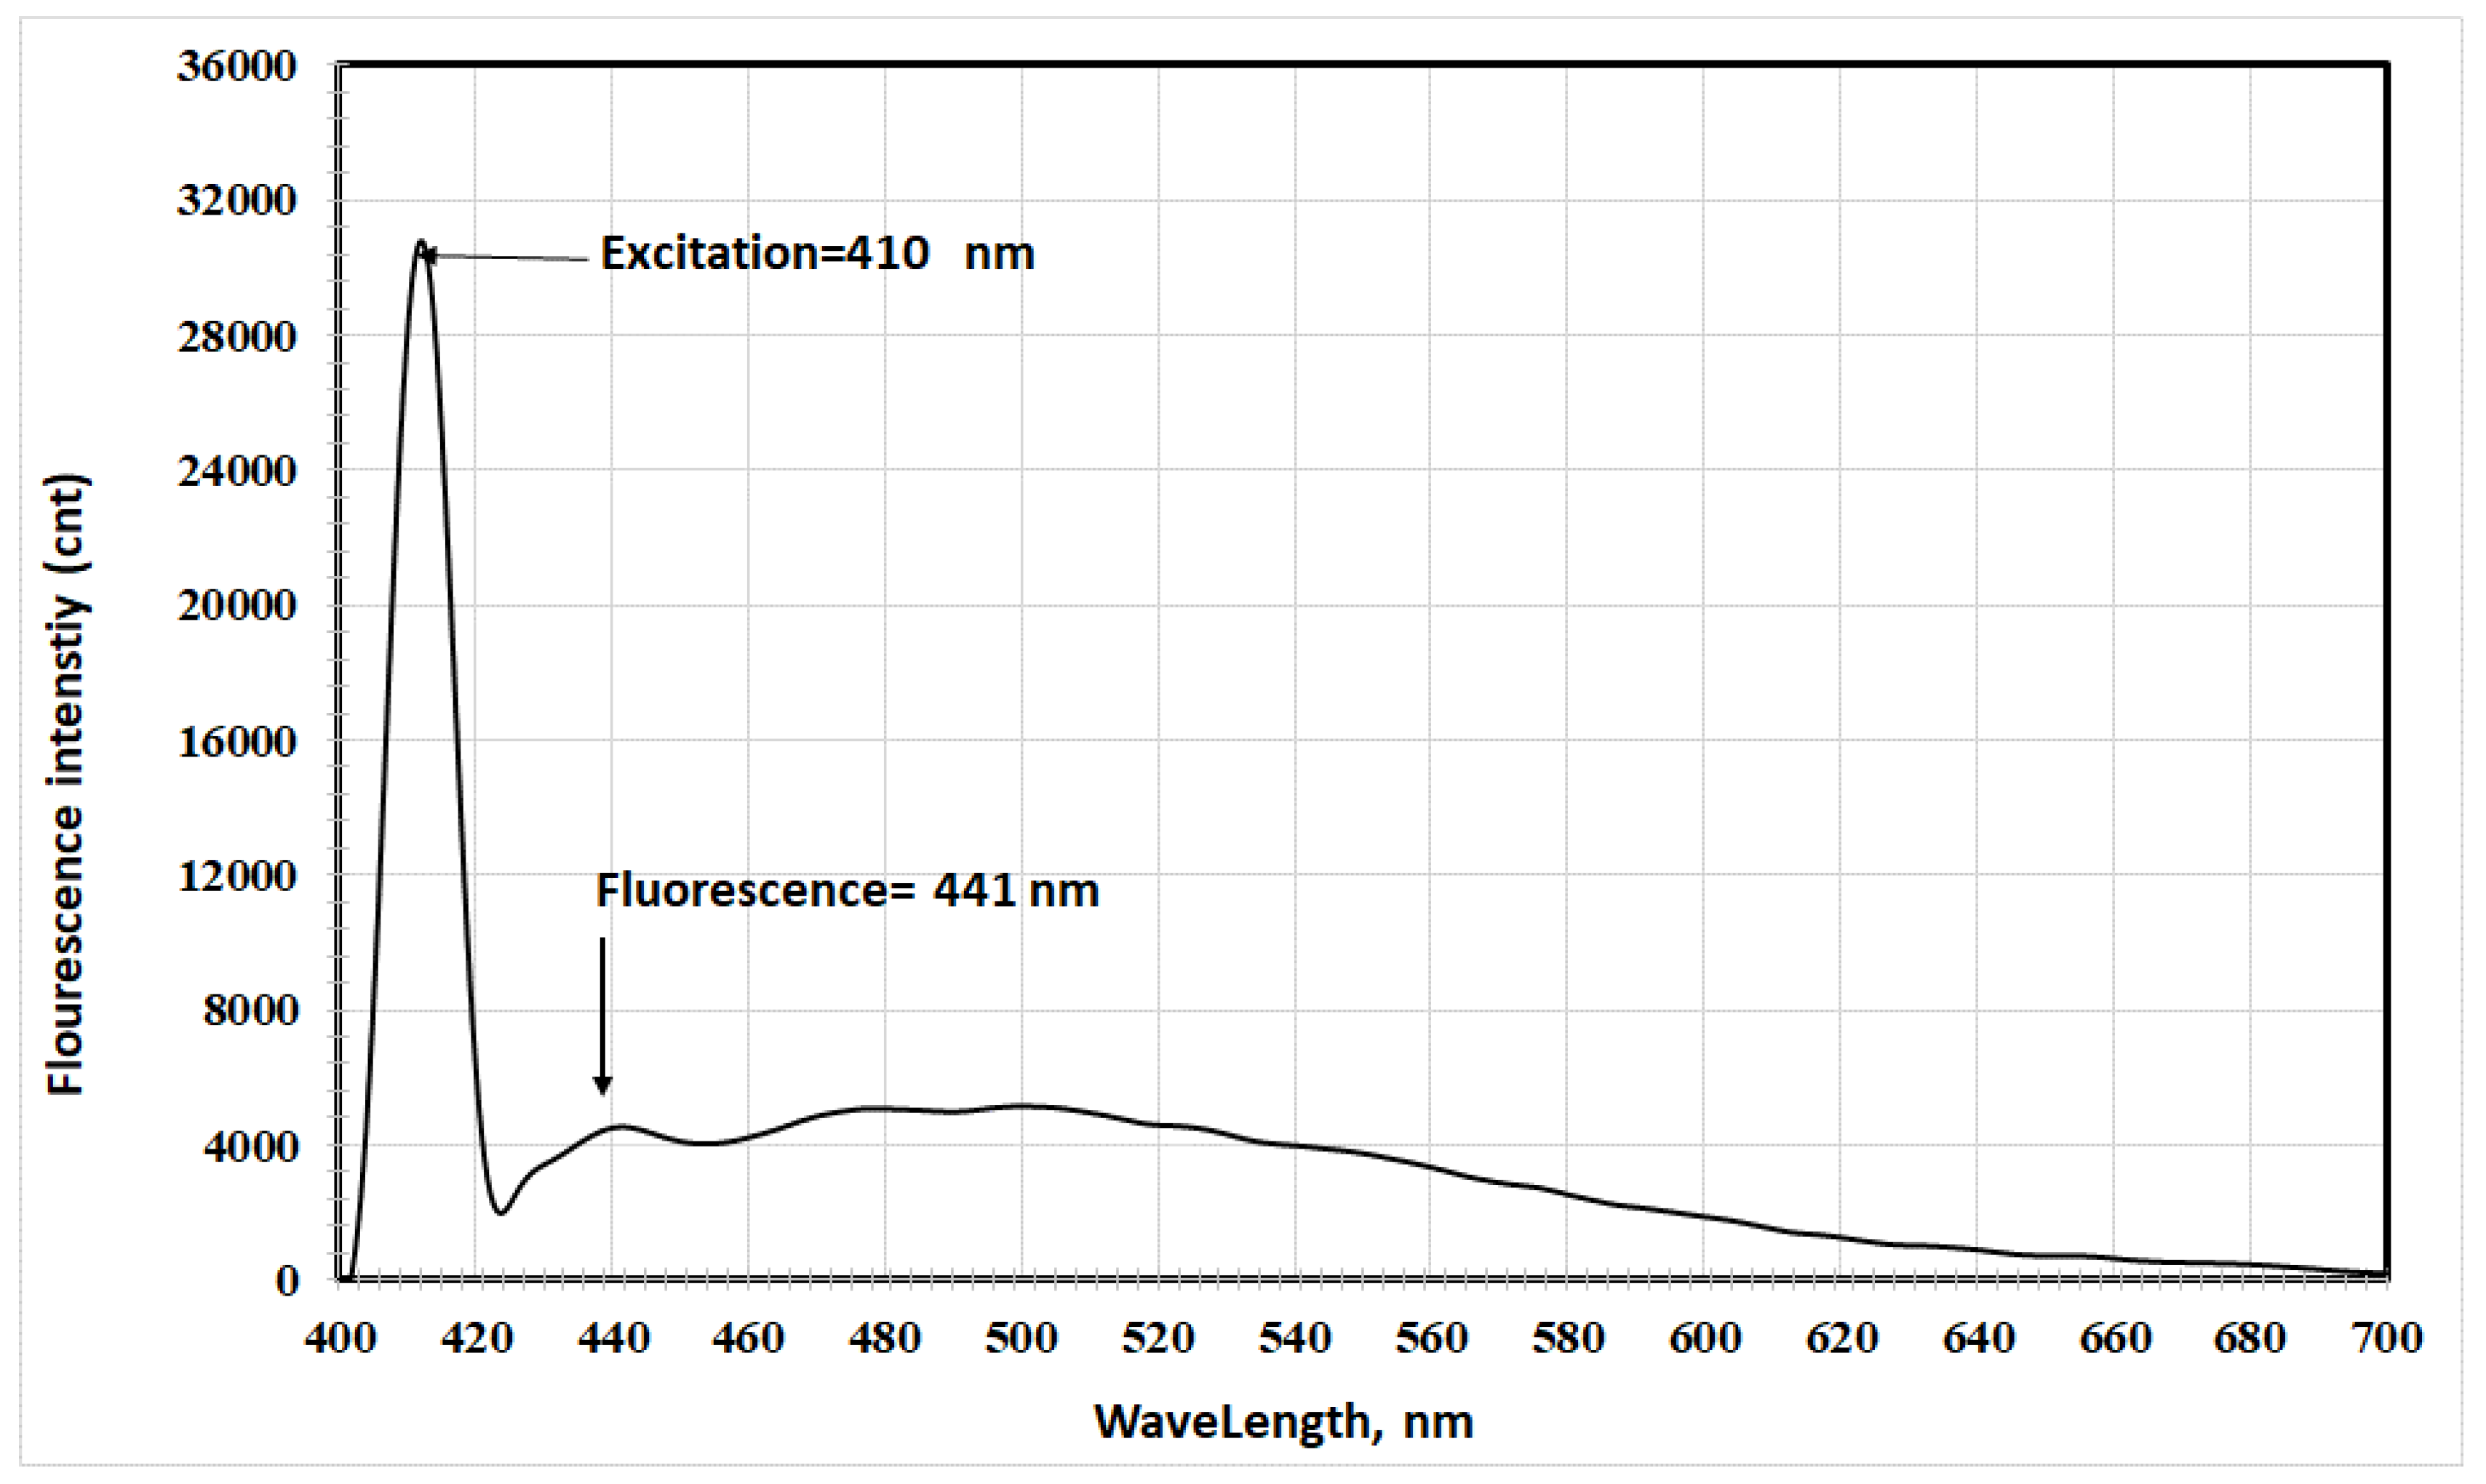
Figure 9.
Fluorescence and excitation spectrum of unsubstituted oxazolone in acetonitrile.
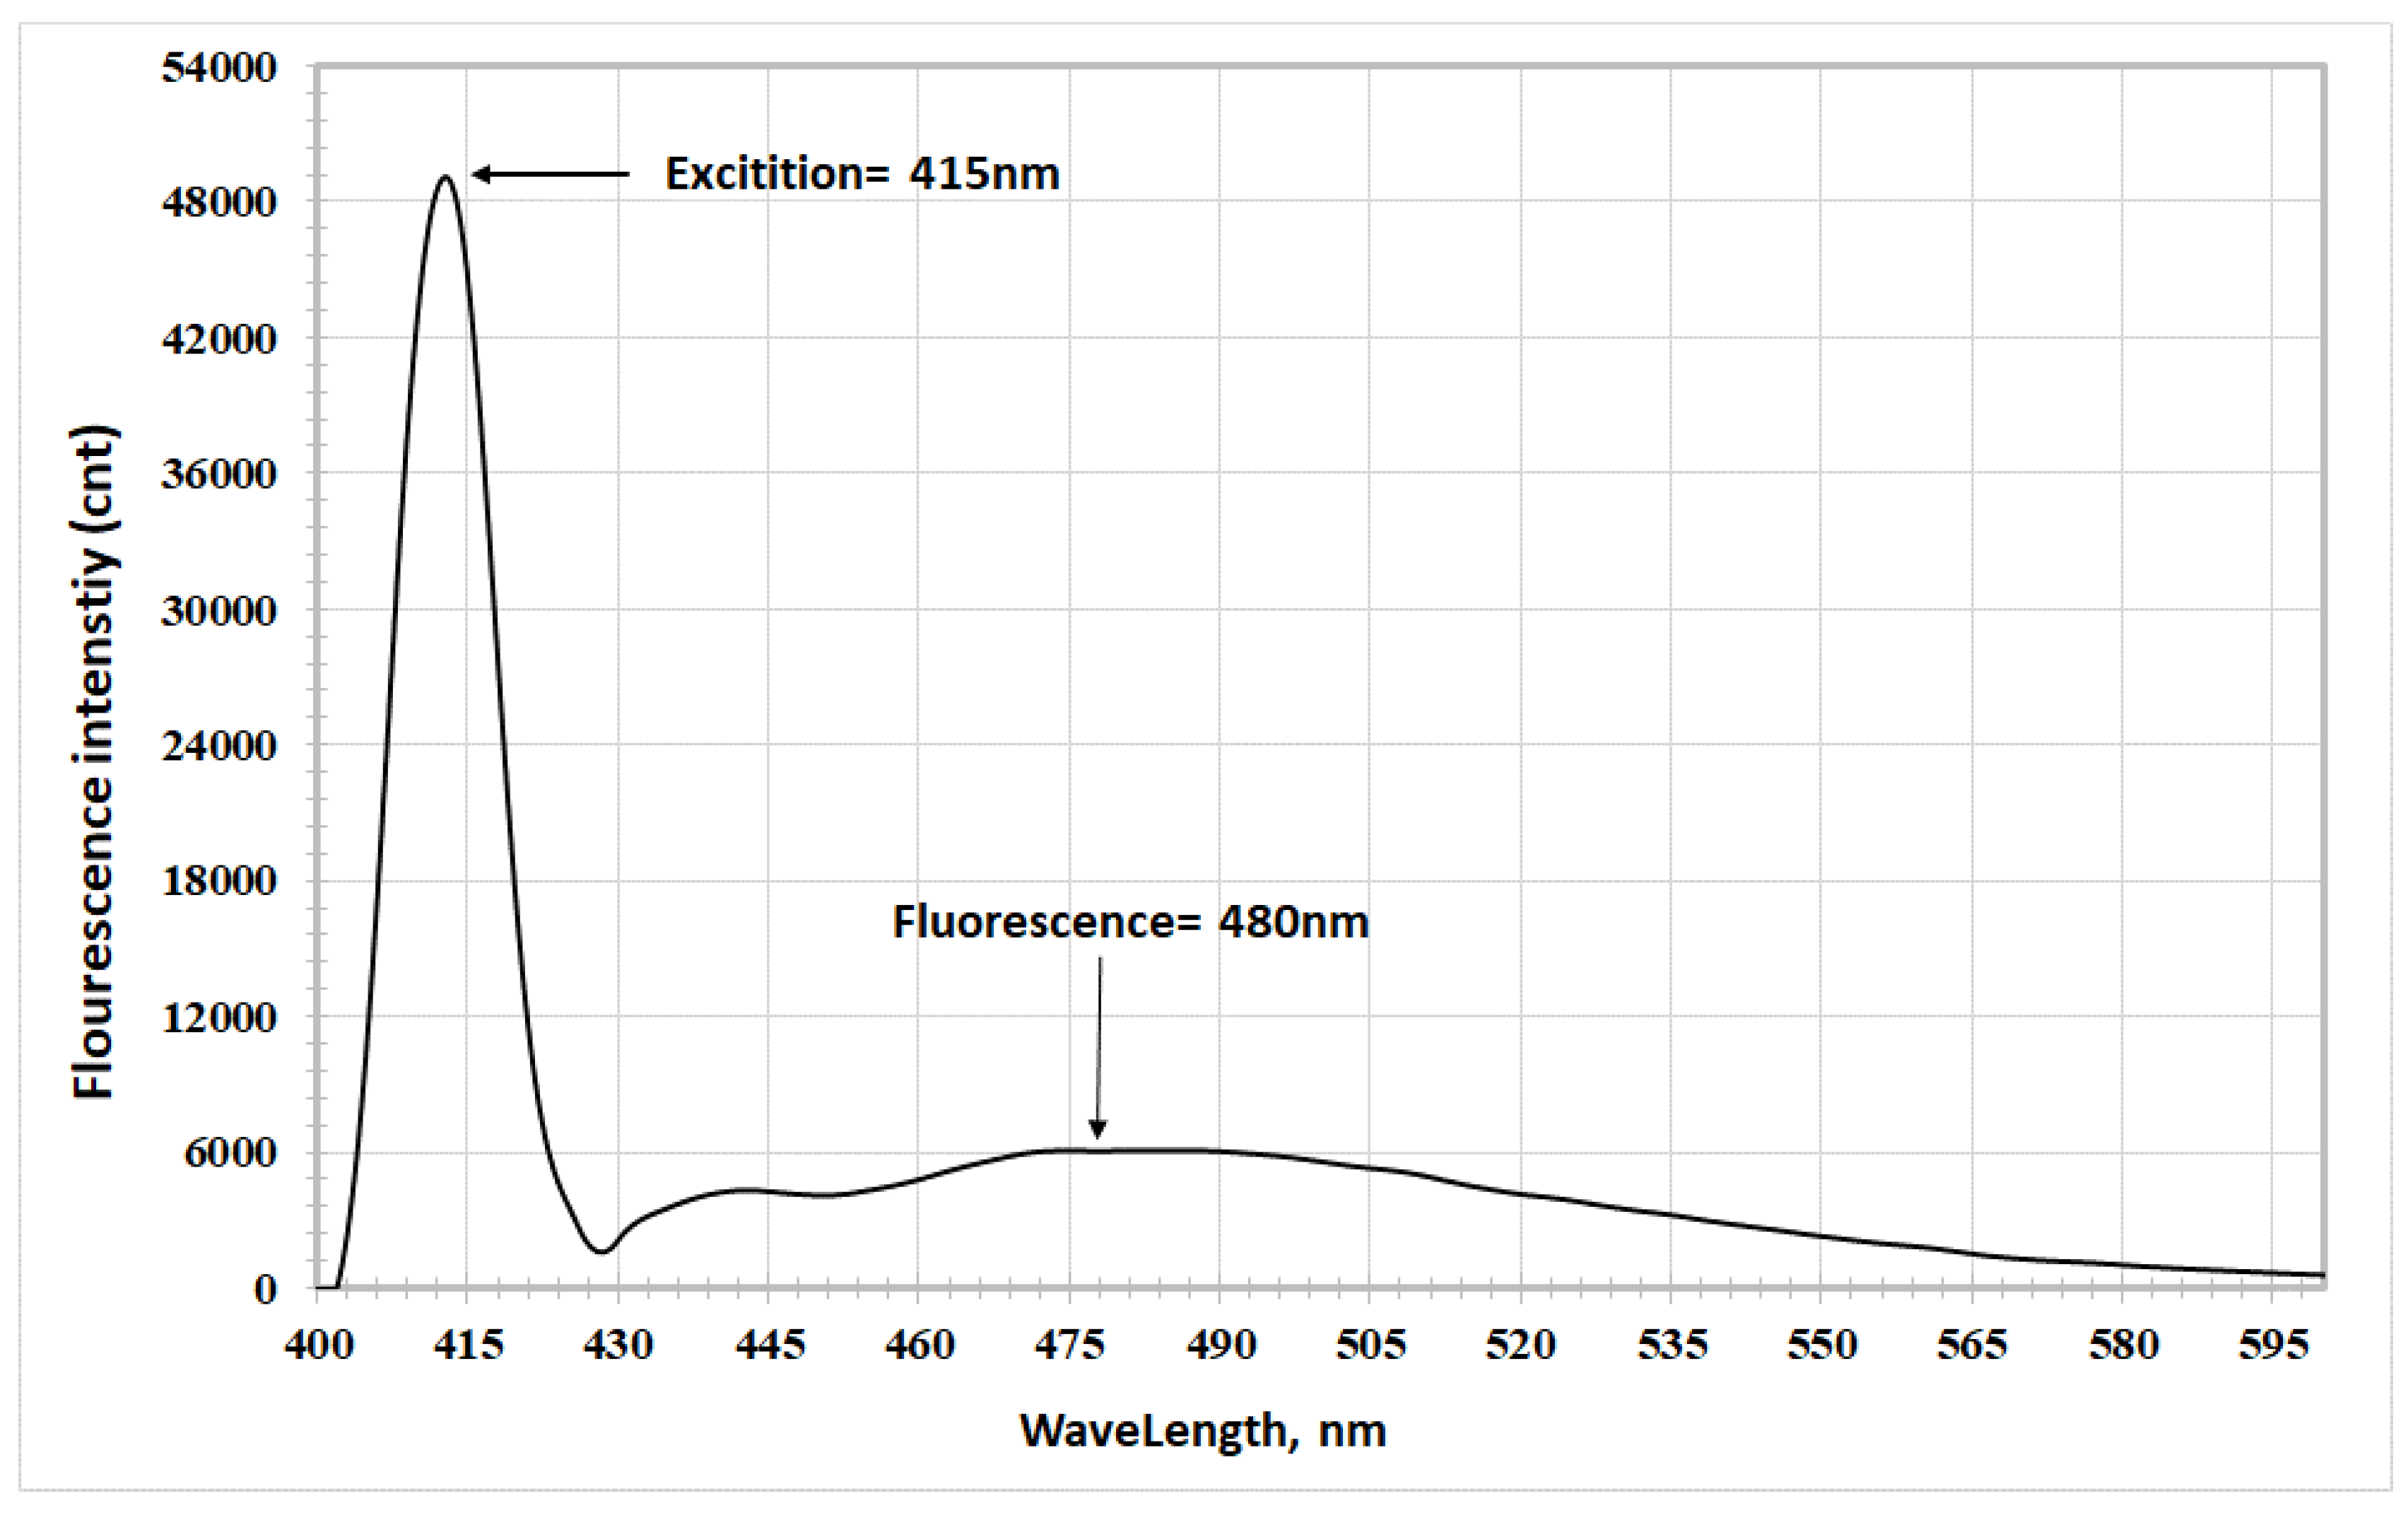
Figure 10.
Fluorescence and excitation spectrum of methoxy-substituted oxazolone in ethyl acetate.

Figure 11.
Fluorescence and excitation spectrum of methoxy-substituted oxazolone in acetic acid.
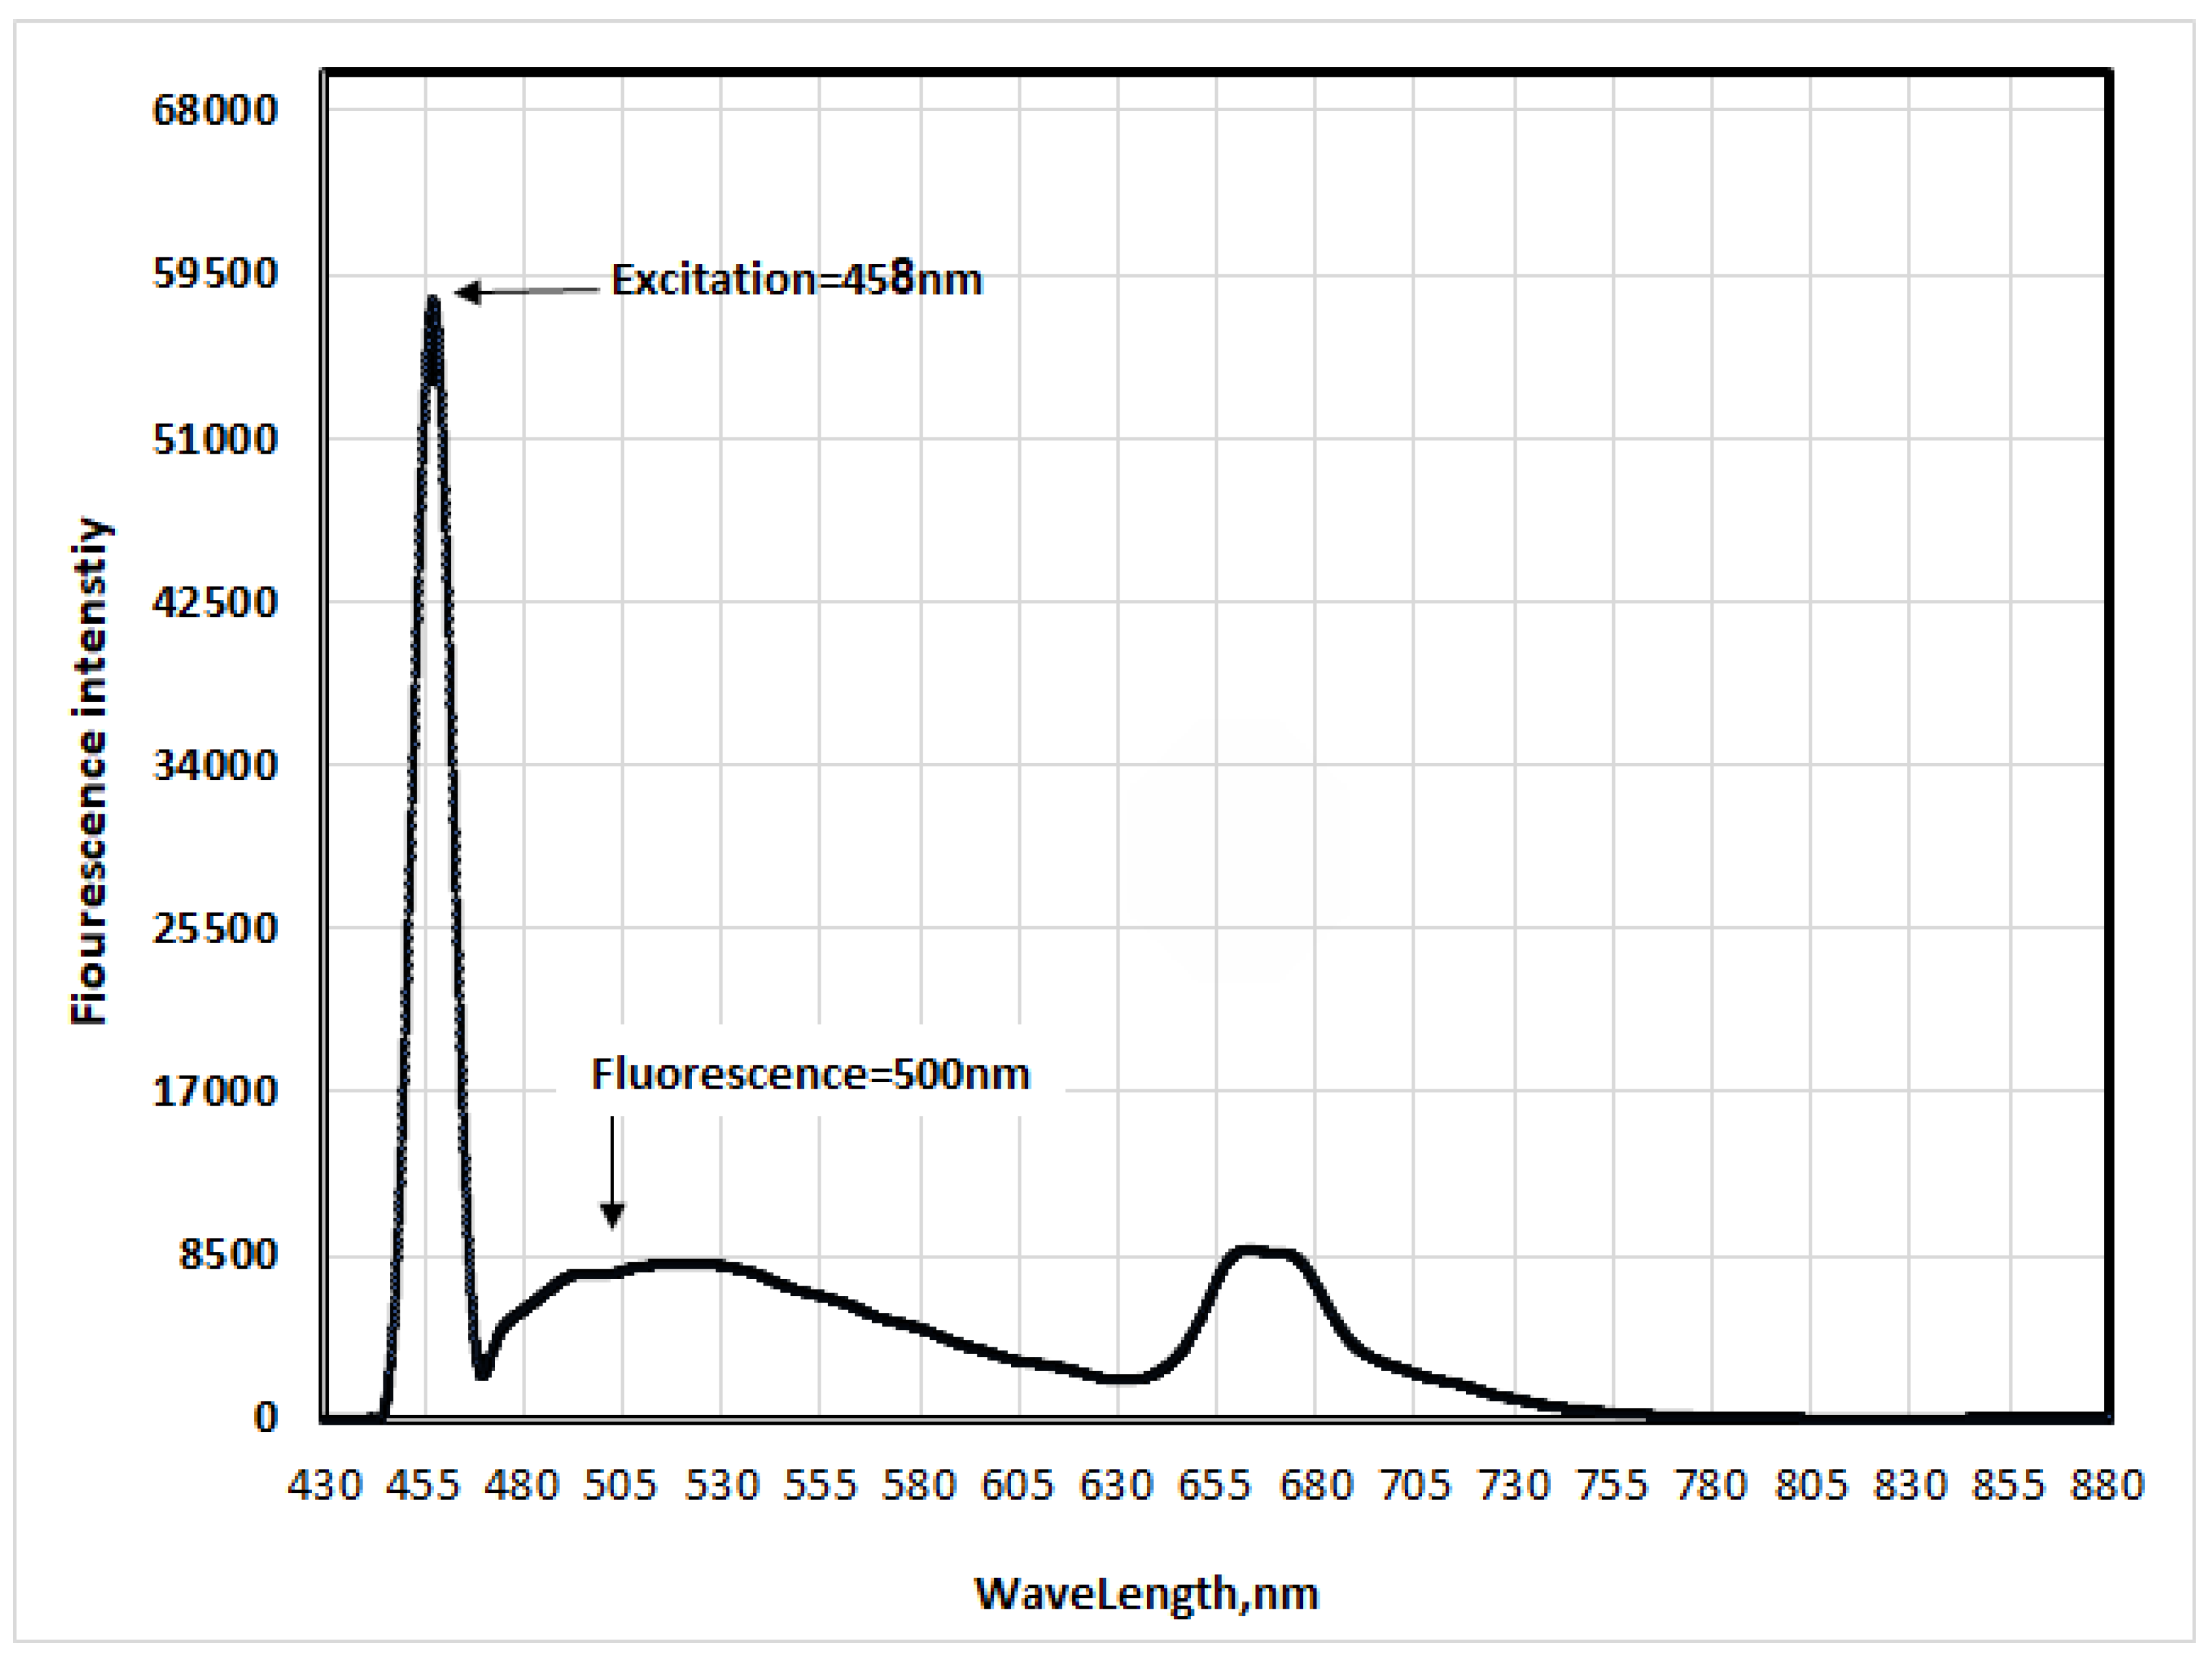
Figure 12.
Fluorescence and excitation spectrum of methoxy-substituted oxazolone in acetonitrile.

Figure 13.
Calculate m1 of the oxazolone without substituent by drawing the relationship va-vf in terms of F2(D, n).
Figure 13.
Calculate m1 of the oxazolone without substituent by drawing the relationship va-vf in terms of F2(D, n).

Figure 14.
Calculate m2 of the oxazolone without substituent by drawing the relationship va +vf/2 in terms of F3(D, n).
Figure 14.
Calculate m2 of the oxazolone without substituent by drawing the relationship va +vf/2 in terms of F3(D, n).
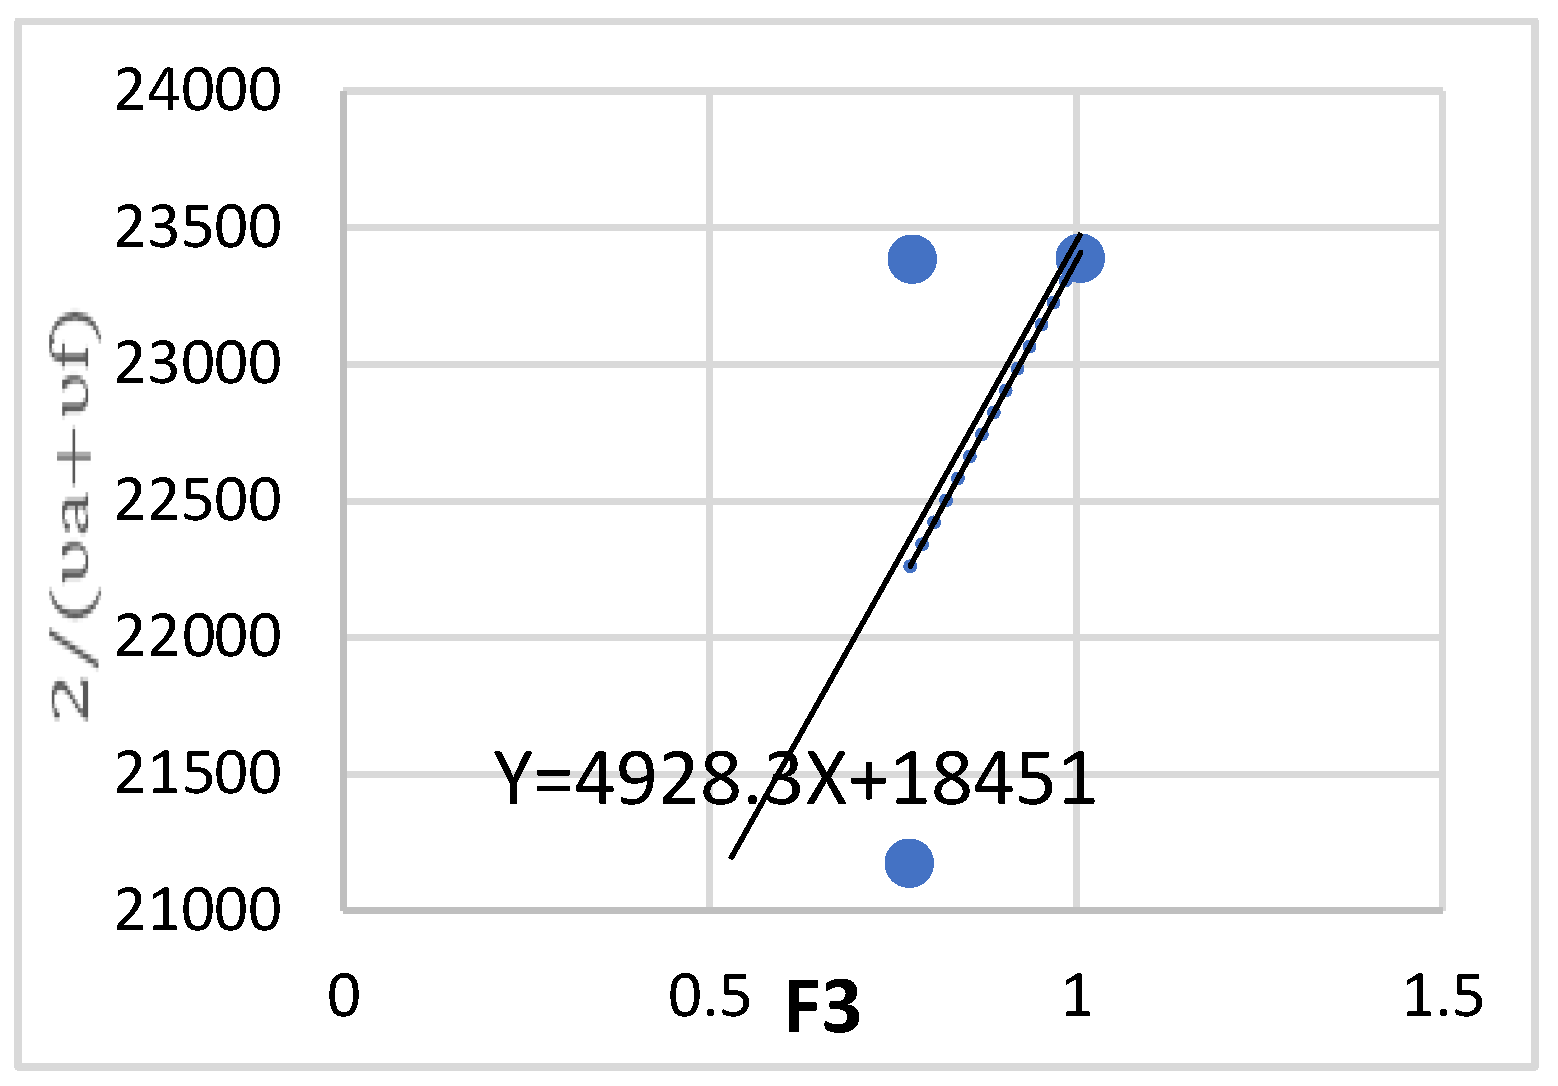
Figure 15.
Calculate the m1 of oxazolone with a substitute methoxy by drawing the relationship va-vf and in terms of F2(D, n).
Figure 15.
Calculate the m1 of oxazolone with a substitute methoxy by drawing the relationship va-vf and in terms of F2(D, n).
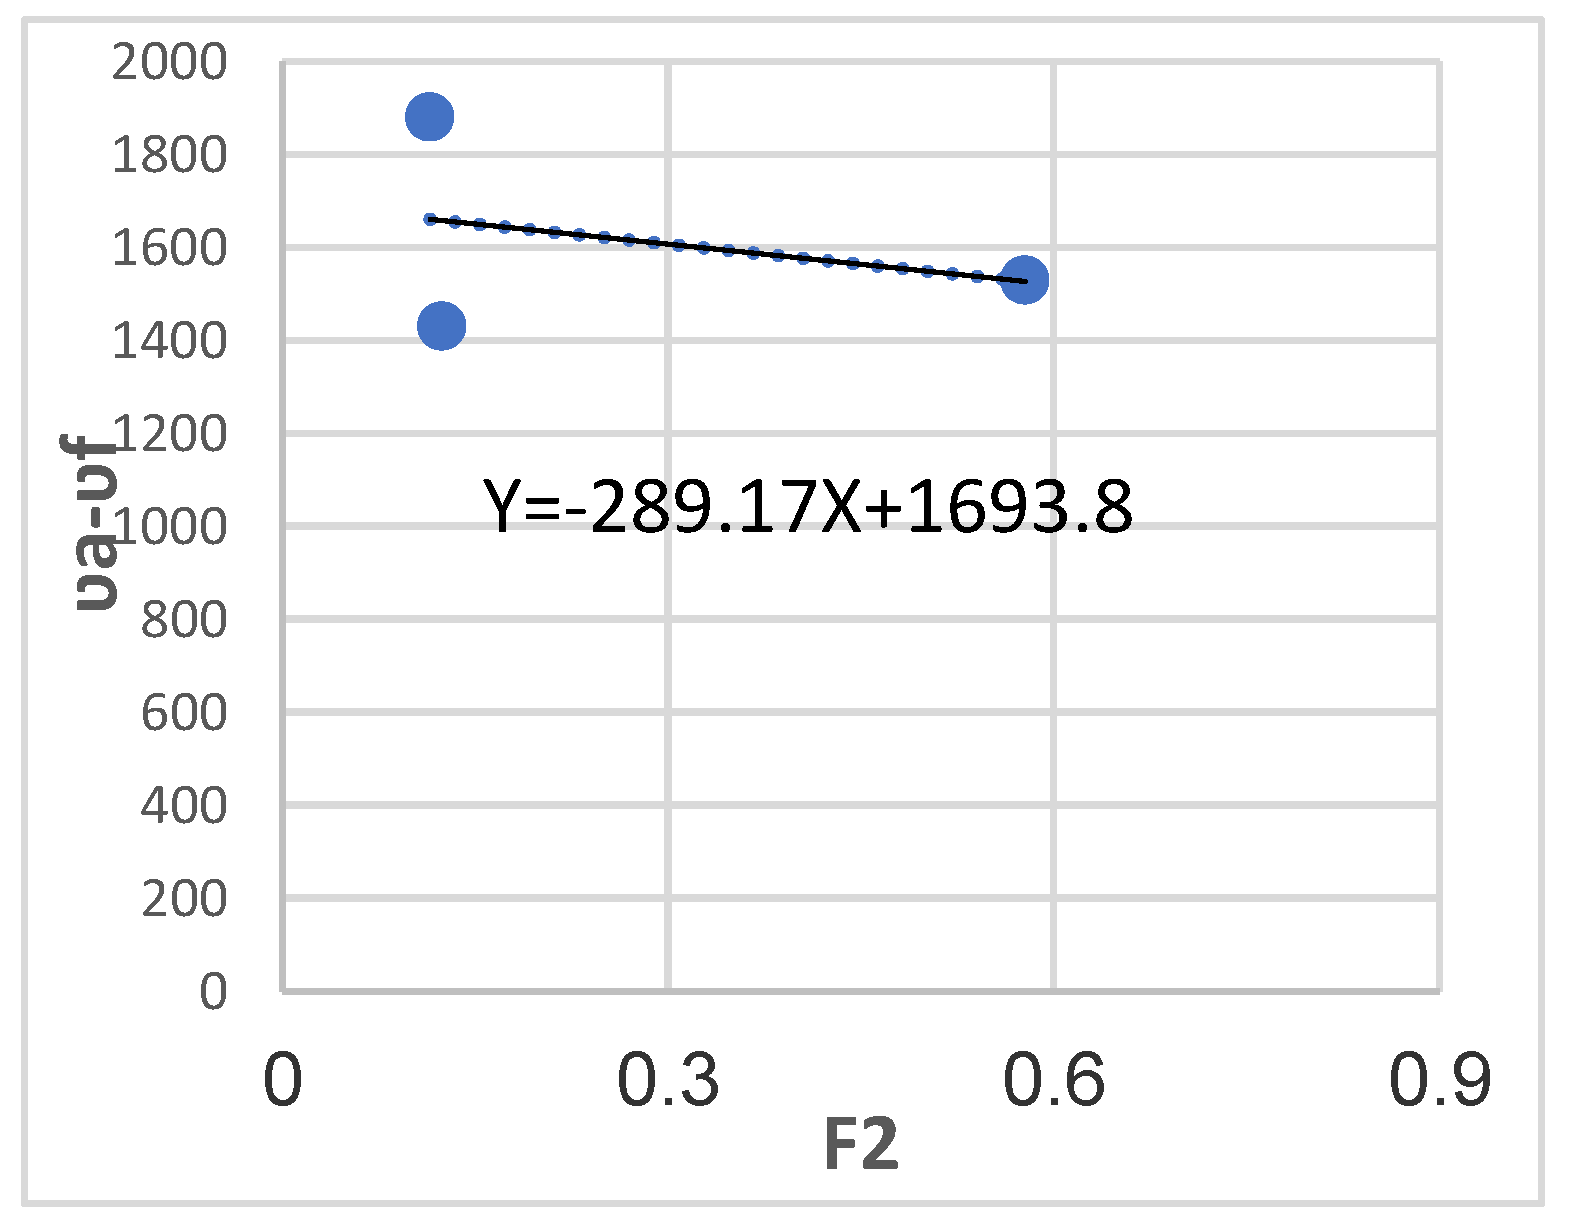
Figure 16.
Calculate the m2 of oxazolone with a substitute methoxy by drawing the relationship va +vf/2 and in terms of F3(D, n).
Figure 16.
Calculate the m2 of oxazolone with a substitute methoxy by drawing the relationship va +vf/2 and in terms of F3(D, n).

Figure 17.
Electronic absorption spectrum of 4-benzylidene-2-phenyl-5(4H)-oxazolone in methanol and n-hexane.
Figure 17.
Electronic absorption spectrum of 4-benzylidene-2-phenyl-5(4H)-oxazolone in methanol and n-hexane.
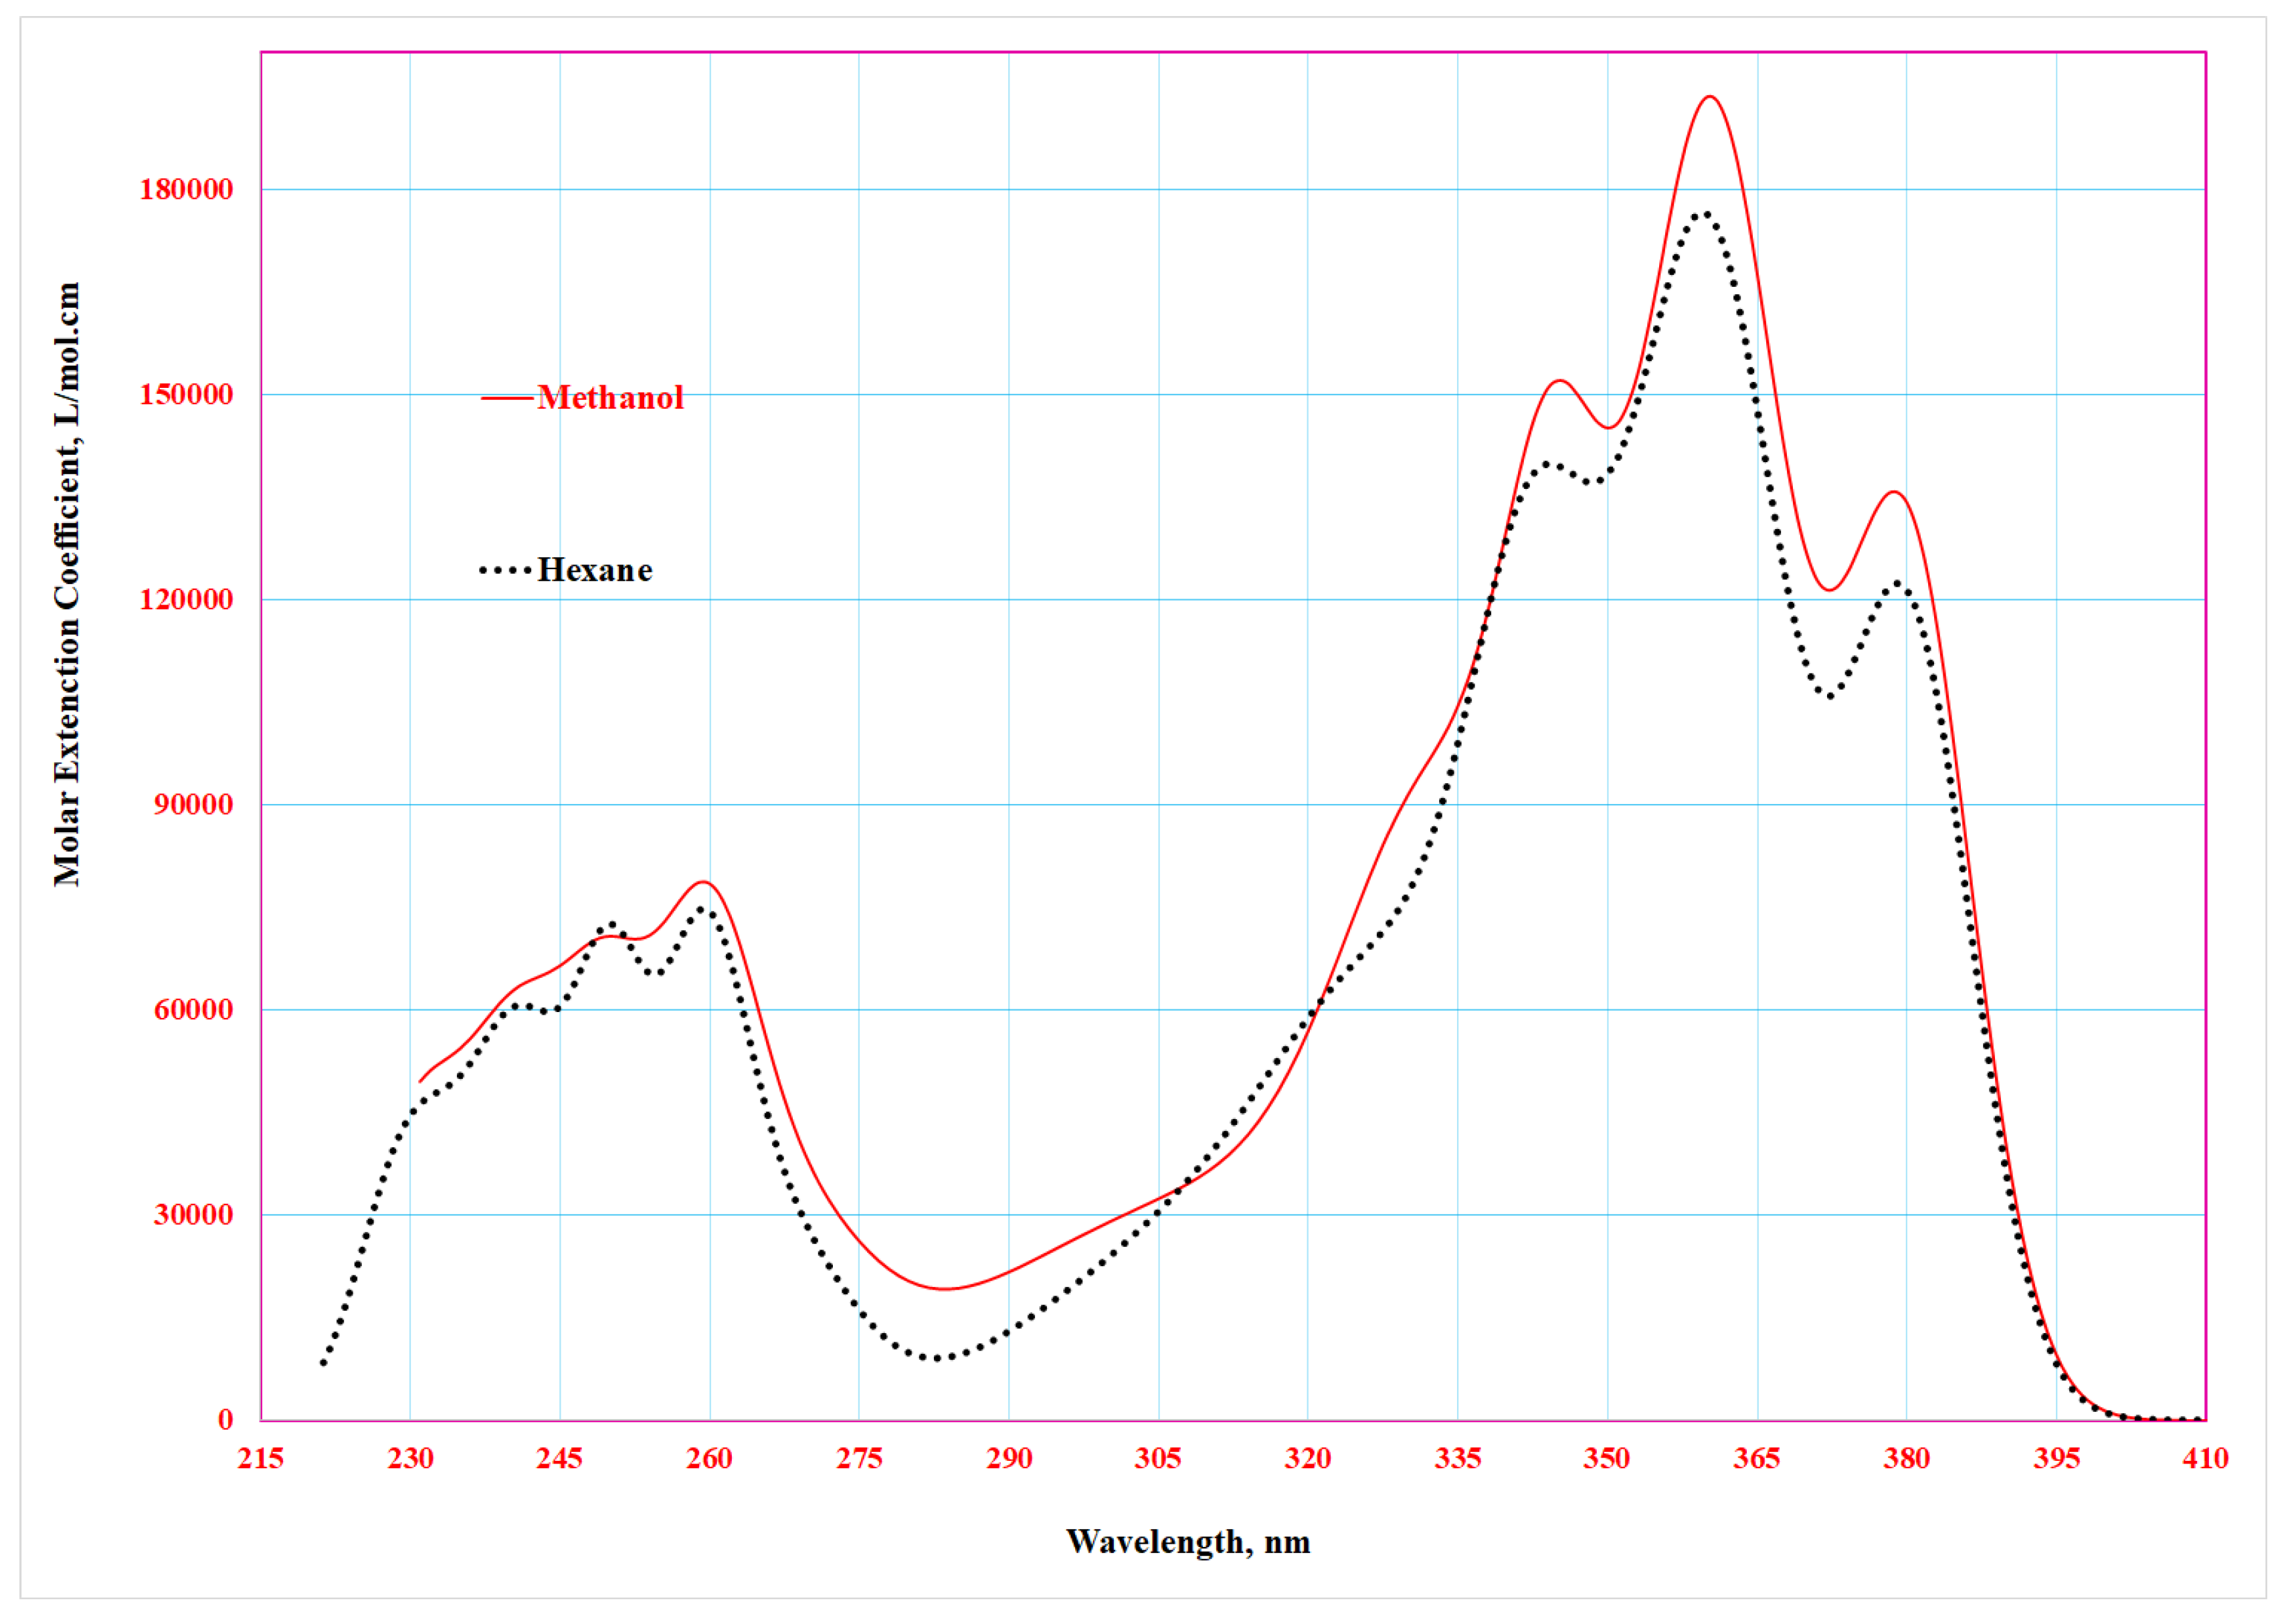
Figure 18.
Gaussian deconvolution analysis of the electronic absorption spectrum for 4-benzylidene-2-phenyl-5(4H)-oxazolone in n-hexane solution.
Figure 18.
Gaussian deconvolution analysis of the electronic absorption spectrum for 4-benzylidene-2-phenyl-5(4H)-oxazolone in n-hexane solution.

Figure 19.
The optimal three-dimensional configuration corresponding to the lowest energy state for the compound 4-benzyldine-2-phenyl-5(4H)-oxazolone, calculated using the PM3 method.
Figure 19.
The optimal three-dimensional configuration corresponding to the lowest energy state for the compound 4-benzyldine-2-phenyl-5(4H)-oxazolone, calculated using the PM3 method.
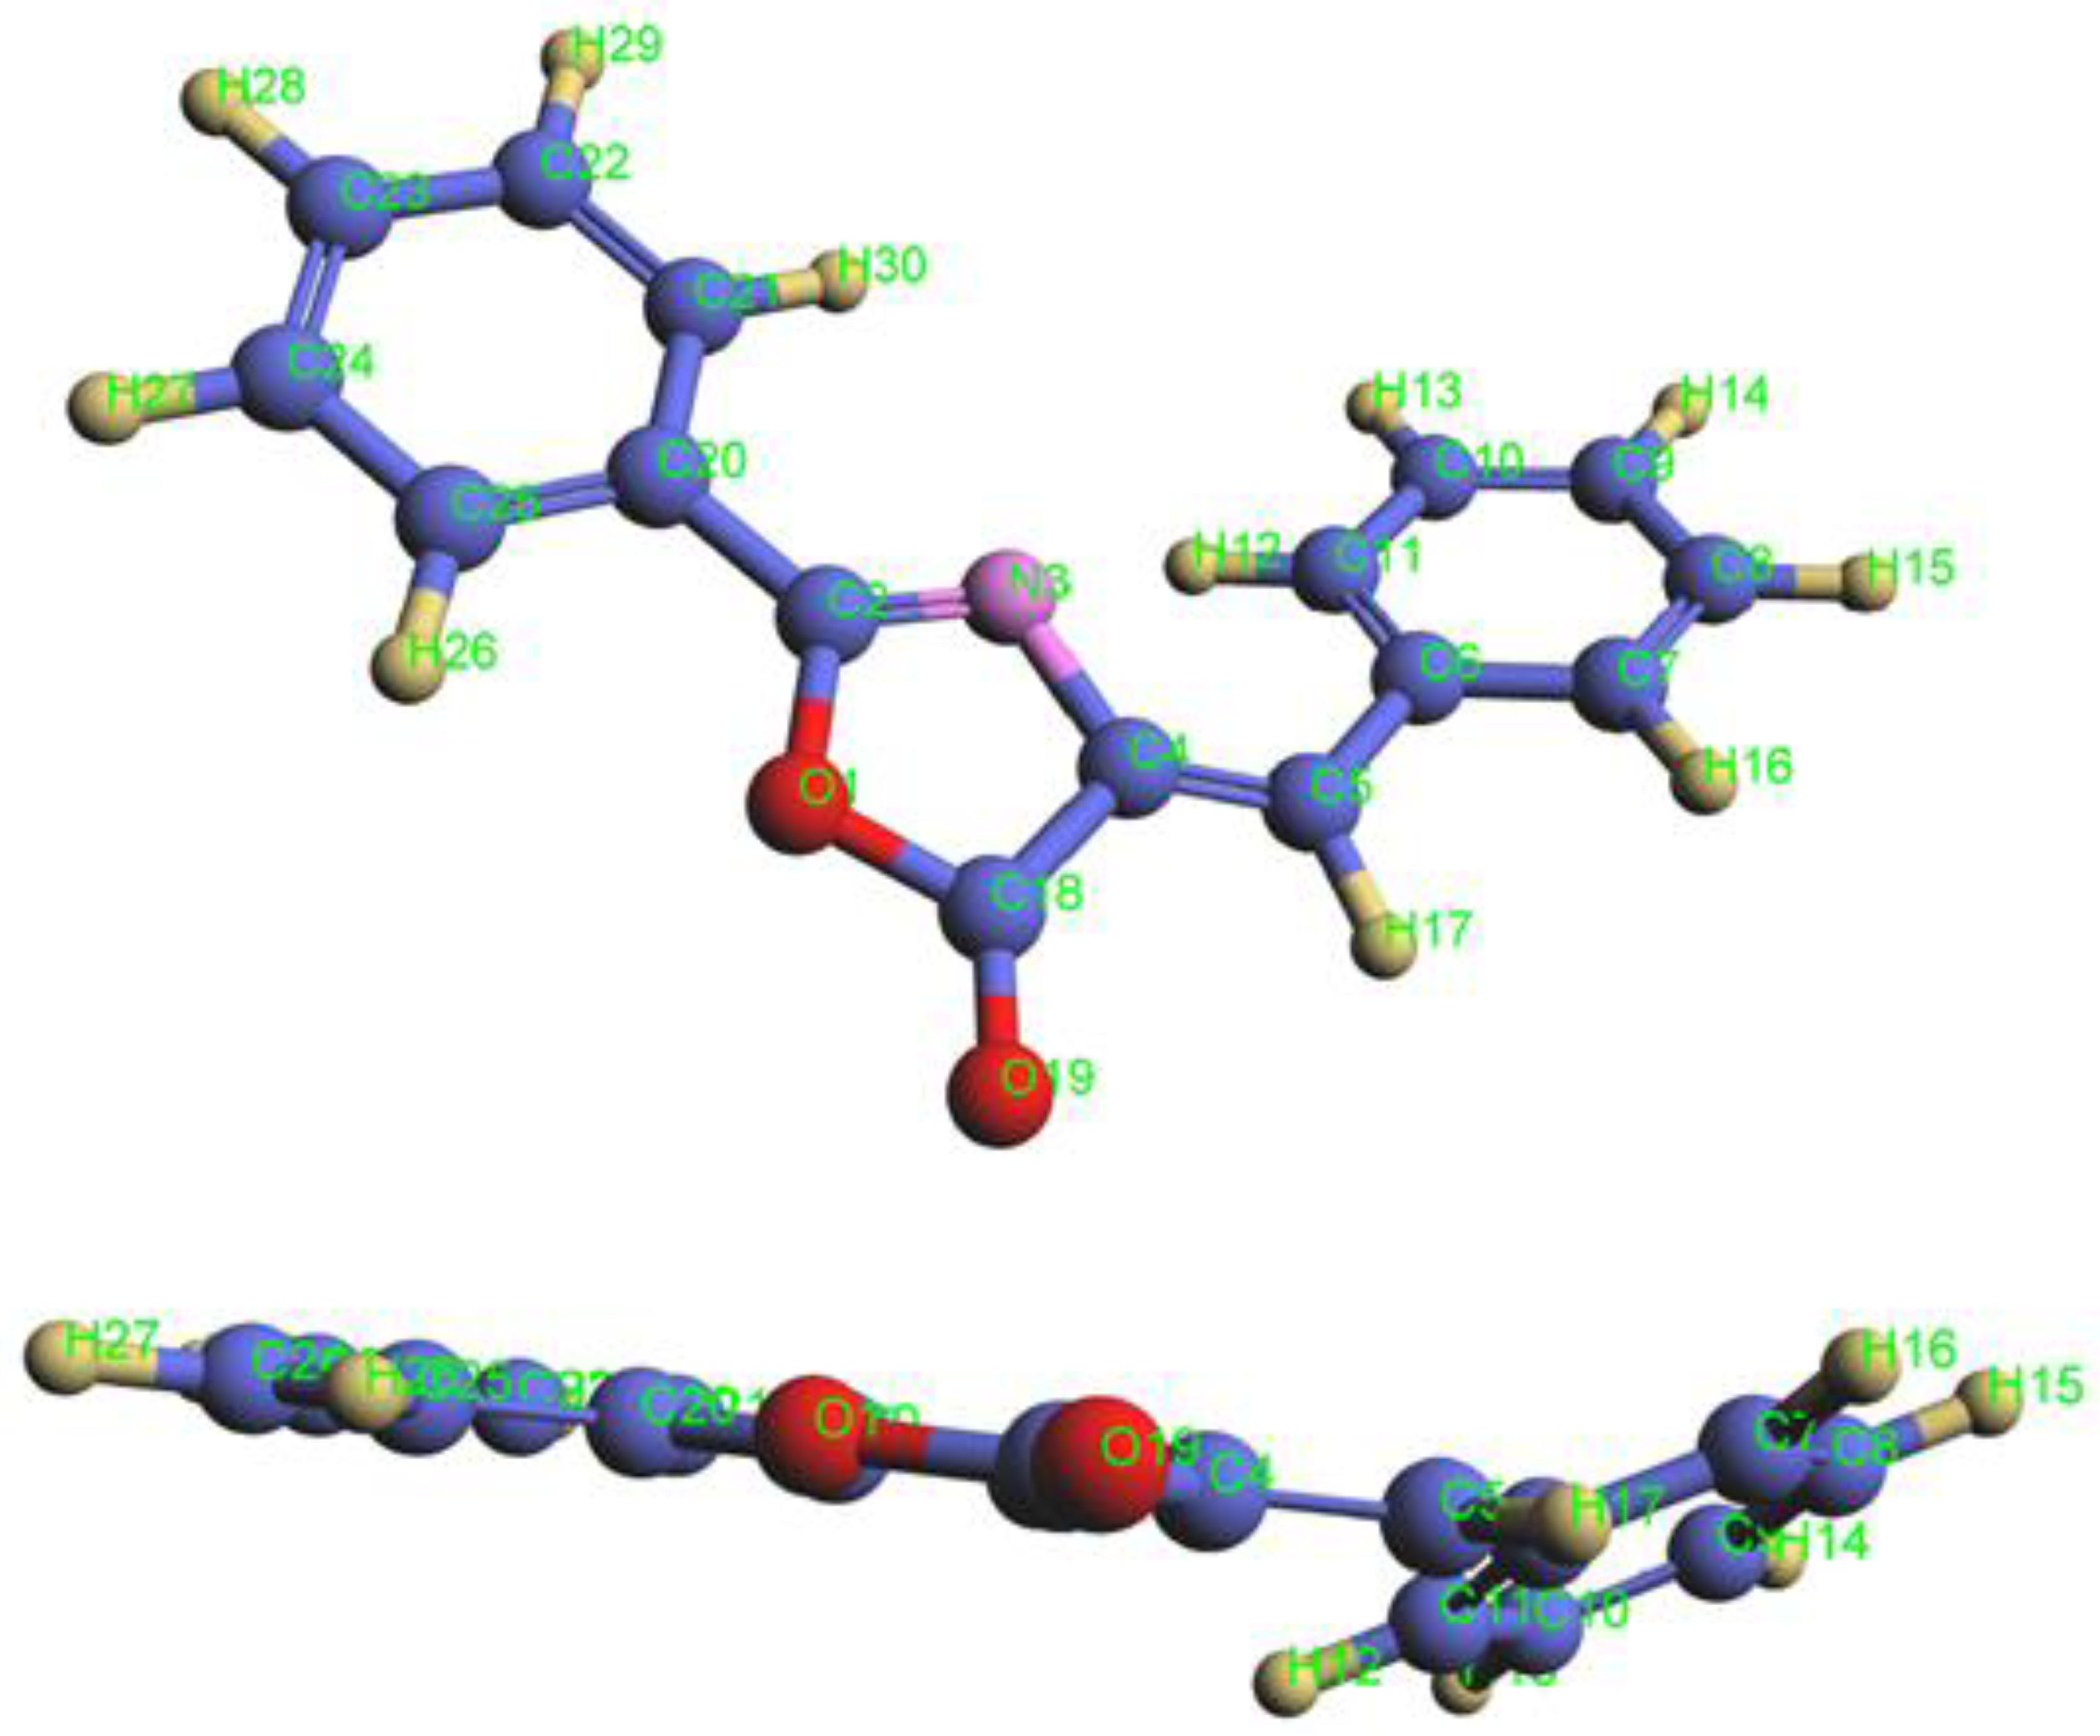
Figure 20.
The absorption spectrum of the compound (4-methoxy)-4-benzylidene-2-phenyl-5(4H)-oxazolone in methanol and hexane.
Figure 20.
The absorption spectrum of the compound (4-methoxy)-4-benzylidene-2-phenyl-5(4H)-oxazolone in methanol and hexane.
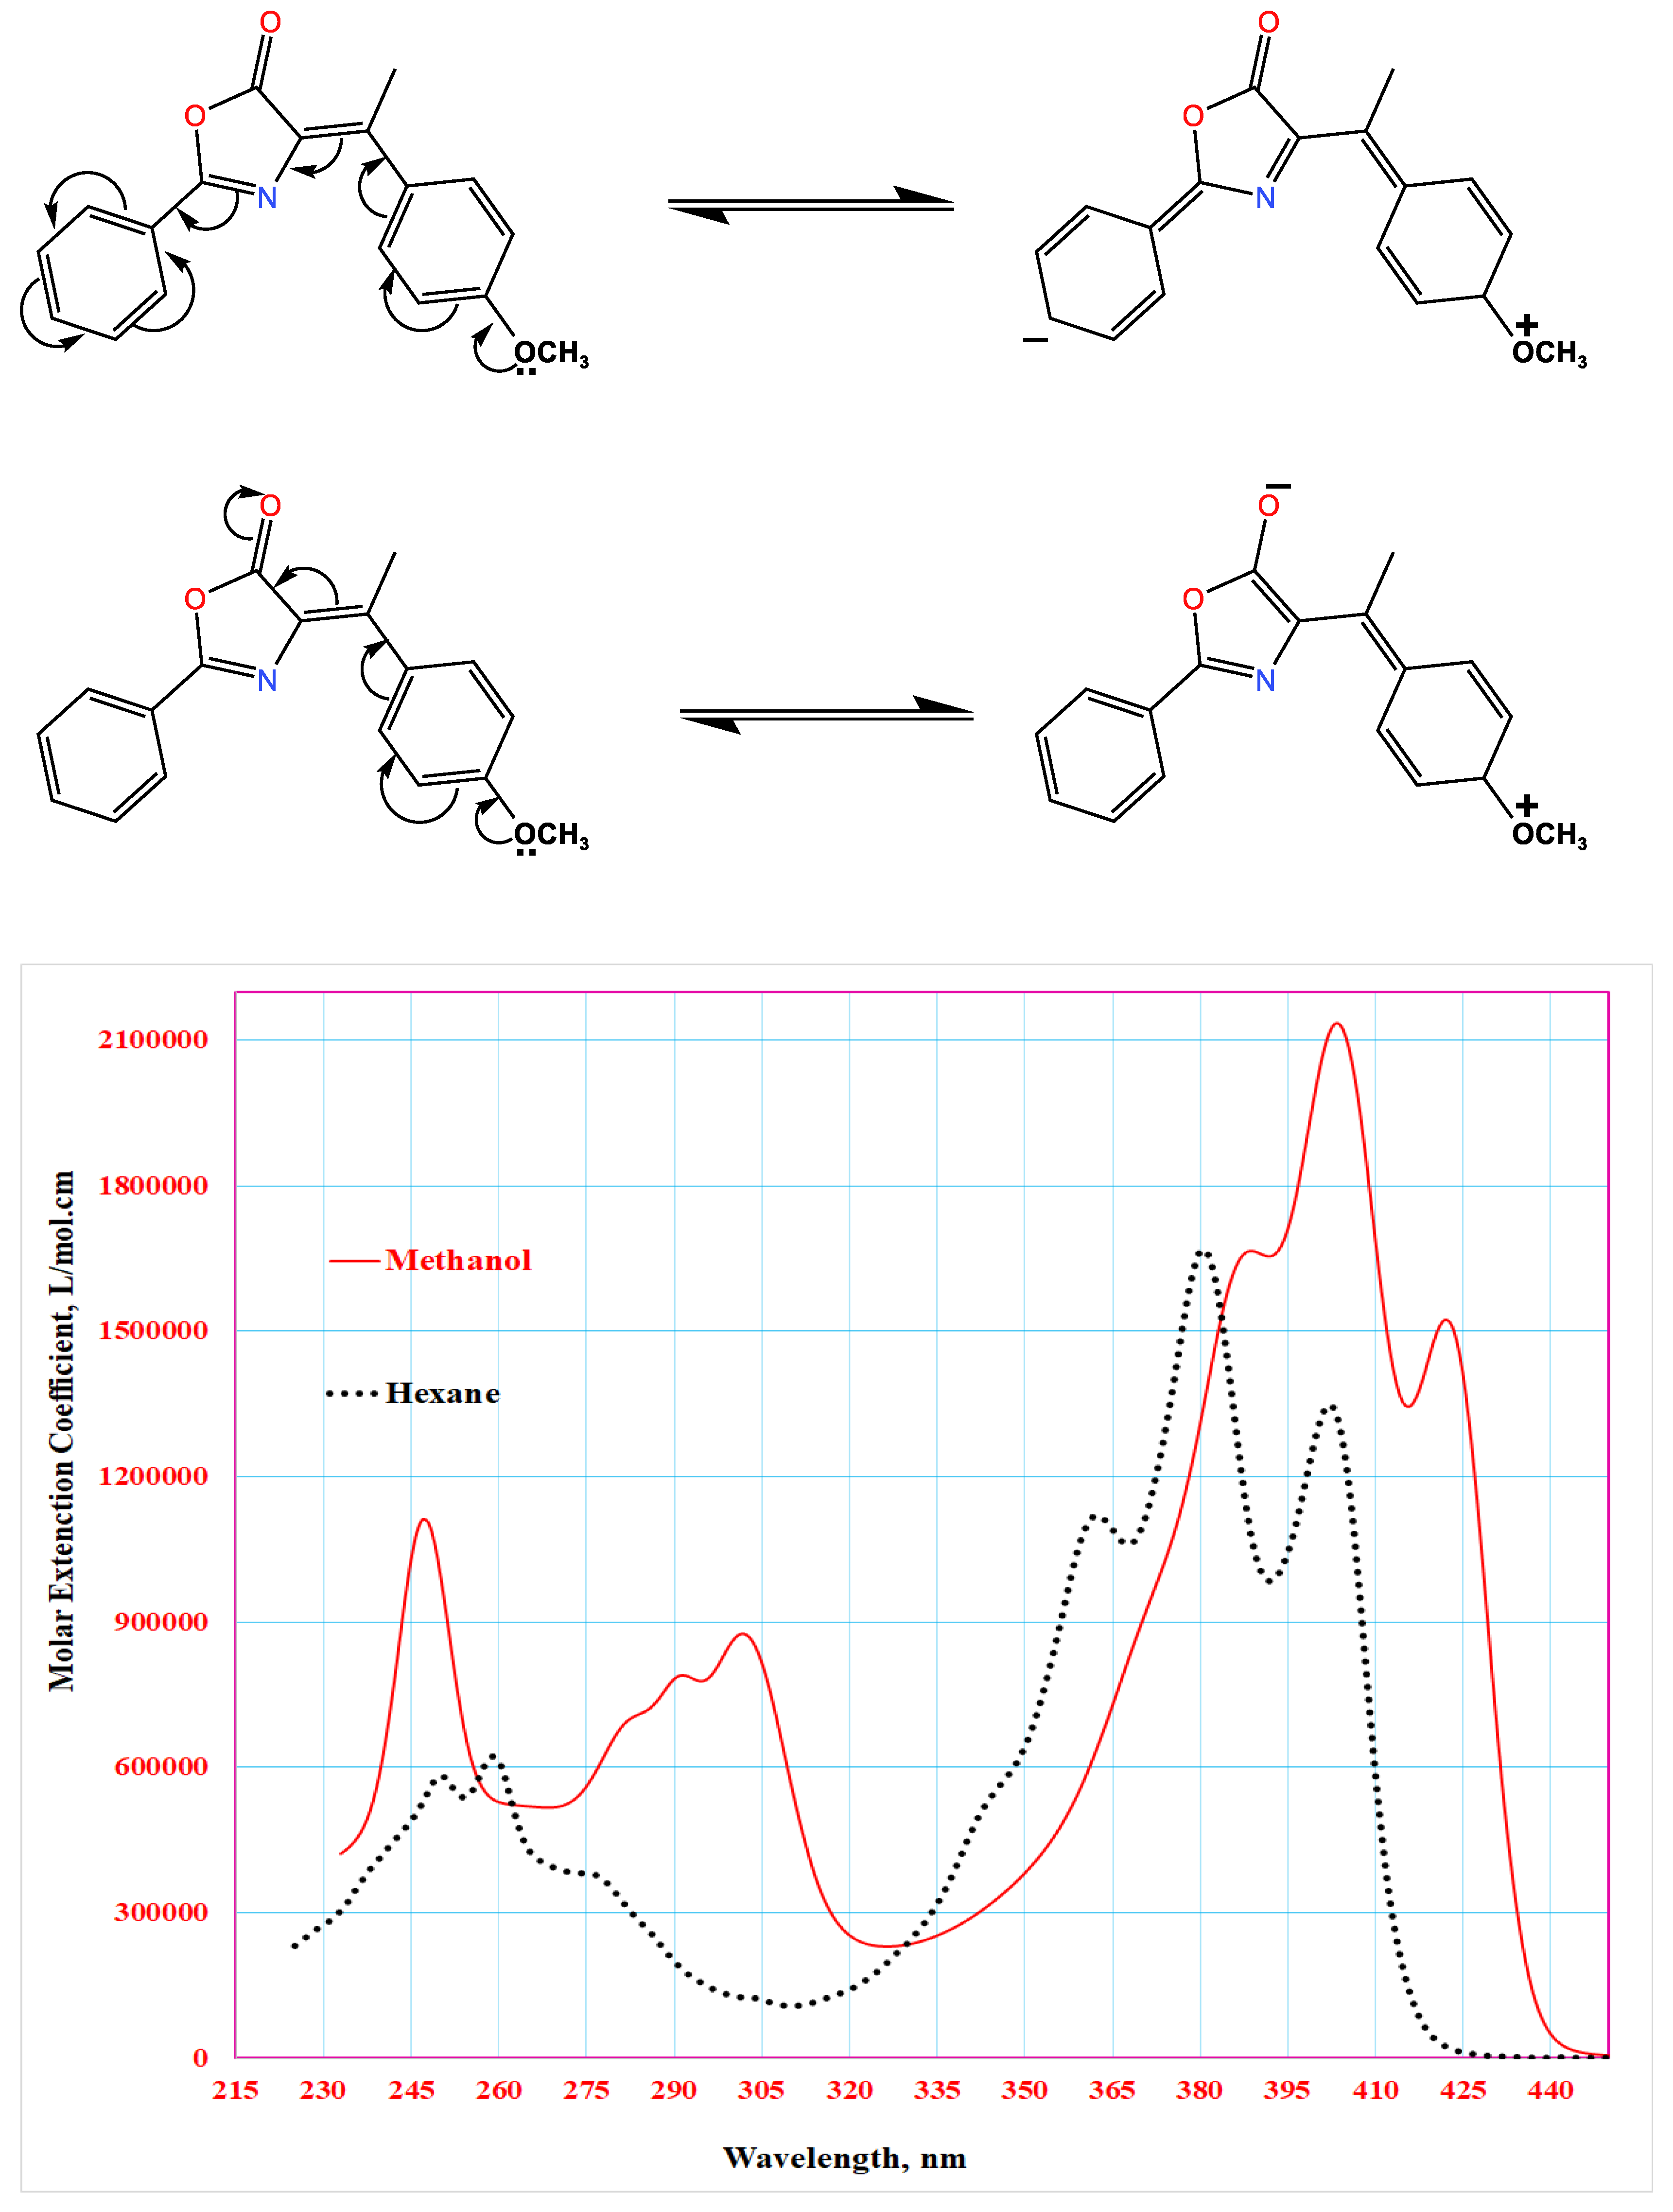
Figure 21.
Gaussian deconvolution spectrum of (4-methoxy)-4-benzylidene-2-phenyl-5(4H)-oxazolone in hexane solution.
Figure 21.
Gaussian deconvolution spectrum of (4-methoxy)-4-benzylidene-2-phenyl-5(4H)-oxazolone in hexane solution.

Figure 22.
The optimal predicted stereochemical configuration corresponding to the lowest energy state of (4-methoxy)-4-benzylidene-2-phenyl-5(4H)-oxazolone calculated using the PM3 method.
Figure 22.
The optimal predicted stereochemical configuration corresponding to the lowest energy state of (4-methoxy)-4-benzylidene-2-phenyl-5(4H)-oxazolone calculated using the PM3 method.
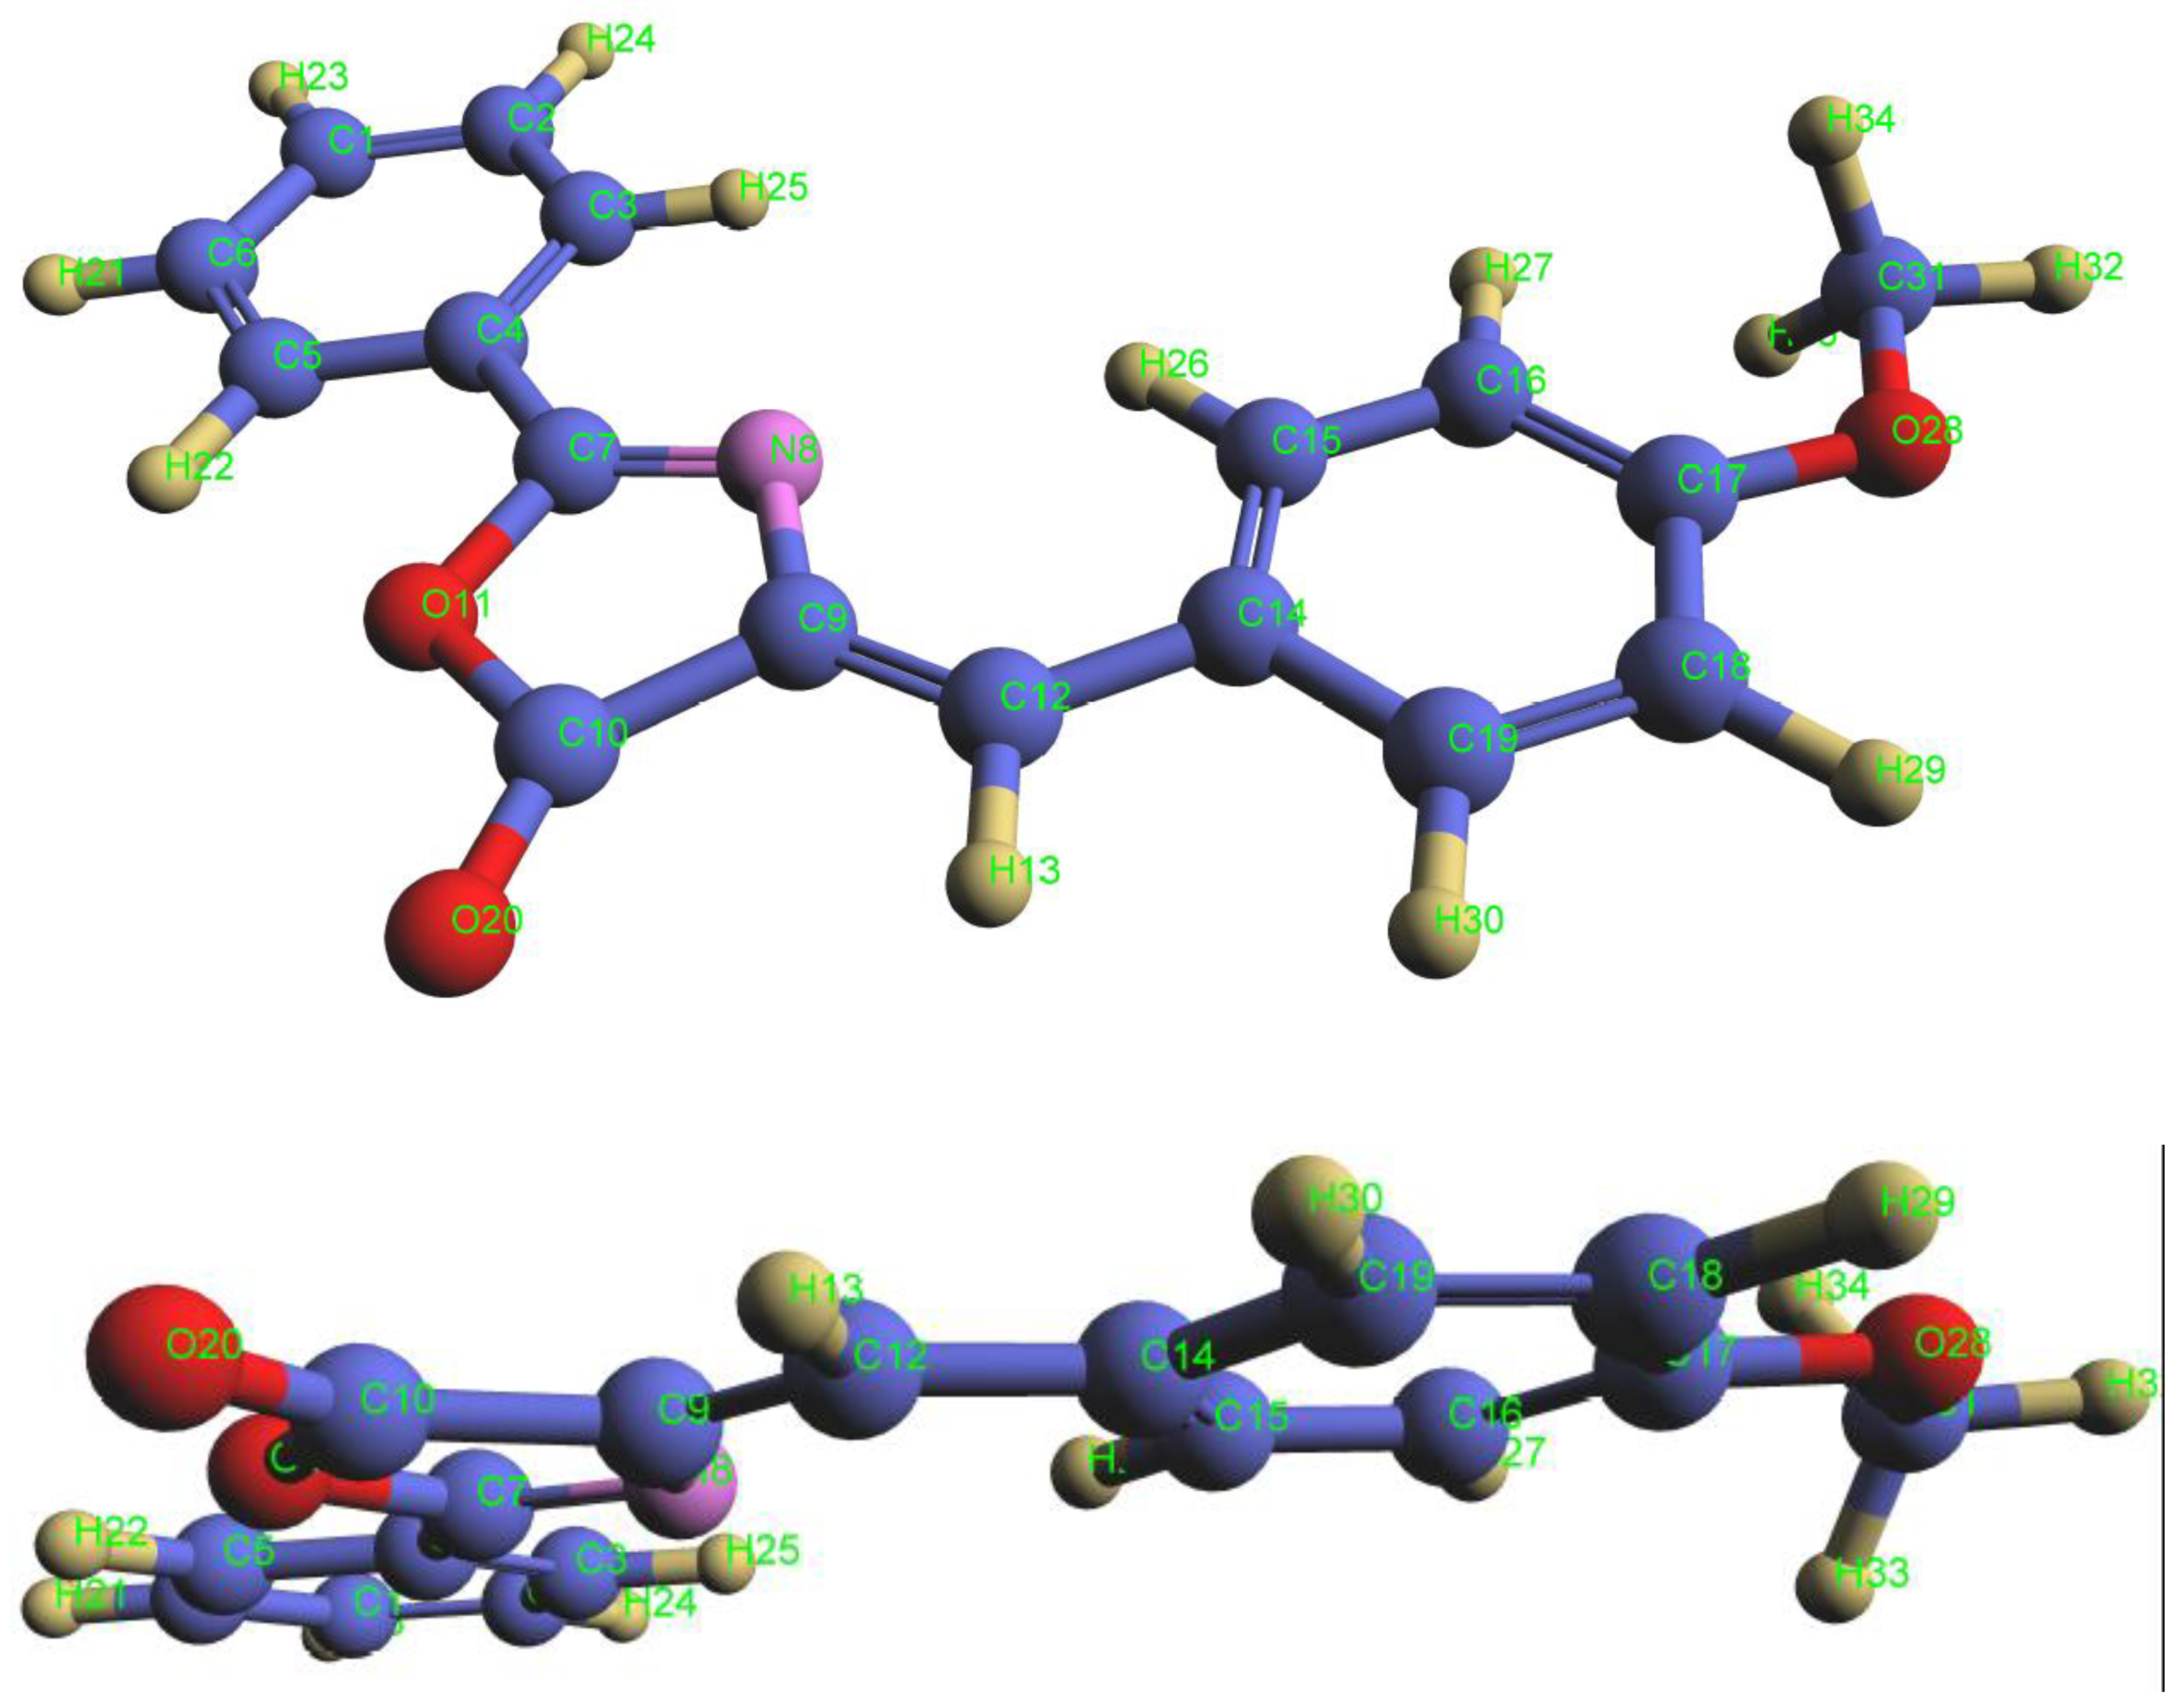
Table 1.
Reaction yield and some properties of the prepared compounds:.
|
Substituent, X |
Overall formula | Molecular weight | Melting point | The color intensity | Reaction yield | Solvent |
| -H | C16H11NO2 | 249 | 165 | Bright yellow | 54 | Ethanol |
| -OCH3 | C17H13NO3 | 279 | 155 | Bright yellow | 80 | Ethanol |
Table 5.
Experimental values of dipole moment in excited and ground states for the studied compounds.
Table 5.
Experimental values of dipole moment in excited and ground states for the studied compounds.
| Parameters | unsubstituted | substitute methoxy |
|---|---|---|
| µ(Debye) Dipole moment of the ground state | 2.807 | 3.039 |
| µ*(Debye) Dipole moment of the excited State | 3.014 | 3.022 |
Table 6.
Shows the experimental results of fluorination of the compounds prepared using ethyl acetate, acetic acid and acetonitrile solvents.
Table 6.
Shows the experimental results of fluorination of the compounds prepared using ethyl acetate, acetic acid and acetonitrile solvents.
| Solvent | ethyl acetate | acetic acid | acetonitrile | |||
|---|---|---|---|---|---|---|
| Compound | unsubstituted | methoxy-substituted | unsubstituted | methoxy-substituted | unsubstituted | methoxy-substituted |
| ℷa⨯10-7 | 405 | 457 | 410 | 457 | 415 | 461 |
| ℷf⨯10-7 | 435 | 500 | 441 | 489 | 480 | 496 |
| va-vf | 1703 | 1882 | 1715 | 1432 | 3263 | 1531 |
| (va +vf)/2 | 23840 | 20940 | 23530 | 21170 | 22460 | 20930 |
| F2(D, n) | 0.095 | 0.115 | 0.104 | 0.124 | 0.562 | 0.578 |
| F3(D, n) | 0.773 | 0.761 | 0.777 | 0.766 | 1.006 | 0.993 |
Table 7.
Calculated versus experimental dipole moments (in Debye units) for oxazolone in benzene solution using various quantum chemical methods implemented in MOPAC.
Table 7.
Calculated versus experimental dipole moments (in Debye units) for oxazolone in benzene solution using various quantum chemical methods implemented in MOPAC.
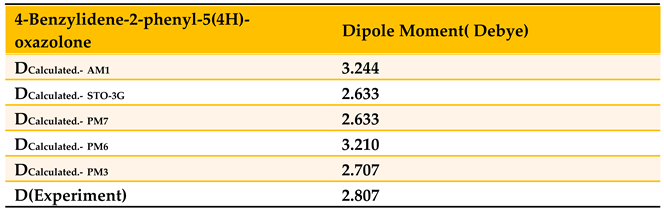
Table 8.
The maximum absorption wavelengthsλmax resulting from Gaussian deconvolution analysis and theoretically calculated using the PM3 method, along with their molar extinction coefficients ε and oscillator strengths (f) for the compound 4-benzyldine-2-phenyl-5(4H)-oxazolone.
Table 8.
The maximum absorption wavelengthsλmax resulting from Gaussian deconvolution analysis and theoretically calculated using the PM3 method, along with their molar extinction coefficients ε and oscillator strengths (f) for the compound 4-benzyldine-2-phenyl-5(4H)-oxazolone.
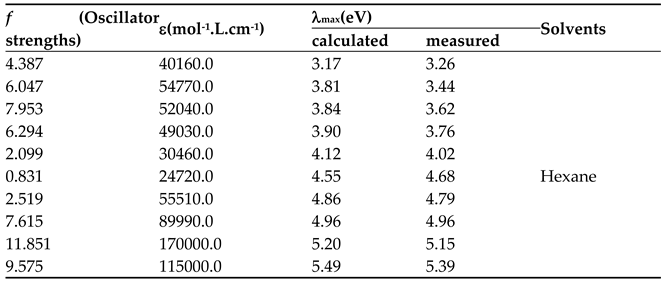
Table 9.
Electronic transitions corresponding to singlet states (singlet) between bonding molecular orbitals (HOMO) and antibonding molecular orbitals (LUMO), calculated using the PM3 method, along with their experimentally corresponding energies from Gaussian deconvolution analysis of the unsubstituted oxazolone spectrum in n-hexane.
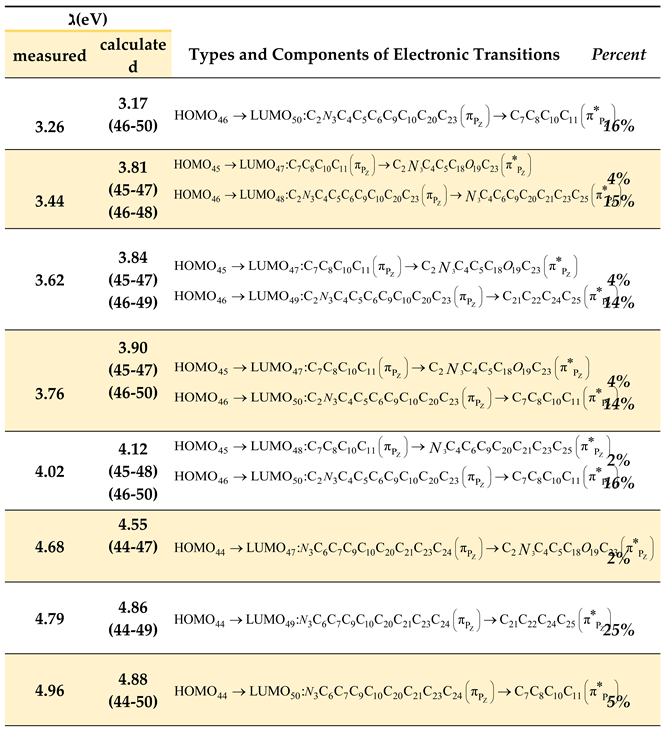
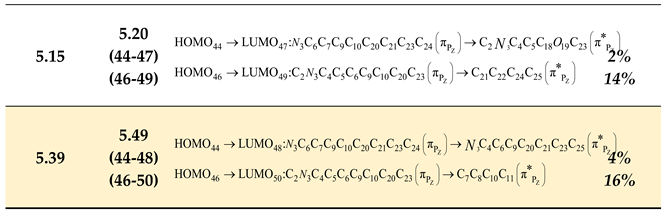
Table 10.
Calculation of permanent dipole moment (in Debye units) using different quantum methods via MOPAC program, compared with experimentally measured values in benzene for (4-methoxy)-4-benzylidene-2-phenyl-5(4H)-oxazolone.
Table 10.
Calculation of permanent dipole moment (in Debye units) using different quantum methods via MOPAC program, compared with experimentally measured values in benzene for (4-methoxy)-4-benzylidene-2-phenyl-5(4H)-oxazolone.
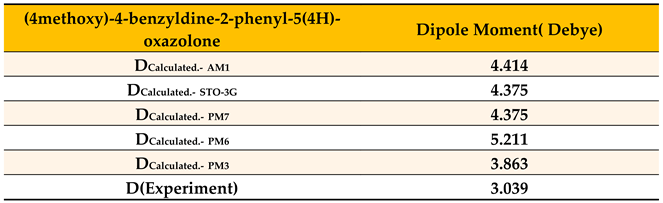
Table 11.
Wavelengths of maximum absorption bands (λmax) obtained from Gaussian deconvolution and theoretically calculated by PM3 method, along with their molar extinction coefficients (ε) and oscillator strengths (f) for (4-methoxy)-4-benzylidene-2-phenyl-5(4H)-oxazolone.
Table 11.
Wavelengths of maximum absorption bands (λmax) obtained from Gaussian deconvolution and theoretically calculated by PM3 method, along with their molar extinction coefficients (ε) and oscillator strengths (f) for (4-methoxy)-4-benzylidene-2-phenyl-5(4H)-oxazolone.
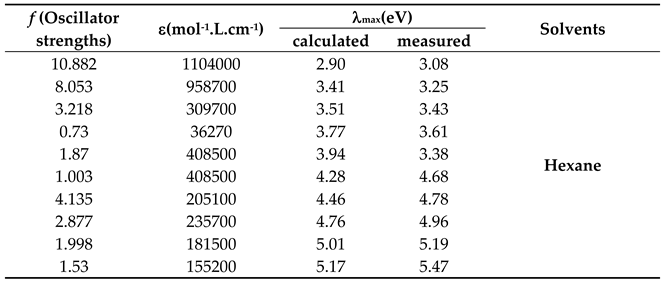
Table 12.
Electronic transitions corresponding to singlet spin states between the bonding molecular orbitals (HOMO) and antibonding molecular orbitals (LUMO) calculated by the PM3 method, along with their experimentally matched energies from Gaussian deconvolution analysis of the absorption spectrum of methoxy-substituted oxazolone in hexane.
Disclaimer/Publisher’s Note: The statements, opinions and data contained in all publications are solely those of the individual author(s) and contributor(s) and not of MDPI and/or the editor(s). MDPI and/or the editor(s) disclaim responsibility for any injury to people or property resulting from any ideas, methods, instructions or products referred to in the content. |
© 2025 by the authors. Licensee MDPI, Basel, Switzerland. This article is an open access article distributed under the terms and conditions of the Creative Commons Attribution (CC BY) license (http://creativecommons.org/licenses/by/4.0/).
Copyright: This open access article is published under a Creative Commons CC BY 4.0 license, which permit the free download, distribution, and reuse, provided that the author and preprint are cited in any reuse.


