
Submitted:
28 July 2025
Posted:
29 July 2025
You are already at the latest version
Abstract
Virtual reality (VR) is often regarded as the "ultimate empathy machine" because of its ability to immerse users in alternative perspectives and environments beyond physical reality. In this study, participants were immersed in 3-dimensional 360° VR videos featuring actors expressing different emotions. Although established methodologies exist in research and clinical domains, our study addresses the lack of a universally accepted "gold standard" for empathy assessment. The primary objective was to explore the relationship between the empathy levels of the participants and the changes in their physiological responses. Empathy levels were self-reported using questionnaires, while physiological attributes were recorded through various sensors. The main outcome of the study are machine learning (ML) models capable of predicting state empathy levels and trait empathy scores during VR video exposure. The Random Forest (RF) regressor achieved the best performance for trait empathy prediction, with a mean absolute percentage error (MAPE) of 9.1%. For classifying state empathy, the RF classifier achieved the highest balanced accuracy of 67%. This research introduces an objective and efficient method for empathy prediction, optimizing resources and time, thus opening new directions in empathy research. Additionally, predictive models were developed to detect non-empathic arousal (78% balanced accuracy) and to distinguish empathic vs. non-empathic arousal (79% balanced accuracy). Furthermore, statistical tests explored the influence of narrative context, as well as empathy differences toward different genders and emotions. We also make available a set of carefully designed and recorded VR videos specifically created to evoke empathy while minimizing biases and subjective perspectives.
Keywords:
empathy
; machine learning
; mental states
; sensor data
; virtual reality
1. Introduction
Empathy is a complex and multifaceted concept that has captured the interest of researchers in various disciplines, including psychology, neuroscience, philosophy, sociology, and anthropology. Despite the absence of a universally accepted definition, empathy is widely understood as a multidimensional construct that encompasses both cognitive and affective components [50,70]. The cognitive component refers to the ability to construct a working model of another person’s emotional state, a process conceptually related to Theory of Mind (ToM), yet distinct in that it centers on understanding emotions rather than beliefs or intentions. In contrast, affective empathy involves sensitivity to and the vicarious experience of another person’s emotions, without necessarily sharing them directly [21].
Examining the reasons why empathy is a valuable area of study highlights its importance across various fields, such as 1) empathy in social relationships and cultures because empathy enables individuals to understand others’ emotions, fostering interpersonal connections. Its cultural variations provide insights into cross-cultural communication and understanding [18,39,56]; 2) Prosocial behavior and altruism: Empathy motivates prosocial actions such as helping, volunteering, and altruistic behavior, contributing to societal well-being [19,40]; 3) Mental health: Empathy deficits are linked to psychiatric disorders such as autism and antisocial personality disorder, highlighting its importance in improving diagnostic and therapeutic approaches [56]; 4) Technological applications: Advances in VR and AI have enabled empathy-driven technologies that enhance user interaction and communication by creating immersive, perspective-shifting experiences [54]; etc.
Although no universally accepted "gold standard" exists for measuring empathy [15], several established methods are widely used in research and clinical contexts. These include self-report questionnaires, behavioral observation, psychophysiological measures, and performance tasks.
- Self-report questionnaires: These involve participants answering questions about their thoughts, feelings, and behaviors related to empathy. While they provide valuable insights into subjective experiences, they rely on self-perception and may be influenced by biases such as social desirability or inaccurate self-assessment [18,28].
- Performance tasks: These tasks evaluate empathic abilities by having participants engage in simulations or scenarios that elicit perspective-taking or emotion inference. They offer ecologically valid measures but primarily capture cognitive empathy and may not reflect emotional empathy. Task design and individual cognitive differences can also influence results [75].
- Behavioral observation: This method involves recording empathic behaviors, such as facial expressions, vocal tone, or prosocial actions, in natural or controlled settings, using standardized coding schemes for quantifying these behaviors. While it provides objective data, it can be time-consuming and subject to reactivity biases due to the presence of observers. Additionally, it focuses on behavioral expressions rather than emotional empathy [62].
- Psychophysiological measures: These assess physiological responses, such as heart rate, skin conductance, or brain activity, during empathic experiences. Although not directly predicting empathy, techniques like functional Magnetic Resonance Imaging (fMRI) and electroencephalography (EEG) have been used to study the neural mechanisms of empathy, highlighting the roles of mirror neurons and brain regions responsible for emotional processing. However, these methods may be influenced by non-empathetic factors, inter-individual variability, and technical constraints [43,58].
The choice of method depends on research goals, the population studied, and the empathy dimensions targeted. To address the limitations of individual approaches, researchers often combine multiple methods to capture empathy comprehensively, despite the added complexity and time required. An ideal empathy measure would be objective, capturing subtle responses that might not be visible through researcher observation and applicable during arbitrary tasks. Psychophysiological measures best meet these criteria, despite the fact that the precise connection between these measures and empathy remained an open question [61].
VR has proven effective in enhancing emotional engagement and empathy across various fields and is increasingly used as a tool for empathy training [12,42]. VR is a technology that generates computer-simulated realistic environments, allowing users to immerse themselves and interact within a virtual setting. By utilizing a VR headset and, in some cases, additional devices, users can experience a sense of being present in the simulated world, engaging with virtual elements in an immersive and interactive manner [8,41]. As a result, many studies have emphasized VR’s capacity to elicit empathic responses, often describing it as "the ultimate empathy machine" [17].
Some of the main reasons why VR is referred to as "the ultimate empathy machine" are:
- Immersive and embodied experiences: VR creates a sense of presence, allowing users to embody different perspectives and experiences. This immersion can enhance empathy by enabling individuals to see and feel situations from another person’s viewpoint [4] or different viewpoint [66]. For instance, one study introduced a method where participants, seated in a stationary chair and wearing a VR headset, used a joystick to move an avatar forward in a virtual environment, allowing them to experience a different point of view. This approach employed electrical muscle stimulation to synchronize leg muscle sensations with the gait cycle, offering a first-person perspective that created the illusion of walking without physical movement. The study demonstrated that this technique, through VR immersion, effectively induced an embodied experience with the sensation of leg movement for seated users [66].
- Perspective-taking and emotional engagement: VR can simulate realistic scenarios that elicit emotional responses and encourage perspective-taking. VR experiences can simulate lifelike scenarios that elicit emotional responses and immerse users in the perspectives of others, helping them better understand different feelings and experiences [6]. For example, one study demonstrated how VR can enhance emotional well-being and foster empathy in the elderly by exposing them to emotionally meaningful content. This included storytelling, immersive environments, and virtual tours of nostalgic locations. Simulated social interactions with family or peers were also incorporated to encourage emotional engagement [20]. Another notable example is the use of death simulations in VR, where users explore the concept of death in a controlled environment. As a profound and universal theme, death offers unique opportunities for fostering empathy, emotional development, and self-reflection. In these simulations, participants transition from a virtual cardiac arrest to brain death, experiencing inner-body sensations while journeying through expansive cosmic landscapes. This immersive experience encourages deep contemplation on mortality and the sublime nature of existence, highlighting VR’s capability to engage with complex emotional and existential topics [38].
- Empathy training and perspective shifts: VR-based interventions are used in healthcare, education, and diversity training to challenge biases and enhance empathic abilities. By immersing individuals in realistic scenarios, VR challenges biases and fosters perspective-taking, allowing participants to gain deeper insights into others’ emotions and experiences, making it a powerful tool for empathy training [12]. For example, VR has been shown to effectively cultivate empathy in sensitive areas such as racism, inequity, and climate change, particularly in healthcare, where participants engage in transformative experiences that improve empathy and understanding [69]. In another study, VR-based dementia training for home care workers improved their knowledge, attitudes, competence, and empathy, demonstrating the value of immersive training methods in enhancing care skills [53]. Additionally, a study proposes a video game framework using generative AI to create personalized interactive narratives, aiming to foster empathy and social inclusion. By combining VR’s immersive nature with personalized experiences, this research explores how AI-driven games can enhance wisdom, with a particular focus on empathy as a core element of wisdom [29].
- Ethical considerations: Although VR has the potential to enhance empathy, its use must be guided by ethical principles. As a tool capable of evoking intense emotional responses, VR experiences should be designed responsibly to respect the dignity and privacy of all individuals involved. Additionally, it is crucial to carefully manage the emotional impact on users to avoid potential negative effects on their well-being. Achieving a balance between creating immersive empathic experiences and ensuring the emotional safety of participants is essential for using VR effectively as a tool to foster empathy [69]. For instance, scenarios like virtual rape highlight the need to address how VR experiences might awaken the idea for the real-world violations [52]. Another study emphasizes that VR can unintentionally cause harm, including empathy fatigue or distress for users and providers of empathic acts, especially in contexts involving chronic or stigmatized illnesses. Thoughtful design approaches that balance emotional engagement with actionable support are vital to ensure VR enhances well-being without adverse effects. By integrating strategies to mitigate empathy fatigue and promote self-care among users and caregivers, VR technologies can better align with the goal of positively impacting health and well-being [9].
The objective of this study was to explore the relationship between participants’ different types of empathy and changes in their physiological responses, measured by sensors such as the inertial measurement unit (IMU), the photoplethysmograph (PPG) and the electromyograph (EMG). Participants were immersed in 360° 3D VR videos that we created and recorded, where actors express various emotions (sadness, happiness, anger, and anxiety). Afterward, they filled out brief questionnaires to assess their levels of state and trait empathy, as well as arousal, valence, and discomfort. Using their sensor and questionnaire data, ML models were developed that predict a participant’s empathy score based on his physiological arousal while watching the VR video.
Developing a stable and accurate model to predict individuals’ empathy levels could provide several advantages, including:
- Personalized interventions and early prevention: The model can assess empathy levels in various contexts, enabling tailored interventions and early identification of individuals needing support, particularly in healthcare and relationships.
- Selection and training: It can help select individuals for empathy-intensive roles and guide training programs by identifying areas for improvement.
- Research and understanding: The model can contribute to research on empathy, offering insights into factors influencing it and identifying patterns across populations.
- Entertainment and interactive media: By tailoring content to users’ empathy levels, creators can enhance emotional engagement in video games, narratives, and media recommendations.
- Personal growth and self-awareness: Individuals can gain self-awareness about their empathy strengths and weaknesses, fostering personal growth and encouraging the development of empathy.
Overall, a stable model for predicting empathy could impact personalized interventions, selection and training, research, entertainment, and personal growth [13,51,56].
This study also aimed to develop ML predictive models that predict empathic arousal, non-empathic arousal, and distinguish between empathic and non-empathic arousal, as well as between relaxed and aroused states. Additionally, statistical tests were conducted to determine whether participants showed more empathy towards females or males, whether participants displayed greater empathy toward certain emotions compared to others, and whether participants exhibited greater empathy when they understood the reasons behind others’ emotions.
2. Background and State of the Art
Recent research highlights the role of emotion regulation strategies, such as mindfulness, self-compassion, and resilience, as significant predictors of well-being [77]. A decline in empathy has been associated with increased psychological distress [32], whereas higher levels of empathy are linked to improved well-being, reduced burnout, and more meaningful work experiences [44,70]. Given the substantial body of research suggesting that VR can be used to elicit empathic behavior [17], the recognition of psychophysiological measures as objective indicators of emotional states [43,58], and the established capability of ML to analyze large datasets, identify patterns, and make predictions, this section examines recent research in four areas:
Section 2.1 explores how VR has been utilized to enhance empathy, the contexts in which it has been applied, and the populations involved.
Section 2.2 reviews findings from studies investigating the most effective environments—whether VR-based or not—for eliciting empathy, along with details regarding experimental material.
Section 2.3 examines the measures and methodologies employed in existing research to assess empathy.
Section 2.4 addresses a gap in the literature: to our knowledge, no studies have used VR to elicit empathy, measured it through sensor-based approaches, and developed predictive ML models. Therefore, we review studies on empathy and other mental state predictions, focusing on how they employed sensor data and developed ML models.
2.1. General Context of the Studies Using VR in Empathy Enhancement
Investigations have explored VR’s capacity to foster empathy across various contexts. For instance, VR has been utilized to encourage pro-environmental behaviors, such as increasing donations to protect coral reefs [72]. In healthcare, VR has been employed to enhance empathy and deepen understanding of the challenges faced by patients with dementia among healthcare workers [63] and caregivers [35]. Similarly, VR has been used to promote empathy towards individuals with psychotic disorders among mental health professionals [59]. Studies have also focused on enhancing medical students’ empathy towards patients with depression [60], understanding of individuals with opioid use disorder [5], and empathy for those with Myalgic Encephalomyelitis/Chronic Fatigue Syndrome (ME/CFS) [11]. Additionally, VR has been applied to foster empathy in undergraduate healthcare students towards older adults with cognitive impairments, such as experiencing disorientation in community settings and distorted sensory perceptions [3].
Beyond healthcare, VR has been utilized to promote prosocial behavior by facilitating perspective-taking towards peers [22], homeless individuals [54], refugees [69], and victims of sexual harassment [64]. Furthermore, VR has been employed to elicit empathy towards avatars experiencing pain [23] and pleasure [34,37], individuals with ME/CFS [1], and specific groups facing challenges such as pregnancy, aging, wheelchair use, and visual impairments [14].
2.2. Using Virtual Reality to Elicit Empathy
Numerous studies have investigated various VR and technical components to identify those most effective in eliciting empathy. These studies demonstrated that 360º immersive virtual environments (IVEs) were more effective than two-dimensional video or film in fostering empathy [1,69,72]. Additionally, other forms of curriculum content, such as e-course materials [35] and workshops [63], were evaluated, but the most significant improvements in empathy were again observed with 360º IVEs, particularly among older participants and non-native English speakers. When empathy toward victims of sexual harassment was analyzed, 360º IVEs proved to be as effective as narrative-based perspective-taking exercises [64]. However, significantly higher empathy scores were reported when participants were first exposed to the narrative-based perspective-taking exercise before experiencing the 360º IVEs, compared to when the exercise was completed after the 360º video [64]. Long-lasting positive attitudes toward the homeless were also identified in other studies that used narrative-based perspective-taking exercises [54].
Some studies employed pretest-posttest designs to assess the impact of 360º IVEs on empathy. For instance, one study examined the stigma and challenges associated with opioid use disorder and found that the immersive VR experience significantly increased empathy [5]. Another study reported positive changes in empathy scores before and after participants engaged in a 3D VR simulation aimed at enhancing empathy toward older adults by simulating cognitive impairments, including experiences related to pregnancy, elderly people, wheelchair users, and sight impairments [3]. In another study, a 3D animated scene with audio portraying real-life stories of individuals living with ME/CFS was shown to be effective in improving empathy [11].
Further studies involved participants experiencing a 3D VR intervention simulating visual and auditory hallucinations associated with psychotic disorders in a home setting, culminating in a call from a mental health professional. This scenario was compared to the same setting without hallucinations and the concluding call. Although this study did not find a significant impact on participants’ empathy levels over time, the group exposed to hallucinations reported higher user satisfaction compared to the control group [59]. Another investigation focused on 3D VR simulations designed to enhance empathy by immersing participants in the daily life and symptoms of individuals with depression. This VR experience was contrasted with typical medical student activities, such as classroom learning and hospital internships, and was found to be effective in fostering empathy [60].
Additional technical features were also analyzed, including the perspective from which participants experience the virtual environment. It was found that first-person perspectives led to higher feelings of ownership compared to third-person perspectives [34,37]. Furthermore, higher empathy scores were recorded when participants interacted with avatars depicting familiar faces expressing pain, as opposed to unfamiliar avatars [23], or when they took the perspective of someone they expected to interact with in the future [22].
2.3. Measuring Empathy
Each of the reviewed studies utilized self-reported questionnaires to evaluate empathy, without exception. These questionnaires were either single-item or multi-item instruments. Examples of commonly employed tools include the Interpersonal Reactivity Index [34,54,59,60], as well as some of its sub-scales [37,63], the Empathy Scale [64], the Jefferson Scale of Empathy (JSE) [5,60], the Kiersma-Chen Empathy Scale (KCES) [3], the Situational Empathy and Perspective Taking Scale [63], and the Empathy for Pain Scale [34,37]. Several studies also included adapted items from various other empathy measurement tools [1,11,14,35,69].
On the other hand, regarding objective measures, many studies have incorporated biometric signals to predict empathic states, for example galvanic skin response (GSR) [23], only skin conductance reactivity (SCR) [34,37], or in combination with heart rate (HR) [34]. Additionally, hybrid inertial–ultrasonic motion-tracking systems like the wireless InterSense IS-900 VET were used for monitoring participants’ head positions [23], as well as infrared-based systems such as the Oculus DK2 IR camera [54]. However, no significant findings were observed in these studies based on the statistical tests they conducted.
Moreover, a study [1] employed EEG to examine brain activity, particularly focusing on mu rhythm suppression, a neural indicator associated with empathic engagement. The results indicated that VR exposure led to greater suppression of mu rhythms compared to traditional TV viewing, suggesting that VR may enhance empathic responses.
2.4. Predicting Empathy and Other Psychological States with Machine Learning
The reviewed studies that use VR to elicit empathy primarily measure responses through questionnaires or biometric signals, analyzing the data using statistical tests [1,3,5,11,14,59,60]. However, many other examples studies that do not use VR have employed physiological data and ML techniques to predict empathy and other mental states. For instance, one study involving healthcare professionals tracked mood, well-being, and empathy through daily self-reports over a period of up to three months, while a smartwatch collected physiological data, including heart rate and step counts. ML models were then trained to predict well-being and empathy ratings using features such as emotional self-reports, diet, exercise, sleep patterns, and smartwatch data [10]. Some studies investigate the impact of genetic variations on empathy using ML, linking genetic data to emotional responses [67], while others apply neural network algorithms to analyze brain imaging data related to social-affective processes, including empathy [68].
In addition to empathy prediction, various studies have explored emotional and mental states using physiological signals combined with machine learning or deep learning methods. For instance, one study utilized 1D-convolutional neural networks (CNNs), Long Short-Term Memory (LSTM) networks, and Extreme Learning Machines to classify emotional responses based on EEG signals recorded during memory recall tasks [26]. In another study, PPG signals were recorded from participants watching peaceful and offensive videos, with time-series data processed to detect stress-related responses such as changes in heart rate. CNNs and LSTMs were employed to train models for classifying emotional reactions [55]. Similarly, a study collected electrodermal activity (EDA) signals from 30 participants as they watched emotionally evocative videos and rated their emotional states. ML models, including both traditional classifiers and deep learning approaches like 1D-CNNs, were used for emotional state classification [16]. Another study analyzed EMG signals from facial muscles to classify emotional states, using Support Vector Machines (SVM) and k-Nearest Neighbors (KNN) classifiers [73]. Furthermore, EEG signals recorded from participants during task performance or video watching were analyzed to detect stress and calm states, with SVM and CNN models applied for classification in personal identification systems [7]. Another study classified facial expressions using EMG signals, which were preprocessed using smoothing filters and reshaped for ML model input. Various supervised classification algorithms were applied for emotion detection [65]. For datasets involving physiological signals such as EEG, PPG, and EDA, recorded during video watching or task performance, ML has been applied to classify emotional states or flow experiences [57]. Additional research examines neural and behavioral responses to emotional expressions in both human and dog faces, analyzing EEG and magnetoencephalography (MEG) data with ML techniques to classify neural responses [74].
Beyond empathy prediction, VR-based setups have also been employed to investigate emotional and mental states using physiological signals combined with machine learning. These works commonly involve wearable biosensors during immersive VR experiences and rely on self-reports for emotion labeling to model internal states such as arousal, stress, or valence. For example, one study used heart rate, respiration, and movement data collected during relaxing and exciting VR scenarios, but faced difficulties in predicting arousal. This led to a binary high- vs. moderate/low-arousal classification approach using windowing and machine learning, while highlighting challenges like individual variability and emotion labeling [45]. Another study recorded biosignals during emotion-evoking VR video exposure and classified multiple emotional states using machine learning, achieving high accuracy, though with confusion between similar emotions [46]. Similar work using custom wearable devices showed that combining different signals enhanced arousal classification performance [47]. In another study, participants viewed emotional VR content while wearing wristband sensors, intra-subject models achieved up to 100% accuracy, though inter-subject generalization remained limited, with negative emotions showing better classification results [48]. Overall, these studies demonstrate that VR environments, coupled with physiological monitoring and machine learning, can serve as effective frameworks for modeling a broad range of emotional and mental states, supporting the methodological foundation of the present work.
3. Materials and Data Collection Process
3.1. Materials and Setup for Empathy Elicitation in VR
Based on the findings in Section 2.2, we immersed participants in a 360º 3D virtual environment, as VR has proven highly effective in eliciting empathic responses. Comparative analyses indicate that 360º settings are as effective or more so than other approaches, with both immediate and lasting impacts. The use of 3D immersion, as highlighted by the review [70], is superior to two-dimensional experiences. Participants adopted a first-person perspective, observing actors expressing emotions directly in front of them, which research shows is more effective for empathy than a third-person perspective [34,37].
We decided to create and record videos where actors genuinely express four distinct emotions (happiness, sadness, anger, and anxiousness) without content, words, or explanations to avoid confounding empathy with emotional responses to the content (videos sent as supplementary material to the paper) [69]. Moreover, individuals may display varying empathic reactions depending on the emotional valence, which leads to the inclusion of four distinct emotions in our study [36]. In the non-narrative version, all four actors portrayed the four emotions by gradually intensifying each emotion to its peak and then returning to a neutral state, without accompanying narratives. For participants who may find understanding the reasons behind emotions more impactful, we developed a narrative version of the VR session featuring emotional audio narratives in Slovenian, followed by corresponding videos (50–120 seconds). We created two narrative versions. For each narrative version, to ensure gender balance, we recorded one video with two male actors and one video with two female actors [71]. Informed consent was obtained from the actors prior to the recording. Each version consists of four parts, each addressing one emotion, with consistent themes of childhood abuse, abandonment, and mother-child relationships (Figure 1).
Prior to the VR session, participants completed questionnaires addressing demographic and personal details, including age, gender, health status, language proficiency, prior VR experience, and educational background [71]. Additionally, the Questionnaire of Cognitive and Affective Empathy (QCAE) [21] was administered to assess participants’ trait empathy, which reflects an individual’s innate capacity for empathetic behavior and is closely tied to personal characteristics [76]. In this study, we adopt the definition of empathy as the ability or tendency to form an internal model of others’ emotional states and to be sensitive to and share their feelings, while remaining aware of the distinction between self and others [21]. The affective empathy subscale of the QCAE was later used as a ground truth in our analysis.
The VR session begins with a calibration phase, where participants relax for two minutes while avoiding facial expressions and head movements. This is followed by voluntary facial expressions, which provide subject-specific normalization for EMG signals based on established methods [24,30,49]. Then, there is a two-minute forest video, The Amsterdam Forest in Springtime, and its purpose is to establish a baseline representing participants’ relaxed state (Figure 2).
In the main segment, participants experience four emotional states (anger, sadness, happiness, and anxiousness) through narrative-video pairs or videos alone. In the narrative condition, each video is preceded by a corresponding emotional narrative read by the actor, creating a 2–3 minute immersive experience for each pair. While the segments in the narrative versions follow stories, the segments in the non-narrative versions are counterbalanced to prevent bias from order effects [71].
After each pair, participants report their current empathic state using 2nd, 3rd, and 4th items from the 12-item State Empathy Scale [31], selected to focus on affective empathy while excluding questions unrelated to empathy. Additionally, the question period serves to reduce habituation and prevent emotional carry-over between segments. This process is repeated for all four emotions, with each feedback session lasting approximately 30 seconds. Participants also rate their arousal and valence using the Self-Assessment Manikin (SAM) affective rating system [25], alongside a measure of personal distress derived from the Interpersonal Reactivity Index (IRI) [28]. These additional measures provide a broader understanding of emotional responses and their connection to empathy [27].
To differentiate empathic arousal from general arousal, a roller coaster video (Yukon Striker – Canada’s Wonderland) is shown as a control. The intensity of arousal and valence after the control video is compared to responses from the narrative-video pairs, strengthening the study’s validity.
The session concludes with a presence questionnaire adapted from the Bongiovi Report [2,71], modified to include questions about participants’ VR experiences and potential challenges [69]. Following recommendations for minimizing VR sickness, fatigue, and potential health concerns, the entire session, including calibration and control measures, lasted approximately 20 minutes, [71]. Participants were randomly assigned in equal numbers to one of five versions: two narrative scenarios, each performed separately by male and female actors, and one non-narrative version—ensuring a balanced design suitable for diverse linguistic backgrounds.
3.2. Participants and Recording Setup
In this study, we employed convenience sampling to recruit participants from the general population. Participants were recruited from a variety of sources, including employees at our institute, university students, and the general public, with invitations distributed both verbally and in writing. Exclusion criteria included individuals under 18 years of age, those with epilepsy or heart conditions, any health issues affecting the autonomic nervous system, and individuals with anxiety disorders (e.g., generalized anxiety disorder, panic disorder, social anxiety disorder, or post-traumatic stress disorder). To be included in the study, participants needed to be willing to engage in scientific research and possess normal vision, minor refractive errors, or use corrective lenses. A total of 105 participants were included, with an average age of 22.43 ± 5.31 years (ranging from 19 to 45), and 75.24% identified as female. Participants had varied educational and professional backgrounds. Ethical approval for the study was obtained from the Research Ethics Committee at the Faculty of Arts, University of Maribor, Slovenia (No. 038-11-146/2023/13FFUM), as the study posed no physical, psychological, legal, or social risk to the participants.
The data from the participants were collected using the emteqPRO system, which includes a sensing mask attached to the Pico Neo 3 Pro Eye VR headset (Figure 3). The system provides both raw sensor data and derived variables through its Emotion AI Engine, which leverages data fusion and ML techniques to assess the user’s emotional state, as described in the protocol study paper [71]. A total of 27 derived variables were generated for each recording, grouped into nine categories: 7 features related to heart rate variability (HRV) and 3 related to breathing rate (all derived from PPG), 2 features representing facial expressions (from EMG), 4 for arousal (from EMG and PPG), 4 for valence (from EMG and PPG), 1 for facial activation and 1 for facial valence (both from EMG), 1 for head activity—defined as the percentage of time with detected head movement (from IMU)—and 4 features representing muscle activation from dry EMG electrodes on the zygomatic, corrugator, frontalis, and orbicularis muscles, expressed as a percentage of the maximum activation recorded during calibration [30].
These derived features are provided at varying intervals, from 10 seconds to 500 milliseconds, resulting in different data frequencies. Prior to preprocessing, the total number of instances from all participants exceeds 136.5 million.
4. Methodology
4.1. Preprocessing
The EmteqPRO system generates a separate file for each participant. As the first preprocessing step, duplicates in both columns and rows were removed for each participant, reducing the total number of features to 23, since four features had identical values.
Since all features are numeric except for one categorical feature, "Expression/Type," which has three categories—smile, frown, and neutral—we applied one-hot encoding to this feature. One-hot encoding is a preprocessing technique that converts categorical variables into a numerical format by creating separate binary (0 or 1) features for each unique category.
Next, missing values, which accounted for less than 1% of each participant’s total data, were imputed using the mean value of the respective feature for that participant. Finally, we used a StandardScaler to normalize the data by transforming each feature to have zero mean and unit variance, ensuring that all features contributed equally to the analysis. However, normalization was performed individually for each participant rather than for the entire dataset. This approach ensured that data from participants with generally lower physiological attribute values in a relaxed state was not overshadowed or deemed less significant.
4.2. Data Segmentation and Feature Engineering
Since some participants requested that specific questions be repeated after certain narrative videos, and because the initial calibration process took longer for participants who experienced discomfort with the VR headset, the session timetables varied among participants (Figure 4). Based on each participant’s timetable and the video they were watching, the data for each participant was split into six segments, labeled according to specific parts of the videos: one for the forest video, four for each emotion-related video segment, and one for the roller coaster segment.
Given that features were recorded at intervals ranging from 1 second to 500 milliseconds, the data was further divided into three time windows: 500 milliseconds, 5 seconds, and one entire video segment (each video consisting of six segments/parts). For each original feature or insight, except for the "Expression/Type" feature (which was restored to its original categorical form), the minimum, maximum, average, and standard deviation were calculated. Additionally, for the "Expression/Type" feature, the majority value was computed within each window segment, resulting in a total of 89 features.
As the final step of feature engineering, additional features were introduced. These included responses from the Personal Information Questionnaire and the Presence Questionnaire for each participant. Furthermore, features derived from the QCAE [21] were incorporated, such as perspective taking, online simulation, affective empathy, emotion contagion, and proximal responsivity. Additionally, responses related to valence, arousal, personal distress, and the three questions assessing state empathy were included [71].
5. Experimental Evaluation
5.1. Experimental Setup
5.1.1. Conducted Experiments
- Different Segments, using 500-millisecond and 5-second window sizes: We set up five different experiments, labeling the dataset in five different ways: a) binary classification of empathic arousal prediction: this aimed to predict empathic arousal by comparing empathic parts of the video with the forest part, excluding the non-empathic roller coaster segment; b) binary classification of non-empathic arousal prediction: this compared the forest and roller coaster parts of the video to predict non-empathic arousal; c) binary classification of empathic vs. non-empathic arousal: this included only empathic parts and the roller coaster, aiming to distinguish between empathic and non-empathic arousal while analyzing physiological responses to empathic content and non-empathic arousal-inducing stimuli (e.g., the roller coaster); d) binary classification of general arousal prediction: this split the dataset into two classes: the forest (representing no arousal) and everything else (including empathic parts and the roller coaster, representing arousal); e) three-class classification of arousal type prediction: this treated the forest and roller coaster as separate classes while grouping all empathic parts into one class, aiming to distinguish no arousal, empathic arousal, and non-empathic arousal without differentiating specific empathic emotions [71];
- State empathy as nominal classification, using 500-millisecond and 5-second window sizes: we aimed to predict state empathy, which reflects the temporary affective response elicited in specific situations [33]. This approach used participants’ averaged responses to the three state empathy questions for each video segment. Each empathic segment was treated separately and labeled with the corresponding state empathy responses, while the forest and roller coaster segments were labeled as zero. The goal was to predict participants’ state empathy levels during the session.
- State empathy as nominal classification, using ’one entire video segment’ window size: The target variable was obtained as an average of participants’ responses to the state empathy questions provided after each segment of the video session. However, in this case, when the ground truth was the state empathy class, we used a window size corresponding to one entire video segment (with each video consisting of six segments/parts). This window size was used consistently in all subsequent experiments.
- State empathy as ordinal classification, using ’one entire video segment’ window size: Since state empathy has ordered categories, ranging from not empathic to highly empathic, and undefined distances between levels, we applied ordinal classification.
- Trait empathy as regression, using ’one entire video segment’ window size: Since trait empathy was a continuous variable derived from the continuous attributes of cognitive empathy (perspective taking and online simulation) and affective empathy (emotion contagion and proximal responsivity) from the QCAE, we focused on predicting the affective empathy component. Affective empathy reflects the ability to feel and share another’s emotions, which aligns with the context of this study, as the participants were not required to perform actions that would test cognitive empathy, such as understanding the actors’ feelings.
- Trait empathy as classification, using ’one entire video segment’ window size: Equal interval binning was applied to the target variable, trait empathy (affective points), dividing its range (5.00 to 8.75) into equal intervals. The resulting bins were defined as follows: class 0: [5.00 - 5.75); class 1: [5.75 - 6.50); class 2: [6.50 - 7.25); class 3: [7.25 - 8.00); and class 4: [8.00 - 8.75].
5.1.2. Resampling Approaches
For schemes b), c), and e) related to the different segments outlined in Section 5.1.1, where the datasets were imbalanced (with the majority class accounting for 80% of the samples), we applied four resampling approaches for each developed model: 1) Synthetic Minority Over-sampling Technique (SMOTE): This method generates synthetic samples for the minority class to balance the dataset; 2) RandomUnderSampler (RUnderS): This method reduces the majority class by randomly selecting samples to balance the dataset; 3) SMOTETomek: This technique combines SMOTE for oversampling the minority class with the Tomek links method for undersampling the majority class, effectively addressing both class imbalances; and 4) Unaltered dataset: Models were trained on the original dataset without applying any sampling techniques.
5.1.3. Machine Learning Algorithms
We developed various models to predict participants’ state empathy classification, affective empathy classification, and to predict different segments during the VR session. For the classification tasks, seven algorithms were employed: Gaussian Naive Bayes, Stochastic Gradient Descent, K-Nearest Neighbors (KNN), RF Classifier, Decision Tree Classifier, Extreme Gradient Boosting (XGBoost) Classifier, and Logistic Regression Classifier.
For predicting participants’ affective empathy through regression, we developed models using seven different regression algorithms: RF Regressor, Decision Tree Regressor, Gradient Boosting Regressor, XGBoost Regressor, Support Vector Regressor, K-Nearest Neighbors Regressor, and Elastic Net Regressor.
Additionally, for predicting participants’ state empathy as an ordinal classification problem, four algorithms were employed: Ordinal Random Forest (ORF), Ordinal SVM (OSVM), Ordinal Gradient Boosting (OGB), and Ordinal Logistic Regression (OLR).
5.1.4. Cross-Validation Strategy
Model evaluation was conducted using a Leave-One-Subject-Out cross-validation (LOSO-CV) approach. In this method, each participant, identified by their unique ID, was excluded as a test set to assess the model’s generalization performance.
5.1.5. Evaluation Metrics
For classification, the balanced accuracy score was used to evaluate model performance, calculated as the average recall across all classes, ensuring a fair assessment in the case of imbalanced datasets. Additionally, confusion matrices were employed to compare actual and predicted labels, providing further insights into model performance.
For regression, models were evaluated using two key metrics: Mean Absolute Percentage Error (MAPE) and and Symmetric Mean Absolute Percentage Error (SMAPE). MAPE quantifies the average percentage difference between predicted and actual values, offering an intuitive measure of prediction accuracy relative to the data’s scale. In contrast, SMAPE measures the percentage error by considering both the predicted and actual values together. This symmetric approach reduces any bias from over- or under-predictions, providing a more balanced assessment.
5.2. Predicting Different Segments
A comprehensive analysis was conducted by developing models using seven classification algorithms on two window sizes (500 milliseconds and 5 seconds). These models were evaluated using four data balancing techniques— undersampling, oversampling, a combination of techniques, and the original dataset— across five different segments (labeling schemes). This resulted in a total of 280 unique confusion matrices and their corresponding accuracies for every combination (Figure 6).
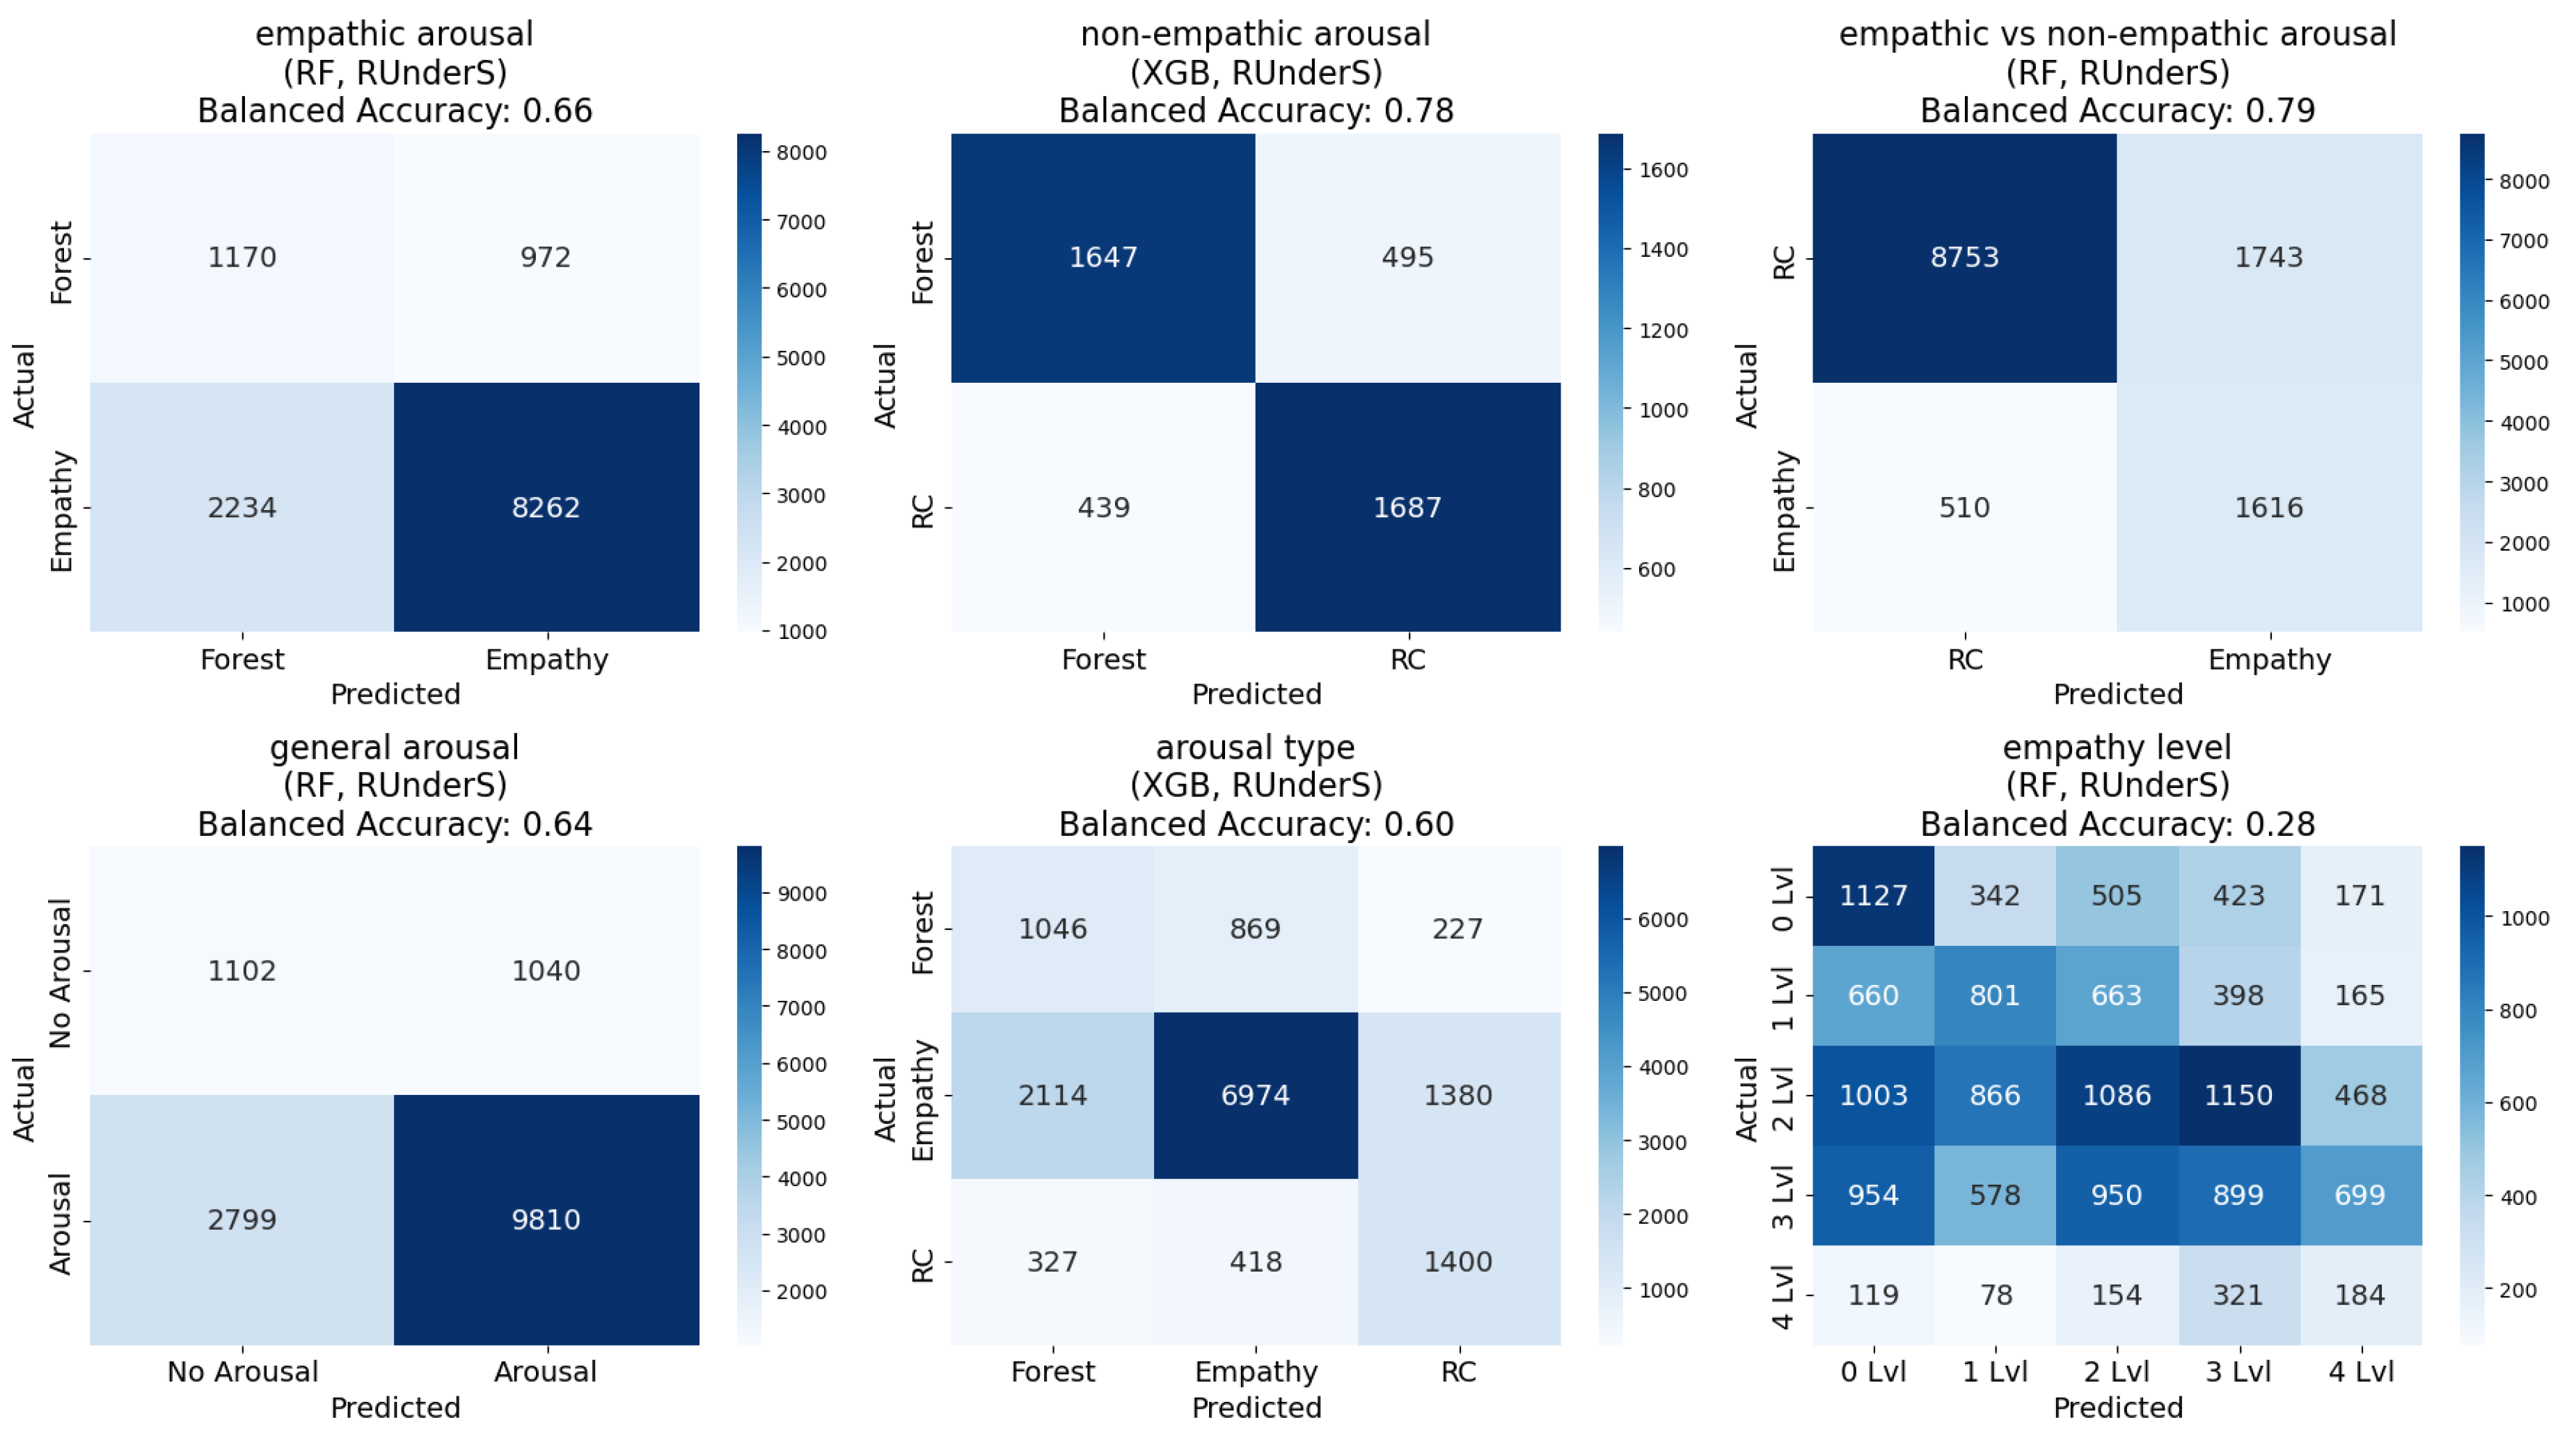
Regarding the experiments on different segments (labeling schemes), we can conclude the following: 1) empathic arousal could be predicted with relatively well-balanced confusion matrices and high accuracy across most models; 2) non-empathic arousal was also reliably predicted, with almost all models achieving balanced accuracy exceeding 60% and some reaching up to 78%, along with a reasonable balance across classes; 3) distinguishing between empathic and non-empathic arousal was possible, with balanced accuracy reaching 79%; 4) general arousal prediction demonstrated similarly high accuracy and class balance; 5) differentiating between no arousal, empathic arousal, and non-empathic arousal showed moderate success;
Regarding the two window sizes, both window sizes demonstrated similar class balance and balanced accuracy, but the 5-second interval dataset performed slightly better (Figure 6, Figure 5).
Figure 5.
The best accuracies for each group of models, developed using datasets extracted at two different frequencies (500 milliseconds and 5 seconds) and various data balancing techniques, presented for the ’different segments’ and ’empathy state level’ experiments [71].
Figure 5.
The best accuracies for each group of models, developed using datasets extracted at two different frequencies (500 milliseconds and 5 seconds) and various data balancing techniques, presented for the ’different segments’ and ’empathy state level’ experiments [71].
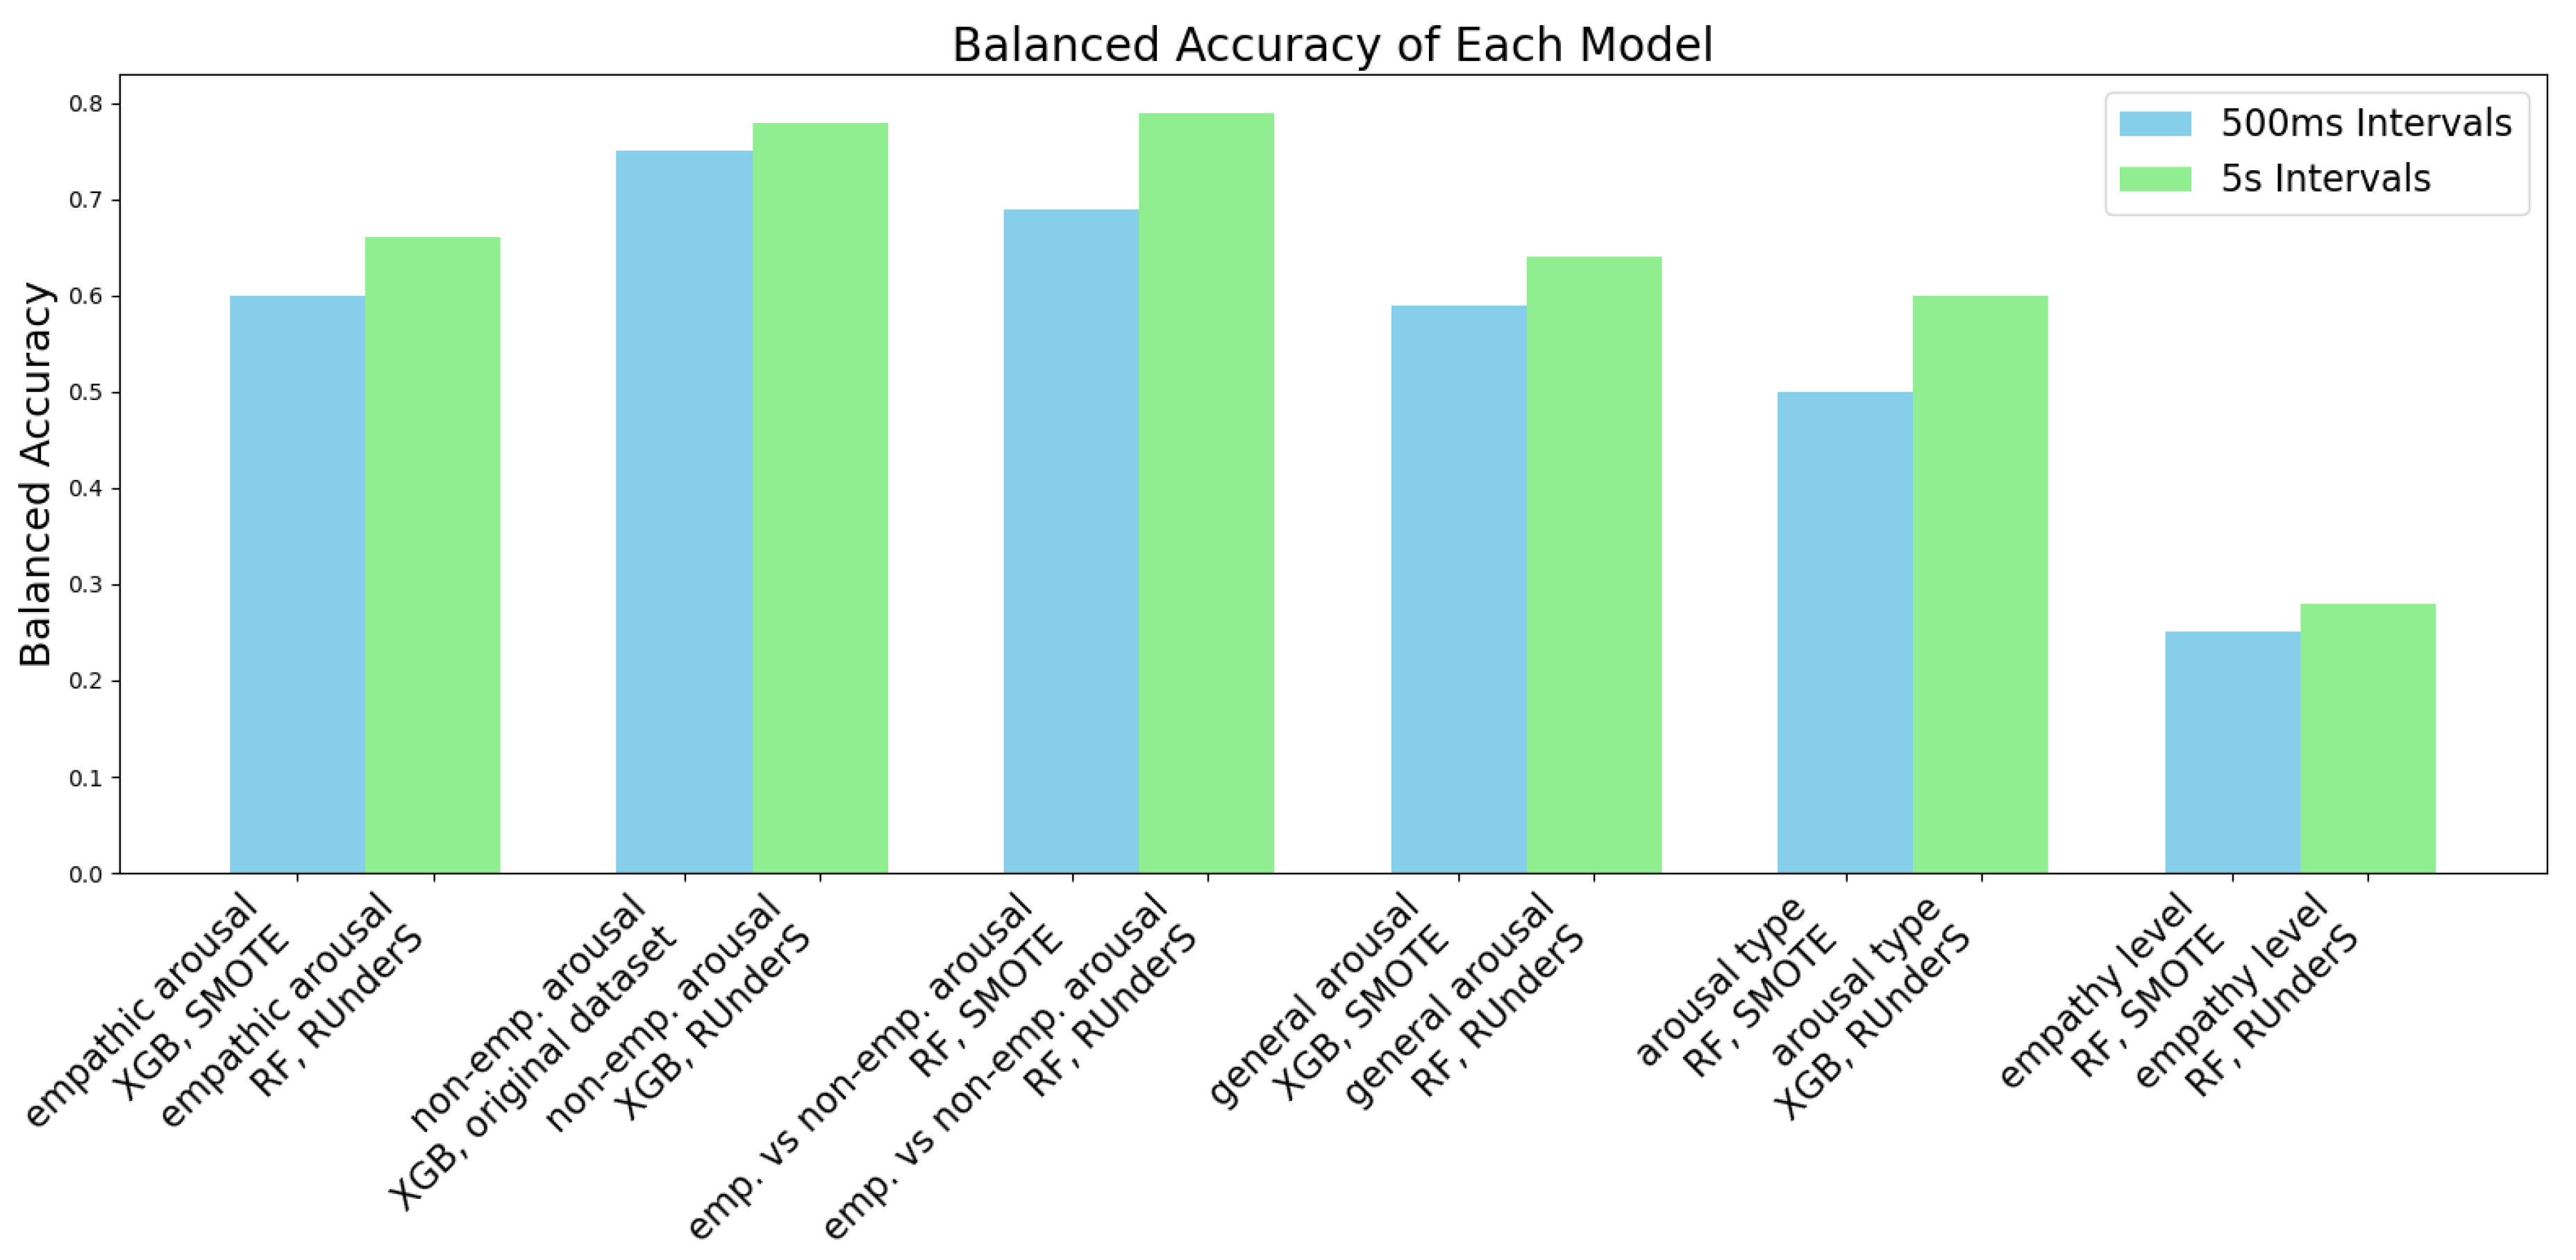
Figure 6.
The best confusion matrices for each group of models, developed using a dataset extracted with a 5s window size and various data balancing techniques, are shown for the ’different segments’ and ’empathy state level’ experiments [71].
Figure 6.
The best confusion matrices for each group of models, developed using a dataset extracted with a 5s window size and various data balancing techniques, are shown for the ’different segments’ and ’empathy state level’ experiments [71].
Regarding the data balancing techniques, the undersampling method yielded the best results for the dataset extracted at 5-second intervals, while the SMOTETomek technique produced similar or slightly lower performance. For the dataset extracted at 500-millisecond intervals, the SMOTE oversampling technique achieved the best results, followed closely by SMOTETomek or the original dataset. Overall, SMOTETomek consistently provided the best or second-best performance across all combinations of labeling schemes [71].
Regarding the classification algorithms in this case, Gaussian Naive Bayes exhibited the poorest performance, particularly in achieving balanced confusion matrices, while RF Classifier and XGBoost emerged as the top-performing algorithms across all combinations, with the RF Classifier slightly outperforming XGBoost in most segments (Figure 6, Figure 5) [71].
5.3. Predicting State Empathy
5.3.1. State Empathy Level as Nominal Classification, Using 500-millisecond and 5-second Window Sizes
The regression outputs were converted into classes by dividing the continuous scale into intervals centered around integer values (for example, values from 0.5 to 1.4 were assigned to class zero, those from 1.5 to 2.4 to class one, continuing similarly up to class four). Using the window sizes of 500 milliseconds and 5 seconds, it was very challenging to predict the precise level of empathy participants are feeling during the session, and to determine whether they are empathizing by mirroring emotions or experiencing something different while observing specific emotions. Balanced accuracy for this task reached only 28%, with confusion matrices revealing imbalances across multiple classes (Figure 6), (Figure 5) [71].
5.3.2. State Empathy as Nominal Classification, Using ’One Entire Video Segment’ Window Size
Although the State Empathy Scale we used in this study contains six grades, no average was calculated for the three questions that received a score of 0, resulting in five distinct classes (0-4) [71].
To enhance the classification process, box plots were generated to reduce the number of classes and identify optimal merges. The plots were used to examine the relationship between the five most important features and the target variable, state empathy class. These features were selected based on RF feature importance, which identified the following five most influential features: the standard deviation of the mean heart rate variability; the valence class feature, categorized as -1 (negative), 0 (neutral), or 1 (positive); the motion intensity recorded by the IMU sensor; the activation percentage of specific muscles, particularly the frontal muscles, relative to their maximum activation during the calibration session; participants’ self-report for discomfort levels experienced during the VR session after each part of the video.
The analysis of all box plots revealed a clear strategy for merging based on the distributions of features. The box plots suggest that classes 1, 2, 3, and 4 exhibit substantial overlaps in ranges, medians, and variability, which could support merging them into a single group. However, to retain meaningful distinctions, we created three classes by merging classes 1 and 2, merging classes 3 and 4, and keeping class 0 separate. This balances simplification and interpretability. The reasoning is as follows: 1) class 0 stands out with distinct medians, non-overlapping ranges, and unique variability across all features, justifying its separation; 2) classes 1 and 2 share overlapping distributions in key features like discomfort and IMU-recorded motion intensity, with aligned medians and comparable variability, supporting their merger into a single group (class 1); 3) classes 3 and 4 exhibit even greater overlap, with indistinguishable ranges and medians across features such as valence and discomfort. Minor outlier differences do not justify separate treatment, leading to their merger into class 2 (Figure 7).
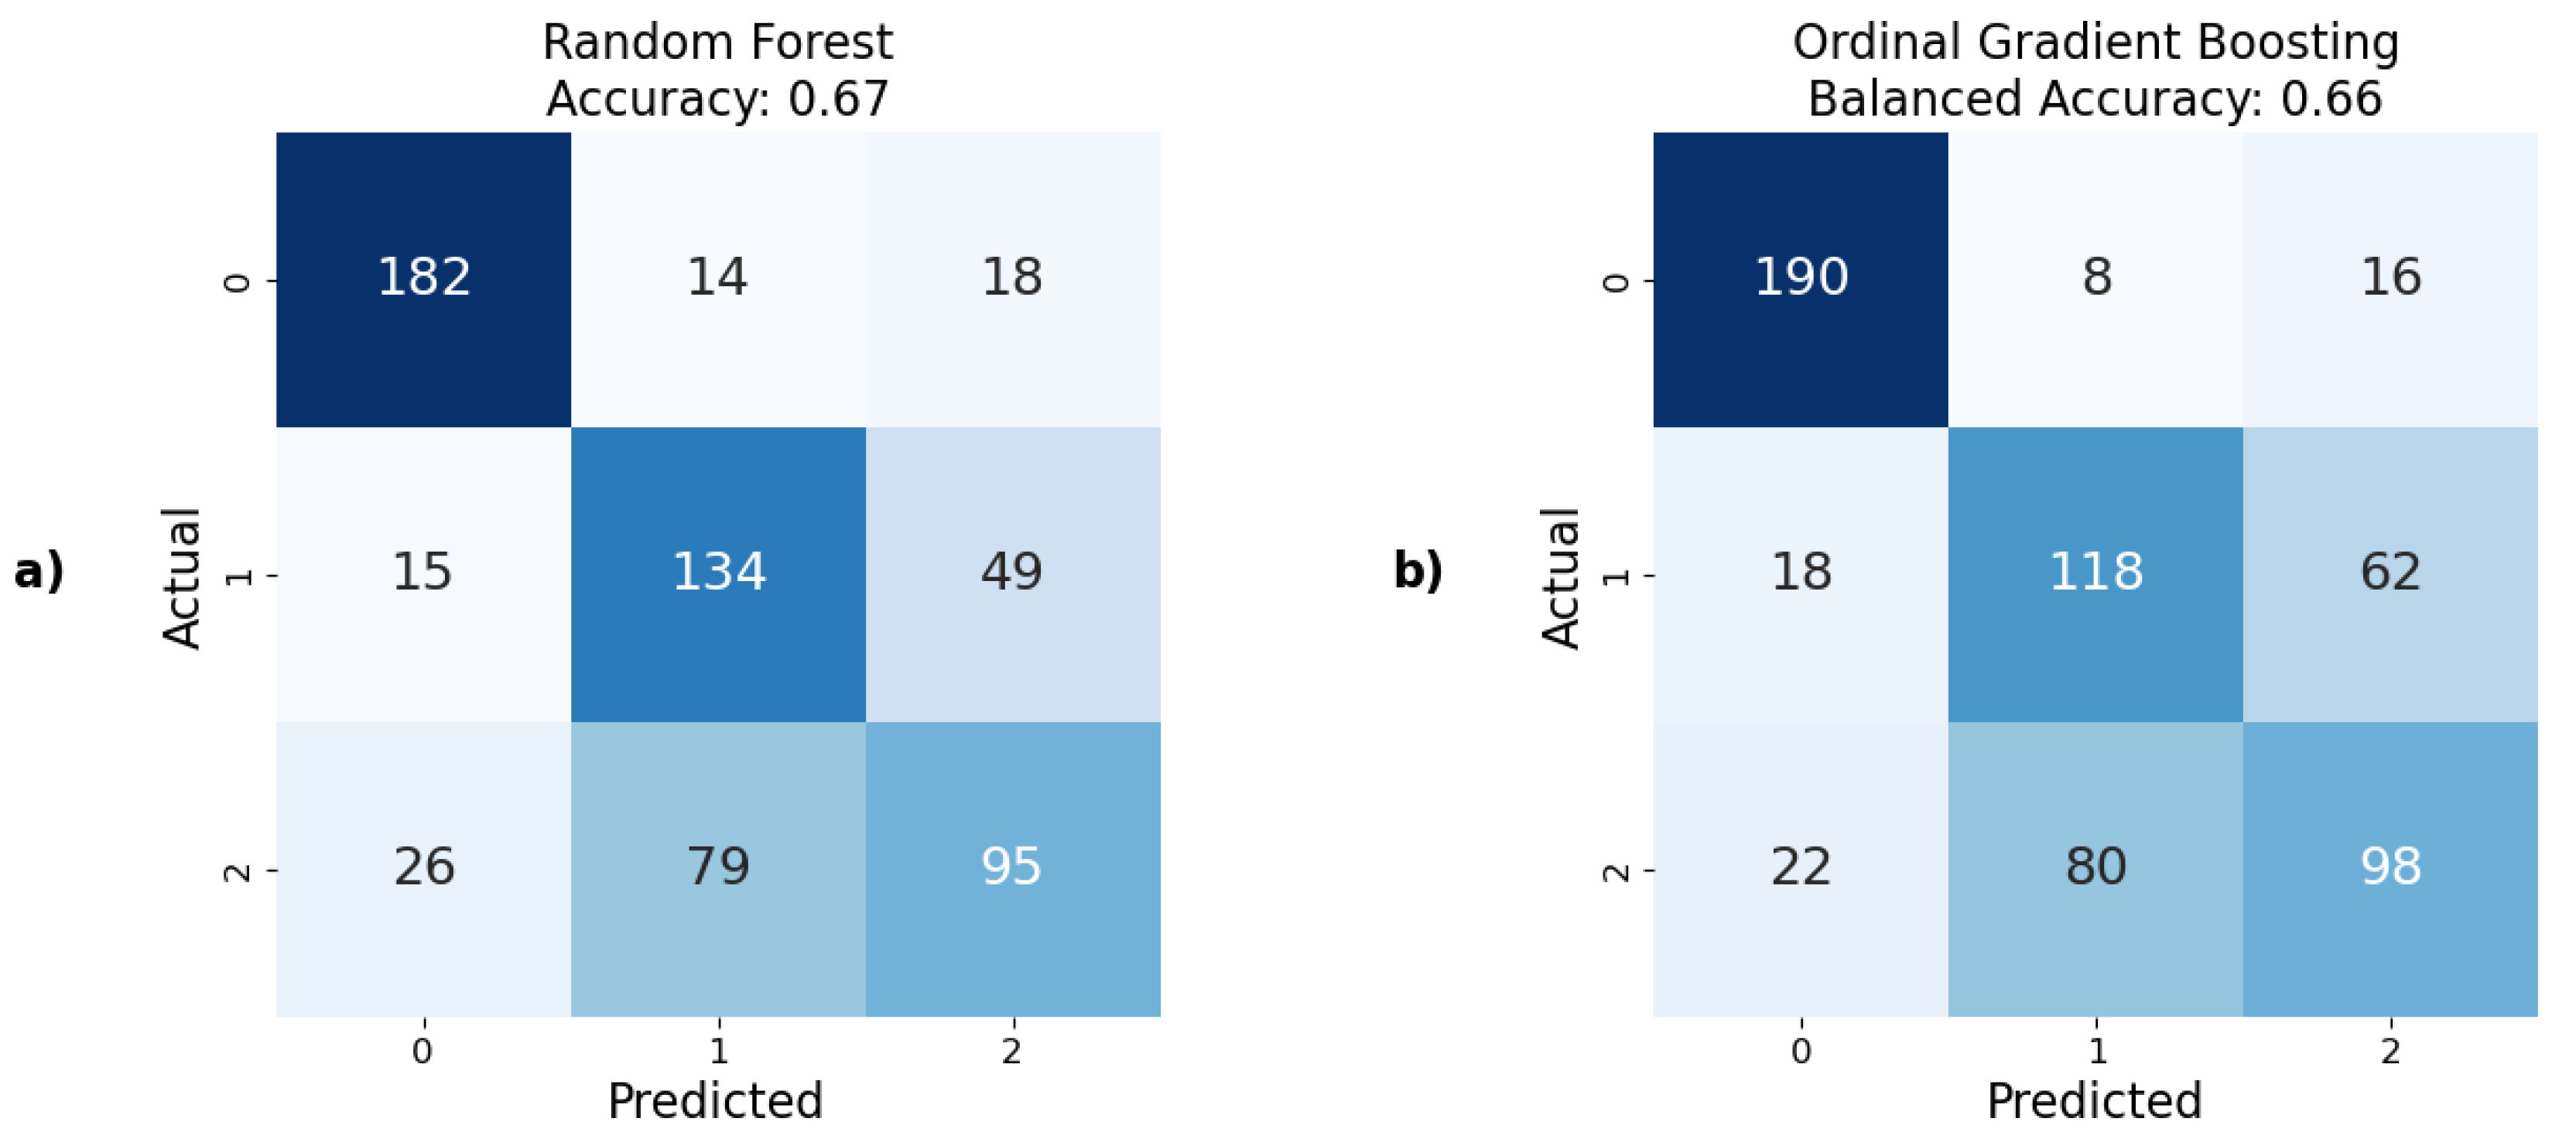
This merging strategy was applied to state empathy classification, and the results demonstrated the ability to predict state empathy using our method, with the highest balanced accuracy score of 67% achieved using the RF model (Figure 9). This was followed by XGBoost and Logistic Regression with approximately 65% balanced accuracy both (Figure 8). The lowest, but still acceptable, result was obtained using the Decision Tree model, which showed a balanced accuracy of 58%. Additionally, the confusion matrices indicated well-balanced classifications across all models.
Figure 8.
Graphical representation of balanced accuracy, comparing the best predictive models developed using various nominal and ordinal classifiers to predict state empathy.
Figure 8.
Graphical representation of balanced accuracy, comparing the best predictive models developed using various nominal and ordinal classifiers to predict state empathy.
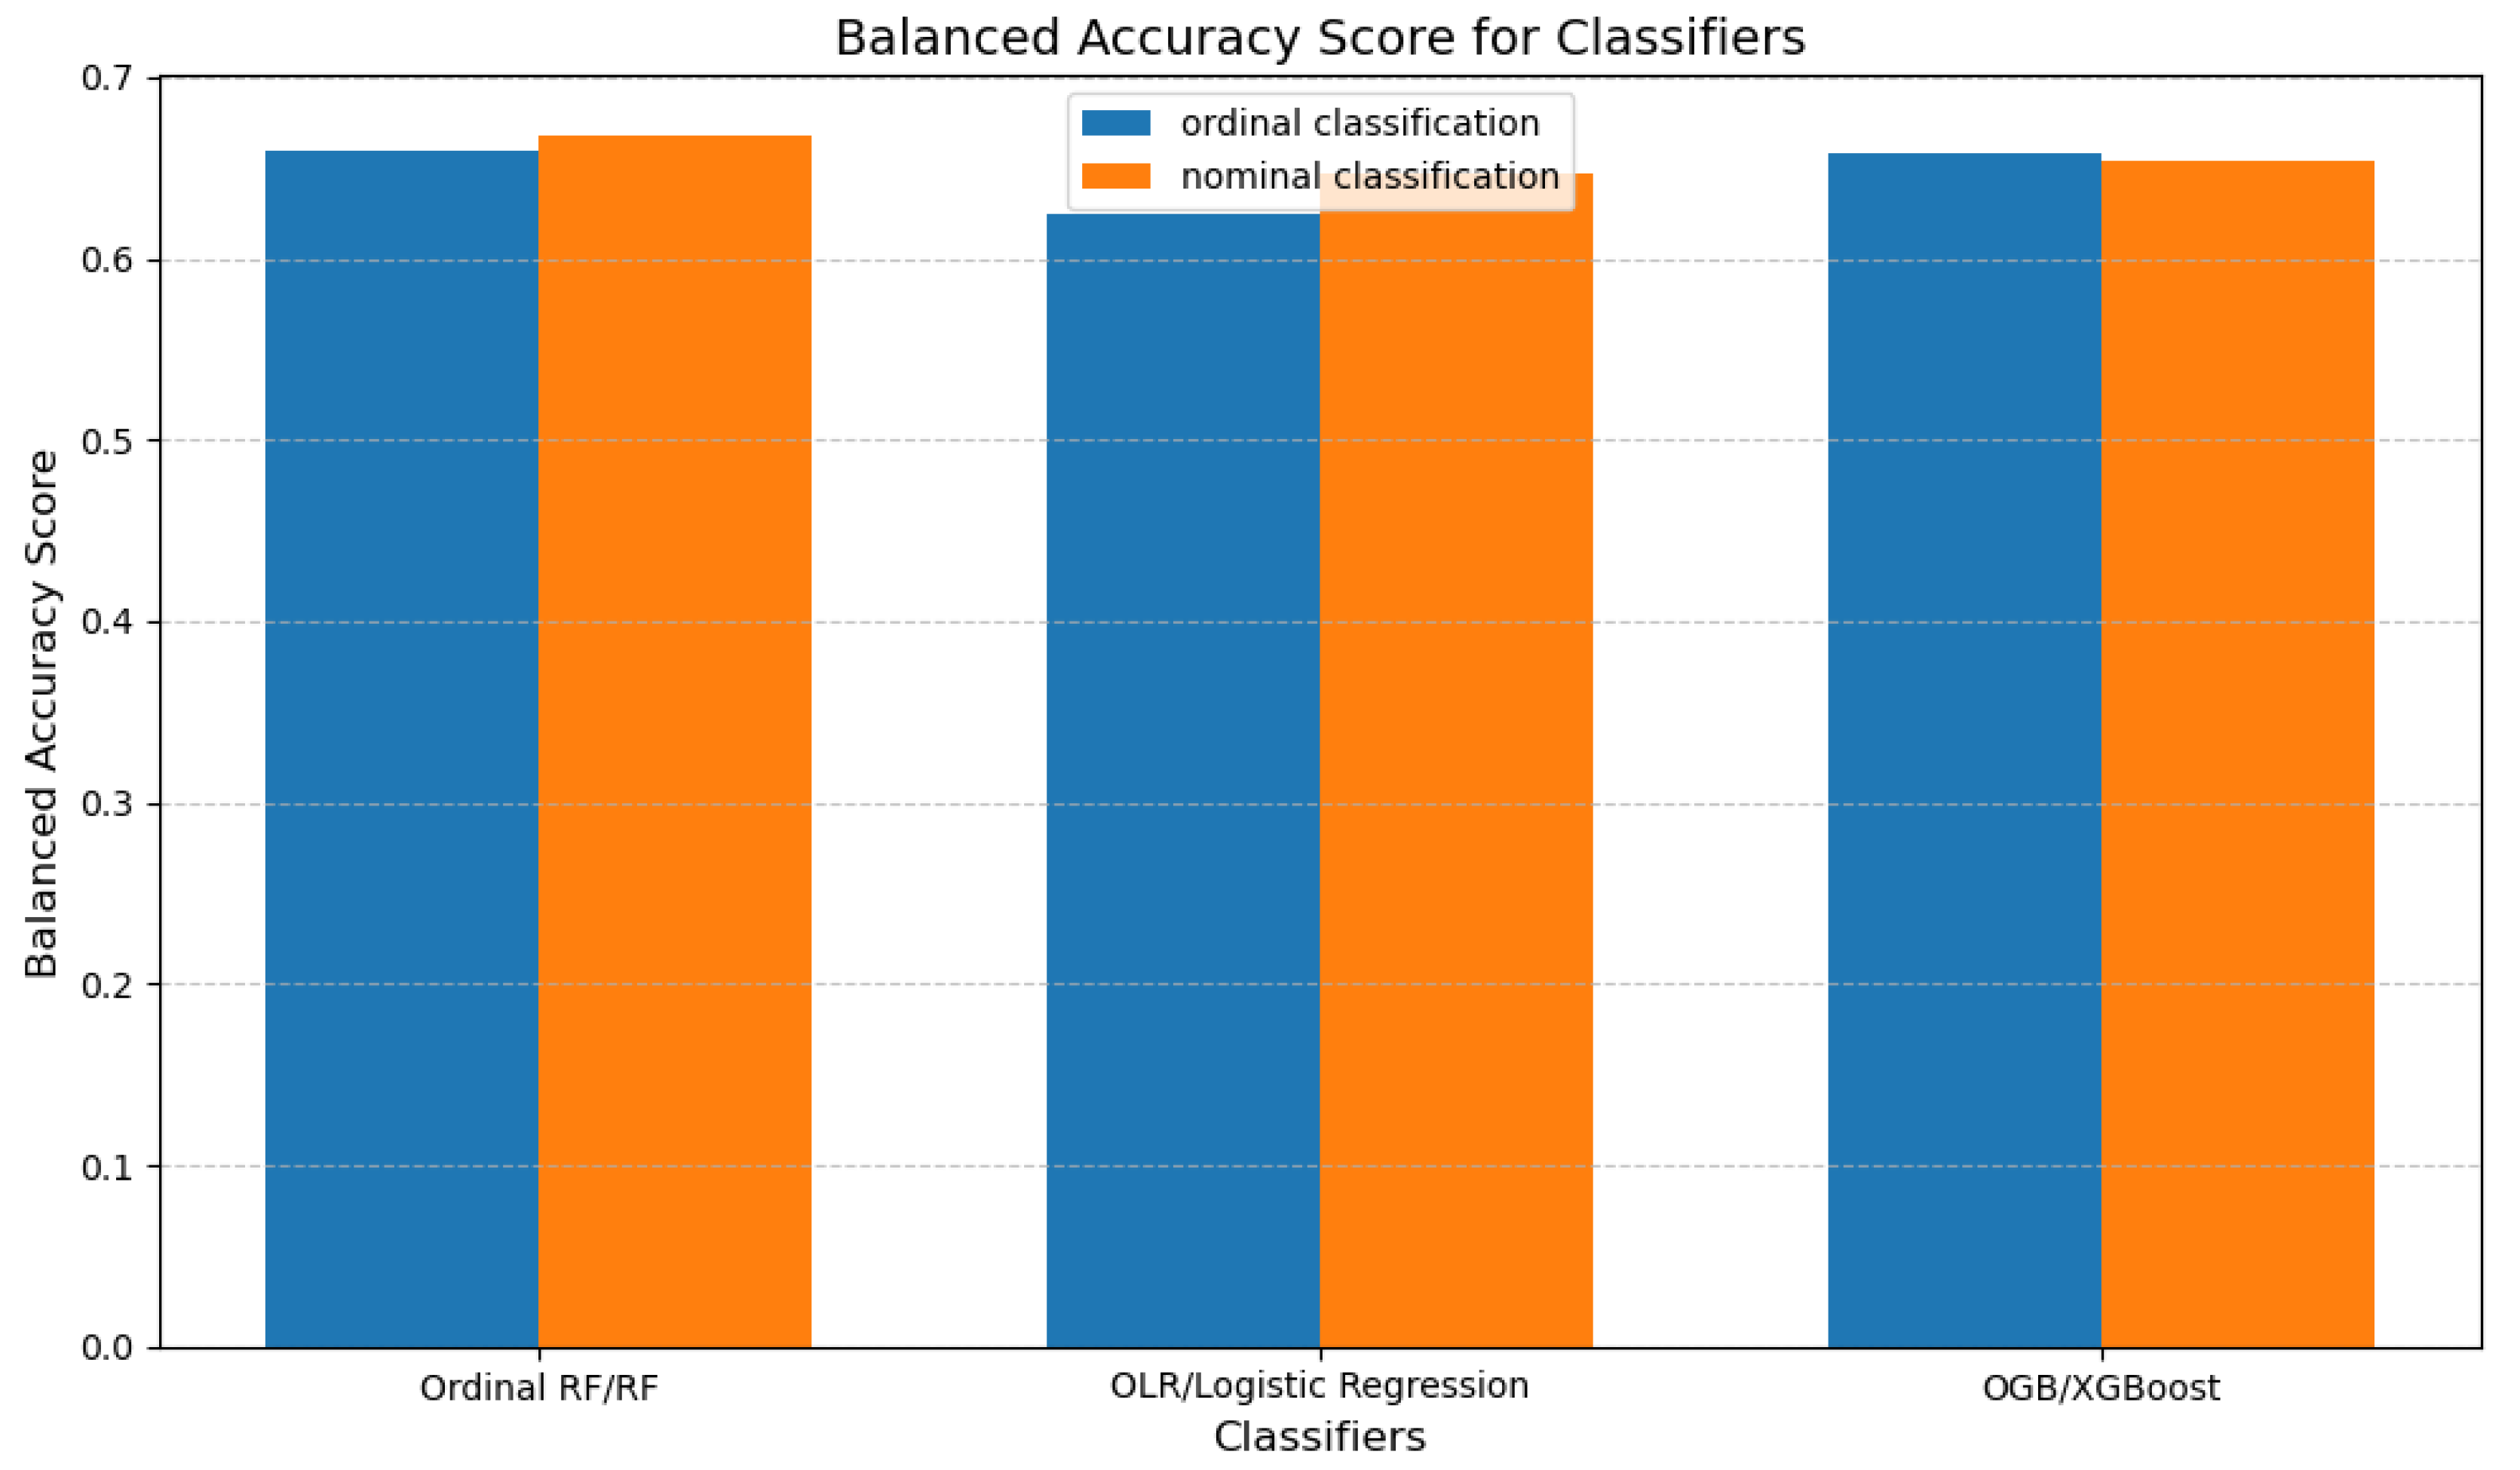
Figure 9.
The best confusion matrices and their corresponding accuracies for predicting state empathy obtained using: a) nominal classifiers; b) ordinal classifiers.
Figure 9.
The best confusion matrices and their corresponding accuracies for predicting state empathy obtained using: a) nominal classifiers; b) ordinal classifiers.
5.3.3. State Empathy as Ordinal Classification
For ordinal classification in predicting state empathy, the same classes as for nominal classification were used, the same window size, and the results were similar. The best result was obtained from the model developed using OGB, with a balanced accuracy of 66%. The worst, though still acceptable, result was obtained using the OLR models, with a balanced accuracy of 62%. The results from the Ordinal RF algorithm is 1% worse than the one obtained with nominal classification (Figure 9), (Figure 8).
5.4. Predicting Trait Empathy
5.4.1. Trait Empathy as Regression
The distribution of values for the target variable, trait empathy (affective points), ranges from 5.00 to 8.75. Prior to developing ML models, all attributes directly related to trait empathy from the QCAE (i.e., perspective taking, online simulation, emotion contagion, and proximal responsivity) were excluded to prevent data leakage. Additionally, a subsequent experiment was conducted where all questionnaire-obtained data were excluded.
When predicting trait empathy as regression, we achieved moderate success. Since the developed models used not only sensor data but also questionnaires’ responses as features, and the target value was based on a questionnaire, the inclusion of questionnaire data introduced significant bias, as these responses were self-reported by the participants. The best performance was achieved with the RF model, yielding a MAPE of 9.1%. This was closely followed by the SVR model with a MAPE of 9.3%. In contrast, the Decision Tree algorithm performed notably worse, with a MAPE of 12.8% (Figure 10).
Subsequently, models were developed using only sensor data, excluding questionnaires’ responses. As anticipated, this omission resulted in higher prediction errors. However, the increase was not as substantial as expected, even though the features used to predict trait empathy differed very little among the first 50 features, suggesting minimal variation in their predictive value. The ElasticNet model produced the best results in this scenario, achieving a MAPE of approximately 10.2%, followed by the Gradient Boosting model with a MAPE of 10.4%. Notably, most models demonstrated errors within a narrow range of 10.4% to 11.5%, except for the Decision Tree model, which again exhibited the highest error with a MAPE of 14.9% (Figure 11).
5.4.2. Trait Empathy as Classification
When the ground truth is the trait empathy class, to optimize the classification process, box plots were employed to reduce the number of classes and identify the most effective method for merging them. The plots were generated for the five most important features and the target variable, trait empathy class. The most important features were identified using RF feature importance. An important note is that the importance of the features when predicting trait empathy differed very little among the first 50 features. However, trait empathy was most strongly influenced by the following features: participants’ ages; the average and minimum values of participants’ state empathy feedback reported after each part of the VR session; responses regarding immersion in the VR experience and difficulties encountered during the session, based on the Bongiovi Report presence questionnaire. The review of all five box plot graphs suggested the most consistent merging approach involved merging classes 0 and 1, merging classes 2 and 3, and keeping class 4 separate. This strategy strikes a balance between simplifying the data and preserving key distinctions, guided by the analysis of medians, ranges, and variability across the classes. The reasoning behind this approach is as follows: 1) classes 0 and 1 exhibit similar medians, overlapping ranges, and comparable variability, justifying their merger. Their key features, such as age and average state empathy feedback, show only minor differences, making them indistinguishable as separate groups; 2) classes 2 and 3 also display highly similar distributions, with only slight variations, such as minor differences in state empathy minimum. Their substantial overlap supports combining them into a single category; 3) class 4 remains distinct, characterized by a broad range, lack of a clear median, and unique variability. This merging strategy simplifies classification while preserving essential data patterns (Figure 12).
This merging approach was applied for trait empathy classification, but the results were suboptimal. Balanced accuracy scores for the predictive models ranged from 37% with Logistic Regression to 46% with RF. Furthermore, all developed models exhibited highly imbalanced confusion matrices, with the minority class consistently yielding zero true positives. Consequently, trait empathy prediction in this case could not be effectively addressed as a classification problem.
5.5. Statistical Tests
We conducted statistical analyses to examine the influence of various factors on participants’ empathic responses.
5.5.1. Narrative vs. Non-Narrative Versions
Given that our study included five video versions (four narrative and one non-narrative), we employed a one-way Analysis of Variance (ANOVA) to determine whether participants exhibited greater empathy when they were aware of the backstory behind a person’s emotions (narrative videos) compared to when they were only observing the emotions without any contextual narrative (non-narrative video).
The ANOVA results show that there is no significant difference in state empathy across video groups. The f-statistic, which is defined as the ratio of variance between groups to the variance within groups, was calculated as 0.51, with a corresponding p-value of 0.72. The p-value represents the probability of obtaining results at least as extreme as the observed results, assuming the null hypothesis is true. Since the p-value is greater than 0.05, we conclude that there is no significant difference.
5.5.2. Gender of the Actor
To investigate whether participants were more empathetic toward female or male actors, we conducted an independent samples t-test. This test compared the empathy levels elicited by the two video versions featuring female actors with the two video versions featuring male actors. By classifying the videos into "Female" and "Male" categories, we aimed to assess whether there was a significant difference in empathy based on the gender of the actor.
The t-test results show that there is no significant difference in state empathy between the female and male video versions. This conclusion is based on the T-statistic, which measures the difference between the means of two groups relative to the variation in the data, indicating how much the groups differ in standard error units. In this case, the t-statistic is 1.18, and the p-value is 0.24.
5.5.3. Type of Emotion
To investigate whether empathy levels differ across various emotional states represented by video scenes (Sad, Anxiety, Happiness, and Anger), we performed an ANOVA analysis. This analysis examines the variance in empathy levels attributable to the video scene (emotional state) while also considering individual differences across participants. The ANOVA results indicated a significant difference in empathy levels between some video versions, with an f-statistic of 25.42 and a very small p-value (1.07 × ), suggesting that the video scene explains a substantial amount of the variance in empathy scores.
Following the ANOVA, we conducted pairwise comparisons using Tukey’s HSD (Honest Significant Difference) post-hoc test to identify which specific emotional states evoked significantly different empathy scores. This test compares the differences between each pair of groups while controlling for the family-wise error rate, ensuring that the likelihood of a Type I error is kept at 5% across all comparisons. The family-wise error rate refers to the probability of making one or more Type I errors (false positives) when conducting multiple statistical tests simultaneously.
From the Tukey HSD results, we can see that:
- There is a significant difference between "Anger" and "Happiness" (mean difference = 0.8627, p-value < 0.05), indicating that participants are more empathetic towards the "Happiness" emotion.
- Similarly, there is a significant difference between "Anger" and "Sad" (mean difference = 0.3725, p-value < 0.05), showing greater empathy towards "Sad" emotions.
- There is also a significant difference between "Anxiety" and "Happiness" (mean difference = 0.6863, p-value < 0.05), where participants are more empathetic towards "Happiness."
- There is a significant difference between "Happiness" and "Sad" (mean difference = -0.4902, p-value < 0.05), indicating higher empathy towards "Happiness."
- However, there is no significant difference between "Anger" and "Anxiety" (mean difference = 0.1765, p-value = 0.4595), and between "Anxiety" and "Sad" (mean difference = 0.1961, p-value = 0.3639), indicating that empathy levels for these emotions are more similar.
Overall, participants show the most empathy towards "Happiness" and "Sad," and the least empathy towards "Anger," as shown by the mean differences and p-values from the Tukey HSD test (Table 1).
6. Discussion And Concluding Remarks
This study introduces an objective and efficient method for predicting both trait and state empathy using physiological responses recorded while participants viewed specially created 3D and 360-degree VR videos. These are the first publicly available VR videos designed explicitly to evoke empathy, created with attention to minimizing biases and subjective influence. Our sensor-based models effectively identified empathic versus non-empathic states, measured general arousal, and distinguished between empathic and non-empathic arousal responses.
Understanding and measuring empathy in this way has wide-ranging implications. In mental health, it offers a framework for identifying empathy deficits and tailoring therapeutic interventions. In VR and empathy training programs—where immersive content is used to challenge perspectives and build empathic skills—our models can guide and assess training effectiveness. In entertainment, the ability to measure empathy in real time enables adaptive VR content that fosters stronger emotional engagement and self-awareness.
Statistical analysis showed that empathy levels were consistent regardless of whether participants understood the causes of others’ emotions and regardless of gender. However, significant differences were found across emotional stimuli: participants expressed higher empathy toward sadness and happiness than toward anger or anxiety. Notably, both narrative and content-free videos elicited comparable empathic responses, further supporting the robustness of our approach.
In summary, this work offers a novel, scalable, and objective framework for empathy prediction, enabling new directions for research and applications across psychology, healthcare, education, and immersive media.
6.1. Strengths and Limitations
Through this research, we gained a comprehensive understanding of the outcomes and future directions for advancing empathy research. However, alongside our findings, it is crucial to acknowledge specific limitations.
The sensors used in this study are not practical for everyday use, limiting the immediate applicability of the empathy measurement methods we developed. Nevertheless, they are well-suited for use in VR environments, where measuring empathy is particularly valuable. VR provides an immersive platform for empathy training and measurement. However, a notable limitation of this study is its design, which is more appropriate for laboratory settings than real-world applications, potentially affecting the naturalistic validity of the empathic responses measured.
Despite our efforts to deeply immerse participants and minimize potential disruptions, certain practical considerations arose. For example, facial sensors integrated into the VR headset excluded participants who wore glasses, which reduced the representation of older individuals in the sample. Our study primarily included participants aged 19 to 45 years, which limited the ability to generalize findings to older populations who might have exhibited different physiological attributes and empathy responses.
In statistical modeling, established methodologies can determine the required sample size for model stability. However, for ML models, this calculation is less precise. While we believe the 105 participants included in our study provided a sufficient sample size to develop stable predictive models, we cannot determine with certainty how additional participants might have impacted the results.
The use of convenience sampling, while logistically efficient, presents potential biases, as the sample may not fully represent the broader population. This self-selection bias could limit the generalizability of our findings. However, this approach enabled efficient participant recruitment and extensive data collection in a controlled laboratory environment. Despite these limitations, we believe our study yielded valuable insights into the relationships between empathy, physiological responses, and immersive VR experiences within the scope of our sample.
One significant challenge in this study was establishing a reliable ground truth for measuring empathy. To address this, we used self-reported questionnaires. Although self-assessments come with limitations—such as social desirability bias (participants responding in ways they believe are expected), limited self-awareness, misinterpretation of questions, and fatigue effects from longer forms—they also offer several important advantages. Self-reports provide access to participants’ internal states, offering insight into thoughts and feelings that are not externally observable. Among the available empathy measurement methods, they were the most practical and efficient for our study design: quick to administer and analyze, cost-effective, scalable, and standardized. We selected well-established and validated questionnaires from the literature to ensure reliability and comparability across participants, as all used the same format. Furthermore, since we ultimately grouped participants based on sensor-derived features using box plots, the consistency of the empathy data labels remained unchanged. To reduce the risk of fatigue, we carefully chose short and clear questionnaires. Since participation was anonymous and part of an experiment, there were no expected “correct” answers, reducing pressure on participants. Additionally, we addressed the potential inaccuracy of momentary self-reflection by using two distinct tools: a three-item state empathy questionnaire and a 31-item trait empathy questionnaire. This dual approach helped reduce bias and encouraged more thoughtful and comprehensive responses.
Statistical analyses were conducted to evaluate empathy across different dimensions. For example, we investigated whether participants exhibited greater empathy for certain emotions and obtained detailed results for all emotions studied. However, these findings may have been influenced by the specific scenes, actors, or performances used in the videos. To reduce this potential bias, we created five different video versions where actors rotated through emotional scenes to ensure a more objective evaluation of empathic responses.
Our findings demonstrated the effective prediction of empathic arousal and the development of predictive models for state and trait empathy based on physiological attributes captured by sensors. However, it is important to note that while physiological changes were predicted, these changes cannot be definitively attributed to empathy alone. The psychological concept of pure empathy, as distinct from empathy mixed with other emotions, remains undefined. To address this complexity, we included non-narrative video versions to reduce the influence of subjective feelings and incorporated an RC (controlled) video segment as a baseline. These measures aimed to minimize errors in empathy prediction and enhance the validity of our results.
6.2. Future Work
After building predictive models using standard ML regressors and classifiers, we plan to expand our research by conducting deep learning experiments, such as end-to-end neural networks, to predict state and trait empathy. Additionally, we plan to extract more features directly from the raw data, moving beyond the affective insights provided by the EmteqPRO system. We also intend to make the dataset publicly available, similar to the 3D and 360° videos that are already being provided as supplementary material, as it offers a valuable resource for empathy research. Currently, there is a notable lack of comparable datasets and video materials in this field. Our plans fully comply with ethical guidelines, with informed consent obtained from all actors featured in the video recordings and from each participant, ensuring the data will be appropriately anonymized before sharing.
Author Contributions
Conceptualization, E.K. and M.L.; methodology, E.K. and H.G. and M.L.; software, E.K.; validation, E.K.; investigation, E.K.; writing—original draft preparation, E.K.; writing—review and editing, E.K. and M.L.; visualization, E.K.; supervision, H.G. and M.L. All authors have read and agreed to the published version of the manuscript.
Funding
Not applicable.
Institutional Review Board Statement
Ethical approval for the study was obtained from the Research Ethics Committee at the Faculty of Arts, University of Maribor, Slovenia (No. 038-11-146/2023/13FFUM).
Informed Consent Statement
Informed consent was obtained from all subjects involved in the study.
Data Availability Statement
Not applicable.
Acknowledgments
This work was supported by the Slovenian Research and Innovation Agency (ARIS) through the young researcher PhD program, grant PR-12879. The technical aspects of the videos, the recording and video editing were skillfully conducted by Igor Djilas and Luka Komar. The actors featured in the videos were Sara Janašković, Kristýna Šajtošová, Domen Puš, and Jure Žavbi. The questionnaires were selected and created, the narratives were written, and the psychological aspects of the video creation were considered by Kristina Šparemblek.
Conflicts of Interest
The authors declare no conflict of interest.
References
- Lee, J.-H. , Lee, S. E., & Kwon, Y.-S. (2024). Exploring empathic engagement in immersive media: An EEG study on mu rhythm suppression in VR. PLOS ONE. [CrossRef]
- Sussex Innovation Centre. (n.d.). Virtual Reality study investigating the affective and behavioural impact of enhanced audio-acoustics (Bongiovi). Science Park Square, Brighton BN1 9SB.
- Liu, J. , Mak, P., Chan, K., Cheung, D., Cheung, K., Fong, K., Kor, P., Lai, T., &; Maximo, T. (2024). The effects of immersive virtual reality–assisted experiential learning on enhancing empathy in undergraduate health care students toward older adults with cognitive impairment: Multiple-methods study. JMIR Medical Education, 10, e48566. [Google Scholar] [CrossRef]
- Riva, G., Waterworth, J. A., & Waterworth, E. LThe layers of presence: A bio-cultural approach to understanding presence in natural and mediated environments. CyberPsychology & Behavior 2004, 7, 402–416.
- Rehl, D. , Mangapora, M., Love, M., Love, C., Shaw, K., McCarthy, J., & Beverly, E. A. Feasibility of a cinematic-virtual reality training program about opioid use disorder for osteopathic medical students: A single-arm pre–post study. Journal of Osteopathic Medicine, 2024; 124, 509–516. [Google Scholar] [CrossRef]
- Slater, M. , Antley, A., Davison, A., Swapp, D., Guger, C., Barker, C., & Sanchez-Vives, M. V. (2006). A virtual reprise of the Stanley Milgram obedience experiments. PLOS ONE 1(1), e39.
- Abdel-Ghaffar, E. A., & Salama, M. (2024). The effect of stress on a personal identification system based on electroencephalographic signals. Sensors. 24, 4167. [CrossRef]
- Ahn, S. J. (Grace), Bostick, J., Ogle, E., Nowak, K. L., McGillicuddy, K. T., & Bailenson, J. N. Experiencing nature: Embodying animals in immersive virtual environments increases inclusion of nature in self and involvement with nature. Journal of Computer-Mediated Communication, 2016; 21, 399–419. [CrossRef]
- Nourriz, S. , Bezabih, A. , & Smith, C. E. (2024). On the design risks of empathy fatigue. In Proceedings of the 3rd Empathy-Centric Design Workshop: Scrutinizing Empathy Beyond the Individual (EmpathiCH ’24) (pp. 34–39). ACM. [Google Scholar] [CrossRef]
- Nan, J. , Herbert, M. S., Purpura, S., et al. Personalized machine learning-based prediction of wellbeing and empathy in healthcare professionals. Sensors, 2024; 24, 2640. [Google Scholar] [CrossRef]
- Anderson, T. Anderson, T., Duffy, G., & Corry, D. (2024). Virtual reality education on myalgic encephalomyelitis for medical students and healthcare professionals: A pilot study. BMC Medical Education 2024, 24, 1018. [Google Scholar] [CrossRef]
- Banakou, D. , Hanumanthu, P. D., & Slater, M. (2016). Virtual embodiment of white people in a black virtual body leads to a sustained reduction in their implicit racial bias. Frontiers in Human Neuroscience, 2676. [Google Scholar]
- Mehrabian, A. , & Epstein, N. A measure of emotional empathy. Journal of Personality 1972, 40, 525–543. [Google Scholar] [CrossRef]
- Raposo, R. , Vairinhos, M., Laska-Leśniewicz, A., & Sztobryn-Giercuszkiewicz, J. (2024). Increasing awareness and empathy among university students through immersive exercises – Testing of the virtual reality application: A pilot study. [CrossRef]
- Lima, F. F. D., & Osório, F. D. L. Empathy: Assessment instruments and psychometric quality – A systematic literature review with a meta-analysis of the past ten years. Frontiers in Psychology. 2021, 12, 781346.
- Mercado-Diaz, L. R. , Veeranki, Y. R., Large, E. W., &; Posada-Quintero, H. F. (2024). Fractal analysis of electrodermal activity for emotion recognition: A novel approach using detrended fluctuation analysis and wavelet entropy. Sensors, 24(24), 8130. [Google Scholar] [CrossRef]
- Barbot, B., & Kaufman, J. C. What makes immersive virtual reality the ultimate empathy machine? Discerning the underlying mechanisms of change. Computers in Human Behavior, 2020; 111, 106431.
- Baron-Cohen, S., & Wheelwright, S. The empathy quotient: An investigation of adults with Asperger syndrome or high functioning autism, and normal sex differences. Journal of Autism and Developmental Disorders, 2004; 34, 163–175.
- Batson, C. D. (2011). Altruism in humans. Oxford University Press.
- Benoit, M. , Guerchouche, R., Petit, P. D., Chapoulie, E., Manera, V., Chaurasia, G., et al. Is it possible to use highly realistic virtual reality in the elderly? A feasibility study with image-based rendering. Neuropsychiatric Disease and Treatment 2015, 557–563. [Google Scholar]
- Reniers, R. L., Corcoran, R., Drake, R., Shryane, N. M., & Völlm, B. A. (2011). The QCAE: A questionnaire of cognitive and affective empathy. Journal of Personality Assessment, 93(1), 84–95. [CrossRef]
- Van Loon, A. , Bailenson, J., Zaki, J., Bostick, J., & Willer, R. Virtual reality perspective-taking increases cognitive empathy for specific others. PLOS ONE, 2018; 1, 3. [Google Scholar]
- Bouchard, S. , Bernier, F., Boivin, É., Dumoulin, S., Laforest, M., Guitard, T., Robillard, G., Monthuy-Blanc, J., & Renaud, P. (2013). Empathy toward virtual humans depicting a known or unknown person expressing pain. Cyberpsychology, Behavior, and Social Networking 2013, 16, 61–71. [Google Scholar] [PubMed]
- Van Boxtel, A. Facial EMG as a tool for inferring affective states. In Proceedings of Measuring Behavior 2010, 2, 104–108.
- Bradley, M. M. , & Lang, P. J. (1994). Measuring emotion: The self-assessment manikin and the semantic differential. Journal of Behavior Therapy and Experimental Psychiatry. 25(1), 49–59.
- Dar, M. N., Akram, M. U., Subhani, A. R., et al. Insights from EEG analysis of evoked memory recalls using deep learning for emotion charting. Scientific Reports 2024, 14, 17080. [CrossRef]
- Russell, J. A., & Barrett, L. F. (1999). Core affect, prototypical emotional episodes, and other things called emotion: Dissecting the elephant. Journal of Personality and Social Psychology, 76(5), 805–819. [CrossRef]
- Davis, M. H. (1980). A multidimensional approach to individual differences in empathy. JSAS Catalog of Selected Documents in Psychology.
- Tucek, T. (2024). Enhancing empathy through personalized AI-driven experiences and conversations with digital humans in video games. In Companion Proceedings of the 2024 Annual Symposium on Computer-Human Interaction in Play (CHI PLAY Companion ’24) (pp. 446–449). ACM. [CrossRef]
- Gnacek, M. , Podlesek, A., Pelicon, A., Štrumbelj, E., & Pogačnik, M. (2022). emteqpro—fully integrated biometric sensing array for non-invasive biomedical research in virtual reality. Frontiers in Virtual Reality, 1218. [Google Scholar] [CrossRef]
- Shen, L. On a scale of state empathy during message processing. Western Journal of Communication 2010, 74, 504–524. [Google Scholar] [CrossRef]
- Neumann, M., Edelhäuser, F., Tauschel, D., Fischer, M. R., Wirtz, M., Woopen, C., Haramati, A., & Scheffer, C. (2011). Empathy decline and its reasons: a systematic review of studies with medical students and residents. Academic Medicine, 86(8), 996–1009. [CrossRef]
- Van der Graaff, J., Meeus, W., de Wied, M., van Boxtel, A., van Lier, P. A., & Koot, H. M. (2016). Motor, affective and cognitive empathy in adolescence: Interrelations between facial electromyography and self-reported trait and state measures. Cognition and Emotion 2016, 30, 745–761.
- Fusaro, M., Tieri, G., & Aglioti, S. M. Seeing pain and pleasure on self and others: Behavioral and psychophysiological reactivity in immersive virtual reality. Journal of Neurophysiology 2016, 116, 2656–2662.
- Wijma, E. M. , Veerbeek, M. A., Prins, M., Pot, A. M., & Willemse, B. M. (2018). A virtual reality intervention to improve the understanding and empathy for people with dementia in informal caregivers: Results of a pilot study. Aging & Mental Health, 2018; 22, 1121–1129. [Google Scholar]
- Olderbak, S. , Sassenrath, C., Keller, J., & Wilhelm, O. (2014). An emotion-differentiated perspective on empathy with the emotion specific empathy questionnaire. Frontiers in Psychology. 5, 653.
- Fusaro, M., Tieri, G., & Aglioti, S. M. (2019). Influence of cognitive stance and physical perspective on subjective and autonomic reactivity to observed pain and pleasure: An immersive virtual reality study. Consciousness and Cognition, 67, 86–97.
- Greuter, S. , & Mulvany, G. T. (2024). Designing a virtual death VR experience. In Companion of the 2024 ACM Int. Joint Conf. on Pervasive and Ubiquitous Computing (UbiComp ’24) (pp. 328–332). ACM. [CrossRef]
- Han, S. (2015). Understanding cultural differences in human behavior: a cultural neuroscience approach. Current Opinion in Behavioral Sciences, 3, 68–72.
- Ma-Kellams, C., & Lerner, J. Trust your gut or think carefully? Examining whether an intuitive, versus a systematic, mode of thought produces greater empathic accuracy. Journal of Personality and Social Psychology 2016, 111, 674.
- Sanchez-Vives, M.V.; Slater, M. From presence to consciousness through virtual reality. Nature Reviews Neuroscience 2005, 6, 332–339. [Google Scholar] [CrossRef]
- Mado, M. Mado, M., Herrera, F., Nowak, K., & Bailenson, J. Effect of virtual reality perspective-taking on related and unrelated contexts. Cyberpsychology, Behavior, and Social Networking 2021, 24, 839–845. [Google Scholar] [PubMed]
- Keysers, C., & Gazzola, V. (2007). Integrating simulation and theory of mind: from self to social cognition. Trends in Cognitive Sciences, 11, 194–196.
- Thomas, M. R., Dyrbye, L. N., Huntington, J. L., Lawson, K. L., Novotny, P. J., Sloan, J. A., & Shanafelt, T. D. (2007). How do distress and well-being relate to medical student empathy? A multicenter study. Journal of General Internal Medicine, 22(2), 177–183. [CrossRef]
- Hinkle, L. B., Roudposhti, K. K., & Metsis, V. (2019). Physiological measurement for emotion recognition in virtual reality. In Proceedings of the 2019 2nd International Conference on Data Intelligence and Security (ICDIS) (pp. 136–143). IEEE. [CrossRef]
- Arslan, E. E., Akşahin, M. F., Yilmaz, M., & Ilgın, H. E. (2024). Towards emotionally intelligent virtual environments: Classifying emotions through a biosignal-based approach. Applied Sciences, 14(19), 8769. [CrossRef]
- Mavridou, I., Seiss, E., Kostoulas, T., Nduka, C., & Balaguer-Ballester, E. (2018). Towards an effective arousal detection system for virtual reality. In Proc. Workshop on Human-Habitat for Health (H3) (Art. no. 4, pp. 1–6). ACM. [CrossRef]
- Bulagang, A. F., Mountstephens, J., & Teo, J. (2021). Multiclass emotion prediction using heart rate and virtual reality stimuli. Journal of Big Data, 8(12). [CrossRef]
- Fridlund, A. J. Fridlund, A. J., Schwartz, G. E., & Fowler, S. C. Pattern recognition of self-reported emotional state from multiple-site facial EMG activity during affective imagery. Psychophysiology 1984, 21, 622–637. [Google Scholar]
- Harari, H. Harari, H., Shamay-Tsoory, S. G., Ravid, M., & Levkovitz, Y. Double dissociation between cognitive and affective empathy in borderline personality disorder. Psychiatry Research 2010, 175, 277–279. [Google Scholar] [PubMed]
- O’Brien, E. O’Brien, E., Konrath, S. H., Gruhn, D., & Hagen, A. L. (2013). Empathic concern and perspective taking: Linear and quadratic effects of age across the adult life span. The Journals of Gerontology Series B: Psychological Sciences and Social Sciences, 68(2), 168–175. [CrossRef]
- Strikwerda, L. (2015). Present and future instances of virtual rape in light of three categories of legal philosophical theories on rape. Philosophy & Technology, 28(4), 491–510. [CrossRef]
- Sung, H. C. , Su, H. F., Lee, W. L., Yamakawa, M., & Wang, H. M. (2022). Effects of a dementia virtual reality-based training with peer support for home care workers: A cluster randomized controlled trial. International Journal of Geriatric Psychiatry. 37(9). doi unavailable.
- Herrera, F., Bailenson, J., Weisz, E., Ogle, E., & Zaki, J. Building long-term empathy: A large-scale comparison of traditional and virtual reality perspective-taking. PLOS ONE 2018, 13.
- Hwang, G., Yoo, S., & Yoo, J. (2025). Emotion recognition using PPG signals of smartwatch on purpose of threat detection. Sensors, 25(1), 18. [CrossRef]
- Shamay-Tsoory, S. G., & Aharon-Peretz, J. Dissociable prefrontal networks for cognitive and affective theory of mind: a lesion study. Neuropsychologia 2007, 45, 3054–3067.
- Irshad, M. T., Li, F., Nisar, M. A., et al. (2023). Wearable-based human flow experience recognition enhanced by transfer learning methods using emotion data. Computers in Biology and Medicine, 166, 107489. [CrossRef]
- Singer, T.; Lamm, C. The social neuroscience of empathy. Annals of the New York Academy of Sciences 2009, 1156, 89–96. [Google Scholar] [CrossRef] [PubMed]
- Tay, J., Qu, Y., Lim, L., Puthran, R., Tan, C., Rajendran, R., Wei, K., Xie, H., & Sim, K. (2025). Impact of a virtual reality intervention on stigma, empathy, and attitudes toward patients with psychotic disorders among mental health care professionals: Randomized controlled trial. JMIR Mental Health, 12, Article e66925. [CrossRef]
- Lin, H. L., Wang, Y. C., Huang, M. L., et al. (2024). Can virtual reality technology be used for empathy education in medical students: A randomized case-control study. BMC Medical Education, 24, 1254. [CrossRef]
- MacKenzie, J. E. , et al. (2024). Using psychophysiological data to facilitate reflective conversations with children about their player experiences. Proceedings of the ACM on Human-Computer Interaction, 8. [CrossRef]
- Preston, S. D., & De Waal, F. B. Empathy: Its ultimate and proximate bases. Behavioral and Brain Sciences, 25 2002, 25, 1–20.
- Stargatt, J., Bhar, S., Petrovich, T., Bhowmik, J., Sykes, D., & Burns, K. The effects of virtual reality-based education on empathy and understanding of the physical environment for dementia care workers in Australia: A controlled study. In Journal of Alzheimer’s Disease; 2021; Volume 84, pp. 1247–1257.
- Ventura, S., Cardenas, G., Miragall, M., Riva, G., & Baños, R. (2021). How does it feel to be a woman victim of sexual harassment? The effect of 360°-video-based virtual reality on empathy and related variables. Cyberpsychology, Behavior, and Social Networking 2021, 24, 258–266.
- Sanipatín-Díaz, P. A., Rosero-Montalvo, P. D., & Hernandez, W. (2024). Portable facial expression system based on EMG sensors and machine learning models. Sensors, 24(11), 3350. [CrossRef]
- Um, J. , Jeon, E., Kang, Y., Kang, S., Elsharkawy, A., DelPreto, J., Matusik, W., Rus, D., & Kim, S. (2024). LegSense: Inducing walking sensation in seated VR by providing movement illusion via electrical muscle stimulation. In Companion of the 2024 ACM International Joint Conference on Pervasive and Ubiquitous Computing (UbiComp ’24) (pp. 797–802). New York, NY, USA. [CrossRef]
- Kaźmierczak, M., Rybicka, M., & Syty, P. (2024). Genetic variations as predictors of dispositional and dyadic empathy—a couple study. Scientific Reports, 14, Article 27411. [CrossRef]
- Kiesow, H., Spreng, N., Holmes, A. J., et al. (2021). Deep learning identifies partially overlapping subnetworks in the human social brain. Communications Biology, 4, Article 65. [CrossRef]
- Bertrand, P., Guegan, J., Robieux, L., McCall, C. A., & Zenasni, F. Learning empathy through virtual reality: Multiple strategies for training empathy-related abilities using body ownership illusions in embodied virtual reality. Frontiers in Robotics and AI 2018, 5, 326671.
- Kizhevska, E. , Ferreira-Brito, F., Guerreiro, T. J., & Lustrek, M. (2022). Using virtual reality to elicit empathy: A narrative review. In VR4Health@MUM (pp. 19–22).
- Kizhevska, E. Kizhevska, E., Šparemblek, K., & Luštrek, M. Protocol of the study for predicting empathy during VR sessions using sensor data and machine learning. PLoS One 2024, 19, e0307385. [Google Scholar]
- Nelson, K. M., Anggraini, E., & Schlüter, A. (2020). Virtual reality as a tool for environmental conservation and fundraising. PLOS ONE, 15(4).
- Kołodziej, M., Majkowski, A., & Jurczak, M. (2024). Acquisition and analysis of facial electromyographic signals for emotion recognition. Sensors, 24(15), 4785. [CrossRef]
- Kujala, M. V., Parkkonen, L., & Kujala, J. (2024). Empathy enhances decoding accuracy of human neurophysiological responses to emotional facial expressions of humans and dogs. Social Cognitive and Affective Neuroscience, 19(1), nsae082. [CrossRef]
- Lamm, C., Batson, C. D., & Decety, J. The neural substrate of human empathy: Effects of perspective-taking and cognitive appraisal. Journal of Cognitive Neuroscience 2007, 19, 42–58.
- Lawrence, E. J., Shaw, P., Baker, D., Baron-Cohen, S., & David, A. S. Measuring empathy: Reliability and validity of the Empathy Quotient. Psychological Medicine 2004, 34, 911–920.
- Zwack, J., & Schweitzer, J. If every fifth physician is affected by burnout, what about the other four? Resilience strategies of experienced physicians. Academic Medicine 2013, 88, 382–389.
Figure 1.
Top to down: (left) Actor one (Dave in the narrative) expressing anger and (right) Actor two (Jake in the narrative) expressing happiness; (left) Actress one (Anna) expressing sadness and (right) Actress two (Leah) expressing anxiousness [71]
Figure 1.
Top to down: (left) Actor one (Dave in the narrative) expressing anger and (right) Actor two (Jake in the narrative) expressing happiness; (left) Actress one (Anna) expressing sadness and (right) Actress two (Leah) expressing anxiousness [71]
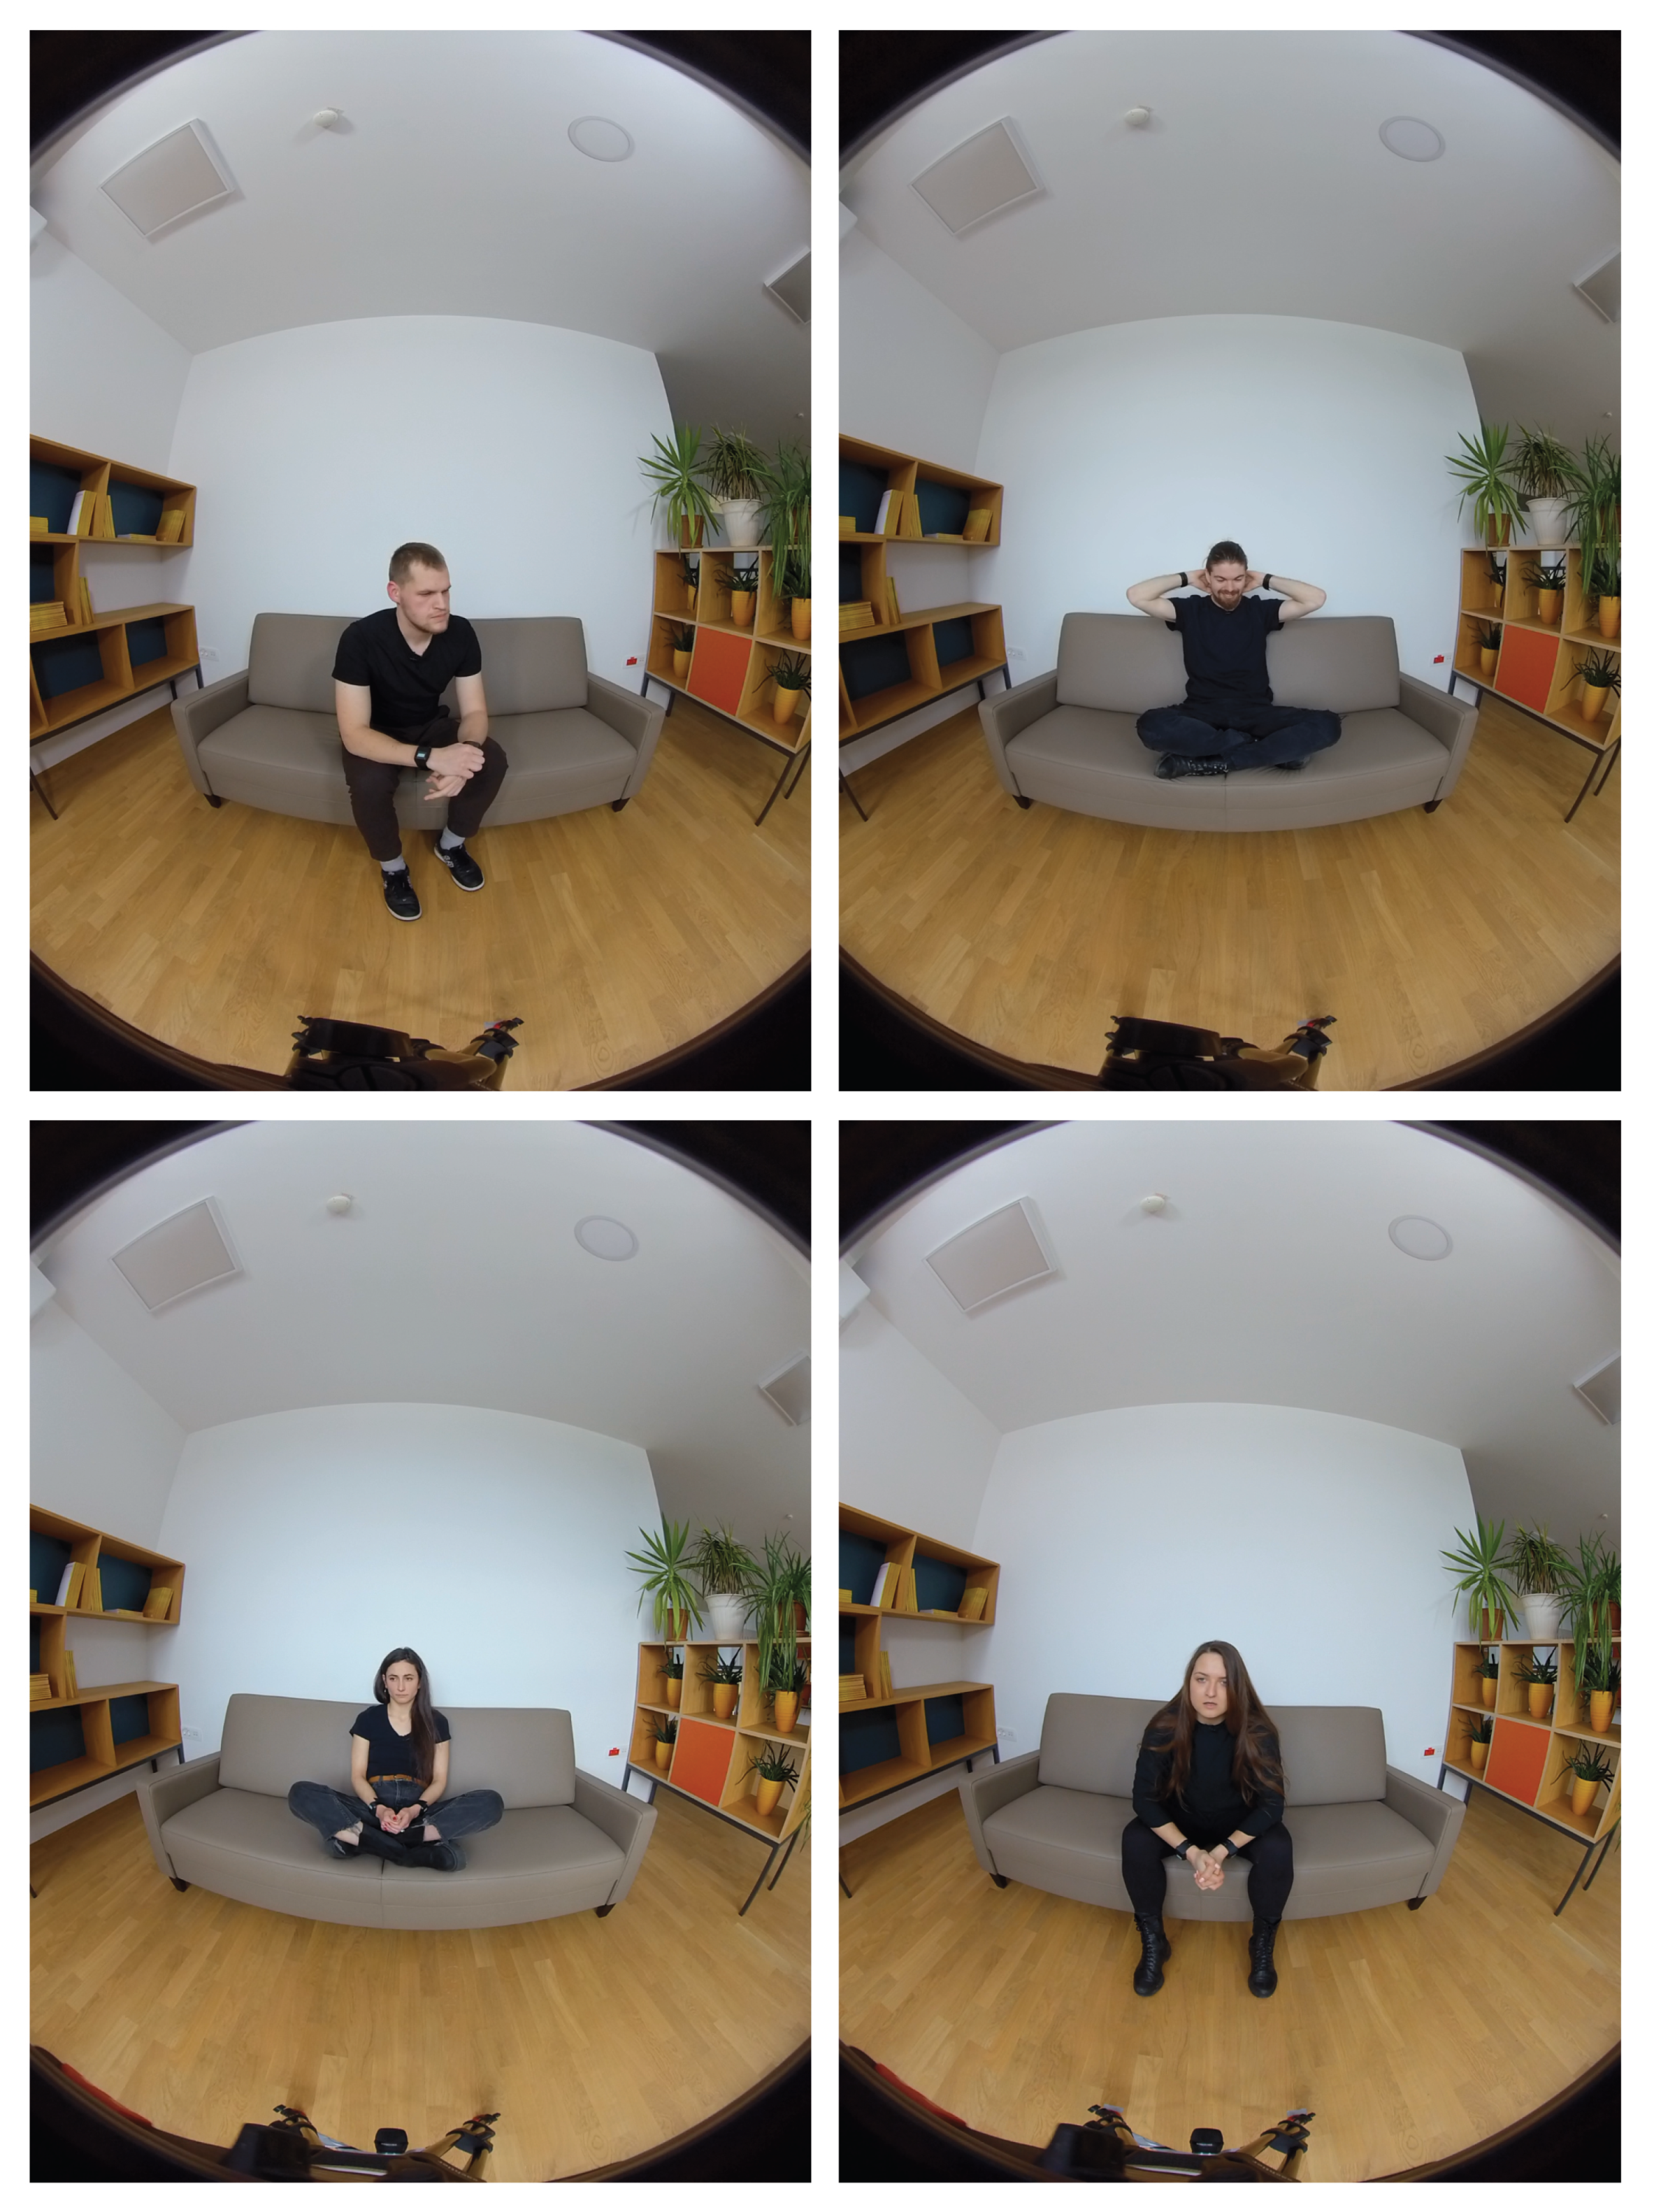
Figure 2.
Graphical representation of the sequences of segments in the VR videos (with narratives included).
Figure 2.
Graphical representation of the sequences of segments in the VR videos (with narratives included).
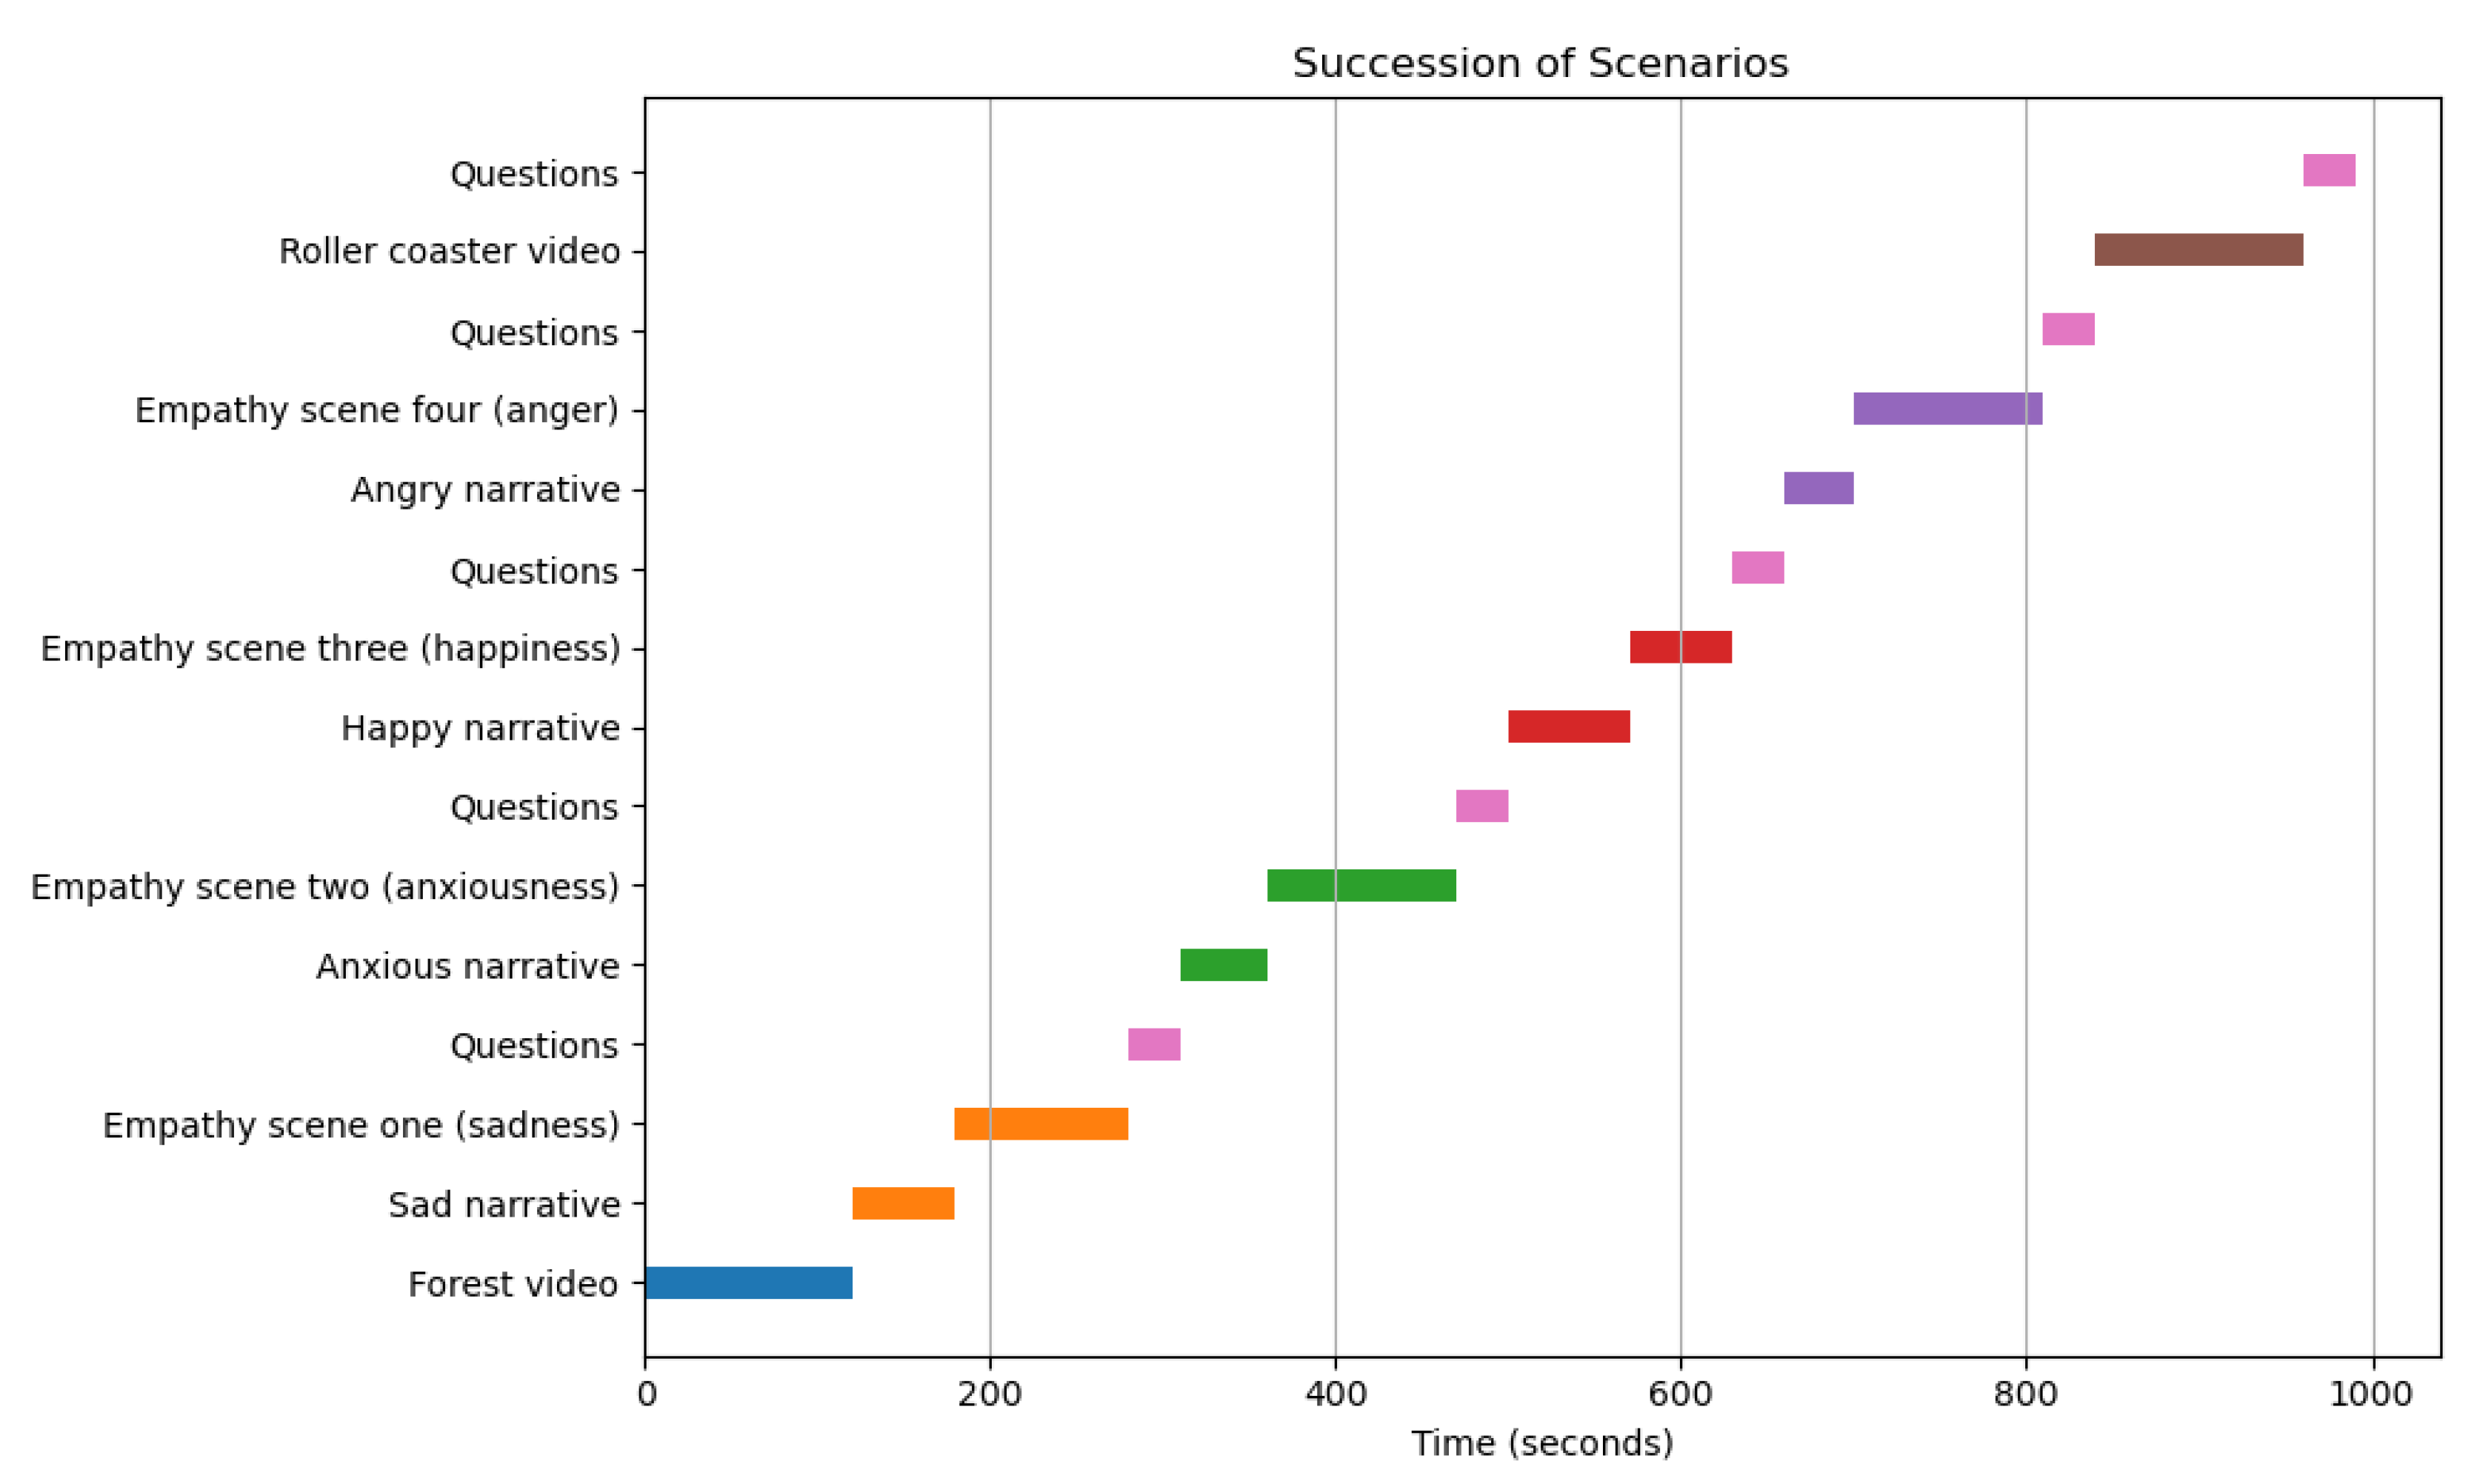
Figure 3.
A participant watching videos via Pico Neo 3 Pro Eye headset in the process of collecting the dataset [71].
Figure 3.
A participant watching videos via Pico Neo 3 Pro Eye headset in the process of collecting the dataset [71].
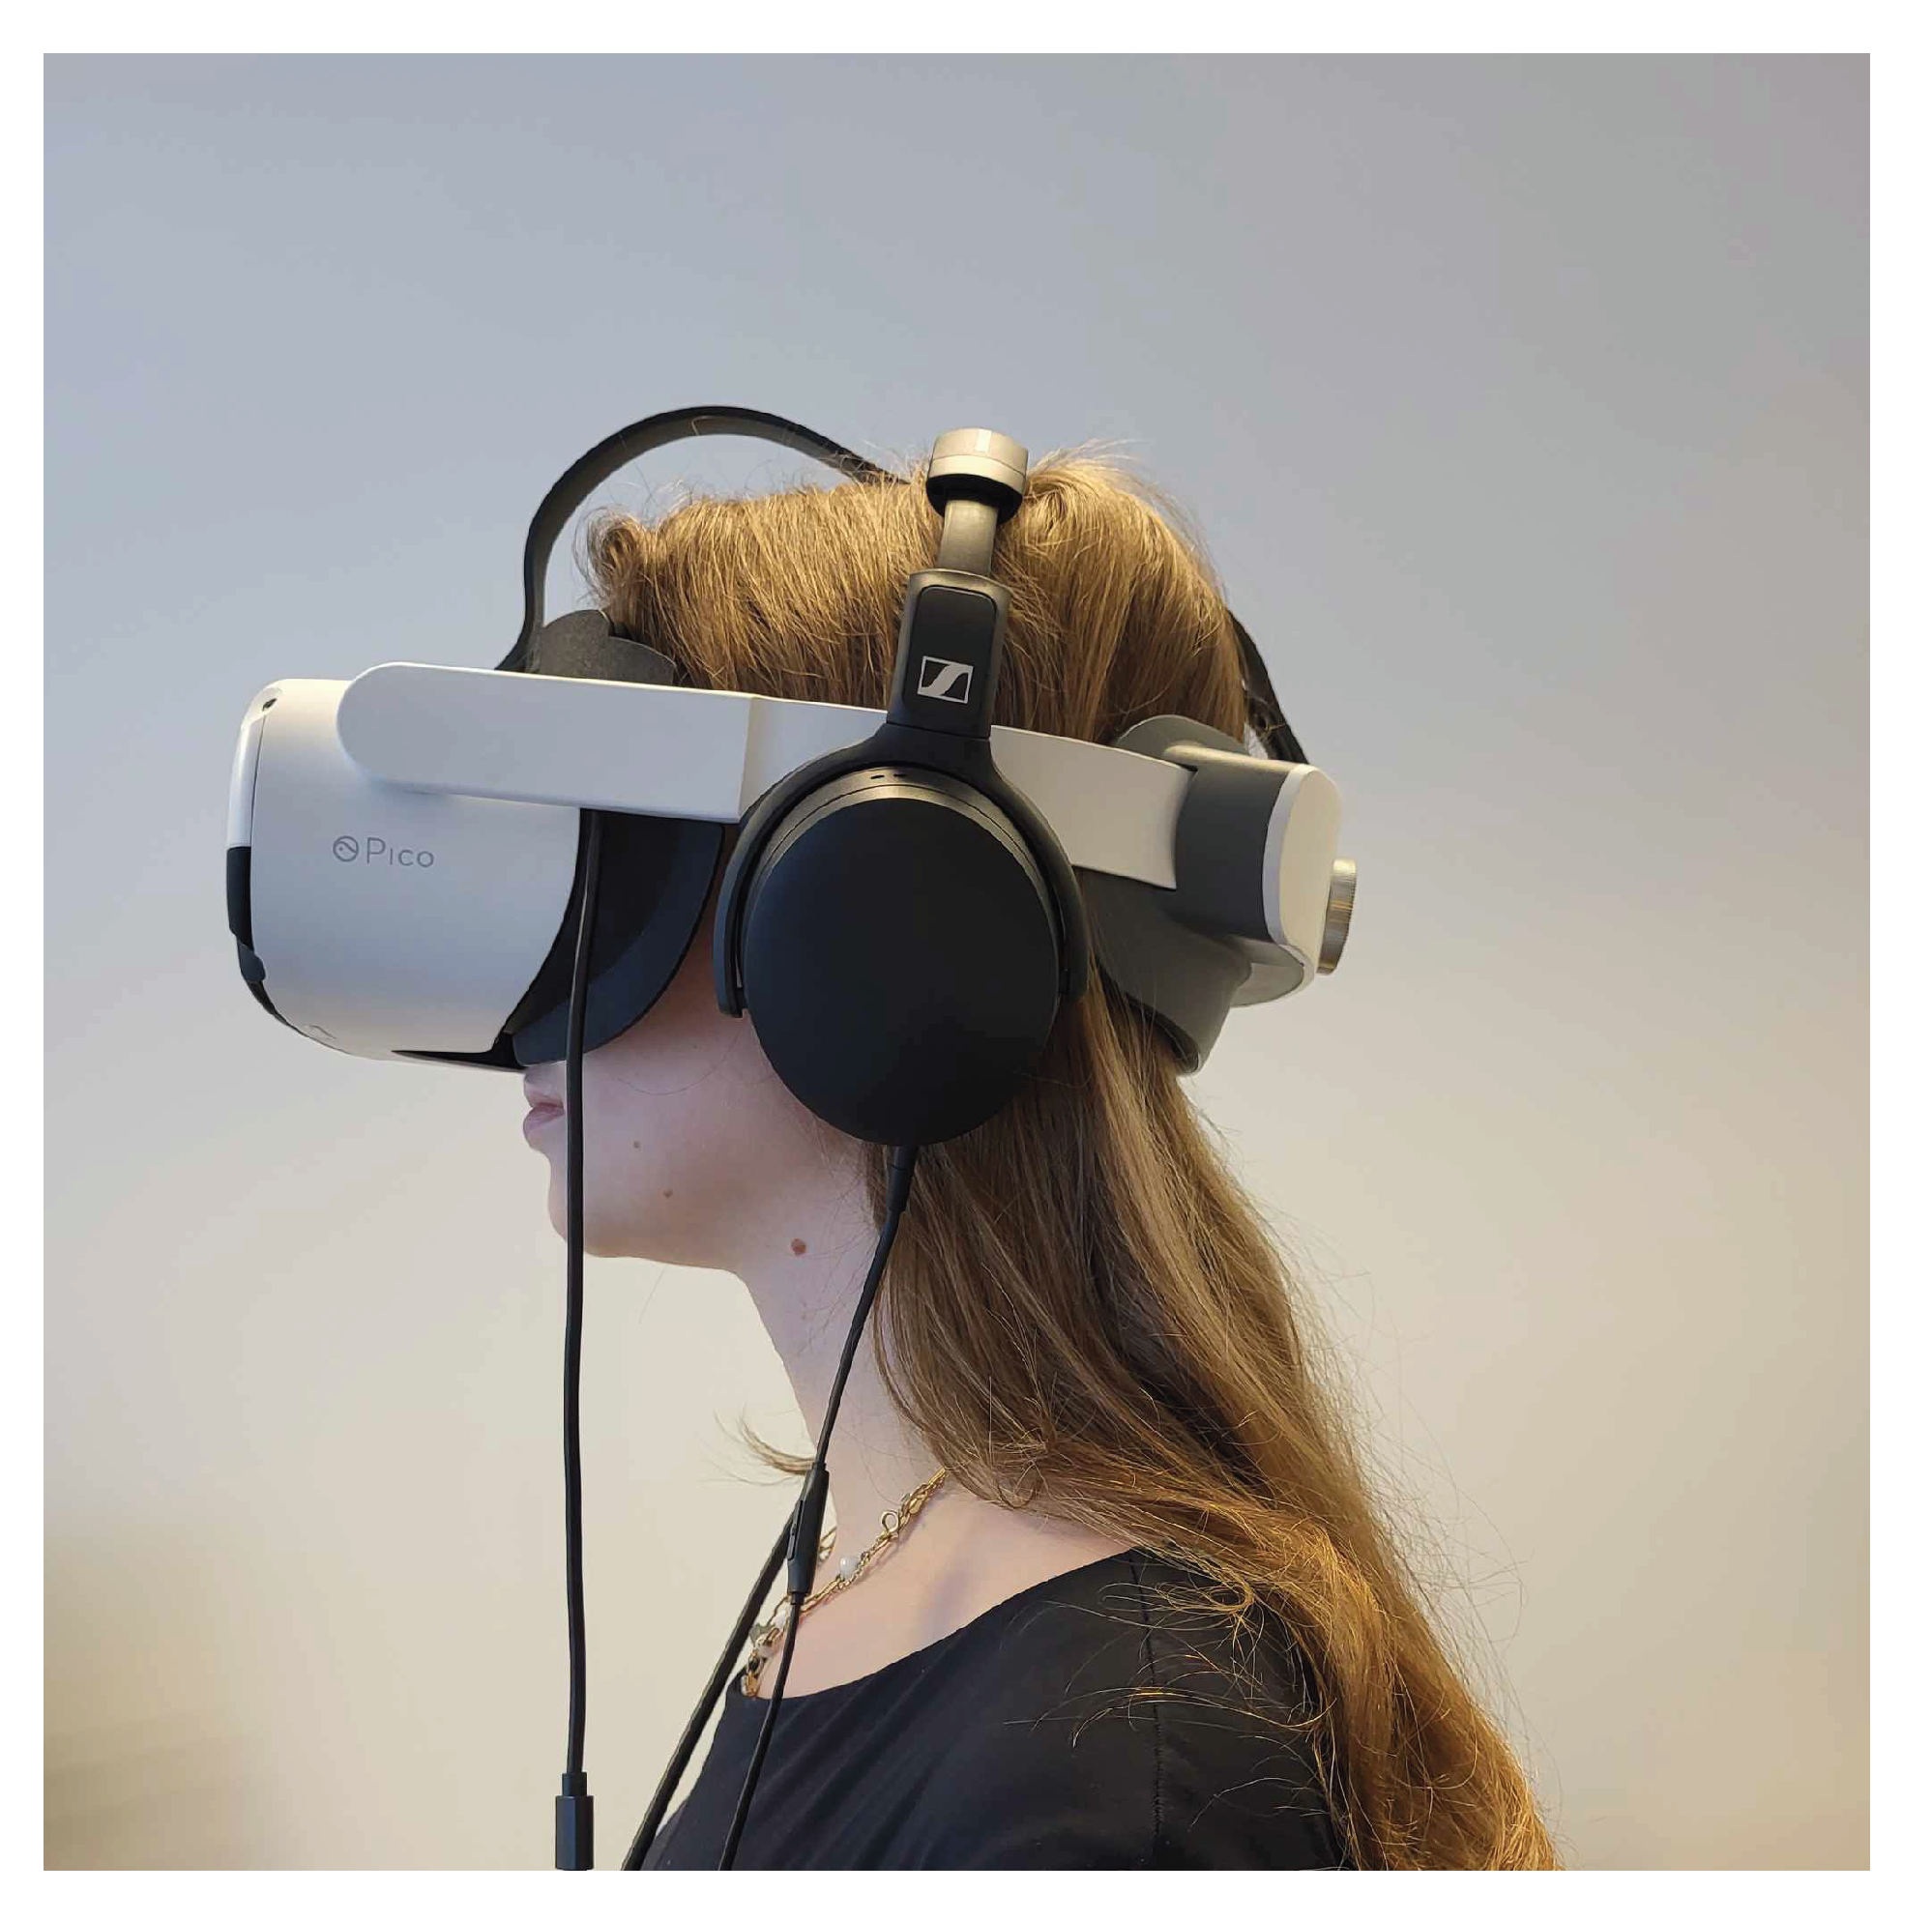
Figure 4.
The time series plot for a single participant showing the most important features, including all sequences of the scenarios. The variable stateEmpathy represents the discrete participant responses after each part of the video. Its value is set to 10 before the beginning of the video and during question periods.
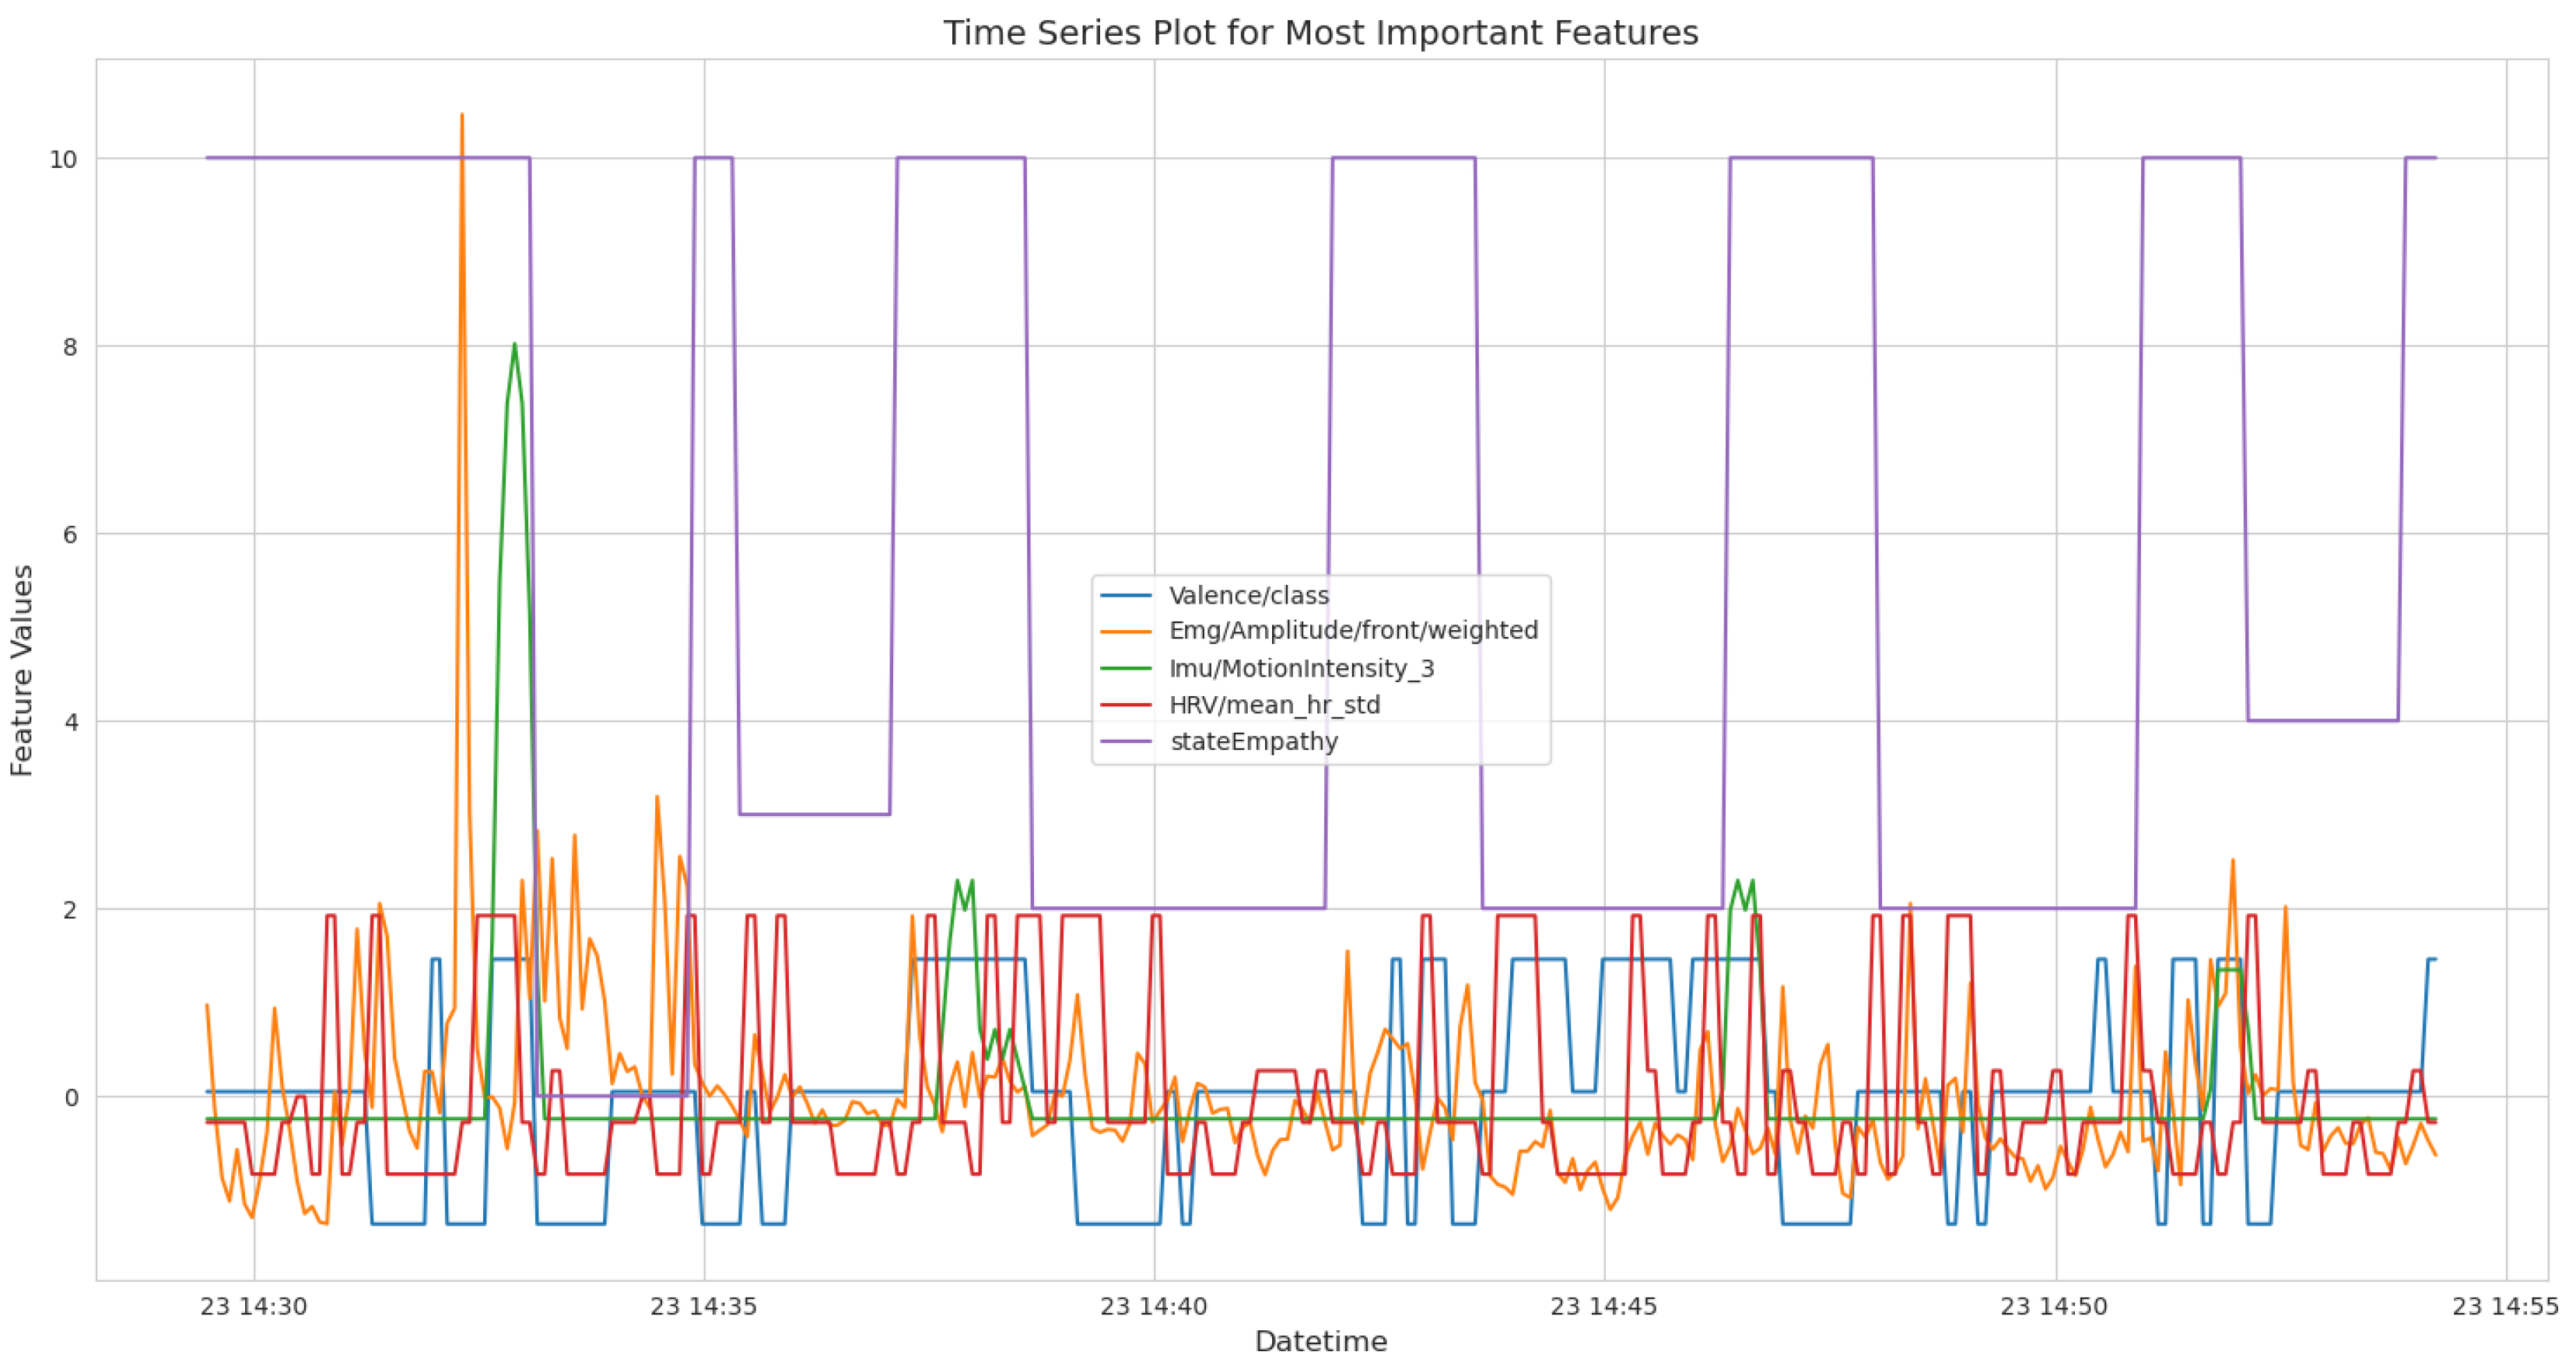
Figure 7.
Review of five box plots for the five most important features and the label state empathy, utilized to analyze feature distributions and guide merging decisions.
Figure 7.
Review of five box plots for the five most important features and the label state empathy, utilized to analyze feature distributions and guide merging decisions.
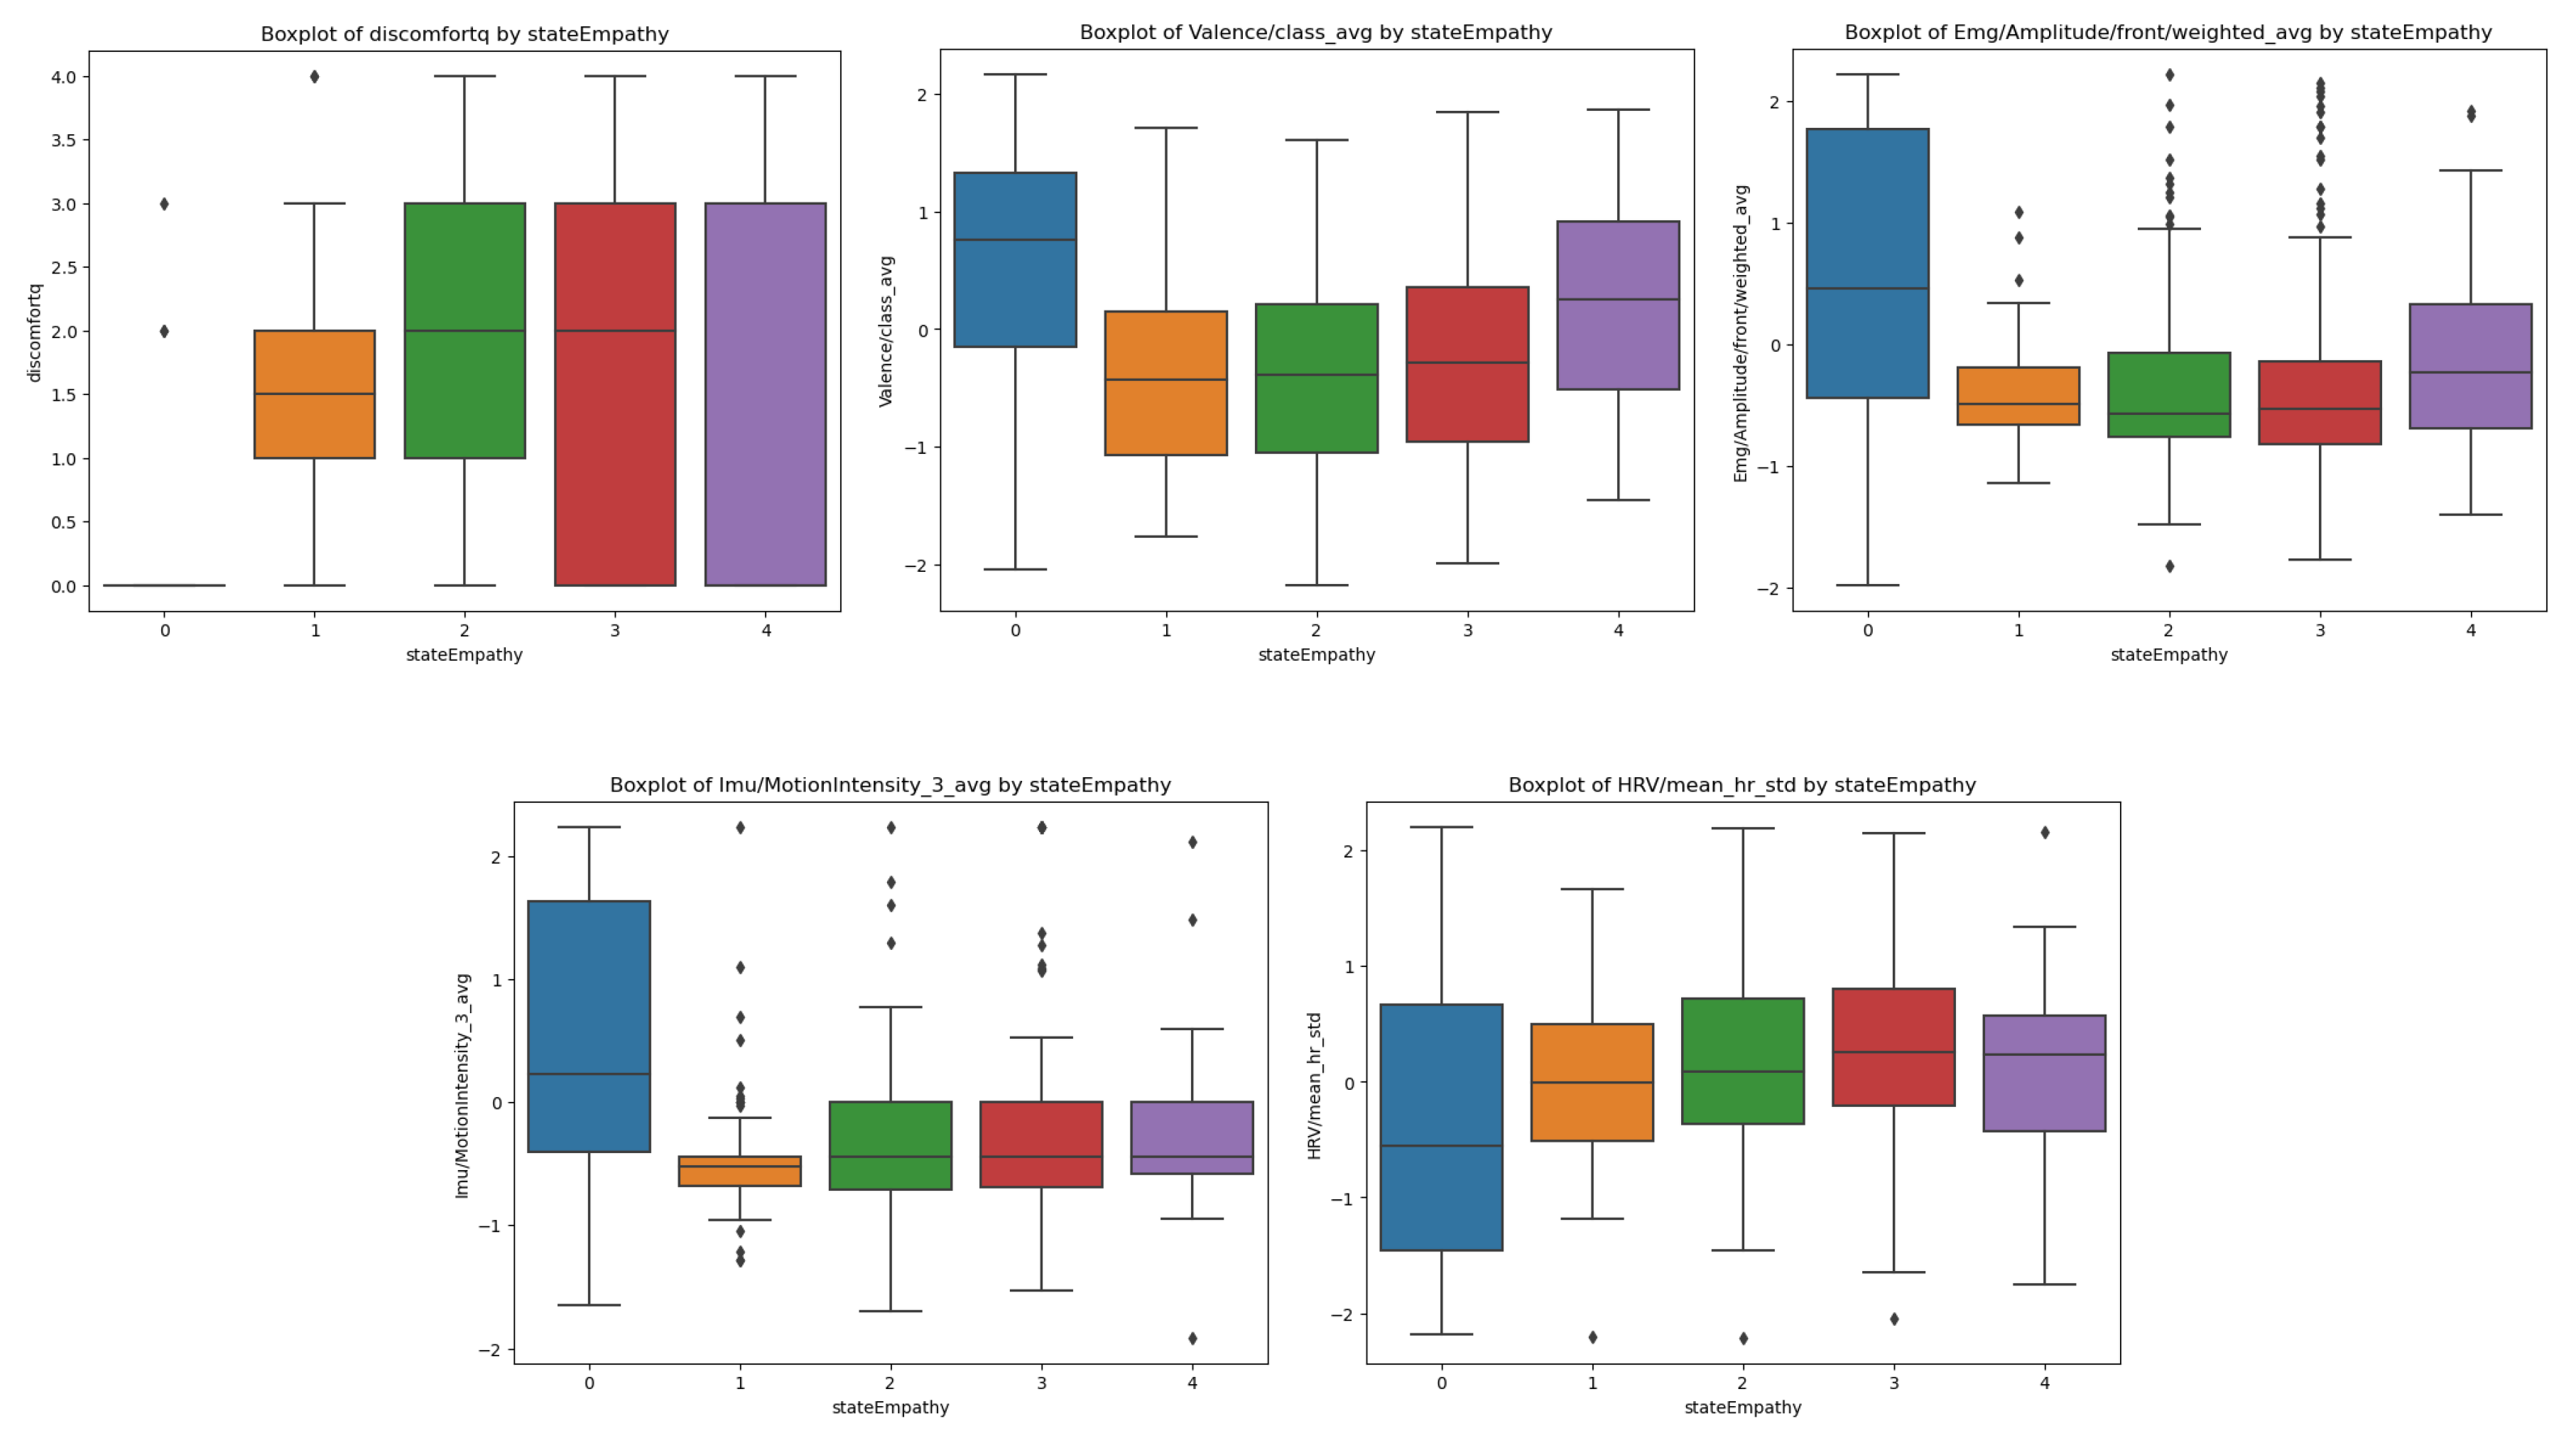
Figure 10.
Graphical representation of the MAPE and SMAPE, comparing different predictive models developed using various regressors on sensor and questionnaire data to predict trait empathy.
Figure 10.
Graphical representation of the MAPE and SMAPE, comparing different predictive models developed using various regressors on sensor and questionnaire data to predict trait empathy.
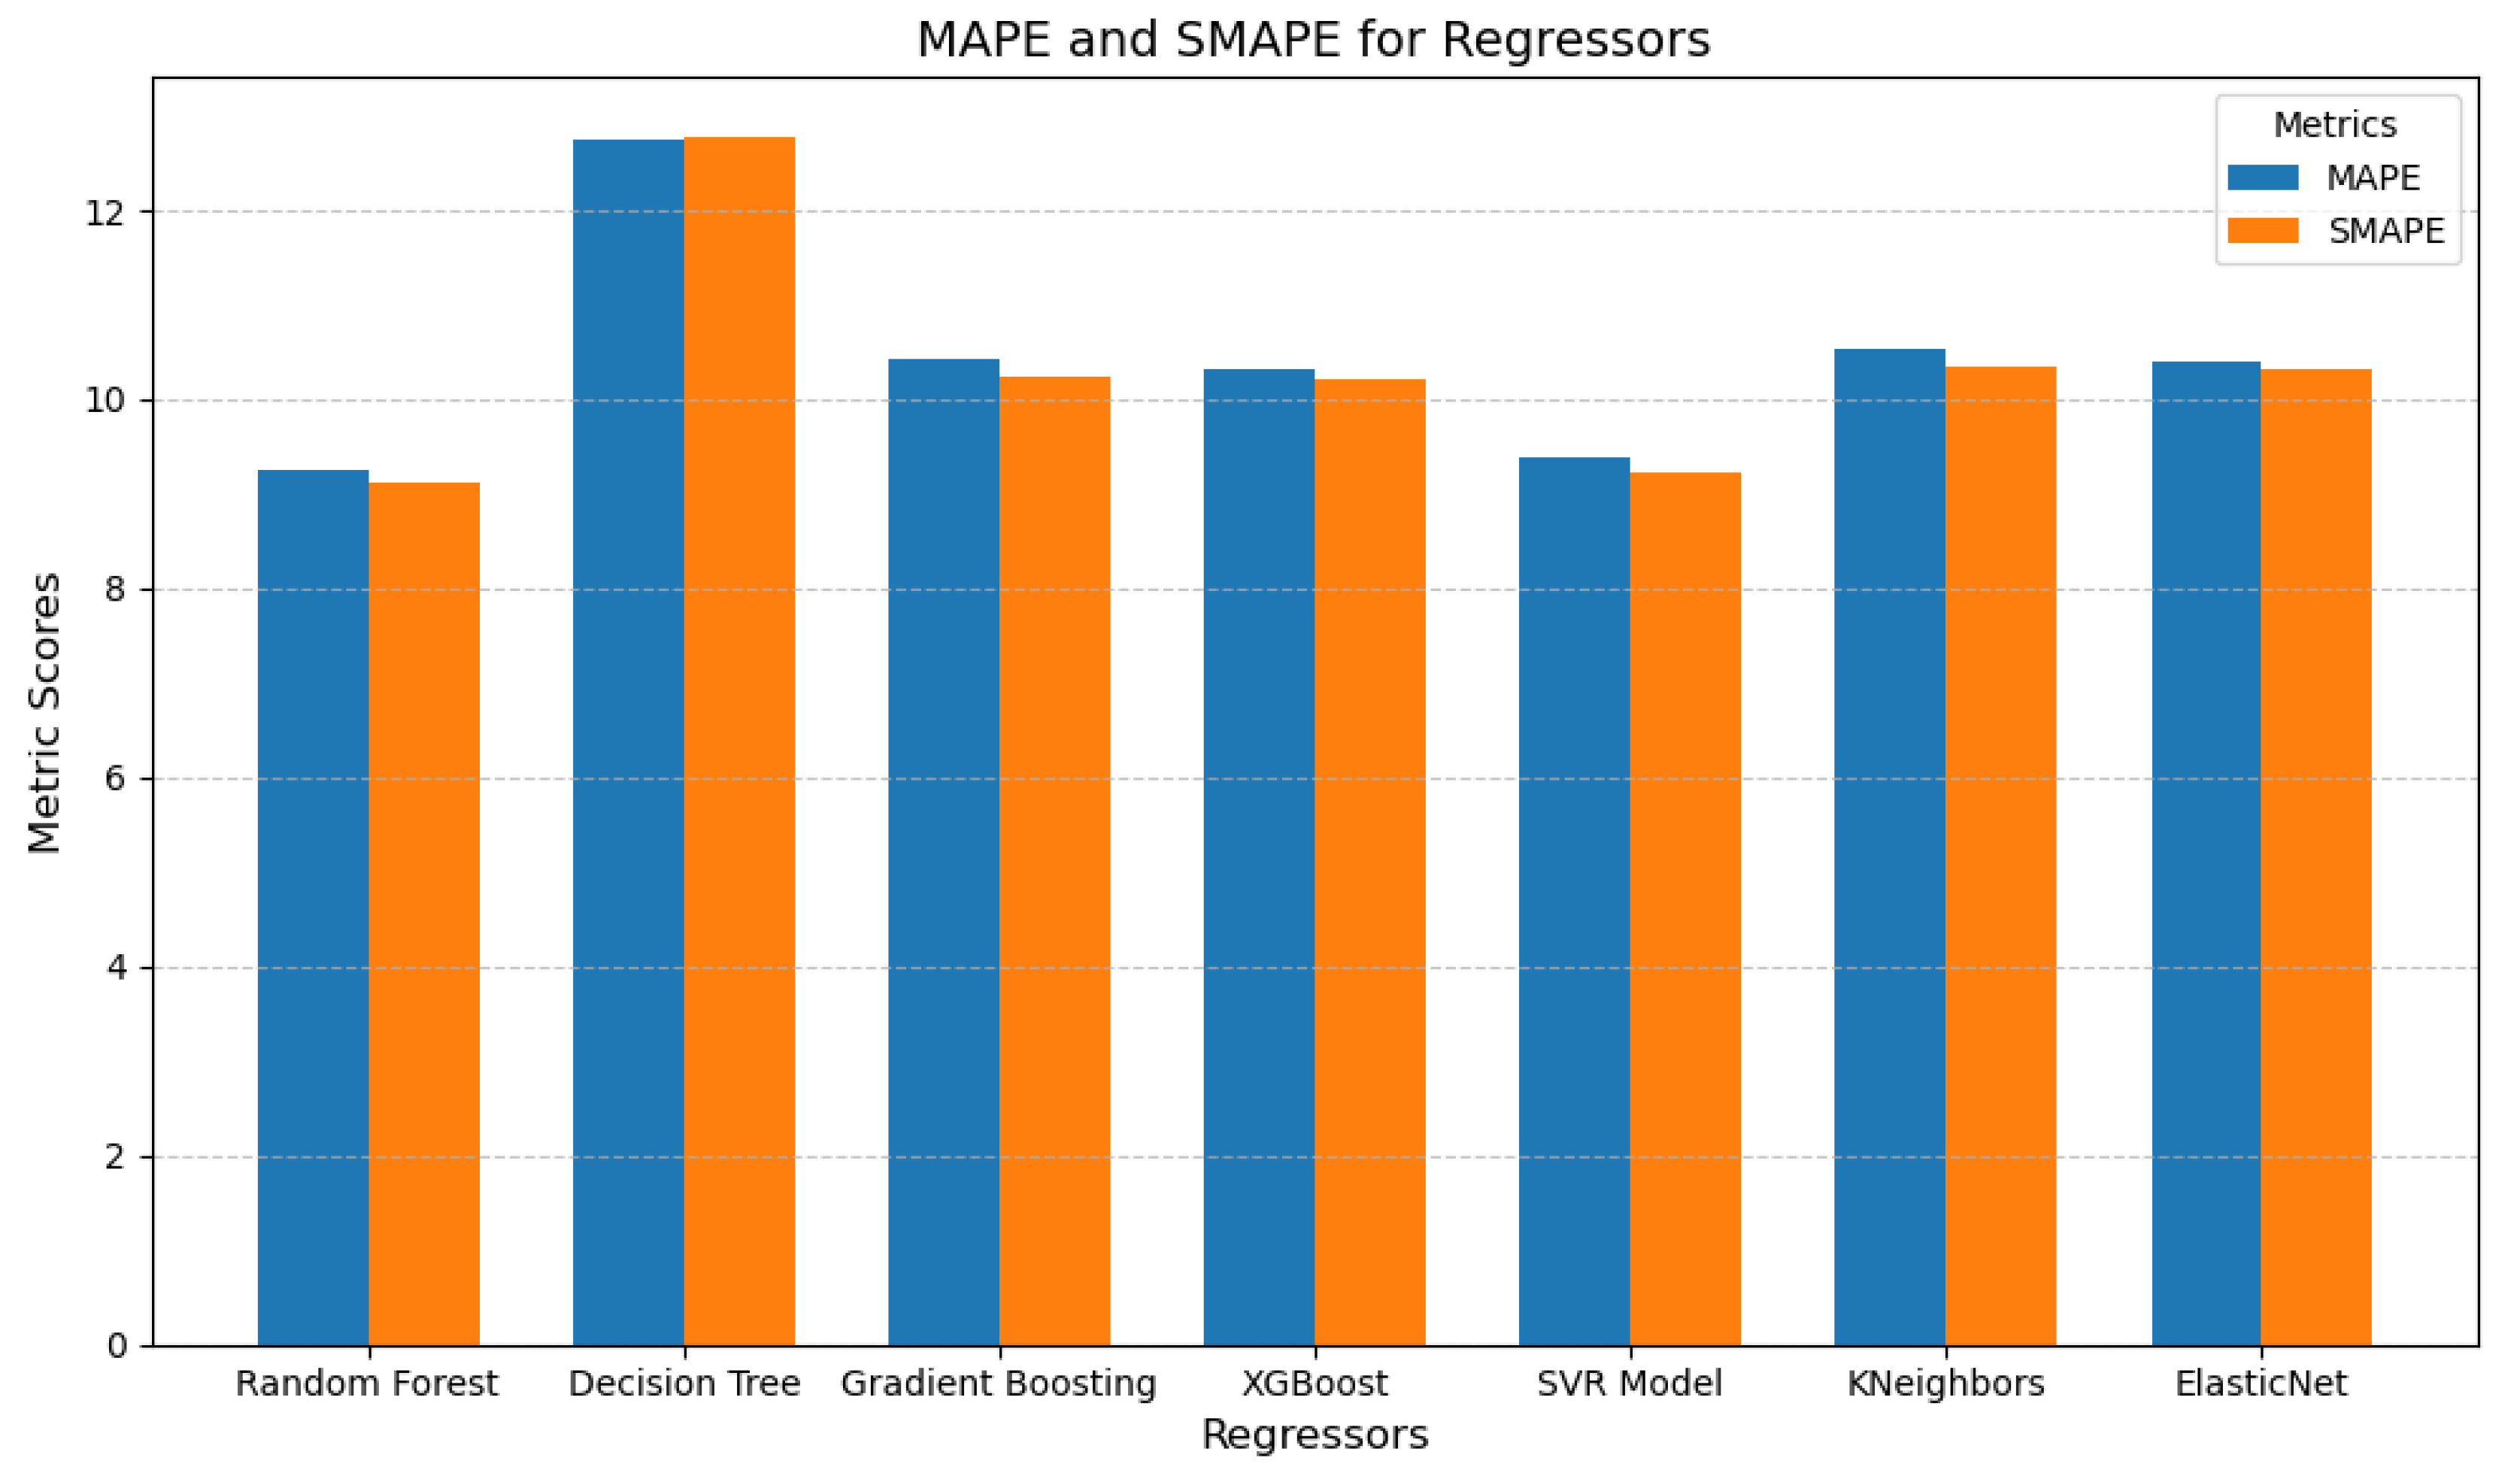
Figure 11.
Graphical representation of the MAPE and SMAPE, comparing different predictive models developed using various regressors only on sensor data to predict trait empathy.
Figure 11.
Graphical representation of the MAPE and SMAPE, comparing different predictive models developed using various regressors only on sensor data to predict trait empathy.
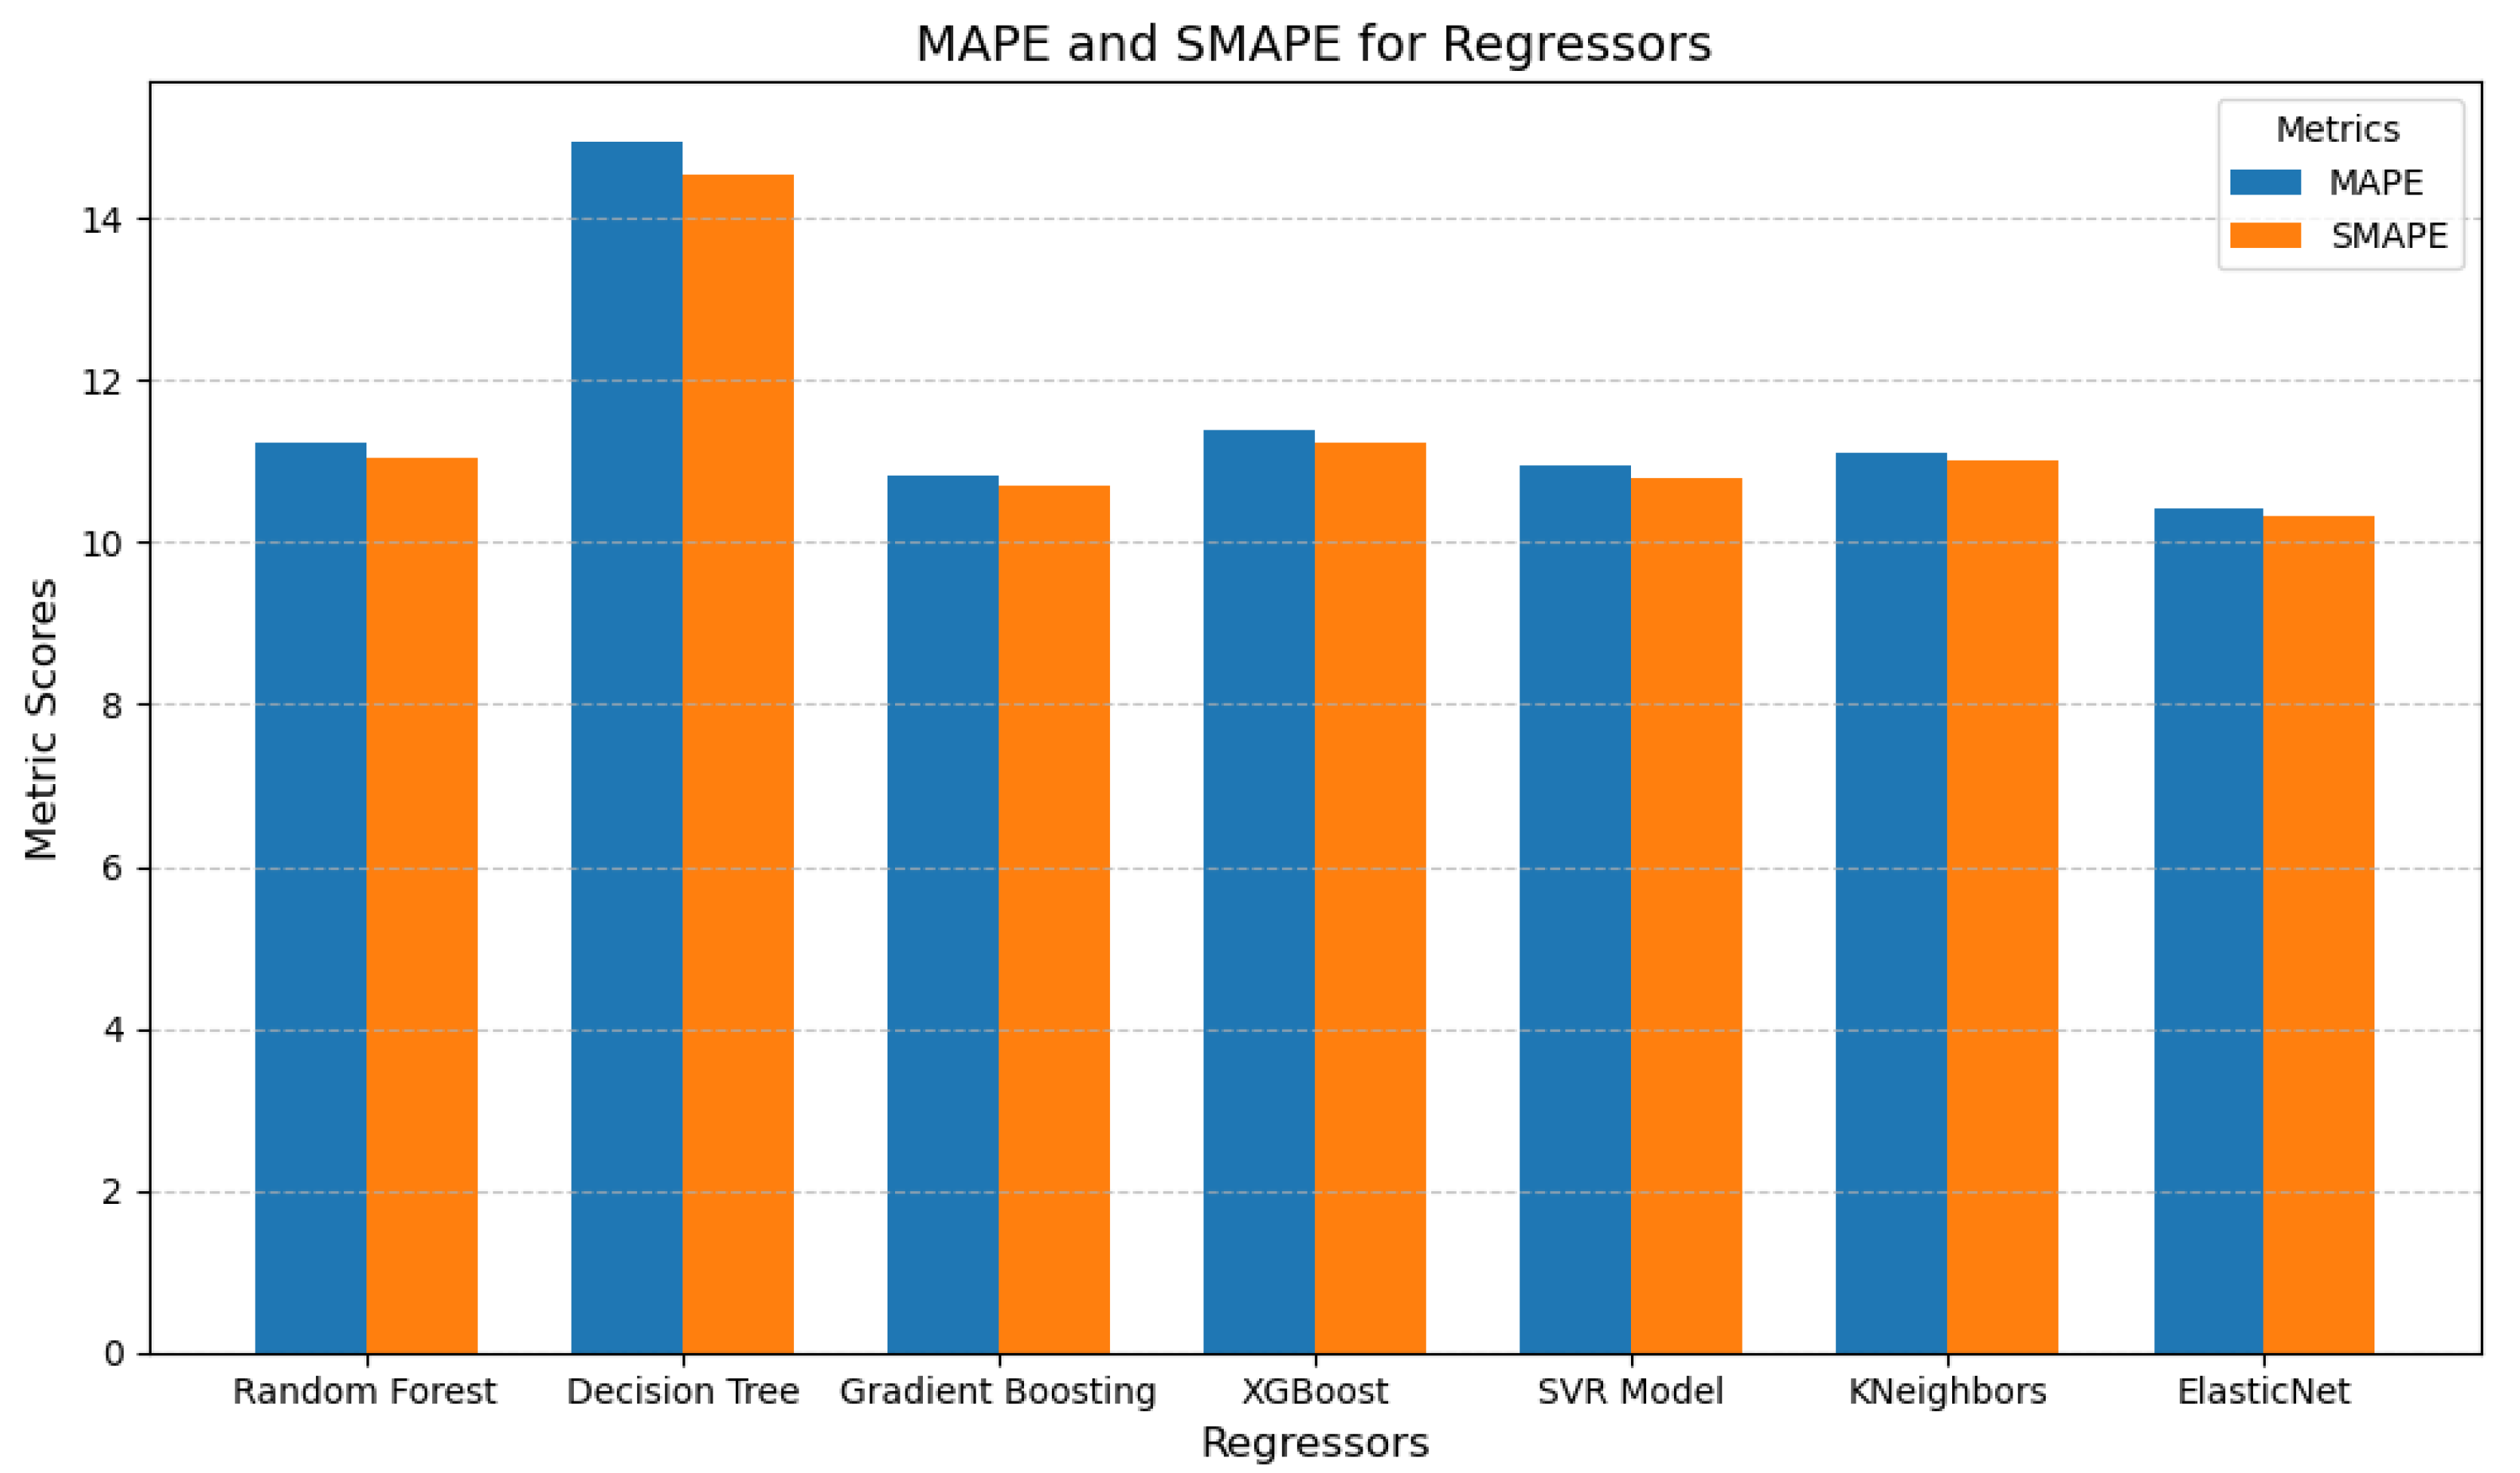
Figure 12.
Review of five box plots for the five most important features and the label trait empathy, utilized to analyze feature distributions and guide merging decisions.
Figure 12.
Review of five box plots for the five most important features and the label trait empathy, utilized to analyze feature distributions and guide merging decisions.
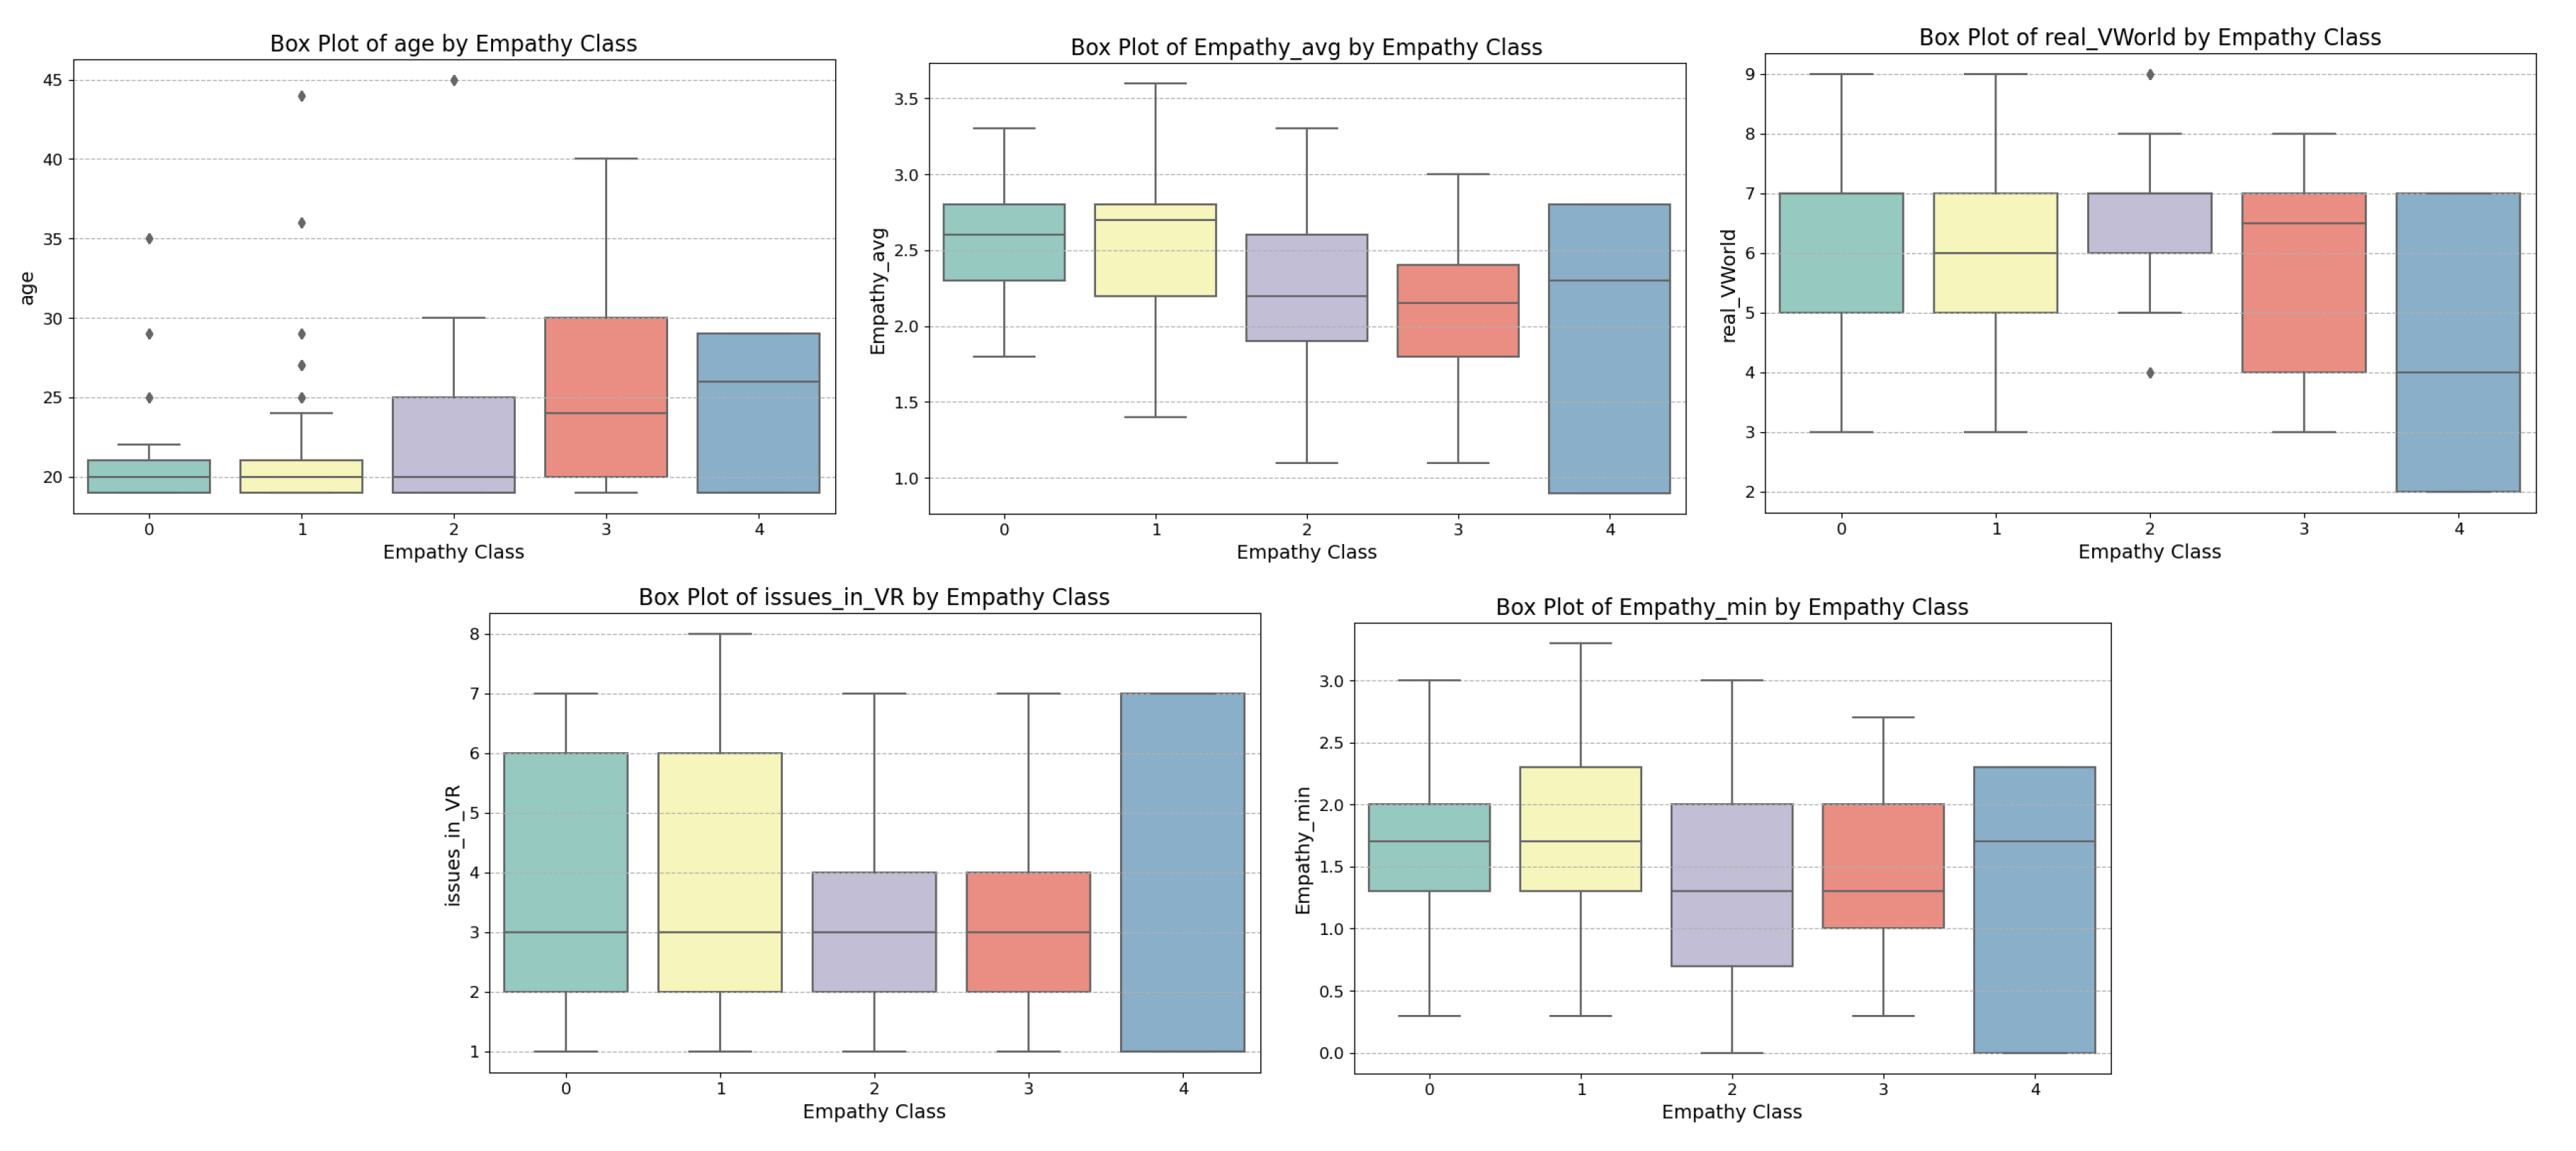

Table 1.
Average state empathy scores among participants for each emotion
| Video Type | Average Empathy Score |
|---|---|
| Happiness | 2.90 |
| Sad | 2.41 |
| Anxiety | 2.22 |
| Anger | 2.04 |
Disclaimer/Publisher’s Note: The statements, opinions and data contained in all publications are solely those of the individual author(s) and contributor(s) and not of MDPI and/or the editor(s). MDPI and/or the editor(s) disclaim responsibility for any injury to people or property resulting from any ideas, methods, instructions or products referred to in the content. |
© 2025 by the authors. Licensee MDPI, Basel, Switzerland. This article is an open access article distributed under the terms and conditions of the Creative Commons Attribution (CC BY) license (http://creativecommons.org/licenses/by/4.0/).
Copyright: This open access article is published under a Creative Commons CC BY 4.0 license, which permit the free download, distribution, and reuse, provided that the author and preprint are cited in any reuse.


