Submitted:
29 July 2025
Posted:
29 July 2025
You are already at the latest version
Abstract
Coastal saltmarsh wetlands play a pivotal role in global carbon and nitrogen cycling, yet the vertical distribution characteristics of sediment carbon and nitrogen and their regulatory mechanisms remain uncertain. We investigated Yalu River Estuary coastal wetlands in the northern Yellow Sea. Sediment cores (0–100 cm depth) were collected and stratified into 20-cm intervals to analyse physicochemical properties and carbon–nitrogen indicators, enabling quantitative assessment of vertical distribution patterns and environmental drivers. The key findings are as follows: (1) Both microbial biomass carbon (MBC) and nitrogen (MBN) exhibited significant depth-dependent decreases, with MBC decreasing sharply by 45% (90.42 to 60.06 mg/kg) in the 40–60 cm layer and MBN decreasing by 50% (7.50 to 3.72 mg/kg) in the 80–100 cm layer. Total carbon (TC) peaked in the 40–60 cm layer (6.49 g/kg), whereas total nitrogen (TN) continuously decreased (from 0.51 (surface) to 0.24 g/kg (bottom)). (2) Depth-specific controls were identified: Surface layers (0–20 cm) were governed by tidal scouring (causing TC loss) and pH buffering; subsurface layers (20–40 cm) were constrained by moisture content (MC) and bulk density (BD), with partial mitigation by labile TC; and deeper layers (40–100 cm) were dominated by chemical factors exhibiting TN limitation and high electrical conductivity (EC). Notably, MBC and MBN in northern Yellow Sea coastal wetlands are regulated primarily by physical‒biological interactions in surface sediments and chemical stressors in deeper layers, providing crucial theoretical foundations for precise wetland carbon sink assessment and sustainable ecosystem management.
Keywords:
Northern Yellow Sea coastal wetlands
; sediments
; microbial biomass carbon
; microbial biomass nitrogen
; environmental drivers
; vertical differentiation
1. Introduction
Coastal wetlands, as critical land‒sea interfaces, exhibit remarkable carbon‒nitrogen filter functionality [1,2,3]. These ecosystems demonstrate exceptional carbon sequestration capacity, with burial rates reaching 168 g C/(m2·a), approximately 40 times higher than those in terrestrial forest ecosystems [4], thereby playing an indispensable role in climate change mitigation and nitrogen pollution regulation. The tidal pumping mechanism facilitates organic matter transport to deeper sediment layers, creating millennial-scale carbon storage potential [5,6,7]. However, microbe-mediated biogeochemical processes exhibit notable spatial heterogeneity along the sediment profile. Particularly below the 40-cm depth, changes in sediment physicochemical and biological properties may alter carbon‒nitrogen cycling pathways, potentially compromising the stability of long-term carbon sequestration [8,9,10].
Sediments exhibit notable vertical heterogeneity in physicochemical and biological properties, manifesting not only in physical characteristics (porosity, particle size distribution, and permeability) but also in chemical and biological gradients (redox conditions, organic matter composition, and microbial community structure) [11,12,13,14]. This multidimensional heterogeneity hierarchically governs key carbon‒nitrogen cycling processes (mineralization, nitrification, denitrification, and methanogenesis) by controlling substrate availability, electron acceptor supply, and microbial metabolic activity [15]. While existing research has mainly focused on surface sediments (0–50 cm) [16,17,18,19], deeper layers (>50 cm) remain understudied despite their importance as ancient carbon reservoirs. These deep sediments contain unique anaerobic metabolic pathways (e.g., sulfate reduction and methanogenesis) that may significantly influence the long-term sequestration efficiency [20]. Notably, total carbon (TC) often exhibits nonmonotonic vertical distribution patterns [19], yet the driving mechanisms, particularly synergistic interactions among physical (sedimentation rate), chemical (redox potential), and biological (microbial succession) factors, remain poorly understood.
Microbial biomass carbon (MBC) and nitrogen (MBN), as the most labile organic fractions, are closely related to depth-dependent carbon‒nitrogen cycling patterns. However, significant knowledge gaps persist regarding their vertical distribution dynamics. While surface MBC associations with tidal flushing and vegetative litter input are well documented [21,22,23], sulfide accumulation in suboxic zones (> 40 cm) may affect nitrogen metabolism through denitrifier inhibition, subsequently modifying the microbial community composition, diversity, and MBC content. Crucially, vertical redox interface migration (typically 30–60 cm) induces microbial metabolic transitions, yet the mechanisms through which these processes regulate depth-dependent carbon‒nitrogen cycling remain unclear.
In this study, minimally disturbed Yalu River Estuary wetlands (northern Yellow Sea) were investigated through 1-m sediment core analysis (stratified into five layers) combined with multivariate modelling to address (1) the existence and spatial positioning of the vertical inflection points of MBC and MBN and (2) the relative contributions of physical (bulk density (BD) and moisture content (MC)), chemical (pH and electrical conductivity (EC)), and biological (TC and total nitrogen (TN)) factors across sediment depths.
2. Materials and Methods
2.1. Study Site
The study area is located in the core zone of the Yalu River Estuary Wetland National Nature Reserve in the northern Yellow Sea (123°34′8.61′′~124°7′23.00” E, 39°40′40.00”~39°58′12.08” N), which occurs within the alluvial delta of the Yalu River Estuary. This region exhibits minimal anthropogenic disturbance, sustaining relatively intact natural succession processes in its ecosystem. Climatically, the area belongs to a typical warm–temperate humid monsoon zone, with meteorological data showing an annual average temperature of 9.8°C, a frost-free period of 203±5 days, and mean annual precipitation amounts ranging from 1000–1200 mm (multiyear average). This unique geographical position creates a characteristic brackish water ecotone, providing an ideal in situ observation site for relevant ecological studies.
2.2. Sample Collection
Field sampling was conducted in September 2023 within an unvegetated mudflat area of the study site (Figure 1). Sediment cores were collected using a VD51 high-frequency vibration corer (Coring Designs, Australia) equipped with 38-mm diameter cutting heads. Following systematic sampling principles, we established 9 sampling points with triplicate cores collected at each location, maintaining a consistent sampling depth of 100 cm. All intact cores were transported to Beijing University of Agriculture laboratories for immediate processing. Each core was sectioned into five vertical intervals: 0–20 cm, 20–40 cm, 40–60 cm, 60–80 cm, and 80–100 cm. All subsamples were preserved at a temperature of -20°C to maintain the original sediment characteristics. Physicochemical analyses (BD, MC, pH, and EC) were performed at the Key Laboratory for Northern Urban Agriculture of the Ministry of Agriculture and Rural Affairs, Beijing University of Agriculture. Carbon‒nitrogen parameters (TC, TN, MBC and MBN) were analysed at the Testing Center of the Institute of Environment and Sustainable Development in Agriculture, Chinese Academy of Agricultural Sciences.
2.3. Sample Determination
2.3.1. MBC and MBN Analysis
In this study, the chloroform fumigation-extraction (CFE) method was employed to determine sediment MBC and MBN contents [24,25]. Fresh sediment samples were first sieved through a 2-mm mesh, homogenized, and then equally divided into fumigated and control groups (triplicate samples per group). The samples of the fumigated group were placed in a vacuum desiccator containing 25 mL of ethanol-free chloroform (CHCl3) and fumigated for 24 h at a constant temperature of 25°C, followed by six vacuum cycles to completely remove residual chloroform. Subsequently, a 0.5 M K2SO4 solution (with a solid-to-liquid ratio of 1:4) was added, and the mixture was oscillated at 200 rpm for 30 min at 25°C. The extract was centrifuged at 4000 rpm for 15 min and filtered through a 0.45-μm membrane. MBC was determined via the Walkley‒Black method (potassium dichromate oxidation–external heating), whereas MBN was measured via the semimicroscopic Kjeldahl method.
2.3.2. TC and TN Analysis
The collected sediment samples were naturally dried at room temperature, and 3.00 g of each dried sample was weighed. After grinding with an agate mortar, the samples were passed through a 200-mesh (75 μm) standard sieve. The homogenized samples were then divided into two parallel aliquots for analysis using a Vario MAX elemental analyser (Elementar, Germany), with the instrumental analytical error strictly controlled within 0.5% to ensure data accuracy and reliability. This analytical method, in which high-temperature combustion (950°C) and chromatographic separation techniques are employed, enables precise determination of the TC and TN contents in the samples.
2.3.3. BD and MC Analysis
In this study, the standard oven-drying method was employed to determine the sediment MC and BD. The procedure included the following steps: First, clean aluminium boxes were weighed using an electronic balance (precision: 0.01 g). Then, exactly 10.00 g of a fresh sediment sample was placed in each aluminium box. The samples were dried in a constant-temperature oven at 105±2°C for 48 h until a constant weight was obtained, with triplicate samples prepared for each group to ensure data reliability. The sediment MC and BD were calculated as follows:
where MC denotes the sediment moisture content (%), BD denotes the bulk density (g/cm3), W1 denotes the weight of the empty aluminium box (g), W2 denotes the combined weight of the aluminium box and wet sediment (g), W3 denotes the combined weight of the aluminium box and dried sediment (g), W4 denotes the weight of each sediment layer (g), and v denotes the volume of the wet sediment sample (cm3).
2.3.4. EC and pH Analysis
In this study, standard methods were employed to determine the sediment pH and EC. Precisely 5.00 g of a fresh sediment sample (duplicate aliquots) was weighed into 250-mL polyethylene centrifuge bottles. For pH measurement, 12.5 mL of deionized water was added at a 1:2.5 solid-to-liquid ratio, whereas for EC determination, 25 mL of deionized water was added at a 1:5 ratio. The bottles were shaken at 120 rpm for 30 min in a reciprocating thermostatic shaker maintained at 20±1°C, followed by 30 min of equilibration. The supernatant was filtered through medium-speed quantitative filter paper (11-μm pore size) into 100-mL polypropylene beakers. The pH was measured using a Rex pHS-3C benchtop pH meter (±0.01 accuracy), and EC was determined with a Mettler Toledo FE30 conductivity meter (±1% accuracy). All measurements were conducted under constant-temperature conditions (20±1°C), with triplicate determinations per sample to ensure data reliability.
2.4. Statistical Analysis
The statistical analysis followed a rigorous multistep protocol. First, the raw data were preprocessed, including outlier removal and normality verification (Shapiro‒Wilk test, α = 0.05). One-way analysis of variance (ANOVA) was then performed to assess differences among the five sediment layers (0–20, 20–40, 40–60, 60–80, and 80–100 cm) across 12 parameters: eight directly measured indicators (BD, MC, pH, EC, TC, TN, MBC and MBN) and four derived indicators (TC/TN, MBC/TC, MBN/TN, and MBC/MBN). For parameters showing significant interlayer differences (P<0.05), Tukey’s honestly significant difference (HSD) post hoc test was employed to determine specific variations between depth intervals.
Subsequently, Pearson’s correlation analysis was used to examine the interparameter relationships within each sediment layer. Correlation coefficients (R, ranging from -1 to 1) were calculated as the ratio of the covariance to the product of standard deviations, with relationships categorized as strong (|R|>0.5), moderate (0.3≤|R|≤0.5), or weak relationships (|R|<0.3). Significance was evaluated via two-tailed t tests (α = 0.05).
Finally, redundancy analysis (RDA) was conducted to elucidate the environmental drivers (BD, MC, pH, EC, TN, and TC) of the variations in the microbial biomass (MBC and MBN) across layers. The environmental factors were subjected to Z score standardization, and the microbial data were subjected to Hellinger transformation. The significance of the RDA model was evaluated with 999 permutations, with major drivers identified on the basis of the variance explained by the first two axes.
All analyses were conducted in R (v4.3.0): ANOVA, Tukey HSD and Pearson’s correlation analysis tests were conducted using the stats package, and RDA was performed via the vegan package. In this comprehensive approach, (1) parametric assumption testing, (2) stratified univariate comparisons, (3) correlation network mapping, and (4) constrained ordination are integrated to reveal depth-dependent biogeochemical controls.
3. Results
3.1. Vertical Distribution Characteristics of Sediment Physicochemical Properties
The results revealed significant differences (one-way ANOVA, P < 0.05) in all eight directly measured parameters—BD, MC, pH, EC, TC, TN, MBC and MBN—across the sediment layers.
The BD exhibited a U-shaped vertical profile, with significantly greater values in the surface (0–20 cm, 1.12±0.04 g/cm3) and bottom layers (80–100 cm, 1.08±0.03 g/cm3) than in the intermediate layers (20–80 cm, approximately 0.9 g/cm3; Table 1, Figure 2A; Tukey’s HSD test, P < 0.05). The MC peaked from 40–60 cm (36.76±1.99%) and 60–80 cm (36.23±1.90%), whereas the lowest values occurred in the bottom layer (80–100 cm, 27.69±0.87%). The pH reached its maximum value in the subsurface layer (20–40 cm, 8.05±0.05), differing significantly from that in the surface (7.83±0.04) and bottom layers (7.82±0.05; Figure 2C). The EC increased notably with depth, peaking from 80–100 cm (4564.44±233.76 μS/cm).
The TN and TC contents exhibited decreasing trends with depth. TN reached its lowest level from 80–100 cm (0.24±0.03 mg/kg; Table 1), which was significantly lower than that in the surface layers (P < 0.001). In contrast, the TC content peaked from 40–60 cm (6.49±0.73 g/kg), exceeding that in all the other layers (P < 0.001). The MBC and MBN contents decreased sharply with depth: MBC decreased sharply from 20–40 cm (90.42±4.54 mg/kg) to 40–60 cm (60.06±6.98 mg/kg), whereas MBN decreased significantly below 80 cm (80–100 cm: 3.72±0.70 mg/kg), differing notably from that in layers above 60 cm (Figure 2J).
Among the derived ratios, the TC/TN ratio peaked from 40–60 cm (17.00±1.60), differing significantly from that in the 0–40 cm layers (Figure 2G). Conversely, the MBC/TC ratio reached its minimum from 40–60 cm (0.0096±0.0009), with significant differences from those in the 0–40 cm and 80–100 cm layers (Figure 2I). No clear trends were observed for the MBN/TN or MBC/MBN ratio (Figures 2K and 2L).
3.2. Relationships Between Environmental Factors and Sediment Carbon–Nitrogen Contents
Pearson’s correlation analysis revealed complex depth-dependent relationships between physicochemical parameters and carbon–nitrogen indicators (Table 2), with distinct stratification patterns across sediment layers. In the surface layer (0–20 cm), only MBC and TC were significantly positively correlated (R = 0.73, P < 0.05). The subsurface layer (20–40 cm) exhibited strong positive correlations between MC and both TC and TN (R > 0.71, P < 0.05). In the middle layer (40–60 cm), MC was significantly positively correlated with TC (R = 0.78, P < 0.05) and TN (R = 0.84, P < 0.01), whereas TC and MBC were positively correlated (R = 0.68, P < 0.05), and TN was negatively correlated with BD (R = -0.82, P < 0.01). In the 60–80 cm layer, EC, MC and TN exhibited mutually positive correlations (R > 0.75, P < 0.05), whereas MBC and pH, as well as MBN and MC, exhibited significant negative correlations. The BD in the bottom layer (80–100 cm) was positively correlated with both the pH (R = 0.85) and TN (R = 0.81). Integrated analysis of the entire profile (0–100 cm) revealed pairwise positive correlations among TC, TN, MBC and MBN (R > 0.33, P < 0.05), with MC showing positive correlations with EC and TC, whereas EC and MBN, along with BD and TC, exhibited significant negative correlations. These results demonstrate clear vertical differences in sediment carbon‒nitrogen cycling processes, with biological processes dominating in surface layers and physicochemical factors yielding greater influences in deeper sediments.
3.3. Driving Effects of Environmental Factors on Microbial Biomass Carbon and Nitrogen
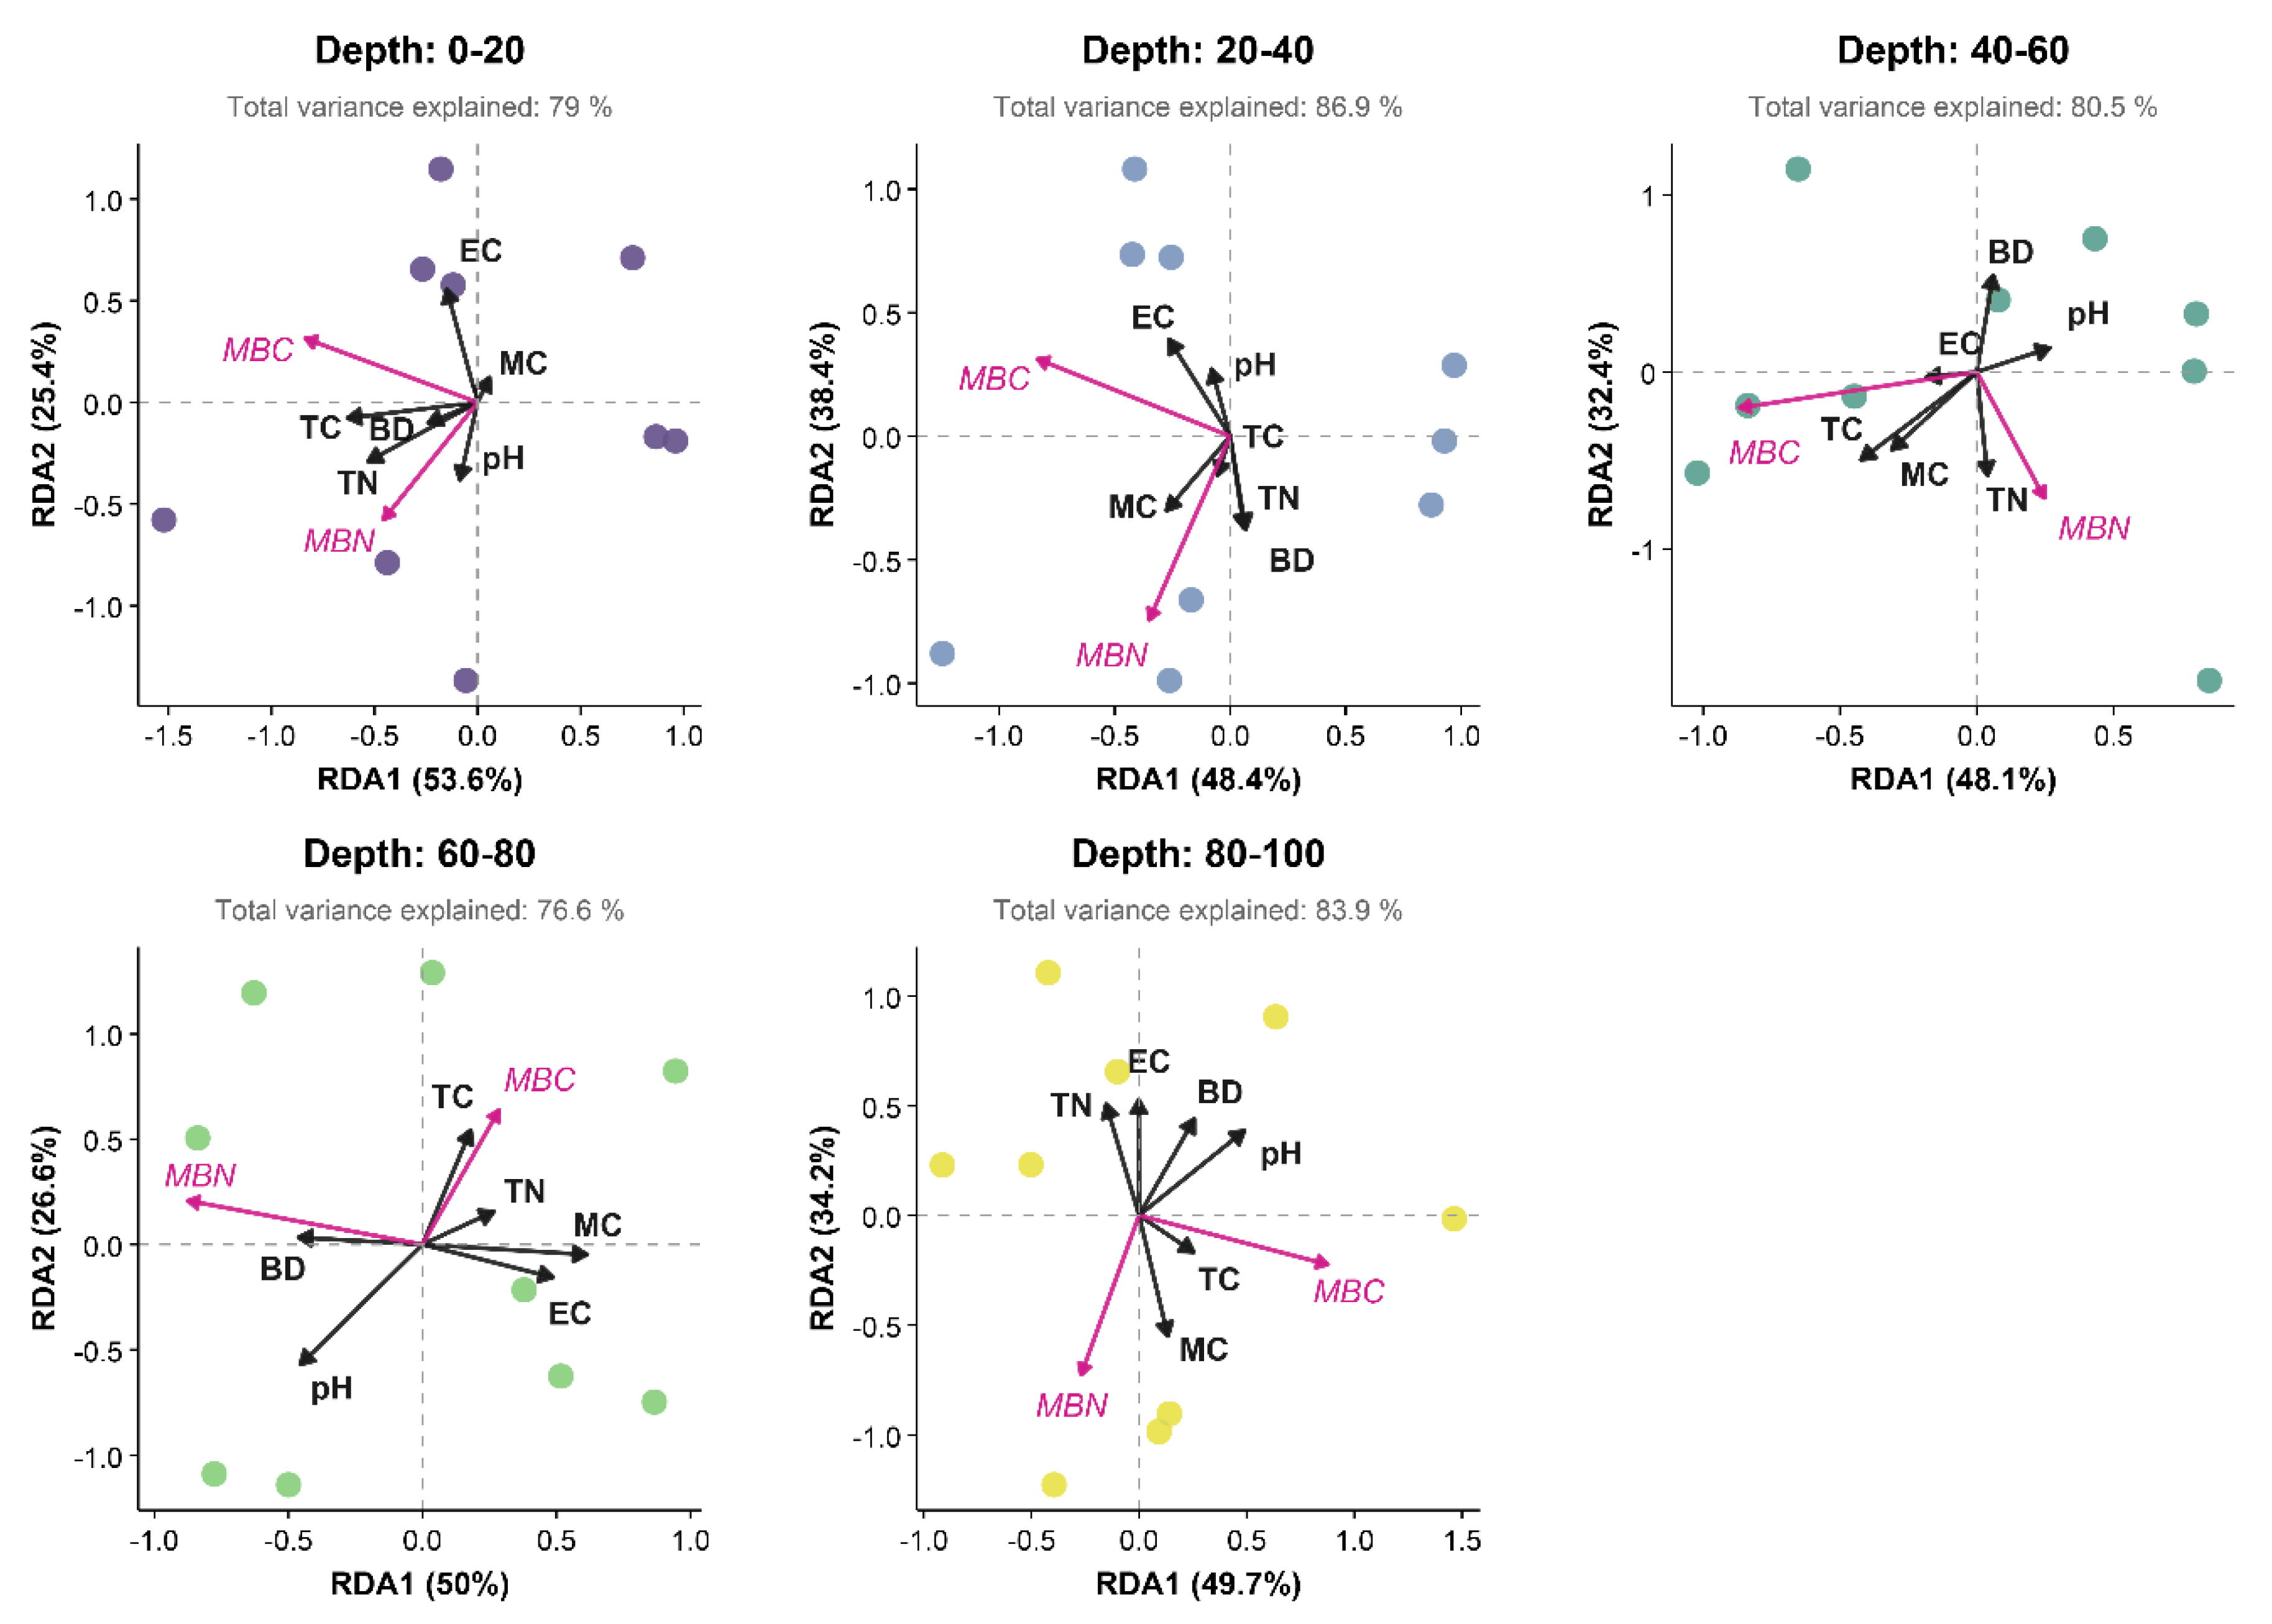
The RDA results revealed that the vertical differences in MBC and MBN in the northern Yellow Sea coastal wetlands were synergistically regulated by multiple factors (Table 2, Figure 4). In the surface layer (0–20 cm), the RDA model explained 81.10% of the variance, although this result was not statistically significant (P = 0.386). The first axis (RDA1, 53.60% variance) was primarily negatively driven by TC (coefficient = −0.71), whereas the pH exerted a positive influence (coefficient = 0.28). The subsurface layer (20–40 cm) exhibited the highest explanatory power (R2 = 0.832), with RDA1 accounting for 48.40% of the variance. MC and BD imposed significant negative effects (coefficients = −1.03 and −0.47, respectively), whereas TC exerted a notable positive effect (coefficient = 1.15). For the middle layer (40–60 cm), the model explained 78.00% of the variance. RDA1 (48.10% variance) was controlled mainly by the negative influence of TN (coefficient = −0.85), whereas EC and MC yielded weaker effects (coefficients = 0.10 and 0.24, respectively). In the lower middle layer (60–80 cm), the explanatory power of the model was relatively low (R2 = 0.700). RDA1 (50.00% variance) was most strongly associated with the pH (coefficient = 0.32). The bottom layer (80–100 cm) demonstrated notable explanatory power (R2 = 0.887, P = 0.172), with RDA1 (49.70% variance) highlighting TN and EC as key negative drivers (coefficients = −1.07 and −0.38, respectively), whereas BD exhibited a notable positive effect (coefficient = 1.35). Although none of the RDA models reached statistical significance (P > 0.05), the directional trends of the coefficients across the different sediment layers suggest potential influences of environmental factors on the microbial biomass distribution. These findings underscore the complex, depth-specific interplay between physicochemical parameters and microbial activity in coastal wetland sediments.
Figure 3.
Correlation analysis of physicochemical and biological indicators in coastal wetland sediments from the northern Yellow Sea across different sediment layers and the total sediment column, with only significant results labelled (“*”: 0.01< P < 0.05; “**”: P < 0.01).
Figure 3.
Correlation analysis of physicochemical and biological indicators in coastal wetland sediments from the northern Yellow Sea across different sediment layers and the total sediment column, with only significant results labelled (“*”: 0.01< P < 0.05; “**”: P < 0.01).
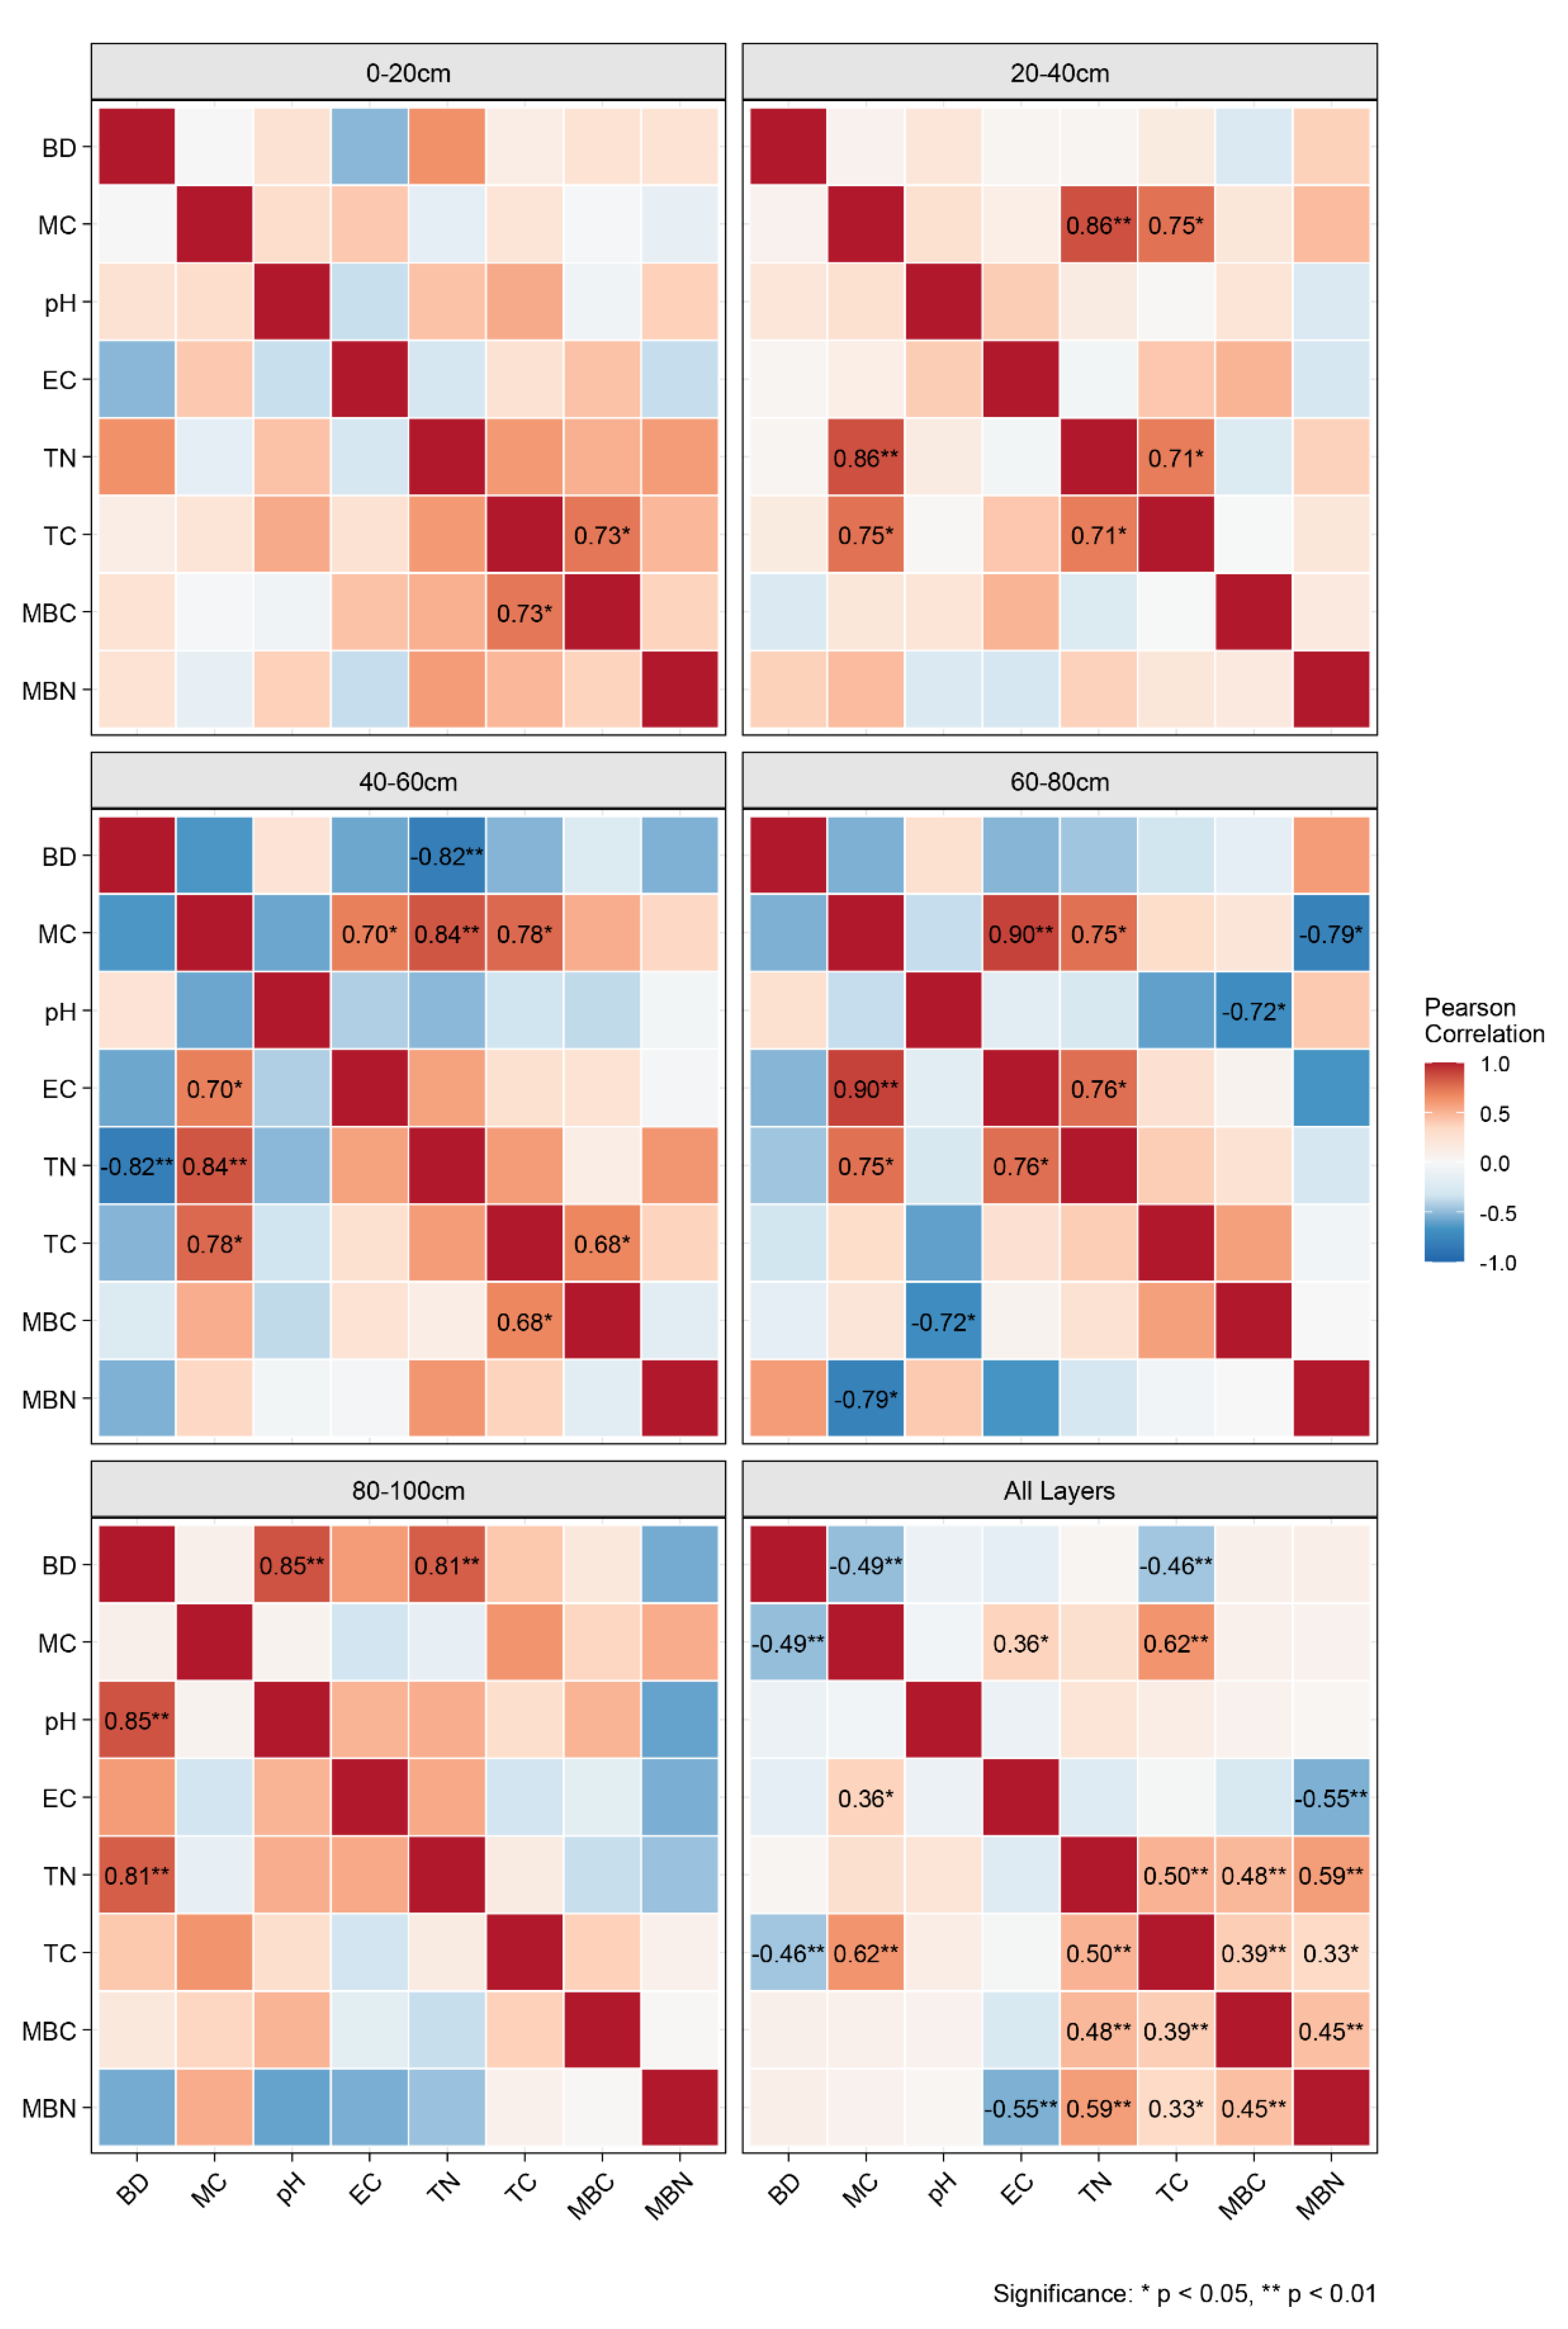
Figure 4.
Redundancy analysis (RDA) of the microbial biomass (MBC and MBN; magenta arrows) and environmental drivers (BD, MC, pH, EC, TC, and TN; black arrows) across five sediment depths (0–20, 20–40, 40–60, 60–80, and 80–100 cm).
Figure 4.
Redundancy analysis (RDA) of the microbial biomass (MBC and MBN; magenta arrows) and environmental drivers (BD, MC, pH, EC, TC, and TN; black arrows) across five sediment depths (0–20, 20–40, 40–60, 60–80, and 80–100 cm).
4. Discussion
4.1. Vertical Distribution Characteristics of Carbon and Nitrogen
The TC and TN contents in northern Yellow Sea coastal wetland sediments exhibited distinct vertical patterns. The TN content significantly decreased with depth (0.51±0.04 g/kg from 0–20 cm to 0.24±0.03 g/kg from 80–100 cm), which is consistent with typical nitrogen dynamics in coastal wetlands [19,20]. The nitrogen in these sediments originates primarily from microbial mineralization of organic matter, whereas the lower nitrogen content in deeper layers may result from continuous mineralization during long-term burial and nitrogen loss through denitrification [28].
TC exhibited a nonmonotonic vertical distribution (involving an initial increase from 4.17±0.32 g/kg at the surface to 6.49±0.73 g/kg in the mid-depth layer, followed by a decrease to 2.63±0.26 g/kg in the bottom layer). The TC/TN ratio followed a similar trend. The relatively low surface TC content may be attributed to frequent tidal scouring, which promotes the mineralization of organic carbon into CO2 and the physical removal of inorganic carbon by seawater.
Both the MBC and MBN contents decreased significantly with depth (MBC: 95.92±11.91 mg/kg from 0–20 cm to 46.84±6.05 mg/kg from 80–100 cm; MBN: 14.23±1.81 mg/kg to 3.72±0.70 mg/kg), whereas the MBC/MBN ratio demonstrated no obvious trend (Figure 2L). This decreasing pattern agrees with findings for South Dongting Lake wetlands [29], reflecting enhanced humification and reduced decomposition rates under anaerobic conditions.
Notably, the MBC content sharply decreased (a 45% decrease) from 40–60 cm (from 90.42±4.54 mg/kg at depths from 20–40 cm to 60.04±6.98 mg/kg at depths from 40–60 cm; Table 1), which is likely related to redox interface migration. Studies indicate that an increased waterlogging depth significantly inhibits methanotroph activity and reduces soil respiration rates, leading to an abrupt decrease in the MBC content [30,31]. Additionally, oxygen-depleted conditions in deeper layers suppress aerobic microbial activity, altering organic matter decomposition pathways [5]. The significant increases in EC (from 3226.30±177.94 μS/cm to 4129.63±302.00 μS/cm) and BD at this depth may in turn inhibit microbial metabolism through porosity and salinity changes. In the bottom layer (80–100 cm), MBN dramatically decreased (>50% decrease from 7.50±1.02 mg/kg at depths from 60–80 cm to 3.72±0.70 mg/kg). This can be attributed to sulfide accumulation in the sulfate reduction zone (below 80 cm), which inhibits denitrifier activity and exacerbates nitrogen limitation, a mechanism consistent with sulfide interference in iron‒carbon coupled reactions [32].
4.2. Environmental Driving Mechanisms of Microbial Biomass Carbon and Nitrogen
This study systematically revealed the vertical distribution characteristics and environmental driving mechanisms of MBC and MBN in coastal wetland sediments. Moreover, our analysis revealed significant differences in regulatory factors across sediment layers.
In surface sediments (0–20 cm), tidal dynamics emerged as the key factor influencing microbial activity. The negative driving effect of TC on MBC (RDA coefficient = -0.71) likely reflects organic carbon loss due to tidal scouring, which is consistent with the findings reported by Zhou et al. [33] for the Qiantang River estuary wetlands, where intense tidal disturbances accelerate dissolved organic carbon transport. Notably, the pH imposed a significant positive influence (coefficient = 0.28), potentially related to buffering effects from periodic tidal inundation. We hypothesize that the high buffering capacity of seawater results in relatively stable pH conditions, promoting the growth of alkaliphilic microbial communities (e.g., ammonia-oxidizing bacteria). This antagonistic effect between carbon loss and pH buffering constitutes a unique survival strategy for surface microorganisms.
The subsurface layer (20–40 cm) exhibited more complex regulatory networks. The inhibitory effects of MC and BD on MBC (coefficients = -1.03 and -0.47, respectively) suggest that physical limitations dominate this zone. A high MC level may result in the rapid depletion of oxygen dissolved in porewater, whereas an increased BD level directly restricts microbial mobility and diffusion, supporting the hypothesis of Lin et al. [34] stating that the sediment particle size distribution affects microbial spatial patterns. However, the positive driving effect of TC (coefficient = 1.15) indicates that organic matter input can partially mitigate physical stress. Notably, this layer exhibited a significantly higher TC/TN ratio (17.0±1.6), suggesting that higher-quality organic matter input provides superior carbon sources, partially offsetting physical limitations.
Deep sediments (40–100 cm) exhibited distinct chemical stress characteristics. In the 40–60 cm redox transition zone, the negative control of TN on MBC (coefficient = -0.85) may reflect multiple stressors: nitrogen limitation potentially forces microbes towards more energy-intensive metabolic pathways [35], whereas denitrification-induced nitrogen loss may exacerbate nutrient limitation [36]. In the 80–100 cm sulfate reduction zone, the notable inhibitory effect of EC (coefficient =-0.38) is likely related to sulfide accumulation. Our data revealed that the EC values in this layer could reach 4564±234 μS/cm; such hypersaline conditions can cause the disruption of microbial membrane integrity [37]. Luo et al. [38] similarly reported that vertical salinity variations affect diazotrophic community diversity. Interestingly, the positive effect of BD (coefficient = 1.35) herein may reflect the dual role of compaction: while reducing the pore space limits microbial mobility, this process simultaneously increases the probability of substrate contact (increased organic matter contact area per unit volume). This stress‒adaptation equilibrium should be investigated further.
5. Conclusions
5.1. Key Inflection Points of the Vertical Variations in MBC and MBN in Northern Yellow Sea Coastal Wetlands
This study revealed two critical inflection points in the vertical distributions of MBC and MBN. In the 40–60 cm layer, MBC sharply decreased (45% reduction), which is likely associated with redox interface migration and salinity-induced inhibition of aerobic microbial activity. In the 80–100 cm layer, MBN sharply decreased by more than 50%, presumably because sulfide accumulation in sulfate reduction zones interferes with nitrogen metabolism. Additionally, TC peaked in the 40–60 cm layer (6.49±0.73 g/kg), whereas the TC/TN ratio simultaneously increased (17.0±1.6), reflecting depth-dependent differences in the organic matter input quality and decomposition rates.
5.2. Driving Factors of MBC and MBN in Northern Yellow Sea Coastal Wetlands
Microbial activity was synergistically regulated by multiple factors: In the surface layers (0–20 cm), tide-driven carbon loss (negative TC effect) and pH buffering dominated; subsurface layers (20–40 cm) were restricted by MC and BD, although high-quality carbon sources (positive TC effect) partially alleviated stress; and deep layers (40–100 cm) were primarily controlled by chemical factors, such as nitrogen limitation (negative TN effect) from 40–60 cm and high salinity (EC inhibition) from 80–100 cm. The vertical differentiation characteristics demonstrated that the surface layers are governed by physical‒biological interactions, whereas the deep layers are dominated by chemical stress, providing new insights into the depth-dependent differentiation mechanisms of carbon and nitrogen cycling in coastal saltmarsh wetland sediments.
Funding
This research was supported by the financial support provided by the project of “Preliminary investigation on carbon pool size of blue carbon ecosystem in the reserve in 2024 (Grant No. 2014115199).”.
Institutional Review Board Statement
Not applicable.
Informed Consent Statement
Not applicable.
Data Availability Statement
Data will be made available on request.
Acknowledgments
Authors of this article would like to thank all the people who participated in this study and the experimental space provided by the Yalu River Estuary National Nature Reserve.
Conflicts of Interest
The authors declare no conflicts of interest.
References
- Ward, N.D.; Megonigal, J.P.; Bond-Lamberty, B., et al. Representing the function and sensitivity of coastal interfaces in Earth system models. Nat. Commun. 2020, 11, 2458. [CrossRef]
- Wang, F., Sanders, C.J., Santos, I.R., et al. Global blue carbon accumulation in tidal wetlands increases with climate change. Natl. Sci. Rev. 2021, 8, nwaa296. [CrossRef]
- Mathis, M., Lacroix, F., Hagemann, S., et al. Enhanced CO2 uptake of the coastal ocean is dominated by biological carbon fixation. Nat. Clim. Change. 2024, 14, 373-379. [CrossRef]
- Wang, F., Lu, X., Sanders, C.J., et al. Tidal wetland resilience to sea level rise increases their carbon sequestration capacity in United States. Nat. Commun. 2019, 10, 5434.
- Wei, L., Ge, T., Zhu, Z., et al. Paddy soils have a much higher microbial biomass content than upland soils: A review of the origin, mechanisms, and drivers. Agric. Ecosyst. Environ. 2022, 326, 107798.
- Niu, Y., An, Z., Gao, D., et al. Tidal dynamics regulates potential coupling of carbon-nitrogen-sulfur cycling microbes in intertidal flats. Sci. Total Environ. 2023, 899, 165663. [CrossRef]
- Talling, P.J., Hage, S., Baker, M.L., et al. The global turbidity current pump and its implications for organic carbon cycling. Annu. Rev. Mar. Sci. 2024, 16, 105-133.
- Berhe, A.A., Barnes, R.T., Six, J., et al. Role of soil erosion in biogeochemical cycling of essential elements: carbon, nitrogen, and phosphorus. Annu. Rev. Earth Pl. Sc. 2018, 46, 521-548. [CrossRef]
- Liu, L., Sun, F., Zhao, H., et al. Compositional changes of sedimentary microbes in the Yangtze River Estuary and their roles in the biochemical cycle. Sci. Total Environ. 2021, 760, 143383.
- Li, C., Wang, Y., Yi, Y., et al. A review of reservoir carbon Cycling: Key Processes, influencing factors and research methods. Ecol. Indic. 2024, 166, 112511. [CrossRef]
- Holden, J., Burt, T.P. Hydrological studies on blanket peat: the significance of the acrotelm-catotelm model. J. Ecol. 2003, 86-102.
- Beer, J., Lee, K., Whiticar, M., et al. Geochemical controls on anaerobic organic matter decomposition in a northern peatland. Limnol. Oceanogr. 2008, 53, 1393-1407. [CrossRef]
- Degermendzhy, A.G., Zadereev, E.S., Rogozin, D.Y., et al. Vertical stratification of physical, chemical and biological components in two saline lakes Shira and Shunet (South Siberia, Russia). Aquat. Ecol. 2010, 44, 619-632. [CrossRef]
- Kazmi, S.S.U.H., Tayyab, M., Pastorino, P., et al. Vertical variations and environmental heterogeneity drove the symphony of periphytic protozoan fauna in marine ecosystems. Sci. Total Environ. 2024, 932, 173115.
- Sun, R., Han, G. A comprehensive review of multi-scale mechanisms of soil carbon mineralization: From micro processes to macro ecosystems. Geogr. Res. Bull. 2024, 3, 471-498.
- Lin, X., Hetharua, B., Lin, L., et al. Mangrove sediment microbiome: adaptive microbial assemblages and their routed biogeochemical processes in Yunxiao mangrove national nature reserve, China. Microb. Ecol. 2019, 78, 57-69. [CrossRef]
- Yu, X., Yang, X., Wu, Y., et al. Sonneratia apetala introduction alters methane cycling microbial communities and increases methane emissions in mangrove ecosystems. Soil Biol. Biochem. 2020, 144, 107775. [CrossRef]
- Yang, P., Shu, Q., Liu, Q., et al. Distribution and factors influencing organic and inorganic carbon in surface sediments of tidal flats in northern Jiangsu, China. Ecol. Indic. 2021, 126, 107633. [CrossRef]
- Zhang, A., Lv, W., Shu, Q., et al. Distribution Characteristics and Main Influencing Factors of Organic Carbon in Sediments of Spartina Alterniflora Wetlands along the Northern Jiangsu Coast, China. Land 2024, 13, 741.
- Chen, G., Cheng, S., Liu, J., et al. Physical-chemical Properties of Soil,C and N of Three Typical Communities in Tianjin Coastal Wetland. Bull. Bot. Res. 2015, 35, 406-411.
- Howes, B.L., Goehringer, D.D. Porewater drainage and dissolved organic carbon and nutrient losses through the intertidal creekbanks of a New England salt marsh. Mar. Ecol. Prog. Ser. 1994, 114, 289-301. [CrossRef]
- Mudd, S.M., Howell, S.M., Morris, J.T. Impact of dynamic feedbacks between sedimentation, sea-level rise, and biomass production on near-surface marsh stratigraphy and carbon accumulation. Estuar. Coast. Shelf S. 2009, 82, 377-389.
- Cai, Y.J., Liu, Z.A., Zhang, S., et al. Microbial community structure is stratified at the millimeter-scale across the soil–water interface. ISME Commun. 2022, 2, 53.
- Vance, E.D., Brookes, P.C., Jenkinson, D.S. An extraction method for measuring soil microbial biomass C. Soil Biol. Biochem. 1987, 19, 703-707.
- Witt, C., Gaunt, J.L., Galicia, C.C., et al. A rapid chloroform-fumigation extraction method for measuring soil microbial biomass carbon and nitrogen in flooded rice soils. Biol. Fertil. Soils 2000, 30, 510-519. [CrossRef]
- Jenkinson, D.S., Brookes, P.C., Powlson, D.S. Measuring soil microbial biomass. Soil Biol. Biochem. 2004, 36, 5-7.
- Zhou, Z., Hua, J., Xue, J. Polyethylene microplastic and soil nitrogen dynamics: Unraveling the links between functional genes, microbial communities, and transformation processes. J. Hazard. Mater. 2023, 458, 131857. [CrossRef]
- Wang, F., Chen, S., Wang, Y., et al. Long-term nitrogen fertilization elevates the activity and abundance of nitrifying and denitrifying microbial communities in an upland soil: implications for nitrogen loss from intensive agricultural systems. Front. Microbiol. 2018, 9, 2424.
- Lu, S., Zhou, N., Cai, Y., et al. Ecological Stoichiometry of Carbon, Nitrogen and Phosphorus in Deep Sediments within the Critical Zone of South Dongting Lake Wetland, China. J. Soil Sci. Plant Nut. 2024, 1-15. [CrossRef]
- Guo, X., Jiang, Y. Spatial characteristics of ecological stoichiometry and their driving factors in farmland soils in Poyang Lake Plain, Southeast China. J. Soil Sediment 2019, 19, 263-274. [CrossRef]
- Sun, S., Song, Z., Chen, B., et al. Current and future potential soil organic carbon stocks of vegetated coastal ecosystems and their controls in the Bohai Rim Region, China. Catena 2023, 225, 107023.
- Li, J., Sang, C., Yang, J., et al. Stoichiometric imbalance and microbial community regulate microbial elements use efficiencies under nitrogen addition. Soil Biol. Biochem. 2021, 156, 108207.
- Zhou, Y., Li, Y., Yao, X., et al. Response of chromophoric dissolved organic matter dynamics to tidal oscillations and anthropogenic disturbances in a large subtropical estuary. Sci. Total Environ. 2019, 662, 769-778. [CrossRef]
- Lin, J., Zhou, X., Lu, X., et al. Grain size distribution drives microbial communities vertically assemble in nascent lake sediments. Environ. Res. 2023, 227, 115828. [CrossRef]
- Fang, Z., Yu, H., Jiao, F., et al. Microbial Metabolic Limitation in Response to Phosphorus Enrichment: Implications for Carbon Sequestration in a Nitrogen-Enriched Desert Steppe. Land Degrad. Dev. 2025, 36, 2405-2419. [CrossRef]
- Ayiti, O.E., Babalola, O.O. Factors influencing soil nitrification process and the effect on environment and health. Front. Sustain. Food S. 2022, 6, 821994.
- Kumawat, C., Kumar, A., Parshad, J., et al. Microbial diversity and adaptation under salt-affected soils: a review. Sustainability 2022, 14, 9280.
- Luo, Z., Zhong, Q., Han, X., et al. Depth-dependent variability of biological nitrogen fixation and diazotrophic communities in mangrove sediments. Microbiome 2021, 9, 1-14. [CrossRef]
Figure 1.
Geographical location of the sample site in the northern Yellow Sea coastal wetland.
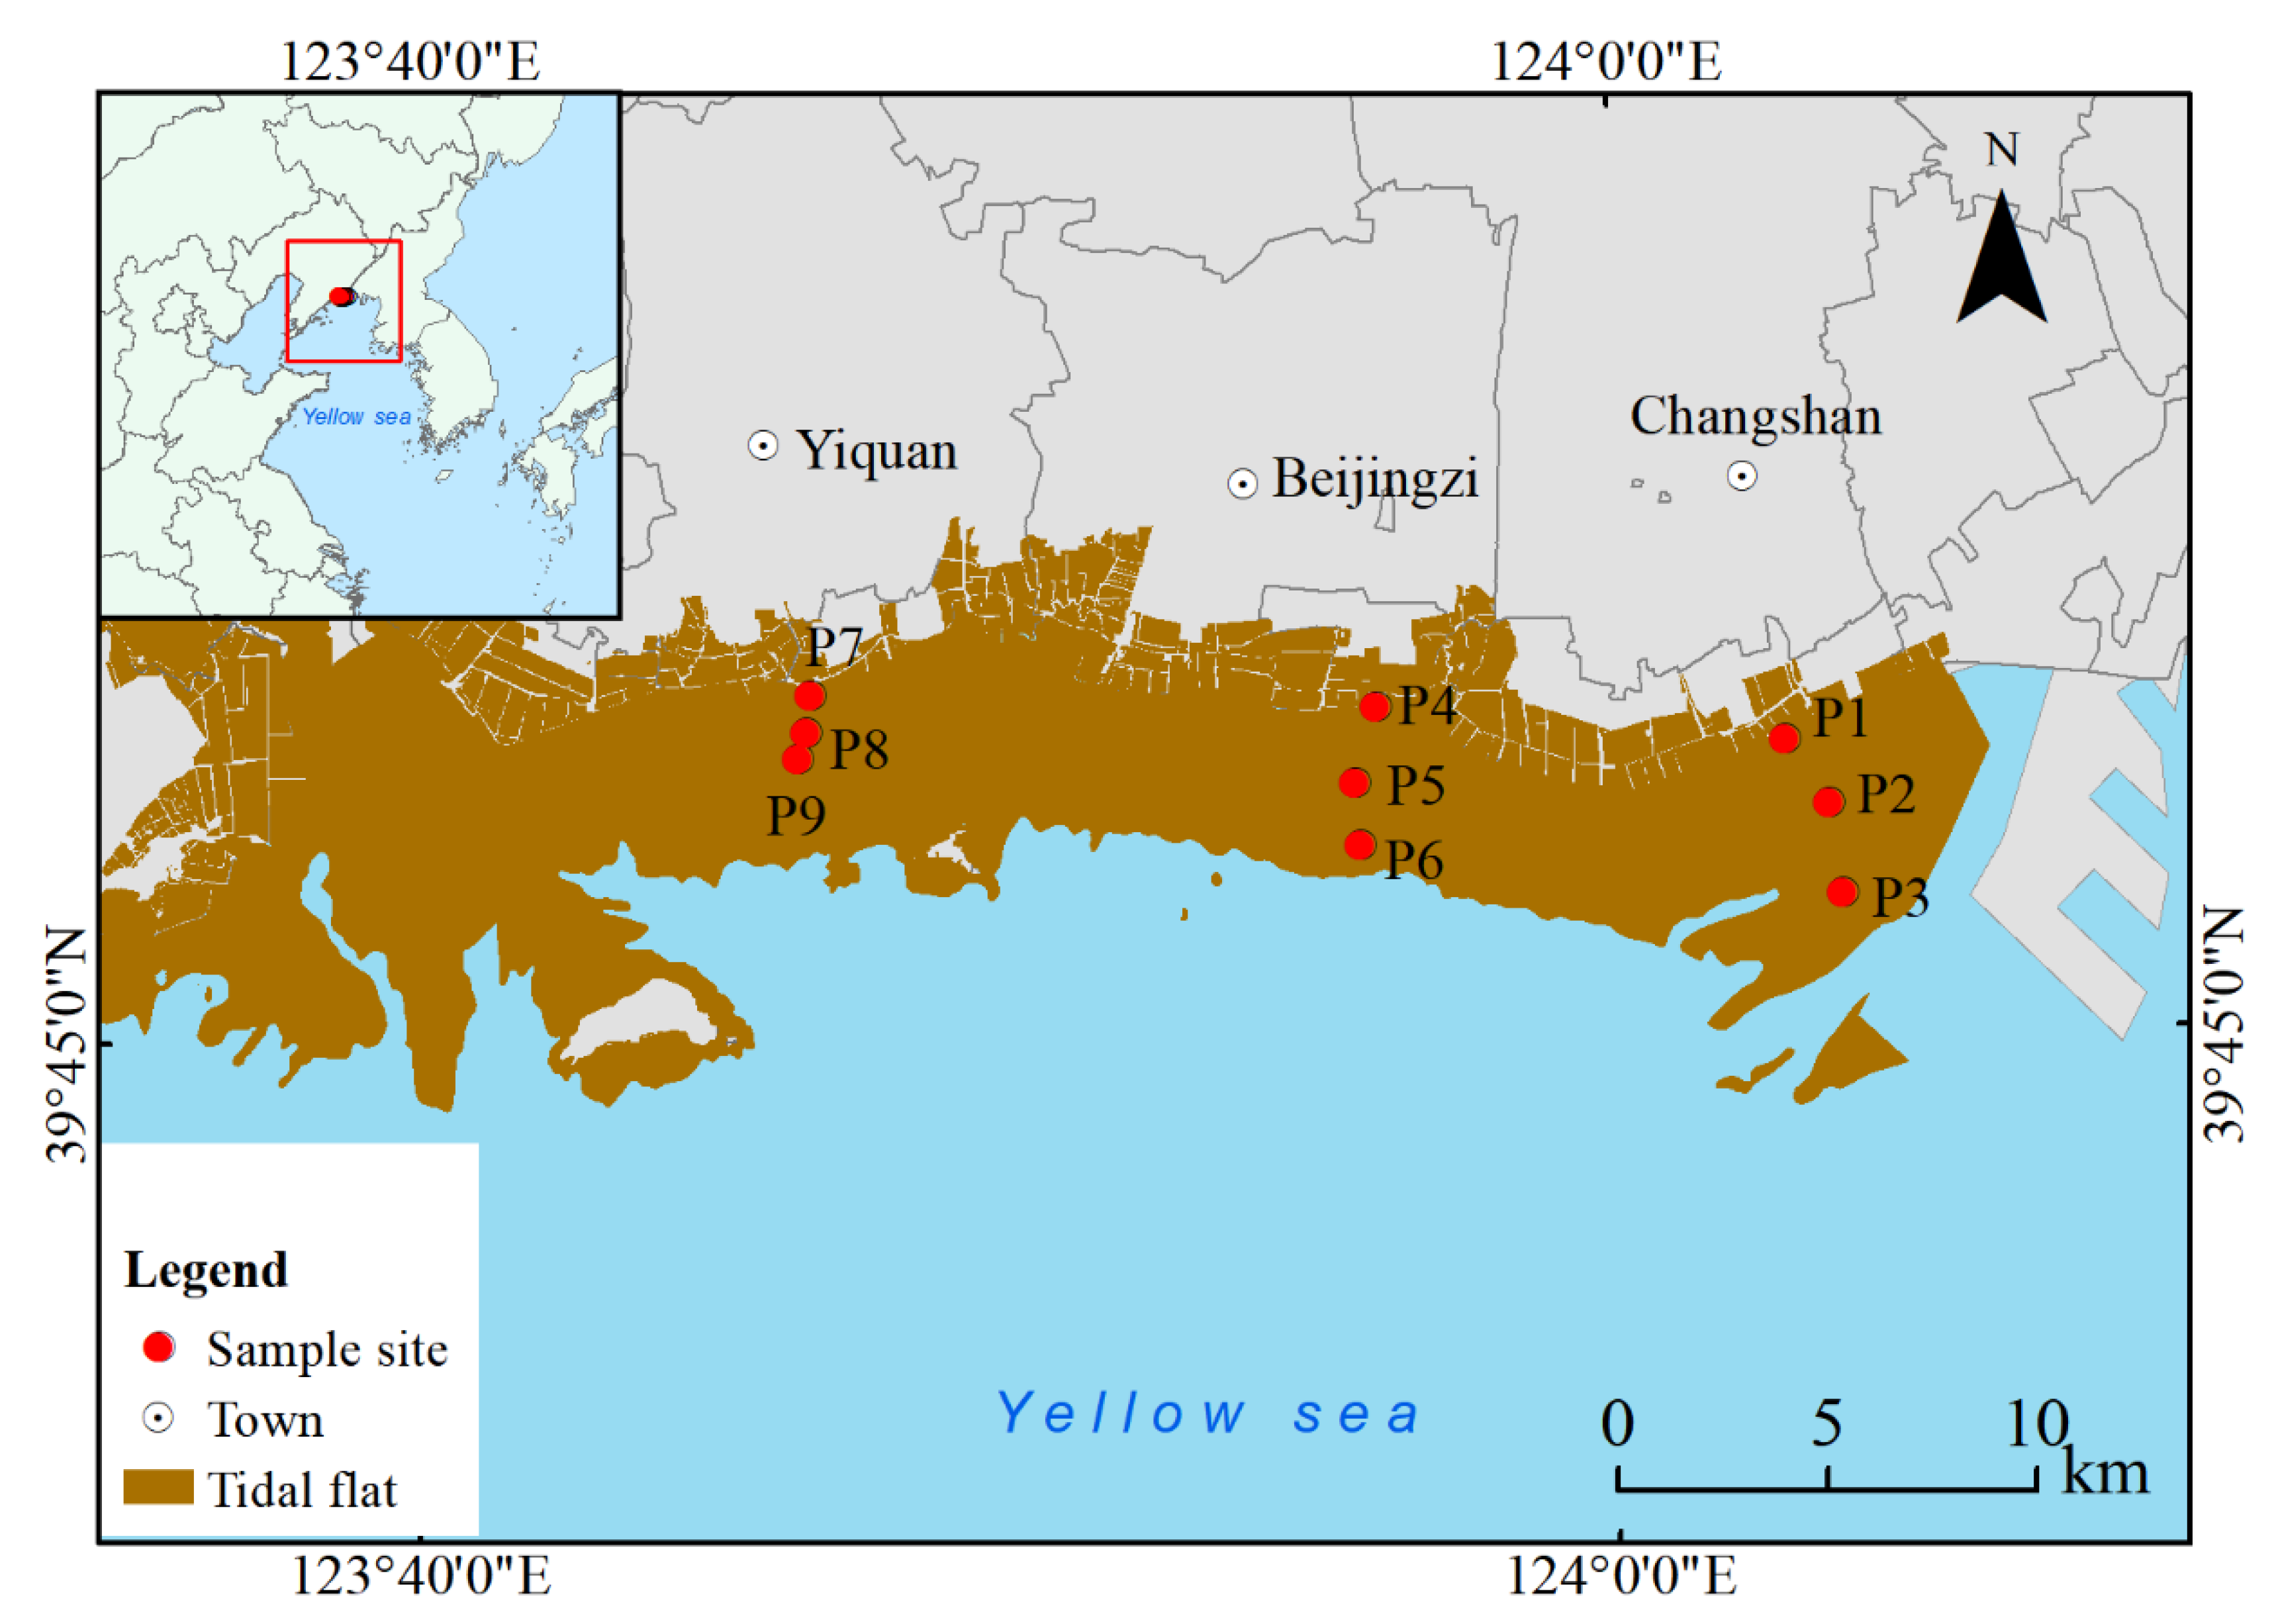
Figure 2.
Results of one-way ANOVA of the effects of the sediment depth on eight directly measured indicators (BD, MC, pH, EC, TC, TN, MBC and MBN) and four derived indicators (TC/TN, MBC/TC, MBN/TN, and MBC/MBN). “*”: 0.01< P < 0.05, “**”: P < 0.01.
Figure 2.
Results of one-way ANOVA of the effects of the sediment depth on eight directly measured indicators (BD, MC, pH, EC, TC, TN, MBC and MBN) and four derived indicators (TC/TN, MBC/TC, MBN/TN, and MBC/MBN). “*”: 0.01< P < 0.05, “**”: P < 0.01.
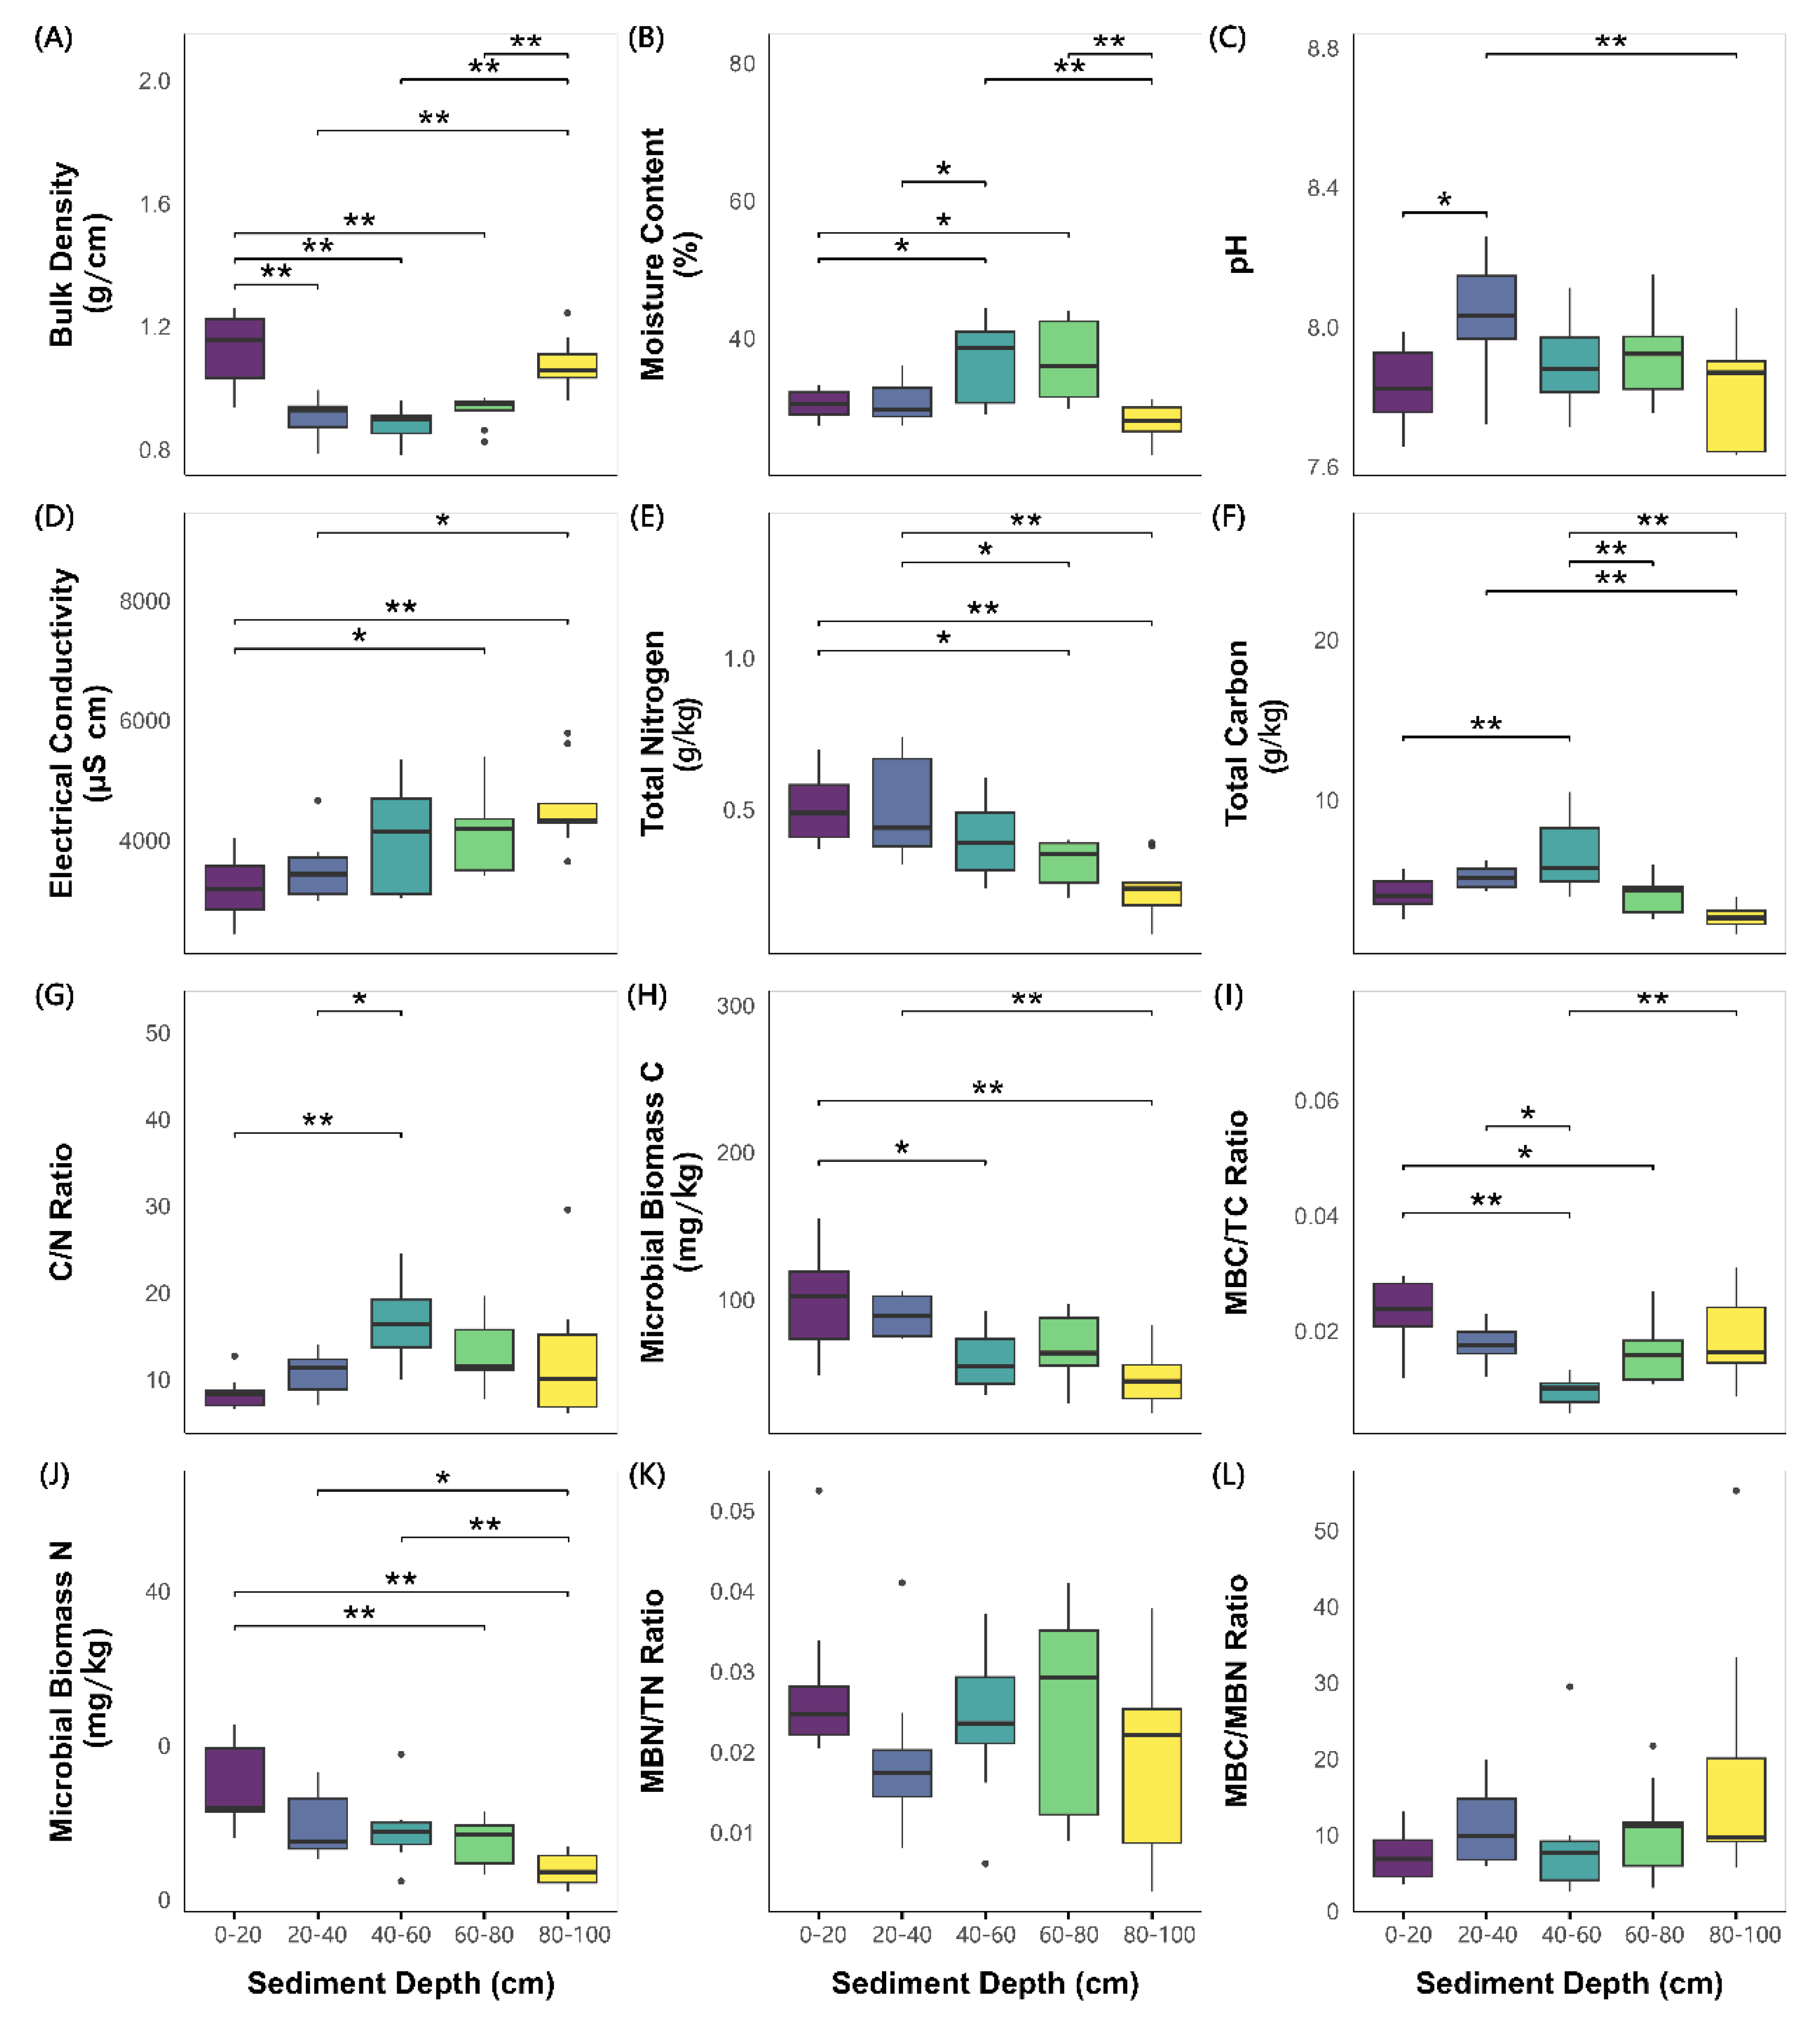

Table 1.
Mean±SE of the measured and derived indicators in northern Yellow Sea coastal wetland sediments across sediment layers and the total sediment layer.
Table 1.
Mean±SE of the measured and derived indicators in northern Yellow Sea coastal wetland sediments across sediment layers and the total sediment layer.
| Layers | All layers 0-100 cm |
|||||
|---|---|---|---|---|---|---|
| 0-20 cm | 20-40 cm | 40-60 cm | 60-80 cm | 80-100 cm | ||
| Measured indicators | ||||||
| BD (g/cm3) | 1.12 ± 0.04 | 0.91 ± 0.02 | 0.88 ± 0.02 | 0.93 ± 0.02 | 1.08 ± 0.03 | 0.98 ± 0.02 |
| MC (%) | 30.37 ± 0.71 | 30.59 ± 0.97 | 36.76 ± 1.99 | 36.23 ± 1.90 | 27.69 ± 0.87 | 32.33 ± 0.80 |
| pH | 7.83 ± 0.04 | 8.05 ± 0.05 | 7.89 ± 0.04 | 7.91 ± 0.04 | 7.82 ± 0.05 | 7.90 ± 0.02 |
| EC (μS/cm) | 3226.30 ± 177.94 | 3487.04 ± 177.38 | 4129.63 ± 302.00 | 4211.11 ± 243.20 | 4564.44 ± 233.76 | 3923.70 ± 123.54 |
| TN (g/kg) | 0.51 ± 0.04 | 0.51 ± 0.05 | 0.40 ± 0.04 | 0.32 ± 0.02 | 0.24 ± 0.03 | 0.40 ± 0.02 |
| TC (g/kg) | 4.17 ± 0.32 | 5.15 ± 0.24 | 6.49 ± 0.73 | 4.09 ± 0.40 | 2.63 ± 0.26 | 4.50 ± 0.27 |
| MBC (mg/kg) | 95.92 ± 11.91 | 90.42 ± 4.54 | 60.04 ± 6.98 | 65.13 ± 8.44 | 46.84 ± 6.05 | 71.67 ± 4.41 |
| MBN (mg/kg) | 14.23 ± 1.81 | 9.55 ± 1.41 | 9.03 ± 1.47 | 7.50 ± 1.02 | 3.72 ± 0.70 | 8.80 ± 0.77 |
| Derived indicators | ||||||
| TN/TC | 8.37 ± 0.64 | 10.68 ± 0.80 | 17.00 ± 1.60 | 12.92 ± 1.27 | 12.75 ± 2.50 | 12.34 ± 0.78 |
| MBC/TC (10-3) | 22.95 ± 2.07 | 17.87 ± 1.22 | 9.57 ± 0.92 | 16.04 ± 1.78 | 18.50 ± 2.34 | 16.99 ± 0.99 |
| MBN/TN (10-3) | 28.18 ± 3.34 | 19.63 ± 3.10 | 23.48 ± 3.00 | 25.03 ± 4.12 | 18.55 ± 3.94 | 22.97 ± 1.60 |
| MBC/MBN | 7.34 ± 1.09 | 11.06 ± 1.61 | 9.08 ± 2.69 | 10.43 ± 2.06 | 18.54 ± 5.44 | 11.29 ± 1.40 |
* Tukey’s HSD test results are shown in Figure 2.
Table 2.
RDA results for the physicochemical and biological indicators of northern Yellow Sea coastal wetland sediments.
Table 2.
RDA results for the physicochemical and biological indicators of northern Yellow Sea coastal wetland sediments.
| SD | R2 | P-value | Redundancy Analysis Coefficient | |||||
|---|---|---|---|---|---|---|---|---|
| BD | MC | pH | EC | TN | TC | |||
| 0-20 cm | 0.811 | 0.386 | -0.105 | 0.109 | 0.280 | -0.013 | -0.025 | -0.710 |
| 20-40 cm | 0.832 | 0.367 | -0.474 | -1.029 | 0.336 | -0.251 | -0.043 | 1.150 |
| 40-60 cm | 0.780 | 0.421 | -0.256 | 0.241 | -0.202 | 0.096 | -0.845 | 0.066 |
| 60-80 cm | 0.700 | 0.653 | 0.081 | -0.177 | 0.322 | 0.124 | 0.040 | -0.060 |
| 80-100 cm | 0.887 | 0.172 | 1.351 | -0.044 | -0.032 | -0.382 | -1.072 | -0.557 |
Disclaimer/Publisher’s Note: The statements, opinions and data contained in all publications are solely those of the individual author(s) and contributor(s) and not of MDPI and/or the editor(s). MDPI and/or the editor(s) disclaim responsibility for any injury to people or property resulting from any ideas, methods, instructions or products referred to in the content. |
© 2025 by the authors. Licensee MDPI, Basel, Switzerland. This article is an open access article distributed under the terms and conditions of the Creative Commons Attribution (CC BY) license (http://creativecommons.org/licenses/by/4.0/).
Copyright: This open access article is published under a Creative Commons CC BY 4.0 license, which permit the free download, distribution, and reuse, provided that the author and preprint are cited in any reuse.


