Submitted:
27 July 2025
Posted:
28 July 2025
You are already at the latest version
Abstract
Platinum-coated polystyrene (PT-PS) rough colloids were employed as catalysts to degrade methylene blue (MB), a representative organic pollutant, at the air-water interface. The particles were synthesized and examined using electron and light microscopy together with complementary analytical techniques to verify their morphology and surface features. Degradation tests were carried out at the air–water interface using an interface-trapping configuration under controlled circulation. At 50 RPM (Reynolds number of 1686) and a particle packing fraction of 0.8, MB was fully degraded within 30 minutes, while the same treatment in bulk solution required 75 minutes. The reaction followed the Langmuir–Hinshelwood model with a rate constant of 0.018 min$^{-1}$. Kinetic predictions were evaluated using an Artificial Neural Network (ANN) model, giving a root mean square error (RMSE) of 5.5 and a correlation coefficient (R$^{2}$) of 0.9656. The approach allows rapid MB degradation while enabling catalyst recovery and low reagent consumption, offering a practical route for wastewater treatment.
Keywords:
Methylene blue
; Pt Nanoparticles
; air-water interface
; wastewater
; ANN Modeling
; removal efficiency
1. Introduction
The escalating demand for textiles, pharmaceuticals, and other industrial products has led to a substantial increase in the production and usage of synthetic dyes. While these vibrant colorants enhance the aesthetic appeal of various materials, their indiscriminate discharge into natural ecosystems poses significant environmental and health concerns. Methylene blue (MB), a common azo-based dye pollutant, is soluble in water and is often used in the textile industry for dyeing garments, resulting in the generation of polluted effluents containing both organic and inorganic dyes. Despite its advantages, MB’s water solubility has adverse effects on both humans and the environment [1,2,3]. Addressing this formidable challenge requires innovative and sustainable approaches to efficiently remove dye contaminants from aqueous environments. Nanotechnology has recently experienced substantial growth due to advancements in various fields such as medicine [4], catalysis [5,6], sensing [7,8], photonics [9,10,11], and wastewater treatment [12,13,14,15]. In this context, wet-chemical methods garnered high interest due to their bulk production capacity and tunability in altering nanostructures.
Thus far, several advanced oxidation processes (AOPs) such as photolysis [16,17], ozonation [18], sonochemical [19,20], and heterogeneous Fenton-like catalyst-assisted [13,21] have been effectively used to eliminate the traces of various chemical residues or dye molecules over traditional methods. Despite the advancements in the field of water treatment, the AOPs possess shortcomings such as high energy demand (sono), strict pH range (Fenton), high H2O2 consumption (Fenton/photo-Fenton), and cost of implementation. In the early 20th century, scientists began exploring platinum’s potential as a catalyst for various chemical reactions. This led to its incorporation into catalytic converters for platinum ability to catalyze oxidation reactions, a crucial process in water treatment. Platinum nanoparticles, in particular, exhibit exceptional catalytic activity, enabling them to efficiently oxidize organic pollutants and break down complex molecules into harmless substances [22,23,24,25,26,27].
Recently, our group reported a simple and straightforward method to remove MB and tetracycline using platinum-decorated rough particles in the bulk [13]. The method employed a wet-chemical approach and offers a single-step route to synthesize various sizes of rough particles of polystyrene (PS) surface engineered with platinum nanoparticles. When exposed, these catalytic rough particles exhibit exemplary decomposing characteristics against hydrogen peroxide, which eventually helps generate radicals to remove desired target pollutants from the wastewater stream. This approach is widely employed in various fields, including environmental remediation [28,29,30], industrial processes [31], and pharmaceutical synthesis [32], to mitigate the adverse effects of pollutants or to enhance the efficiency of chemical reactions.
In the present study, we confined the application of the rough particles to the air-water interface by carefully controlling the precursor concentration to create a dense platinum shell over polystyrene particles. The as-synthesized nanoparticles and rough particles were analyzed using various techniques, including NTA, DLS, AFM, FESEM, and TEM. Controlled circulation at a programmed speed is introduced under a batch condition to improve the mass transfer characteristics. The combined application of rough particles at the air-water interface, aided by controlled circulation, enhances the physicochemical kinetics multi-fold. For instance, at the same concentration of catalyst particles and hydrogen peroxide, the decomposition time achieved by the rough particles at the interface and in the bulk are approximately 30 and 75 min, respectively.
The enhanced physicochemical kinetics achieved by the synergistic action of rough particles at the air-water interface and controlled circulation highlight the need for advanced predictive modelling techniques to enhance such processes. Because of the complex interaction among several variables in catalytic reactions and mass transfer, traditional modelling techniques may not be sufficient in the representation of the dynamics of the system. In this context, a variety of soft computing techniques, including artificial neural networks (ANNs), fuzzy and neuro-fuzzy intelligent systems, and support vector machines, have been widely utilized to model experimental datasets [33,34,35]. Among these, ANNs have emerged as the most widely utilized computational framework due to their ability to emulate the structure and function of the biological nervous system through numerous interconnected processing units. ANNs are renowned for their capability to perform high-speed parallel information processing, exhibit fault tolerance, and conduct global mapping [36]. In the context of performance prediction and process optimization, predictive modelling using artificial intelligence has become a pivotal area of research, especially for case-specific experimental investigations. However, despite the extensive application of AI tools in various domains, to the best of our knowledge, the use of AI techniques for predictive modelling of MB removal in water treatment processes has yet to be thoroughly explored.
The proposed strategy creates high-surface-area platforms conducive to catalytic reactions by employing rough particles at the air-water interface. This strategic positioning facilitates efficient mass transfer and maximizes the interaction between catalyst and target molecules, thereby accelerating the degradation of MB contaminants. The catalytic degradation of MB at the air-water interface represents a paradigm shift in environmental remediation. There are various advanced oxidation processes that show very good performance in wastewater treatment. However, these AOPs possess shortcomings such as high energy demand, strict pH range, high consumption, and cost of implementation [13]. The proposed process, platinum-decorated PS rough colloids at the air-water interface method provides significant advantages through integration of air-water interface such as enhanced surface catalysis, sustainability, and operational feasibility. It presents a novel and scalable approach that addresses some of the key limitations of existing MB removal techniques, making it a valuable advancement in the field of wastewater treatment research.
2. Experimental
2.1. Materials
We utilized grade amidine-functionalized polystyrene (PS) latex particles obtained from Thermo Fisher Scientific, India, to prepare catalytically enabled rough particles for treating wastewater containing MB, model pollutant. The particle size specified by the manufacturer is 1.0 m. However, the particle size determined through image analysis based on scanning electron microscopy (SEM) was 1.0 ± 0.1 m. An electrophoretic study was conducted to determine the particle’s Zeta potential (). The potential of the PS particles in a 1 mM NaCl electrolyte medium was measured as 46 ± 3 mV. The Chloroplatinic acid hydrate, used as a precursor for nanoparticle synthesis and to deposit platinum (Pt) nanoparticles on the PS surface, was procured from Sigma-Aldrich Chemicals Pvt. Ltd., India. Sodium borohydride (), obtained from Sigma-Aldrich Chemicals Pvt. Ltd., was employed as a reducing agent. Hydrogen peroxide (30 w/v %), used in the decomposition reaction mixture to generate hydroxy radicals, was obtained from Thermo Fisher Scientific India, Pvt. Ltd. The model pollutant, MB, was procured from Sigma-Aldrich Chemicals Pvt. Ltd., India. All reagents received were of analytical grade and used without any further purification. All aqueous solutions experiments used deionized water from a Smart2PureTM water purification system (Manufacturer: Thermo Fisher Scientific, Model: Smart2Pure 12 UV/UF).
2.2. Methods
2.2.1. Synthesis of Pt Nanoparticles and Rough Particles
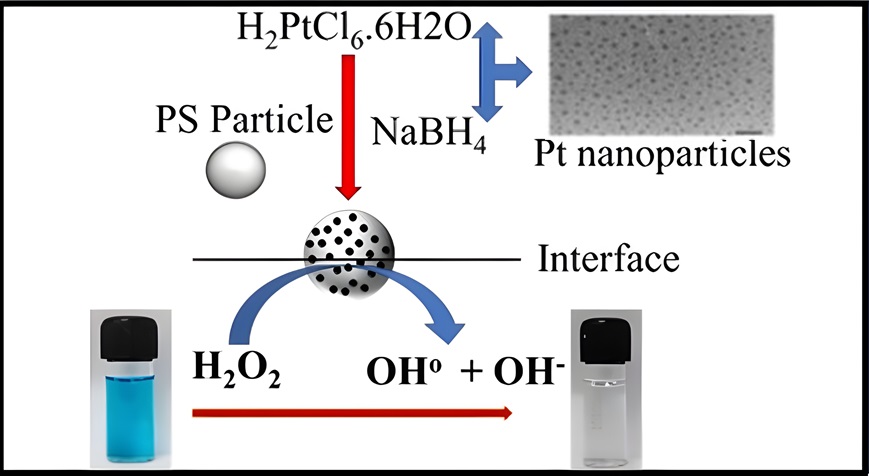
First, a stock solution of platinum precursor () was meticulously prepared in deionized (DI) water, maintaining a constant molarity of 10 mM. Subsequently, various molarities of 0.3, 0.5, 0.7, 1, and 1.3 mM solutions were prepared in different vials through dilution to determine the optimum one. A 10 mM concentration of sodium borohydride solution served as the reducing agent in the synthesis of platinum nanoparticles. A predetermined quantity of platinum precursor was combined with a tenfold excess volume of sodium borohydride solution in a designated beaker, ensuring thorough mixing at 140 rpm using a magnetic stirrer at room temperature. The mixture was left undisturbed for 4 h, during which time the transparent solution transitioned to a black hue, indicating completion of the reaction as shown in Figure 1A. Following the reaction period, the formed nanoparticles were separated via centrifugation at 9500 rpm for 10 minutes. Subsequently, they were washed multiple times with water to eliminate any residual intermediate complexes in the suspension. The method reported by our group earlier was employed to synthesize the rough particles using Pt nanoparticles at a suitable precursor concentration [13]. The synthesis of PS/Pt rough particles involves mixing a known concentration of platinum precursor (1 mM) with PS particles (0.5 mg/mL) using a magnetic stirrer for up to 30 minutes. A reducing agent, sodium borohydride, is added to the mixture, followed by a 30 minute equilibration period. The chemical reduction reaction is initiated by adding 5 mL of 10 mM sodium borohydride solution to the reaction mixture. To ensure maximum conversion, a ten-fold excess of sodium borohydride is used. After several centrifugation and washing cycles, the modified PS particles are subsequently separated from the supernatant.
2.2.2. Discoloration of MB Using Rough Particles at Air-Water Interface
A batch reactor is integrated with multiple input and output connections linked to the circulation pump, allowing for interchangeable assemblies using polymer tubes. The rough particles are deposited at the interface between air and the aqueous pollutant mixture. A peristaltic pump serving as the circulation pump for transporting the pollutant from top to bottom was employed to enhance the driving force, i.e., the concentration gradient, within the system, as shown in the schematic (Please refer to Figure 1B). The inset shown in Figure 1B corresponds to the microscopic images showing the monolayer assembly of rough particles at the air-water interface. In this way, the radicals generated by the decomposition of hydrogen peroxide near the interface are fed at the bottom through circulation so that the bulk pollutant starts to degrade continuously. On the other hand, the reactant molecules mixed with the radicals diffuse continuously from bottom to top due to displacement caused by circulation. As the recycle creates a marked difference in the mixing, one can observe the concentration gradients with an action of the peristaltic pump. Flow circulation is characterized by the Reynolds number, which can be calculated from the pump’s RPM using the following equation [37]:
where, is angular velocity (rad/s), pump rotation (RPM), v is linear velocity (m/s), r is radius of the particle (m), water density () (kg/), Water viscosity () (Pa.s), l is length of the pipe (m).
When circulation is maintained, forced diffusion occurs, where pollutants are actively transported throughout the treatment system due to mechanical agitation. This rapid movement enhances contact between pollutants and treatment agents, accelerating their breakdown. However, when circulation is halted, forced diffusion ceases, and molecular diffusion becomes the dominant mechanism. Molecular diffusion is a slower process driven by the random movement of molecules. Pollutants must rely on this slower motion to encounter treatment agents, leading to a delay in their degradation.
2.2.3. ANN Methodology
In studying MB removal efficiency in water treatment processes, we employed Artificial Neural Networks (ANN) to address the inherent complexity that classical regression methods cannot adequately handle. ANN, a robust computational tool, is well-suited for analyzing intricate systems that defy description by conventional mathematical equations [38]. While non-linear models are frequently employed to optimize process parameters, ANN offers enhanced sensitivity in identifying the relationships between variables [39]. The artificial neural network (ANN) model comprises an input, hidden, and output layer, constituting a multilayer feedforward network architecture trained using the backpropagation algorithm [38]. The architecture consists of four input neurons representing time, stirring speed, MB concentration, hydrogen peroxide, and a single output neuron for predicting removal efficiency. We optimized the hidden layer by varying the number of neurons from 1 to 20 and tested several activation functions, including purelin, logsig, tansig, and ReLU. Given the limited dataset, the model architecture was configured with a single hidden layer and input and output layers. Additionally, optimizing the number of neurons in the hidden layer was crucial. This optimization was accomplished by systematically varying the neuron count within a predefined range, guided by an extensive review of the relevant literature. The experimental dataset, comprising time and removal efficiency data, was standardized to ensure equal contribution from all features. The dataset was divided into training (80%), validation (10%), and testing (10%) subsets, with early stopping employed to prevent overfitting. The early stopping mechanism monitored validation loss and restored the best model weights after a specified patience period. We evaluated the ANN with different numbers of neurons in the hidden layer to identify the optimal configuration based on Root Mean Square Error (RMSE). The best model configuration was selected based on the lowest RMSE. The Adam optimizer’s learning rate was set to 0.001 during training to ensure effective convergence. Model performance was evaluated using RMSE, Mean Squared Error (MSE), and R-squared (R2) values. The neuron function in the ANN model is defined as follows [40]:
where w represents the weights, b the biases, x the inputs, and the activation function. The weights were adjusted iteratively using the backpropagation algorithm to minimize the error E, calculated by:
It is worth noting that the ANN modelling was performed using Python with the TensorFlow and Keras libraries. The resulting plots visualize the model’s performance across different configurations, offering valuable insights into optimizing water treatment processes.
2.2.4. Characterization
The Zeta potential of bare polystyrene (PS) and rough PS particles was measured using a Zetasizer obtained from Malvern Panalytical (Model: ZSP), employing the electrophoretic light scattering (ELS) technique. The average diameter of 1.0 µm PS particles was determined using a Field-emission scanning electron microscope (FESEM) from FEI, USA (Model: Inspect F). Additionally, the hydrodynamic diameter of the 1 m PS particles and platinum (Pt) particles was determined using a dynamic light scattering technique (Make: Malvern Panalytical, Model: ZSP) and Nanoparticle Tracking Analysis (NTA), Make: Malvern Panalytical, Model: NS300. To confirm the distribution and size of the nanoparticles on the as-synthesized rough particles engineered with Pt, the electron mapping analysis using a scanning electron microscope from JEOL Ltd., Japan (Model: JSM-6610) and atomic force microscopy (AFM), Bruker Corporation, Germany; Model: Multimode-8 AFM were employed, respectively. The surface morphology of PS rough particles was captured using an inverted microscope (Make: Leica microsystems, Model: DM IL LED Fluo). X-ray diffraction (XRD) (make: Bruker Corporation, Germany, model: Bruker D8 Venture) was employed to investigate the structural properties of both polystyrene (PS) particles and platinum-coated PS rough particles in their original synthesized form. Furthermore, the kinetics study of the chemical decomposition of MB was investigated by monitoring concentration as a function of time using a UV–VIS spectrophotometer obtained from Thermo Fisher Scientific, India (model: GENESYS 10S UV-Vis).
3. Results and Discussion
3.1. Characterization of Pt and Rough Particles
The hydrodynamic diameter of the synthesized Pt nanoparticles was measured using DLS and NTA at various precursor concentrations by dispersing them in water at appropriate amounts (0.01 w/v %) to prevent aggregation in the suspension. The particles were suspended in a 1 mM NaCl solution for zeta potential measurements. It was observed that increasing the precursor concentration led to the formation of smaller nanoparticles, as illustrated in Figure 2. Specifically, nanoparticles with a size of 150 nm were formed at a precursor concentration of 1 mM. However, further increases in concentration resulted in larger nanoparticle sizes, likely due to particle aggregation, as detected using NTA. Results obtained from DLS also exhibited a similar trend, although the measured sizes were slightly higher. DLS data indicated that the particle size remained relatively constant after reaching a precursor concentration of 0.7 mM. Subsequent increases in precursor concentration did not significantly affect the particle size. As previously reported, these findings align well with the mean aggregate size deduced from DLS [41]. The tendency of metallic nanoparticles to aggregate stems from their surface properties, characterized by strong van der Waals force. Atomic Force Microscopy (AFM) and Transmission Electron Microscopy (TEM) were also employed to study the nucleating particle size or the monomeric unit of Pt nanoparticles, which are the building blocks of nanoparticle aggregates. Atomic Force Microscopy (AFM) and Transmission Electron Microscopy (TEM) were used to analyze the nucleating particle size or monomeric unit of Pt nanoparticles, which are the building blocks of nanoparticle aggregates. The particles were spread on a silicon wafer using the drop-casting technique. A 0.01 w/v % concentration of particles diluted in DI water was used for these analyses. The samples were dried in a forced air oven at 80°C overnight (12 hours).
Figure 3 A-D show the surface morphology and size distribution plot obtained from analyzing TEM and AFM images. These images reveal that the particles are poly-disperse, and the average size of the nanoparticles varies from 15 to 40 nm with a mean particle size of 25 nm. It is worth noting that 100 representative particles were considered for the image analysis using imageJ to obtain the size distribution plot. The analysis was performed by diluting and drop-casting on a suitable substrate, which resulted in well-dispersed nanoparticles upon visualization under AFM and TEM. The findings from Figure 2 and Figure 3 help us understand the variation in nanoparticle size depending on their state, whether well-dispersed (TEM/AFM) or aggregate (DLS/NTA). Figure 4 A-C presents the morphological characteristics of the PS/Pt particles alongside electron mapping, illustrating the uniform distribution of platinum nanoparticles on the PS surface at a reaction time of 4 h and precursor concentration of 1 mM. However, Figure 4D-F presents the Atomic Force Microscopy (AFM) analysis and corresponding line cut analyses, elucidating the deposition of platinum particles on the surface of polystyrene (PS). This examination offers a detailed insight into the topographical features, revealing distinct surface roughness patterns indicative of the formation of rough particles. The clarity of the images provides compelling evidence regarding the distribution and arrangement of platinum particles on the PS substrate, facilitating a comprehensive understanding of the deposition process. Observation of Figure 4 suggests that the rugged PS particles are adorned with Pt nanoparticles, akin to speckles adorning the skin with white spots. It can be inferred from Figure 3 and Figure 4 that the dispersed state of the nanoparticles resembles the islands-like morphology. Figure 5 depicts the X-ray diffraction (XRD) pattern acquired from the particles under examination. Analysis revealed that the characteristic peaks observed at 39.81∘ and 46.31∘ correspond to the crystallographic orientations of 110 and 200, respectively, confirming the presence of platinum nanoparticles. These observations corroborate with findings documented in prior literature, reinforcing the consistency and validity of the reported results [41]. It comes to say that the application of rough particles synthesized by immobilizing the Pt nanoparticles on the surface of PS particles offers enhanced exposure and catalytic efficiency compared to pristine Pt nanoparticles, owing to their reduced tendency to aggregate. Furthermore, the detailed XRD and FESEM analysis conducted after five degradation cycles confirm the structural and compositional integrity of the catalyst, showing no signs of degradation even after repeated use.
Using rough particles embedded with Pt nanoparticles has opened up new possibilities for treating wastewater containing specific pollutants. Building upon previous work by our group [13], which focused on the chemical decomposition of MB dye and tetracycline pharmaceutical residues, significant progress has been made in identifying optimal parameters such as contacting patterns, particle size, concentration, and reagent dosing volume. While the cost factor is mitigated by employing magnetically responsive rough particles (MR-RP), scaling up and recycling the particles after each use is a persistent challenge. Our current strategy aims to achieve a suitable trade-off between time and particle concentration at the air-water interface rather than in the bulk solution. This technique attempts to enhance particle use efficiency and enhance overall process sustainability.
3.2. Discoloration of MB at Air-Water Interface
First, we share an analogy proposed by our group regarding bulk phenomena before discussing the interface approach [13]. Figure 6 shows that increasing the concentration of rough particles in the bulk results in better removal efficiency and a shorter time to eradicate MB species. However, the bulk approach is costly due to the amount of catalyst particles involved. One can trap the particles at the air-water interface to degrade MB entirely instead of dispersing them in bulk. However, this may result in a longer decomposition time as it is inversely proportional to the concentration. Combining the interface approach with a circulation of the reaction mixture can significantly reduce the reaction time by many folds, the result of which is discussed in the subsequent sections. It can be noticed that the efficiency of the catalytic-assisted reaction considered for the analysis is more or less the same, although varying slightly between 91 and 96%.
The proposed method, illustrated in Figure 1B, capitalizes on rough particles deposited at the interface to initiate chemical decomposition directly at the contact point. Catalytic activity from hydrogen peroxide generates radicals, which help break down the target pollutants. This approach establishes two distinct zones: treated and untreated. Controlling the movement of the boundary between these zones is crucial for managing chemical reactions effectively. The peristaltic pump, depicted in Figure 1B, promotes mixing and re-circulation, swiftly transporting fresh pollutants from the bulk to depleted phases. Figure 1B shows the schematic of the dye degradation, with the inset displaying the particle arrangement at the A/W interface. For more information on the experimental setup, please refer to the details in the Experimental section. In short, we established an interface between air and water to degrade the industrial model dye, MB. The physicochemical kinetics of the rough particles were recorded by trapping them at the interface with a packing fraction ranging from 0.5 to 0.8. Thus, one can readily control the discoloration time scales by adjusting the packing fraction as the number of rough particles deposited at the interface varies for a reactor diameter of 0.063 m. In the water phase, there was a homogeneous solution of MB (total volume 200 mL, MB concentration 10 M or 3.2 PPM) in a reactor with circulation. The circulation of the pollutant is further facilitated using a peristaltic pump set at 50 rpm, circulating from top to bottom to ensure equilibrium and minimize concentration gradients within the water phase. In this way, several studies were conducted by manipulating the circulation speed from 10 to 50 rpm at a 0.8 packing fraction to investigate its effect on degradation further.
3.3. The Effect of Circulation Speed on MB Degradation
The breakdown of MB relies on the catalytic reaction of at the particle interface, which accelerates pollutant degradation through rapid contact. It takes about 9 hours for MB to break down in still conditions (without circulation), as demonstrated by the reactor’s clear phase zone length over time (Please refer to Figure 7A). However, complete decomposition occurs within ≈ 30 minutes when circulation is activated and optimized. Figure 7B illustrates the effect of circulation on the formation of the concentration gradient during MB degradation. The circulation of the pollutant from top to bottom reduces the concentration gradient by continuously transporting OH− radicals to the bottom and enhancing the contact mixing between non-degraded MB molecules and the particle interface. This process increases the multi-fold contact time between rough particles and MB, replacing old fluid with fresh fluid via circulation. It is important to note that all air-water interface MB decomposition trials utilized 200 mL of pollutant (MB) at a concentration of 10 M and 5 vol% of per batch. It is also important to note that increased circulation speed reduces reaction time, breaks up the particle monolayer, or moves particles towards the wall. Therefore, an intermediate circulation speed is necessary for effective degradation, and circulation beyond 50 RPM is not preferable for the studies (Please refer to Figure 8A). Through optimization, we have determined that a circulation speed of 50 RPM is optimal for achieving complete MB degradation within a minimal time frame. At speed < 50 RPM, the circulation effectively prevents gradient formation while avoiding monolayer detachment.
3.4. Effect of Packing Fraction () on the MB Degradation
The packing fraction of particles at the interface plays a crucial role in the degradation of pollutants, as a greater surface area facilitates the rapid conversion of and decomposition of MB. We optimized the using different number densities of the rough particles ranging from a closely-packed arrangement to a loosely-packed arrangement while keeping the concentrations of hydrogen peroxide (5 w/v %) and pollutant (10 M) constant, along with an optimum circulation speed of 50 rpm (NRe=1686). This approach demonstrated the effect of at the interface on pollutant degradation. The close examination of Figure 8B suggests that the degradation time is inversely proportional to the , indicating that a decrease in the at the interface results in less surface area exposed to and slower decomposition, leading to a longer degradation time of the pollutant. Figure 9 demonstrates the representative microscopic images depicting the packing of particles at the A/W interface before and after degradation, clearly indicating the changes in the packing densities.
We conducted a separate study to determine the optimal conditions to minimize the packing losses while maximizing the decomposition of hydrogen peroxide (). It is important to note that the oxygen produced due to the decomposition of is released into the water phase as bubbles rise to the surface. The collapse of these bubbles at the interface signifies a substantial reduction in the packing density. To curb this issue and assess its impact on the catalytic concentration, the desired % volume of at the optimized condition of = 0.5% was used at the air-water interface. The representative microscopic images captured before and after the degradation experiments were utilized to deduce % change in packing densities during the pollutant degradation. The % change in packing densities can be defined as follows:
Where and refer to packing densities corresponding to initial and final configurations, respectively. The information about the was deduced using imageJ, an image processing tool.
Figure 10 illustrates the percentage losses in packing fraction concerning concentration. The packing losses remain minimal until reaching 1.5 vol% of . Beyond this concentration, there is an increase in losses within the system. However, employing this concentration would excessively prolong the degradation of pollutants. Nevertheless, at 3 vol% , the losses remain nominal (%) under optimized conditions. Therefore, one can utilize 3 vol% as the working concentration for pollutant degradation within the effective time interval.
4. Degradation Kinetics
The kinetics concerning the degradation of MB over time have been studied using a UV-visible spectrometer. The degradation mechanism of MB follows the pseudo-first-order Langmuir-Hinshelwood (LH) kinetics, as described by our group earlier [13]. The MB absorbance was observed at 664 nm (Please refer to Figure 11 for the details on the UV-vis characteristics of MB). Figure 12 A shows the MB decomposition over time under optimum conditions: 3% , a packing factor 0.5, and a circulation at 50 rpm. The system achieved complete pollutant degradation, with a concentration of ≈ 10 M in a 200 ml batch, within 140 min. Besides efficiency, determining the reaction order and rate constant provides The kinetics of heterogeneous catalytic processes that can be described using the Langmuir-Hinshelwood (LH) kinetics model, as shown in Equation 8 below [13],
Where r, , K, and C represent the reaction rate, the limiting rate constant of reaction at maximum coverage under the given experimental conditions, the equilibrium constant, and the concentration at any time t during degradation, respectively.
The literature has demonstrated that Equation 8 follows first-order kinetics, i.e. , by assuming KC1. Thus, when is plotted on the ordinate and time is plotted on the horizontal axis, the slope of the straight line corresponds to the product of and K. However, if the slope value found is , the assumption that KC becomes invalid, indicating that subsequent kinetics will be in zero order. Figure 12 B shows the decomposition kinetics of the MB as a function of time. As the Y regression on X yields a straight line, it can be asserted that the decomposition characteristics obey the first-order kinetics corresponding to the heterogeneous reactions catalyzed by the rough particles. The kinetics presented achieved a linear fit up to 110 min, i.e., removal efficiency = 86.4%, yielding the rate constant of 0.018 min−1 for the reaction promoted by 1m rough particles. These L-H kinetic studies agree with the MB degradation catalyzed by rough particles, as described by our group earlier [13]. Beyond 110 minutes, however, the kinetic profile observes a deviation from linearity. The observed deviation may result from several factors, including mass transfer limitations at lower dye concentrations and the gradual depletion of , which is the primary source of hydroxyl radicals in the system. As the concentration diminishes over time without replenishment, fewer reactive radicals are produced, reducing the oxidative capacity and slowing the reaction rate. Consequently, the degradation process slows down because it becomes limited by the availability of reactive species or the rate at which they reach the catalyst surface. These combined effects account for the observed slowdown in the degradation rate after 110 minutes.
5. ANN Modeling of MB Removal
The architecture of the ANN model used in this study is depicted in Figure 13A. This study focused on the impact of multiple independent variables on the removal efficiency of MB. Thus, the neural network’s input layer was designed with four neurons. As the objective of the neural network was to perform a regression task, the output layer comprised only one neuron representing the predicted removal efficiency. The number of neurons in the hidden layer varied from 1 to 20, and the resulting Root Mean Square Error (RMSE) values were recorded (Figure 13B). The optimal model for predicting MB removal was achieved with the minimum RMSE value of 0.5580, using 19 neurons in the hidden layer. This configuration was used for subsequent analyses. Furthermore, the performance indicator (RMSE) was computed for various activation functions, specifically purelin, logsig, tansig, and ReLU, as illustrated in Figure 13C. Among the evaluated activation functions, the ReLU function demonstrated the highest efficiency for the optimal neural network, with an RMSE value of 0.3161. Throughout the training process, the model with the highest R2 value and lowest RMSE value served as the primary criterion for determining the stopping point of the training. The ANN model’s performance was examined using metrics such as Mean Squared Error (MSE), RMSE, and R2 values. The optimized ANN model established a favourable correlation with the training data, as depicted in Figure 14A. It also demonstrated relatively good performance in validation and testing datasets, as shown in Figure 14B and Figure 14C, respectively. The strong correlation demonstrated in the data confirms the strong generalization capability of the ANN model, which effectively minimizes the risk of overfitting. The training process involved an early stopping mechanism to enhance further model robustness, which monitored validation loss to prevent overfitting and attain optimal convergence. Additionally, the dataset was randomly shuffled before splitting, and model training was repeated using multiple random seeds, all of which yielded consistent performance, confirming the model’s robustness. The model’s R2 value of 0.9656 across the entire dataset range verifies its success in accurately modelling the complex nonlinear interactions among the most significant input parameters, including MB concentration, hydrogen peroxide dose, and removal efficiency. Overall, the performance of the ANN model was satisfactory for the experimental dataset, with an R2 value of 0.9656 (Figure 14D). Additionally, the Mean Absolute Error (MAE) for the optimized ANN model was calculated to be 4.3, further validating its predictive accuracy. Considering that the MB removal efficiency ranges between 0% and 100%, this relatively low MAE indicates a high level of predictive accuracy and underscores the model’s capability to generalize across diverse experimental conditions reliably. To further validate the ANN model, we compared its predictive performance with the Langmuir-Hinshelwood (L-H) kinetic model traditionally used to describe heterogeneous catalytic reactions as illustrated in Figure 15. The comparison showed that while both models provided satisfactory results, the ANN model displayed greater flexibility in handling the system’s nonlinearities and incorporating multiple variables simultaneously. This capability allowed the ANN to outperform the L-H model regarding predictive accuracy, especially when dealing with a broader range of experimental conditions. The ANN model has proven effective in capturing the complexities of MB removal dynamics by demonstrating strong predictive capability across multiple datasets and conditions. Figure 14D compares the predicted removal efficiencies against the experimental values using the best-performing ANN model (optimal number of neurons and ReLU activation function). The scatter plot demonstrates a strong correlation between predicted and actual values, with points closely aligning along the diagonal line, indicating high model accuracy and generalization capability. Additionally, Figure 13D assesses the model’s performance, showing that the predicted outcomes of the ANN model closely matched the actual values, with a Root Mean Squared Errors (RMSE) value of 5.5. This result indicates that the ANN-based model can predict the removal efficiency of MB through the water treatment process.
Table 1 presents the performance of various catalysts in decontaminating wastewater containing MB, assessed using the catalyst-to-MB ratio metric ’M’. The table allows for assessing the materials’ effectiveness, with lower ’M’ values indicating greater catalyst performance. It is worth noting that, excluding rows 2 (M=33.3), 3 (M=33.3), and 11 (M=100), the remaining results generally show similar performance when compared to each other. Among the reported studies, Hsieh et al. [21] demonstrate the highest performance with ’M’ = 1.0. While slightly higher with ’M’ = 1.5, our method achieves a similar removal efficiency of approximately 86.4% within 110 minutes of reaction time, indicating comparable performance. These findings underscore the promising potential of our approach, particularly with rough particles, suggesting significant avenues for further enhancement. Unlike the work of Hsieh et al. [21], it is worth noting that our proposed method works at room temperature.
6. Future Scope and Limitations
The proposed method leverages the catalytic particles to deactivate the target pollutant present in the sub-phase. Hence, the novelty of the method lies in its ability to extend the application to the oil-water interface to perform the decontamination in superphase. For instance, it can effectively eliminate water-soluble and oil-soluble dyes such as MB and solvent blue 4 (1-Naphthalenemethanol) in a single step. Further, since the reactor is configured with re-circulation from top to bottom to improve mass transfer and chemical kinetics, the proposed setup can mimic the recycle reactor, wherein the product is fed back into the reactor. However, the difference, in this case, will be the direction of the reaction, which proceeds from the interface to bulk compared to the conventional reactors. The proposed method is not a good alternative if the catalytic-assisted reaction is carried out at the interface instead of bulk without circulation. Yet, with controlled circulation, it offers a suitable alternative to conventional methods. Even under optimum conditions, the performance of the interfacial recycle reactor outnumbers the bulk method slightly, i.e., discoloration time = 143 min, which is a significant advantage. On the contrary, it is possible to increase the catalytic loading in bulk depending on the initial concentration of the pollutant. In contrast, the proposed method is hindered by the limitation set by the interfacial area, which is a significant setback. Nonetheless, unlike conventional approaches, it confines rough particles to the interface, eliminating the need for additional steps like separation and reuse cycles.
7. Conclusion
The study outlines the parameter optimization for synthesizing platinum nanoparticles using various characterization techniques. The study successfully synthesized Pt/PS rough particles using a single-step approach under optimal conditions. Additionally, the study explores the potential of utilizing platinum-studded PS particles at the air-water interface. The effects of circulation and different packing arrangements of these studded particles were examined. The findings exhibit critical data on rough particle catalytic activity at the air-water interface for decontaminating wastewater with a target pollutant. This study elucidates the intricate relationships between pollutants and nanoparticles, enhancing understanding of their role in catalytic efficiency through meticulous analysis of such parameters as circulation velocity and packing structure. Interestingly, the rough particles deposited at the air-water interface achieve complete decomposition within approximately 30 minutes when the circulation is activated at a programmed speed of 50 RPM (NRe=1686). This response is very significant when compared to 9 hours under still conditions. Furthermore, the interface approach under optimum conditions provides an equal or slightly more improved performance than the bulk approach. The predictive performance of an artificial intelligence-based model employing an artificial neural network (ANN) approach was evaluated to validate the experimental findings on the removal efficiency of MB. The ANN model demonstrated exceptional predictive capability, achieving a low root mean squared error (RMSE) of 5.5 and a high coefficient of determination (R2) value of 0.9656, indicating a high degree of accuracy in forecasting the removal of MB. Thus, the proposed method promotes enhanced decontamination of the target pollutant within a cost-effective route, contributing to developing sustainable and environmentally friendly remediation technologies.
Acknowledgments
The authors greatly acknowledge using the TEM facility at SAIF, Punjab University, Chandigarh. We thank Mr Harsimranjit Singh and Mr Abhishek, CRF, IIT Ropar, for helping us with the AFM and FESEM imaging. MS thanks IIT Ropar for providing the necessary funding assistance through a seed grant (ISIRD phase II) to set up a laboratory. MS acknowledges the CRG grant (CRG/2022/005880) for funding assistance in upgrading a synthesis laboratory.
Data Availability Statement
The experimental results used for the analysis will be made available on a reasonable request basis.
Institutional Review Board Statement
Not applicable.
Conflicts of Interest
The authors have no relevant financial or non-financial interests to disclose.
References
- Shimizu, N.; Ogino, C.; Dadjour, M.F.; Murata, T. Sonocatalytic degradation of methylene blue with tio2 pellets in water. Ultrasonics sonochemistry 2007, 14, 184–190. [Google Scholar] [CrossRef] [PubMed]
- ElShafei, G.M.; Yehia, F.; Dimitry, O.; Badawi, A.; Eshaq, G. Ultrasonic assisted-fenton-like degradation of nitrobenzene at neutral ph using nanosized oxides of fe and cu. Ultrasonics sonochemistry 2014, 21, 1358–1365. [Google Scholar] [CrossRef]
- Setiawan, A.; Dianti, L.R.; Mayangsari, N.E.; Widiana, D.R.; Dermawan, D. Removal of methylene blue using heterogeneous fenton process with fe impregnated kepok banana (musa acuminate l.) peel activated carbon as catalyst. Inorganic Chemistry Communications 2023, 152, 110715. [Google Scholar] [CrossRef]
- Alivisatos, P. The use of nanocrystals in biological detection. Nature biotechnology 2004, 22, 47–52. [Google Scholar] [CrossRef]
- Wu, Y.; Wang, D.; Li, Y. Nanocrystals from solutions: catalysts. Chemical Society Reviews 2014, 43, 2112–2124. [Google Scholar] [CrossRef]
- Zhao, Z.; Chen, C.; Liu, Z.; Huang, J.; Wu, M.; Liu, H.; Li, Y.; Huang, Y. Pt-based nanocrystal for electrocatalytic oxygen reduction. Advanced Materials 2019, 31, 1808115. [Google Scholar] [CrossRef]
- Konstantatos, G.; Sargent, E.H. Nanostructured materials for photon detection. Nature nanotechnology 2010, 5, 391–400. [Google Scholar] [CrossRef]
- Mayer, K.M.; Hafner, J.H. Localized surface plasmon resonance sensors. Chemical reviews 2011, 111, 3828–3857. [Google Scholar] [CrossRef]
- Lal, S.; Link, S.; Halas, N.J. Nano-optics from sensing to waveguiding. Nature photonics 2007, 1, 641–648. [Google Scholar] [CrossRef]
- Koenderink, A.F.; Alu, A.; Polman, A. Nanophotonics: Shrinking light-based technology. Science 2015, 348, 516–521. [Google Scholar] [CrossRef] [PubMed]
- Quan, L.N.; Kang, J.; Ning, C.-Z.; Yang, P. Nanowires for photonics. Chemical reviews 2019, 119, 9153–9169. [Google Scholar] [CrossRef]
- El-Sheshtawy, H.S.; Shoueir, K.R.; El-Kemary, M.; et al. Activated h2o2 on ag/sio2–srwo4 surface for enhanced dark and visible-light removal of methylene blue and p-nitrophenol. Journal of Alloys and Compounds 2020, 842, 155848. [Google Scholar] [CrossRef]
- Khan, F.; Shekhar, C.; Mondal, T.; Sabapathy, M. Rapid removal of methylene blue and tetracycline by rough particles decorated with pt nanoparticles. Journal of Nanoparticle Research 2024, 26, 4. [Google Scholar] [CrossRef]
- García, A.; Delgado, L.; Torà, J.A.; Casals, E.; González, E.; Puntes, V.; Font, X.; Carrera, J.; Sánchez, A. Effect of cerium dioxide, titanium dioxide, silver, and gold nanoparticles on the activity of microbial communities intended in wastewater treatment. Journal of hazardous materials 2012, 199, 64–72. [Google Scholar] [CrossRef]
- Kaegi, R.; Voegelin, A.; Sinnet, B.; Zuleeg, S.; Hagendorfer, H.; Burkhardt, M.; Siegrist, H. Behavior of metallic silver nanoparticles in a pilot wastewater treatment plant. Environmental science & technology 2011, 45, 3902–3908. [Google Scholar]
- Peter, A.; Mihaly-Cozmuta, A.; Nicula, C.; Mihaly-Cozmuta, L.; Jastrzebska, A.; Olszyna, A.; Baia, L. Uv light-assisted degradation of methyl orange, methylene blue, phenol, salicylic acid, and rhodamine b: photolysis versus photocatalyis. Water, Air, & Soil Pollution 2017, 228, 1–12. [Google Scholar]
- Mohammed, H.A.; Khaleefa, S.A.; Basheer, M.I. Photolysis of methylene blue dye using an advanced oxidation process (ultraviolet light and hydrogen peroxide). Journal of Engineering and Sustainable Development 2021, 25, 59–67. [Google Scholar] [CrossRef]
- Ikhlaqa, A.; Javedb, F.; Niaza, A.; Munirc, H.M.S.; Qid, F. Combined uv catalytic ozonation process on iron loaded peanut shell ash for the removal of methylene blue from aqueous solution. Desalination and Water Treatment 2020, 200, 231–240. [Google Scholar] [CrossRef]
- Saleh, R.; Taufik, A. Degradation of methylene blue and congo-red dyes using fenton, photo-fenton, sono-fenton, and sonophoto-fenton methods in the presence of iron (ii, iii) oxide/zinc oxide/graphene (fe3o4/zno/graphene) composites. Separation and Purification Technology 2019, 210, 563–573. [Google Scholar] [CrossRef]
- Egbosiuba, T.C.; Abdulkareem, A.S.; Kovo, A.S.; Afolabi, E.A.; Tijani, J.O.; Auta, M.; Roos, W.D. Ultrasonic enhanced adsorption of methylene blue onto the optimized surface area of activated carbon: Adsorption isotherm, kinetics and thermodynamics. Chemical engineering research and design 2020, 153, 315–336. [Google Scholar] [CrossRef]
- Hsieh, S.; Lin, P.-Y. Fept nanoparticles as heterogeneous fenton-like catalysts for hydrogen peroxide decomposition and the decolorization of methylene blue. Journal of Nanoparticle Research 2012, 14, 1–10. [Google Scholar] [CrossRef]
- Wang, N.; Li, J.; Ye, L.; Li, X. Heterogeneous nanostructure anatase/rutile titania supported platinum nanoparticles for efficient photocatalytic degradation of methylene blue dyes. Sustainable Chemistry for the Environment 2024, 5, 100072. [Google Scholar] [CrossRef]
- Huang, H.J.; Wu, L.-Y.; Ko, T.-S.; Wu, C.-W.; Liu, C.-C.; Fan, J.-J.; Lee, P.-Y.; Lin, Y.-S. Effects of thermal treatment on sea-urchin-like platinum nanoparticlese. Applied Surface Science 2024, 657, 159799. [Google Scholar] [CrossRef]
- Chen, M.; Zhang, J.; Guo, P.; Zhai, J.; Liu, X.; Yu, D.; You, X.; Li, J. Pdptcu nanoflower mediated photothermal enhanced fenton catalysis for recyclable degradation of methylene blue. Inorganic Chemistry Communications 2024, 160, 111841. [Google Scholar] [CrossRef]
- Faisal, M.; Ahmed, J.; Algethami, J.S.; Alkorbi, A.S.; Harraz, F.A. Facile synthesis of platinum/polypyrrole-carbon black/sns2 nanocomposite for efficient photocatalytic removal of gemifloxacin under visible light. Journal of Saudi Chemical Society 2024, 28, 101806. [Google Scholar] [CrossRef]
- Jameel, M.S.; Aziz, A.A.; Dheyab, M.A.; Mehrdel, B. Rapid methanol-assisted amalgamation of high purity platinum nanoparticles utilizing sonochemical strategy and investigation on its catalytic activity. Surfaces and Interfaces 2020, 21, 100785. [Google Scholar] [CrossRef]
- Wu, Y.; Tiri, R.N.E.; Bekmezci, M.; Altuner, E.E.; Aygun, A.; Mei, C.; Yuan, Y.; Xia, C.; Dragoi, E.-N.; Sen, F. Synthesis of novel activated carbon-supported trimetallic pt–ru–ni nanoparticles using wood chips as efficient catalysts for the hydrogen generation from nabh4 and enhanced photodegradation on methylene blue. International Journal of Hydrogen Energy 2023, 48, 21055–21065. [Google Scholar] [CrossRef]
- Peramune, D.; Manatunga, D.C.; Dassanayake, R.S.; Premalal, V.; Liyanage, R.N.; Gunathilake, C.; Abidi, N. Recent advances in biopolymer-based advanced oxidation processes for dye removal applications: A review. ENVIRONMENTAL RESEARCH 2022, 215, 114242. [Google Scholar] [CrossRef]
- Ren, Y.; Hersch, S.J.; He, X.; Zhou, R.; Dong, T.G.; Lu, Q. A lightweight, mechanically strong, and shapeable copper-benzenedicarboxylate/cellulose aerogel for dye degradation and antibacterial applications. Separation and Purification Technology 2022, 283, 120229. [Google Scholar] [CrossRef]
- Zhang, Y.; Zhao, S.; Mu, M.; Wang, L.; Fan, Y.; Liu, X. Eco-friendly ferrocene-functionalized chitosan aerogel for efficient dye degradation and phosphate adsorption from wastewater. Chemical engineering journal 2022, 439, 135605. [Google Scholar] [CrossRef]
- Giannakis, S.; Lin, K.-Y.A.; Ghanbari, F. A review of the recent advances on the treatment of industrial wastewaters by sulfate radical-based advanced oxidation processes (sr-aops). Chemical Engineering Journal 2021, 406, 127083. [Google Scholar] [CrossRef]
- Wang, Y.; Feng, C.; Li, Y.; Gao, J.; Yu, C.-P. Enhancement of emerging contaminants removal using fenton reaction driven by h2o2-producing microbial fuel cells. Chemical Engineering Journal 2017, 307, 679–686. [Google Scholar] [CrossRef]
- Azari, A.; Mahmoudian, M.H.; Niari, M.H.; Eş, I.; Dehganifard, E.; Kiani, A.; Javid, A.; Azari, H.; Fakhri, Y.; Khaneghah, A.M. Rapid and efficient ultrasonic assisted adsorption of diethyl phthalate onto feiife2iiio4@ go: Ann-ga and rsm-df modeling, isotherm, kinetic and mechanism study. Microchemical Journal 2019, 150, 104144. [Google Scholar] [CrossRef]
- Li, M.; Wei, D.; Liu, T.; Liu, Y.; Yan, L.; Wei, Q.; Du, B.; Xu, W. Edta functionalized magnetic biochar for pb (ii) removal: Adsorption performance, mechanism and svm model prediction. Separation and Purification Technology 2019, 227, 115696. [Google Scholar] [CrossRef]
- Trivedi, A.; Hait, S. Metal bioleaching from printed circuit boards by bio-fenton process: Optimization and prediction by response surface methodology and artificial intelligence models. Journal of Environmental Management 2023, 326, 116797. [Google Scholar] [CrossRef]
- Zhao, K.; Tian, Y.-j.; Deng, N.-y. Robust unsupervised and semi-supervised bounded ν- support vector machines. In Advances in Neural Networks–ISNN 2009: 6th International Symposium on Neural Networks, ISNN 2009 Wuhan, China, -29, 2009 Proceedings, Part II 6; Springer, 26 May 2009; pp. 312–321. [Google Scholar]
- Knudson, D. Linear and angular kinematics. In Fundamentals of biomechanics; Springer, 2021; pp. 79–100. [Google Scholar]
- Sahu, S.; Yadav, M.K.; Gupta, A.K.; Uddameri, V.; Toppo, A.N.; Maheedhar, B.; Ghosal, P.S. Modeling defluoridation of real-life groundwater by a green adsorbent aluminum/olivine composite: Isotherm, kinetics, thermodynamics and novel framework based on artificial neural network and support vector machine. Journal of Environmental Management 2022, 302, 113965. [Google Scholar] [CrossRef]
- Rathankumar, A.K.; Saikia, K.; Ribeiro, M.H.; Cheng, C.K.; Purushothaman, M.; Vaidyanathan, V.k. Application of statistical modeling for the production of highly pure rhamnolipids using magnetic biocatalysts: Evaluating its efficiency as a bioremediation agent. Journal of Hazardous Materials 2021, 412, 125323. [Google Scholar] [CrossRef]
- Raj, S.; Mahanty, B.; Hait, S. Coagulative removal of polystyrene microplastics from aqueous matrices using fecl3-chitosan system: Experimental and artificial neural network modeling. Journal of Hazardous Materials 2024, 468, 133818. [Google Scholar] [CrossRef] [PubMed]
- Hansen, H.E.; Seland, F.; Sunde, S.; Burheim, O.S.; Pollet, B.G. Two routes for sonochemical synthesis of platinum nanoparticles with narrow size distribution. Materials Advances 2021, 2, 1962–1971. [Google Scholar] [CrossRef]
- Kirchon, A.; Zhang, P.; Li, J.; Joseph, E.A.; Chen, W.; Zhou, H.-C. Effect of isomorphic metal substitution on the fenton and photo-fenton degradation of methylene blue using fe-based metal–organic frameworks. ACS applied materials & interfaces 2020, 12, 9292–9299. [Google Scholar]
- Lv, H.; Zhao, H.; Cao, T.; Qian, L.; Wang, Y.; Zhao, G. Efficient degradation of high concentration azo-dye wastewater by heterogeneous fenton process with iron-based metal-organic framework. Journal of Molecular Catalysis A: Chemical 2015, 400, 81–89. [Google Scholar] [CrossRef]
Figure 1.
Experimental insights: A) Synthesis of platinum and PS-Pt rough particles at constant mixing at 140 rpm and at room temperature for 4 hr and (B) schematic description showing the decomposition of MB using rough particles at air-water interface.
Figure 1.
Experimental insights: A) Synthesis of platinum and PS-Pt rough particles at constant mixing at 140 rpm and at room temperature for 4 hr and (B) schematic description showing the decomposition of MB using rough particles at air-water interface.
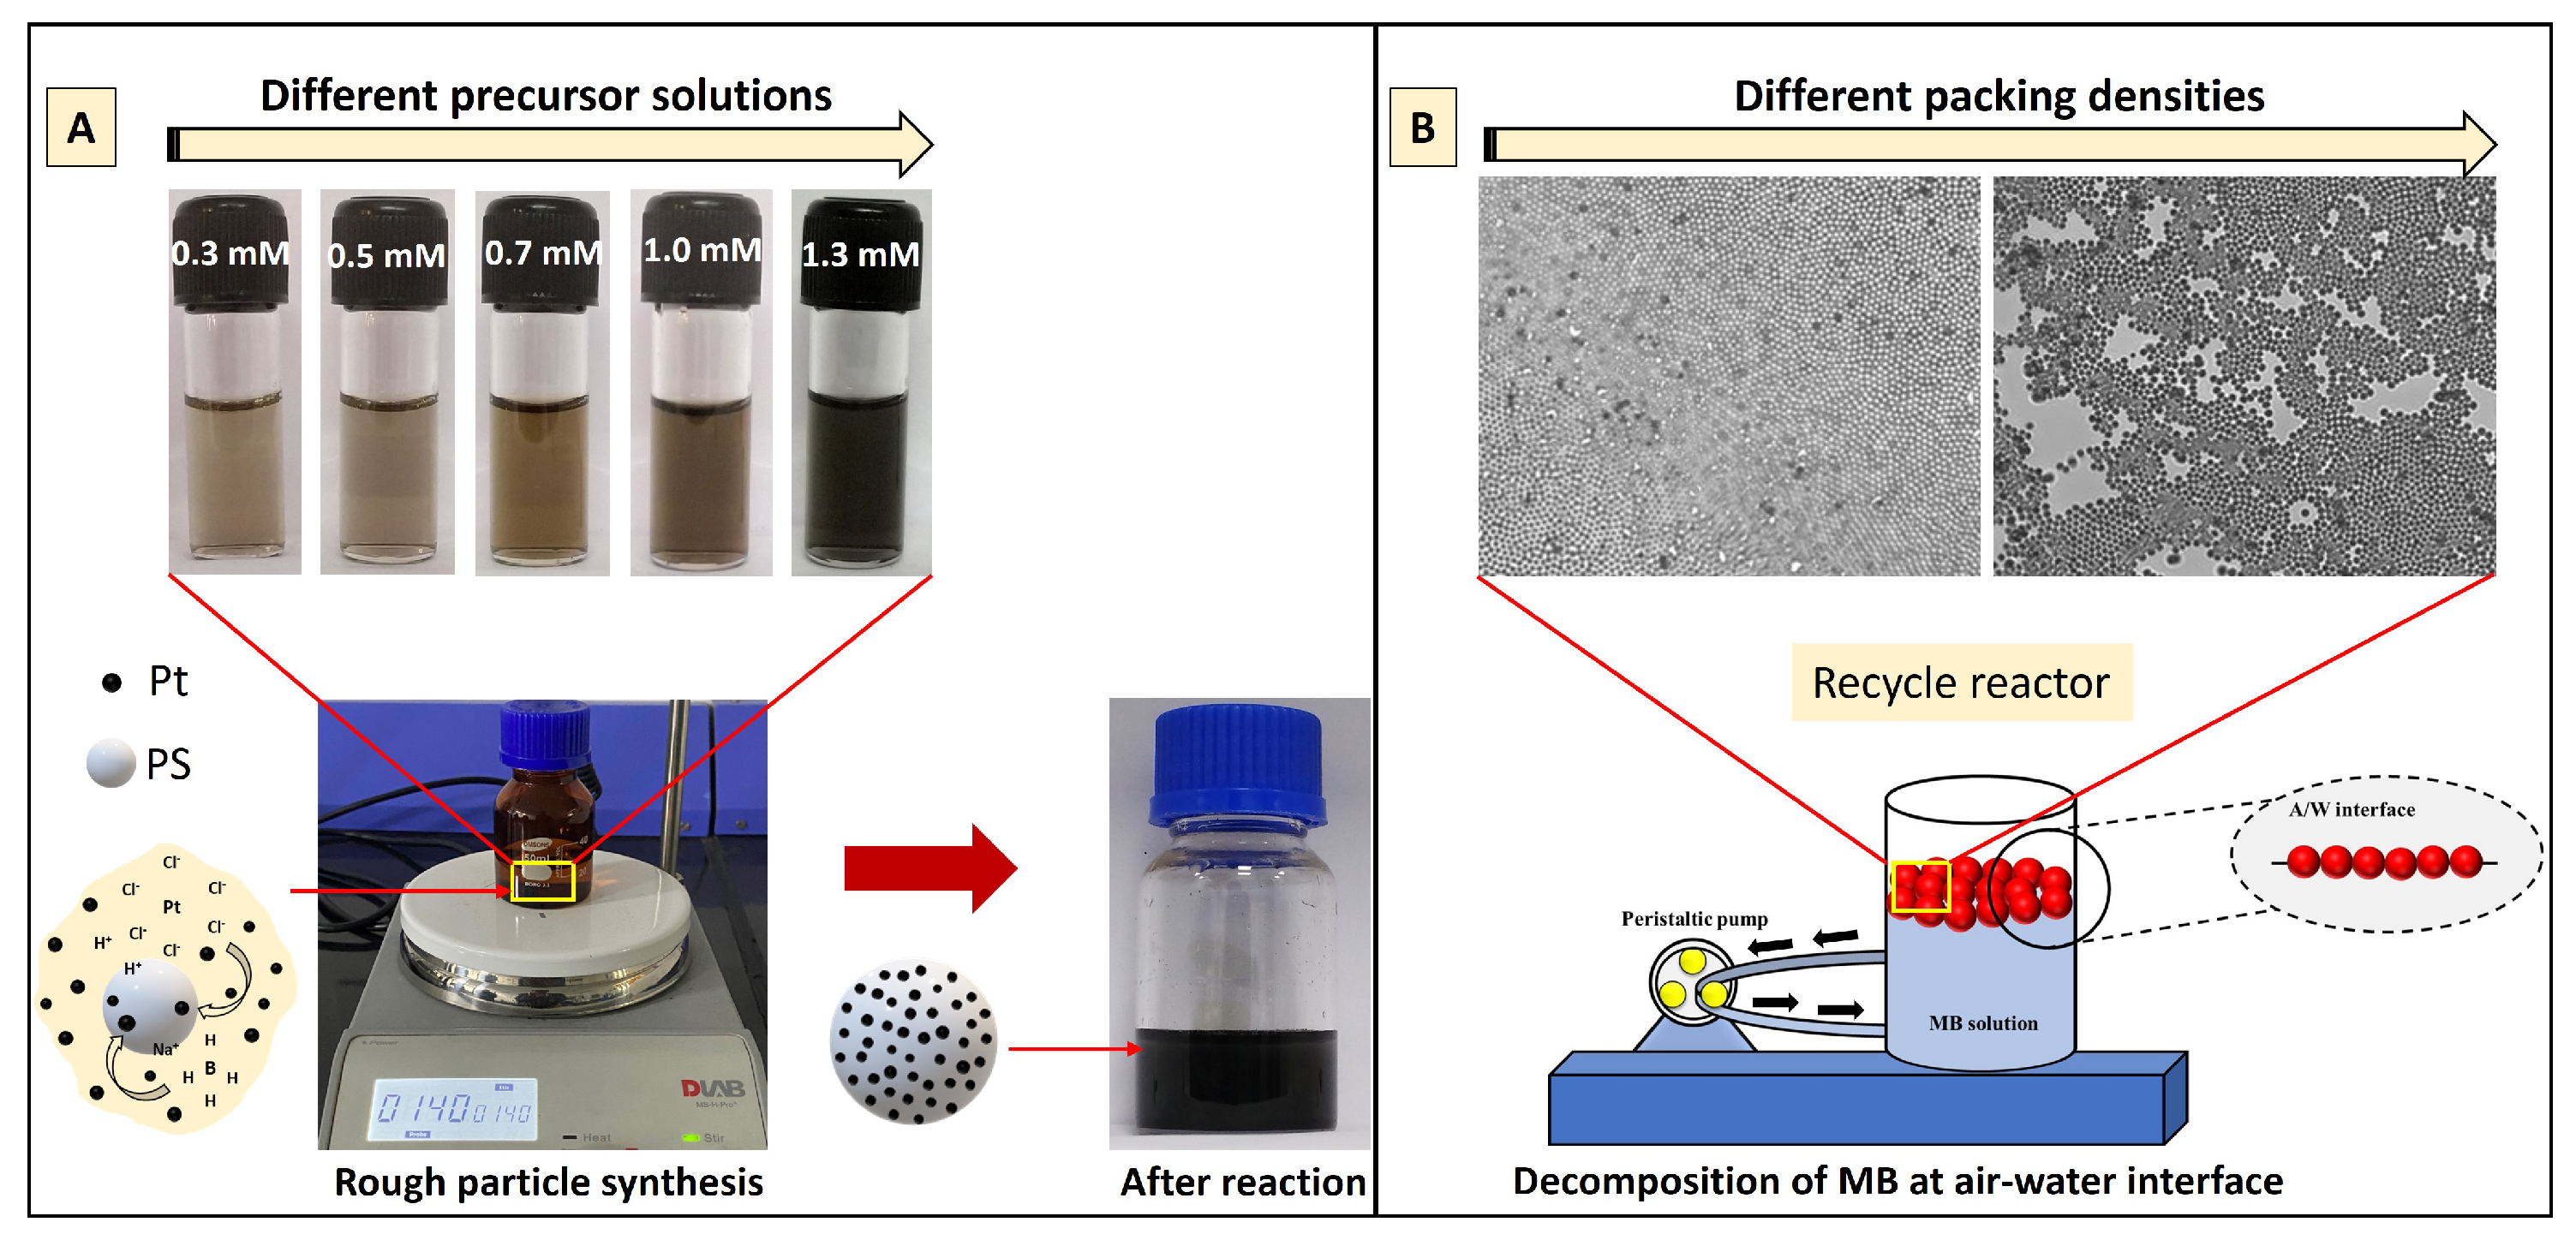
Figure 2.
Figure illustrates a comparison of the size difference in platinum nanoparticles with variations in platinum salt concentration.
Figure 2.
Figure illustrates a comparison of the size difference in platinum nanoparticles with variations in platinum salt concentration.
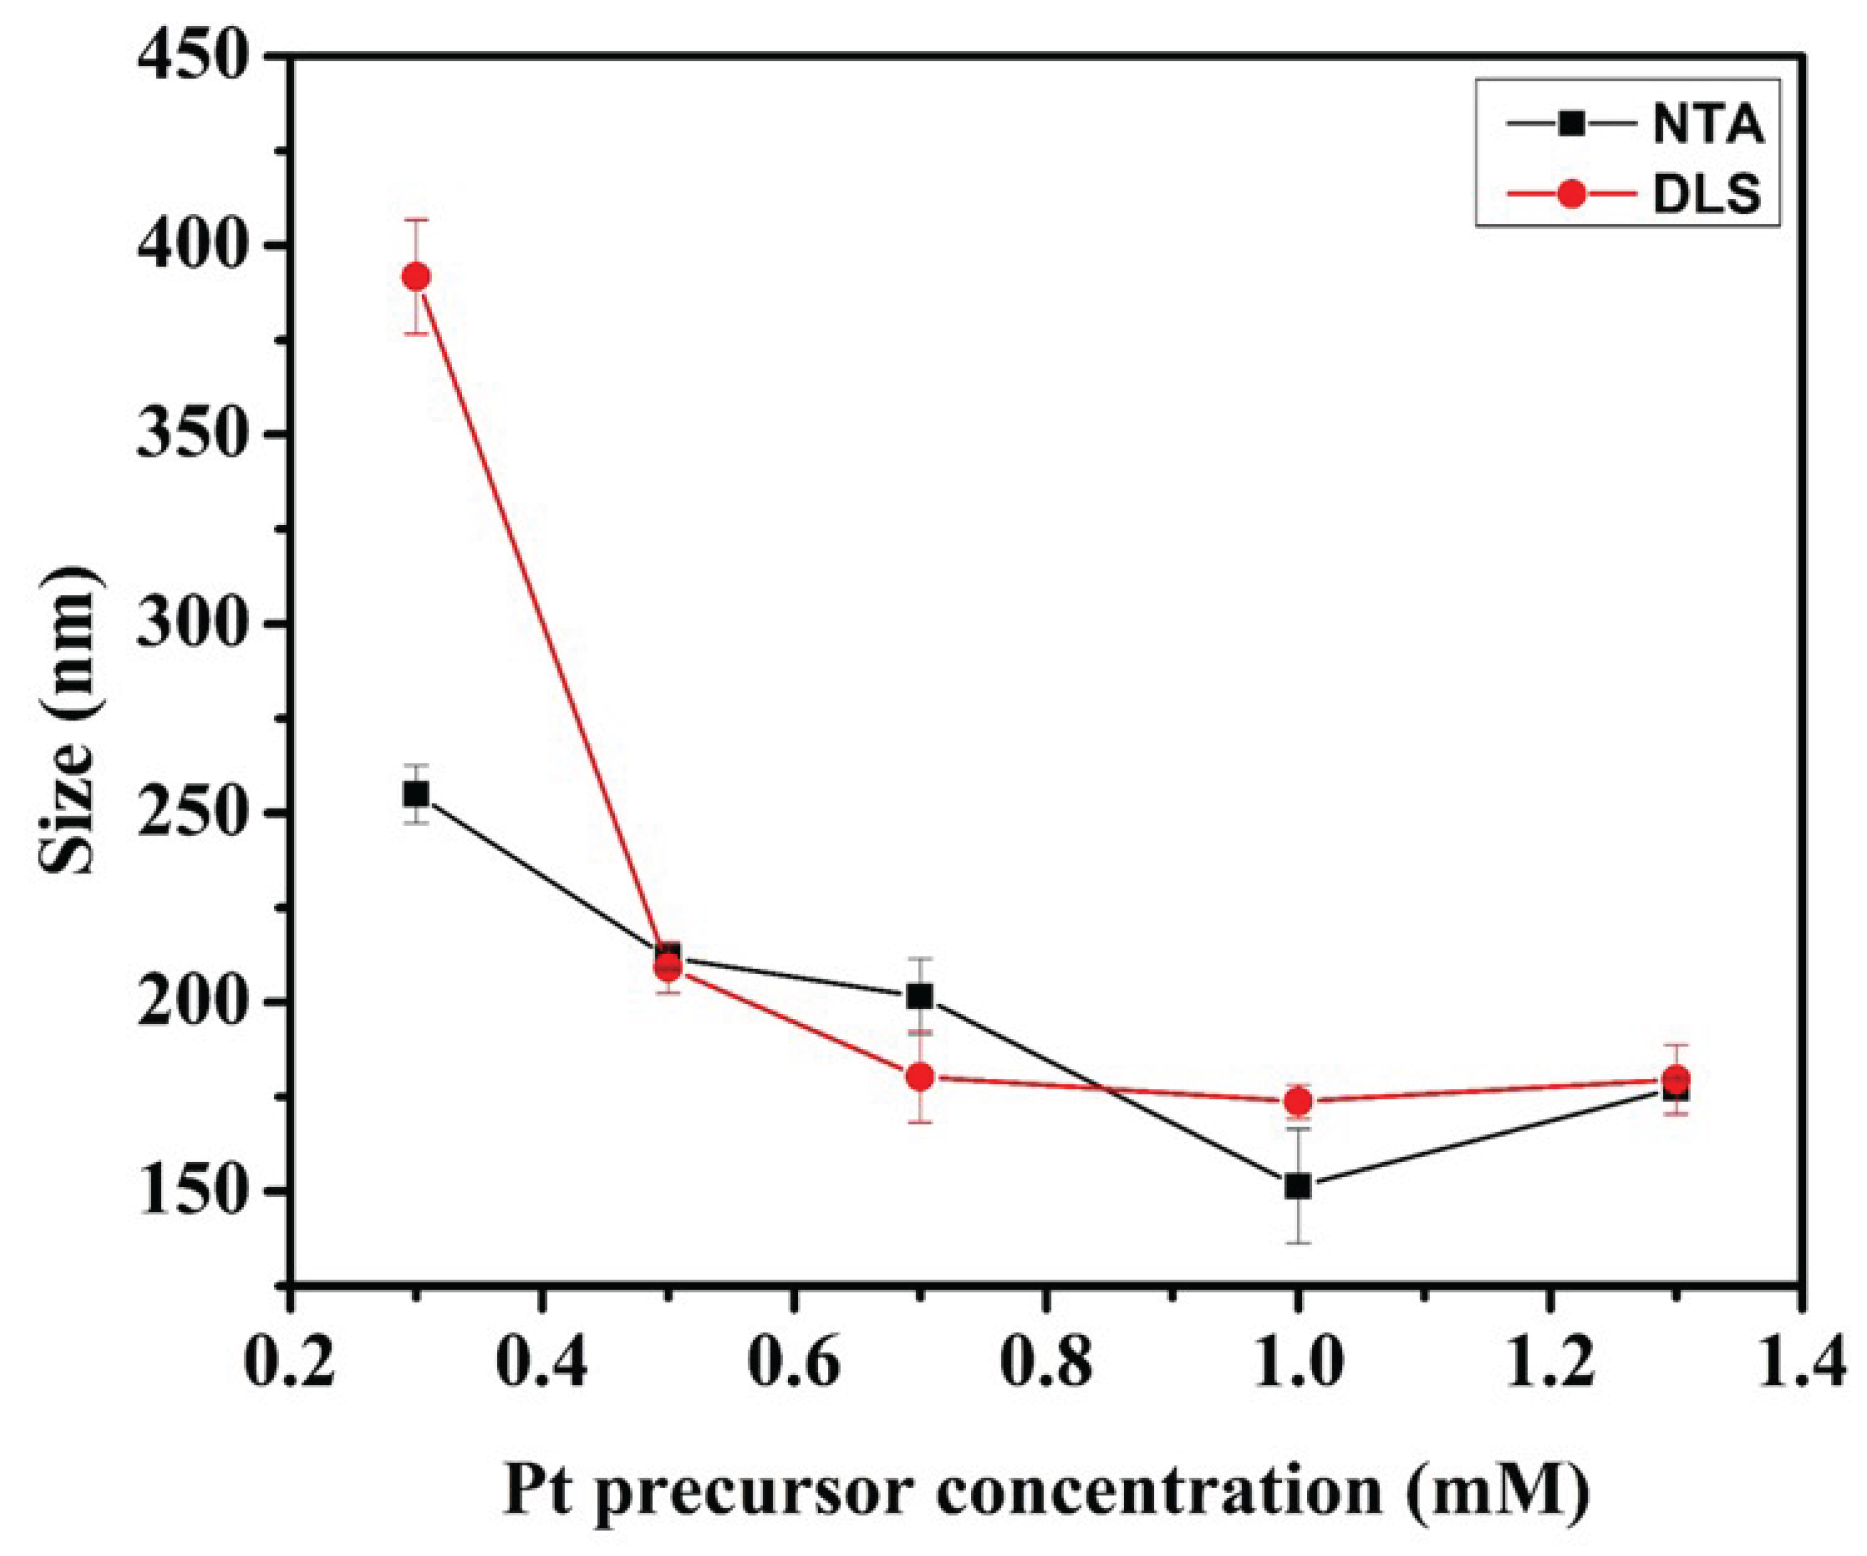
Figure 3.
Microscopic insights: (A) TEM morphology and (B) size distribution of the Pt-nanoparticles. The scale bar given in the TEM image corresponds to 200 nm. (C) AFM morphology and (D) size distribution of the Pt-nanoparticles. The scale bar given in the AFM image corresponds to 1000 nm.
Figure 3.
Microscopic insights: (A) TEM morphology and (B) size distribution of the Pt-nanoparticles. The scale bar given in the TEM image corresponds to 200 nm. (C) AFM morphology and (D) size distribution of the Pt-nanoparticles. The scale bar given in the AFM image corresponds to 1000 nm.
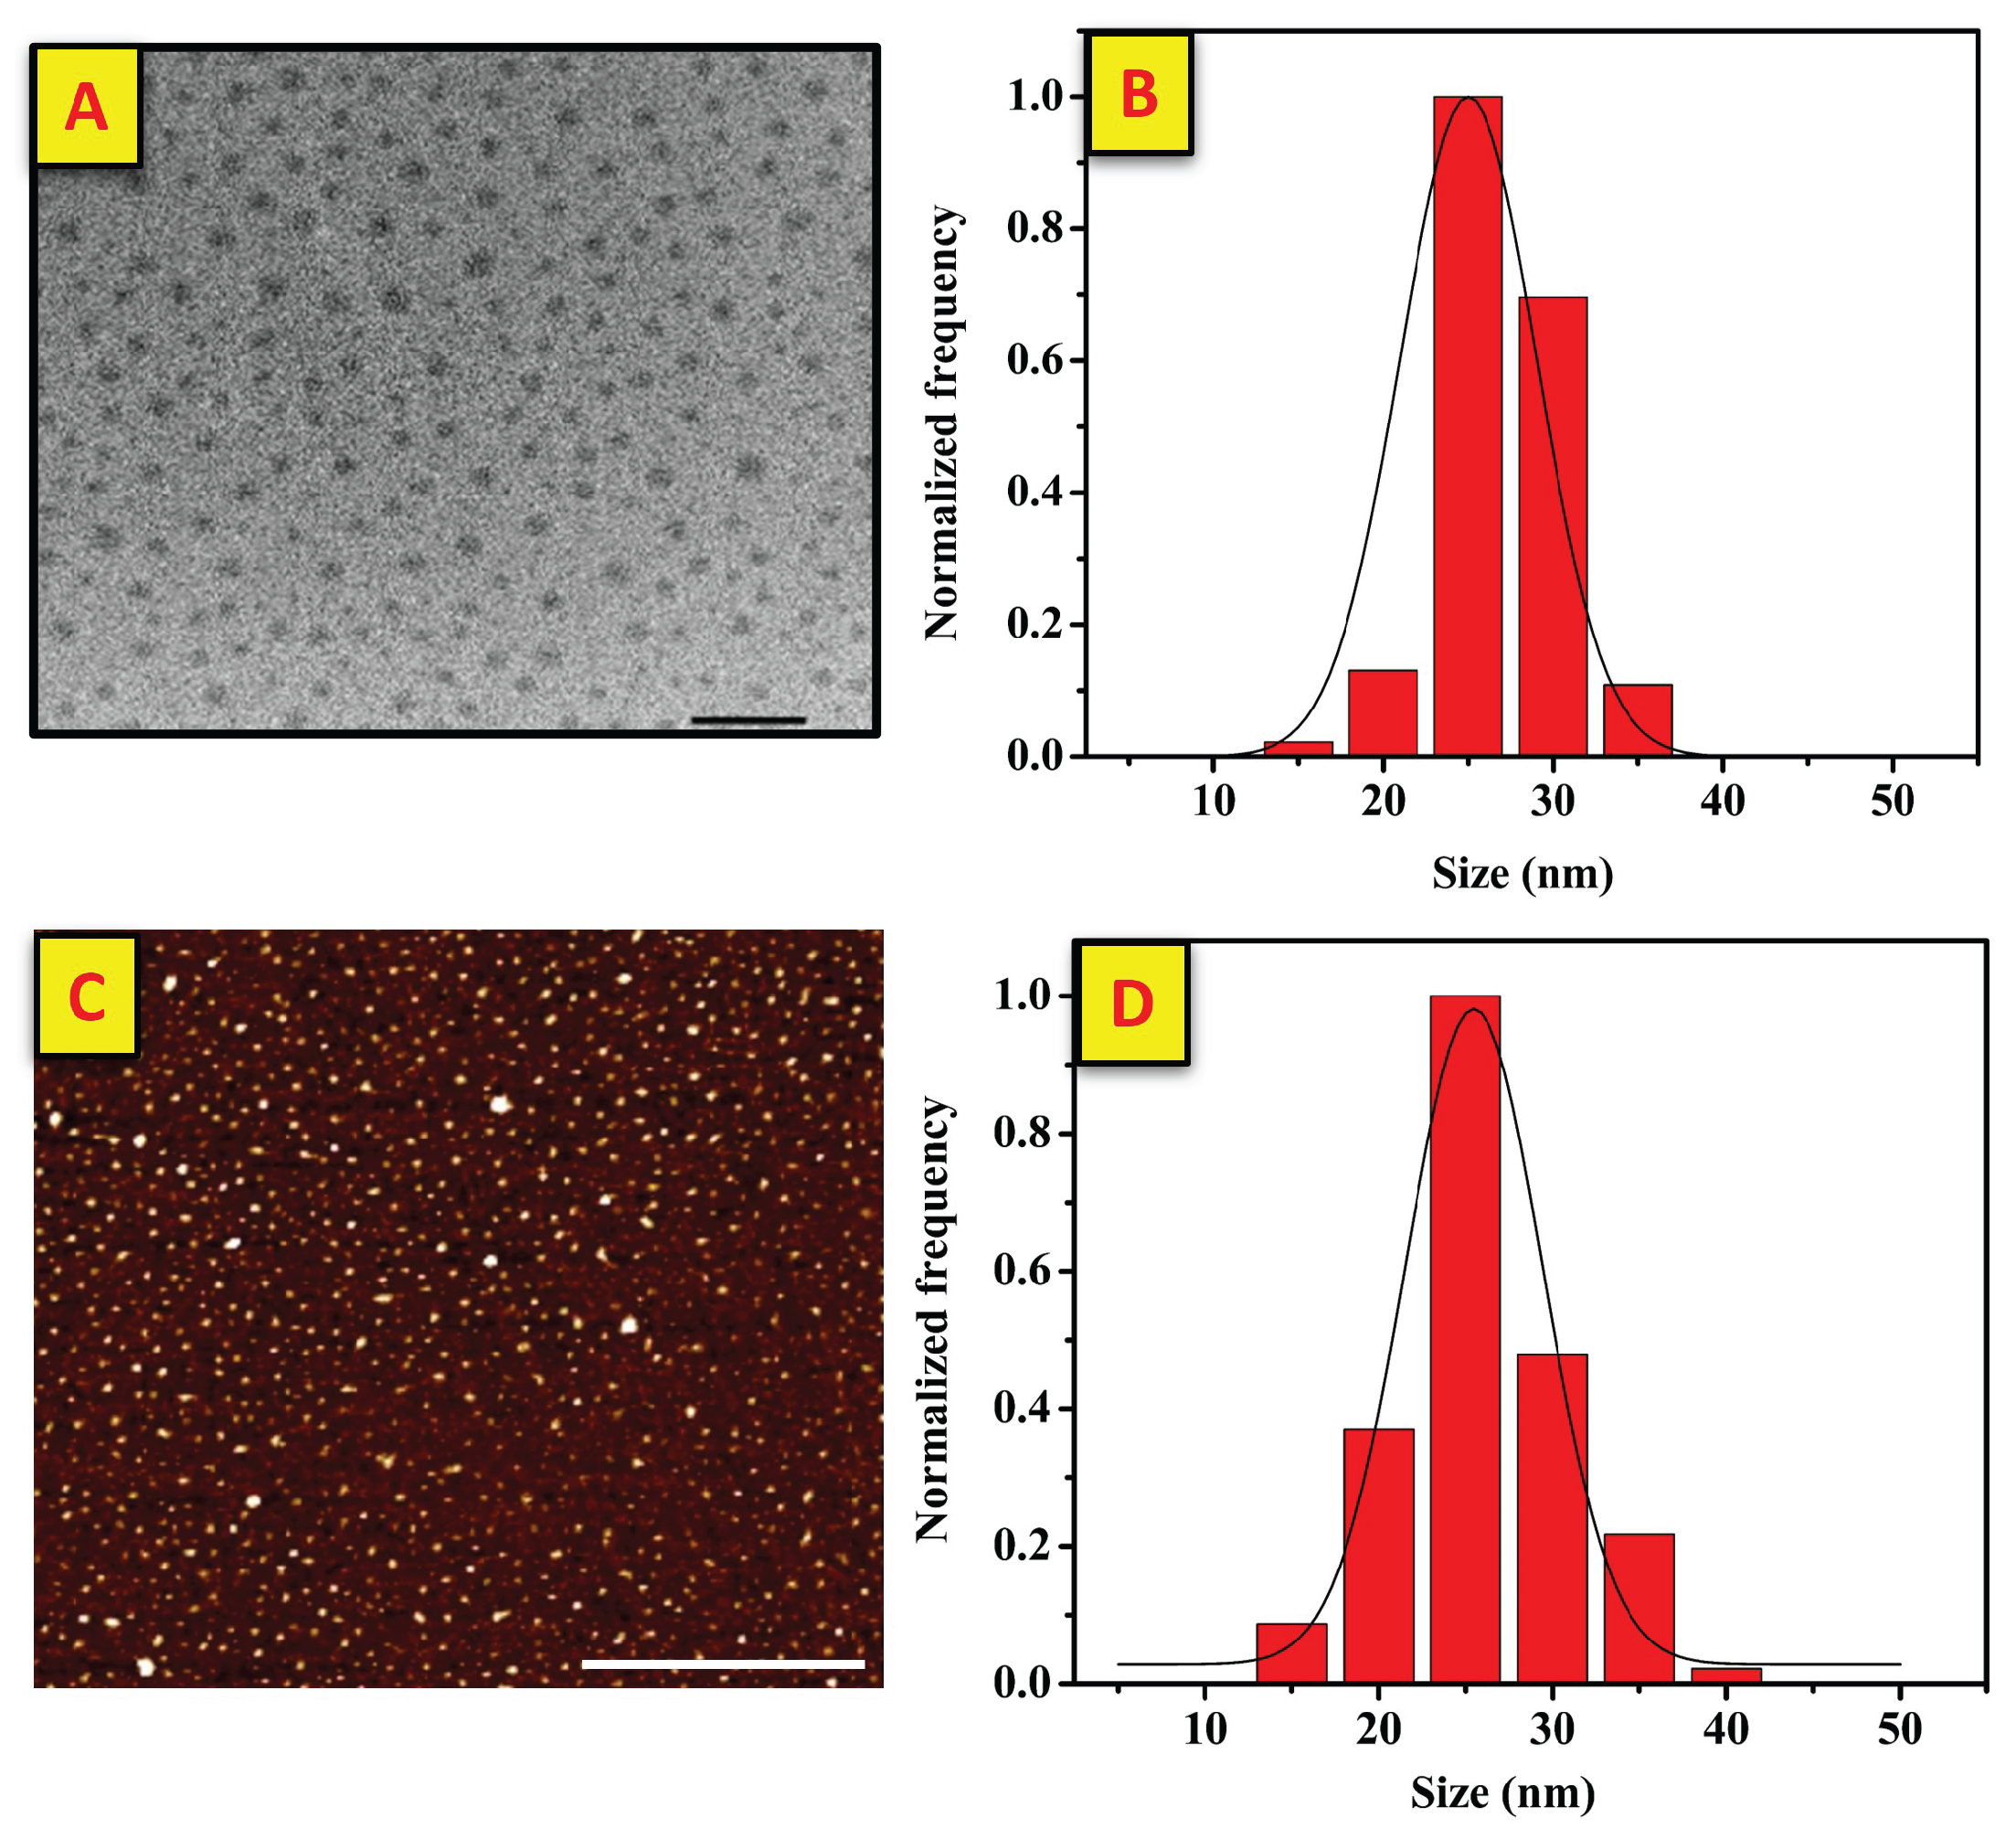
Figure 4.
The surface characterization of rough particles. A) FESEM, B) EDS analysis to confirm the presence of Pt, and C) electron mapping, depicting the islands-like morphology of platinum nanoparticles distributed uniformly on the surface of the micron-sized polystyrene particles. D-F) AFM images corresponding to the surface morphology (D) and the line cut analysis (E and F). The scale bar given in the FESEM image (A) corresponds to 100 nm.
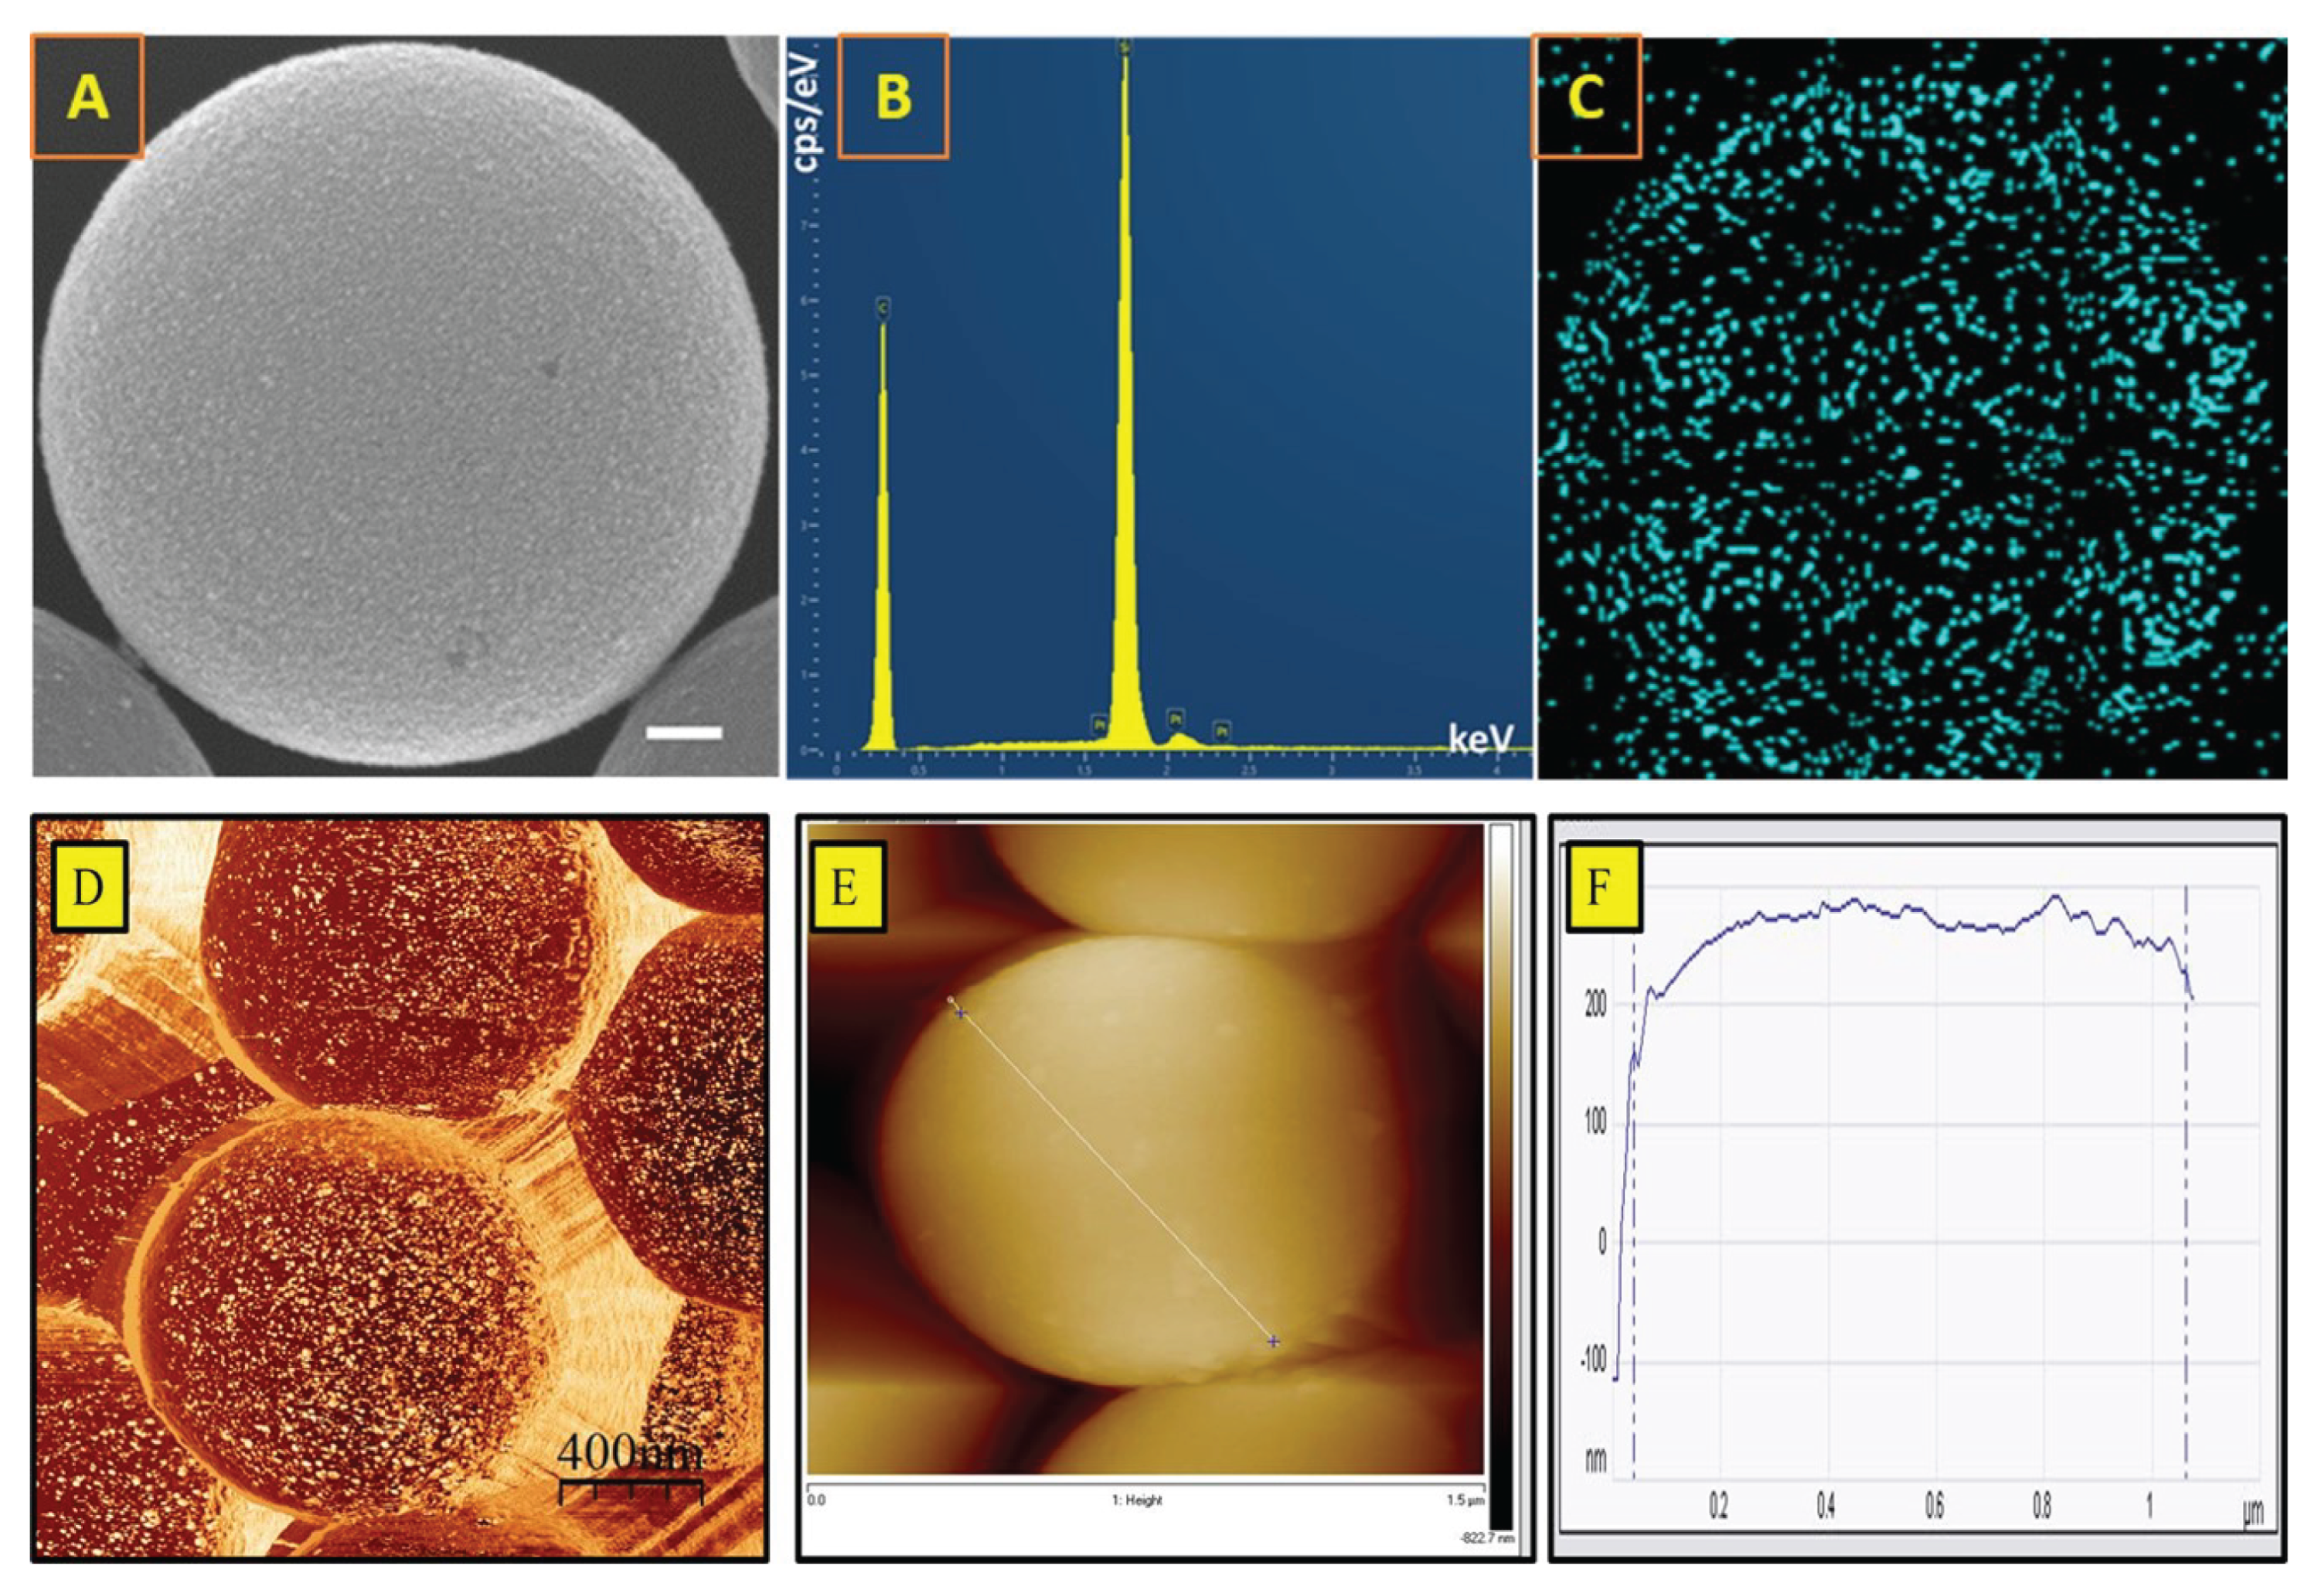
Figure 5.
XRD analysis confirms the presence of platinum (Pt) on the surface of 1 M polystyrene (PS) particles.
Figure 5.
XRD analysis confirms the presence of platinum (Pt) on the surface of 1 M polystyrene (PS) particles.
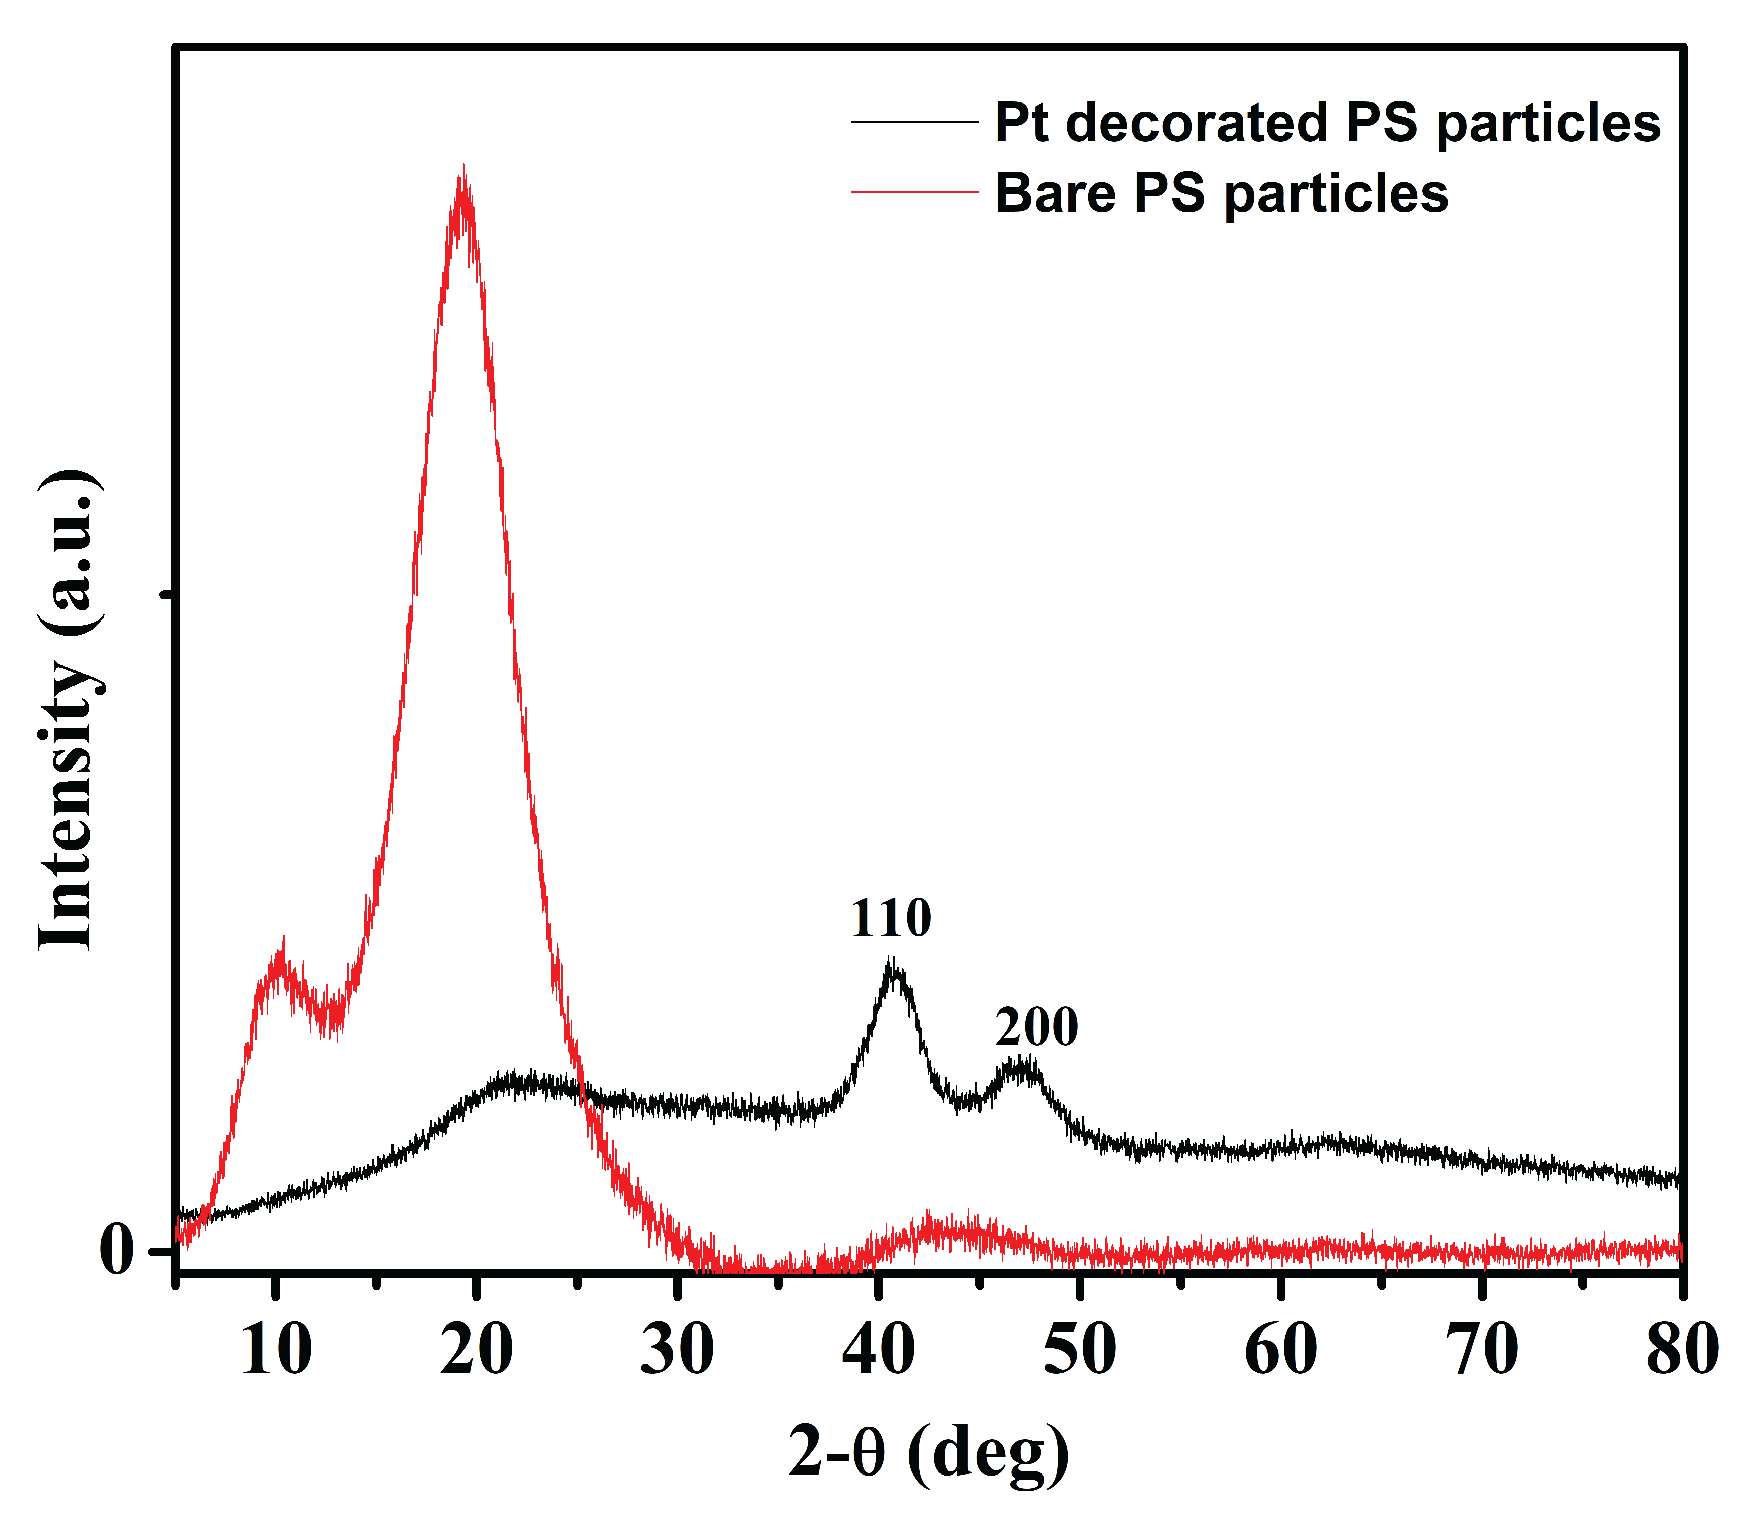
Figure 6.
A quick insight into the chemical decomposition of MB showing discolouration time and catalytic efficiency as a function of the concentration of rough particles through the bulk approach. The initial concentration of MB maintained throughout is 10 M.
Figure 6.
A quick insight into the chemical decomposition of MB showing discolouration time and catalytic efficiency as a function of the concentration of rough particles through the bulk approach. The initial concentration of MB maintained throughout is 10 M.
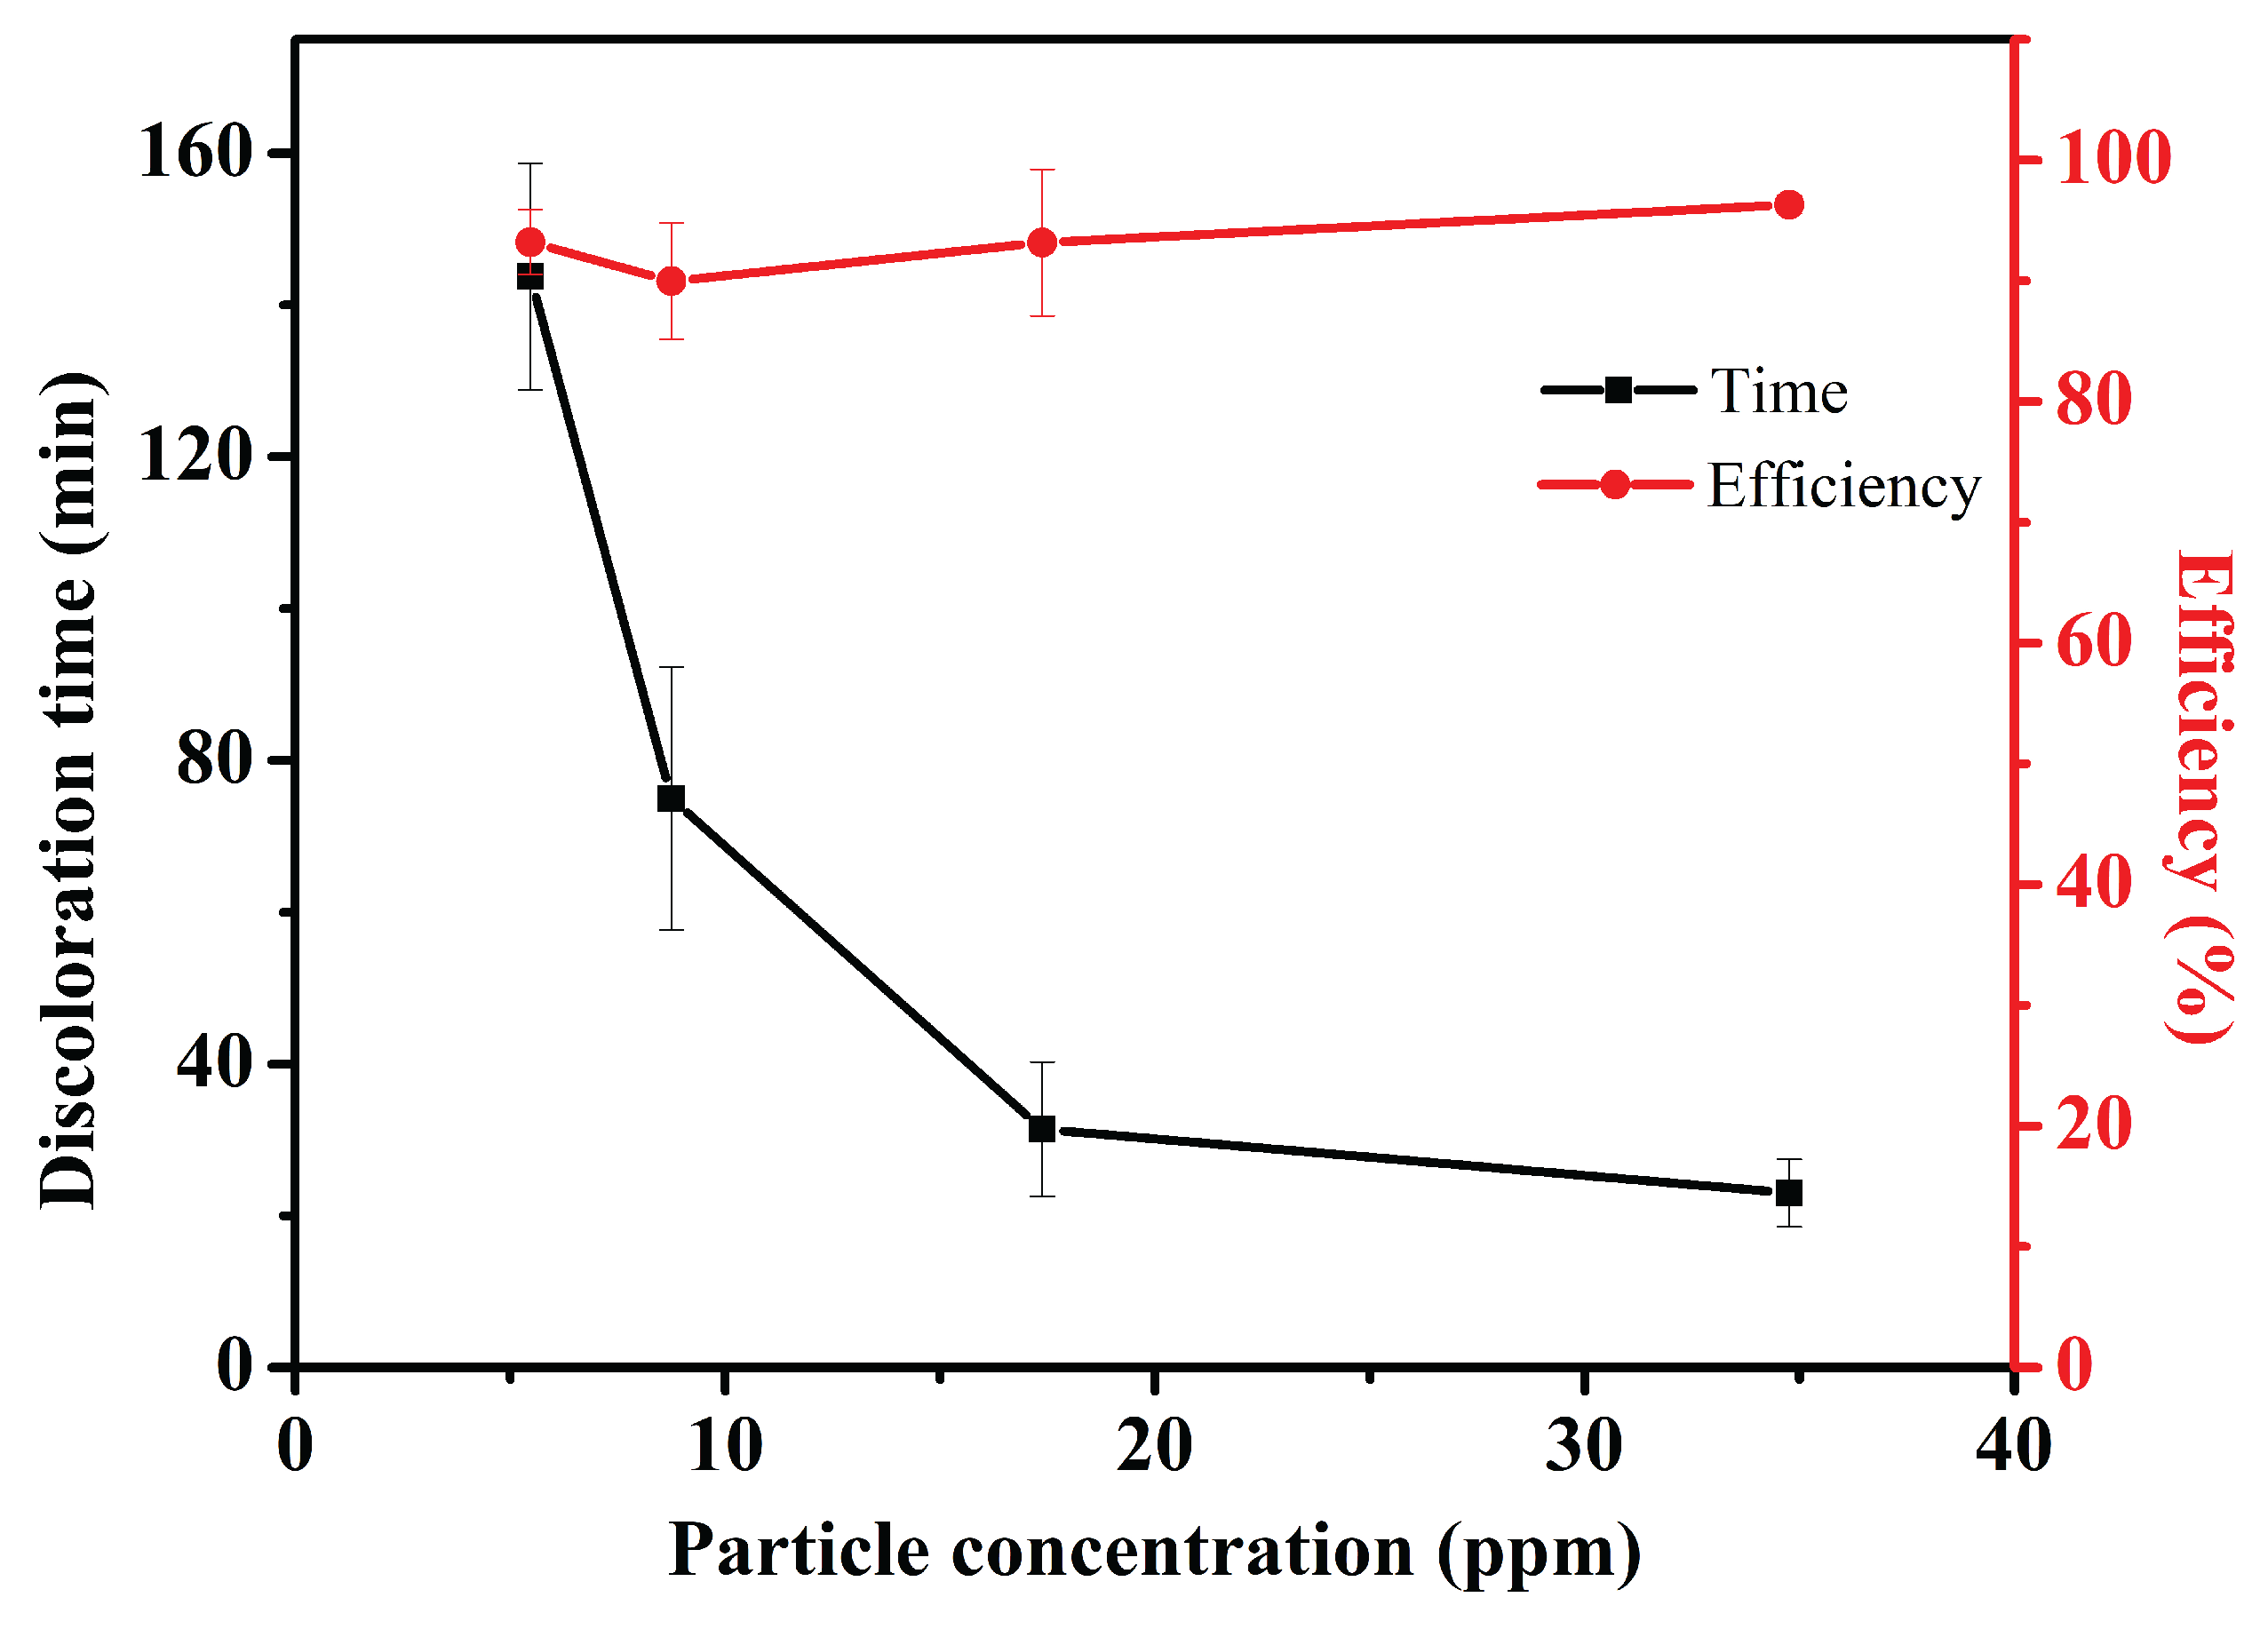
Figure 7.
A) Photographs depicting the formation of the concentration gradient during the degradation of MB without circulation. B) Photographs depicting the absence of concentration gradient formation with a circulation speed of 50 RPM and the complete degradation of MB within 30 minutes.
Figure 7.
A) Photographs depicting the formation of the concentration gradient during the degradation of MB without circulation. B) Photographs depicting the absence of concentration gradient formation with a circulation speed of 50 RPM and the complete degradation of MB within 30 minutes.
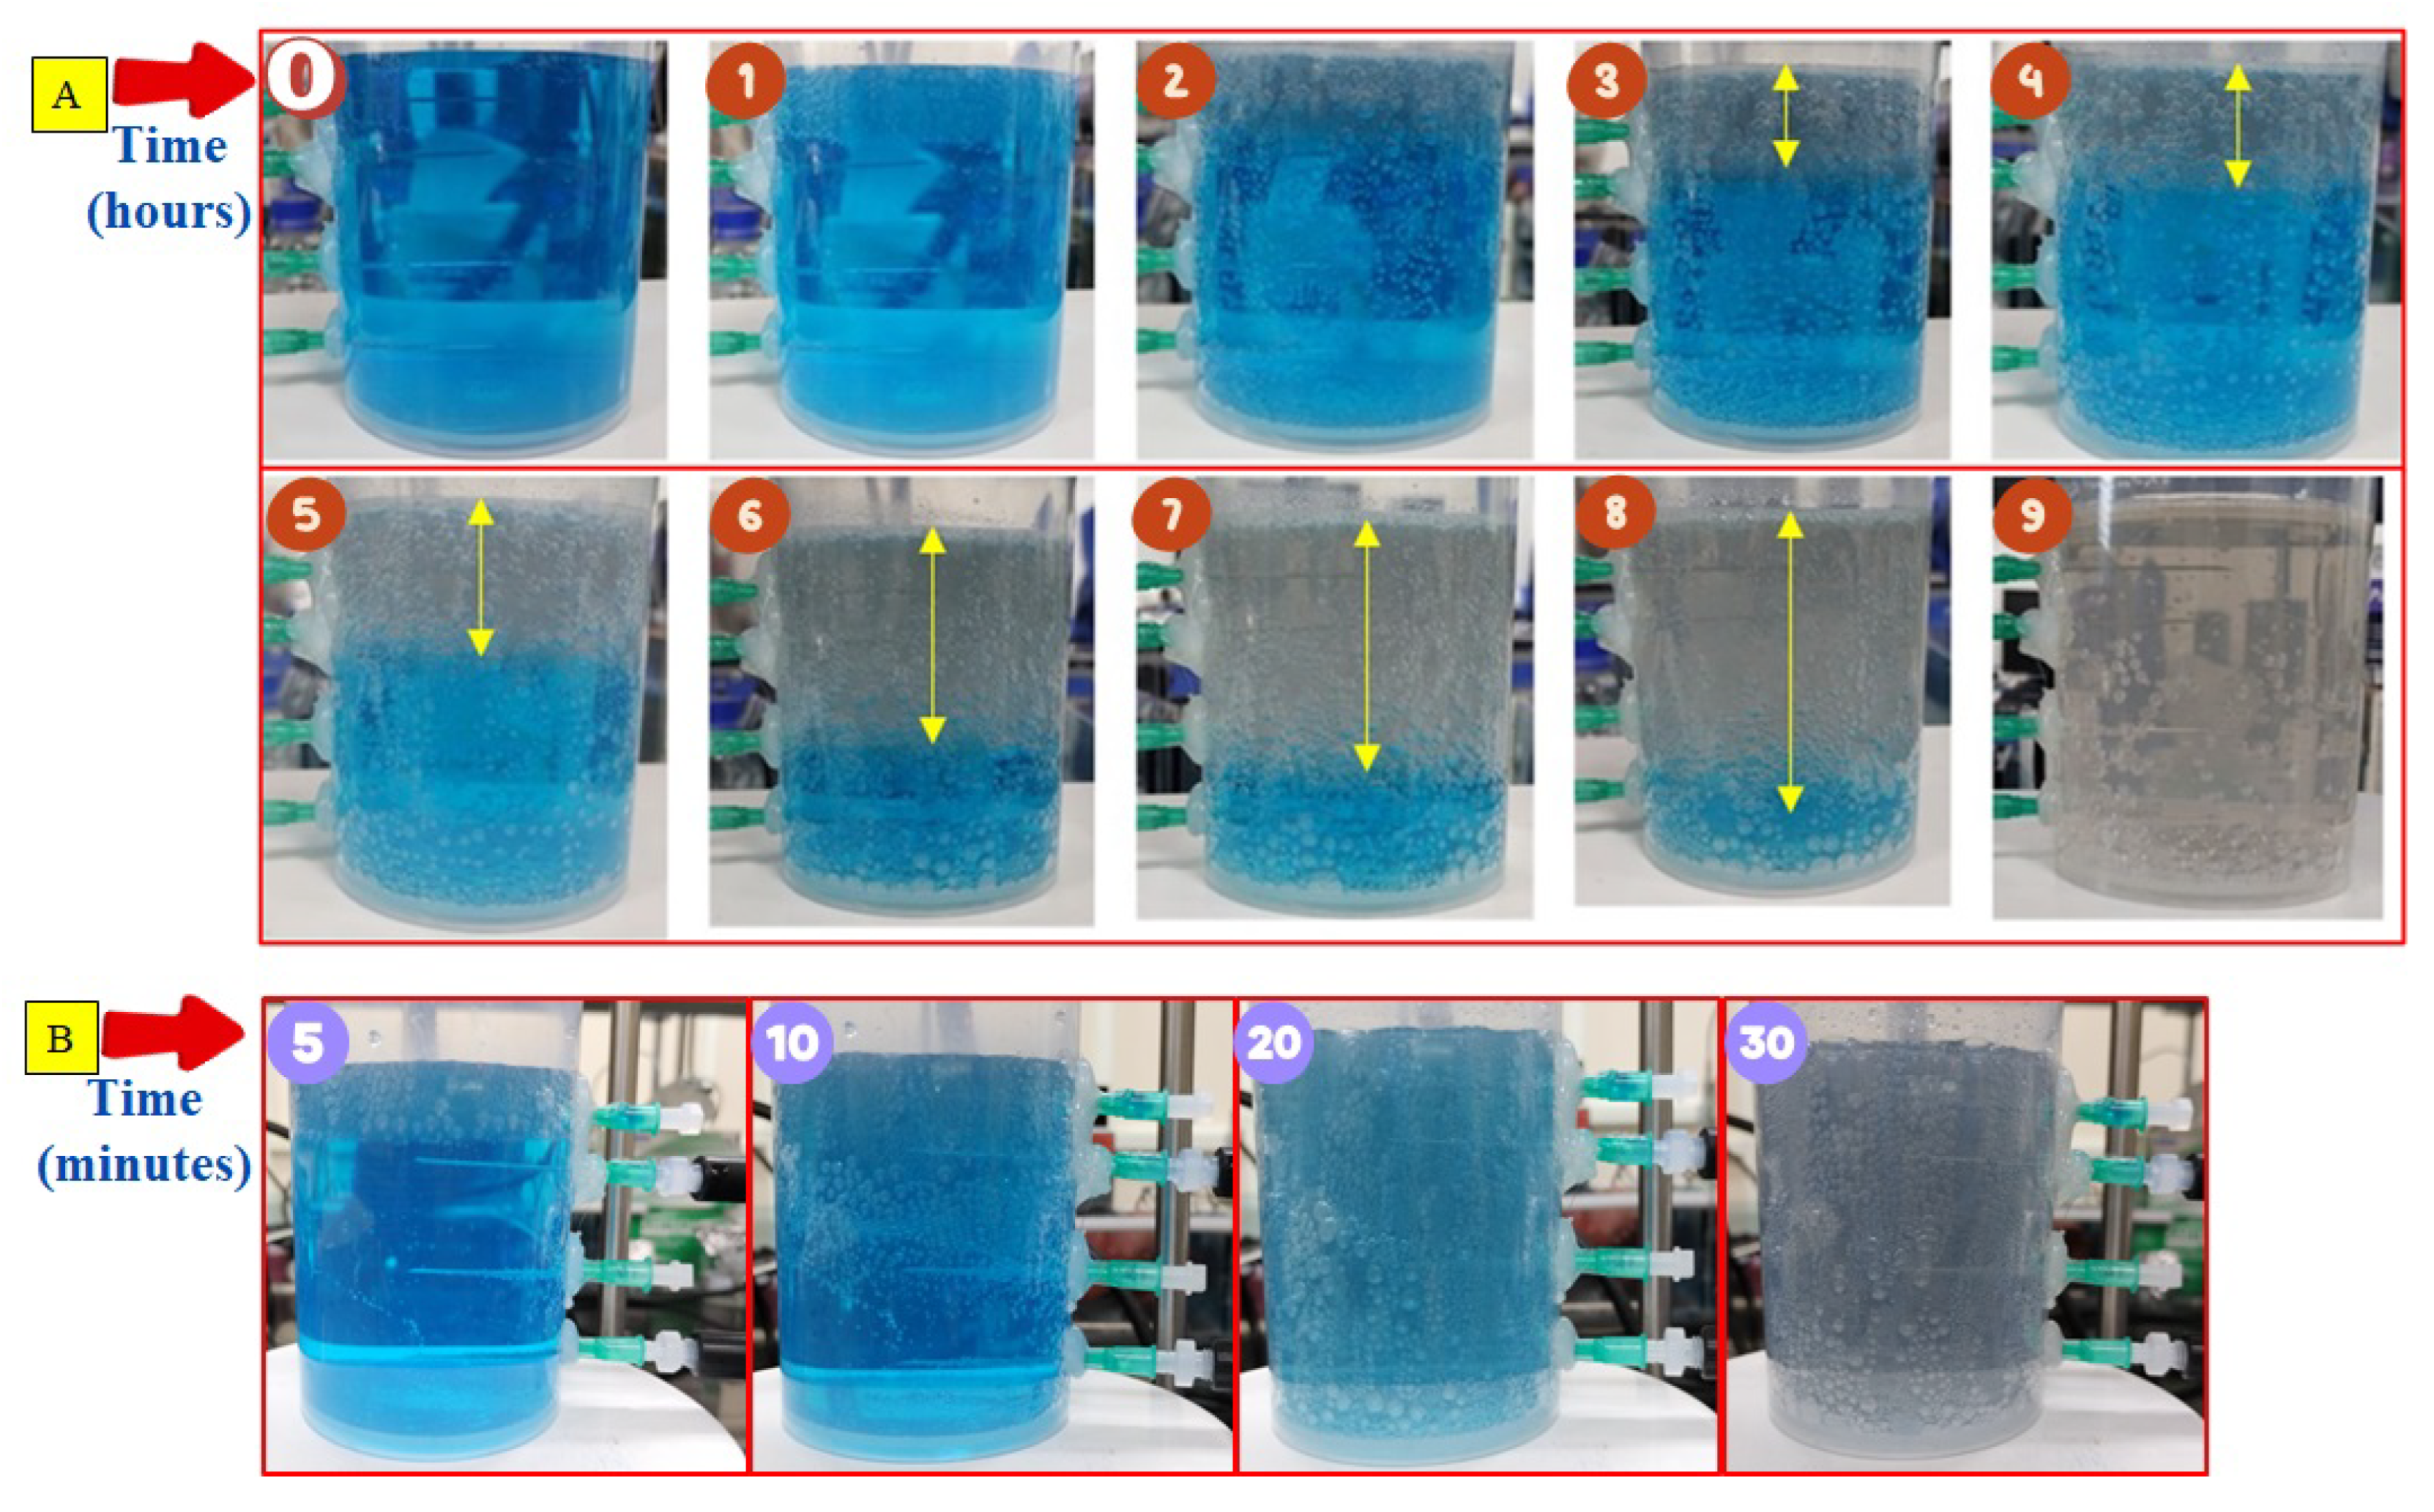
Figure 8.
Plot showing the decomposition of MB. A) At different circulation speeds and fixed =0.8. (B) At different packing fractions and fixed NRe=1686.
Figure 8.
Plot showing the decomposition of MB. A) At different circulation speeds and fixed =0.8. (B) At different packing fractions and fixed NRe=1686.
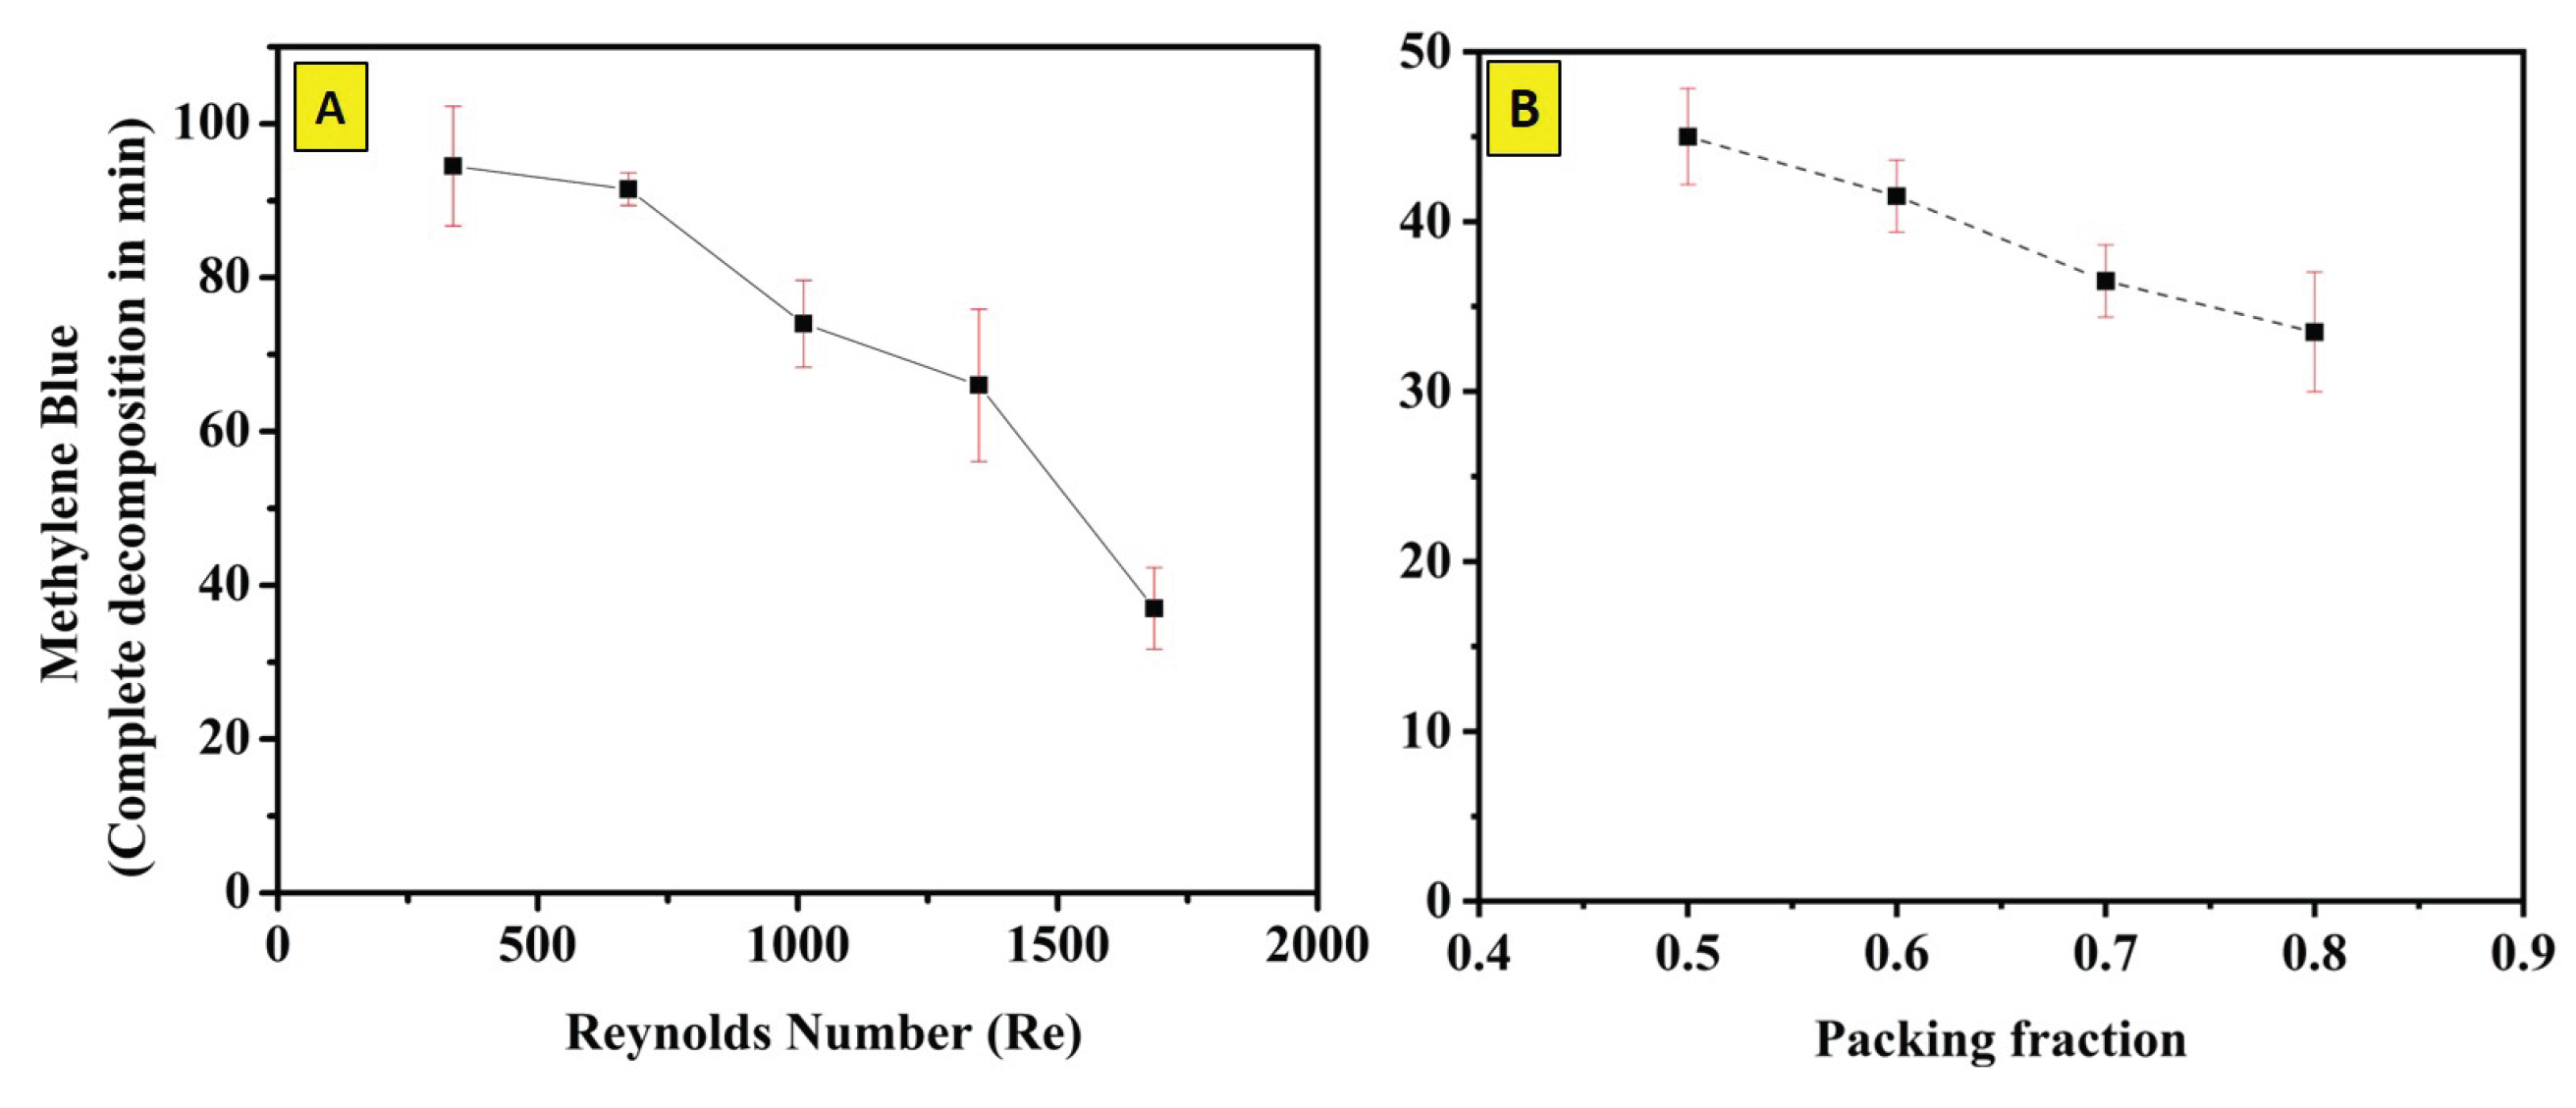
Figure 9.
Figures A and B depict the condition of 0.8 packing before and after MB degradation, respectively, at a 5% concentration. Figures C and D show the condition of 0.5 packing before and after MB degradation, respectively, at a 1.5% concentration. Figures E and F illustrate the condition of 0.5 packing before and after MB degradation, respectively, at a 3% concentration. The scale bar on A-B, C-D, and E-F correspond to 25, 100 and 100 m, respectively.
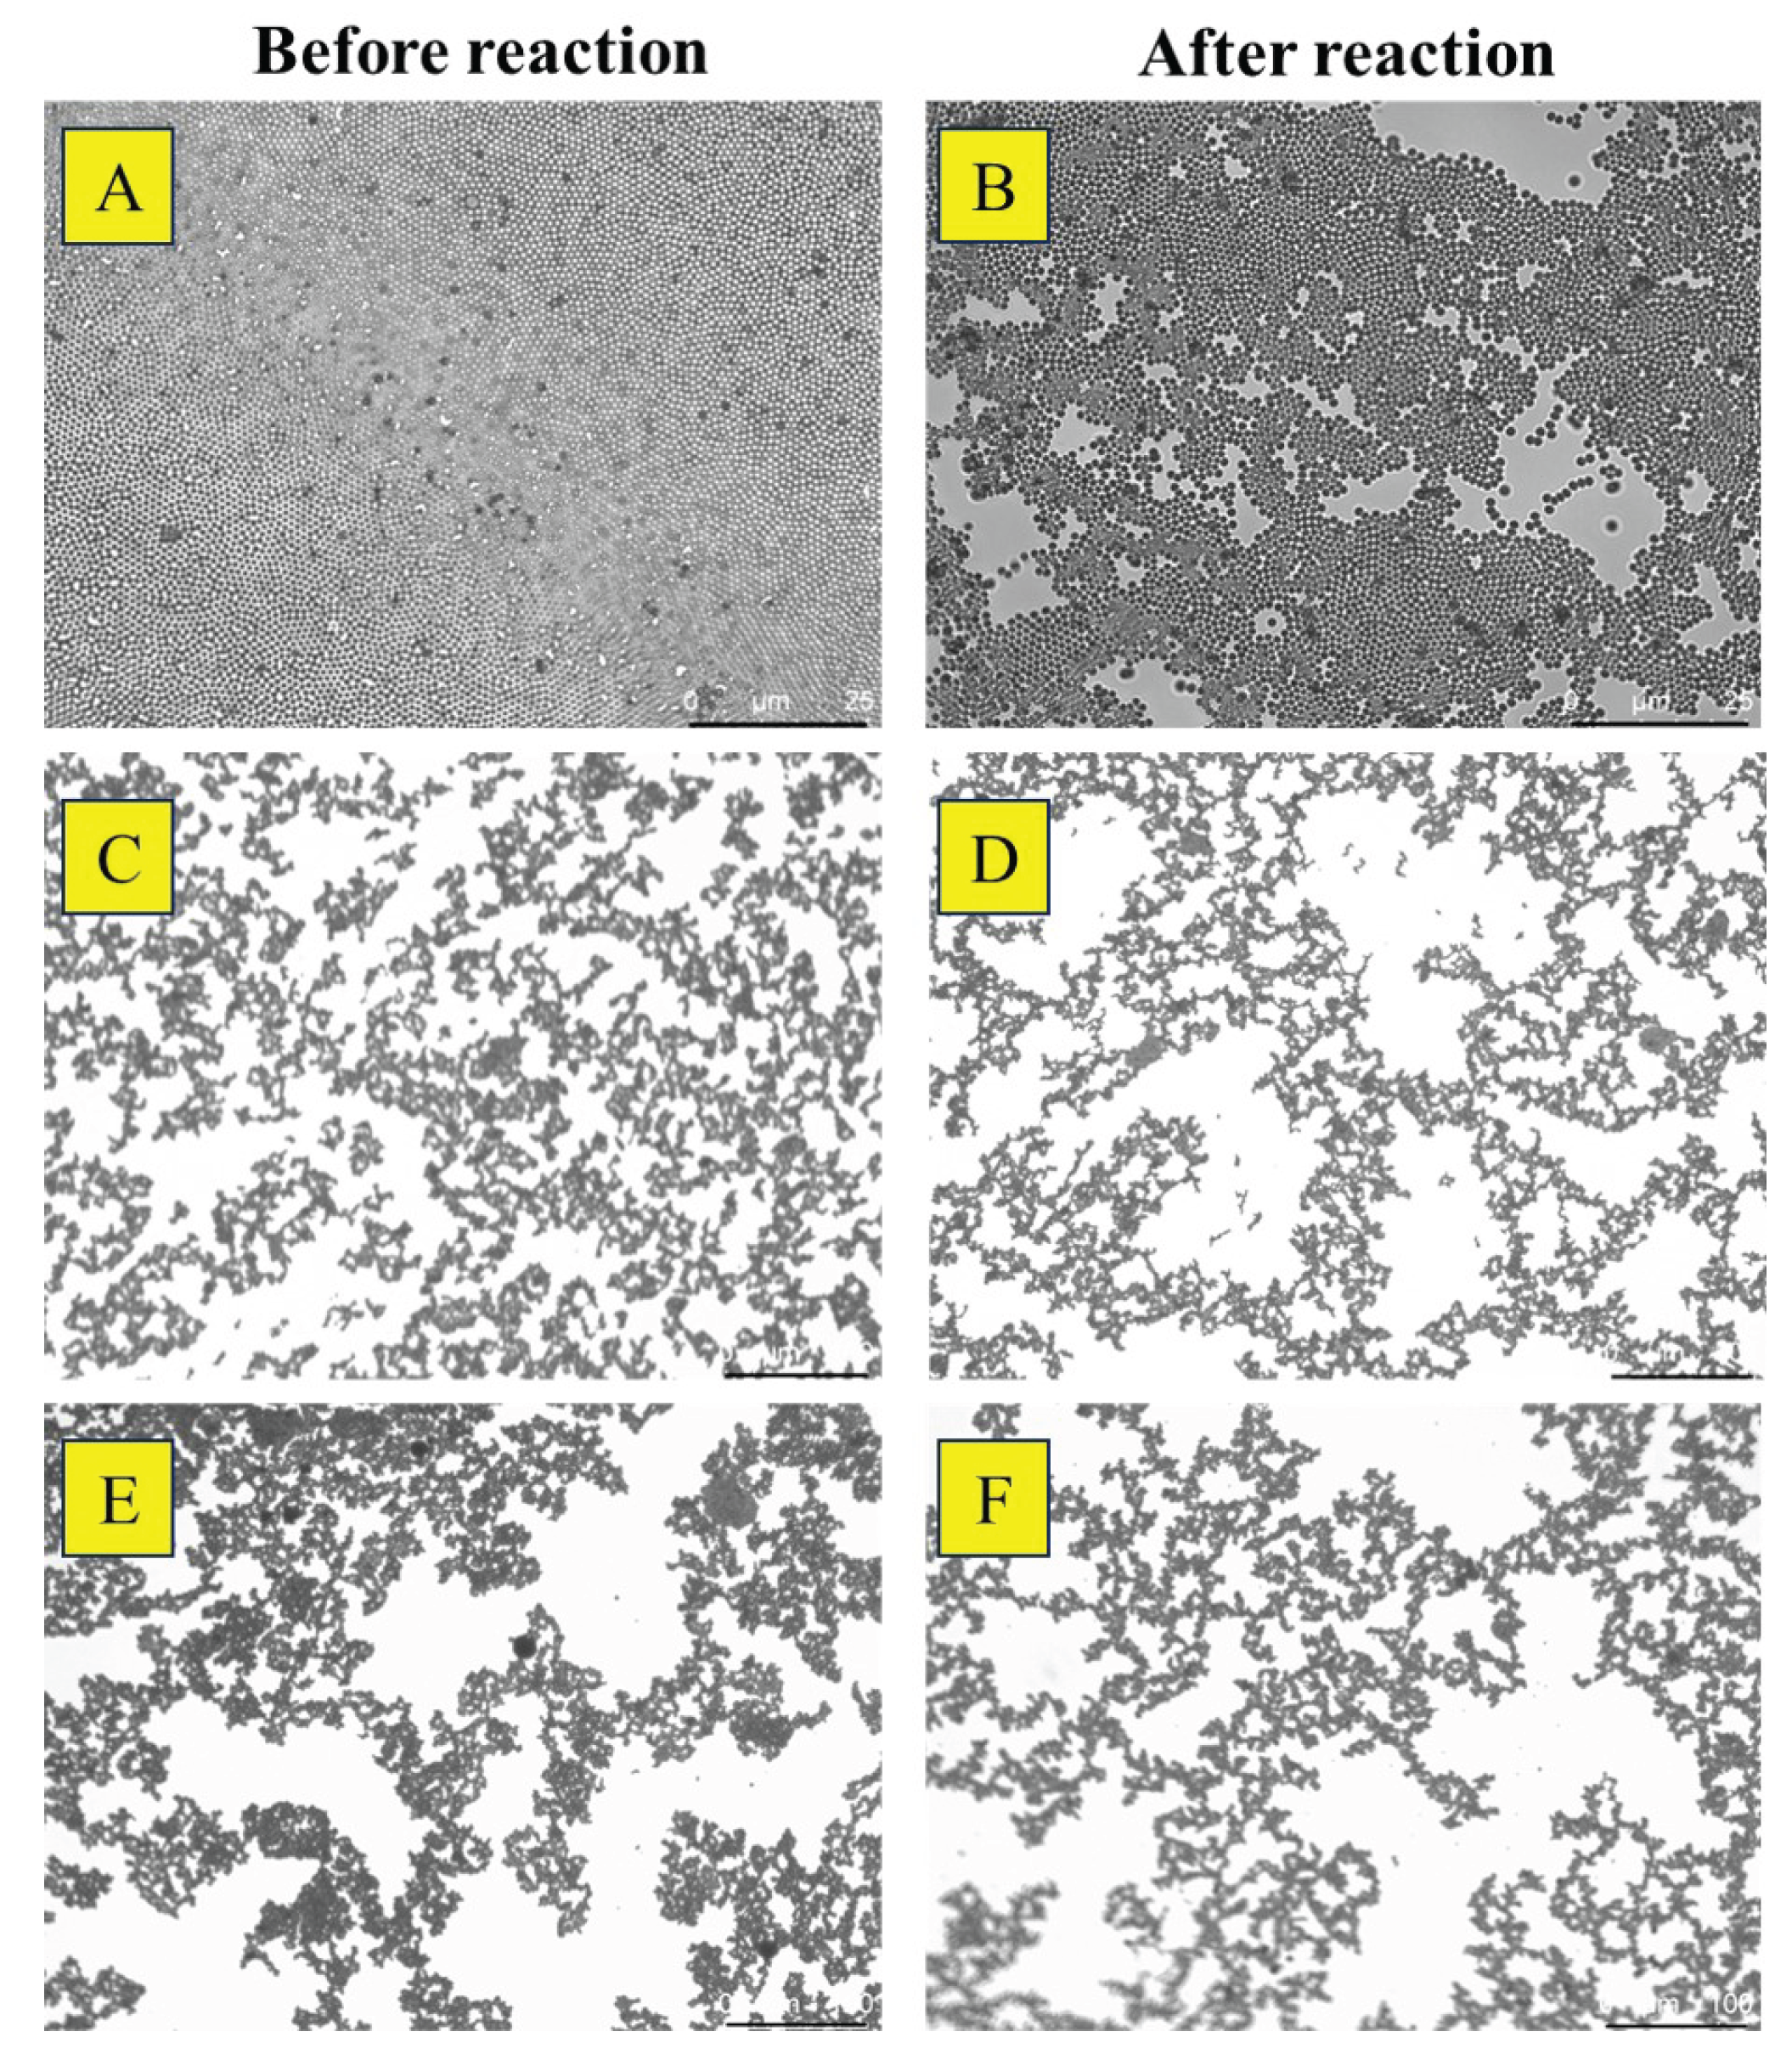
Figure 10.
Plot depicting the % change in the packing fraction as a function of hydrogen peroxide concentration.
Figure 10.
Plot depicting the % change in the packing fraction as a function of hydrogen peroxide concentration.
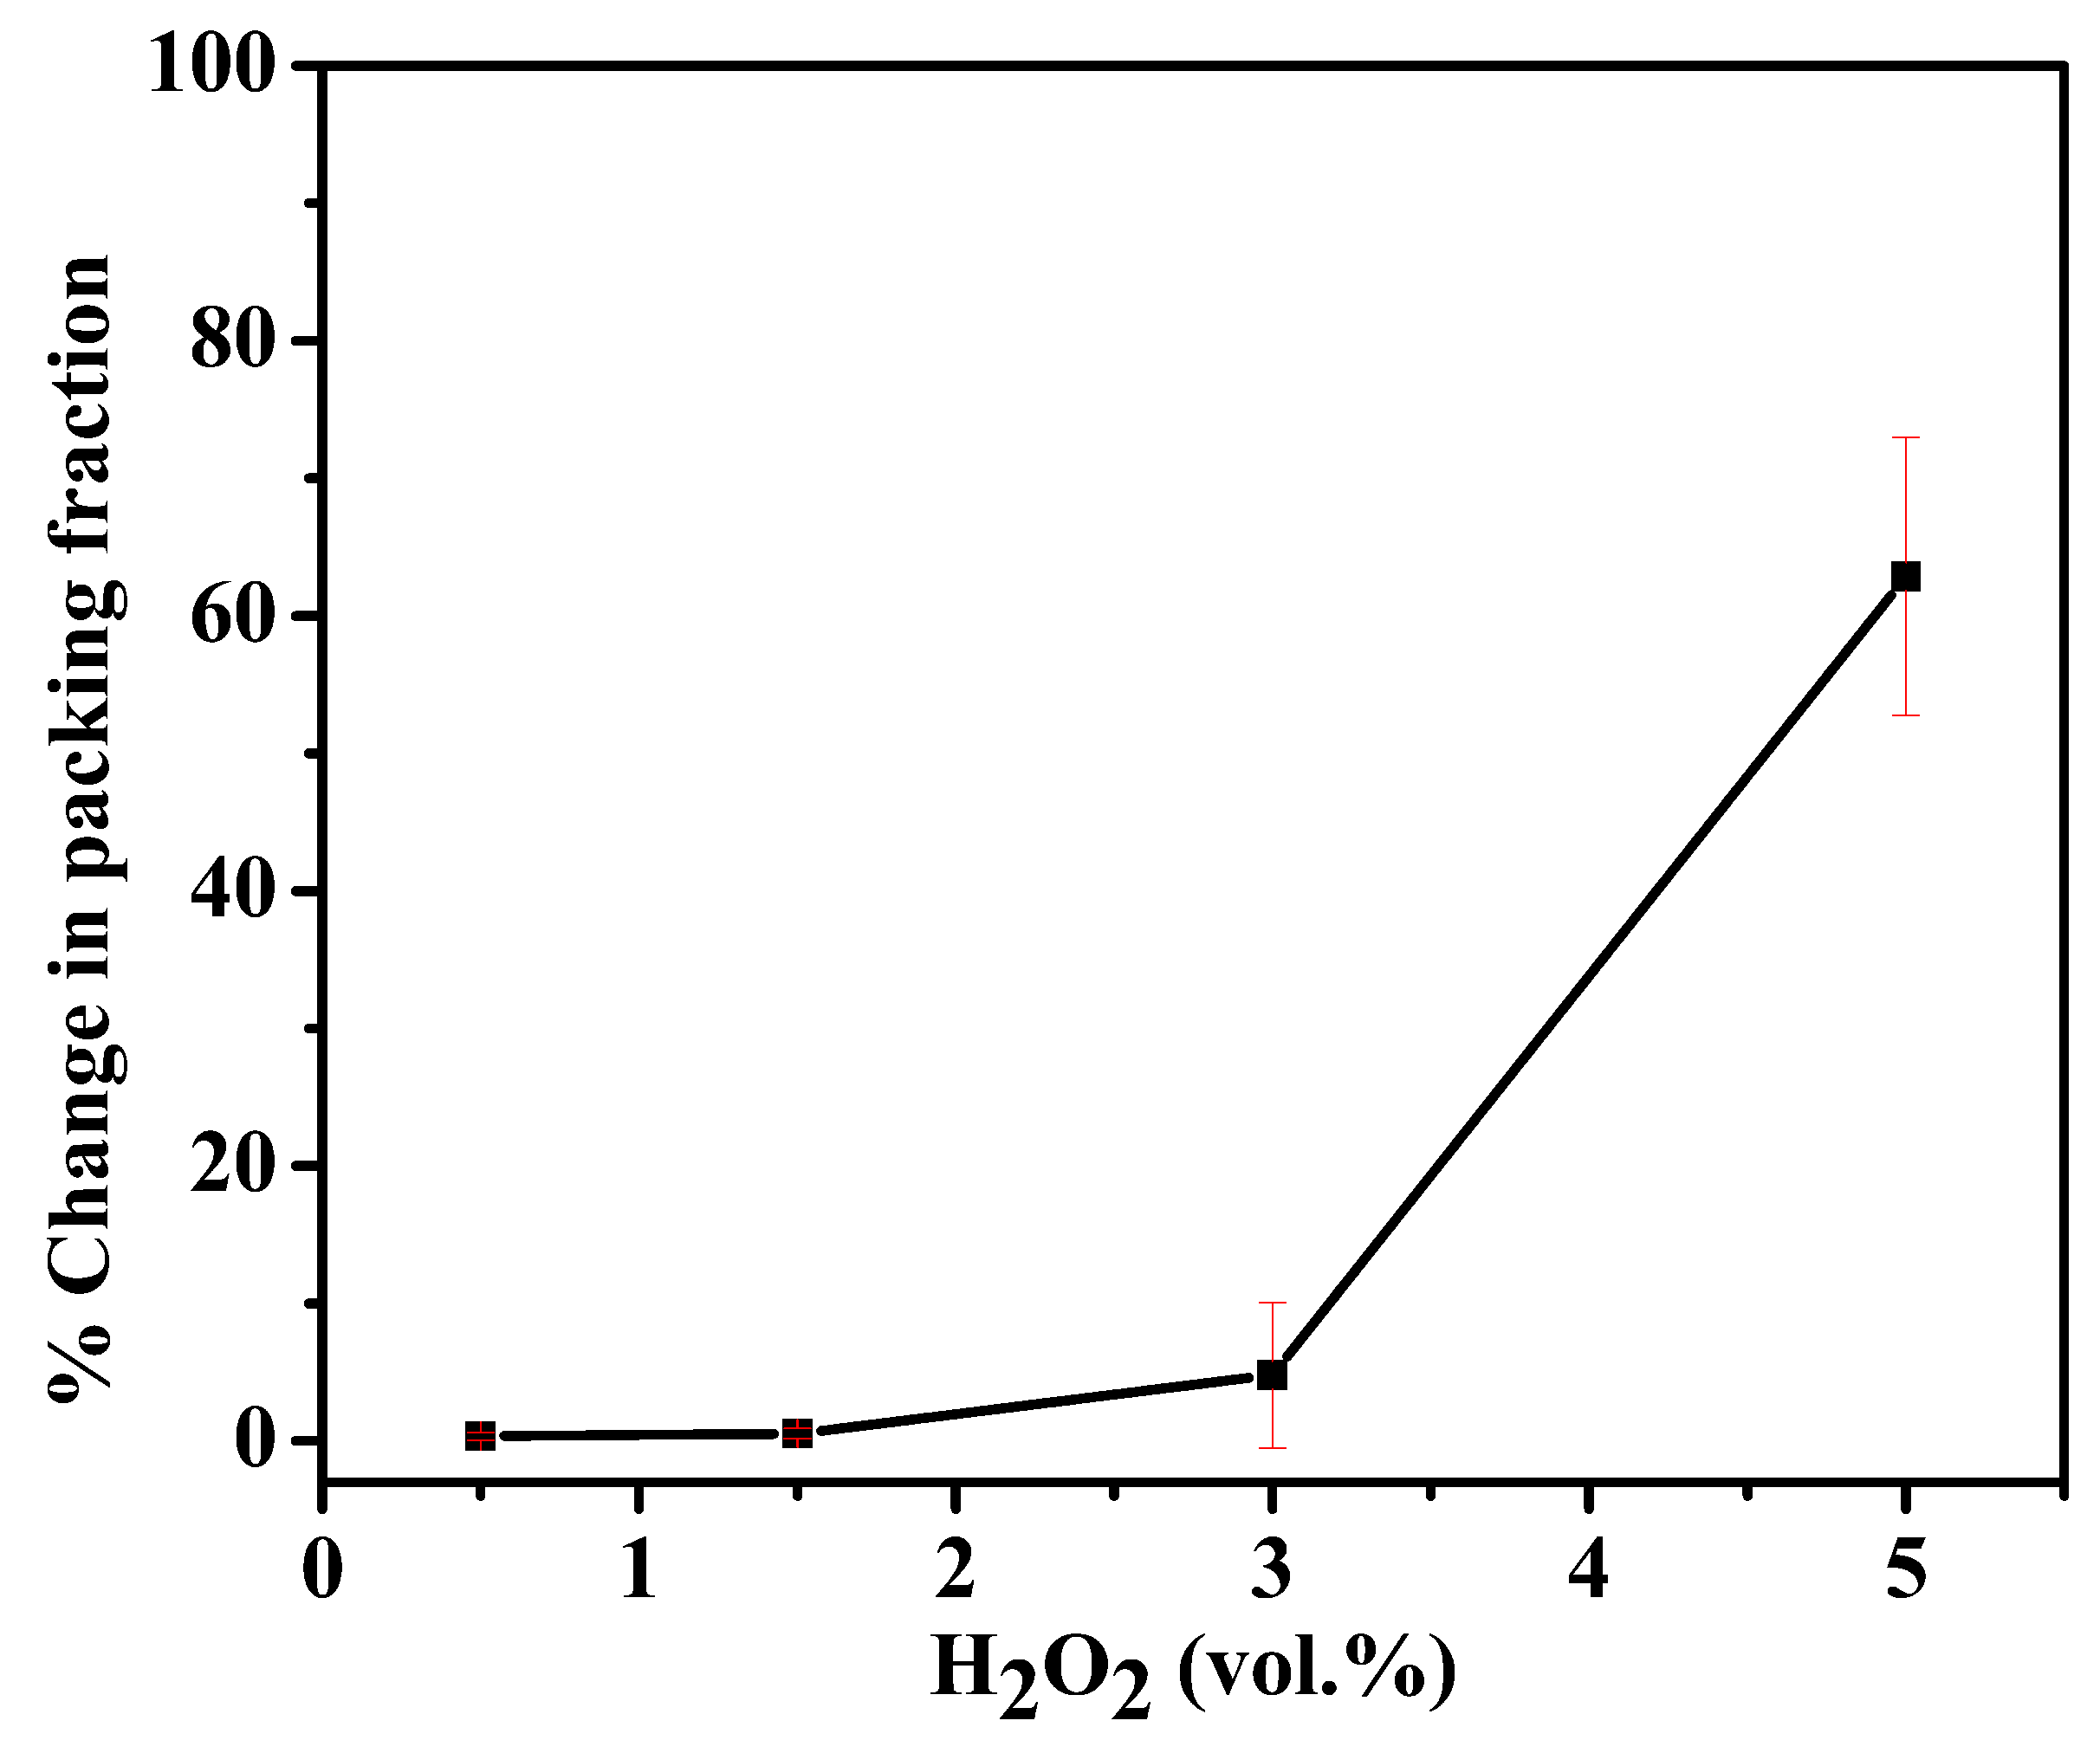
Figure 11.
The plot showing the absorbance spectra corresponding to the decomposition of MB over time (=0.5, H2O2 = 3%, circulation speed = 50 RPM.)
Figure 11.
The plot showing the absorbance spectra corresponding to the decomposition of MB over time (=0.5, H2O2 = 3%, circulation speed = 50 RPM.)
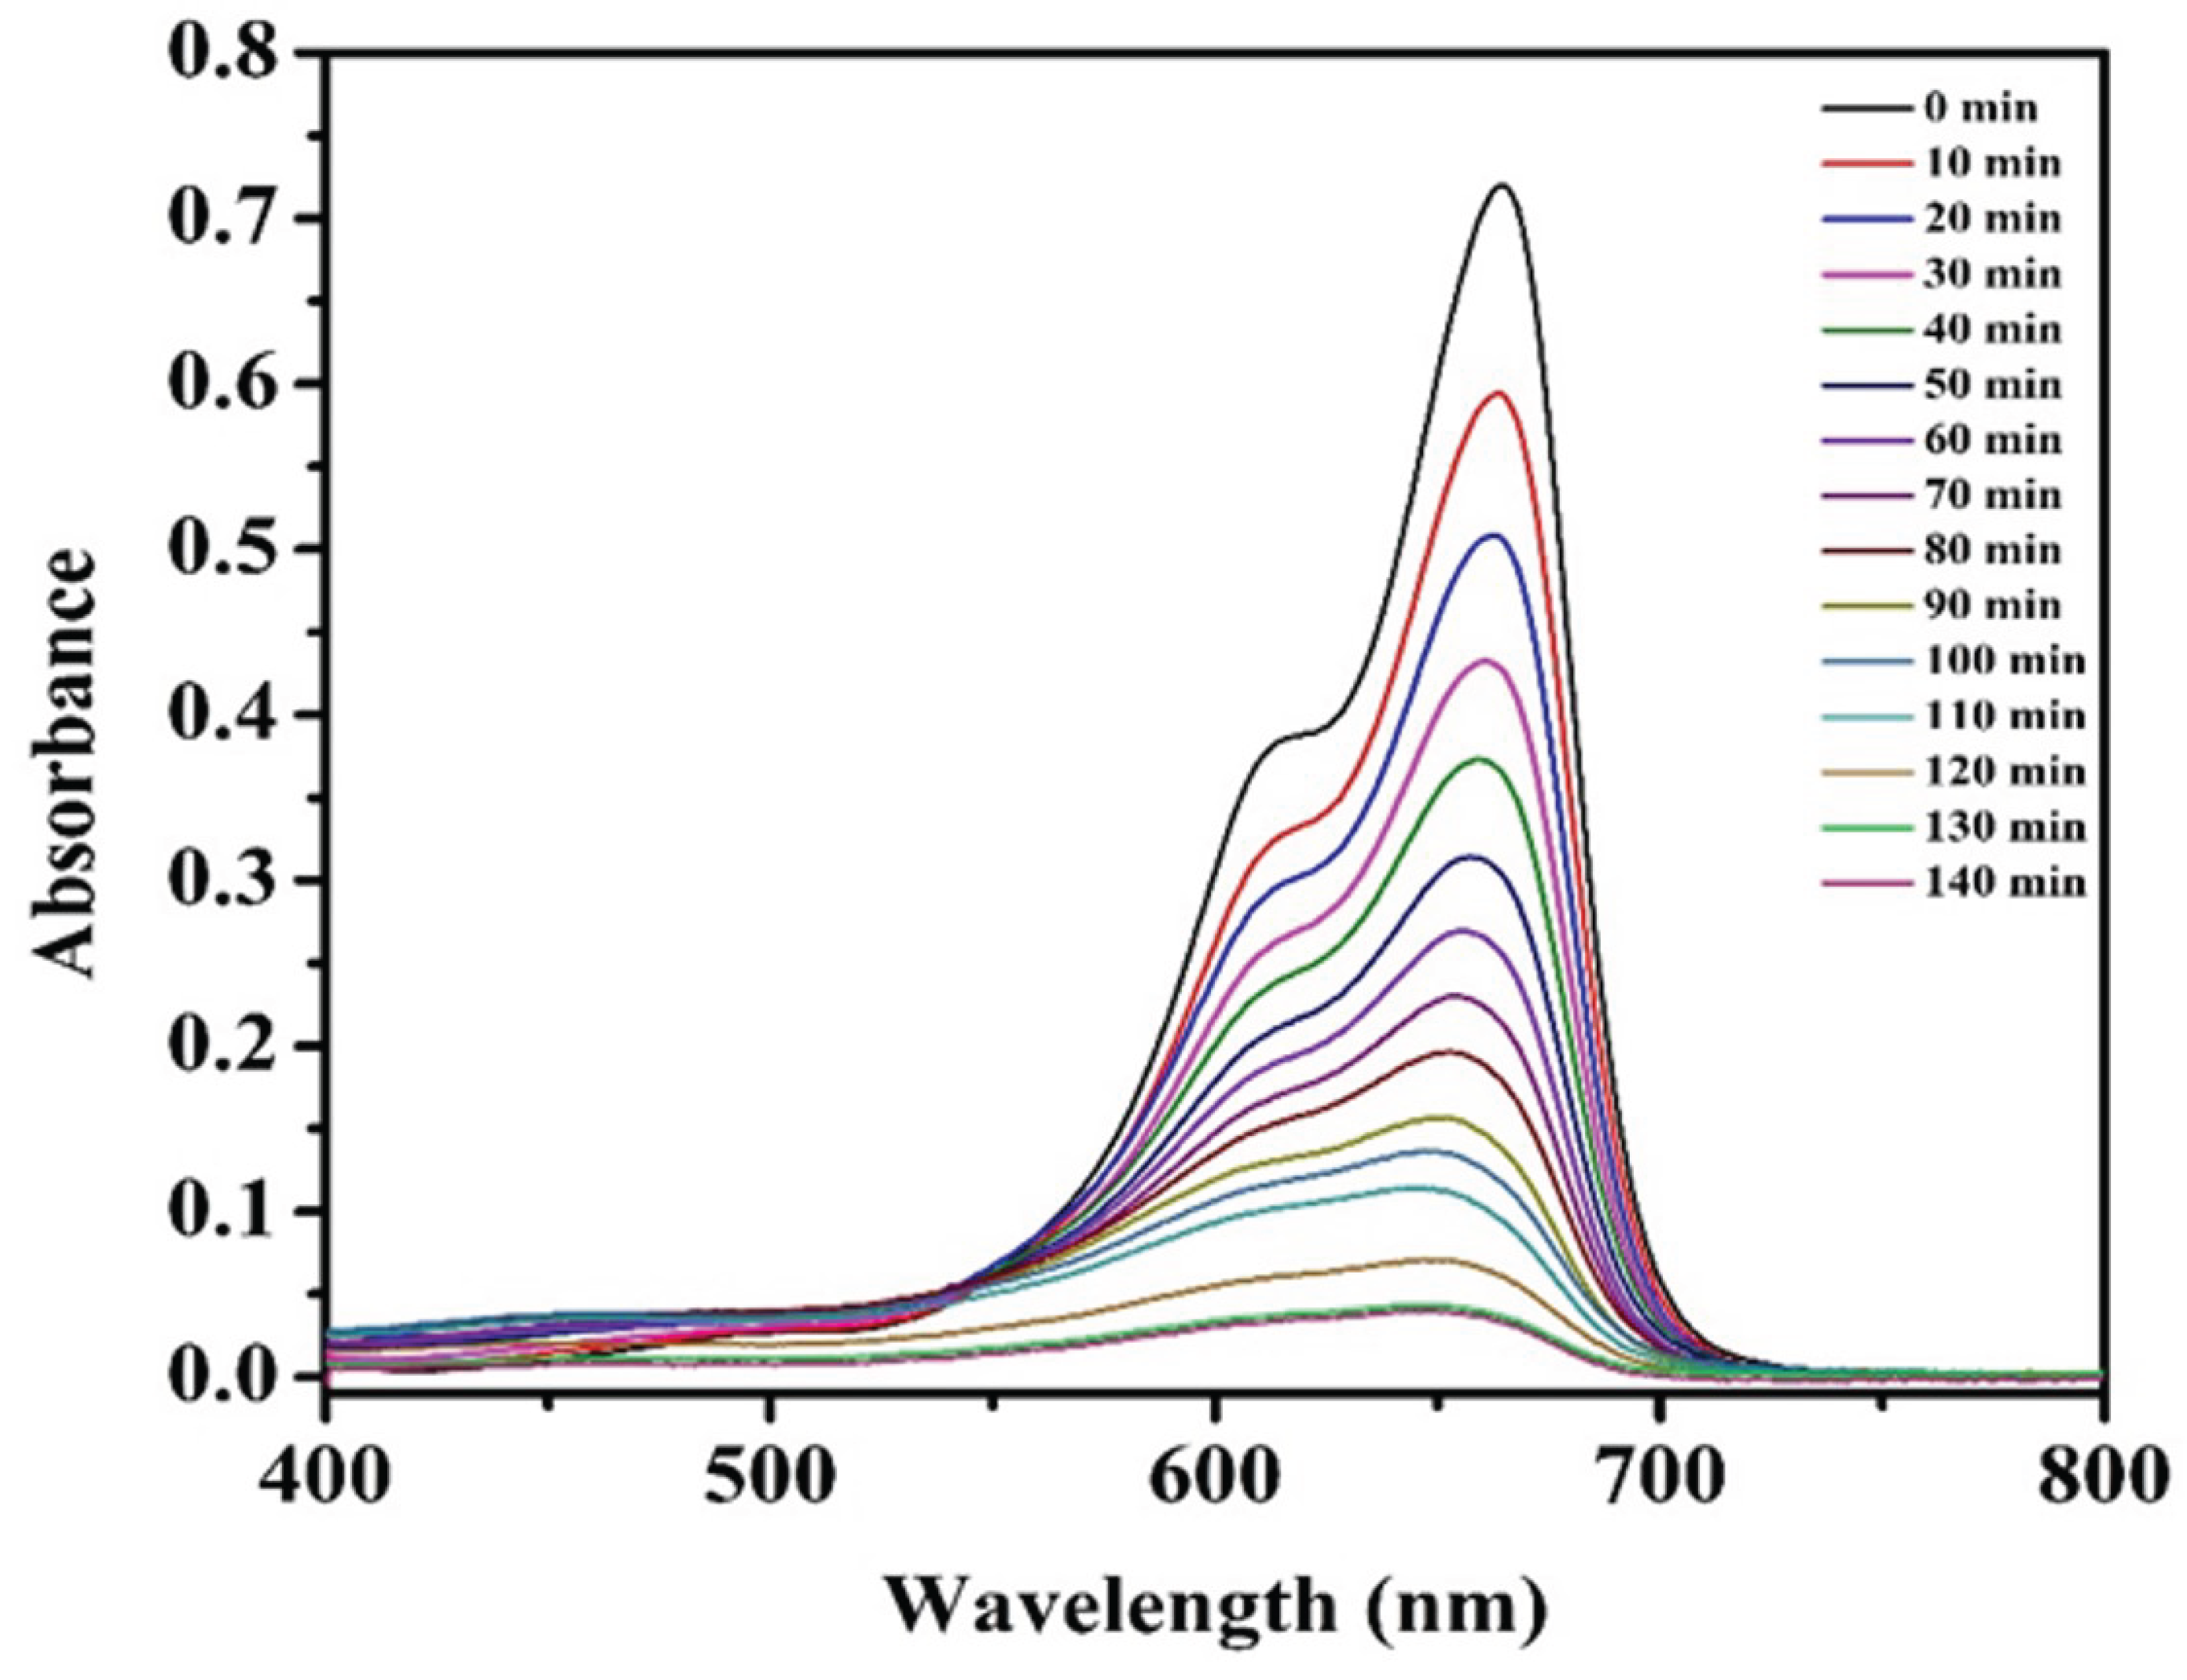
Figure 12.
Plot showing the A) concentration vs time and B) kinetics of the MB decomposition obtained from absorbance spectra at optimized conditions, i.e., =0.5, H2O2 = 3%, circulation speed = 50 RPM.
Figure 12.
Plot showing the A) concentration vs time and B) kinetics of the MB decomposition obtained from absorbance spectra at optimized conditions, i.e., =0.5, H2O2 = 3%, circulation speed = 50 RPM.
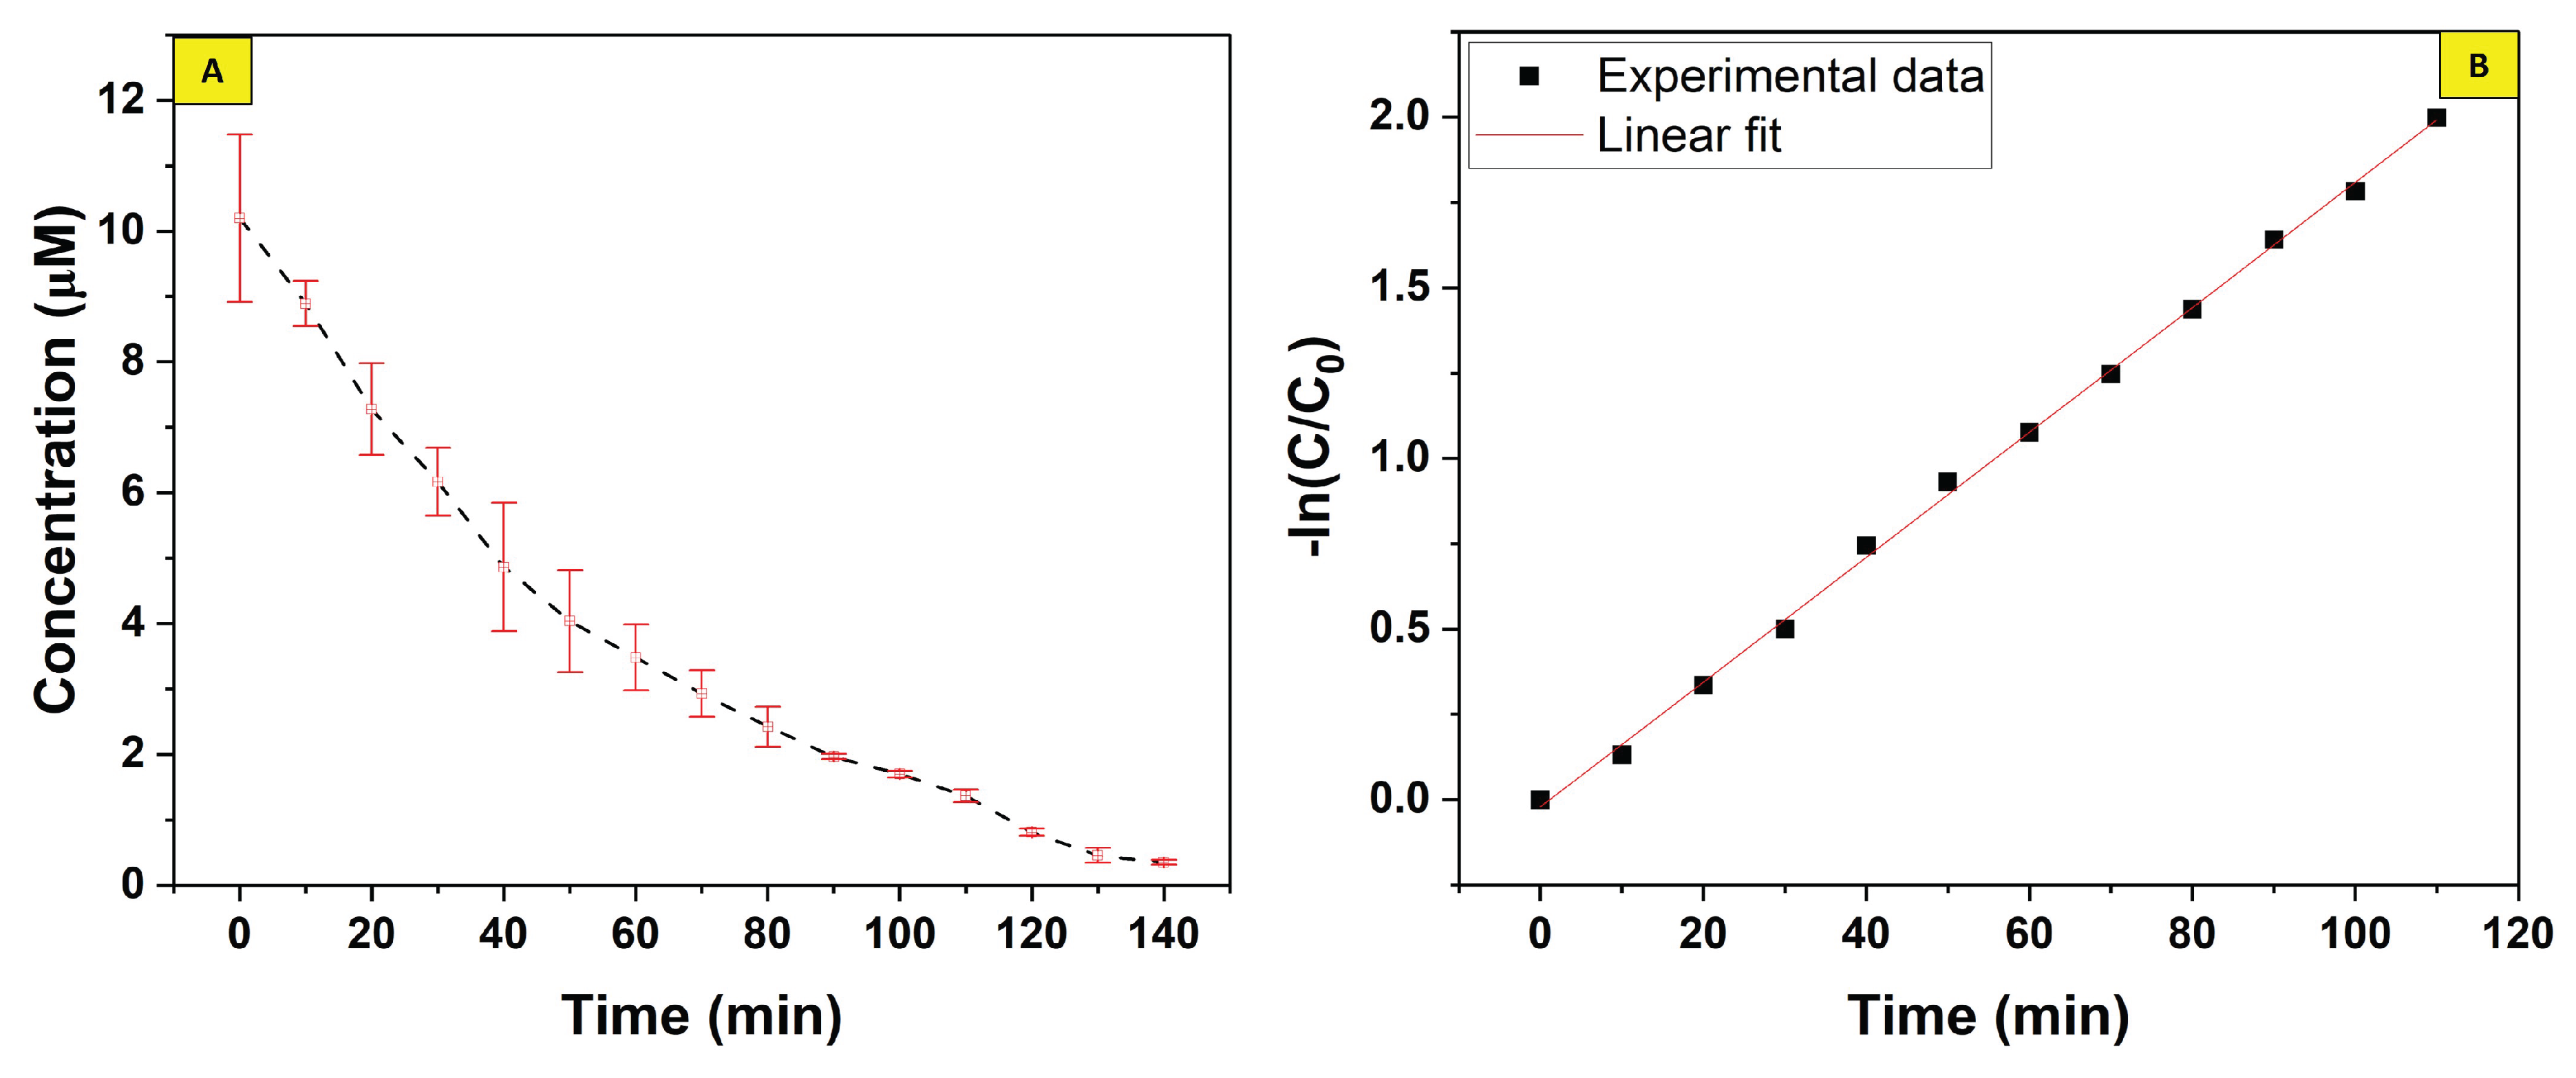
Figure 13.
(A) Architecture of the ANN model (4-19-1) with input features including Time, MB Concentration, Speed, and Hydrogen Peroxide. (B) RMSE values corresponding to different numbers of neurons in the hidden layer, with the optimal number of neurons identified. (C) RMSE values for different activation functions (purelin, logsig, tansig, ReLU) demonstrating the performance of each. (D) Comparison of actual and predicted values for the MB removal efficiency, showcasing the model’s predictive accuracy.
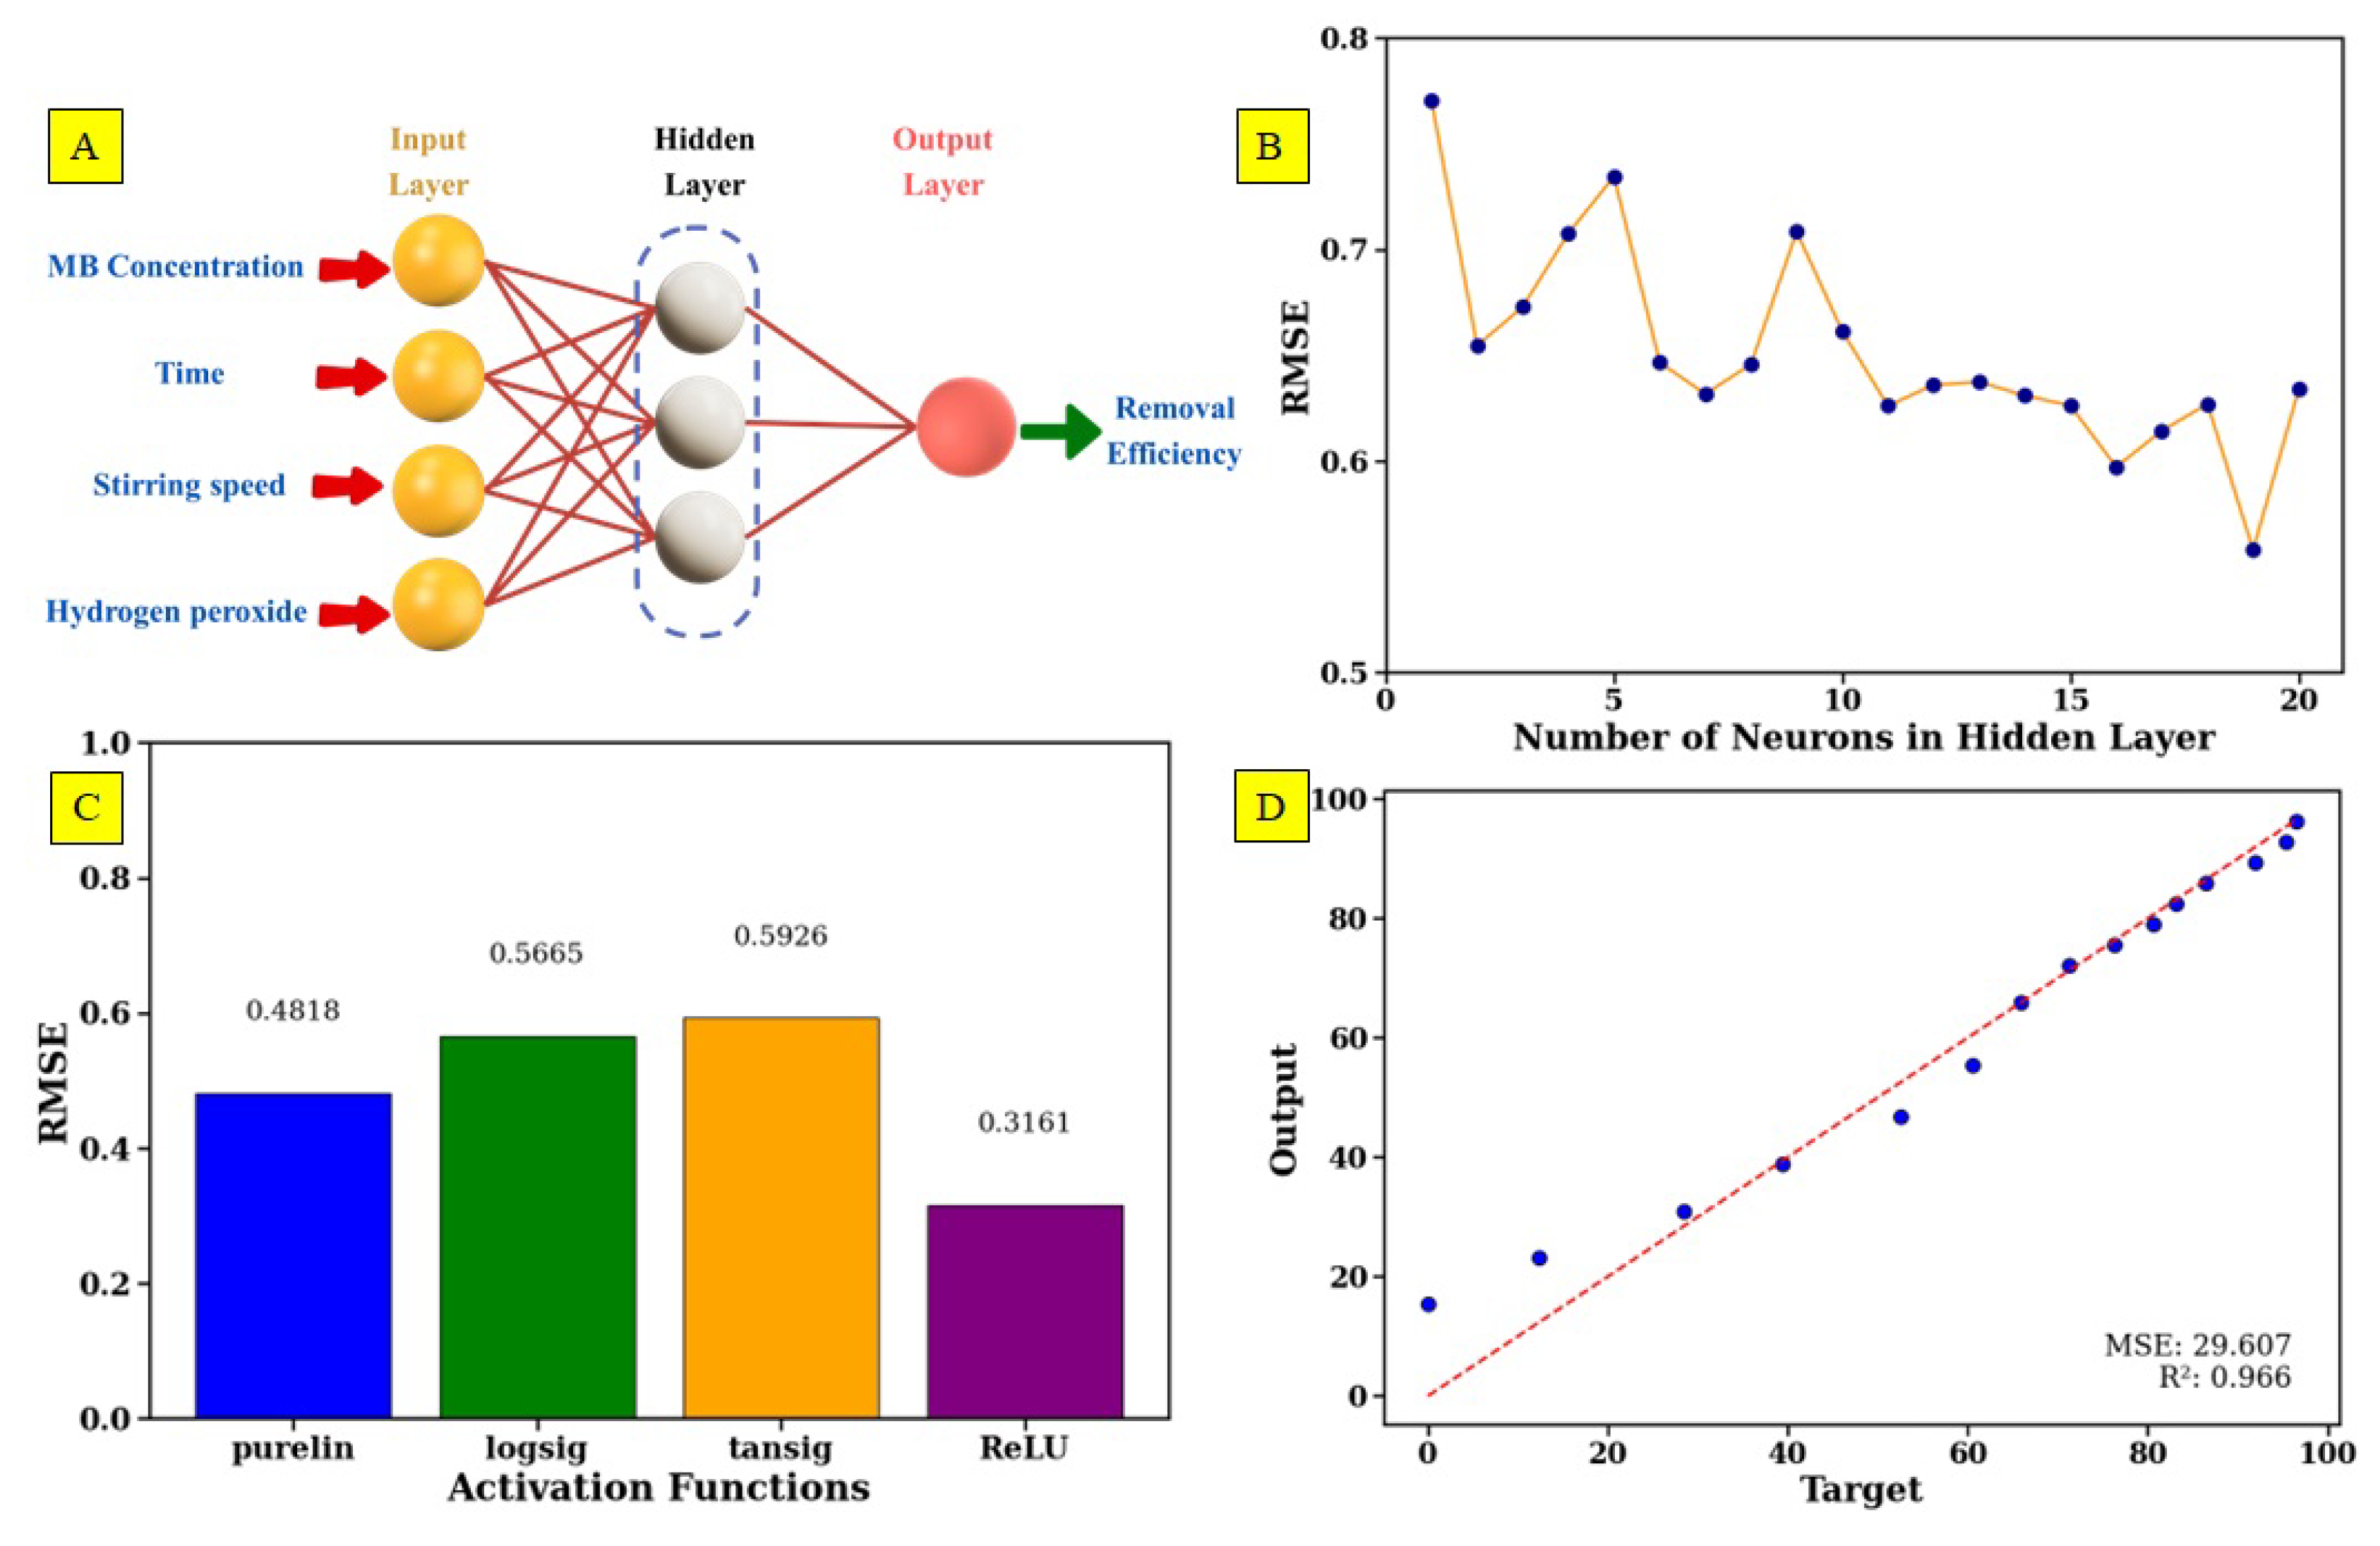
Figure 14.
A) Training data showing the correlation between actual and predicted values. B) Testing data illustrating the accuracy of the model predictions against actual values.C) Validation data depicting the model’s performance in predicting unseen data.D) Combined data representing the overall fit between actual and predicted values across the entire dataset.
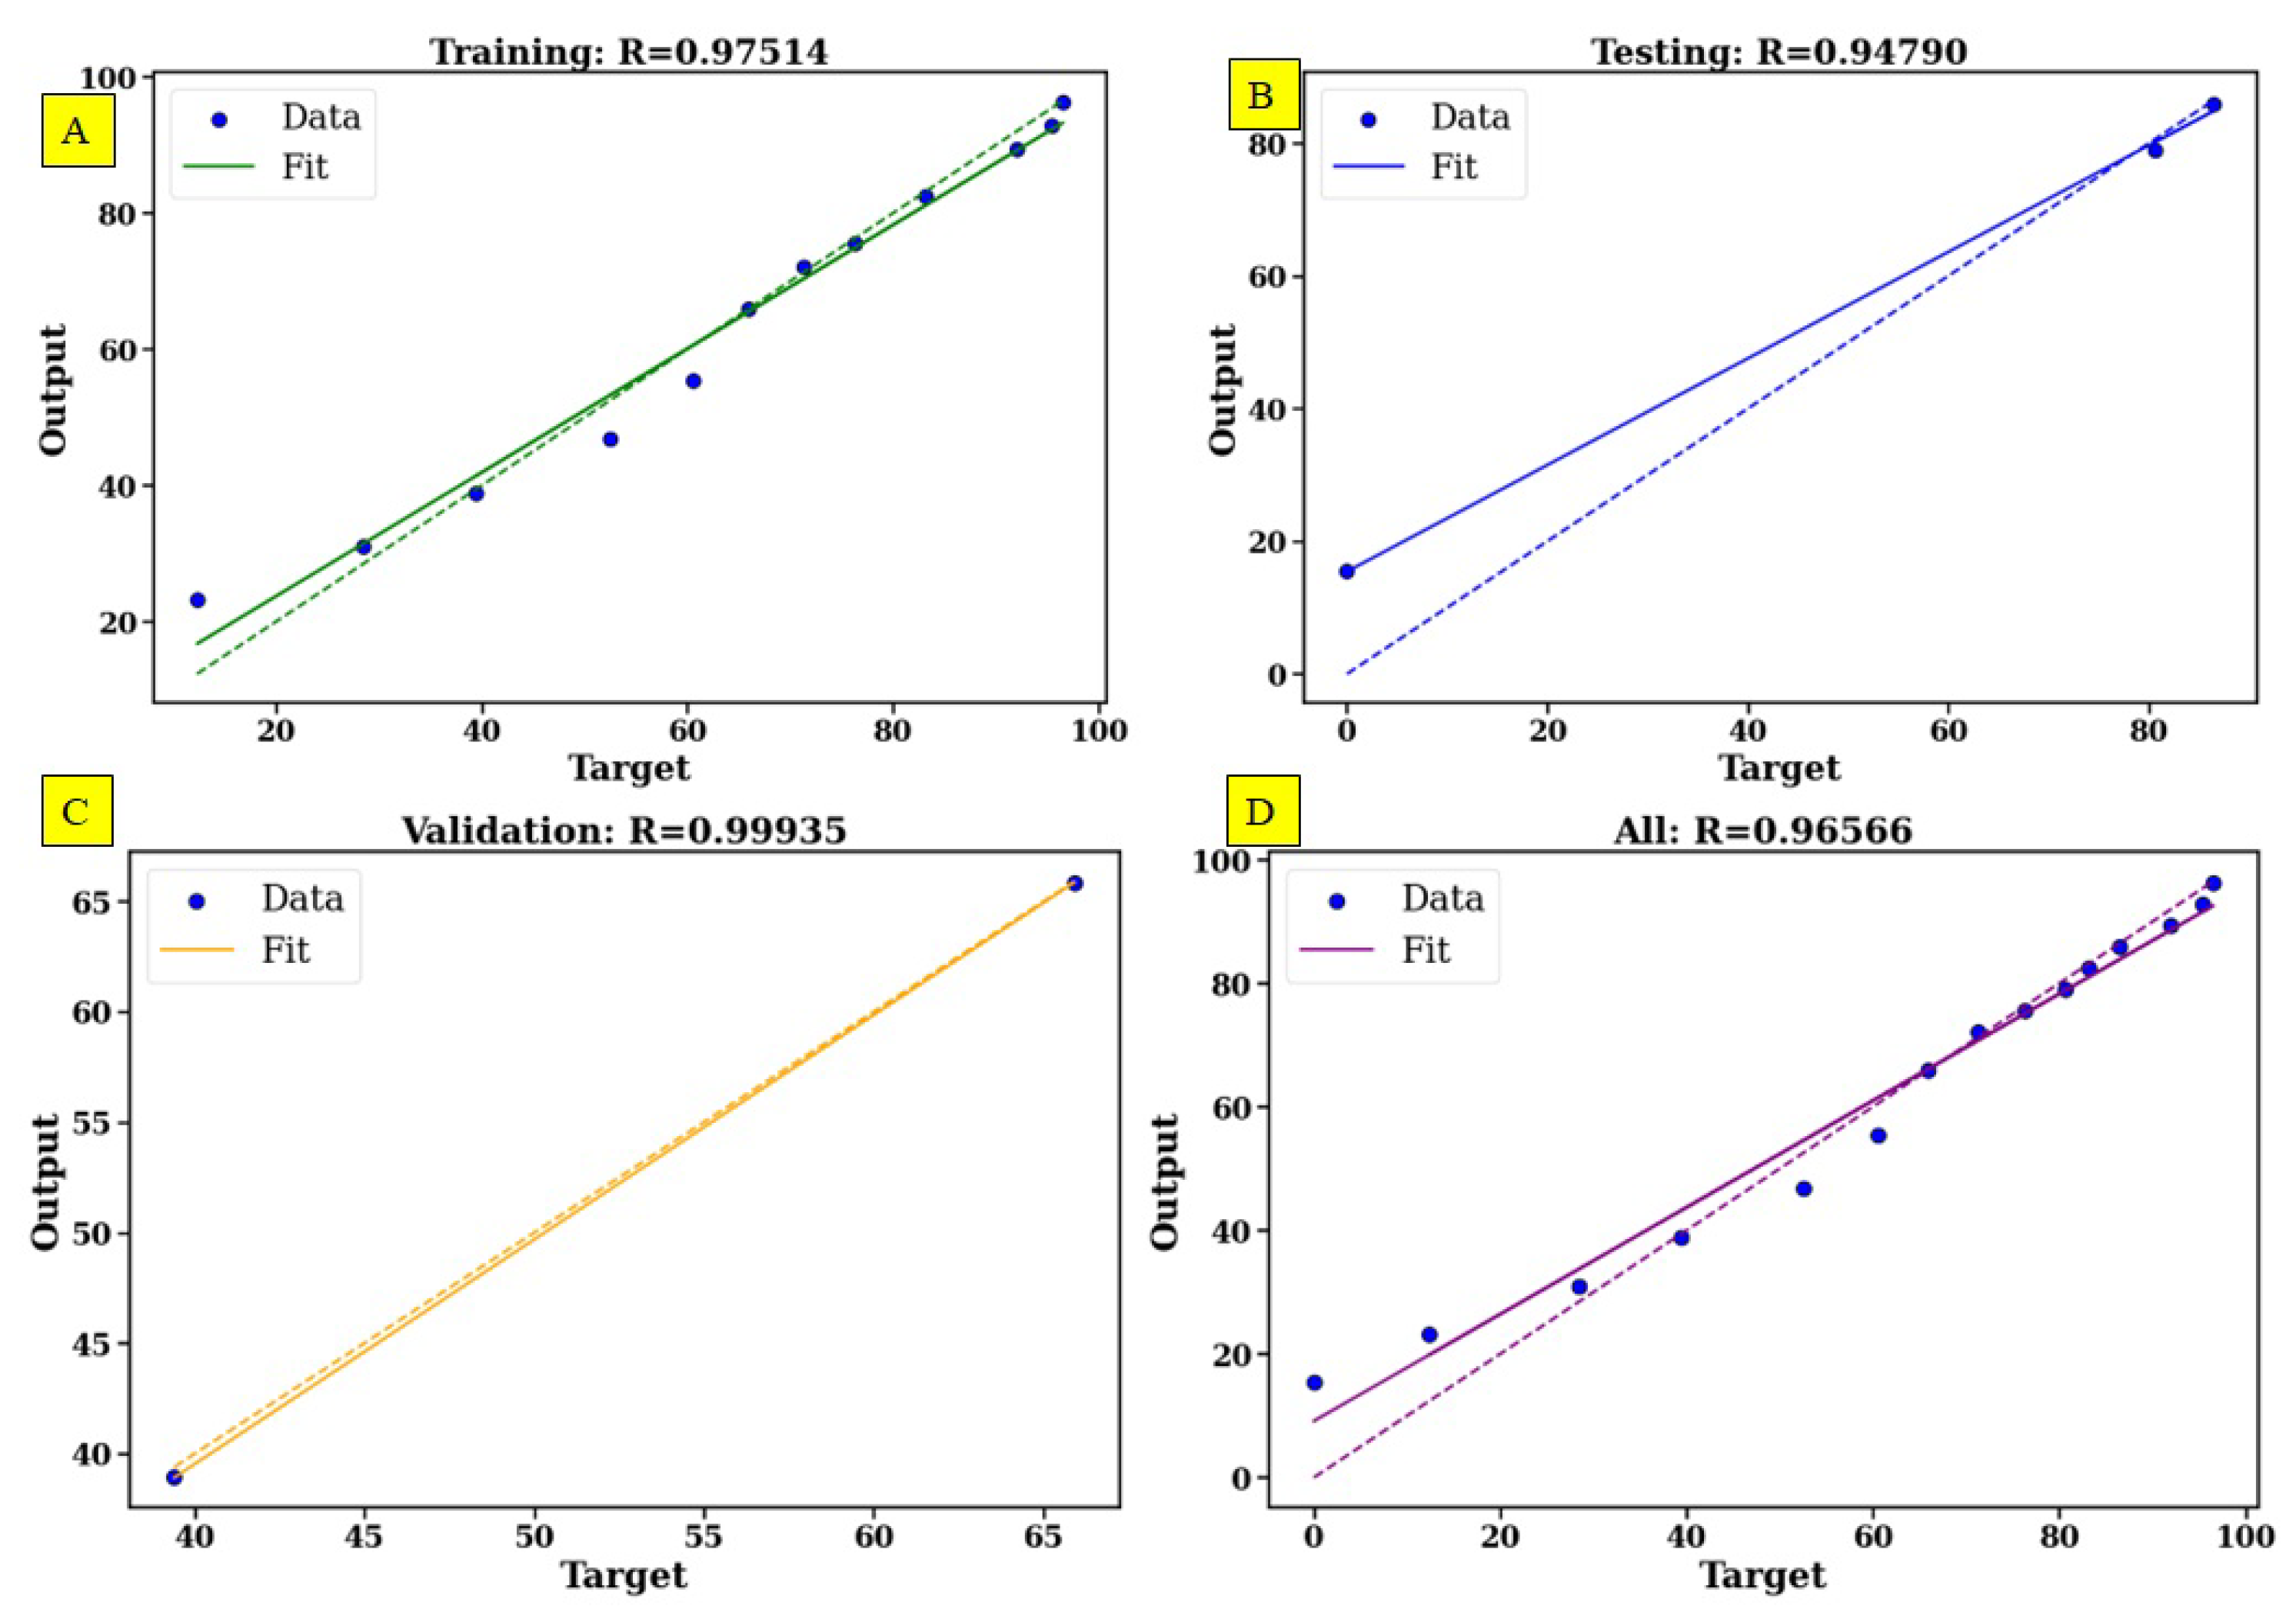
Figure 15.
Figure shows the Langmuir-Hinshelwood (L-H) kinetic model, with experimental and theoretical reaction rates plotted against concentration (A, B) and between each other (C), demonstrating a good fit with R2 values ranging from 0.86 to 0.98.
Figure 15.
Figure shows the Langmuir-Hinshelwood (L-H) kinetic model, with experimental and theoretical reaction rates plotted against concentration (A, B) and between each other (C), demonstrating a good fit with R2 values ranging from 0.86 to 0.98.
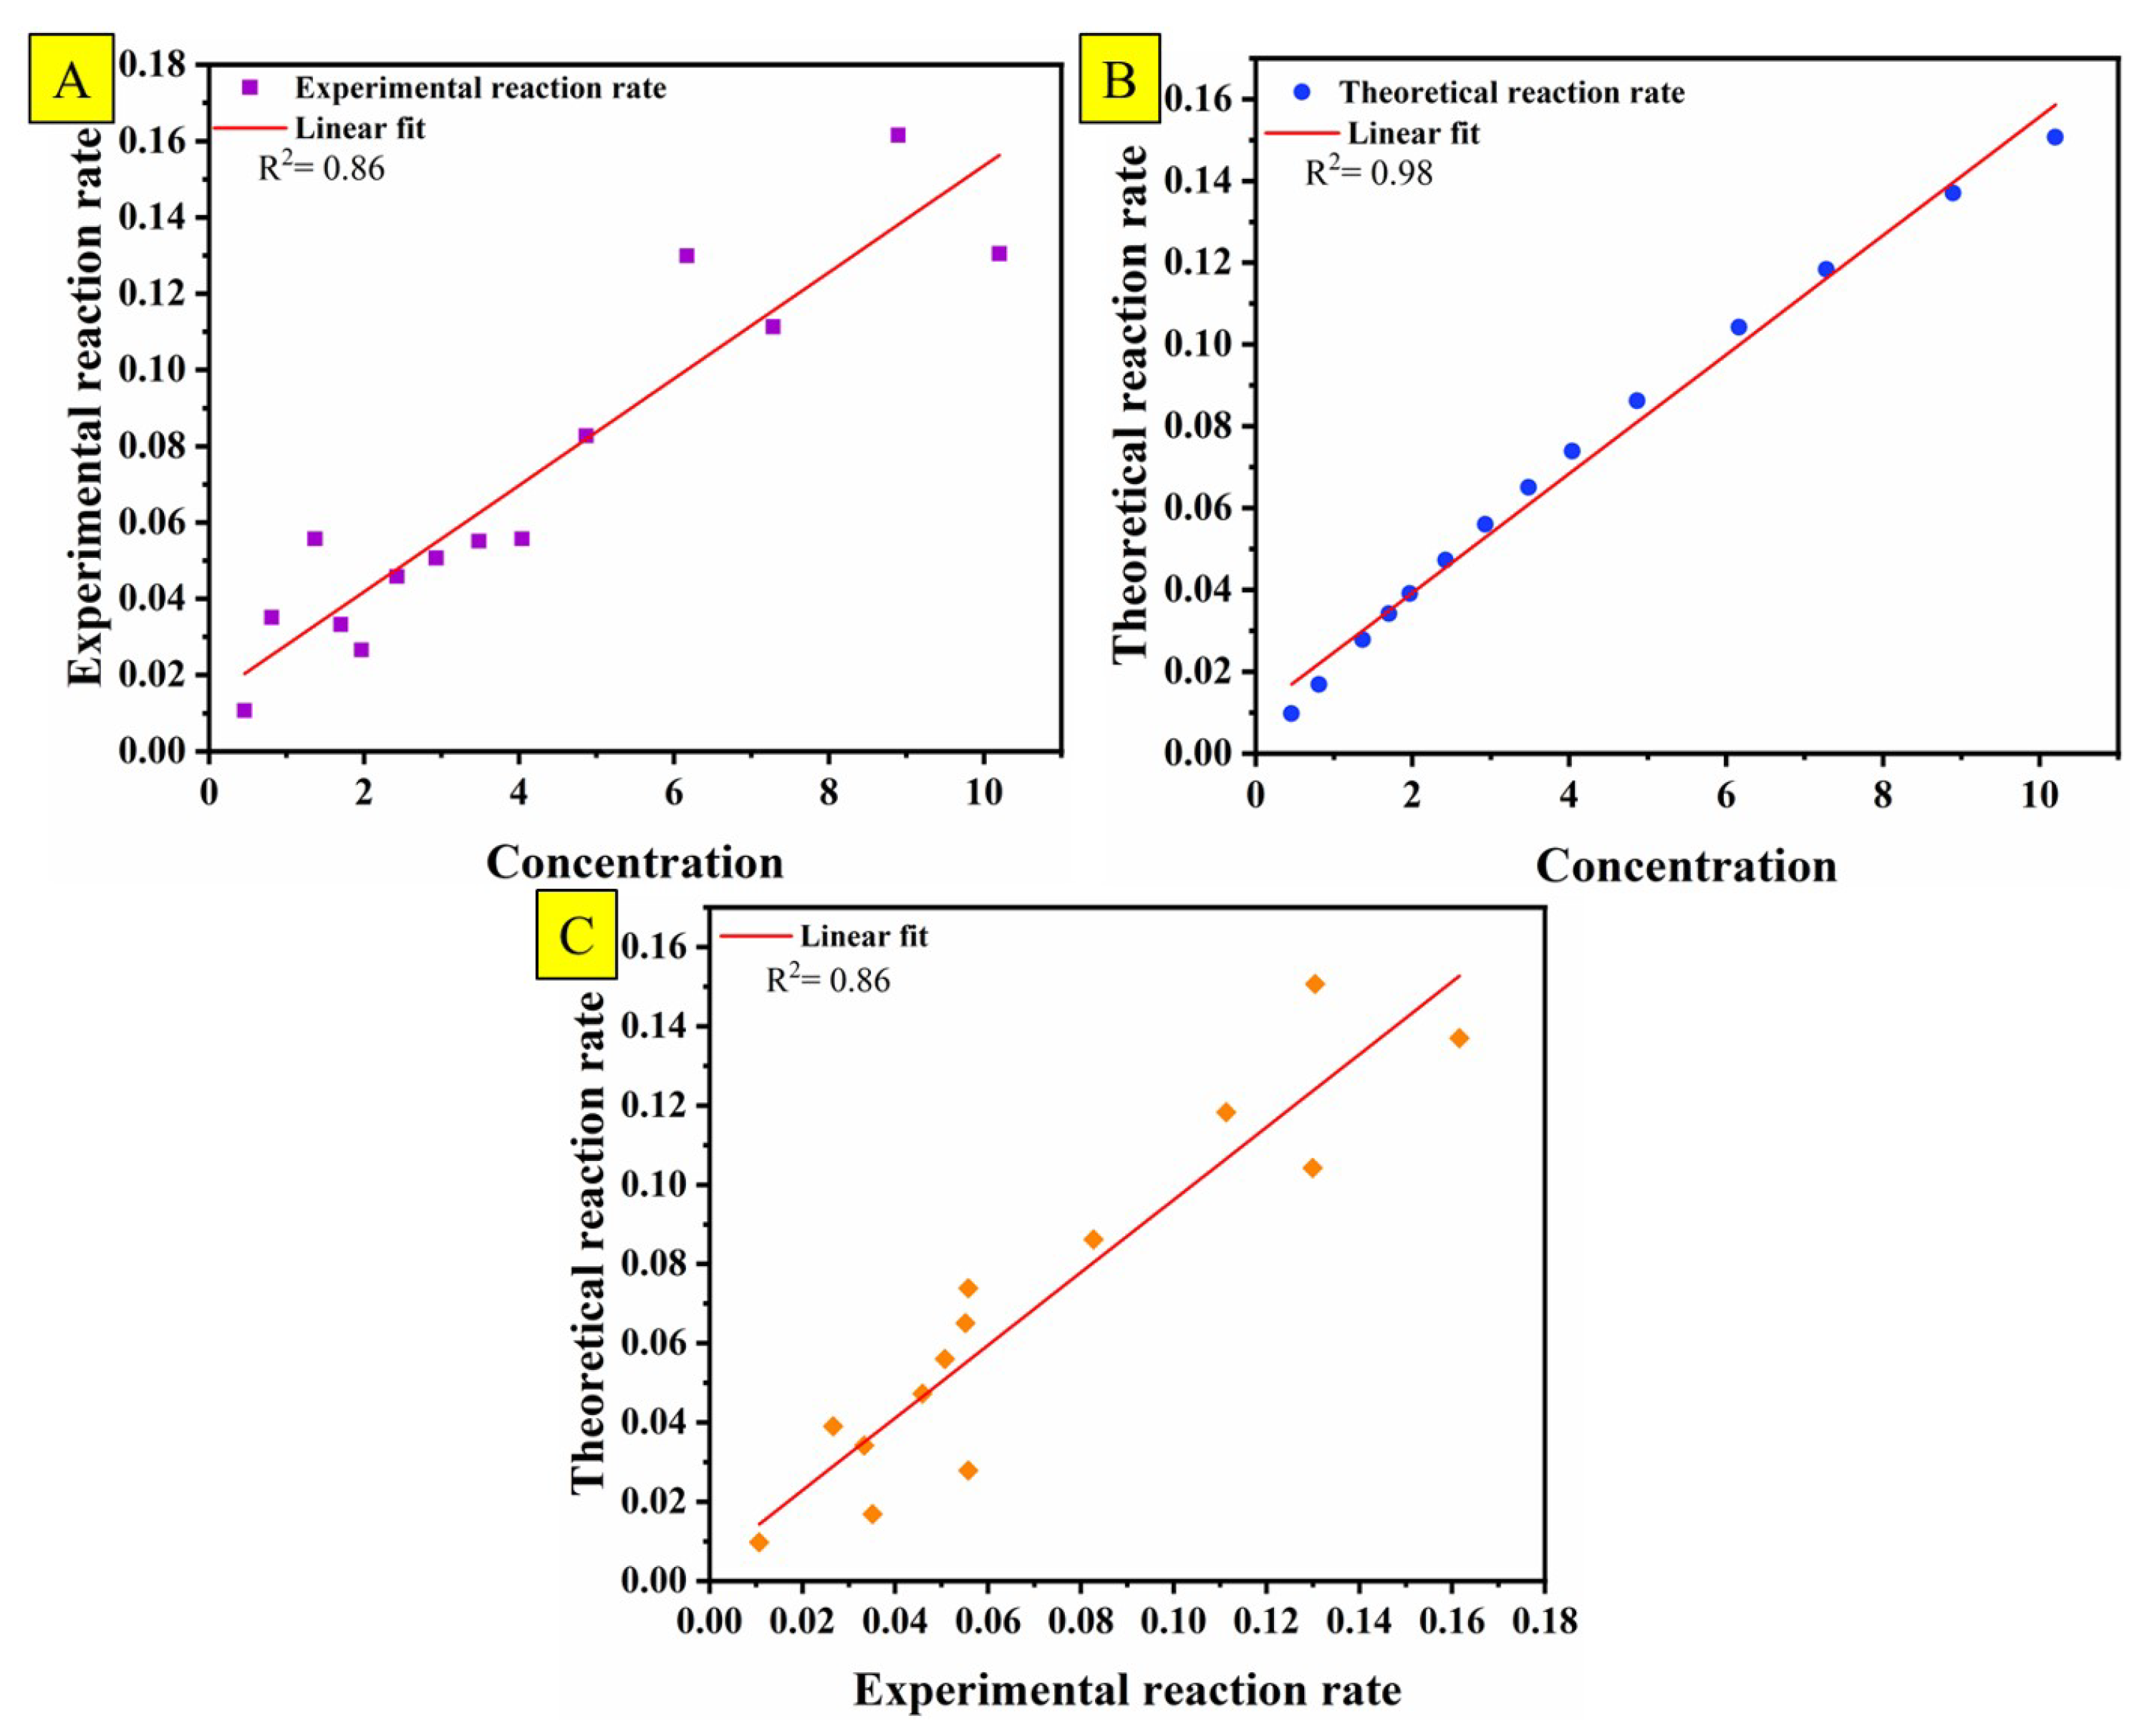

Table 1.
Comparison of the various techniques.
| Materials | Catalyst | Contaminant | M=Catalyst/MB ratio | Removal efficiency(%) | Time (min) | Reference |
|---|---|---|---|---|---|---|
| PCN-250 (500 PPM) | MB (15 PPM) | 33.3 | 88 | 720 | Kirchon et al. [42] | |
| PCN-250 (500 PPM) | MB (15 PPM) | 33.3 | 100 | 720 | Kirchon et al. [42] | |
| MIL-100 | (1000 PPM) | MB (500 PPM) | 2.0 | 42 | 230 | Lv et al. [43] |
| Fe | MIL-100 (1000 PPM) | MB (500 PPM) | 2.0 | 94 | 230 | Lv et al. [43] |
| (1000 PPM) | MB (500 PPM) | 2.0 | 59 | 230 | Lv et al. [43] | |
| MIL-100 | (1000 PPM) | MB (500 PPM) | 2.0 | 95 | 230 | Lv et al. [43] |
| Fe | MIL-100 (1000 PPM) | MB (500 PPM) | 2.0 | 85 | 230 | Lv et al. [43] |
| (1000 PPM) | MB (500 PPM) | 2.0 | 61 | 230 | Lv et al. [43] | |
| Fe-Pt | Fe-Pt (5 ppm) | MB (5 ppm) | 1.0 | 90 | 90 | Hsieh et al. [21] |
| (500 ppm) | MB (5 ppm) | 100 | 55 | 90 | Hsieh et al. [21] | |
| PS-Pt | Pt (5 PPM) | MB (3.2 ppm) | 1.5 | 86 | 110 | This study |
Disclaimer/Publisher’s Note: The statements, opinions and data contained in all publications are solely those of the individual author(s) and contributor(s) and not of MDPI and/or the editor(s). MDPI and/or the editor(s) disclaim responsibility for any injury to people or property resulting from any ideas, methods, instructions or products referred to in the content. |
© 2025 by the authors. Licensee MDPI, Basel, Switzerland. This article is an open access article distributed under the terms and conditions of the Creative Commons Attribution (CC BY) license (http://creativecommons.org/licenses/by/4.0/).
Copyright: This open access article is published under a Creative Commons CC BY 4.0 license, which permit the free download, distribution, and reuse, provided that the author and preprint are cited in any reuse.


