Submitted:
26 July 2025
Posted:
28 July 2025
You are already at the latest version
Abstract
The Okefenokee is a fire-adapted swamp located in the Southeastern United States. The Okefenokee experiences varying degrees of wildfire severity, which can alter long-term vegetation dynamics. Despite frequent fires in the wildlife refuge, no study has modeled long-term vegetation recovery across multiple events using satellite time series. Our goal was to assess the long-term impacts of repeated fire on vegetation dynamics using satellite-derived indices and use a generalized additive mixed model. Landsat-derived dNBR was used to assess fire severity across 99 sites. Vegetation indices were retrieved from peak growing seasons, and recovery trajectories were modeled by severity class and site characteristics. Pre-fire conditions, cumulative fire history, and fire severity were all found significant in the NDVI model, which was the most accurate predictor out of the models tested–NDMI, EVI, and NDVI. High severity sites also recovered slower and less complete than moderate and low-severity sites. Vegetation recovery plateaued in the model after 10-12 years. This study can be used as a scalable framework for monitoring wetland fire recovery in the Okefenokee and can support adaptive fire management with additional research. Additional research may focus on integrating hydrological data and field validation to enhance understanding of post-fire wetland recovery.
Keywords:
remote sensing
; okefenokee swamp
; post-fire vegetation recovery
; generalized additive mixed models
Introduction
Wetlands are recognized globally as important for sequestration of carbon, transformation of nutrients, and are centers for diversity (Mitsch and Gosselink 2015). Fire is a natural driver for ecological change in a peat-dominated wetland such as the Okefenokee which is in South Georgia of the United States. Drought can lower water tables and set the stage for large, high severity burns (Yin 1993). As a result, the recovery of the ecosystem is left in the minds of many.
The Okefenokee Swamp is one of the world’s largest intact peat wetlands, encompassing about 150,319 ha (USFWS 2022). Extreme fire events remain episodic such as the Georgia bay complex of 2007 which burned about 300,000 ha total, and the West Mims Fire of 2017 which burned 59,000 ha. Long-term records show that fire consume more than 50% of the swamp have return intervals of more than 100 years and are tightly coupled to water-level lows (Yin 1993).
Post-fire vegetation recovery is strongly influenced by burn severity and hydroperiod, as demonstrated in Argentina’s Paraná River Delta marsh where post-fire plant cover varied strongly (Salvia et al. 2012). In an Everglades study, green-up timings and pathways were influenced by similar factors (Bruland & Richardson, 2009). Additionally, soil characteristics, hydrology, biodiversity, and ecosystem functioning have been shown to affect post-fire recovery (Salvia et al. 2012; Bruland & Richardson 2009). Furthermore, wading birds are attracted to burned marshes and the endangered flatwood salamanders depend on open, fire-maintained pond margins (Venne and Frederick 2012; USFWS 2021).
Few studies have assessed vegetation recovery beyond immediate post-fire years. Studies pertaining to fire severity have focused on the effects of vegetation types on fire behavior. For instance, Ross et al. (2024) used Landsat-derived dNBR to assess burn severity following 2017 West Mims Fire; however, they focused on short-term effects rather than long-term recovery. To our knowledge, there has been no published study used long-term Landsat data to quantify multi-decadal vegetation trajectories across repeated fire in this peat-dominated wetland.
Here, we address that gap by (i) quantify fire severity for 99 sites from 2004 to 2024 with differenced Normalized Burn Ratio (dNBR), a metric validated for detecting canopy and soil consumption across diverse ecosystems (Key and Benson 2006) , and (ii) modeling vegetation recovery using peak-season NDVI, EVI, and NDMI time-series in generalized additive models (GAMMs). By linking recovery rates to severity class, hydro-edaphic setting, and fire history, our study delivers the first landscape-scale assessment of long-term post-fire resilience in the Okefenokee.
Methods
2.1. Study Area
The study was conducted within the Okefenokee Swamp which is a large peat-forming wetland in southern Georgia, USA spanning 162,000 ha. In the Okefenokee ecosystem, fire is a frequent disturbance and plays a key role in shaping vegetation dynamics as well as resetting successional stages.
A rectangular area was used for the study within the central portion of the swamp and was selected for analysis. The selected area was chosen based on historical fire activity and is bounded by the following geographic coordinates:
Northwest: [-82.4124, 30.8154]
Southwest: [-82.4124, 30.662]
Southeast: [-82.1625, 30.662]
Northeast: [-82.1625, 30.8154]
2.2. Fire Event and Site Selection
Sites were selected using a 10 by 12 grid across the study area, creating 120 sites. A MODIS-based fire mask was used to identify sites that had experienced fire(s) from 2004 to 2024. To avoid open water influence, a water mask was applied using the JRC dataset to ensure the site was 90 meters away from permanent water. Stratified random sampling was applied using sample seed 42 for reproducibility. Each site sampled its data with a 90-meter buffer point, and mean vegetation index and dNBR values of the area. Fire event data was collected using the MODIS Burned Area product within Google Earth Engine (GEE). For each site, we checked each month to verify if a fire had occurred.
2.3. Remote Sensing Data Sources
Multiple Datasets from Google Earth Engine were used. MODIS Burned area (MODIS/006/MCD64A1) was used for Fire event detection. Landsat 5 (2004-2010), Landsat 7 (2011-2013), and Landsat 8 (2013- 2024) were used for vegetation indices (NDVI, NDMI, and EVI) and fire severity (dNBR). The LANDFIRE existing vegetation type 2020 (LANDFIRE/US_140/EVT/v1_4_0) was determined for each site. Precipitation was collected for each site using CHIRPS Daily precipitation for annual precipitation summaries per site using spatial snapping applied to align grid resolution with Landsat-scale buffers. USGS SRTM (USGS/SRTMGL1_003) was used for elevation and slope for each site.
2.4. Preprocessing and Compositing
All Landsat surface reflectance imagery (Landsat 5 TM, 7 ETM+, and 8 OLI) was obtained from the Google Earth Engine (GEE) platform, using Tier 1 Collection 2 Level 2 data. The data underwent preprocessing to retain consistency. Atmospheric contamination such as clouds and shadows was masked using the QA_Pixel band. Cloud and shadow pixels were identified based on bitwise flags: bit 3 (cloud) and bit 4 (cloud shadow) then masked to ensure only clear-sky observations. Snow pixels (bit 5) were also removed although rare in the study region. Reflectance scaling was applied using “.multiply(0.0000275).add(-0.2)”.
Landsat 5/7 : Red = SR_B3, NIR = SR_B4, SWIR1 = SR_B5, Blue = SR_B1
Landsat 8: Red = SR_B4, NIR = SR_B5, SWIR1 = SR_B6, Blue = SR_B2
*Sensor specific band assignments.
Each band was correctly matched based on the satellite used in order to account for different sensor identification. Landsat 5 and 7 used SR_B3, B4, and B5. Landsat 8 used SR_B4, B5, and B6.
2.5. Fire Severity Assessment
dNBR=NBRpre −NBRpost
*Differenced Normalized Burn Ratio (dNBR) equation.
NBR=(NIR+SWIR)/(NIR−SWIR)
* Normalized Burn Ratio (NBR) equation.
Fire severity was quantified using differenced Normalized Burn Ratio (dNBR). This is a standard remote sensing metric derived from pre- and post-fire Landsat surface reflectance images (Key & Benson 2006). For each fire event detected by the MODIS burned area (MCD64A1), a pre-fire composite was constructed from imagery 1 year before the fire event and spanning the same months as the fire event. A post-fire composite was created from imagery 1-3 months after the burn. With sensor-specific adjustments, NBR was calculated using near-infrared (NIR) and shortwave-infrared (SWIR) bands. DNBR values were then extracted for each site and classified into severity classes using dNBR fire severity thresholds from Key & Benson (2006): low (0.1–0.27), moderate (0.27–0.44), and high (>0.44). Vegetation recovery trajectories were then created using these value inputs.
2.6. Vegetation and Time Series
NDVI = (NIR − Red) / (NIR + Red)
NDMI = (NIR − SWIR1) / (NIR + SWIR1)
EVI = 2.5 × (NIR − Red) / (NIR + 6 × Red − 7.5 × Blue + 1)
Normalized Differential Vegetation Index (NDVI), Normalized Difference Moisture Index (NDMI), and Enhanced Vegetation Index (EVI) were used to assess vegetation recovery. To minimize variability, seasonal composting was applied using the peak growing season of the region – April to August. The peak growing season corresponds to maximum photosynthetic activity in the southeastern U.S wetlands (Zhou et al., 2023). All vegetation indices derived from 90-meter buffer points from surface reflectance Landsat imagery using qualityMosaic() to select the greenest available observation per pixel and reduce the impact of cloud contamination (Roy et al. 2016). One peak value was collected for each index for each site from 2004 to 2024 for modeling.
2.7. Statistical Modeling
Statistical modeling was used to assess post-fire vegetation recovery over time for each index (NDVI, NDMI, EVI). Generalized Additive Mixed Models (GAMMs) were used to flexibly model nonlinear recovery patterns with each index modeled separately.
Predictors include:
- dNBR class (Categorical: low, moderate, high)
- pre-fire NDVI, NDMI, and EVI
- Elevation
- LANDFIRE ecological vegetation type (EVT code)
- cumulative dNBR
- Time since fire (continuous)
Smoothing terms were applied to time since fire event and stratified by severity class using the interaction form “s(time_since_fire, by = dnbr_class).” This allowed the model to capture different recovery curves for each severity level. Smooths were implemented using thin-plate regression splines with a basis dimension limited to K = 5 to avoid overfitting.
NDVI ~ dnbr_class + cumulative_dNBR + pre_fire_NDVI + pre_fire_NDMI + pre_fire_EVI + elevation + evt_code + s(time_since_fire, by = dnbr_class)
*Structure of the NDVI recovery model using Generalized Additive Mixed Models (GAMMs)
To account for repeated observations at each site across multiple years, site ID was included as a random intercept using the gamm() function from the mgcv package in R (Wood, 2017), with random effects handled via the nlme package.
2.8. Validation and Accuracy Assessment
Model performance was assessed using root mean squared error (RMSE), mean absolute error (MAE), and R² for each model. Using custom loops, Leave-one-site-out (LOSO) cross-validation was implemented in R to evaluate the generalizability of each model across spatially independent sites. Residuals were examined for normality, heteroscedasticity, and spatial autocorrelation using Moran’s I based on geographic coordinates for each site. Given that the NDVI model consistently outperforms NDMI and EVI in predictive accuracy (RMSE, MAE, R²), it will be emphasized when interpreting recovery dynamics (see Section 3.2).
2.9. Software and Tools
Google Earth Engine (GEE) was used for satellite image preprocessing, index calculation, and dNBR analysis. All statistical modeling, data integration, and visualization of figures, and tables were done using R studio (v4.1). Key R packages included mgcv for generalized additive modeling, nlme for mixed-effects structures, spdep for spatial autocorrelation analysis (e.g., Moran’s I), and ggplot2 for data visualization. Data organization and preprocessing relied on dplyr, tidyr, purrr, and readr. All modeling and processing were performed on a standard laptop running windows 11 with cloud resources used via the GEE code editor interface.
Results
3.1. Overview of Data Distribution
The dataset from 2004 to 2024 had 5352 site-year observations. Most site-year observations fell into the low severity class, with fewer observations persisting beyond 10 years (Table 1). Vegetation recovery was monitored for up to 19 years post-fire. Across the study period, most sites had one to three fires with a maximum of seven fire years observed at a single site (Figure 1).
3.2. Vegetation Recovery Patterns by Index
Vegetation recovery patterns varied by index and burn severity class over the 20-year post-fire period. All three indices increased within the first decade following the fire, with trajectories stabilizing or plateauing afterwards (Figure 2). While all three vegetation indices revealed consistent post-fire recovery trajectories, we will place emphasis on NDVI due to its more accurate model performance during cross validation (Section 2.8). GAMM smooth terms and parametric coefficients show that severity class significantly influenced vegetation recovery despite the overlap in 95% confidence intervals (Table 2, Table 3, Table 4 and Table 5).
Across all indices, recovery for high-severity burns had slower and less complete recovery compared to moderate and low severity classes. For NDVI, while all severity classes converged over time, early divergence was statistically significant (Table 2). EVI patterns peaked within the first decade after the fire declined slightly thereafter. NDMI recovery patterns showed an initial rise in canopy moisture during years 1 to 7 post-fire.
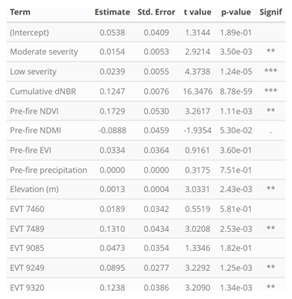
3.3. Model Predictors and Fixed Effects
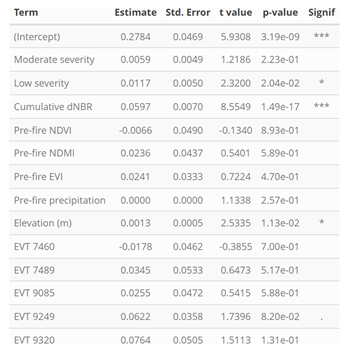
Across all models (NDVI, NDMI, and EVI), there were several fixed effects that were statistically significant, with the NDVI model having the most significant factors. Fire severity class was a significant predictor for NDVI and NDMI models (p < 0.001), with “high” severity serving as the reference category. In the NDVI model, both “moderate” and “low” severity classes were associated with higher greenness. NDMI and EVI models also showed positive coefficients for severity, and the effect sizes were smaller relative to the NDVI model (Table 2, Appendix A and B).
Cumulative dNBR, representing long-term fire exposure, was significant in all models with the largest effect in NDVI (estimate = 0.1399, p < 0.001). Pre-fire NDVI, NDMI, and EVI parameters were all significant in the NDVI model, while only pre-fire NDVI was significant in the NDMI model (Table 2; see Appendix B and C). A negative coefficient was associated with pre-fire NDMI, and pre-fire precipitation was significant only in the NDVI model. Elevation had a positive and significant effect on all three models.
Existing Vegetation Type (EVT) was retained as a factor in all models. Several EVT categories were significantly associated with NDVI and EVI outcomes (e.g., EVT 9320 in NDVI, p = 0.0061), while fewer EVT categories reached significance in the NDMI model.
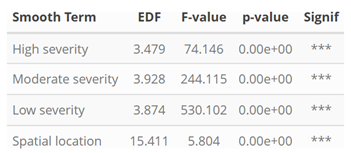
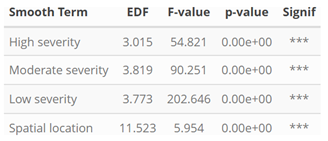
3.4. Smooth Terms and Spatial Effects
The GAM models included smooth terms for time since fire (by severity class) and for spatial location (Table 3; see Appendix C and Appendix D). All smoothing terms were statistically significant (p < 0.001) based on F-tests. Spatial effects were modeled using two-dimensional splines over geographic coordinates.
In addition to the smooth terms, maps of the site-level random intercepts were created to explore spatial variation in baseline recovery. Figure 3 displays continuous random effect values from the NDVI model with shading indication of the degree of deviation from the model mean. Figure 4 shows the distribution of fire years per site. Fire year frequency was highest in the southern and western regions.
3.5. Cross-Validation and Model Performance
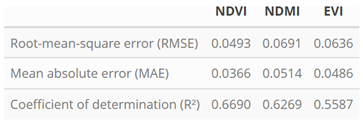
Model performance was evaluated using leave-one-site-out (LOSO) cross-validation. This method involves iteratively excluding one site from training data and predicting its values using the trained model on the remaining sites. LOSO and predictive accuracy were assessed on each model by using Root Mean Squared Error (RMSE), Mean Absolute Error (MAE), and Coefficient of Determination (R²). Results from the LOSO validation and the full model fit are provided in Table 6 and Table 7. NDVI exhibited lower RSME and MAE values, while NDMI had the highest R² in the LOSO cross-validation.
3.6. Residual Diagnostics and Spatial Autocorrelation
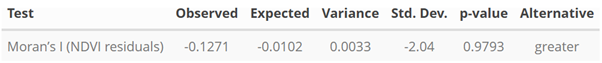
Model residuals were summarized to assess overall model fit and error distribution. The NDVI model residuals ranged from –0.22 to 0.59 (mean ≈ –0.0025), NDMI model residuals ranged from –0.46 to 0.22 (mean ≈ –0.0023), and the EVI model residuals ranged from –0.29 to 0.24 (mean ≈ 0.0015). Using Moran’s I test with 20 nearest neighbors, spatial autocorrelation of NDVI residual was assessed and yielded no significant spatial clustering (observed I = -0.1271, expected I = -0.0102, p = 0.9793; Figure 5; see Appendix E). EVI and NDMI models were not evaluated due to their comparatively lower predictive performance.
Discussion
Key findings suggest fire severity to be a strong predictor of vegetation recovery. NDVI showed the lowest overall error metrics and highest predictive accuracy, making it the most reliable indicator of recovery in comparison to the other models tested. Pre-fire conditions such as pre-NDMI, pre-EVI, and cumulative fire history were shown to influence recovery. Spatial analysis also detected geographic variability with frequent fire years in the southern and western regions of the study area.
Prior research also found severity to be a primary driver of recovery. Salvia et al. (2012), for instance, demonstrated that both burn severity and water depth significantly influenced post-fire recovery and similarly, Ross et al. (2024) investigated burn severity after the 2017 West Mims fire. The present research expands prior studies by analyzing the long-term recovery across multiple fire events by using GAMMs over two decades. The results indicate areas affected by high-severity fires demonstrated slower and less complete recovery. Due to ecological memory and pre-fire conditions which have been observed affecting post-fire recovery (Johnstone et al., 2016). Likewise, significant effects of pre-fire NDVI, NDMI, and EVI were observed. While many previous studies have emphasized hydroperiods and water management and found strong links to vegetation recovery, our study did not directly measure this variable; we instead focused on cumulative severity from fires (Bruland & Richardson, 2009). However, precipitation values from the previous year were used as a predictor and although they were considered statistically significant, their effect size (estimate = -0.0001 per mm; Table 2) was found to be negligible. The present study provides the first long-term, multi-fire analysis in the Okefenokee, and contributes to a landscape-scale remote sensing perspective on wetland fire resilience.
All vegetation indices showed similar recovery patterns with initial increases, then plateaued after 10 to 12 years. Recovery from higher severity fires caused slower and less complete; potential explanations include organic matter, bare mineral soil, hydrology disruption, or deep-rooted vegetation mortality. As described above, legacy effects — pre-fire NDVI, EVI and NDMI—were found to be significant. This supports ecological memory and suggests resilience is partially pre-determined by site conditions. In addition, divergence was observed between indices. NDVI was the most accurate overall and is based only on long-term greenness while NDMI captured canopy moisture and EVI captured structural/biomass change. NDMI and EVI exhibited lower predictive power which could be attributed to more complex responses. Some possible causes are post-fire succession, species turnover, or short-term variability in canopy and moisture composition, which are factors not directly captured by greenness alone. Another notable observation is that recovery curves plateaued after 10-12 years for all models and could indicate vegetation reaching a new equilibrium, species turnover, slowing of succession, or alternative stable states/persistent impact. The patterns observed could be related to complex post-fire recovery trajectories shaped by burn severity, vegetation legacy, and potential feedback from prior disturbances.
Understanding long-term post-fire recovery can be useful for effective fire management, habitat protection, and resilience planning for the Okefenokee. As noted above, high severity fires have long lasting impacts. Prescription burns and hydrological management could reduce the chance of severe burns. The USFWS cites their goal to reduce the risk of catastrophic wildfire in the Okefenokee. Cumulative fire history can be used to reduce this risk by considering and informing rotational planning for prescription burn units. Recovery models can also support post-fire monitoring for predicting recovery timelines and identifying outliers that need intervention. Finally, elevation and certain existing vegetation types were found to be statistically significant. Although elevation had a minimal impact on the relatively flat Okefenokee. Also, vegetation types could be made more accurate with updated data for each year, not just one dataset, Land Fire 2020.
While the study yields novel insights, several methodological and data limitations should be acknowledged. One of these limitations is the MODIS fire product has a coarse resolution of 500 meters - especially when compared to the 90-meters buffer zones. The coarse resolution of MODIS may result in missing smaller or low intensity fires going undetected. Additionally, the product’s monthly time stamps can conflate multiple distinct fire events. To address this, fire frequency is aggregated annually; however, multiple fire events occurring at one site might be missed and generalized as a fire year. Another issue encountered was Landsat’s temporal range, which is every 2 weeks, resulting in 2 images per month. If both images are cloud contamination, both images are rendered unusable, affecting the continuity of observations. Another limitation was Landsat 7’s data quality issues. Landsat 7’s satellite imagery was used from 2011 to 2013 to cover the data gap between Landsat 5 and 8. However, the satellite’s scan line corrector malfunctions and generates imagery gaps which cause up to 22% of data to be lost per scene. Compositing techniques and quality masking were used to reduce the impact of this error, although the issue still may have affected vegetation index values or fire severity estimates. Peak-season compositing was also used to reduce noise and cloud contamination by providing a single value per year per site; Although this method ignores intra-annual variability and regrowth pulses, this could be a future research direction. Previous research, however, has established this approach as a reliable method for capturing long-term vegetation recovery trends across years in wetland ecosystems (Zhou et al., 2023). As previously stated, LANDFIRE EVT 2020 was applied across the entire 2004 to 2024 study period. This dataset fails to account for historical changes in vegetation across the 20-year period. LANDFIRE EVT 2020 was used because of time constraints and retained in the model based on the significance of EVT 9320. Even so, its significance may reflect temporal mismatches or inaccuracies. The limitations of the GAMMs is another caveat to consider. GAMMs is an method to capture nonlinear patterns but in doing so smooth out discrete shifts in ecological transitions. Furthermore, the use of site-level random effects improved the fit of the model, but did not explicitly explain any mechanisms. Despite limitations, the study offers a strong landscape-scale framework for understanding post-fire vegetation regeneration.
These limitations identify several opportunities for future improvements and directions for research. In terms of fire detection, an improved burned area product with an enhanced temporal and spatial resolution could benefit detecting small fires and multiple fires within one month. Additionally, field validation or species composition may improve model predictive performance and offer valuable ecological context to satellite-derived recovery patterns. Incorporating hydrology and water table data should also be considered as these variables are fundamental for wetlands. Finally, other modeling approaches (i.e., machine learning, or Bayesian hierarchical models) might yield useful insights as well as exploring other geographic scope or comparing to other fire prone wetlands may also prove worthwhile.
This study provides a novel, landscape-scale assessment of post-fire vegetation recovery in the Okefenokee Swamp using long-term remote sensing and statistical modeling. It includes the first multi-fire, multi-decade analysis of post-fire resilience by linking fire severity, vegetation legacy, and recovery trajectories. The results can be scaled and work as a framework for remote monitoring that supports adaptive fire and wetland management. These remote sensing approaches will be essential for enhanced large-scale decision making for sustaining fire-adapted wetland ecosystems.
Conclusion
This study aimed to assess the long-term effects of burn severity on vegetation recovery in the Okefenokee National Wildlife Refuge. Remote sensing and statistical modeling were used to quantify recovery trajectories across multiple fire events over a 20-year period. The results demonstrated that fire severity was a key driver of recovery and suggested that NDVI was the most reliable indicator out of the three models tested. The recovery of each site was also affected by pre-fire conditions, and fire history and spatial differences in fire frequency were detected. To our knowledge, this is the first landscape-scale level, multi-fire, long-term recovery model in the Okefenokee using satellite time series data and GAMMs. These findings can provide tools for land/fire management, inform adaptive management strategies, and monitor frameworks in fire-adapted wetland ecosystems. Future research addressing hydrological aspects and field validation will be critical for refining predictions of vegetation resilience in fire-prone wetlands.
Appendix A. Summary of Fixed Effects for NDMI Generalized Additive Model
Appendix B. Summary of Fixed Effects for EVI Generalized Additive Model
Appendix C. Estimated Smooth Terms for NDMI Model (Time Since Fire by Severity Class and Spatial Location
Appendix D. Estimated Smooth Terms for EVI Model (Time Since Fire by Severity Class and Spatial Location)
Appendix E. Moran’s Test for Spatial Autocorrelation in NDVI Model Residuals
References
- Becknell JM, Fernald RT, Mladenoff DJ. Limited influence of fire on vegetation structure and composition across multiple spatial scales in a southeastern U.S. wetland landscape. Ecosystems 2015, 18, 1210–1228. [Google Scholar]
- Bruland GL, Richardson CJ. Microbial and phosphorus dynamics in low nutrient Everglades peat soils after additions of exogenous phosphorus. Soil Science Society of America Journal 2009, 73, 1147–1156. [Google Scholar]
- Davies GM, Smith AA, Wright DR, Scaled MR. Fire history and severity drive vegetation trajectories in North American wetlands. Ecological Applications 2021, 31, e02272. [Google Scholar]
- Johnstone JF, Allen CD, Franklin JF, Frelich LE, Harvey BJ, Higuera PE, Mack MC, Meentemeyer RK, Metz MR, Perry GL, et al. Changing disturbance regimes, ecological memory, and forest resilience. Frontiers in Ecology and the Environment 2016, 14, 369–378. [Google Scholar] [CrossRef]
- Key CH, Benson NC. 2006. Landscape assessment: Ground measure of severity, the Composite Burn Index, and remote sensing of severity, the Normalized Burn Ratio. In: Lutes DC, Keane RE, Caratti JF, Key CH, Benson NC, Sutherland S, Gangi LJ, editors. FIREMON: Fire Effects Monitoring and Inventory System. Gen. Tech. Rep. RMRS-GTR-164-CD. Fort Collins (CO): USDA Forest Service, Rocky Mountain Research Station.
- Lentile LB, Holden ZA, Smith AMS, Falkowski MJ, Hudak AT, Morgan P, Lewis SA, Gessler PE, Benson NC. Remote sensing techniques to assess active fire characteristics and post-fire effects. International Journal of Wildland Fire 2006, 15, 319–345. [Google Scholar] [CrossRef]
- Loftin CS, Bried JT, Zydlewski JD. Evaluation of vegetation–fire dynamics in the Okefenokee National Wildlife Refuge with Bayesian belief networks. Wetlands 2018, 39, 495–510. [Google Scholar] [CrossRef]
- Mitsch WJ, Gosselink JG. 2015. Wetlands. 5th ed. Hoboken (NJ): John Wiley & Sons.
- Ratajczak Z, Carpenter SR, Ives AR, Kucharik CJ, Ramiadantsoa T, Stegner MA, Williams JW. Abrupt change in ecological systems: inference and diagnosis. Trends in Ecology & Evolution 2018, 33, 513–526. [Google Scholar] [CrossRef] [PubMed]
- Ross MS, Beckage B, Platt WJ. Wildfire severity to valued resources mitigated by prescribed fire in the Okefenokee National Wildlife Refuge. Remote Sensing 2024, 16, 4708. [Google Scholar] [CrossRef]
- Roy DP, Li J, Zhang H, Yan L, Huang H, Li Z, Tucker CJ. Landsat-8: Science and product vision for terrestrial global change research. Remote Sens Environ 2016, 185, 271–282. [Google Scholar] [CrossRef]
- Salvia R, Grondona MO, Balzaretti V, Mercado LM. Vegetation response to fire severity and water depth in South American wetlands. Wetlands Ecology and Management 2012, 20, 245–258. [Google Scholar]
- Turner MG, Romme WH, Gardner RH, Hargrove WW. Effects of fire size and pattern on early succession in Yellowstone National Park. Ecological Monographs 1997, 67, 411–433. [Google Scholar] [CrossRef]
- Venne LS, Frederick PC. Dry-season water levels influence wading bird nesting in the Okefenokee Swamp. The Wilson Journal of Ornithology 2012, 124, 343–349. [Google Scholar]
- Westerling AL, Hidalgo HG, Cayan DR, Swetnam TW. Warming and earlier spring increase western US forest wildfire activity. Science 2006, 313, 940–943. [Google Scholar] [CrossRef] [PubMed]
- Wood, K. Fire management in the Okefenokee National Wildlife Refuge: Lessons from the 2007 and 2011 wildfires. Fire Management Today 2017, 77, 18–25. [Google Scholar]
- Zhou Y, Wullschleger SD, Shuman JM, Ricciuto DM, Xia J, Walker AP. Seasonal photosynthesis dynamics in southeastern U.S. wetlands derived from satellite remote sensing. Remote Sens Environ 2023, 286, 113446. [Google Scholar]
Figure 1.
Distribution of fires years per site from 2004 to 2024.
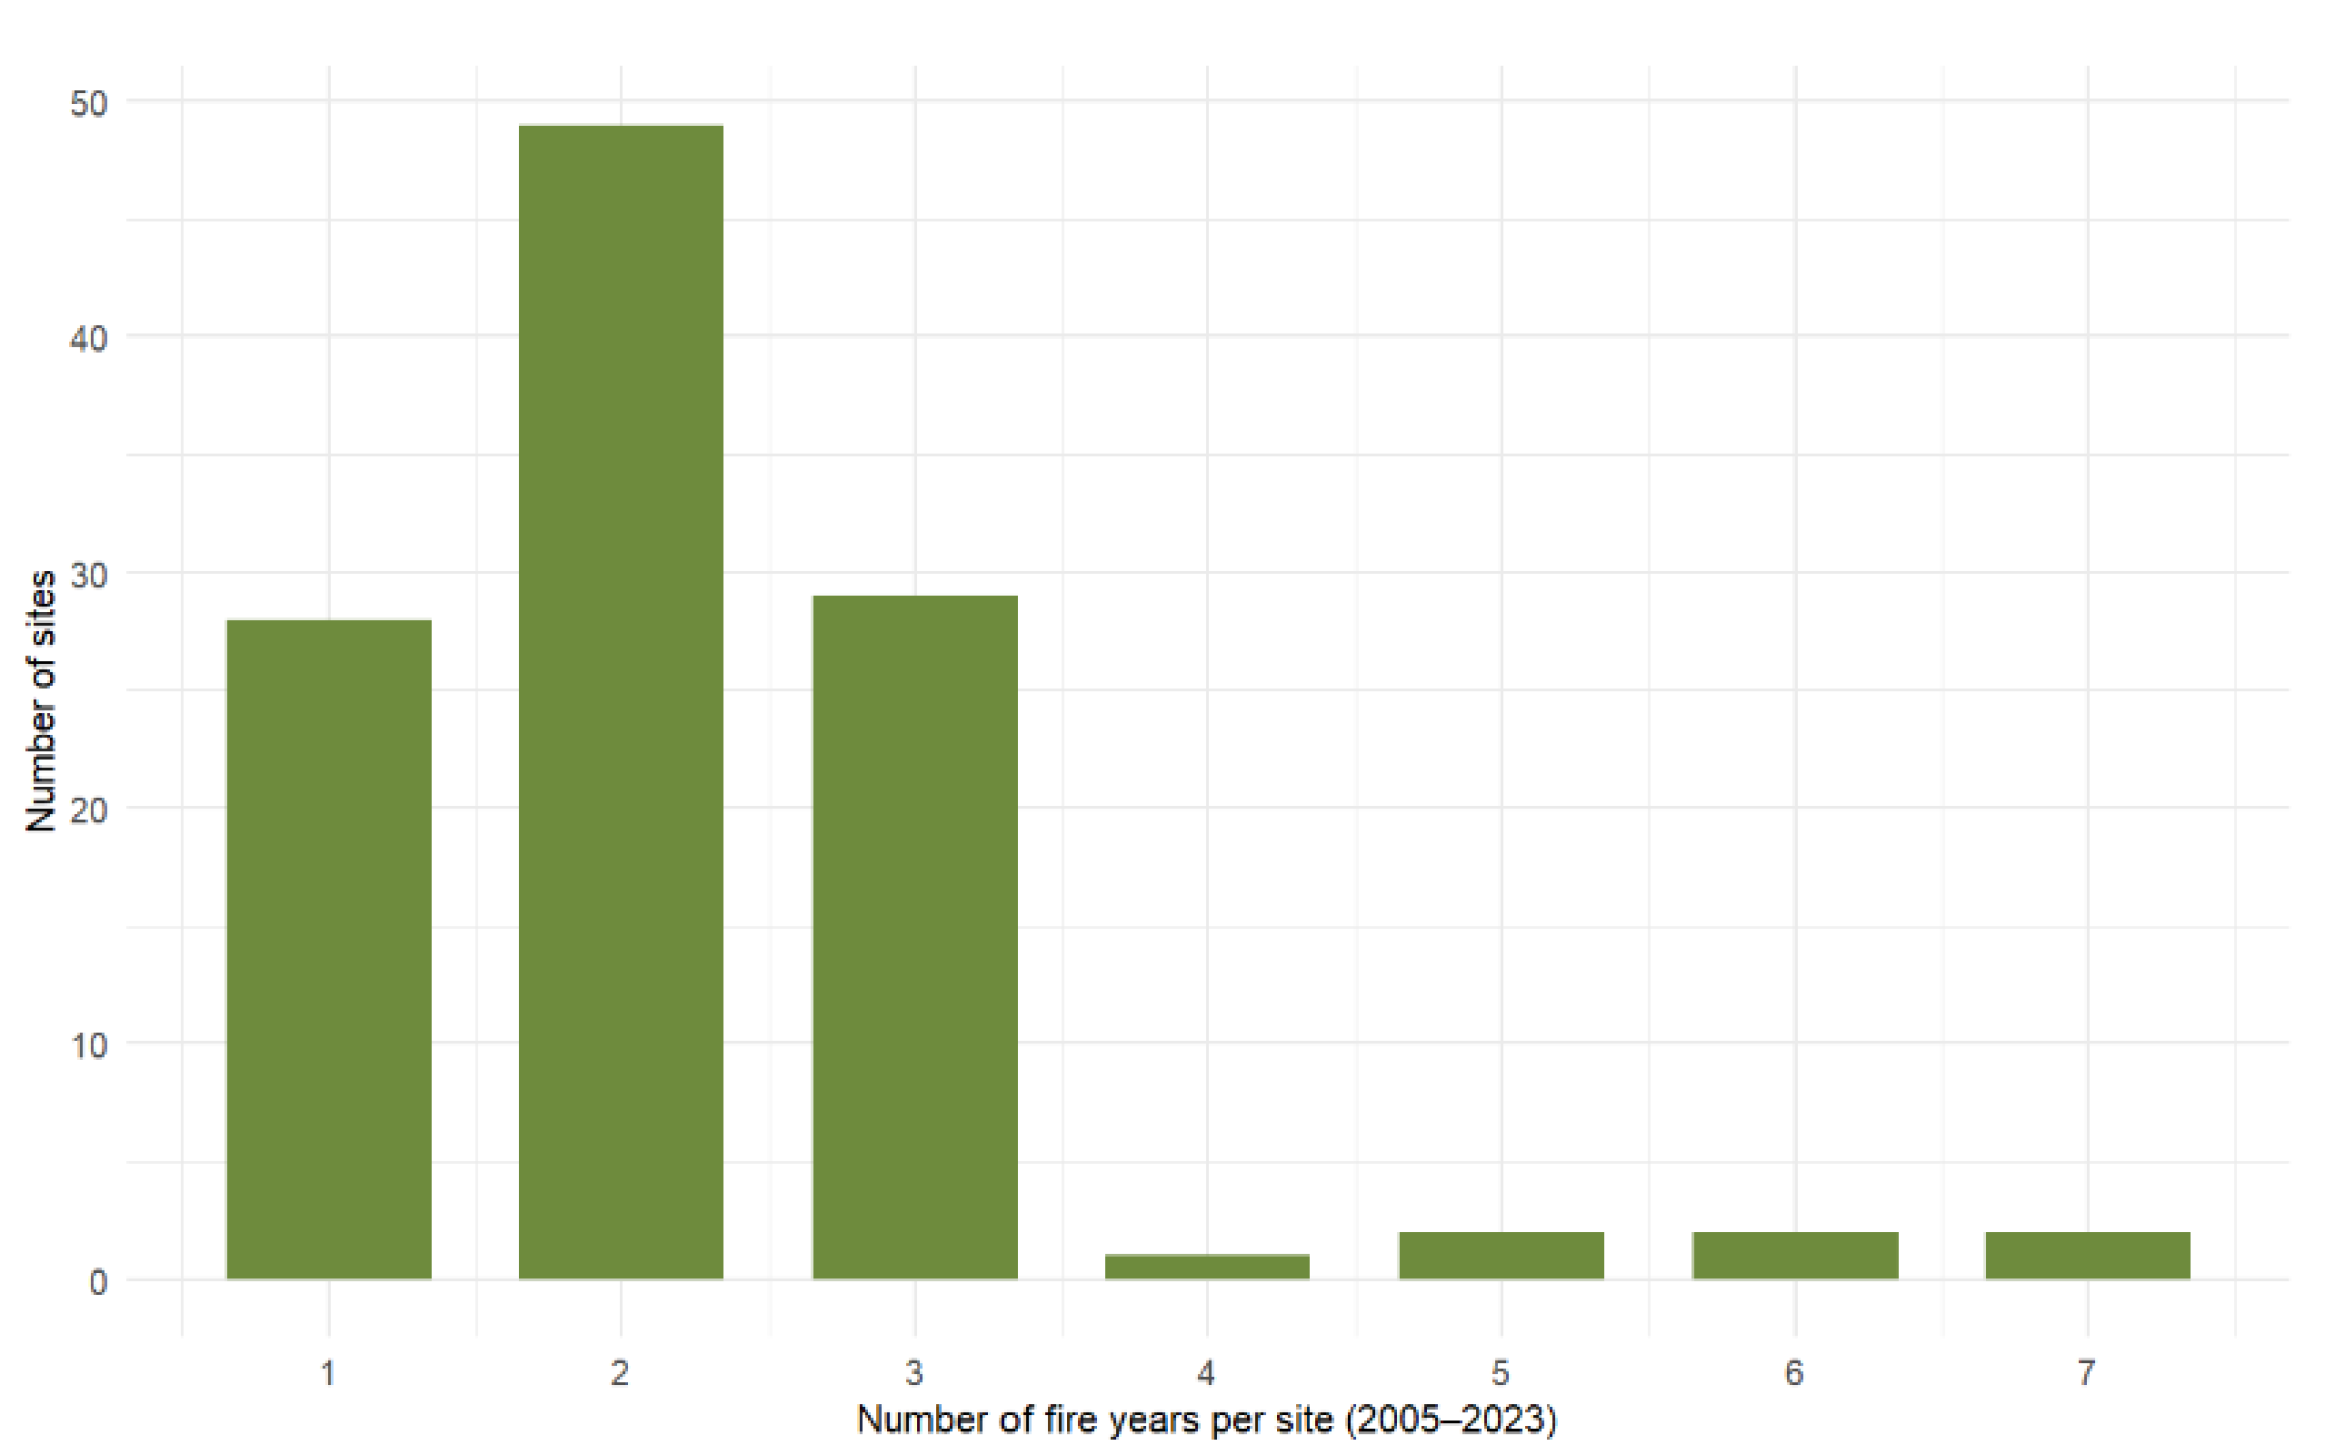
Figure 2.
Modeled post-fire vegetation recovery for NDVI, NDMI, and EVI. Fitted GAMM trajectories show each dNBR severity class, and shaded ribbons indicate 95% confidence intervals. Predictions reflect mean site conditions across all covariates.
Figure 2.
Modeled post-fire vegetation recovery for NDVI, NDMI, and EVI. Fitted GAMM trajectories show each dNBR severity class, and shaded ribbons indicate 95% confidence intervals. Predictions reflect mean site conditions across all covariates.
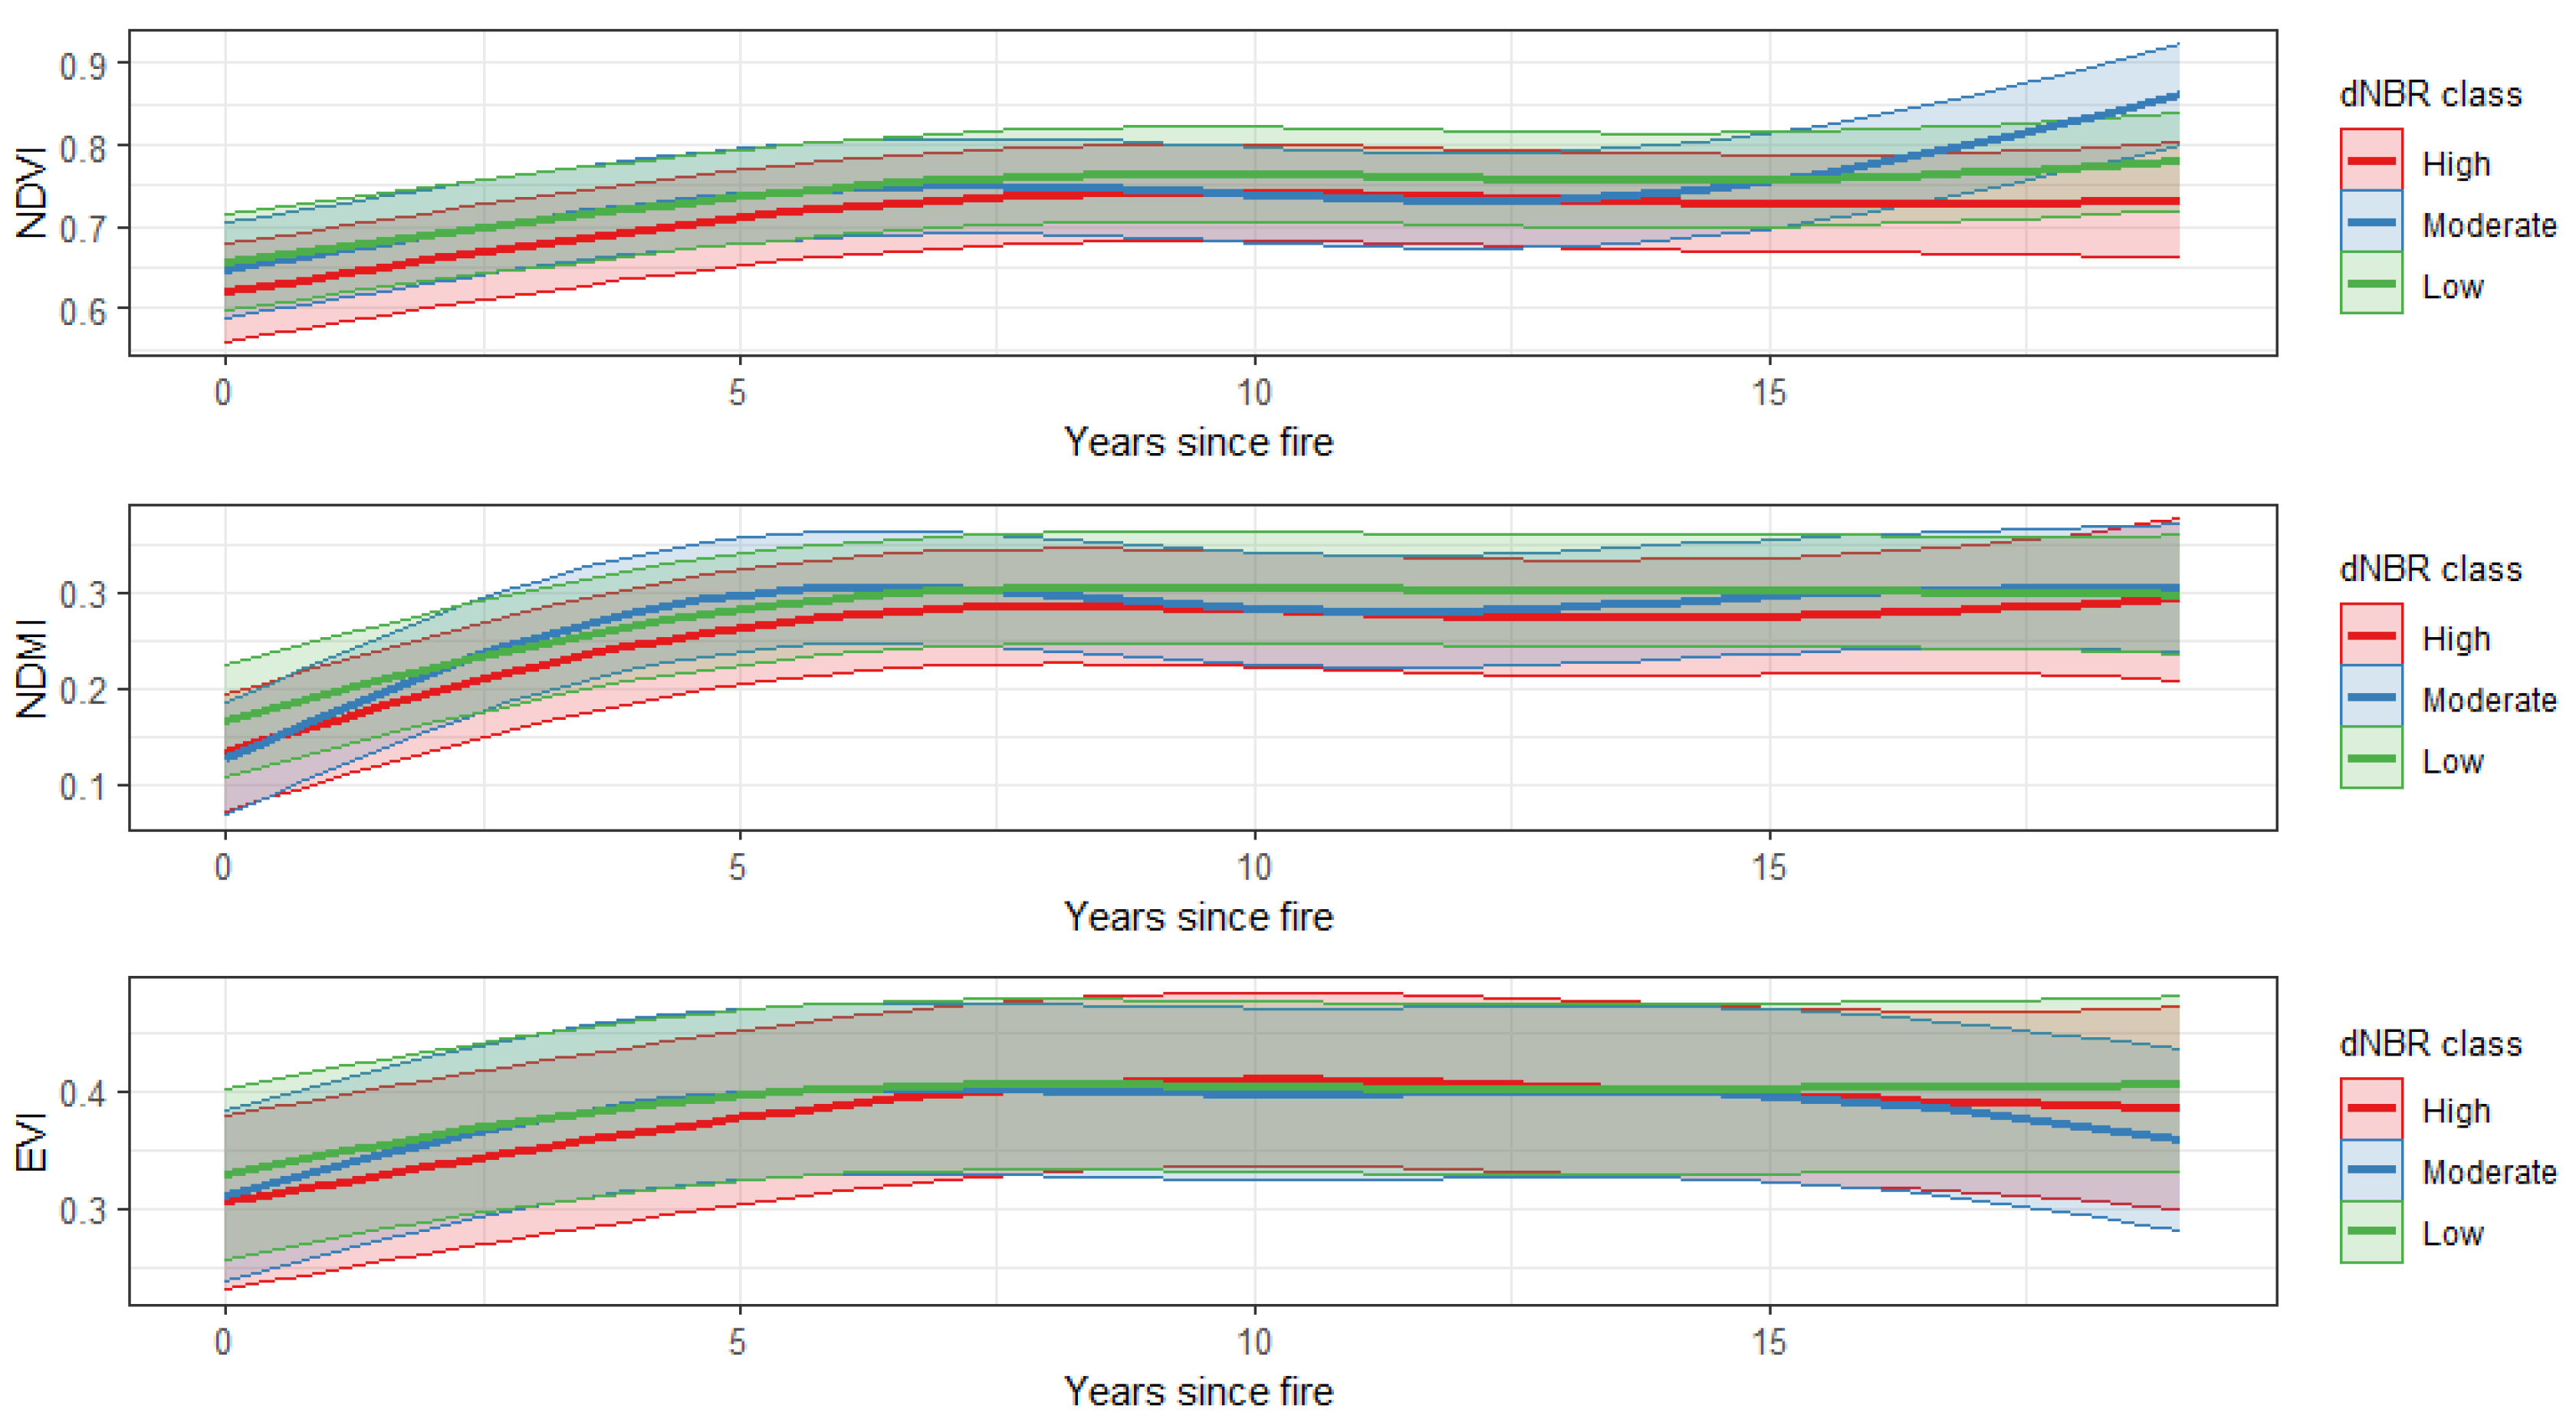
Figure 3.
Spatial Distribution of Site-level Random Effects from the NDVI Model.
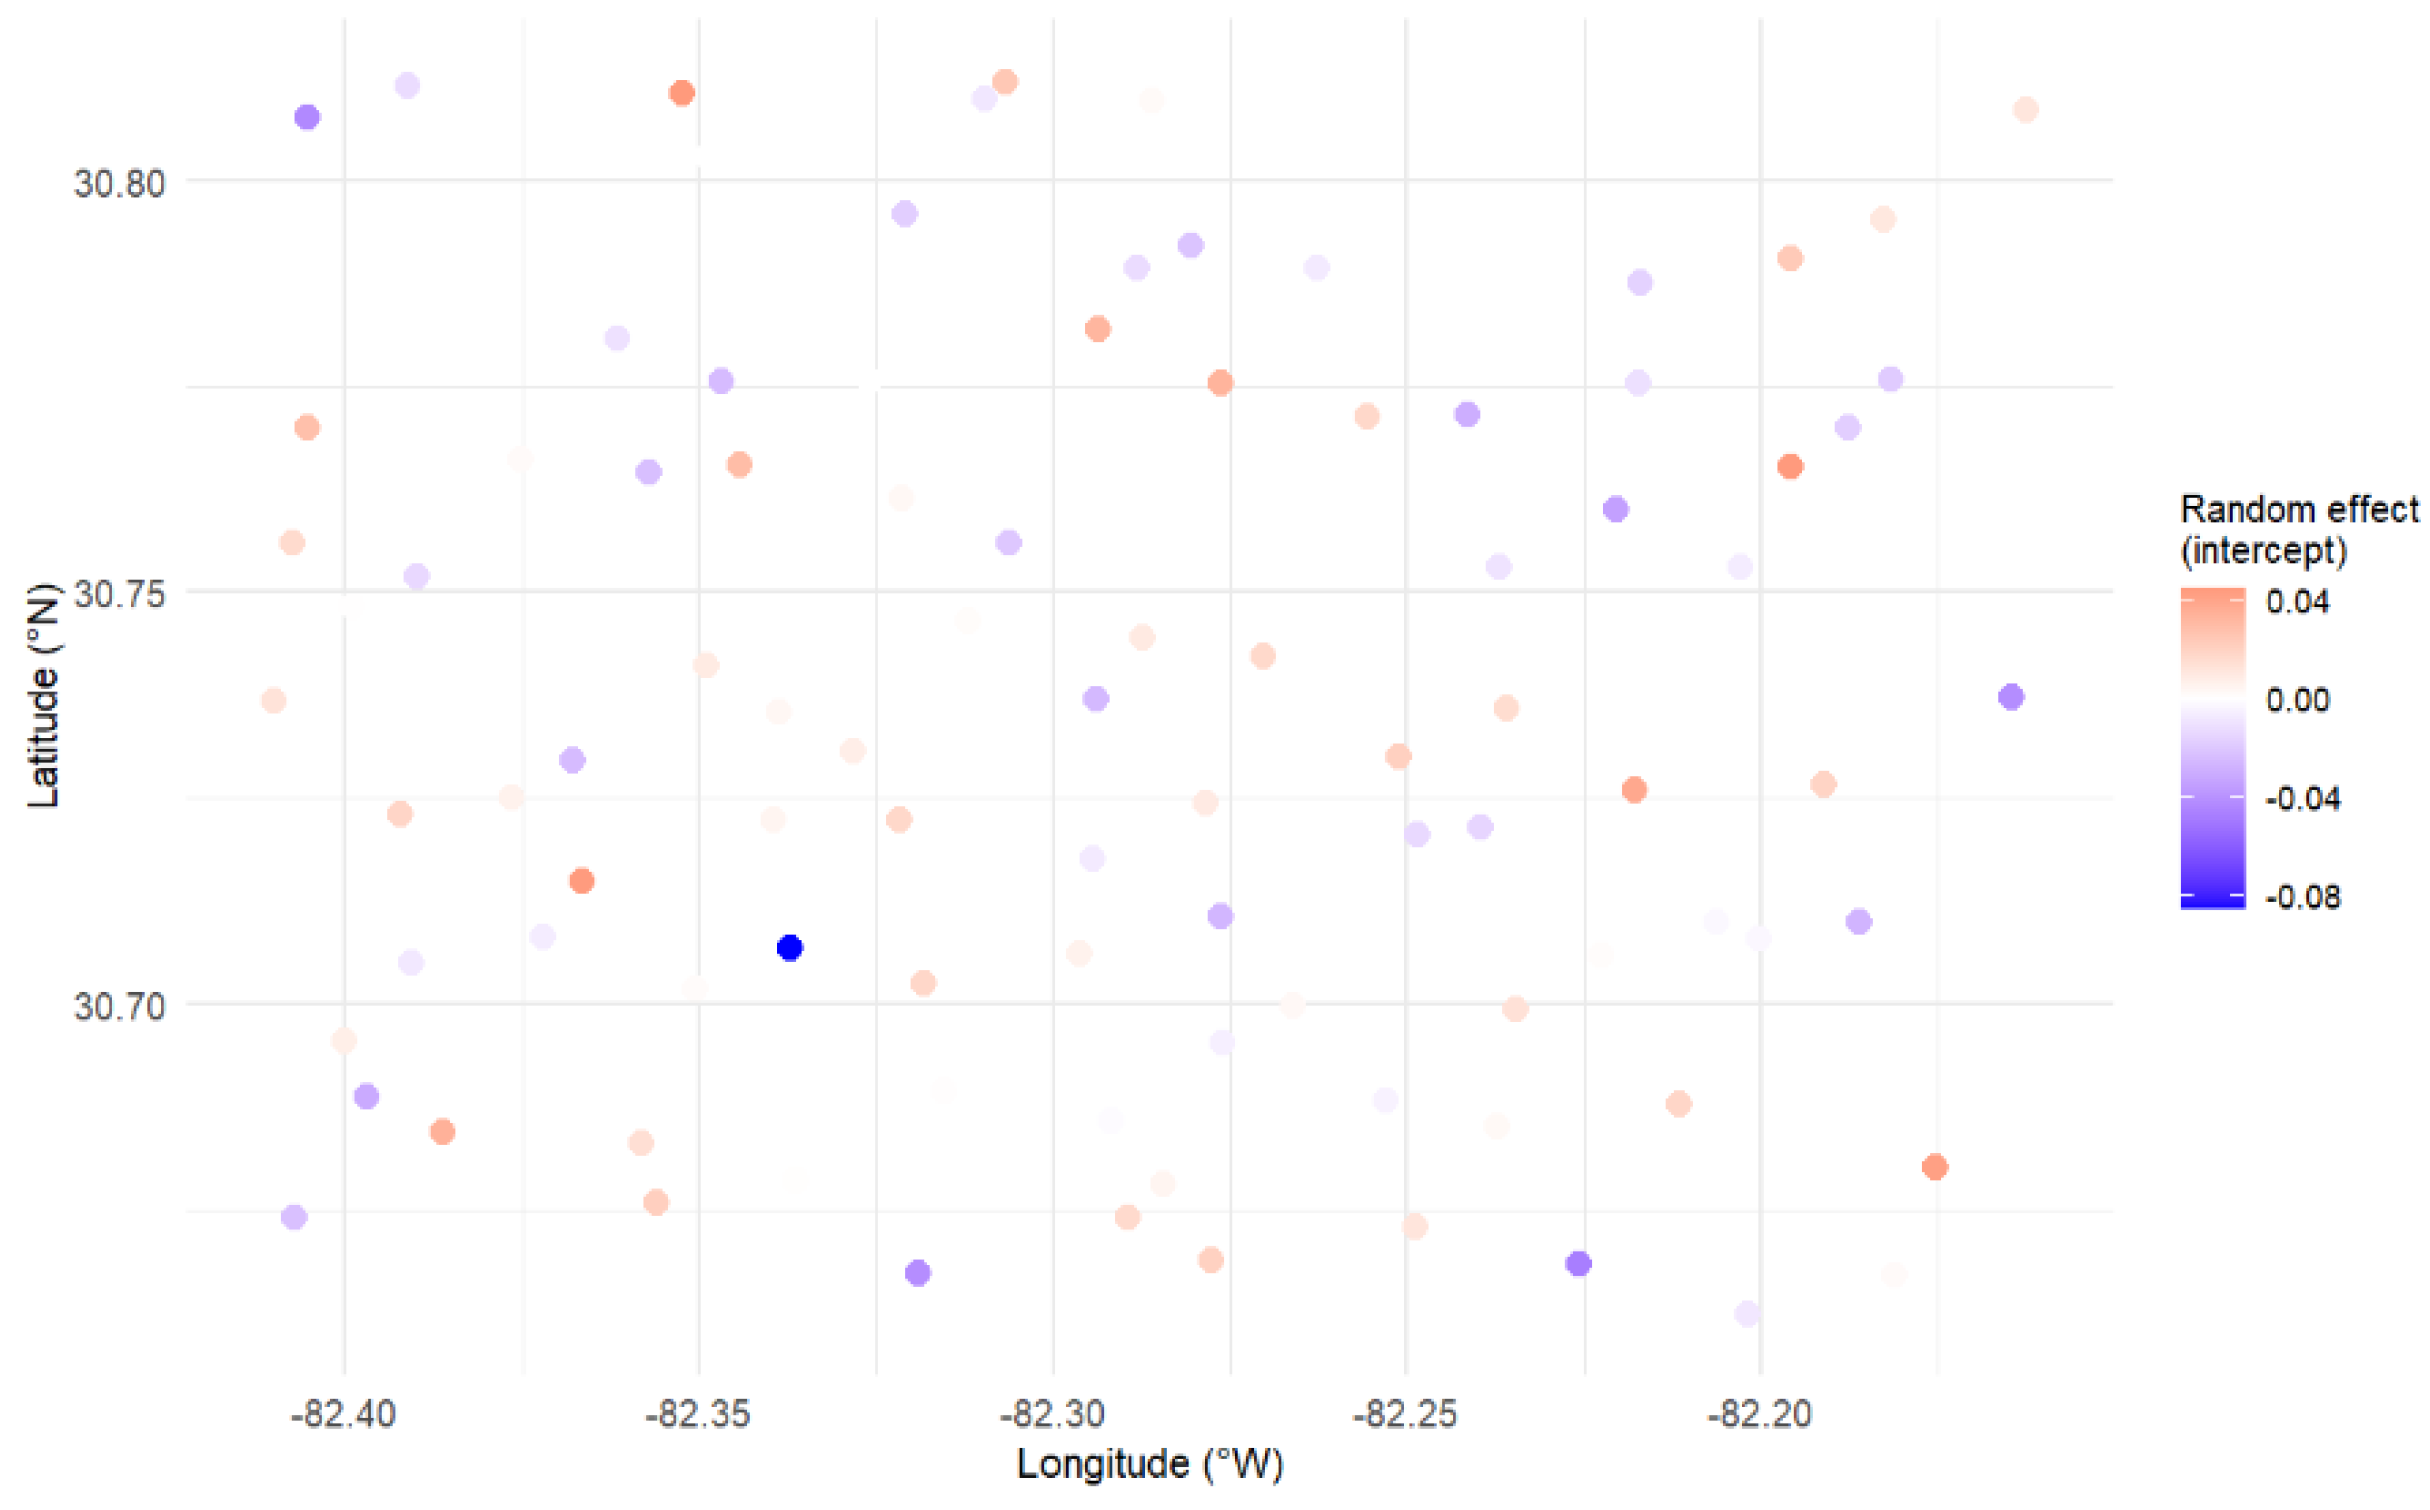
Figure 4.
Fire Years Distribution Across sites, 2004–2023.
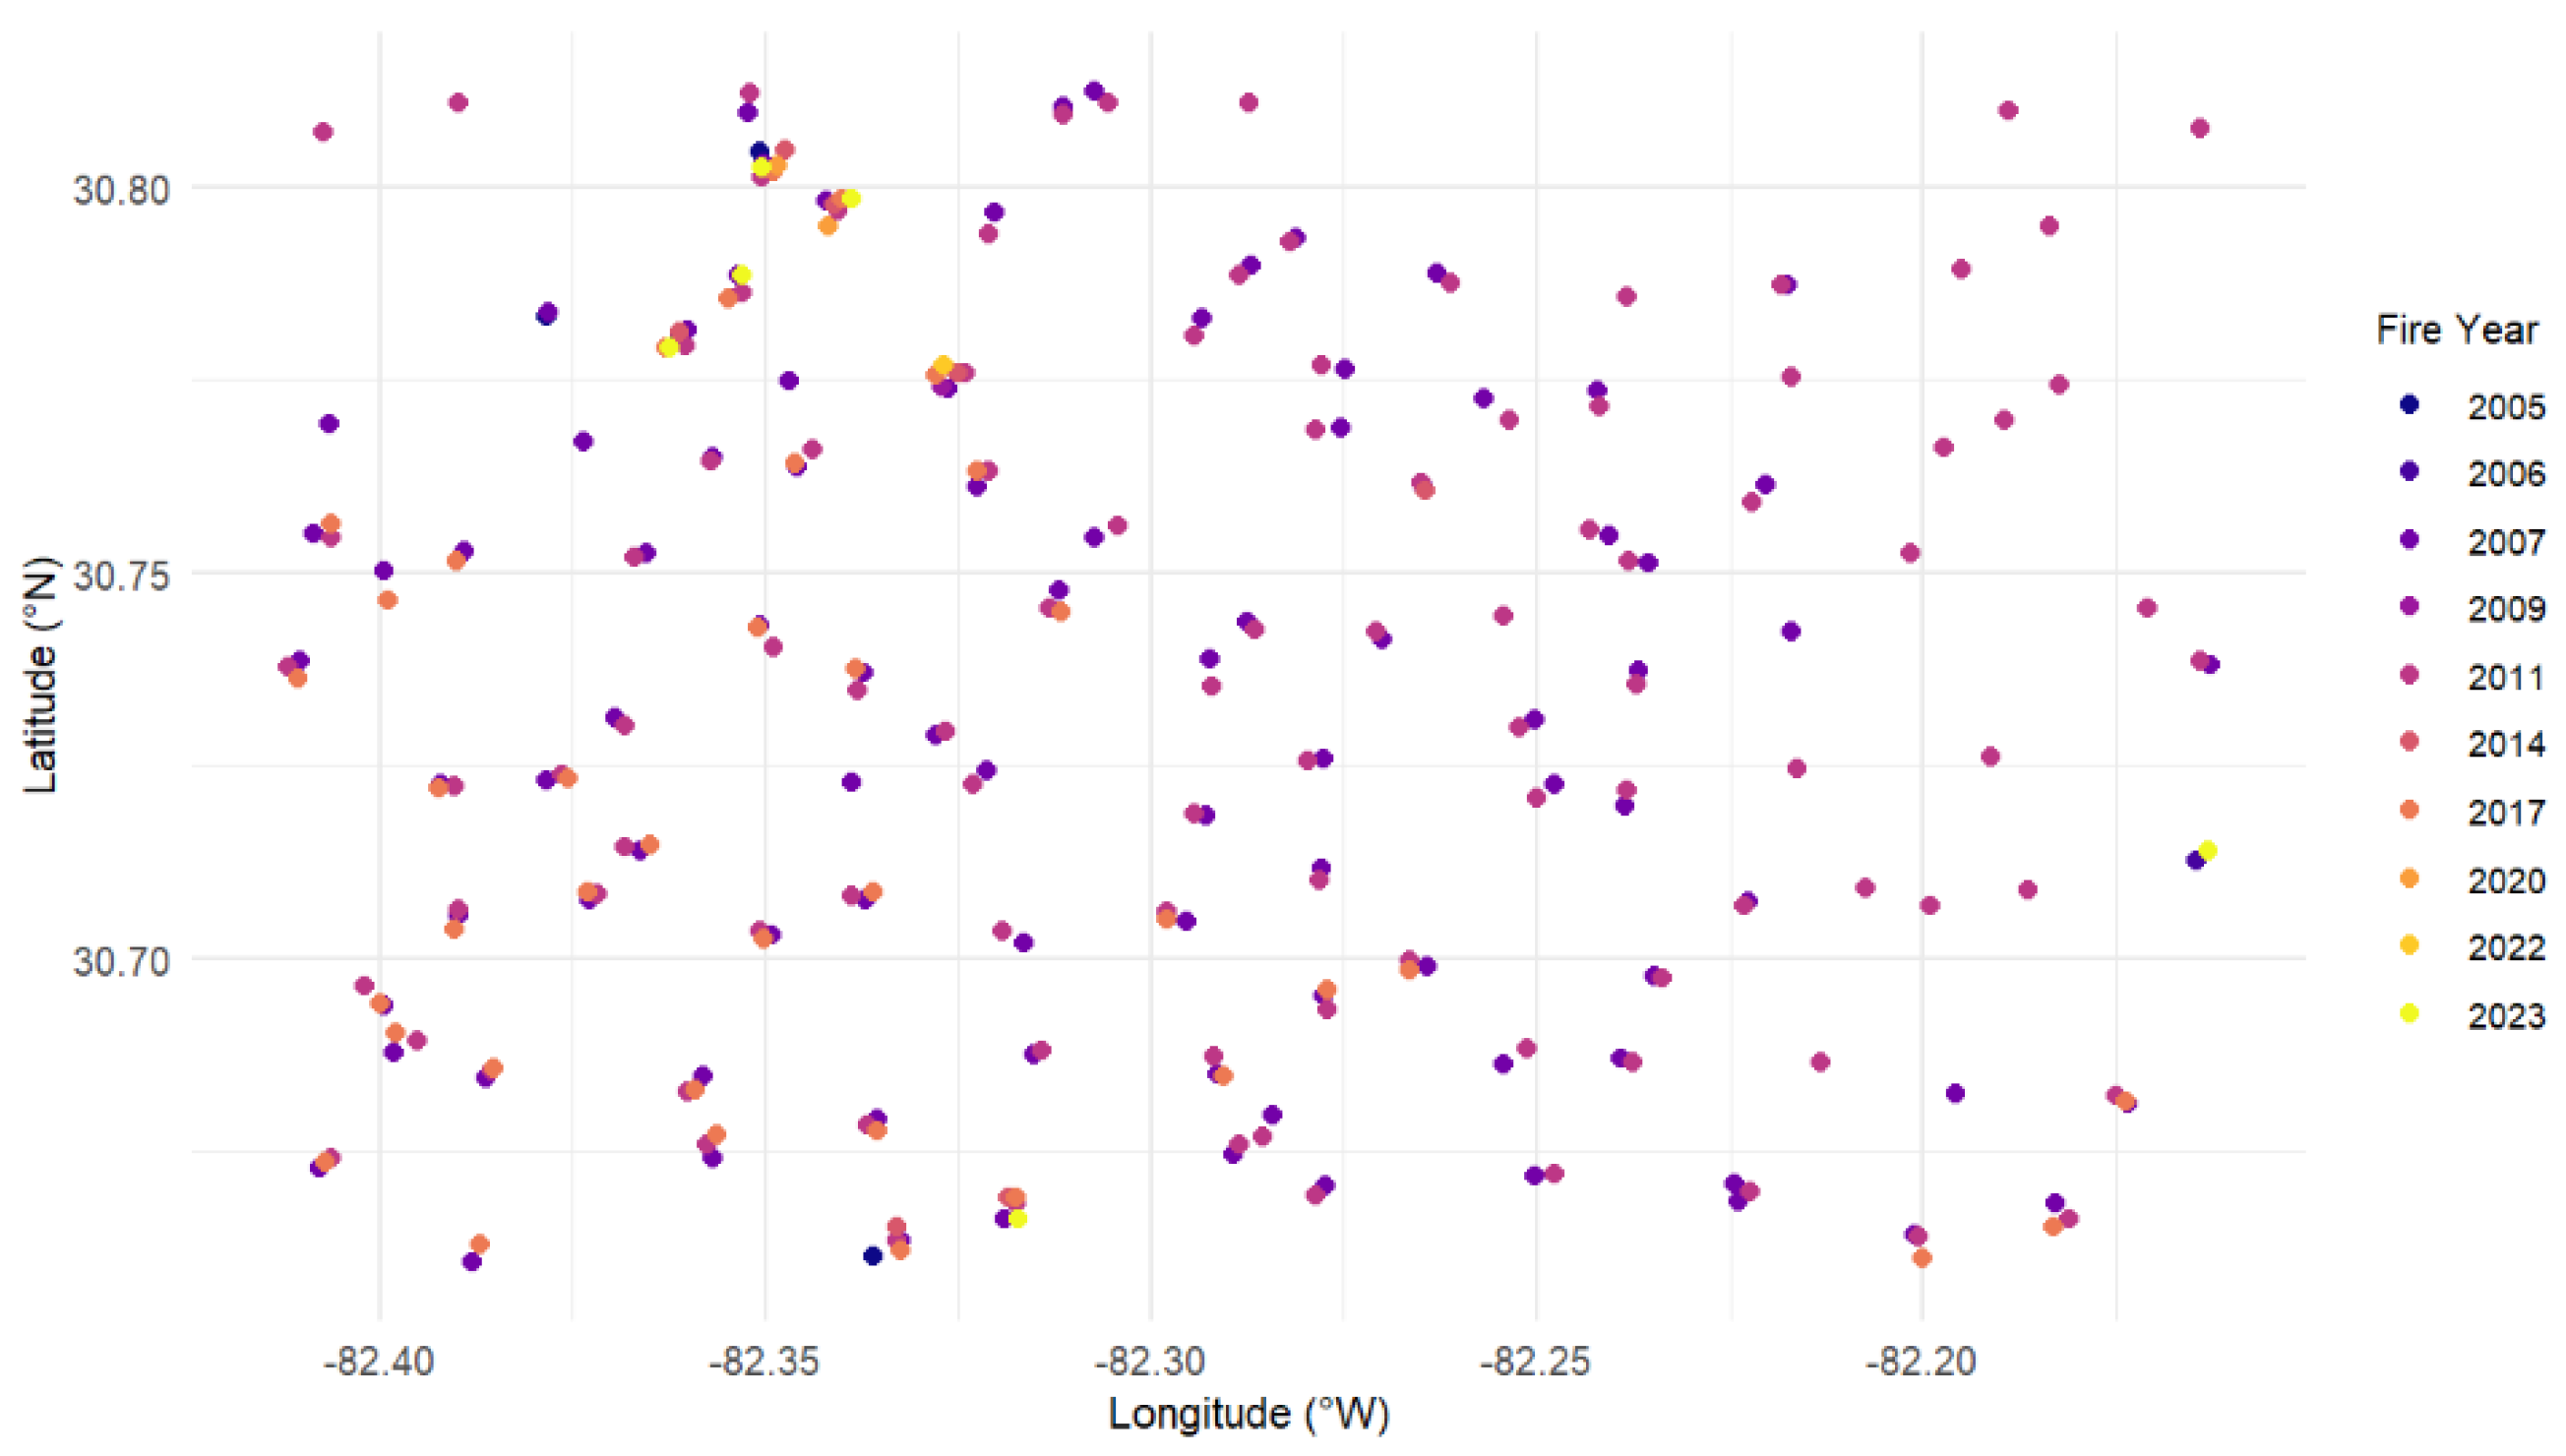
Figure 5.
Moran’s I Scatterplot of NDVI Model Residuals.
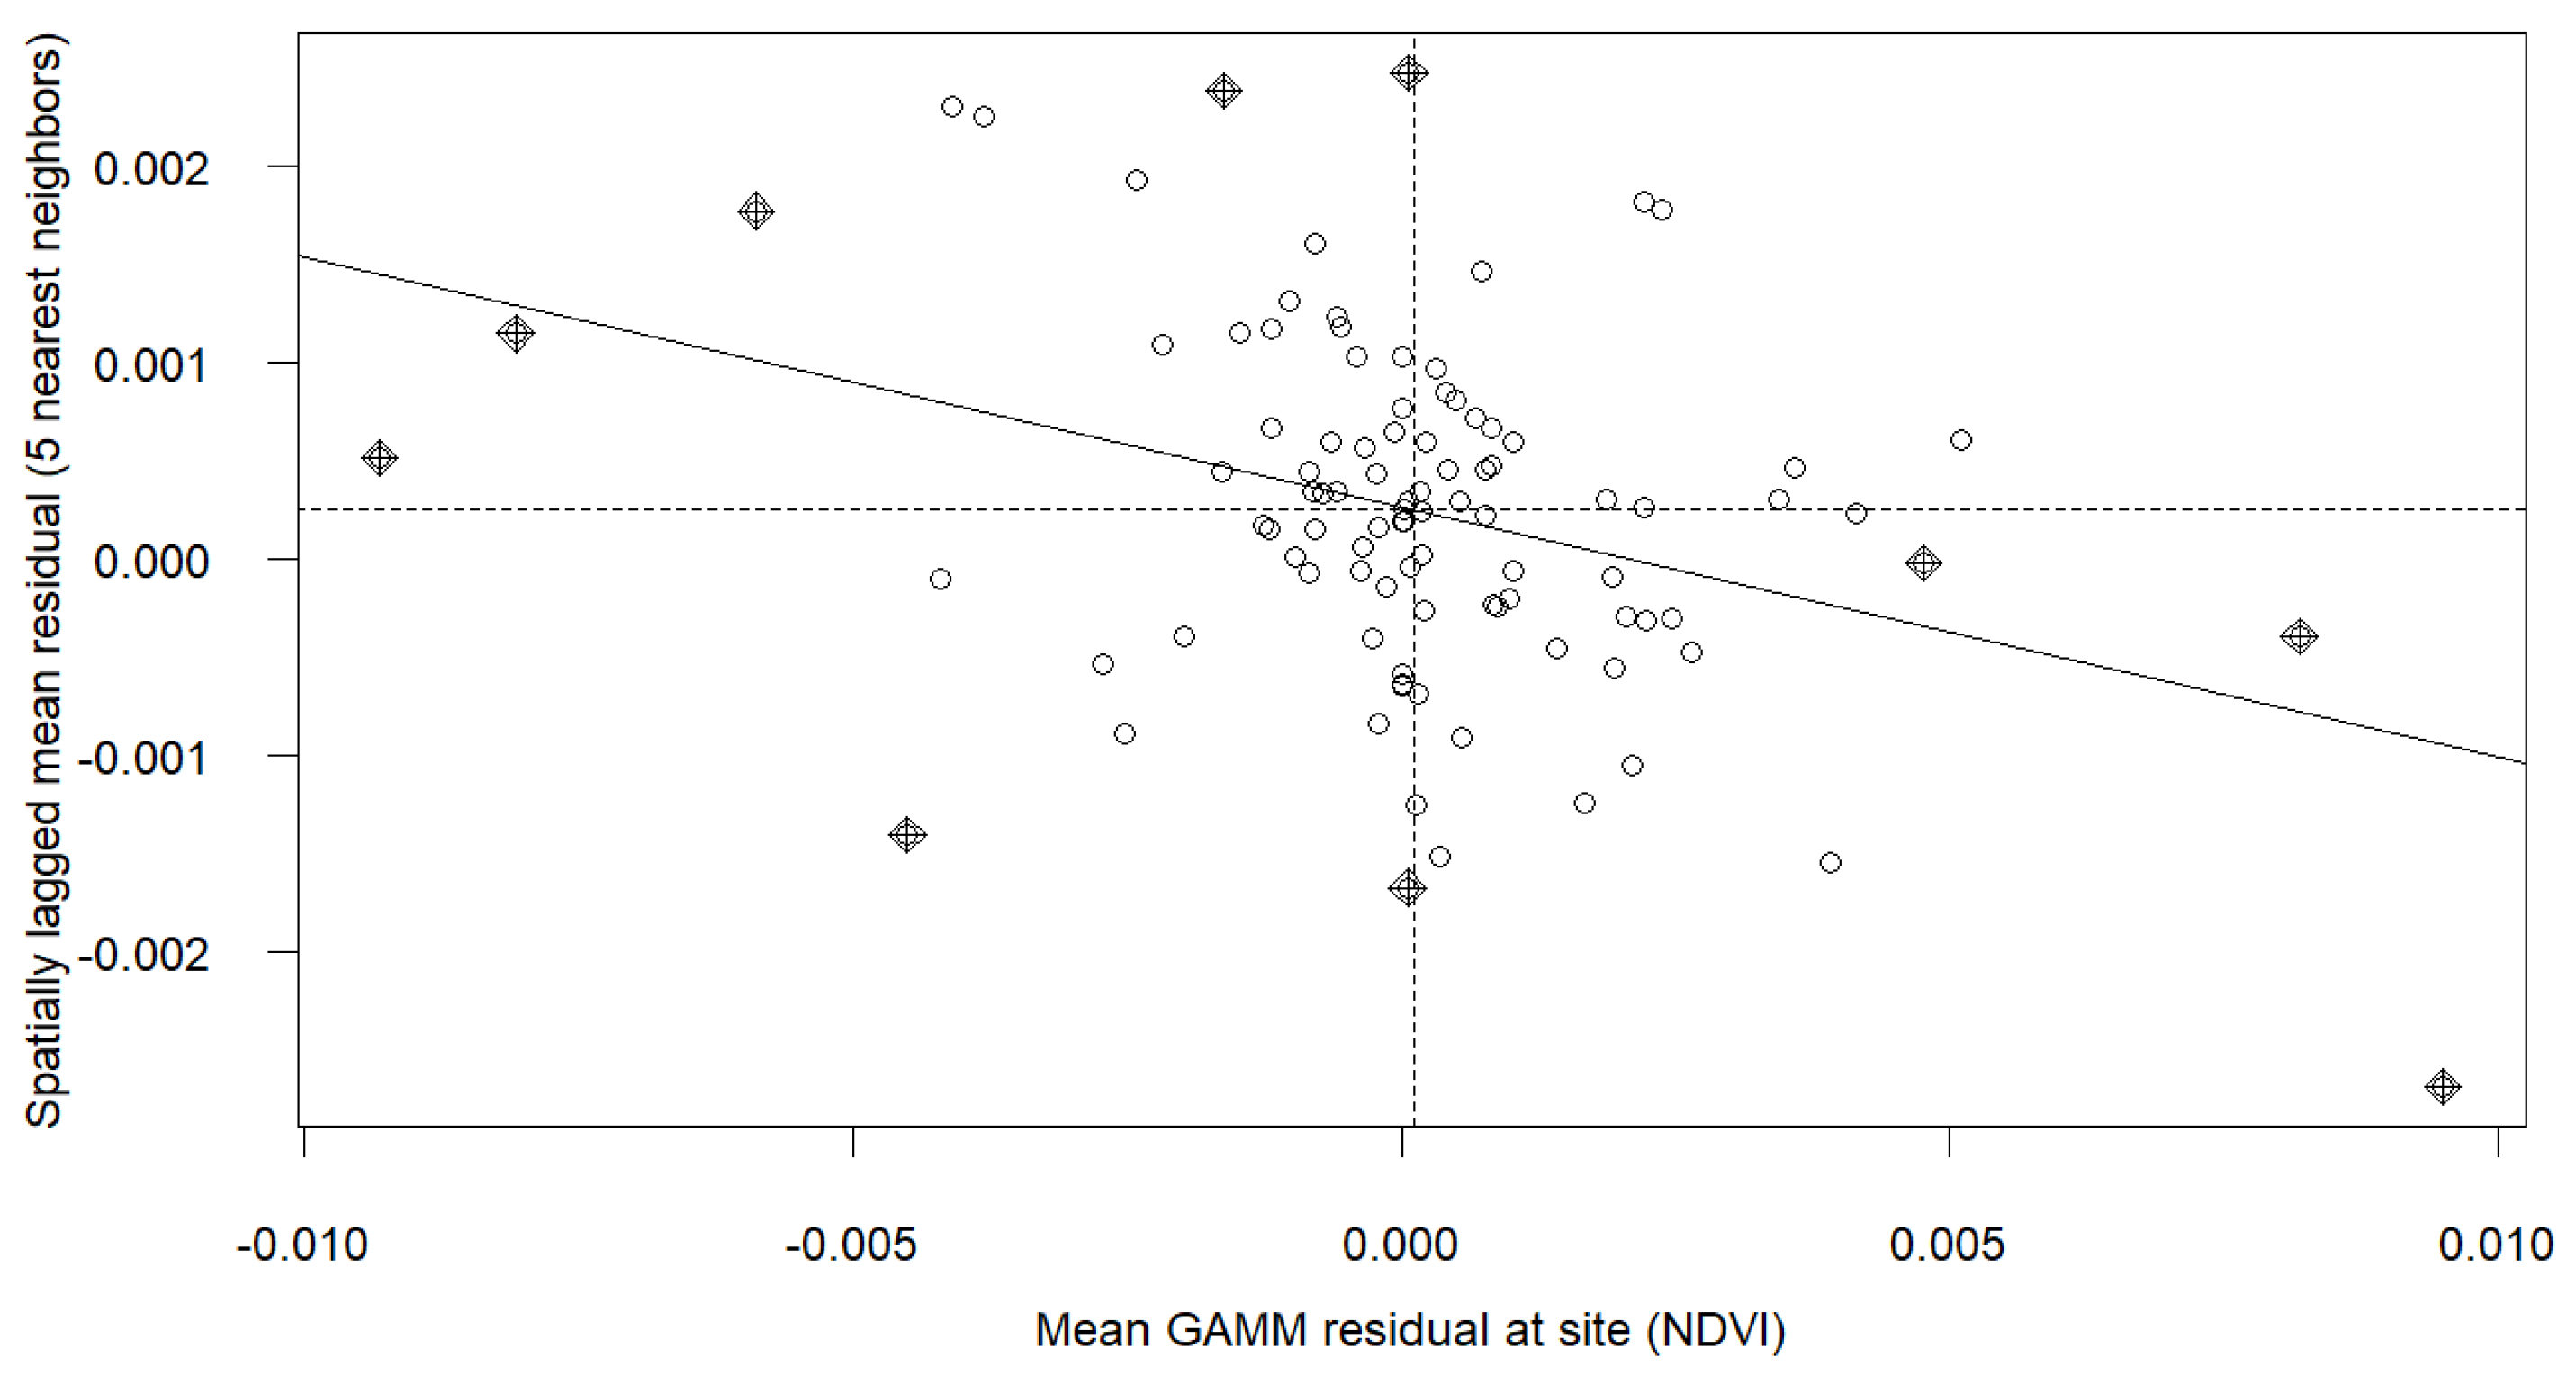

Table 1.
Number of site-year observations by fire severity class and time since fire.
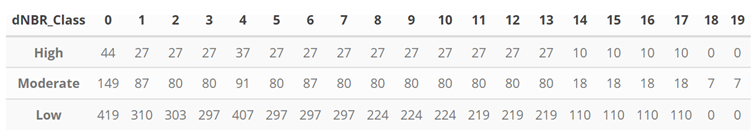
Table 2.
Summary of Fixed Effects for NDVI Generalized Additive Model.
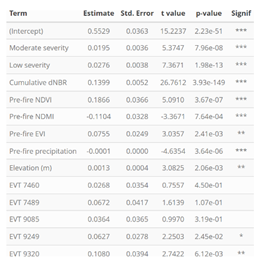
Table 3.
Estimated smooth terms for NDVI model (time since fire by severity class and spatial location).
Table 3.
Estimated smooth terms for NDVI model (time since fire by severity class and spatial location).
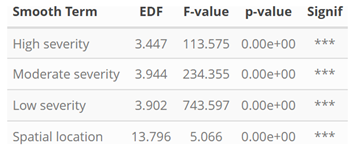
Table 6.
Leave-One-Site-Out Cross Validation Metrics
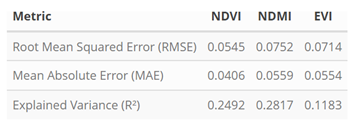
Table 7.
Model Fit Statistics for Full Dataset.
Disclaimer/Publisher’s Note: The statements, opinions and data contained in all publications are solely those of the individual author(s) and contributor(s) and not of MDPI and/or the editor(s). MDPI and/or the editor(s) disclaim responsibility for any injury to people or property resulting from any ideas, methods, instructions or products referred to in the content. |
© 2025 by the authors. Licensee MDPI, Basel, Switzerland. This article is an open access article distributed under the terms and conditions of the Creative Commons Attribution (CC BY) license (http://creativecommons.org/licenses/by/4.0/).
Copyright: This open access article is published under a Creative Commons CC BY 4.0 license, which permit the free download, distribution, and reuse, provided that the author and preprint are cited in any reuse.


