
Submitted:
26 July 2025
Posted:
28 July 2025
You are already at the latest version
Abstract
Objective: This study aimed to evaluate whether modifying the post-processing algorithm of twin-spiral dual-energy computed tomography (DECT) improves infarct detection compared to conventional dual-energy or single-energy CT (DECT/SECT) following endovascular therapy (EVT) for large vessel occlusion (LVO). Methods: We retrospectively analyzed 52 patients who underwent twin-spiral DECT after endovascular stroke therapy. Ten patients were used to generate a device-specific parameter (“y”) using an AI-based neural network (SynthSR). This parameter was integrated into the post-processing algorithm for edema map generation. Quantitative Hounsfield unit (HU) measurements were used to assess density differences in ischemic brain tissue across conventional virtual non-contrast (VNC) images and edema maps. Results: The median HU of infarcted tissue in conventional mixed DECT was 33.73 ± 4.58, compared to 22.96 ± 3.81 in default VNC images. Edema maps with different smoothing filter settings showed values of 14.39 ± 4.96, 14.50 ± 3.75, and 15.05 ± 2.65, respectively. All edema maps demonstrated statistically significant HU differences of infarcted tissue compared to conventional VNC images (p<0.001) while maintaining the density values of non-infarcted brain tissue. Conclusion: Enhancing the post-processing algorithm of conventional virtual non-contrast imaging improves infarct detection compared to standard mixed or virtual non-contrast reconstructions in dual-energy CT.
Keywords:
Stroke
; Dual Energy
; Endovascular stroke therapy
; Edema Map
; AI-Assisted Post-Processing
1. Introduction
Stroke is a leading cause of morbidity, disability, and mortality worldwide.[1] Endovascular therapy (EVT) is a corner stone in acute stroke therapy with recent studies showing that selected patients in a late time-window or with manifest early ischemic changes profit.[2,3,4,5] Typical follow-up procedures after EVT include a post-interventional CT, usually within 24hrs, to visualize the degree of infarction, exclude intracranial hemorrhage (ICH) and to plan further management of the patient. A frequent finding on these early post-interventional CT scans are intraaxial or subarachnoid hyperdensities occuring due to disruption of the blood-brain barrier or leakage of contrast material into the subarachnoid space.[6,7]
Dual Energy CT employs high and low energy X-rays to measure different attenuation levels and further characterize these hyperdensities using a 3-material decomposition algorithm into different compounds.[8,9,10,11] Current acquisition methods in routine imaging include classical dual source scannning with two x-ray tubes, rapid voltage switching, dual-layer detector, split filter technique, and more recently also sequential scanning (Dual- or Twin Spiral Dual Energy CT).[12].
Previous studies have demonstrated that DECT performed after mechanical thrombectomy can differentiate hyperdensities seen on the post-interventional CT — distinguishing contrast extravasation from hemorrhage — and improve the detection of infarcted brain tissue compared to conventional single-energy CT (SECT).[13,14,15]
To further refine the post-processing of the dual energy CT we adapted the method of edema map generation using a device-specific parameter "y".[16,17] We employed an AI-based neural network to separate gray and white matter and overlay these masks onto the CT-scan to measure the respective Hounsfield units (HU) of gray and white matter. From this we calculated a device-specific parameter that suppresses gray-white differentiation. We hypothesize that if the brain appears uniformly gray it is easier to spot subtle changes in density ultimately incrasing the visibility and identification of infarcted tissue.
2. Materials and Methods
2.1. Patients
We retrospectively analyzed 52 patients (22 male, 30 females, mean age 70 years, IQR: 61-85) between 07/2023 and 03/2025 who had TwinSpiral DECT scan following EVT. 8 Patients had an occlusion of the ICA, 38 of the MCA (23 M1-segment, 14 M2-segment, 1 M3-segment) and 3 patients had an occlusion in the posterior circulation (1 VA, 2 BA). Inclusion criteria required the availability of DECT imaging within 24 hours following EVT. When accessible, follow-up CT or MRI scans were used as reference standard. In the absence of follow-up imaging, infarction was identified by comparing pre-stroke imaging with NCCT and CT perfusion acquired during the initial stroke workup.
2.2. Image Acquisition and Post Processing
DECT scan was performed in all patients using a single source DECT scanner (X.ceed, Siemens Healthineers, Forchheim, Germany). Parameters of the scan protocol in all patients were tube voltages of 80 kV and tin (Sn) filtered 150 kV. A slice thickness of 1 mm, a pitch factor of 0.55 with a CARE kV Image Quality-setting of 260 were selected. The mean computed tomography dose index volume (CTDIvol) was 44.95 ± 4,59 mGy. Image reconstruction included both virtual non-contrast (VNC) and standard mixed images in axial orientation and an image matrix of 512 × 512 mm.
Post-processing and dataset reconstruction were fully automated on the CT-scanner workstation (syngo.via, CT Brain Hemorrhage, VA.40 client 4.0, Siemens Healthineers AG, Erlangen, Germany). Virtual monoenergetic reconstructions at 87 keV with a slice thickness of 3 mm in axial, sagittal, and coronal orientations were generated, representing classical non-contrast CT. Additionally, color-coded iodine overlay images, VNC images at default settings and edema maps were reconstructed at three different post-processing configurations, labeled as "Resolution" (1, 3, and 5) in the interface. This parameter controls the strength of the spatial smoothing filter applied during image reconstruction, where higher values correspond to stronger smoothing and lower image noise.
2.3. Image Conversion
Mixed, low and high energy datasets of the Dual Energy CT were converted to nifti format. The mixed energy series was then converted into a synthetic MPRAGE using SynthSR convolutional neural network (CNN).[18] Synthetic MPRAGE was then segmented into gray and white matter using SPM12. Segmentation files were registered and overlaid onto low- and high-energy CT scans. Voxel based Hounsfield units of gray and white matter were measured using Python. [19] Figure 1.
2.4. Image and Statistical Analysis
Hounsfield units (HU) were measured by manually placing equally sized regions of interest (ROIs) within the ischemic lesion on the conventional CT image and VNC/edema-maps at different settings of the spatial smoothing filter and iodine ratios. One ROI was placed per patient. Figure 2. Data was tested for normal distribution using the Shapiro-Wilk test. Paired t-tests were applied to normally distributed data, while Wilcoxon signed-rank tests were used for non-normally distributed data. Statistical analyses were performed using Python and R.[19,20]
3. Results
Of the 52 patients analyzed, 10 were used for validation, and their CT scans were converted into synthetic MPRAGEs. Images were overlaid as described above. The total number of analyzed voxels was 7,277,096 (GM) and 7,108,959 (WM) in high-energy CT scans, and 7,291,076 (GM) and 7,122,897 (WM) in low-energy scans. The median density of GM in the high-energy scans was 32 HU (SD: 2.19), while WM had a median of 27.95 HU (SD: 1.27). In low-energy scans, GM had a median density of 47.84 HU (SD: 3.25), and WM had 39.92 HU (SD: 2.25). Following the measurement of median HU we put the values into the formula proposed by Mohammed et al. which resulted in the value of .[16] Table 1.

Table 1.
Number of analyzed voxels and median HU values (SD) for high-energy and low-energy CT scans.
Table 1.
Number of analyzed voxels and median HU values (SD) for high-energy and low-energy CT scans.
| Scan Type | Number of Analyzed Voxels | Median HU (SD) |
|---|---|---|
| High-Energy CT (GM) | 7,277,096 | 32 (2.19) |
| High-Energy CT (WM) | 7,108,959 | 27.95 (1.27) |
| Low-Energy CT (GM) | 7,291,076 | 47.84 (3.25) |
| Low-Energy CT (WM) | 7,122,897 | 39.92 (2.25) |
The median measured Hounsfield Unit (HU) of the infarction area on conventional mixed CT images was 33.73 HU (SD: 4.58), for the default VNC-map 22.96 HU (SD: 3.81), for edema maps at smoothing level 1 (14.39 HU, SD: 4.98), smoothing level 3 (14.50 HU, SD: 3.75), and smoothing level 5 (15.05 HU, SD: 2.65). Figure 2. Normality testing using the Shapiro-Wilk test indicated that median HU values of default VNC and of Edema maps at level 1 of the smoothing filter followed a normal distribution, while all other parameters were non-normally distributed. Significant differences in median Hounsfield unit values were observed between conventional VNC images and edema maps at all levels of smoothing (). Table 2. Figure 3 & Figure 4.
Table 2.
Median Hounsfield Unit (HU) values with standard deviation (SD) and corresponding p-values for comparisons against Siemens default VNC.
Table 2.
Median Hounsfield Unit (HU) values with standard deviation (SD) and corresponding p-values for comparisons against Siemens default VNC.
| Reconstruction | Median HU (SD) | p-value vs Mixed Image / VNC |
|---|---|---|
| Conventional Mixed Image | 33.73 (4.58) | |
| Default VNC | 22.96 (3.85) | |
| Edema Map Resolution 1 | 14.39 (4.98) | |
| Edema Map Resolution 3 | 14.50 (3.75) | |
| Edema Map Resolution 5 | 15.05 (2.65) |
4. Discussion
Routine imaging after endovascular stroke therapy (EVT) usually includes CT or MRI imaging to determine the extent of infarction or to identify hemorrhagic transformation which occurs in approximately 15% of patients.[21,22,23] Common findings on the post-interventional CT are intraparenchymal or subarachnoid hyperdensities which could resemble hemorrhage or contrast extravasation.[24] Dual energy CT has already been shown to reliably differentiate between hemorrhage or contrast extravasation using virtual non-contrast- and iodine maps.[14,22,25] Several previous studies have also shown that virtual non-contrast images are superior in identifying infarction tissue compared to conventional single energy CT.[11,16,17,26].
In our study we adjusted the post-processing parameters of TwinSpiral Dual Energy CT by implementing a device-specific parameter "y" for edema map generation analogous to Mohammed et al.[16]. Compared to previous studies we derived this parameter from a voxel-wise measurement of gray and white matter densities using AI-assisted brain segmentation. We hypothesize that by suppressing the gray-white matter contrast, the brain parenchyma appears homogenous making it easier to spot subtle hypodensities such as cytotoxic edema.[16]
Our results confirm this hypothesis. Edema maps at varying strengths of the smoothing filter show significantly lower Hounsfield Unit (HU) values in infarction tissue compared to conventional VNC images (all ). Using the device-specific parameter "y" at a smoothing level of 1 resulted in the largest absolute reduction of infarct HU values. In these settings, the image was very noisy compared to mixed CT or the conventional VNC-map. With an increase of the spatial smoothing filter to a setting of 3 there was a marked increase of image quality while maintaining the same infarction detection compared to a smoothing setting of 1 (). Figure 3.
Compared to previous analyses that used manual ROI-based HU measurements to calculate post processing settings, we performed a voxel based analysis with more than 28 million voxels analyzed providing a more robust data foundation.[16,17,26] Additionally, other analyses focused on already established acquisition methods of the DECT like dual source or dual layer scanning. Twin-Spiral Dual Energy CT is a relatively recent method in spectral CT acquisition relying on sequential kV-switching rather than conventional dual-source or dual-layer configurations. Through this difference it may produce different spectral information compared to the already established methods making it essential to validate post-processing strategies such as edema map generation. A possible drawback of this type of acquisition — due to the use of twin-spiral and double-spiral sequences — is the prolonged acquisition time, which may render the examination susceptible to motion artifacts. However, in all our patients this was not the case and no disturbances of image quality were observed.
Several limitations of our study have to be acknowledged. The relatively small sample size and retrospective nature of the analysis is well known to be subject to various biases. Furthermore, while the use of synthetic T1-MPRAGE images generated from CT data enabled gray and white matter segmentation, there is a risk of image distortion and that the segmentations may not fully resemble true anatomical gray and white matter distributions. Additionally, MRI - often considered the gold standard for infarct detection - was not available in the majority of cases for comparison.
Further studies should verify if the device-specific parameter "y" can be applied to other devices with different acquisition methods to allow easier identification of infarction compared to conventional VNC images. Additionally, there should be a focus on the benefits of dual energy CT in the setting of acute ischemic stroke employing edema maps and virtual monoenergetic reconstructions to identify early ischemic changes.[27,28] In summary, refining the post-processing of conventional virtual non contrast images has the potential to improve infarct detection after EVT compared to conventional SECT and conventional VNC-maps.
5. Conclusions
Our study demonstrates that changing the post-processing algorithm for TwinSpiral Dual-Energy CT (DECT) with a device-specific parameter offers superior detection of ischemic brain tissue compared to conventional virtual non-contrast (VNC) images or Single-Energy CT (SECT).
Author Contributions
L.S.: Conceptualization, Methodology, Software, Formal Analysis, Investigation, Data Curation, Writing - original draft, Visualization, D.H.: Investigation, Validation, Data Curation, T.A.M.: Formal analysis, Data Curation, Software, A.M.: Data Curation, Software, A.S.: Data Curation, Validation, S.L.: Validation, Visualization, S.G.: Validation, Data Curation, Formal Analysis, Data Curation, S.S.: Resources, A.D.: Resources, Writing - Review & Editing, Supervision, M.A.S.: Conceptualization, Methodology, Investigation, Writing - original draft, Supervision, Project administration
Funding
This research received no external funding
Informed Consent Statement
Given the retrospective design of this study, informed consent and the requirement for formal ethical approval was waived in accordance with federal legislation (Gesundheitsdatennutzungsgesetz Art. 6) and institutional requirements.
Data Availability Statement
Data can be made available upon reasonable request
Conflicts of Interest
The authors declare no conflicts of interest.
Abbreviations
The following abbreviations are used in this manuscript:
| AI | Artificial Intelligence |
| CNN | Convolutional Neural Network |
| CT | Computed Tomography |
| DECT | Dual-Energy Computed Tomography |
| DWI | Diffusion-Weighted Imaging |
| EVT | Endovascular Stroke Therapy |
| GM | Gray Matter |
| HU | Hounsfield Unit |
| ICA | Internal Carotid Artery |
| ICH | Intracranial Hemorrhage |
| LVO | Large Vessel Occlusion |
| MCA | Middle Cerebral Artery |
| MPRAGE | Magnetization Prepared Rapid Acquisition Gradient Echo |
| MRI | Magnetic Resonance Imaging |
| PACS | Picture Archiving and Communication System |
| ROI | Region of Interest |
| SECT | Single-Energy Computed Tomography |
| VNC | Virtual Non-Contrast |
| WM | White Matter |
References
- Katan, M.; Luft, A. Global burden of stroke. In Proceedings of the Seminars in neurology. Thieme Medical Publishers, Vol. 38; 2018; pp. 208–211. [Google Scholar]
- Albers, G.W.; Marks, M.P.; Kemp, S.; Christensen, S.; Tsai, J.P.; Ortega-Gutierrez, S.; McTaggart, R.A.; Torbey, M.T.; Kim-Tenser, M.; Leslie-Mazwi, T.; et al. Thrombectomy for stroke at 6 to 16 hours with selection by perfusion imaging. New England Journal of Medicine 2018, 378, 708–718. [Google Scholar] [CrossRef]
- Huo, X.; Ma, G.; Tong, X.; Zhang, X.; Pan, Y.; Nguyen, T.N.; Yuan, G.; Han, H.; Chen, W.; Wei, M.; et al. Trial of endovascular therapy for acute ischemic stroke with large infarct. New England Journal of Medicine 2023, 388, 1272–1283. [Google Scholar] [CrossRef]
- Nogueira, R.G.; Jadhav, A.P.; Haussen, D.C.; Bonafe, A.; Budzik, R.F.; Bhuva, P.; Yavagal, D.R.; Ribo, M.; Cognard, C.; Hanel, R.A.; et al. Thrombectomy 6 to 24 hours after stroke with a mismatch between deficit and infarct. New England Journal of Medicine 2018, 378, 11–21. [Google Scholar] [CrossRef]
- Sarraj, A.; Hassan, A.E.; Abraham, M.G.; Ortega-Gutierrez, S.; Kasner, S.E.; Hussain, M.S.; Chen, M.; Blackburn, S.; Sitton, C.W.; Churilov, L.; et al. Trial of endovascular thrombectomy for large ischemic strokes. New England Journal of Medicine 2023, 388, 1259–1271. [Google Scholar] [CrossRef]
- Whitney, E.; Khan, Y.R.; Alastra, A.; Schiraldi, M.; Siddiqi, J. Contrast extravasation post thrombectomy in patients with acute cerebral stroke: a review and recommendations for future studies. Cureus 2020, 12. [Google Scholar] [CrossRef]
- Zidan, M.; Ghaei, S.; Bode, F.J.; Weller, J.M.; Krueger, N.; Lehnen, N.C.; Petzold, G.C.; Radbruch, A.; Dorn, F.; Paech, D. Clinical significance and prevalence of subarachnoid hyperdensities on flat detector CT after mechanical thrombectomy: does it really matter? Journal of NeuroInterventional surgery 2024, 16, 966–973. [Google Scholar] [CrossRef]
- Gupta, R.; Phan, C.M.; Leidecker, C.; Brady, T.J.; Hirsch, J.A.; Nogueira, R.G.; Yoo, A.J. Evaluation of dual-energy CT for differentiating intracerebral hemorrhage from iodinated contrast material staining. Radiology 2010, 257, 205–211. [Google Scholar] [CrossRef]
- Tan, C.O.; Kuppens, D.; Gupta, R. Dual-energy CT. Neuroimaging Techniques in Clinical Practice: Physical Concepts and Clinical Applications 2020, pp. 69–86.
- Wolman, D.N.; Patel, B.P.; Wintermark, M.; Heit, J.J. Dual-energy computed tomography applications in neurointervention. Journal of computer assisted tomography 2018, 42, 831–839. [Google Scholar] [CrossRef] [PubMed]
- Wolman, D.N.; van Ommen, F.; Tong, E.; Kauw, F.; Dankbaar, J.W.; Bennink, E.; de Jong, H.W.; Molvin, L.; Wintermark, M.; Heit, J.J. Non-contrast dual-energy CT virtual ischemia maps accurately estimate ischemic core size in large-vessel occlusive stroke. Scientific reports 2021, 11, 6745. [Google Scholar] [CrossRef] [PubMed]
- Omoumi, P.; Becce, F.; Racine, D.; Ott, J.G.; Andreisek, G.; Verdun, F.R. Dual-energy CT: basic principles, technical approaches, and applications in musculoskeletal imaging (part 1). In Proceedings of the Seminars in musculoskeletal radiology. Thieme Medical Publishers, Vol. 19; 2015; pp. 431–437. [Google Scholar]
- Renú, A.; Laredo, C.; Rodríguez-Vázquez, A.; Santana, D.; Werner, M.; Llull, L.; Lopez-Rueda, A.; Urra, X.; Rudilosso, S.; Obach, V.; et al. Characterization of subarachnoid hyperdensities after thrombectomy for acute stroke using dual-energy CT. Neurology 2022, 98, e601–e611. [Google Scholar] [CrossRef] [PubMed]
- Grkovski, R.; Acu, L.; Ahmadli, U.; Terziev, R.; Schubert, T.; Wegener, S.; Kulcsar, Z.; Husain, S.; Alkadhi, H.; Winklhofer, S. A novel dual-energy CT method for detection and differentiation of intracerebral hemorrhage from contrast extravasation in stroke patients after endovascular thrombectomy: feasibility and first results. Clinical neuroradiology 2023, 33, 171–177. [Google Scholar] [CrossRef]
- Grkovski, R.; Acu, L.; Ahmadli, U.; Nakhostin, D.; Thurner, P.; Wacht, L.; Kulcsár, Z.; Alkadhi, H.; Winklhofer, S. Dual-energy computed tomography in stroke imaging: Value of a new image acquisition technique for ischemia detection after mechanical thrombectomy. Clinical Neuroradiology 2023, 33, 747–754. [Google Scholar] [CrossRef] [PubMed]
- Mohammed, M.F.; Marais, O.; Min, A.; Ferguson, D.; Jalal, S.; Khosa, F.; O’Keeffe, M.; O’Connell, T.; Schmiedeskamp, H.; Krauss, B.; et al. Unenhanced dual-energy computed tomography: visualization of brain edema. Investigative Radiology 2018, 53, 63–69. [Google Scholar] [CrossRef]
- Grams, A.E.; Djurdjevic, T.; Rehwald, R.; Schiestl, T.; Dazinger, F.; Steiger, R.; Knoflach, M.; Gizewski, E.R.; Glodny, B. Improved visualisation of early cerebral infarctions after endovascular stroke therapy using dual-energy computed tomography oedema maps. European radiology 2018, 28, 4534–4541. [Google Scholar] [CrossRef]
- Iglesias, J.E.; Billot, B.; Balbastre, Y.; Magdamo, C.; Arnold, S.E.; Das, S.; Edlow, B.L.; Alexander, D.C.; Golland, P.; Fischl, B. SynthSR: A public AI tool to turn heterogeneous clinical brain scans into high-resolution T1-weighted images for 3D morphometry. Science advances 2023, 9, eadd3607. [Google Scholar] [CrossRef]
- McKinney, W.; et al. Data structures for statistical computing in Python. In Proceedings of the SciPy, Vol. 445; 2010; pp. 51–56. [Google Scholar]
- Team, R.C. RA language and environment for statistical computing, R Foundation for Statistical. Computing 2020. [Google Scholar]
- Mokin, M.; Kan, P.; Kass-Hout, T.; Abla, A.A.; Dumont, T.M.; Snyder, K.V.; Hopkins, L.N.; Siddiqui, A.H.; Levy, E.I. Intracerebral hemorrhage secondary to intravenous and endovascular intraarterial revascularization therapies in acute ischemic stroke: an update on risk factors, predictors, and management. Neurosurgical focus 2012, 32, E2. [Google Scholar] [CrossRef]
- Postma, A.A.; Das, M.; Stadler, A.A.; Wildberger, J.E. Dual-energy CT: what the neuroradiologist should know. Current radiology reports 2015, 3, 1–16. [Google Scholar] [CrossRef] [PubMed]
- Zhang, X.; Xie, Y.; Wang, H.; Yang, D.; Jiang, T.; Yuan, K.; Gong, P.; Xu, P.; Li, Y.; Chen, J.; et al. Symptomatic intracranial hemorrhage after mechanical thrombectomy in Chinese ischemic stroke patients: the ASIAN score. Stroke 2020, 51, 2690–2696. [Google Scholar] [CrossRef]
- Puntonet, J.; Richard, M.E.; Edjlali, M.; Ben Hassen, W.; Legrand, L.; Benzakoun, J.; Rodriguez-Régent, C.; Trystram, D.; Naggara, O.; Méder, J.F.; et al. Imaging findings after mechanical thrombectomy in acute ischemic stroke: clinical implications and perspectives. Stroke 2019, 50, 1618–1625. [Google Scholar] [CrossRef]
- Phan, C.; Yoo, A.; Hirsch, J.; Nogueira, R.; Gupta, R. Differentiation of hemorrhage from iodinated contrast in different intracranial compartments using dual-energy head CT. American journal of neuroradiology 2012, 33, 1088–1094. [Google Scholar] [CrossRef]
- Taguchi, K.; Itoh, T.; Fuld, M.K.; Fournie, E.; Lee, O.; Noguchi, K. “X-map 2.0” for edema signal enhancement for acute ischemic stroke using non–contrast-enhanced dual-energy computed tomography. Investigative radiology 2018, 53, 432–439. [Google Scholar] [CrossRef] [PubMed]
- van Ommen, F.; Dankbaar, J.W.; Zhu, G.; Wolman, D.N.; Heit, J.J.; Kauw, F.; Bennink, E.; de Jong, H.W.; Wintermark, M. Virtual monochromatic dual-energy CT reconstructions improve detection of cerebral infarct in patients with suspicion of stroke. Neuroradiology 2021, 63, 41–49. [Google Scholar] [CrossRef] [PubMed]
- Chen, H.; Bodanapally, U.K.; Colasurdo, M.; Malhotra, A.; Gandhi, D. Clinical Applications of Dual-Energy Computed Tomography for Acute Ischemic Stroke. Stroke: Vascular and Interventional Neurology 2024, 4, e001193. [Google Scholar] [CrossRef]
Figure 1.
A/B/C: 80 kV CT scan with respective GM and WM segmentation masks; D/E/F: sn150 kV scan with respective GM and WM segmentation masks
Figure 1.
A/B/C: 80 kV CT scan with respective GM and WM segmentation masks; D/E/F: sn150 kV scan with respective GM and WM segmentation masks
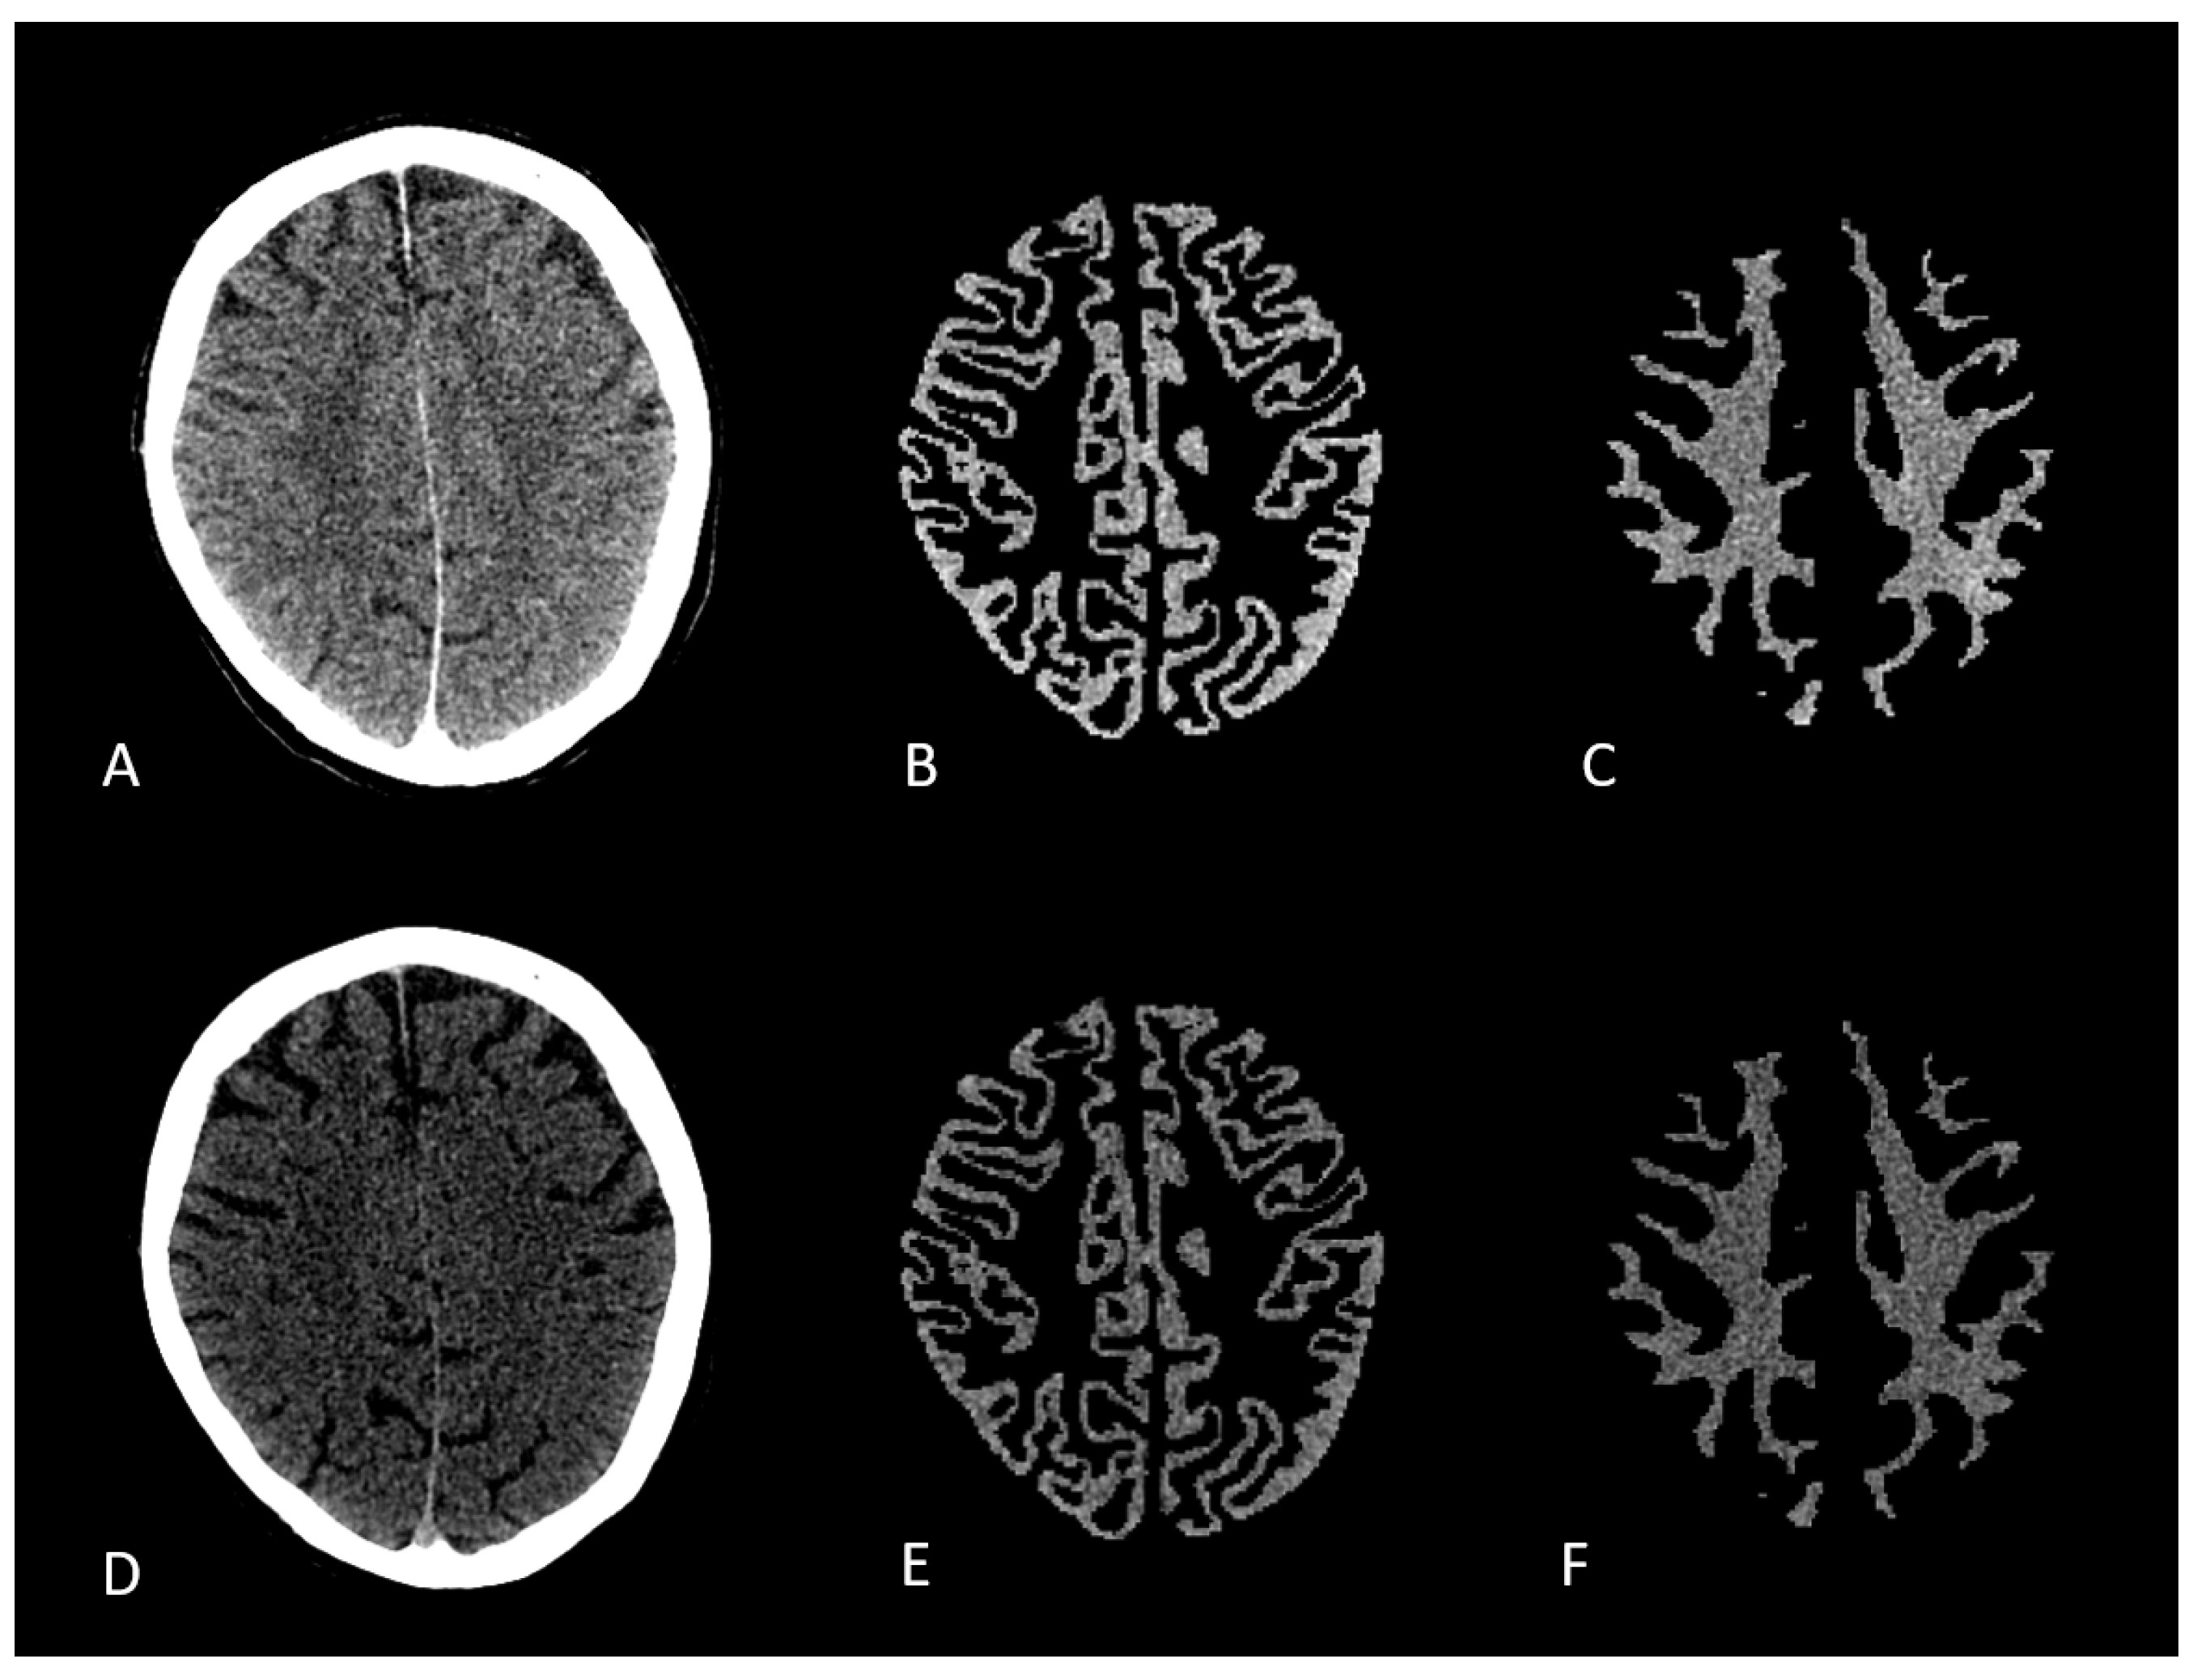
Figure 2.
CT-Images of a 71 year old male after recanalization of a M1-occlusion on the left. A: Mixed images with no visible infarction of the basal ganglia, B: Conventional Virtual non-contrast-map with barely visible infarction, C: Follow-up CT after 5 days with Infarction of the basal ganglia, D: Edema-map at smoothing level 1 with visible infarction of the basal ganglia, D: Edema-map at smoothing level 3 with clearly visible infarction of the basal ganglia and good image quality, E: Edema-map at smoothing level 5 with clearly visible infarction of the basal ganglia.
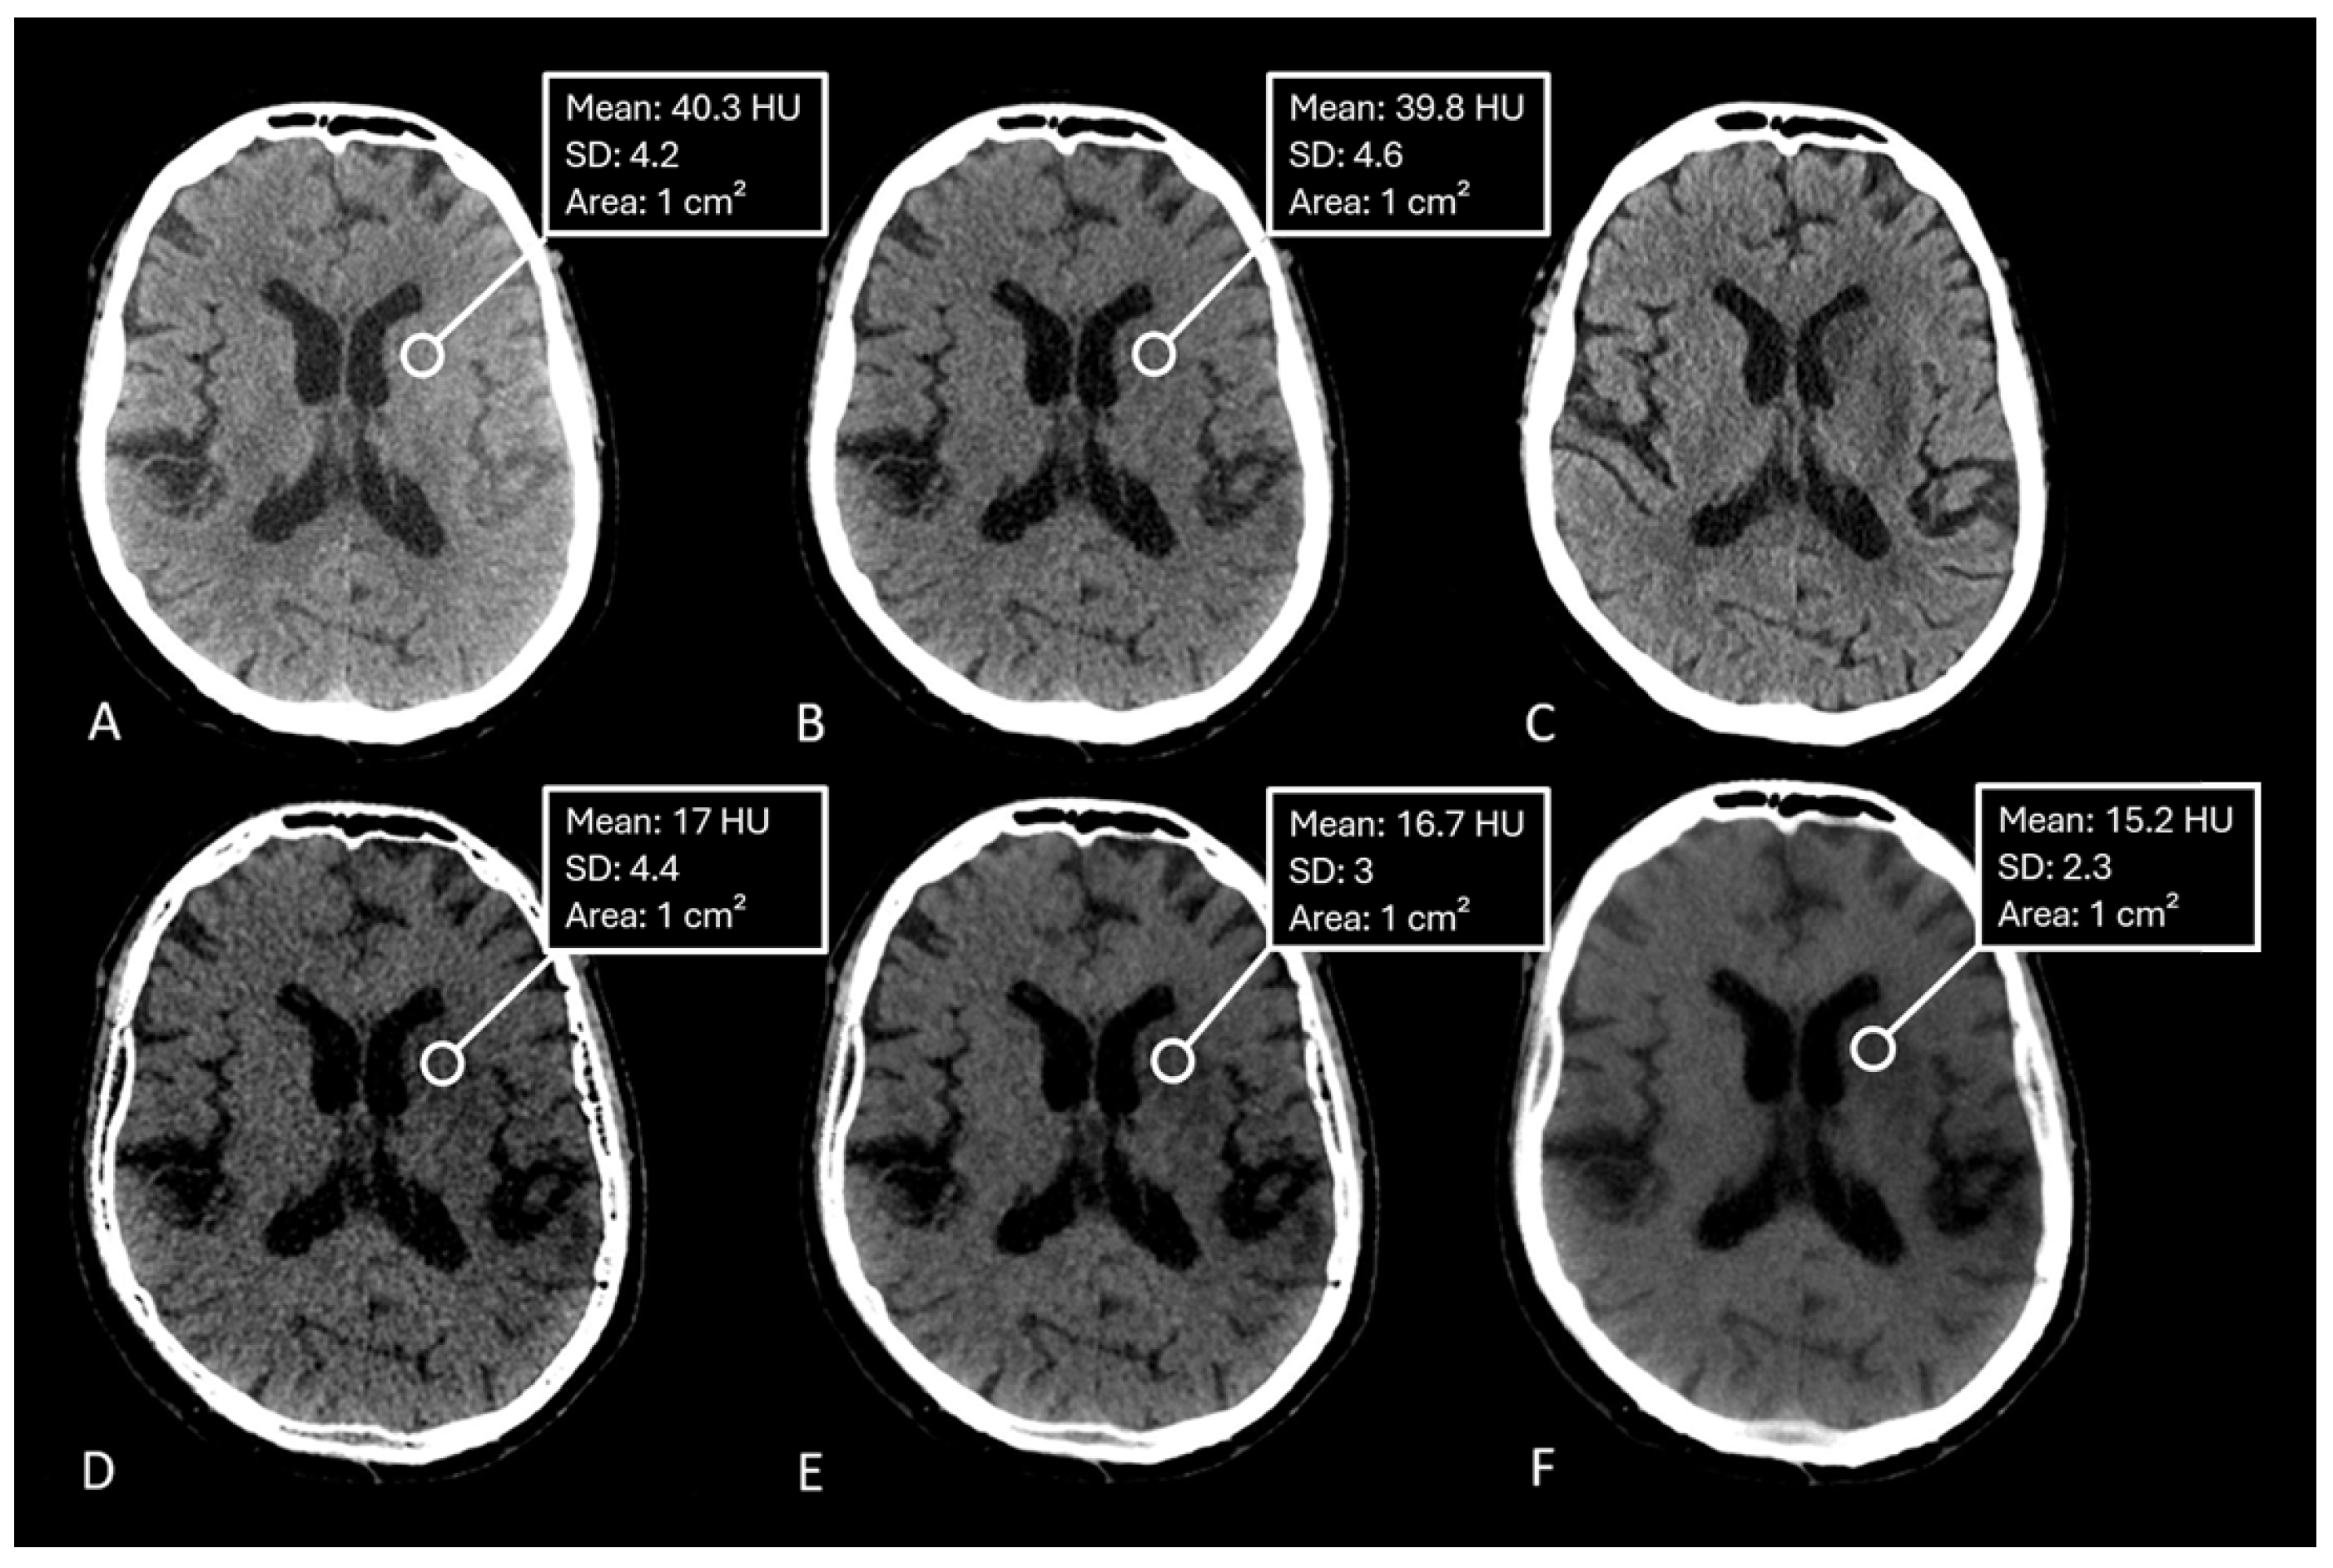
Figure 3.
Boxplots of Hounsfield unit distribution of different reconstruction parameters of VNC and Edema maps
Figure 3.
Boxplots of Hounsfield unit distribution of different reconstruction parameters of VNC and Edema maps
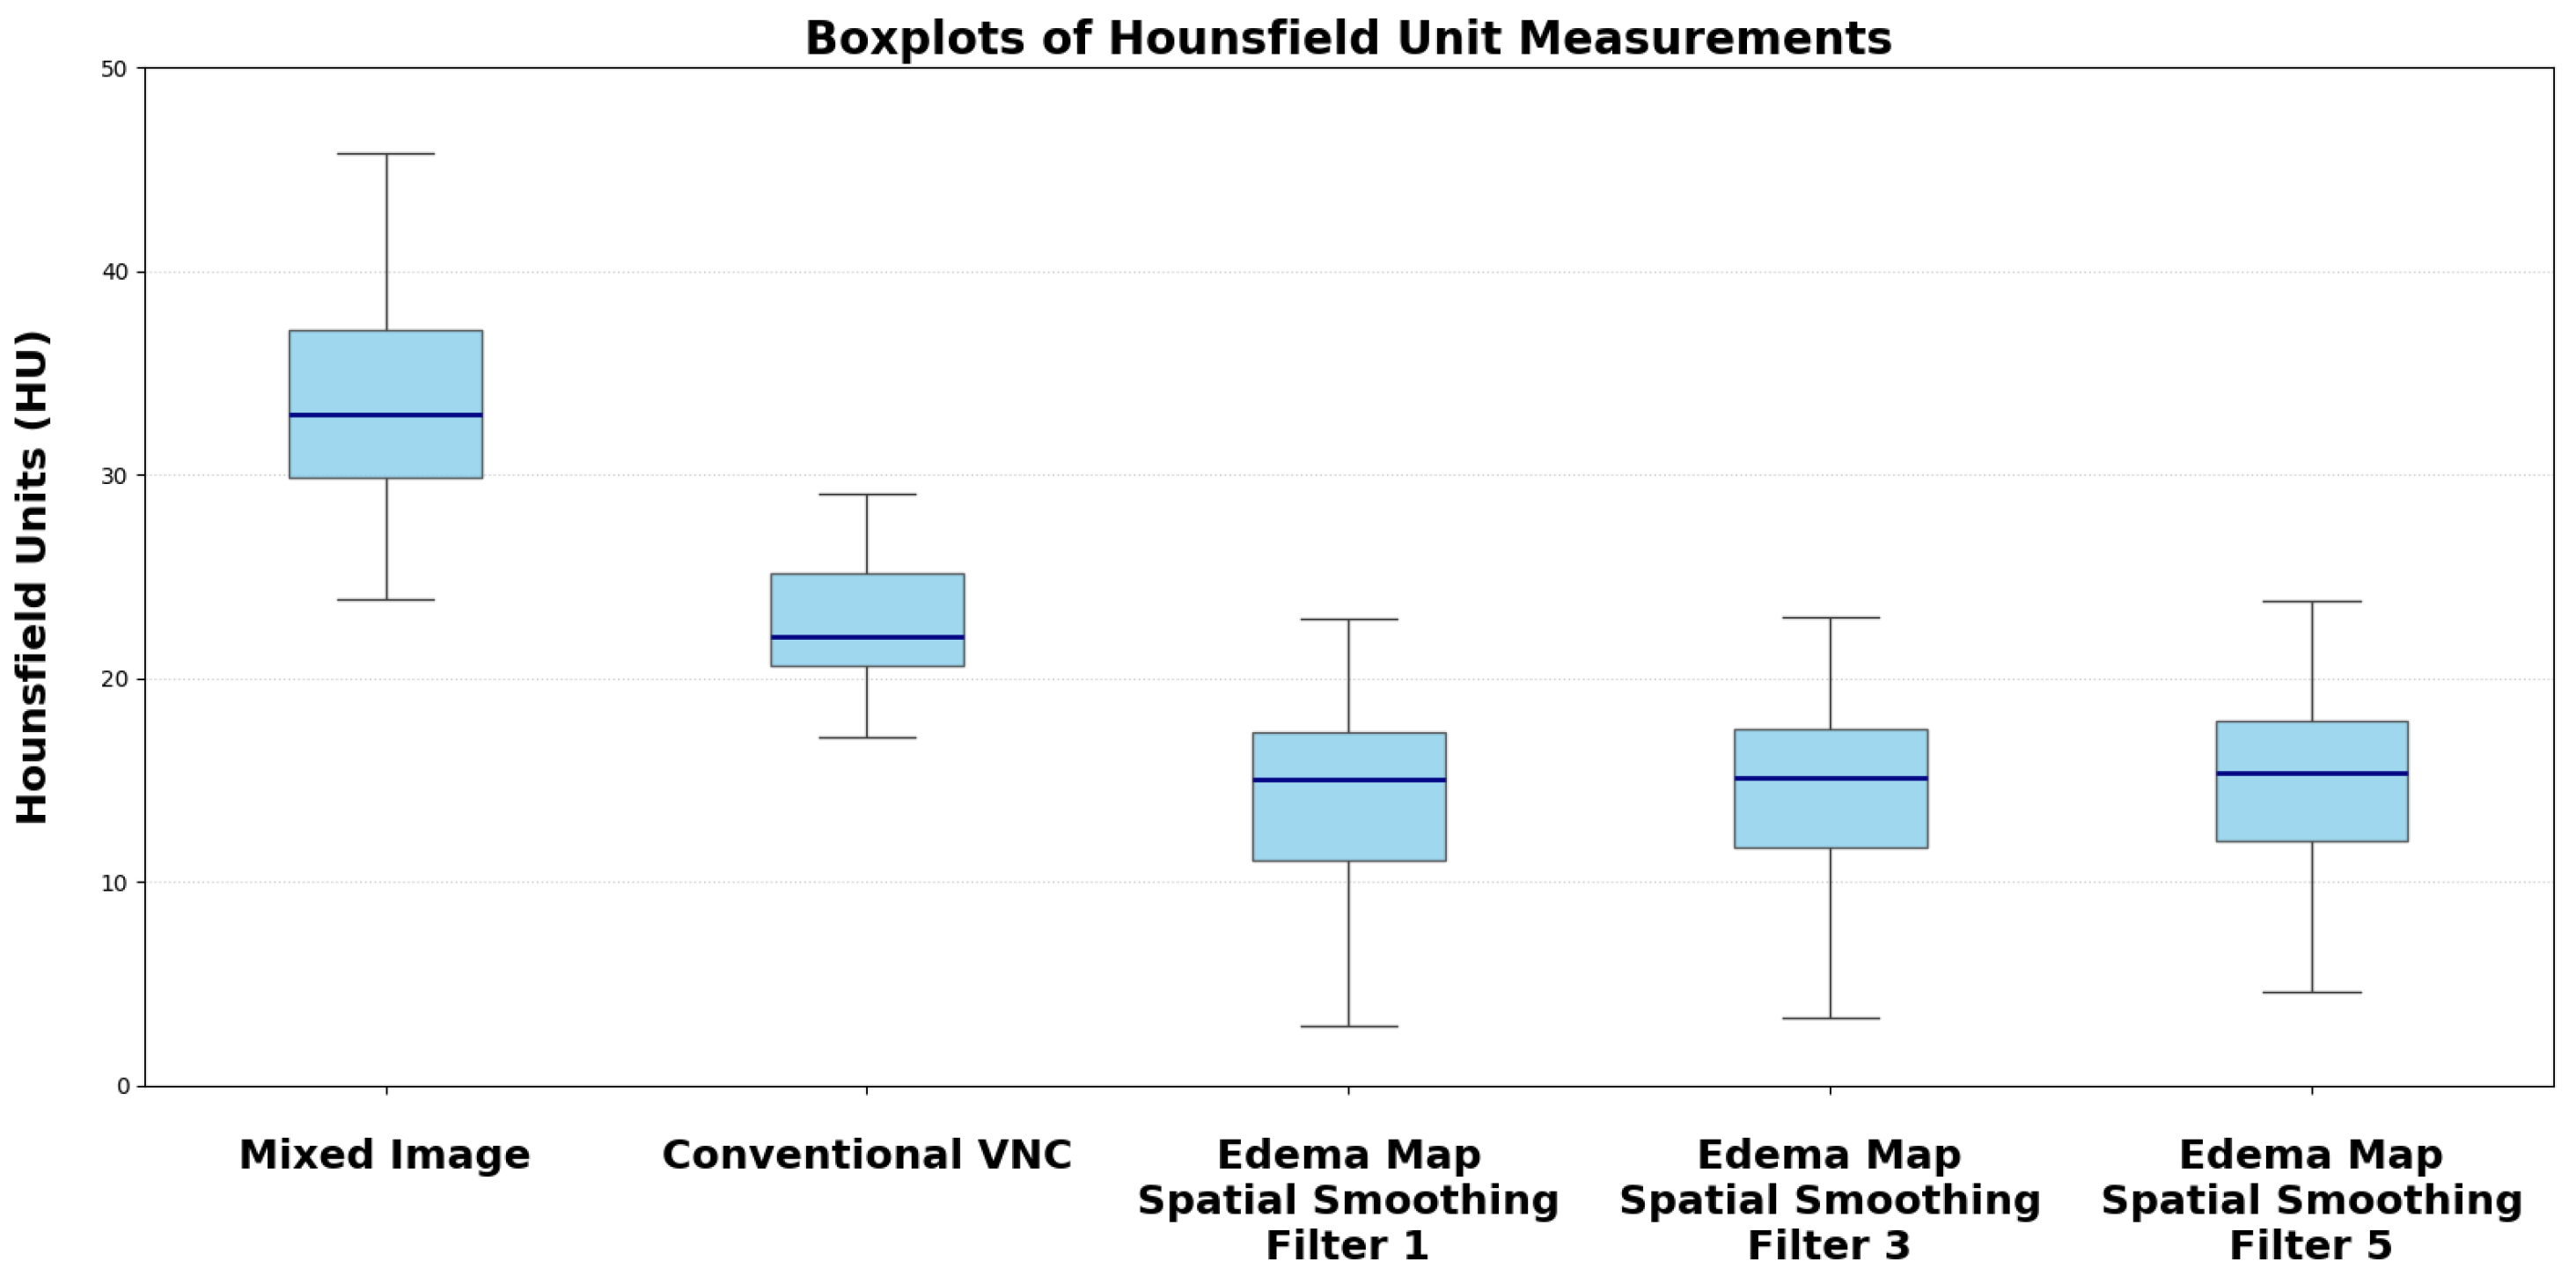
Figure 4.
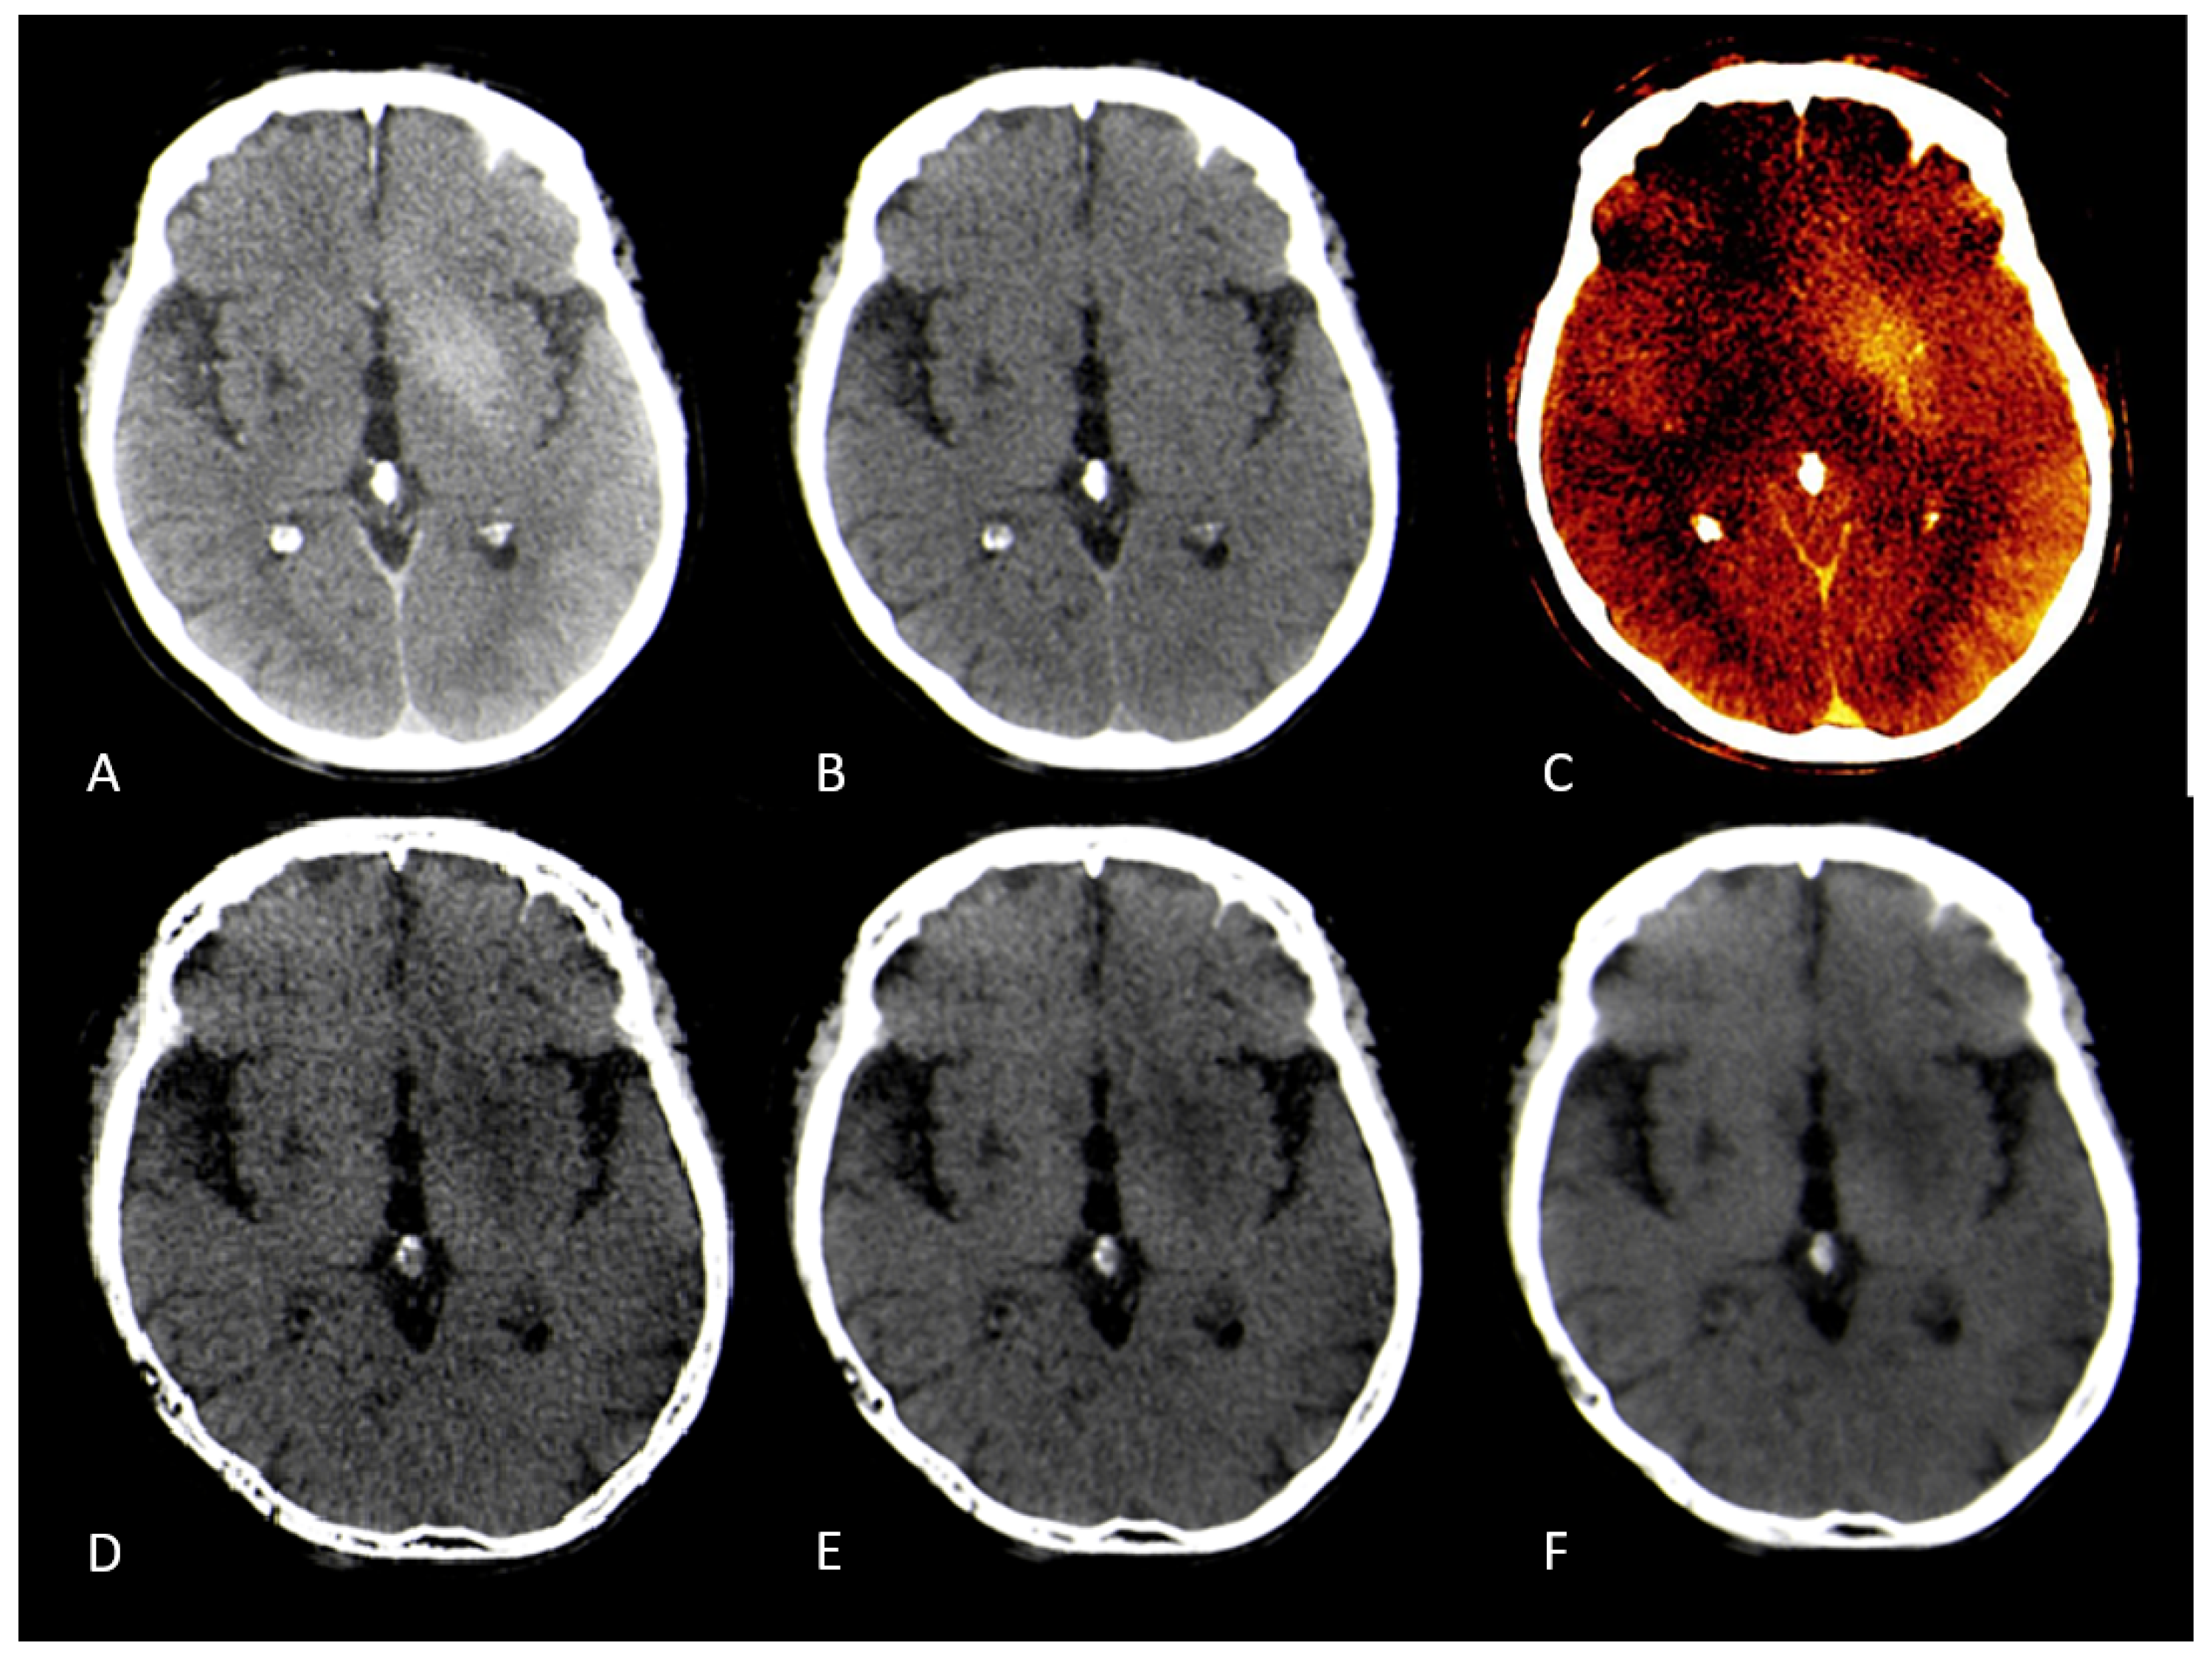
CT-Images of a 90 year old female after recanalization of a left-sided M1-occlusion. A: Conventional mixed images with contrast staining of basal ganglia, B: Conventional Virtual non-contrast-map with barely visible infarction, C: Iodine-map confirming contrast staining of basal ganglia, D: Edema-map at smoothing level 1 with clearly visible infarction of the basal ganglia and high image noise, E: Edema-map at smoothing level 3 with clearly visible infarction of the basal ganglia and good image quality, F: Edema-map at smoothing level 5 with clearly visible infarction of the basal ganglia and loss of detail due to high smoothing.
Figure 4.
CT-Images of a 90 year old female after recanalization of a left-sided M1-occlusion. A: Conventional mixed images with contrast staining of basal ganglia, B: Conventional Virtual non-contrast-map with barely visible infarction, C: Iodine-map confirming contrast staining of basal ganglia, D: Edema-map at smoothing level 1 with clearly visible infarction of the basal ganglia and high image noise, E: Edema-map at smoothing level 3 with clearly visible infarction of the basal ganglia and good image quality, F: Edema-map at smoothing level 5 with clearly visible infarction of the basal ganglia and loss of detail due to high smoothing.
Disclaimer/Publisher’s Note: The statements, opinions and data contained in all publications are solely those of the individual author(s) and contributor(s) and not of MDPI and/or the editor(s). MDPI and/or the editor(s) disclaim responsibility for any injury to people or property resulting from any ideas, methods, instructions or products referred to in the content. |
© 2025 by the authors. Licensee MDPI, Basel, Switzerland. This article is an open access article distributed under the terms and conditions of the Creative Commons Attribution (CC BY) license (http://creativecommons.org/licenses/by/4.0/).
Copyright: This open access article is published under a Creative Commons CC BY 4.0 license, which permit the free download, distribution, and reuse, provided that the author and preprint are cited in any reuse.


