
Submitted:
24 July 2025
Posted:
25 July 2025
You are already at the latest version
Abstract
Chondrosarcoma is the most common type of primary bone sarcoma in adults but with a high risk of local recurrence and metastasis. Most chondrosarcomas are resistant to chemotherapy and radiotherapy, which means that surgery is the only effective treatment option for the majority of patients. Therefore, new therapeutic targets are required. CD44 is a transmembrane protein that has roles in cell proliferation, adhesion and migration and it has already been shown to be overexpressed in several cancer types. In this study, chondrosarcoma patient tissue sections were characterised for CD44 expression using immunohistochemistry. The relationship between CD44 expression in the patient tissue and overall and event-free survival was then investigated. CRISPR/Cas9 gene editing was also used to knockout CD44 from chondrosarcoma cells which were used in a spheroid invasion assay to understand the role of CD44 in chondrosarcoma cell invasion. Cox multivariate analysis of CD44 expression by chondrosarcoma patient tissue revealed that high CD44 expression was linked to decreased overall and event-free survival. Furthermore, the invasion of the CD44 knockout cells in the spheroid invasion assay was less than the invasion of the wild-type cells. Increased expression of CD44 for intermediate and high grades of chondrosarcoma as well as reduced invasion of CD44 knockout cells suggests that CD44 plays an important role in chondrosarcoma metastasis. CD44 is therefore worthy of further investigation as an imaging and therapeutic target.
Keywords:
chondrosarcoma
; CD44
; solid tumour
; immunohistochemistry
; CRISPR
; spheroid
; invasion
1. Introduction
Sarcomas are a group of cancers which can originate in bones and connective tissues in any anatomical site [1]. Chondrosarcoma is the most common type of primary bone sarcoma in adults and is characterised by the production of a cartilaginous matrix [2]. Chondrosarcoma tumours are most commonly found in the pelvis and long bones such as the femur and humerus [3]. Between 1998 and 2007, an average of 113 patients were diagnosed with chondrosarcoma each year in England [4]. The most common age range for chondrosarcoma to occur is 50 – 70 years old and it has been shown that younger patients with chondrosarcoma have a better prognosis [5]. The 2020 WHO classification of chondrosarcomas states the following subgroups: conventional central (grades 1, 2 and 3), secondary peripheral (grades 1, 2 and 3), periosteal, dedifferentiated, mesenchymal, and clear cell chondrosarcoma. Grade 1 chondrosarcomas are characterised by the presence of chondrocytes with small nuclei, whereas characteristics of a grade 2 tumour include less matrix and more cells with enlarged nuclei. Grade 1 tumours in the appendicular skeleton have been reclassified as atypical cartilaginous tumours (ACTs) because they have a very low risk of metastasis and most simply require observation with surgery considered in some cases [6]. Grade 3 tumours are the most invasive and are even more cellular with less matrix than grade 2 with large, often spindle-shaped nuclei [2]. Dedifferentiated chondrosarcomas are identified due to a low-grade cartilaginous component which abruptly transitions to a high-grade non-cartilaginous component. Patients with dedifferentiated chondrosarcoma have a very poor prognosis due to its highly invasive nature which often results in widespread metastatic disease [7]. As they are so aggressive, dedifferentiated chondrosarcomas can be referred to as grade 4 tumours with a conservative 5 year overall survival estimate of 32% [8]. Metastasis occurs in approximately 24% of chondrosarcoma patients with the risk of metastasis increasing with tumour grade [9].
The main treatment method for chondrosarcoma is wide surgical resection where, for high grade chondrosarcoma, a clear surgical margin of at least 4 mm is recommended to reduce the risk of local recurrence, which is significantly increased when a margin smaller than this is achieved [10]. However, a sufficient tumour margin is not always possible, especially in the pelvis where critical neurovascular strucutres are in very close proximity to, or even involve, the tumour [11]. Most chondrosarcomas are resistant to chemotherapy but some conventional chemotherapy agents such as doxorubicin or cisplatin can show some effect in mesenchymal and dedifferentiated chondrosarcomas [12]. Additionally, apart from tumours arising in the skull base, most chondrosarcomas are resistant to radiotherapy and it is usually reserved for patients where surgery is not possible, or those with incomplete resection [13].
Cluster of differentiation 44 (CD44) is a transmembrane glycoprotein expressed by lymphocytes, smooth muscle cells, fibroblasts and epithelial cells. In healthy tissues CD44 is required for cell adhesion, hyaluronic acid degradation and the release of cytokines [14]. CD44 consists of 19 exons in humans where the first five and last five exons are the same for all forms of CD44 and it is these 10 exons that form the standard form of CD44 (CD44s). Up to nine of the remaining central exons are alternatively spliced to form the variant forms of CD44 (CD44v2 – CD44v10) [15].
CD44 is the main receptor of hyaluronic acid but other ligands of CD44 are collagen, fibronectin and laminin [16]. When hyaluronic acid binds to CD44, the interaction of hyaluronic acid with CD44 can regulate pathways that are involved in cell proliferation and migration as well as angiogenesis and inflammation [17]. For example, hyaluronic acid binding to CD44 has been shown to activate the phosphatidylinositol 3 kinase/AKT pathway which is important in cell cycle regulation. This occurs because rho-associated coiled coil containing protein kinase (ROCK) activity is stimulated by hyaluronic acid binding to CD44. This then leads to an increase in serine/threonine phosphorylation of the Gab-1 protein which in turn activates phosphatidylinositol 3 kinase and this activates AKT signalling [18]. AKT is able to promote cell proliferation and survival by inactivating pro-apoptotic proteins [19]. Binding of hyaluronic acid to CD44 can also contribute to cell migration via actin cytoskeleton contractability by activating the Rho GTPase, Ras homolog family member A (RhoA) which can activate ROCK. ROCK can phosphorylate myosin which is required for cell migration [20].
Increased CD44 expression is linked to a higher tumour grade for a range of cancer types including ovarian [21], triple-negative breast cancer [22] and meningioma [23]. CD44 may contribute to cancer cell invasion due to its role in the process of epithelial-mesenchymal transition (EMT). During EMT, stationary epithelial cells transition to invasive mesenchymal cells through morphogenic changes and altered cell surface expression [24]. It has been shown that during EMT, CD44 is required to change isoforms from CD44v to CD44s. CD44s is able to activate AKT and AKT can lead to a reduction in epithelial cadherin expression which is needed for cell-cell adhesion in epithelial cells. It has also been shown that a knockdown of CD44 resulted in inhibition of EMT due to the unavailability of CD44s [25]. Additionally, CD44 has been shown to lead to an increase in angiogenesis. Angiogenesis is an important process in tumour growth and invasion because neovasculature can provide the tumour with nutrients and oxygen as well as the removal of waste products which prevents the tumour from becoming necrotic [26]. The presence of CD44 on blood vessel walls allows endothelial cells to adhere to extracellular matrix components which are required for the formation of blood vessels. Furthermore, hyaluronic acid binding to CD44 can lead to an increase in vascular endothelial growth factor expression which is required for the formation of new blood vessels [27]. CD44 can also advance cancer cell invasion by promoting the secretion of matrix metalloproteinase-9 (MMP-9), which can degrade type IV collagen which is the main type of collagen in the basement membrane of the extracellular matrix (ECM) [28]. Furthermore, CD44 can form clusters which trap MMP-9 on the cell membrane, promoting membrane degradation and enabling tumour cell invasion [29].
One of the objectives of this study was to investigate whether CD44 could be used as a future therapeutic or imaging target for chondrosarcoma. A clinical trial of RG7356 (ID NCT01358903), a recombinant immunoglobin G1 monoclonal antibody which binds near the hyaluronic acid binding region of CD44 has been undertaken on patients with CD44-expressing solid tumours, although no patients had chondrosarcoma [30]. The results of the trial showed that although no safety concerns with RG7356 arose, the clinical efficacy was modest. A subgroup of the patients involved in this trial were also recruited for imaging studies using PET imaging with 89Zirconium-labelled RG7356 [31]. The PET imaging revealed that tumour uptake of the CD44 antibody in some tissues was dose-dependent suggesting that immune-PET imaging with this antibody could be beneficial for a non-invasive measure of drug uptake.
In this study, CD44 expression in chondrosarcoma patient tissue and patient-derived chondrosarcoma cells was characterised in order to evaluate whether CD44 could be a potential therapeutic target for chondrosarcoma. To understand the role of CD44 in chondrosarcoma cell invasion, CRISPR/Cas9 gene editing was used to knockout CD44 in the HT-1080 chondrosarcoma cells and the cells were used in a spheroid invasion assay.
2. Materials and Methods
2.1. Cell Culture
The HT-1080 human dedifferentiated chondrosarcoma cell line was purchased from American Type Culture Collection. The patient-derived cells were extracted from the patient tissue as previously outlined [32]. Patient-derived cells from two different patients were cultured. The 13095 cells were derived from the pelvis of a patient with a grade 2 secondary chondrosarcoma arising from an osteochondroma. The 13073 cells were derived from the pelvis of a patient with a grade 3 primary chondrosarcoma. Both the HT-1080 cells and patient-derived cells were cultured in RPMI 1460 medium (Sigma-Aldrich, R8758) supplemented with 10% foetal bovine serum (Gibco, A5256701) and 1% penicillin-streptomycin (Sigma-Aldrich, P0781). All cells were cultured in a humidified incubator at 5% CO2 and 37 oC in a T-25 or T-75 cell culture flask (Corning, 430639 and 430641U). The cells were subcultured when they reached a confluency of 80-95%.
2.2. Immunohistochemistry
2.2.1. Patient Tissue Slides
Chondrosarcoma tissue from 46 patients was obtained from the Newcastle Biobank (IRAS 233551, REC 17/NE/0361). The tissues were collected between 2011 and 2023. A total of 49 tissue sections were analysed as two patients had multiple slides due to recurrence. The tumours were confirmed as chondrosarcoma and graded by specialist sarcoma pathologists at the North of England Bone and Soft Tissue Tumour Service. Tissues were obtained from patients with a median age of 54 (range 10 – 89 years). A total of 20 tissue samples were obtained from female patients and 29 samples were obtained from male patients. The tissue was sliced into 4 μm slices. The sections were taken from chondrosarcomas with different grades including 14 grade 1/ACT, 17 grade 2, 18 grade 3.
2.2.2. Generation of Patient-Derived Cell Block
Cell blocks for the 13095 and 13073 patient-derived cells were created by trypsinising two confluent T-75 flasks for each cell line and centrifuging them at 250 x g for 5 minutes. The cell pellet was washed in PBS and centrifuged again. The cell pellet was resuspended in 2 mL 4% formaldehyde (Genta Medical, BFN010) for 1 hour. The cells were centrifuged at 250 x g for 5 minutes and resuspended in 300 μL HistoGel (Epredia, HG-4000-012) and then centrifuged for 30 seconds at 14,000 rpm. The cells were then placed on ice for 30 minutes. The cells in the HistoGel were transferred into a tissue cassette (Simport, M492) and then processed using a Leica TP 1020 tissue processor. Processing steps included placing the samples in ethanol (Thermo Fisher Scientific, E/065DF/17), xylene (VWR, 28975.325) and paraffin wax (CellPath, cellwax plus). Finally, the cell pellet was encased in paraffin wax using a modular tissue embedding centre (Myr, EC 350) and once set, it was sliced into 4 μm slices using a microtome. The slices were placed on slides (VWR, 631-0108) and heated for 2 hours to dry in preparation for staining.
2.2.3. Antibody Staining of Patient Tissue and Cell Block Slices
The slides were first de-waxed and hydrated. Initially, the slides were soaked in three separate tubs of xylene for 5 minutes each time. They were then soaked in three separate tubs of 100% ethanol for 1 minute each time. This was followed by 95% ethanol for 1 minute, 70% ethanol for 1 minute, then 50% ethanol for 1 minute and then distilled water for 1 minute. Antigen retrieval was carried out by placing the slides in a pressure cooker containing citrate buffer. The citrate buffer consisted of 2.1 g citric acid (Thermo Fisher Scientific, 423565000) dissolved in 750 mL distilled water with 2 M sodium hydroxide (Scientific Laboratory Supplies, 71474) added until a pH of 6 was reached. Distilled water was added to make the solution up to 1 litre. The slides were heated in the pressure cooker for 15 minutes before turning the pressure cooker off and allowing it to cool. The slides were then washed in TBS on a rocker for 5 minutes, three times. The TBS solution was made from diluting 500 mL 20x stock in 9.5 L distilled water. The 20x stock was made by dissolving 26 g tris(hydroxymethyl)aminomethane (Sigma-Aldrich, 252859) and 320 g sodium chloride (Acros organics, 207790050) in 15 mL 6 M hydrochloric acid solution (Honeywell, 017-002-01-X). The pH was then adjusted to 7.6 using 1 M hydrochloric acid solution and then the volume was made up to 2 L using distilled water. During the wash, a 3% hydrogen peroxide solution was made by diluting 30% stock hydrogen peroxide (Thermo Fisher Scientific, H/1750/15) 1:10 in TBS. The slides were then washed in the hydrogen peroxide solution for 15 minutes on a rocker. Next, the slides were washed in TBS-T for 5 minutes on a rocker three times. TBS-T consisted of 9480 mL distilled water, 20 mL Tween 20 (Promega, H5151) and 500 mL 20x TBS. During this time, the blocking solution was made which consists of 5% goat serum (Capricorn Scientific, GOA-1B) in 1% BSA (Sigma-Aldrich, 810033) in TBS. The excess liquid was then tapped off a slide and a hydrophobic pen (Thermo Fisher Scientific, R3777) was used to draw around the area of cells or tissue that needed to be stained. 100 μL of the blocking solution was added within the area drawn by the hydrophobic pen and the slide was left in a humidity chamber at room temperature for 1 hour. The blocking solution was removed from each slide and 100 μL of the primary antibody solution was added to each slide which consisted of the CD44 mouse antibody (Cell Signalling, 5640S) diluted 1:1000 in TBS for the cell block slices and 1:500 for the patient tissue. The slides were left in the humidity chamber overnight at 4 oC. The following day, the primary antibody solution was removed from the slides, and they were washed in TBS-T for 5 minutes three times. During the washes, the secondary antibody solution was made which consisted of polyclonal goat anti-mouse immunoglobulins conjugated with horseradish peroxidase (HRP, Dako, P044701-2) diluted 1:1000 in TBS. The secondary antibody was left on the slides for 1 hour at room temperature in a humidity chamber. The secondary antibody solution was removed from the slides and they were washed in TBS-T for 5 minutes three times. The 3,3’-diaminobenzidine (DAB) solution was made by mixing 30 μL SignalStain DAB Chromogen Concentrate with 1 mL SignalStain DAB Diluent (Cell Signalling, 8059). 100 μL of the DAB solution was added to each slide for 5 minutes. The DAB solution was removed from each slide and the slides were washed in DI water for 3 minutes. The slides were then rapidly dipped in Gill 3 hematoxylin (Epredia, 6765009) to counterstain the slides. Once dipped, the slides were washed in running tap water for 3 minutes, placed in Scott’s tap water for 1 minute and washed in running tap water again for 3 minutes. Scott’s tap water consists of 2 L of distilled water, 7 g sodium hydrogen carbonate (Thermo Fisher Scientific, A17005.36) and 40ig magnesium sulfate heptahydrate (Thermo Fisher Scientific, A14491). The slides were then dehydrated by placing them in 50% ethanol for 1 minute, 95% ethanol for 1 minute, 70% ethanol for 1 minute, 50% ethanol for 1 minute then 2 minutes in three separate containers of xylene. The slides were then mounted with cover slips using a dibutylphtalate polystyrene xylene mountant (Sigma-Aldrich, 06522) which was left overnight to set. All slides were scanned using a Leica Aperio CS2 using a 20x objective lens.
2.2.4. Quantification of Antibody Staining
QuPath software was used to quantify the staining intensity of the patient tissue slides that had been stained with an antibody for CD44 [33]. The CD44 staining on the chondrosarcoma patient tissue slices was quantified using the positive cell detection tool on QuPath. An area of interest on the tissue was first selected using the annotation tool before running positive cell detection which resulted in the H-score of the region of interest. The H-score is calculated by: (1 x percentage of weak staining) + (2 x percentage of moderate staining) + (3 x percentage of strong staining), resulting in a value between 0 and 300 [34].
2.3. Flow Cytometry
Cells were washed with PBS then incubated for up to 20 minutes at 37 oC, and 5% CO2 with 10 mL flow buffer consisting of 50 mL PBS, 2.5 mL 0.2 mM EDTA (Sigma-Aldrich, E6758) and 2.5 mL BSA (MACS, 130-091-376). 1x10⁶ cells in 100 μL flow buffer were transferred to FACS tubes (Falcon, 352003) on ice. An additional 650 μL flow buffer was added to the tube that would be the unstained sample. For the stained samples, 3 μL human Seroblock (Bio-Rad, BUF070A) was added to each tube and incubated on ice for 10 minutes. Then either 3 μL FITC isotype control antibody (BD Biosciences, 555748) per 1x10⁶ cells or 3 μL CD44 FITC antibody (BD Biosciences, 560977) per 1x10⁶ cells was added to the relevant tubes and incubated on ice in the dark for 50 minutes. The cells were then washed twice by adding 1 mL flow buffer to the tubes followed by centrifugation at 250 x g for 5 minutes. The pellets were resuspended in 750 μL flow buffer and the samples were analysed using a BD LSRFortessa X-20 (BD Biosciences) with the 488 nm laser and 530/30 bandpass filter. Dead cells and doublets were excluded by the use of appropriate gating. Flow cytometry data was analysed using FCS Express 7 software (De Novo software).
2.4. CD44 Knockout
2.4.1. Lipofectamine CRISPR Transfection
The day prior to the transfection, 1x10⁵ cells were seeded in the wells of a 24 well plate (Corning, 3524). On the day of the transfection, the old media was removed and replaced with fresh media. The TrueGuide Synthetic sgRNA (Thermo Fisher Scientific, CRISPR807011_SGM) was diluted in Opti-MEM (Thermo Fisher Scientific, 31985062) to a concentration of 250 ng/μL. In a 1.5 mL microcentrifuge tube, 8.25 μL Lipofectamine MessengerMax (Invitrogen, LMRNA015) and 137.5 μL Opti-MEM were vortexed and incubated at room temperature for 5 minutes. In a different 1.5 mL microcentrifuge tube, 50 μL Opti-MEM and 1 μL GeneArt Cas9 Nuclease 1 μg/μL (Thermo Fisher Scientific, A29378) were mixed well by pipetting. 1 μL of the 250 ng/μL sgRNA was also added to this tube which was then mixed well by pipetting followed by vortexing. 50 μL of the diluted Lipofectamine MessengerMax solution from the first tube was then added to the second tube. The solution was mixed by gentle pipetting. The tube was incubated for 15 minutes at room temperature. 50 μL of this solution was added to the well that contained the cells to be transfected. The plate was gently agitated and incubated at 37 oC for 40-48 hours. The old media was then removed from the wells and the cells were washed with PBS, trypsinised and transferred to a T-25 flask to be continuously cultured.
2.4.2. Fluorescence Activated Cell Sorting
Following flow cytometry to check that the CRISPR knockout was successful, cells were sorted using fluorescence activated cell sorting (FACS) to separate the wild-type (WT) cells from the knockout (KO) cells. Cells were prepared for sorting by following the flow cytometry protocol. The media that was aspirated from the flasks containing the cells was kept and sterile filtered using a 0.2 μm filter (Sartorius, 17823) and a 20 mL syringe (BD, 613-3921). The filtered media was used to make conditioned media by mixing it with equal quantities of fresh media. Each well of a 96 well plate was filled with 100 μL of the conditioned media prior to the sort. Before sorting, 5 μL DAPI was also added to each tube (Roche, 10236276001). The cells were sorted using a BD FACSAria Fusion flow cytometer using the 100 μm nozzle where single cells were deposited into each well of the 96 well plate containing the conditioned media. Gating was used to discard dead cells, doublets, debris and cells that were bound to the CD44 antibody meaning only cells that had CD44 knocked out were deposited into the plate. The single cells were then continuously cultured.
2.5. qRT-PCR
2.5.1. RNA Extraction
Cells for RNA extraction were grown in the wells of a 6 well plate (Corning, 3516) until confluency. The RNA was extracted using the RNeasy mini kit (Qiagen, 74104) as per the manufacturer’s instructions for animal cells.
2.5.2. cDNA Synthesis
The cDNA was synthesised from the RNA samples using the Applied Biosystems High-Capacity cDNA Reverse Transcription kit (Thermo Fisher Scientific, 4368814) according to the manufacturer’s instructions. The master mix was prepared which consisted of 2 μL 10x RT buffer, 0.8 μL 25x dNTP mix, 2 μL 10x RT random primers, 1 μL MultiScribe reverse transcriptase and 4.2 μL nuclease free water per reaction. 1000 ng of each sample was prepared in 10 μL molecular grade water (waternation, MLG1) which was mixed with 10 μL of the master mix in a PCR tube (Starlab, I1405-8100) and then centrifuged for 10 seconds at 14,000 rpm. A Techne Prime thermocycler was then used to run the samples in the cycle outlined in the manufacturer’s instructions. Samples were then centrifuged for 10 seconds at 14,000 rpm and stored at -20 oC.
2.5.3. RT-PCR
For each 10 μL reaction, a master mix was made which consisted of 5 μL PowerTrack SYBR green (Thermo Fisher Scientific, A46012), 2 μL molecular grade water, 0.5 μL forward primer (Thermo Fisher Scientific, 10336022) and 0.5 μL reverse primer (Thermo Fisher Scientific, 10336022). The primer sequences were chosen so that they were away from any sections of DNA that were knocked out as this would prevent the primers from binding to KO cell lines. The CD44 primer sequences were taken from Zhang et al. and the forward primer sequence was 5’-CAGCTCATACCAGCCATCCA and the reverse was 5’-TGGGGTGTGAGATTGGGTTG [35]. HPRT1 was used as the housekeeper gene as a reference and the forward sequence used was 5’-TTGCTTTCCTTGGTCAGGCA and the reverse sequence was 5’-AGCTTGCGACCTTGACCATCT. The primers were used at a concentration of 10 μM. To prepare the samples for qRT-PCR, 2 μL of cDNA from each sample that had been diluted 1:3 in molecular grade water and 8 μL of the master mix was added to each well of a 384 well plate (Thermo Fisher Scientific, 4343370). Each sample was seeded in triplicate. The plate was then sealed with optical adhesive film (Thermo Fisher Scientific, 4360954) and briefly centrifuged. The QuantStudio 7 Flex Real-Time PCR system (Thermo Fisher Scientific, 4485701) was used to run the qRT-PCR using a standard run for 40 cycles. The results of the qRT-PCR were analysed using QuantStudio Real-Time PCR software.
2.6. Sanger Sequencing
2.6.1. DNA Extraction
DNA was extracted from cell pellets using QuickExtract DNA Extraction Solution (Lucigen, QE09050) as per the manufacturer’s instructions.
2.6.2. Primer Design
First, the genomic sequence of CD44 (NG_008937.1) was obtained from the National Center for Biotechnology Information (NCBI) website [36]. The target DNA sequence from the TrueGuide sgRNA was highlighted on the sequence and 200 base pair (bp) upstream and downstream of the sgRNA sequence was isolated from the full genomic sequence. This was then input into the NCBI Primer-BLAST website to design the primers with an amplicon length of 200-250 bp selected [37]. The generated primer pairs were then checked to ensure that the sgRNA sequence was centrally located between the forward and reverse primers. Once that condition was met, the primers were also checked to ensure the following conditions were also met: the length of each primer was 16-28 bp, the GC content was 40-60%, the melting temperature was 52-62 oC and the difference in melting temperature between the forward and reverse primer was less than 5 oC [38]. The CD44 forward primer sequence that was used was 5’-GGAGTCTGTCCTAAACTGAACTTA and the reverse sequence was 5’-GCAGGTCTCAAATCCGATGC (Eurofins Genomics, 12PP-001PPT).
2.6.3. Polymerase Chain Reaction
Polymerase chain reaction (PCR) was used to amplify the required DNA fragments. The forward and reverse primers were first suspended in molecular grade water to achieve a stock concentration of 100 pmol/μL. This was then used to make a working concentration of 10 pmol/μL. For each DNA sample, the following PCR mix was made: 25 μL Premix Taq DNA Polymerase Hot-Start Version (TaKaRA, R028A), 25 μL molecular grade water, 2 μL DNA extract, 1 μL 10 pmol/μL forward primer and 1 μL 10 pmol/μL reverse primer. The PCR was run using a Techne Prime Thermocycler with the lid pre-heated to 105 oC and the following cycle: 10 minutes at 95 oC, 40 cycles of 95 oC for 30 seconds, 60 oC for 30 seconds, 72 oC for 30 seconds and then 72 oC for 7 minutes with a hold temperature of 10 oC.
2.6.4. PCR Purification
The PCR products were purified using the QIAquick PCR Purification kit (Qiagen, 28104) according to the manufacturer’s instructions for purification using a centrifuge. All centrifugation steps took place at room temperature at 13,000 rpm.
2.6.5. Sanger Sequencing and Analysis
20 μL of each purified PCR product was prepared to a concentration of 1 ng/μL in molecular grade water. The samples and 65 μL of the forward primer at 10 pmol/μL were labelled and sequenced using Eurofins TubeSeq Supreme service. The .ab1 files that were obtained from Eurofins were then input into the Synthego Inference of CRISPR Edits (ICE) software for analysis [39].
2.7. Collagen Spheroid Invasion Assay
To generate the spheroids, HT-1080 cells were seeded in the wells of a 96 well ULA microplate (Corning, 7007) at a density of 3000 cells/well and incubated at 37 oC for 72 hours. Once the spheroids had formed, the media was removed from the well containing the spheroid and replaced with 100 μL of either a type I collagen hydrogel or a type I collagen hydrogel with hyaluronic acid. The collagen hydrogel solution was formed as follows: at least 24 hours before encasing the spheroids in collagen, 10 mg lyophilised type I collagen from rat tail tendon (Roche, 11179179001) was dissolved in 3.3 mL 0.2% acetic acid diluted from 100% stock (Sigma-Aldrich, A6283) to achieve a collagen concentration of 3 mg/mL which was stored at 4 oC. On the day that the spheroids were encased in collagen, a mixture of 500 μL 0.33 M sodium hydroxide and 500 μL Dulbecco’s Modified Eagle’s Medium 10x (Sigma-Aldrich, D2429) were vortexed to mix and labelled as solution A, and this was stored on ice. For the hydrogels just containing collagen, 500 μL of the collagen solution was mixed with 125 μL of solution A by gentle pipetting to avoid the formation of bubbles in the hydrogel. For the collagen hydrogels with hyaluronic acid, 100 mg medium molecular weight hyaluronic acid (Bio-Techne, GLR004) was first reconstituted in 6.67 mL PBS to achieve a concentration of 15 mg/mL. The collagen hydrogel was formed as previously described but with the addition of 25 μL hyaluronic acid. All collagen hydrogels were allowed to set for 1 hour in an incubator at 37 oC before 100 μL of media was added on top of the hydrogel. The spheroids were first imaged after the media had been added and then every 24 hours for 72 hours using a Nikon TE2000 inverted microscope. The area of the spheroids after they had first been encased in the collagen was measured using ImageJ software. This is known as the spheroid core. The coefficient of variation of the diameter of the spheroids was then calculated as outlined in the protocol by Roper and Coyle [40]. If the coefficient of variation was less than 20% then the spheroid diameters were consistent between the spheroids and the results between spheroids were comparable. ImageJ was also used to measure the final area of the spheroid after the 72 hours of invasion. The invasion area was calculated by taking the core area of the spheroid away from the final invasion area.
2.8. Statistical Analysis
All statistical analysis was carried out using GraphPad Prism 10 software. The normality of the data (p>0.05) was first checked using a Shapiro-Wilk test. For data that was normally distributed and required the comparison of more than two mean values, a Brown-Forsythe and Welch analysis of variance (ANOVA) with Dunnet’s T3 multiple comparison post-hoc test was used as the samples had different standard deviations. For data that was normally distributed and required the comparison of just two mean values, an unpaired t-test with Welch’s correction was used as the samples had different standard deviations. Survival curves in Kaplan-Meier plots were compared using a log-rank test and multivariate analysis using Cox regression was used to evaluate the prognostic value of CD44 expression.
3. Results
To understand the expression of CD44 for in vivo chondrosarcoma tumours, immunohistochemistry was used to stain 49 chondrosarcoma tumour samples. Immunohistochemistry staining of the patient tissue showed that CD44 was expressed for all tumour grades (Figure 1a - l). Positive CD44 expression was mainly observed in the cell membrane with some staining also in the cytoplasm. CD44 was generally found in clusters within the tissues except for the dedifferentiated chondrosarcoma samples where CD44 was more widespread. Quantification of the CD44 staining across the tissue samples using the H-score (Figure 1m) showed that the staining intensity of the low grade (grade 1) tumours was significantly lower than the staining intensity of the intermediate grade (grade 2) and high grade (grade 3) tumours.
To determine risk factors that may affect the overall survival (OS) and event free survival (EFS) of chondrosarcoma patients, survival analysis was undertaken. Kaplan-Meier survival analysis of CD44 expression suggested that high CD44 expression (H-score > 84) was not linked to decreased OS (Figure 2a) or EFS (Figure 2b). Multivariate analysis using Cox regression with tumour size, CD44 expression, presence of metastasis, age and sex was also undertaken (Table 1). Cox regression revealed that tumour size, age and sex did not lead to decreased OS or EFS. However, CD44 expression had an impact on OS (HR = 1.031, p = 0.0060) and EFS (HR = 1.020, p = 0.0057). Presence of metastasis also had an impact on OS (HR = 17.41, p = 0.0101) and EFS (HR = 13.35, 0.0002).
To further understand CD44 expression in chondrosarcoma cells, patient derived chondrosarcoma cells were successfully cultured and embedded to paraffin blocks. The cell blocks were sliced and immunostained for CD44 (Figure 3a). As with the patient tissue samples, the patient-derived cells showed strong positive staining for CD44, mainly in the cell membrane. Flow cytometry was used to further characterise the patient-derived cells for CD44 expression (Figure 3b and c). Both the 13095 and 13073 strongly expressed CD44.
In order to determine how CD44 affects the invasion of chondrosarcoma cells, CRISPR/Cas9 gene editing was used to knockout CD44 from HT-1080 chondrosarcoma cells. Following FACS to separate out the KO cells into a single clone, flow cytometry was used to confirm that the knockout was successful at the cell surface expression level. The histogram of cell count against CD44 signal intensity (Figure 4a) contained a low intensity peak for the unstained and CD44 stained sample as well as a high intensity peak for the stained WT sample. This suggests that at a surface level the CRISPR KO was successful. To investigate how the knockout affected CD44 mRNA expression levels in the KO cells, RNA was extracted from the WT and KO cells and qRT-PCR was used to measure the mRNA expression. The Ct values obtained from qRT-PCR were used to calculate the relative CD44 expression (Figure 4b). There was a significant difference in gene expression between the WT cells and the CD44 KO cells (p<0.01) however, the CD44 KO cells were still expressing some CD44. Therefore, to understand the genetic modifications that took place after the CRISPR transfection, Sanger sequencing was undertaken. The sequencing data was then analysed with Synthego ICE analysis which is a computational method that provides a summary of the composition of the sequences in the sample (Figure 5). The results showed that the KO cells contained just one sequence that had a deletion of 8 base pairs compared to the WT sequence and the deletion occurred at the cut site of the cas9 nuclease enzyme.
To investigate the effects of the CD44 knockout on the invasion of the HT-1080 cells, WT and CD44 KO spheroids were encased in a collagen hydrogel or a collagen hydrogel with hyaluronic acid added and allowed to invade for 72 hours. The spheroid invasion was imaged every 24 hours (Figure 6a) and the final invasion area of the spheroids after the 72 hours was calculated (Figure 6b). When the spheroids were encased in just collagen, there was a significant decrease (p<0.001) in the invasion of the KO cells compared to WT. There was also a decreased invasion (p<0.0001) for the KO cells compared to the WT cells for the spheroids encased in collagen with hyaluronic acid.
4. Discussion
The aim of this study was to increase the understanding of the expression and role of CD44 in chondrosarcoma tumours. Firstly, this work represents the largest current study to date looking into CD44 expression in chondrosarcoma patient tissue. Through immunohistochemical staining, it was shown that all of the chondrosarcoma tissue from the 49 different tissue sections expressed some CD44. This confirms that CD44 is ubiquitously expressed in chondrosarcoma tissue in vivo and highlights that CD44 could be a possible future therapeutic or diagnostic target for chondrosarcoma. Quantification of the CD44 positive staining revealed that there was significantly increased CD44 expression in the grade 3 and grade 2 tissue sections when compared to the grade 1 respectively. Grade 3 and dedifferentiated chondrosarcomas have the highest risk of metastasis [41]. This suggests that the increased invasion and metastasis of high-grade chondrosarcomas could be due to increased CD44 expression. In a study by Xu et al., breast cancer tissue microarray slides were stained for CD44 and the CD44 expression increased with tumour grade [42]. This study did not find a significant difference between CD44 expression between intermediate and high grades, suggesting that even for grade 2 tumours CD44 expression is high and could be an important marker.
Kaplan-Meier analysis was undertaken to understand whether CD44 expression had an effect on OS and EFS. The results showed that CD44 expression did not have an effect on the survival and outcomes in our studied cohort. In a previous study by Heyse et al. where CD44 expression in tissue from 30 chondrosarcoma patients was investigated, Kaplan-Meier analysis revealed that CD44s did have an effect on both OS and metastatic free survival but CD44v5 did not [43]. In this study, the CD44 antibody used was not isoform specific therefore, the lack of significance could be due to detecting cells which are expressing a variant form of CD44 rather than the standard form which could have an increased effect on patient prognosis. However, a similar result was also obtained by Neumeister et al. where Kaplan-Meier analysis showed that CD44 expression was not linked to survival in a breast cancer cohort [44]. Therefore, further studies need to be undertaken with a larger number of samples to understand if CD44 expression can predict patient prognosis.
Cox regression, however, did suggest that CD44 expression can contribute to patient prognosis. This could imply that CD44 expression alone cannot predict the prognosis of a patient but combined with other factors, it could contribute to predicting reduced OS and EFS. Multivariate analysis of EFS and CD44 expression in neuroblastoma tumours also showed that CD44 expression did affect the EFS [45]. The largest HR values that were obtained from the multivariate analysis were for metastasis which shows that a metastasis could result in a poor prognosis for chondrosarcoma patients. This is consistent with results obtained by Brown et al. where research on 472 patients with chondrosarcoma of the pelvis found that patients with metastatic chondrosarcoma had a 5-year survival of 14.7% but the patients without metastasis had a 5-year survival rate of 67.4% [46]. This highlights the importance of investigating factors that can affect tumour cell invasion because if invasion is prevented or reduced then metastasis might also be reduced.
Patient-derived chondrosarcoma cells from two patients were also successfully cultured and characterised for CD44 expression. The successful culture and characterisation of these cells is promising for the development of patient-specific treatments. Strong CD44 expression was measured in both the grade 2 and grade 3 patient-derived cells which is important as even intermediate grades of chondrosarcoma have a high metastatic potential [47].
Finally, for the first time to our knowledge, CRISPR/Cas9 gene editing was used to knockout CD44 in the HT-1080 dedifferentiated chondrosarcoma cell line. CRISPR was used to knock out CD44 from the cell lines as compared to a knockdown where a gene is silenced; a genetic knockout is precise, often has fewer off-target effects and, is permanent within the KO clone [48]. Results obtained from flow cytometry suggest that at a cell surface level, CD44 was no longer expressed by the KO cells but qRT-PCR results suggest that although significantly less than the WT cells, the KO cells still express some CD44 mRNA. In previous work by Kapahnke et al. CRISPR was used to knockout the flotillin-1 gene from HeLa cells [49]. Similarly to this study, qRT-PCR showed that some of the HeLa KO cells had similar mRNA expression levels as the WT cells. mRNA sequencing of the clones showed that for a KO clone that still had high levels of mRNA expression, an exon had been deleted and alternative splicing had occurred. However, in this study Sanger sequencing showed that at a DNA level, the knockout was a full homogenous knockout.
A 3D spheroid invasion assay was then used to investigate the effect of the knockout on chondrosarcoma cell invasion. Spheroid invasion assays are a useful technique that can represent the in vivo tumour and cell-cell interactions [50]. The spheroid invasion assay showed that the CD44 KO cells invaded significantly less than the WT cells. This suggests that CD44 does play an important role in chondrosarcoma cell invasion and targeting CD44 could reduce further invasion and metastasis for chondrosarcoma tumours. Although a CRISPR knockout of CD44 in chondrosarcoma cells has not previously been investigated, it has been undertaken in osteosarcoma cells. Spheroids of osteosarcoma WT and KO cells were imaged after 5 days in a 3D environment which revealed that the WT spheroids had a greater diameter than the KO cells. Furthermore, the proliferation and migration of the CD44 KO cells was reduced compared to the WT cells [51].
Hyaluronic acid was also added to the collagen hydrogel surrounding the spheroids because it is a key component of the ECM and the main ligand for CD44 [52]. There was a significant increase in invasion for the HT-1080 WT spheroids encased in the collagen hydrogel with hyaluronic acid compared to just the collagen hydrogel. Furthermore, the difference between the invasion area for the WT and CD44 KO cells was greater for the spheroids that were encased in the hydrogel containing hyaluronic acid. When CD44 interacts with HA, several proteins are activated including RhoA which leads to reformation of the actin cytoskeleton, allowing cells to migrate. Hyaluronic acid binding to CD44 also activates MMP-9 which can degrade collagen, allowing tumour cells to invade [53]. Hyaluronic acid can also reduce cell attachment to the ECM which allows for easier cell migration [54]. Therefore, the presence of hyaluronic acid as well as CD44 could be an important factor for chondrosarcoma cell invasion.
In conclusion, the results obtained in this study suggest that CD44 is key for the invasion of chondrosarcoma cells and could therefore be a useful imaging and therapeutic target. This is further emphasised by the results of the clinical trial of RG7356 and subsequent imaging studies [30,31]. However, further larger studies would need to be undertaken to understand whether CD44 expression levels can be a predictor of chondrosarcoma patient prognosis.
Author Contributions
Conceptualization, Z.B., K.S.R. and D.F.; methodology, Z.B., K.S.R., C.D.C., R.H. and D.F.; formal analysis, Z.B.; investigation, Z.B. and R.H.; resources, K.S.R. and R.H.; data curation, Z.B.; writing—original draft preparation, Z.B.; writing—review and editing, Z.B., K.S.R. and C.D.C.; visualization, Z.B.; supervision, K.S.R, D.F. and O.B.; project administration, Z.B.; funding acquisition, K.S.R. and D.F. All authors have read and agreed to the published version of the manuscript.
Funding
This research was funded by the Engineering and Physical Sciences Research Council, EP/T517914/1.
Institutional Review Board Statement
The study was conducted according to the guidelines of the Declaration of Helsinki, and approved by the Institutional Review Board of Newcastle upon Tyne Hospitals NHS Hospitals Trust (Caldicott number 7159, 10 June 2019).
Informed Consent Statement
Informed consent was obtained from all subjects involved in the study.
Acknowledgments
We would like to thank Sam Hogan for advice with Sanger sequencing and Dr Elizabeth Roundhill for providing the patient-derived chondrosarcoma cells. The authors would also like to thank the patients for donating their tissues to research.
Conflicts of Interest
The authors declare no conflicts of interest.
Abbreviations
The following abbreviations are used in this manuscript:
| ANOVA | Analysis of Variance |
| ACT BSA |
Atypical cartilaginous tumour Bovine serum albumin |
| Cas9 | CRISPR associated protein 9 |
| CD44 | Cluster of differentiation 44 |
| cDNA | Complementary deoxyribonucleic acid |
| CRISPR | Clustered regularly interspaced short palindromic repeats |
| DAB | 3,3’-diaminobenzidine |
| DI | De-ionised |
| ECM | Extracellular matrix |
| EFS | Event-free survival |
| EMT | Epithelial-mesenchymal transition |
| FACS | Fluorescence activated cell sorting |
| FITC | Fluorescein isothiocyanate |
| HR | Hazard ratio |
| KO | Knockout |
| MEM | Minimum Essential Medium |
| MMP-9 | Matrix metalloproteinase-9 |
| OS | Overall survival |
| PBS | Phosphate-buffered saline |
| qRT-PCR | Quantitative reverse transcription polymerase chain reaction |
| RhoA | Ras homolog family member A |
| ROCK | Rho-associated coiled coil containing protein kinase |
| RPMI | Roswell Park Memorial Institute |
| sgRNA | Single guide ribonucleic acid |
| TBS | Tris-buffered saline |
| ULA | Ultra-low attachment |
| WT | Wild type |
References
- Aran, V.; Devalle, S.; Meohas, W.; Heringer, M.; Cunha Caruso, A.; Pinheiro Aguiar, D.; Leite Duarte, M.E.; Moura Neto, V. Osteosarcoma, Chondrosarcoma and Ewing Sarcoma: Clinical Aspects, Biomarker Discovery and Liquid Biopsy. Critical Reviews in Oncology/Hematology 2021, 162, 103340. [Google Scholar] [CrossRef]
- Kim, J.-H.; Lee, S.K. Classification of Chondrosarcoma: From Characteristic to Challenging Imaging Findings. Cancers (Basel) 2023, 15, 1703. [Google Scholar] [CrossRef]
- Kim, M.-J.; Cho, K.-J.; Ayala, A.G.; Ro, J.Y. Chondrosarcoma: With Updates on Molecular Genetics. Sarcoma 2011, 2011, 405437. [Google Scholar] [CrossRef]
- Whelan, J.; McTiernan, A.; Cooper, N.; Wong, Y.K.; Francis, M.; Vernon, S.; Strauss, S.J. Incidence and Survival of Malignant Bone Sarcomas in England 1979-2007. Int J Cancer 2012, 131, E508–517. [Google Scholar] [CrossRef]
- Xie, T.; Sun, Y.; Han, X.; Zhang, J. The Clinicopathological Characteristics and Prognosis of Young Patients with Chondrosarcoma of Bone. Front. Surg. 2022, 9. [Google Scholar] [CrossRef] [PubMed]
- Dierselhuis, E.F.; Gerbers, J.G.; Ploegmakers, J.J.W.; Stevens, M.; Suurmeijer, A.J.H.; Jutte, P.C. Local Treatment with Adjuvant Therapy for Central Atypical Cartilaginous Tumors in the Long Bones: Analysis of Outcome and Complications in One Hundred and Eight Patients with a Minimum Follow-up of Two Years. JBJS 2016, 98, 303. [Google Scholar] [CrossRef]
- Dehner, C.A.; Maloney, N.; Amini, B.; Jennings, J.W.; McDonald, D.J.; Wang, W.-L.; Chrisinger, J.S.A. Dedifferentiated Chondrosarcoma with Minimal or Small Dedifferentiated Component. Modern Pathology 2022, 35, 922–928. [Google Scholar] [CrossRef] [PubMed]
- Weber, K.L.; Raymond, A.K. Low-Grade/Dedifferentiated/High-Grade Chondrosarcoma: A Case of Histological and Biological Progression. The Iowa Orthopaedic Journal 2002, 22, 75. [Google Scholar] [PubMed]
- Sekito, S.; Kato, M.; Nishikawa, K.; Yoshio, Y.; Kanai, M.; Kanda, H.; Arima, K.; Sugimura, Y. Successfully Treated Lung and Renal Metastases from Primary Chondrosarcoma of the Scapula with Radiofrequency Ablation and Surgical Resection. Case Reports in Oncological Medicine 2019, 2019, 6475356. [Google Scholar] [CrossRef]
- Stevenson, J.D.; Laitinen, M.K.; Parry, M.C.; Sumathi, V.; Grimer, R.J.; Jeys, L.M. The Role of Surgical Margins in Chondrosarcoma. European Journal of Surgical Oncology 2018, 44, 1412–1418. [Google Scholar] [CrossRef]
- Wirbel, R.J.; Schulte, M.; Maier, B.; Koschnik, M.; Mutschler, W.E. Chondrosarcoma of the Pelvis: Oncologic and Functional Outcome. Sarcoma 2000, 4, 161–168. [Google Scholar] [CrossRef]
- Italiano, A.; Mir, O.; Cioffi, A.; Palmerini, E.; Piperno-Neumann, S.; Perrin, C.; Chaigneau, L.; Penel, N.; Duffaud, F.; Kurtz, J.E.; et al. Advanced Chondrosarcomas: Role of Chemotherapy and Survival. Ann Oncol 2013, 24, 2916–2922. [Google Scholar] [CrossRef]
- de Jong, Y.; Ingola, M.; Briaire-de Bruijn, I.H.; Kruisselbrink, A.B.; Venneker, S.; Palubeckaite, I.; Heijs, B.P.A.M.; Cleton-Jansen, A.-M.; Haas, R.L.M.; Bovée, J.V.M.G. Radiotherapy Resistance in Chondrosarcoma Cells; a Possible Correlation with Alterations in Cell Cycle Related Genes. Clinical Sarcoma Research 2019, 9, 9. [Google Scholar] [CrossRef]
- Mishra, M.N.; Chandavarkar, V.; Sharma, R.; Bhargava, D. Structure, Function and Role of CD44 in Neoplasia. J Oral Maxillofac Pathol 2019, 23, 267–272. [Google Scholar] [CrossRef]
- Chen, C.; Zhao, S.; Karnad, A.; Freeman, J.W. The Biology and Role of CD44 in Cancer Progression: Therapeutic Implications. Journal of Hematology & Oncology 2018, 11, 64. [Google Scholar] [CrossRef] [PubMed]
- Goodison, S.; Urquidi, V.; Tarin, D. CD44 Cell Adhesion Molecules. Mol Pathol 1999, 52, 189–196. [Google Scholar] [CrossRef] [PubMed]
- Cirillo, N. The Hyaluronan/CD44 Axis: A Double-Edged Sword in Cancer. International Journal of Molecular Sciences 2023, 24, 15812. [Google Scholar] [CrossRef]
- Bourguignon, L. Matrix Hyaluronan-Activated CD44 Signaling Promotes Keratinocyte Activities and Improves Abnormal Epidermal Functions. The American journal of pathology 2014, 184. [Google Scholar] [CrossRef]
- Nitulescu, G.M.; Van De Venter, M.; Nitulescu, G.; Ungurianu, A.; Juzenas, P.; Peng, Q.; Olaru, O.T.; Grădinaru, D.; Tsatsakis, A.; Tsoukalas, D.; et al. The Akt Pathway in Oncology Therapy and beyond (Review). International Journal of Oncology 2018, 53, 2319–2331. [Google Scholar] [CrossRef]
- Al-Rekabi, Z.; Fura, A.M.; Juhlin, I.; Yassin, A.; Popowics, T.E.; Sniadecki, N.J. Hyaluronan-CD44 Interactions Mediate Contractility and Migration in Periodontal Ligament Cells. Cell Adh Migr 2019, 13, 138–150. [Google Scholar] [CrossRef] [PubMed]
- Martincuks, A.; Li, P.-C.; Zhao, Q.; Zhang, C.; Li, Y.-J.; Yu, H.; Rodriguez-Rodriguez, L. CD44 in Ovarian Cancer Progression and Therapy Resistance—A Critical Role for STAT3. Front Oncol 2020, 10, 589601. [Google Scholar] [CrossRef] [PubMed]
- Abdoli Shadbad, M.; Hosseinkhani, N.; Asadzadeh, Z.; Derakhshani, A.; Karim Ahangar, N.; Hemmat, N.; Lotfinejad, P.; Brunetti, O.; Silvestris, N.; Baradaran, B. A Systematic Review to Clarify the Prognostic Values of CD44 and CD44+CD24- Phenotype in Triple-Negative Breast Cancer Patients: Lessons Learned and The Road Ahead. Front. Oncol. 2021, 11. [Google Scholar] [CrossRef]
- Sawaya, R.; Yamaguchi, S.; Ishi, Y.; Okamoto, M.; Echizenya, S.; Motegi, H.; Fujima, N.; Fujimura, M. Increased CD44 Expression in Primary Meningioma: Its Clinical Significance and Association with Peritumoral Brain Edema. 2024. [CrossRef]
- Yilmaz, M.; Christofori, G. EMT, the Cytoskeleton, and Cancer Cell Invasion. Cancer Metastasis Rev 2009, 28, 15–33. [Google Scholar] [CrossRef] [PubMed]
- Brown, R.L.; Reinke, L.M.; Damerow, M.S.; Perez, D.; Chodosh, L.A.; Yang, J.; Cheng, C. CD44 Splice Isoform Switching in Human and Mouse Epithelium Is Essential for Epithelial-Mesenchymal Transition and Breast Cancer Progression. J Clin Invest 2011, 121, 1064–1074. [Google Scholar] [CrossRef]
- Nishida, N.; Yano, H.; Nishida, T.; Kamura, T.; Kojiro, M. Angiogenesis in Cancer. Vasc Health Risk Manag 2006, 2, 213–219. [Google Scholar] [CrossRef]
- Chen, L.; Fu, C.; Zhang, Q.; He, C.; Zhang, F.; Wei, Q. The Role of CD44 in Pathological Angiogenesis. FASEB J 2020, 34, 13125–13139. [Google Scholar] [CrossRef] [PubMed]
- Joseph, C.; Alsaleem, M.; Orah, N.; Narasimha, P.L.; Miligy, I.M.; Kurozumi, S.; Ellis, I.O.; Mongan, N.P.; Green, A.R.; Rakha, E.A. Elevated MMP9 Expression in Breast Cancer Is a Predictor of Shorter Patient Survival. Breast Cancer Res Treat 2020, 182, 267–282. [Google Scholar] [CrossRef]
- Medrano-González, P.A.; Rivera-Ramírez, O.; Montaño, L.F.; Rendón-Huerta, E.P. Proteolytic Processing of CD44 and Its Implications in Cancer. Stem Cells International 2021, 2021, 6667735. [Google Scholar] [CrossRef] [PubMed]
- Menke-van der Houven van Oordt, C.W.; Gomez-Roca, C.; van Herpen, C.; Coveler, A.L.; Mahalingam, D.; Verheul, H.M.W.; van der Graaf, W.T.A.; Christen, R.; Rüttinger, D.; Weigand, S.; et al. First-in-Human Phase I Clinical Trial of RG7356, an Anti-CD44 Humanized Antibody, in Patients with Advanced, CD44-Expressing Solid Tumors. Oncotarget 2016, 7, 80046–80058. [Google Scholar] [CrossRef]
- Jauw, Y.W.S.; Huisman, M.C.; Nayak, T.K.; Vugts, D.J.; Christen, R.; Naegelen, V.M.; Ruettinger, D.; Heil, F.; Lammertsma, A.A.; Verheul, H.M.W.; et al. Assessment of Target-Mediated Uptake with Immuno-PET: Analysis of a Phase I Clinical Trial with an Anti-CD44 Antibody. EJNMMI Res 2018, 8, 6. [Google Scholar] [CrossRef]
- Roundhill, E.A.; Jabri, S.; Burchill, S.A. ABCG1 and Pgp Identify Drug Resistant, Self-Renewing Osteosarcoma Cells. Cancer Lett 2019, 453, 142–157. [Google Scholar] [CrossRef] [PubMed]
- Bankhead, P.; Loughrey, M.B.; Fernández, J.A.; Dombrowski, Y.; McArt, D.G.; Dunne, P.D.; McQuaid, S.; Gray, R.T.; Murray, L.J.; Coleman, H.G.; et al. QuPath: Open Source Software for Digital Pathology Image Analysis. Sci Rep 2017, 7, 16878. [Google Scholar] [CrossRef] [PubMed]
- Wen, Z.; Luo, D.; Wang, S.; Rong, R.; Evers, B.M.; Jia, L.; Fang, Y.; Daoud, E.V.; Yang, S.; Gu, Z.; et al. Deep Learning–Based H-Score Quantification of Immunohistochemistry-Stained Images. Modern Pathology 2024, 37, 100398. [Google Scholar] [CrossRef]
- Zhang, H.; Cao, H.; Luo, H.; Zhang, N.; Wang, Z.; Dai, Z.; Wu, W.; Liu, G.; Xie, Z.; Cheng, Q.; et al. RUNX1/CD44 Axis Regulates the Proliferation, Migration, and Immunotherapy of Gliomas: A Single-Cell Sequencing Analysis. Front. Immunol. 2023, 14. [Google Scholar] [CrossRef]
- Homo Sapiens CD44 Molecule (IN Blood Group) (CD44), RefSeqGene (LRG_815) on Chromosome 11. Available online: http://www.ncbi.nlm.nih.gov/nuccore/NG_008937.1 (accessed on 11 June 2024).
- Ye, J.; Coulouris, G.; Zaretskaya, I.; Cutcutache, I.; Rozen, S.; Madden, T.L. Primer-BLAST: A Tool to Design Target-Specific Primers for Polymerase Chain Reaction. BMC Bioinformatics 2012, 13, 134. [Google Scholar] [CrossRef]
- Yang, C.-H.; Cheng, Y.-H.; Chuang, L.-Y.; Chang, H.-W. Specific PCR Product Primer Design Using Memetic Algorithm. Biotechnology Progress 2009, 25, 745–753. [Google Scholar] [CrossRef]
- Conant, D.; Hsiau, T.; Rossi, N.; Oki, J.; Maures, T.; Waite, K.; Yang, J.; Joshi, S.; Kelso, R.; Holden, K.; et al. Inference of CRISPR Edits from Sanger Trace Data. CRISPR J 2022, 5, 123–130. [Google Scholar] [CrossRef]
- Roper, S.J.; Coyle, B. Establishing an In Vitro 3D Spheroid Model to Study Medulloblastoma Drug Response and Tumor Dissemination. Current Protocols 2022, 2, e357. [Google Scholar] [CrossRef]
- Gazendam, A.; Popovic, S.; Parasu, N.; Ghert, M. Chondrosarcoma: A Clinical Review. Journal of Clinical Medicine 2023, 12. [Google Scholar] [CrossRef]
- Xu, H.; Wu, K.; Tian, Y.; Liu, Q.; Han, N.; Yuan, X.; Zhang, L.; Wu, G.S.; Wu, K. CD44 Correlates with Clinicopathological Characteristics and Is Upregulated by EGFR in Breast Cancer. Int J Oncol 2016, 49, 1343–1350. [Google Scholar] [CrossRef] [PubMed]
- Heyse, T.J.; Malcherczyk, D.; Moll, R.; Timmesfeld, N.; Wapelhorst, J.; Fuchs-Winkelmann, S.; Paletta, J.R.J.; Schofer, M.D. CD44: Survival and Metastasis in Chondrosarcoma. Osteoarthritis and Cartilage 2010, 18, 849–856. [Google Scholar] [CrossRef]
- Neumeister, V.; Agarwal, S.; Bordeaux, J.; Camp, R.L.; Rimm, D.L. In Situ Identification of Putative Cancer Stem Cells by Multiplexing ALDH1, CD44, and Cytokeratin Identifies Breast Cancer Patients with Poor Prognosis. Am J Pathol 2010, 176, 2131–2138. [Google Scholar] [CrossRef]
- Combaret, V.; Gross, N.; Lasset, C.; Frappaz, D.; Beretta-Brognara, C.; Philip, T.; Beck, D.; Favrot, M.C. Clinical Relevance of CD44 Cell Surface Expression and MYCN Gene Amplification in Neuroblastoma. European Journal of Cancer 1997, 33, 2101–2105. [Google Scholar] [CrossRef]
- Brown, J.M.; Rakoczy, K.; Hart, J.; Jones, K.B.; Groundland, J.S. Presenting Features and Overall Survival of Chondrosarcoma of the Pelvis. Cancer Treatment and Research Communications 2022, 30, 100510. [Google Scholar] [CrossRef]
- Tlemsani, C.; Larousserie, F.; Percin, S.D.; Audard, V.; Hadjadj, D.; Chen, J.; Biau, D.; Anract, P.; Terris, B.; Goldwasser, F.; et al. Biology and Management of High-Grade Chondrosarcoma: An Update on Targets and Treatment Options. International Journal of Molecular Sciences 2023, 24, 1361. [Google Scholar] [CrossRef]
- Zimmer, A.M.; Pan, Y.K.; Chandrapalan, T.; Kwong, R.W.M.; Perry, S.F. Loss-of-Function Approaches in Comparative Physiology: Is There a Future for Knockdown Experiments in the Era of Genome Editing? Journal of Experimental Biology 2019, 222, jeb175737. [Google Scholar] [CrossRef] [PubMed]
- Kapahnke, M.; Banning, A.; Tikkanen, R. Random Splicing of Several Exons Caused by a Single Base Change in the Target Exon of CRISPR/Cas9 Mediated Gene Knockout. Cells 2016, 5, 45. [Google Scholar] [CrossRef]
- Pinto, B.; Henriques, A.C.; Silva, P.M.A.; Bousbaa, H. Three-Dimensional Spheroids as In Vitro Preclinical Models for Cancer Research. Pharmaceutics 2020, 12, 1186. [Google Scholar] [CrossRef] [PubMed]
- Liu, T.; Yan, Z.; Liu, Y.; Choy, E.; Hornicek, F.J.; Mankin, H.; Duan, Z. CRISPR-Cas9-Mediated Silencing of CD44 in Human Highly Metastatic Osteosarcoma Cells. Cellular Physiology and Biochemistry 2018, 46, 1218–1230. [Google Scholar] [CrossRef] [PubMed]
- Misra, S.; Hascall, V.C.; Markwald, R.R.; Ghatak, S. Interactions between Hyaluronan and Its Receptors (CD44, RHAMM) Regulate the Activities of Inflammation and Cancer. Front Immunol 2015, 6, 201. [Google Scholar] [CrossRef]
- Karbownik, M.S.; Nowak, J.Z. Hyaluronan: Towards Novel Anti-Cancer Therapeutics. Pharmacological Reports 2013, 65, 1056–1074. [Google Scholar] [CrossRef] [PubMed]
- Dovedytis, M.; Liu, Z.J.; Bartlett, S. Hyaluronic Acid and Its Biomedical Applications: A Review. Engineered Regeneration 2020, 1, 102–113. [Google Scholar] [CrossRef]
Figure 1.
Staining of chondrosarcoma patient tissue sections. (a) – (l): Images of chondrosarcoma patient tissue that were stained with an antibody for CD44 at a dilution of 1:500. Hematoxylin was used as a counterstain which stains cell nuclei purple. Images were scanned with a Leica Aperio CS2 at 20x magnification. Tissue sections from patients with different grades and types of chondrosarcoma were investigated: (a) clear cell, (b) atypical cartilaginous, (c) – (f), (h) and (i) conventional, (g) mesenchymal and (j) – (l) dedifferentiated. (m) The H-score of the chondrosarcoma patient tissue slices that were stained with an antibody for CD44 was determined using the positive cell detection tool on QuPath software. The H-score values were grouped by tumour grade where n=14 for grade 1, n=17 for grade 2, n=18 for grade 3. Statistical analysis was performed using the Brown-Forsythe and Welch ANOVA test with Dunnett’s T3 multiple-comparison post-hoc test. *p<0.05.
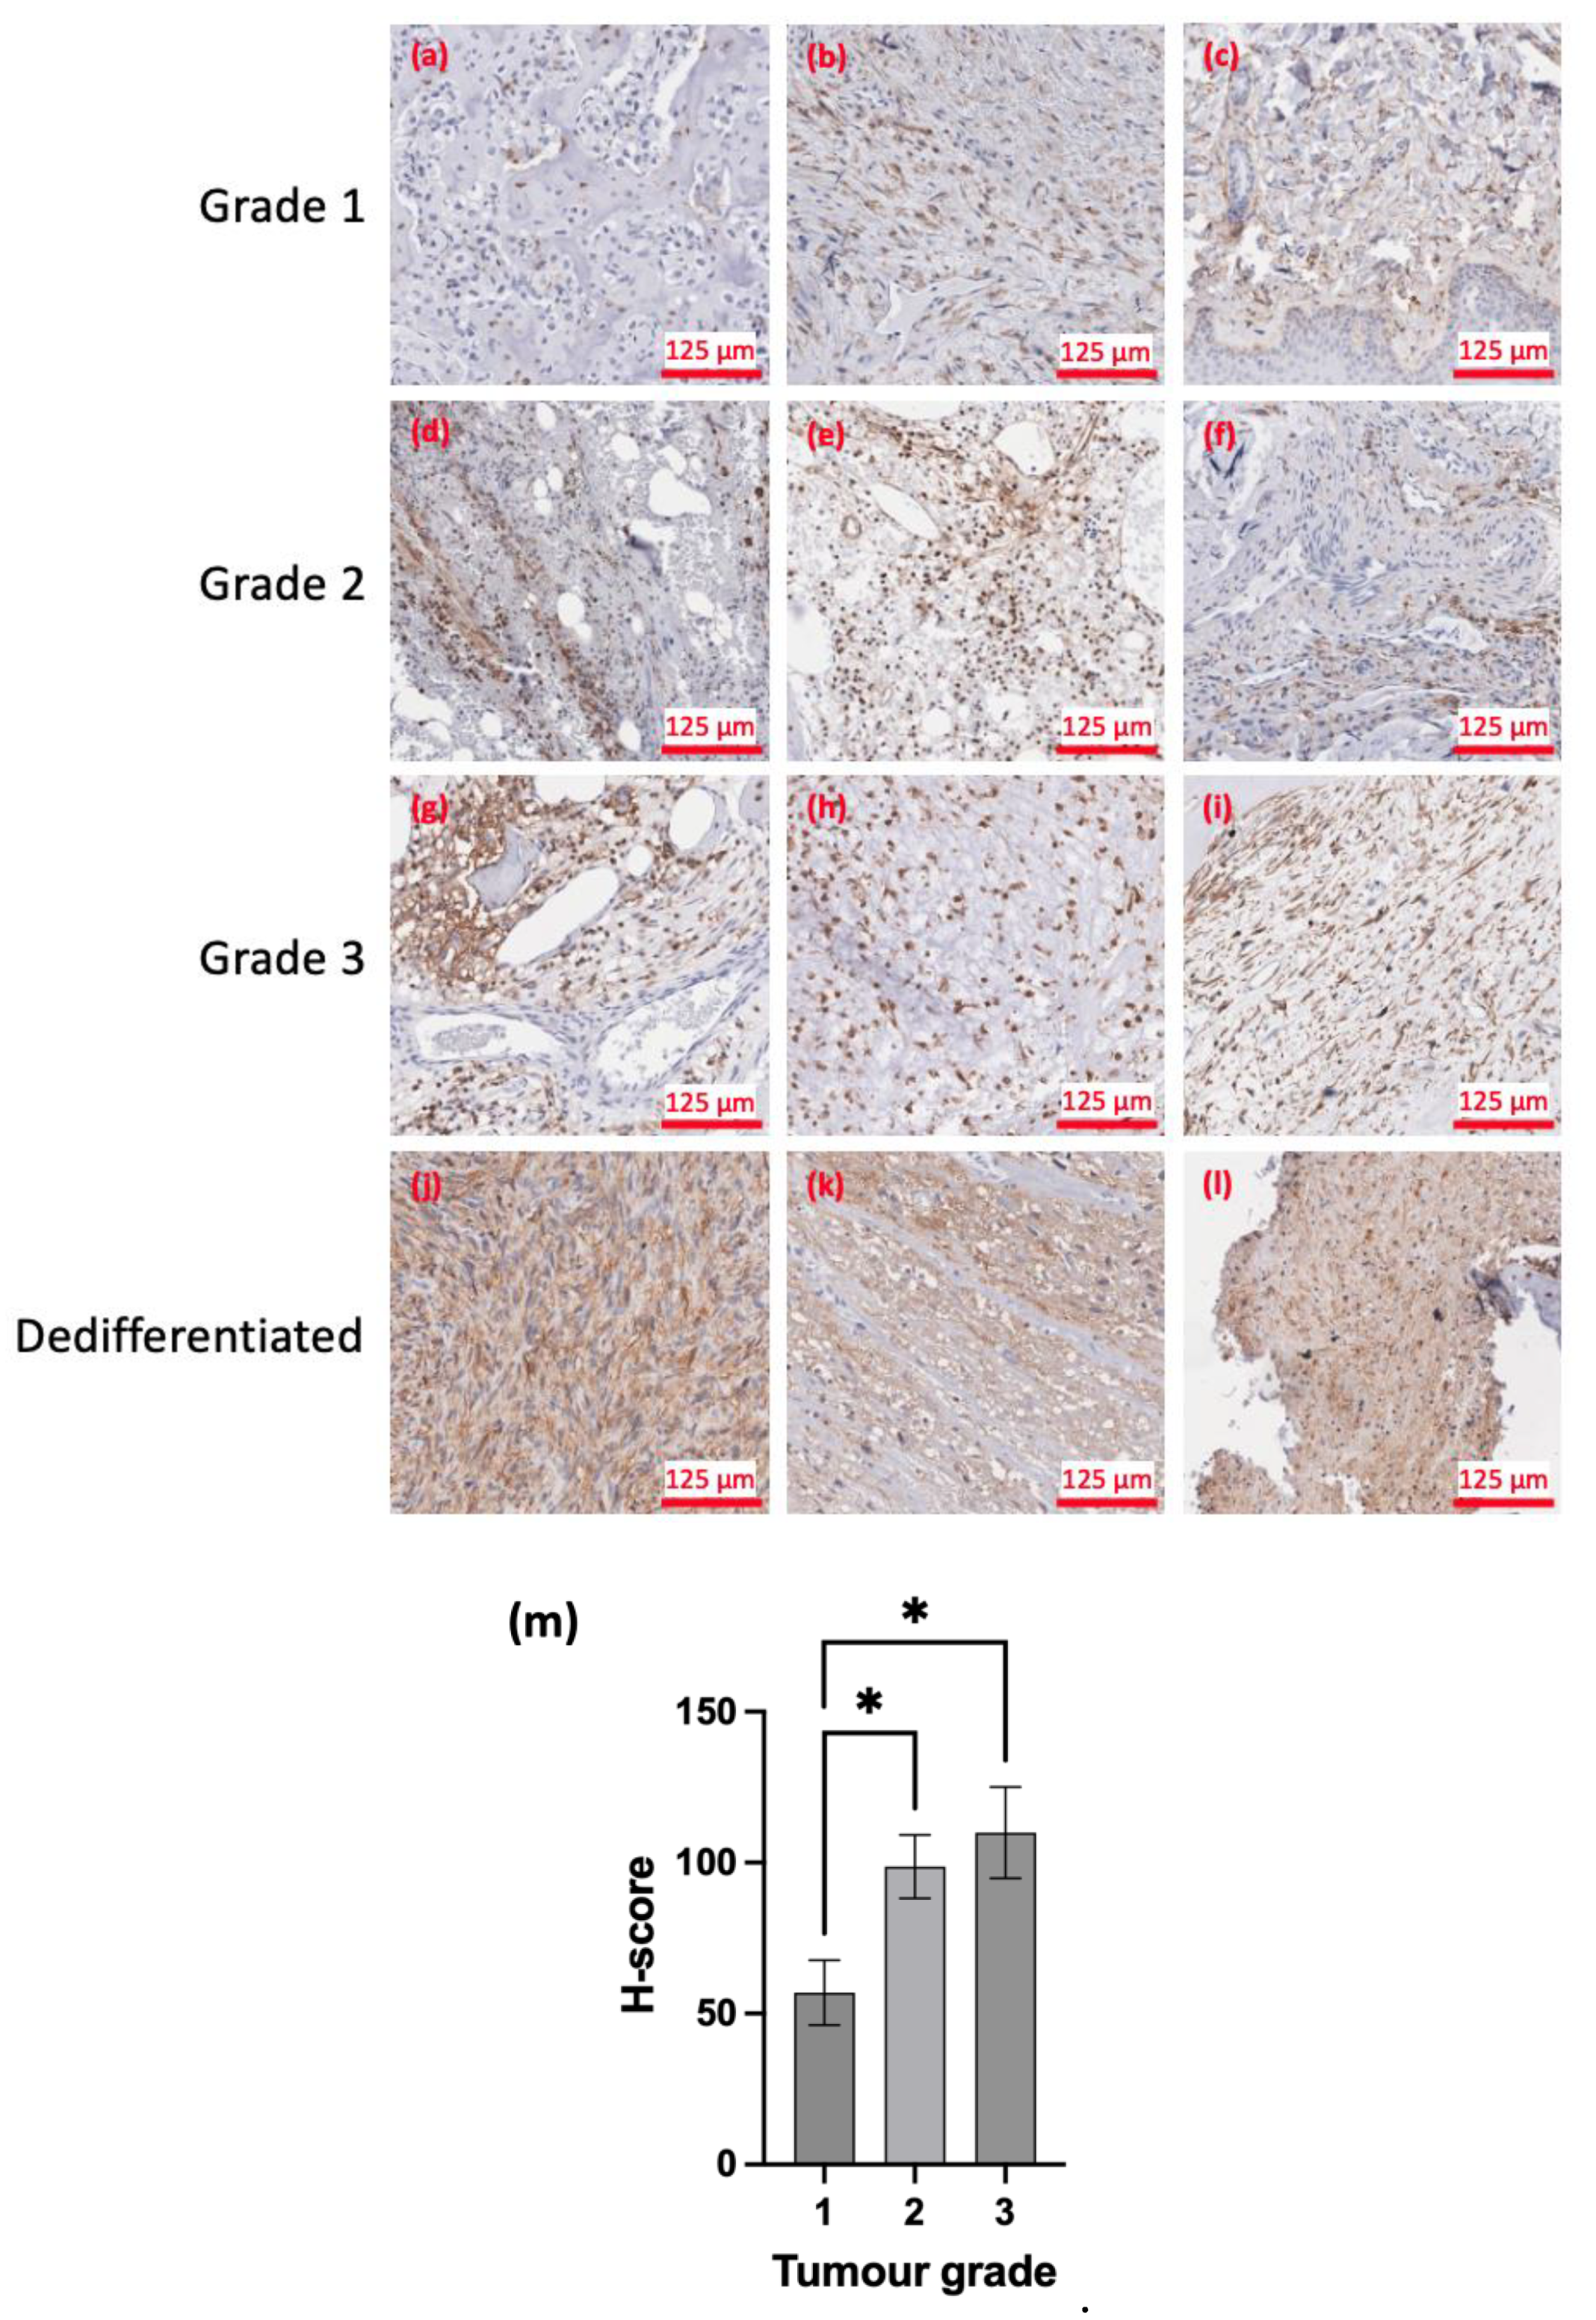
Figure 2.
Survival analysis of CD44 expression. (a) Kaplan-Meier plot of probability of OS against time for high (H-score > 84) and low (H-score < 84) CD44 expression. (b) Kaplan-Meier plot of probability of EFS against time for high (H-score > 84) and low (H-score < 84) CD44 expression.
Figure 2.
Survival analysis of CD44 expression. (a) Kaplan-Meier plot of probability of OS against time for high (H-score > 84) and low (H-score < 84) CD44 expression. (b) Kaplan-Meier plot of probability of EFS against time for high (H-score > 84) and low (H-score < 84) CD44 expression.
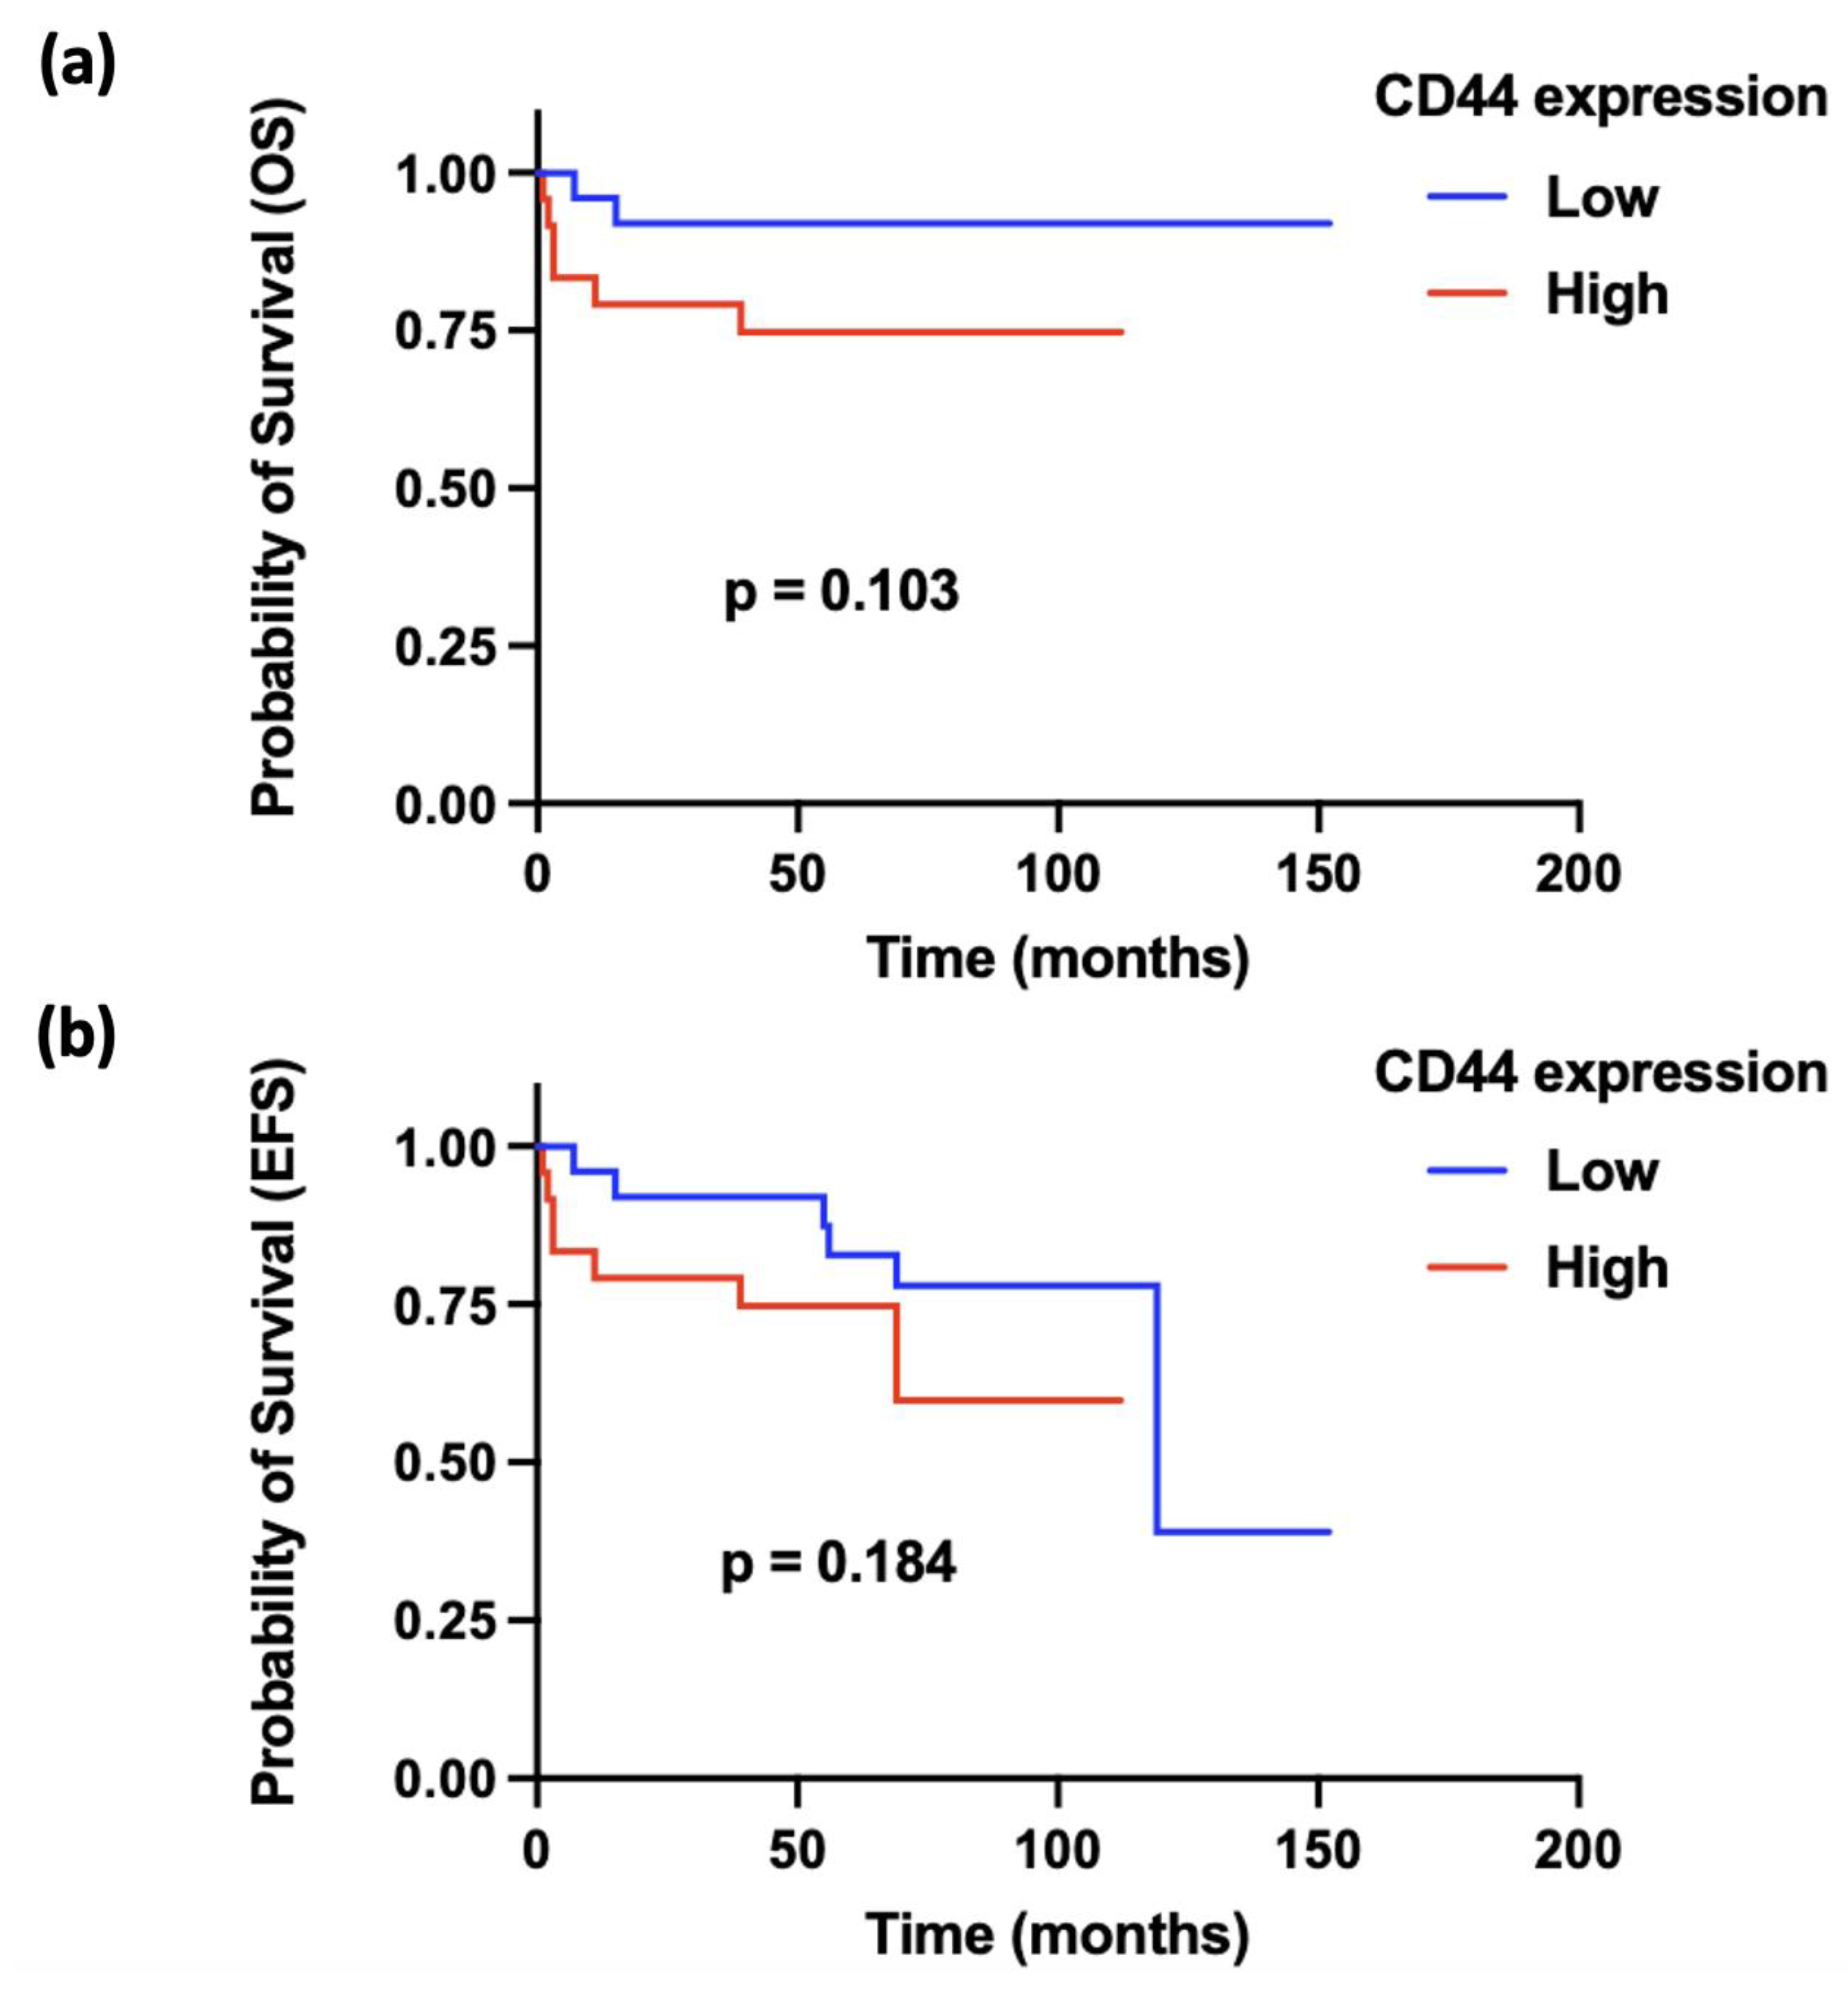
Figure 3.
Characterisation of patient-derived chondrosarcoma cells. (a) Images of cell blocks of 13095 and 13073 patient-derived cells that were sliced and immunostained with an antibody for CD44 at a dilution of 1:1000. Brown staining indicates CD44 positive staining due to the oxidation of DAB. Hematoxylin was used as a counterstain which stains cell nuclei purple. Images were scanned with a Leica Aperio CS2 at 20x magnification. Flow cytometry was also used to analyse the surface expression of CD44 in (b) 13095 and (c) 13073 patient-derived chondrosarcoma cells. For both 13095 and 13073 cells, the cells were either left unstained, stained with a CD44 antibody conjugated to a FITC fluorophore or stained with a FITC isotype control. The x-axis of the histogram represents the fluorescence intensity (biexponential scale) and the y-axis represents cell count. Both cell lines show a high intensity peak for the WT cells with lower intensity peaks for unstained and FITC isotype control stained cells. Flow cytometry data was analysed using FCS Express 7 software.
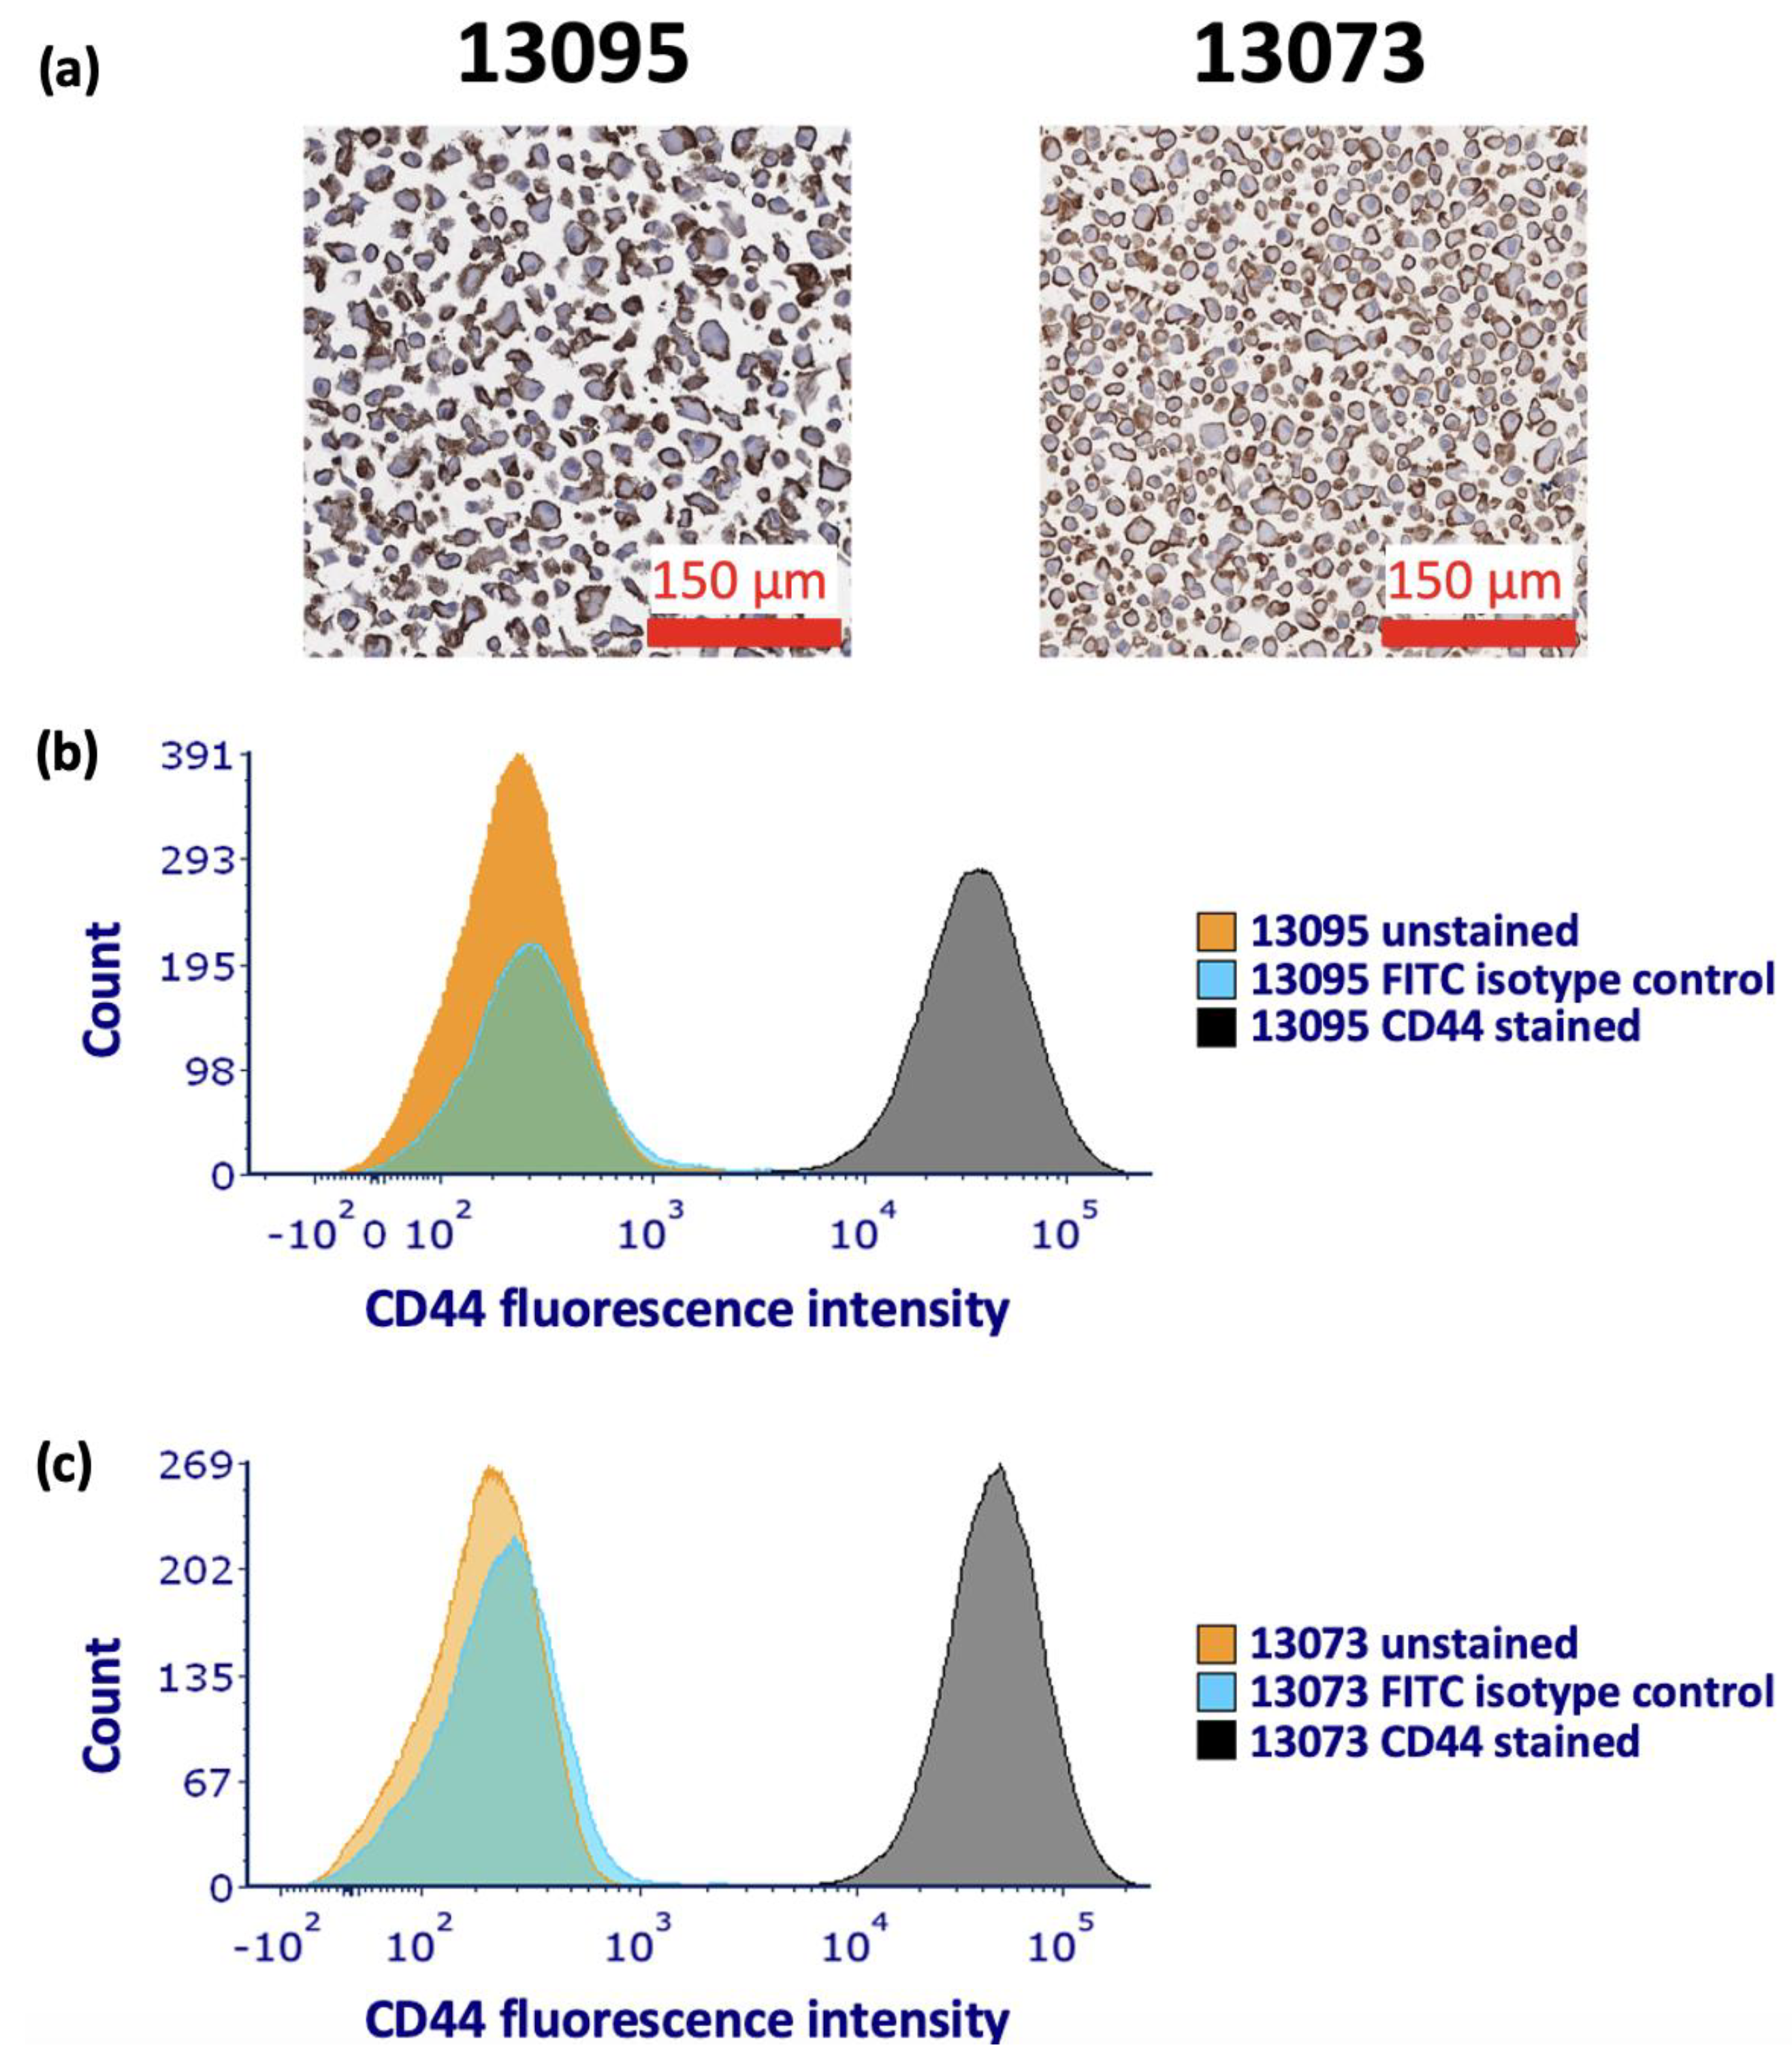
Figure 4.
Characterisation of HT-1080 WT and HT-1080 CD44 KO cells. (a) Flow cytometry was used to analyse the surface expression of CD44 in HT-1080 WT and KO cells. The cells were either left unstained or stained with a CD44 antibody conjugated to a FITC fluorophore. The x-axis of the histogram represents the fluorescence intensity (biexponential scale) and the y-axis is the number of cells. There is a high intensity peak for the WT cells with lower intensity peaks for unstained and KO cells. Flow cytometry data was analysed using FCS Express 7 software. (b) qRT-PCR was used to investigate the CD44 mRNA levels in HT-1080 WT and CD44 KO cells. The relative gene expression was then calculated (n=3, mean ± SEM). Statistical analysis was performed using an unpaired t-test with Welch’s correction. **p<0.01 compared to the WT control.
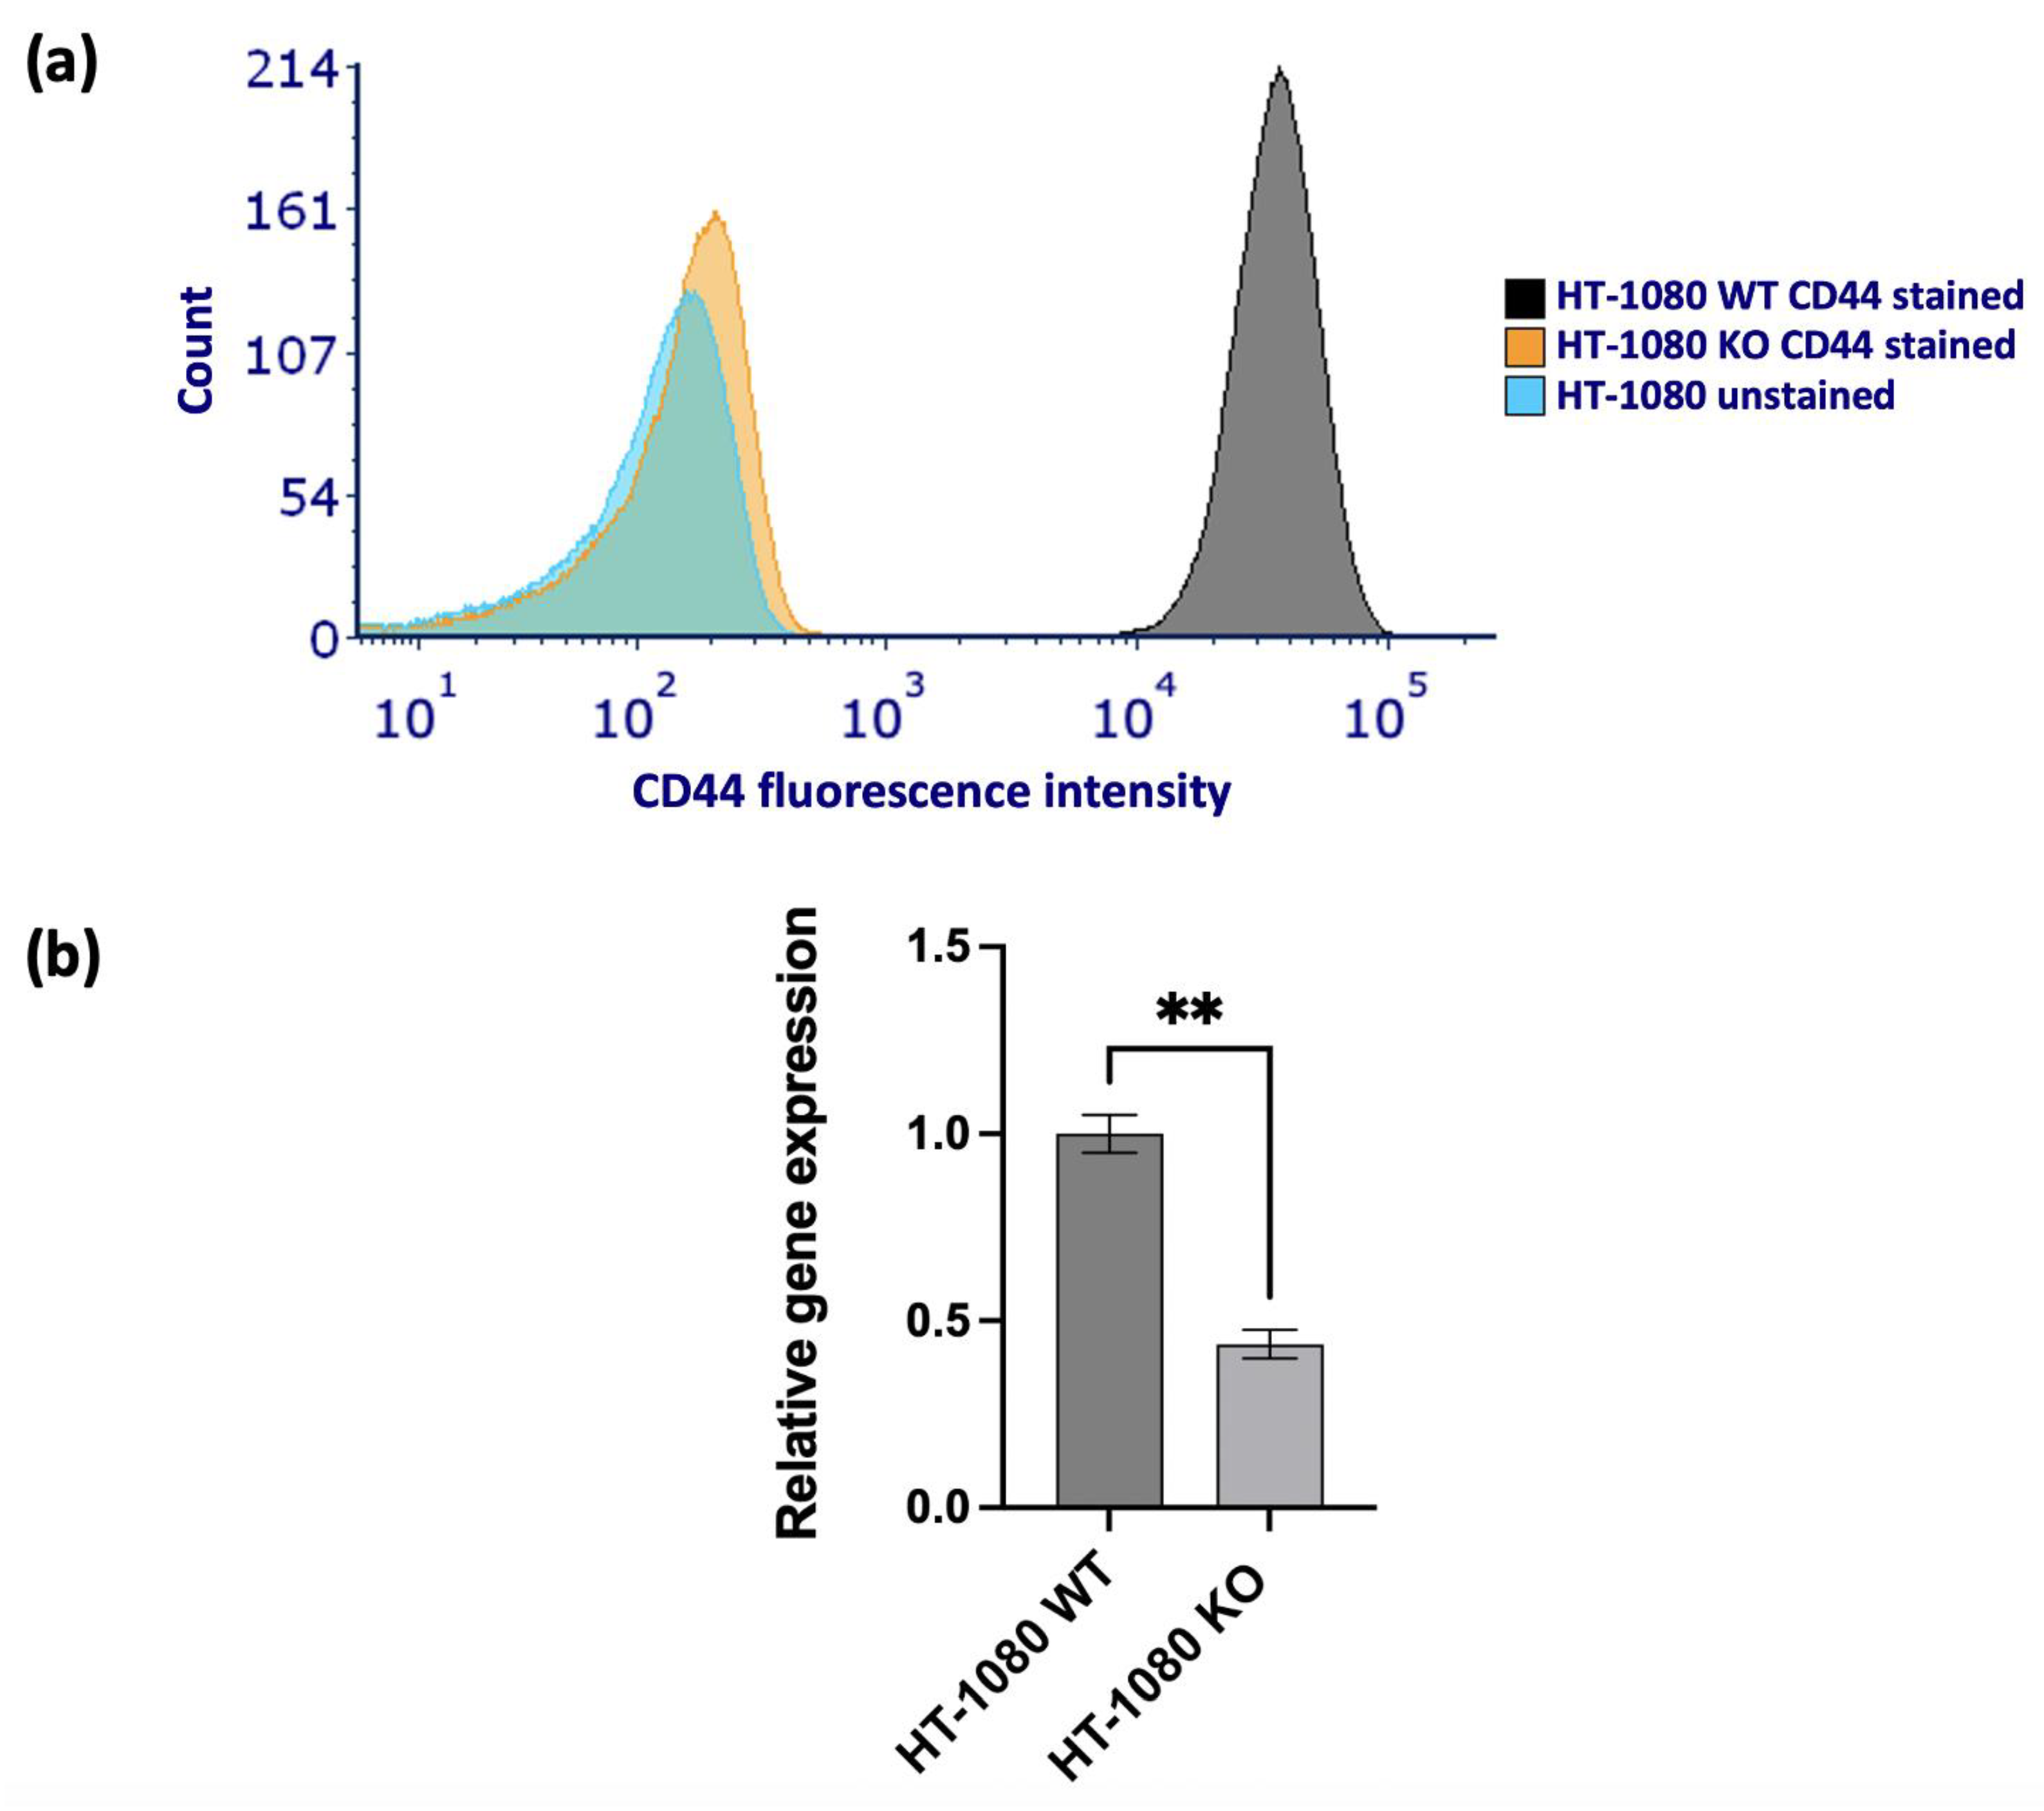
Figure 5.
Sanger sequencing was performed on HT-1080 WT and HT-1080 CD44 KO cell lines to compare their genetic sequences. (a) Shows the composition of the KO sequence where a negative indel value (-8) indicates that this clone contains just one sequence that has an 8 base pair deletion compared to the WT sequence. The vertical black dashed line represents the cut site. (b) Shows the Sanger sequence of the WT (control sample) and (c) shows the Sanger sequence of the KO (edited sample). The guide sequence is underlined in black and the PAM sequence (CGG) is underlined in a dashed red line on the control sample.
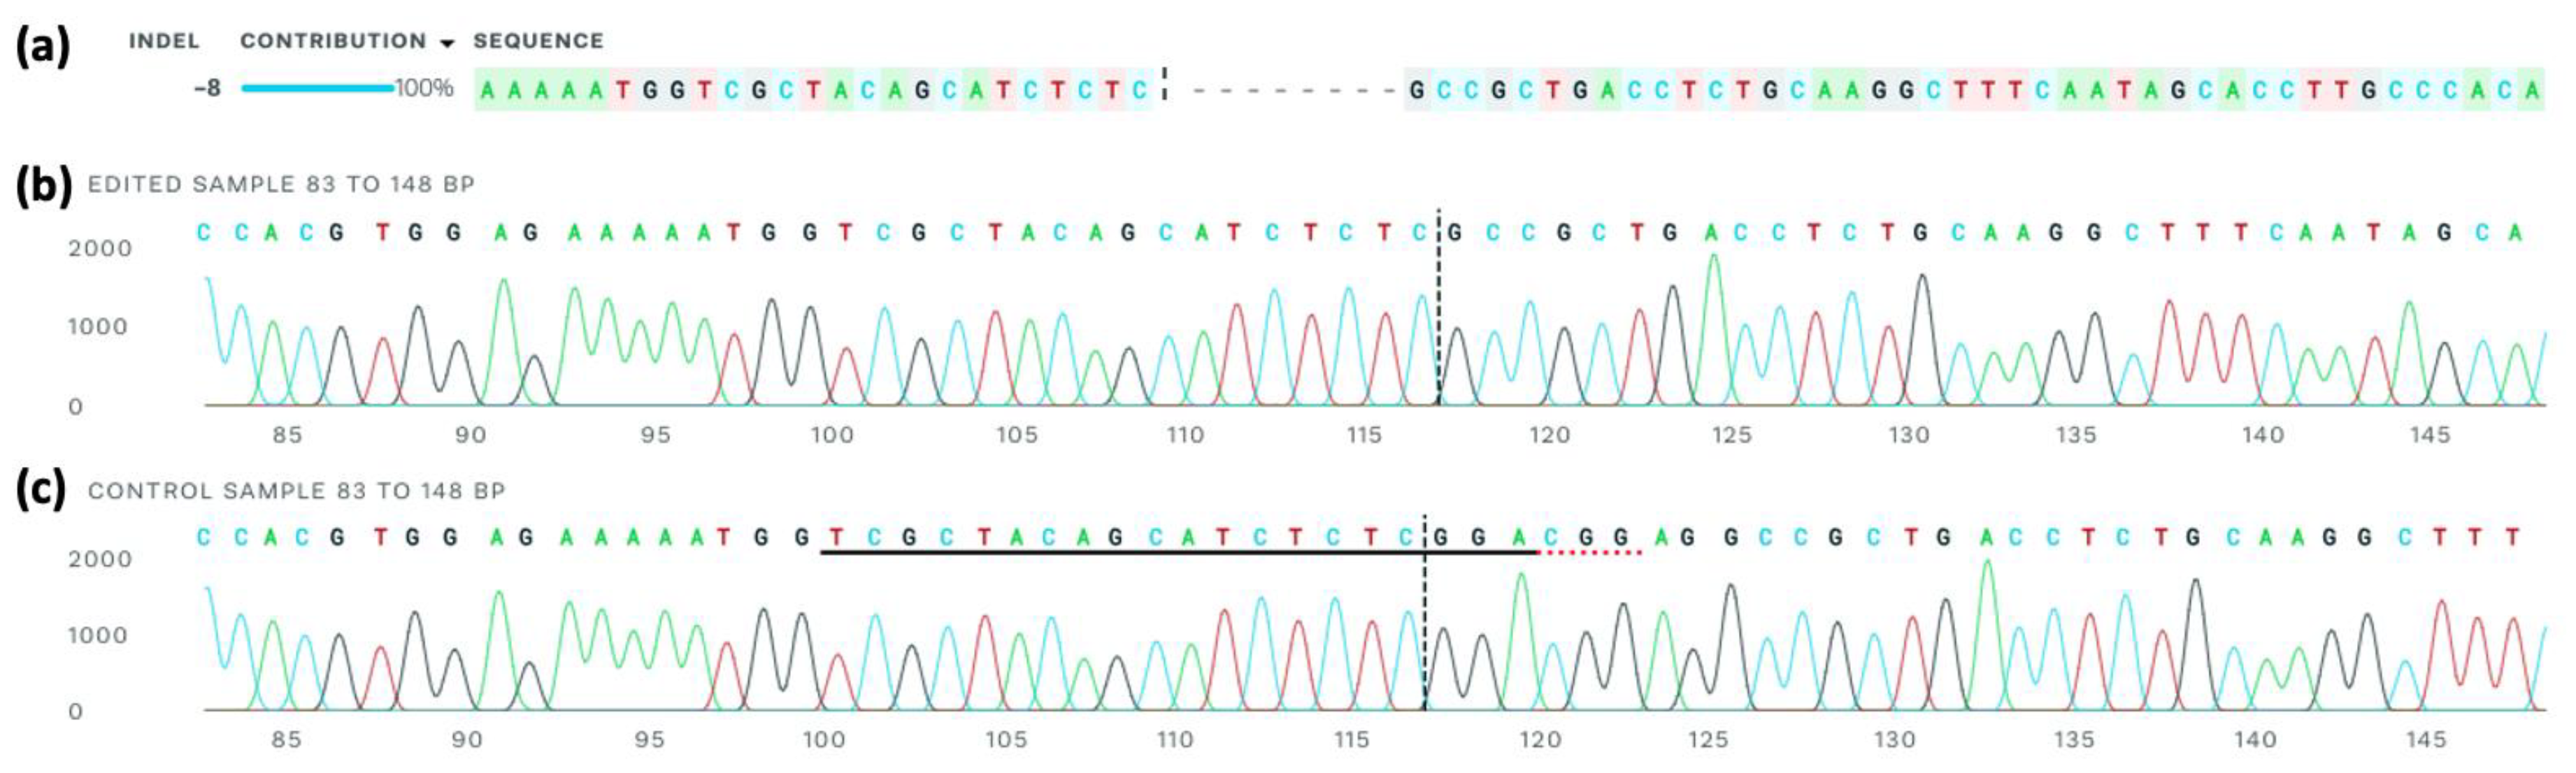
Figure 6.
HT-1080 WT vs CD44 KO collagen spheroid invasion assay. HT-1080 WT and CD44 KO spheroids were encased in collagen or collagen with hyaluronic acid (HA) added for 72 hours. (a) The spheroids were imaged every 24 hours. Images were taken using a Nikon Eclipse TE2000 inverted microscope at 2x magnification. (b) Quantification of the spheroid invasion. ImageJ software was used to measure the initial and final spheroid areas and the invasion area was calculated as final invasion area after 72 hours – initial area of the core. Each cell type and hydrogel composition were tested in triplicate and each experiment was repeated three times (n=9, mean ± SEM). Statistical analysis was performed using an unpaired t-test with Welch’s correction. ***p<0.001, ****p<0.0001 compared to the WT cells in the same hydrogel composition.
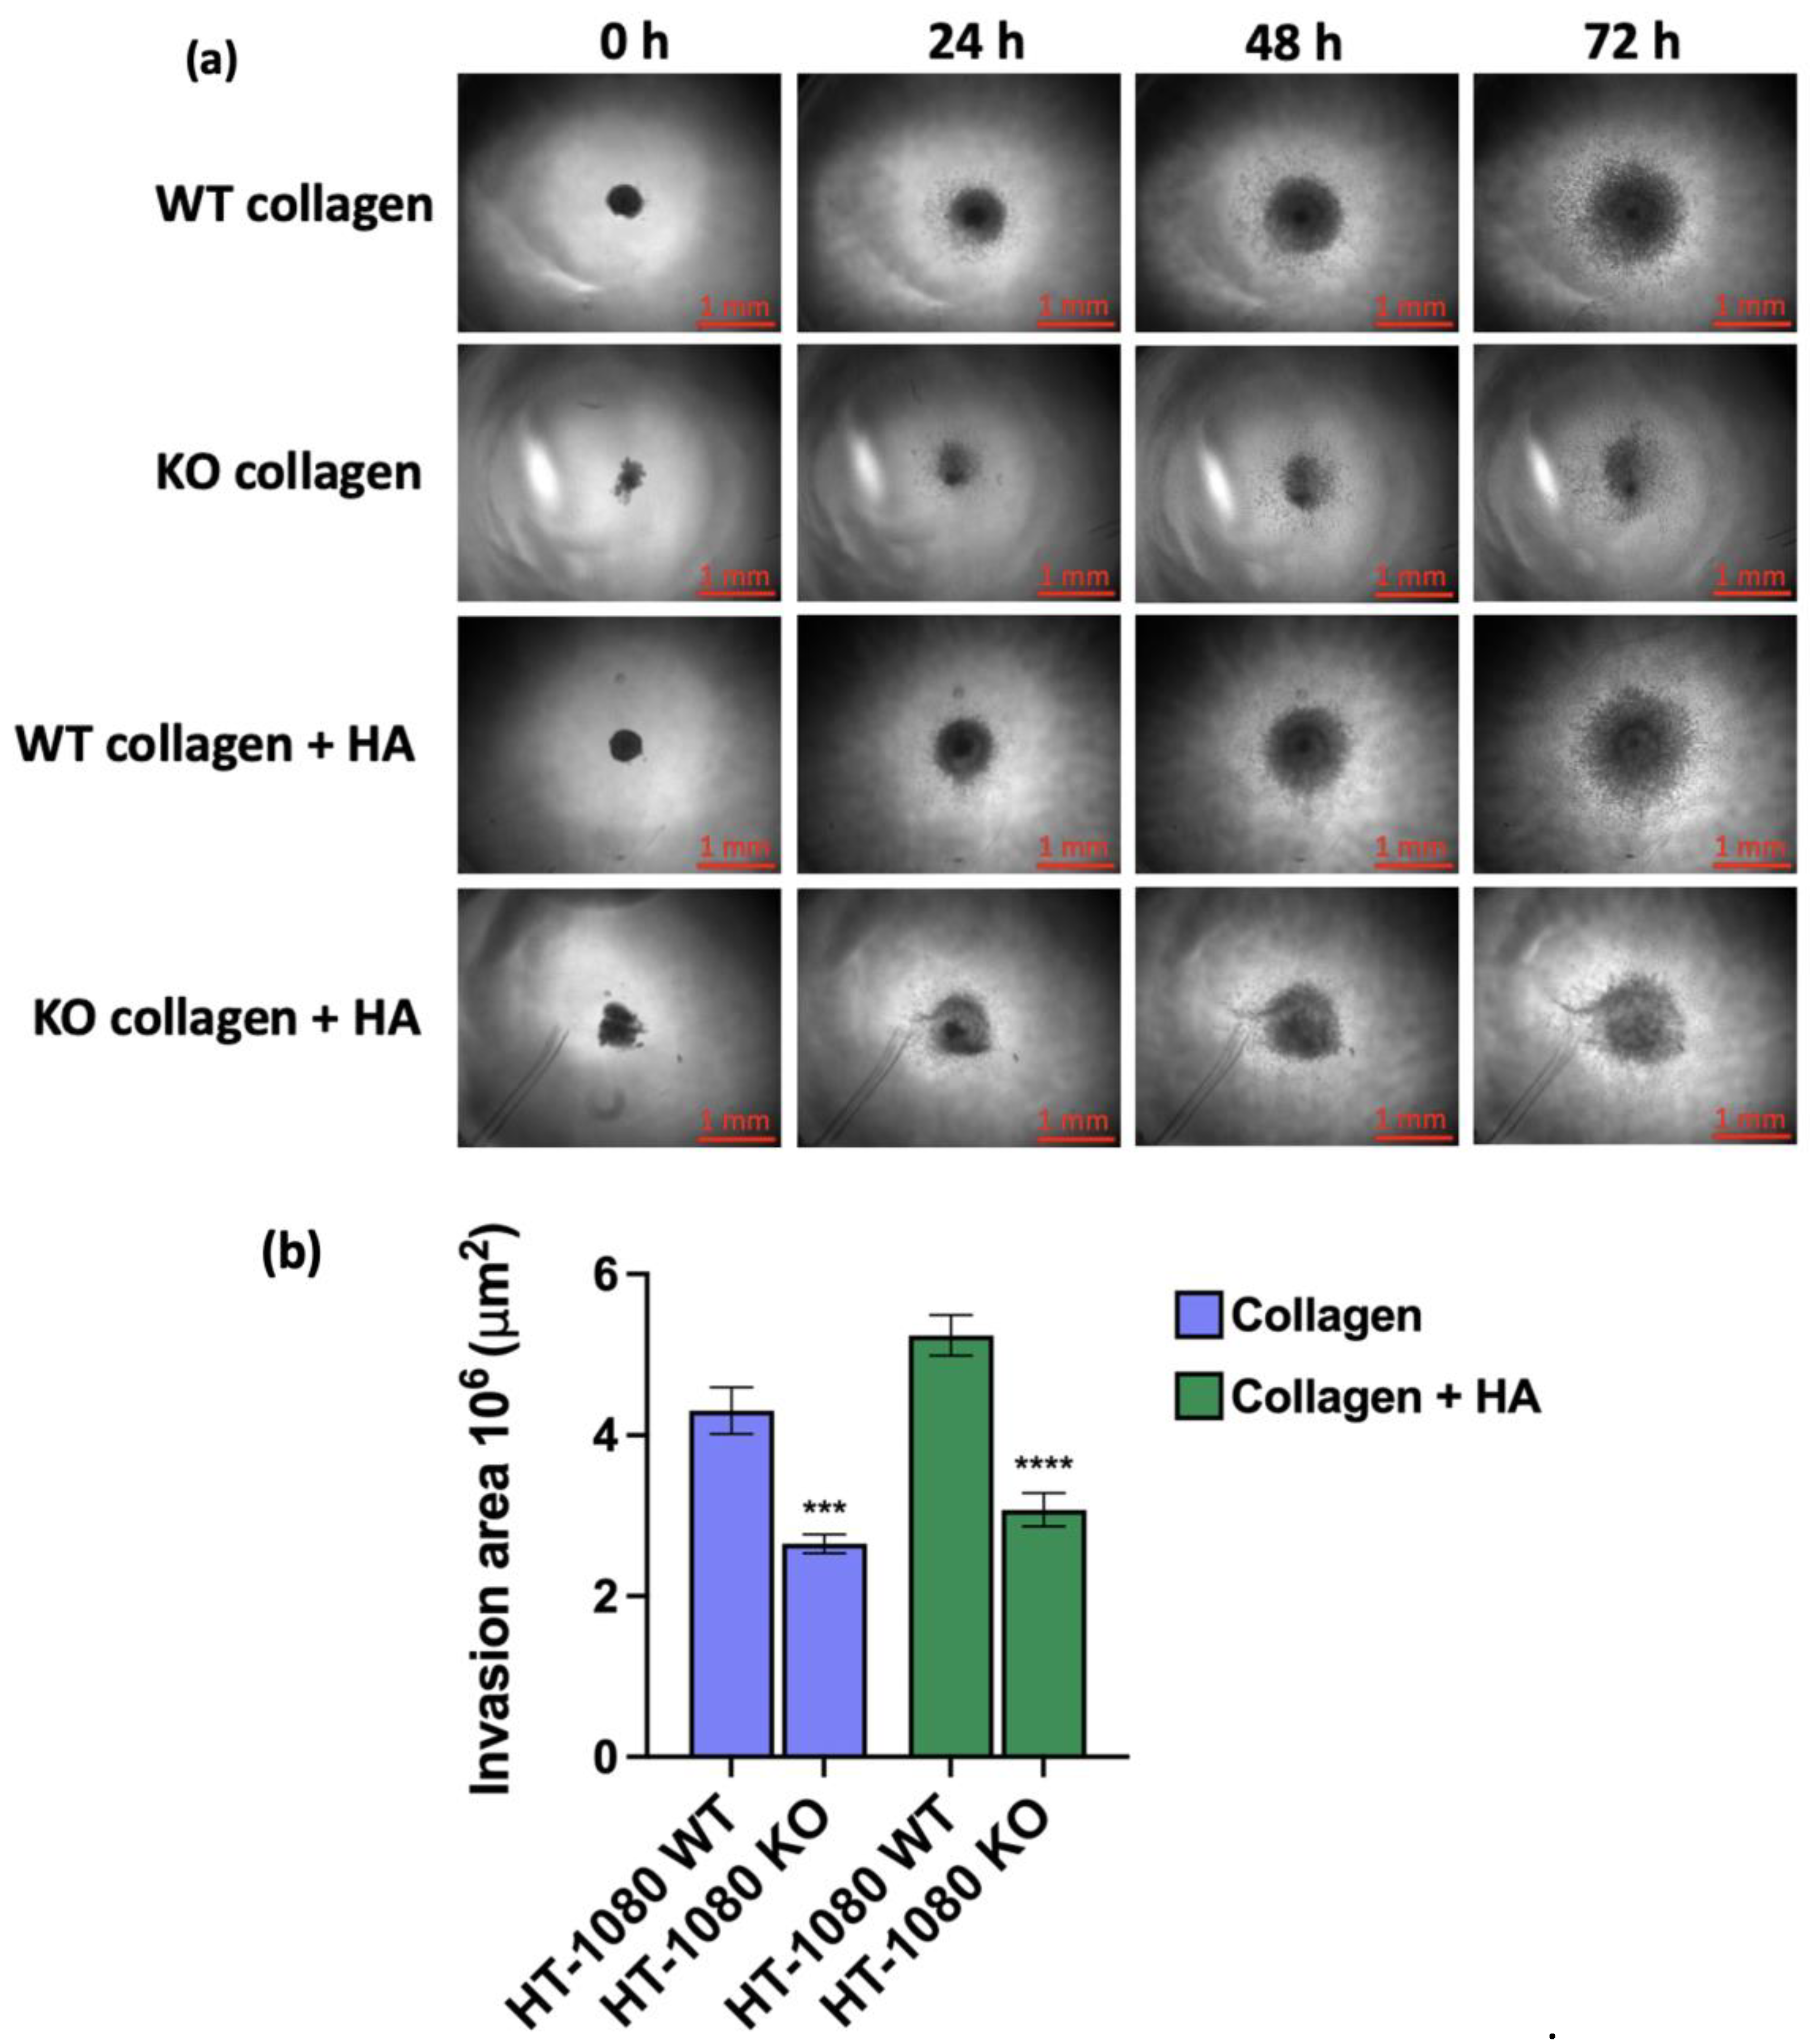

Table 1.
This table contains the hazard ratio (HR) and p-values for OS and EFS obtained from multivariate analysis calculated using Cox regression. A higher HR value corresponds to an increased risk. Bold p-values indicate that it was statistically significant (p<0.05).
Table 1.
This table contains the hazard ratio (HR) and p-values for OS and EFS obtained from multivariate analysis calculated using Cox regression. A higher HR value corresponds to an increased risk. Bold p-values indicate that it was statistically significant (p<0.05).
| OS | EFS | |||
| HR | p-Value | HR | p-Value | |
| Tumour size | 1.001 | 0.9184 | 1.002 | 0.4617 |
| CD44 expression | 1.031 | 0.0060 | 1.020 | 0.0057 |
| Metastasis | 17.41 | 0.0101 | 13.35 | 0.0002 |
| Age | 1.052 | 0.1234 | 1.044 | 0.1290 |
| Sex | 0.6488 | 0.7453 | 0.2177 | 0.1725 |
Disclaimer/Publisher’s Note: The statements, opinions and data contained in all publications are solely those of the individual author(s) and contributor(s) and not of MDPI and/or the editor(s). MDPI and/or the editor(s) disclaim responsibility for any injury to people or property resulting from any ideas, methods, instructions or products referred to in the content. |
© 2025 by the authors. Licensee MDPI, Basel, Switzerland. This article is an open access article distributed under the terms and conditions of the Creative Commons Attribution (CC BY) license (http://creativecommons.org/licenses/by/4.0/).
Copyright: This open access article is published under a Creative Commons CC BY 4.0 license, which permit the free download, distribution, and reuse, provided that the author and preprint are cited in any reuse.


