
Submitted:
28 July 2025
Posted:
30 July 2025
You are already at the latest version
Abstract
Several decades after the development of FEM in computer-based form, which is a milestone in the evaluation of mechanical systems, the method has been adopted to analyze the biomechanical response of human skeletal structures. This innovative technique has generated new questions, but also new results, and, at the same time, competitive environments with explosive development, in the recent period. This research is focused on analyzing, using FEM, the extreme thermal variations produced at the level of two oro-facial systems (one control and one subjected to orthodontic therapy using a fixed metallic orthodontic appliance). Each system was exposed to a succession of extreme thermal regimes (70...-18...70...⁰C and -18…70…-18...⁰C). In order to conduct this research, we used the case of a 14-year-old female patient. Following an orthodontic evaluation, we discovered that the patient had dento-alveolar disharmony with crowding. The straight-wire method of applying a fixed metallic orthodontic appliance was chosen. As complementary examinations, the patient was subjected to a bimaxillary CBCT. Using a series of programs (InVesalius, Geomagic, SolidWorks and AnsysWorkbench), a three-dimensional model was obtained. This model contained the jaws and teeth. Also, brackets, tubes and orthodontic wires can be incorporated into the model. Following the simulations carried out in this study, it can be observed that thermal variations from the dental pulp are more severe for the oro-facial system with a fixed metallic orthodontic appliance (regardless of the type of thermal stimulus used).
Keywords:
cone beam computed tomography
; dental tissues
; finite element method
; fixed metallic orthodontic appliance
; thermal variations
1. Introduction
Malocclusions are characterized by misalignments of the teeth and jaws. Thus, these oral conditions lead to dysfunction of the oro-facial system. The prevalence of malocclusion in children is 79.4% and, for this reason, they are considered a public health problem, affecting the quality of life [1,2].
Cone beam computed tomography (CBCT) represents an innovative alternative of CT investigation, which relies on X-rays to capture internal views of the oro-facial system. Thus, detailed images of these anatomical elements are obtained. CBCT has revolutionized the field of dentistry, being a complementary examination with greater precision than traditional two-dimensional radiographs. All these advantages contribute to establishing the most accurate diagnosis and developing an effective treatment plan [3,4].
In the first decade after the appearance of the finite element method (FEM), this computer-based technique was considered a technique that could solve numerous problems in the field of biomechanics. At the same time, due to the complexity of biological structures, remarkable results were not obtained from the beginning. To this some phenomena not yet completely elucidated were added, such as friction between bone components, the influence of connective tissues at the periodontal ligament level, the action of muscles, but also the reaction of the human body to the presence of tensions [5,6]. All these disadvantages were successively diminished by the latest results of specialized studies, but also by improving the method, by using new types of finite elements, and, obviously, by developing hardware systems [7].
Nowadays, several decades after the development of FEM in computer-based form, which is a milestone in the evaluation of mechanical systems, the method has been adopted to analyze the biomechanical response of human skeletal structures. This innovative technique has generated new questions, but also new results, and, at the same time, competitive environments with explosive development, in the recent period [8].
Thus, FEM is a stimulating method, with deep interferences in mathematics and engineering, being also used in various branches of dentistry, including orthodontics.
This research is focused on analyzing, using FEM, the extreme thermal variations produced at the level of two oro-facial systems (one control and one subjected to orthodontic therapy using a fixed metallic orthodontic appliance). Each system was exposed to a succession of extreme thermal regimes.
2. Materials and Methods
The present study was approved by the Ethics Committee of the University of Medicine and Pharmacy of Craiova, Romania (approval reference no. 127/09.04.2024), in accordance with the ethical guidelines of the University of Medicine and Pharmacy of Craiova, Romania, for research with human participants. The legal guardian of the minor patient has given consent for the use of the CBCT package in this study.
For the purpose of this study, we examined a 14-year-old female patient, who presented herself at the Orthodontics Clinic of the Faculty of Dental Medicine of the University of Medicine and Pharmacy of Craiova, Romania.
After an assessment of the orthodontic status, we discovered that our patient had dento-alveolar disharmony with crowding. The straight-wire method of applying a fixed metallic orthodontic appliance was chosen. We opted for this approach because it moves the teeth in sagittal, transverse and vertical planes, cutting down on treatment time. Modern memory wires and pre-angled brackets and tubes characterize this technique, allowing sliding tooth movements and guaranteeing safe guidance.
As complementary examinations, the patient was subjected to a bimaxillary CBCT imaging technique done concurrently for this study. We utilized a CS 8200 3D CT scanner (Carestream Dental, Atlanta, GA, SUA). As a result of this investigation, 586 tomographic images were obtained.
The patient's dento-maxillary apparatus was first visually analyzed using OnDemand3D Dental (Cybermed Corp., Yusong, Republic of Korea), a medical imaging tool that provided three-dimensional images in addition to the particular equipment. However, obtaining a virtual model that could subsequently be examined using other instruments, like FEM, was not possible with this software.
Consequently, a series of DICOM images was converted into three-dimensional geometries, which are called "point clouds". These procedures were achieved using the InVesalius program (CTI, Campinas, Brazil), an open-source medical research tool, which provides three-dimensional geometries for various tissues based on grayscale.
In order to convert the 3D geometry into precisely closed surfaces, these "point cloud" structures were imported into the Geomagic program (Morrisville, NC, USA). This engineering software modifies "point cloud" geometric elements. The ultimate objective is to convert these complete surfaces into "virtual solid-type" geometries, which can be imported into a software that uses FEM.
In the next step, the model of precisely closed surfaces was applied into CAD software using SolidWorks (Dassault Systemes, Velizy-Villacoublay, France). This way, the surfaces are converted into virtual solid models. Orthodontic therapy-specific components (brackets, tubes and wires) can be incorporated to these models, which are thought to be comparable to the tissues of the patient under analysis. These elements are introduced into the 3D model of the patient under analysis and are specified within digitally modeled environment having adjustable parameters with the help of CAD techniques. The complete model with a perfect geometry is exported to a software that uses FEM.
Ansys Workbench (Ansys Inc., Canonsburg, PA, USA) is a program that permits the analysis of a system exposed to a variety of physical phenomena. In the current research, we were interested in the extreme thermal variations produced at the level of two oro-facial systems (one control and one subjected to orthodontic therapy using a fixed metallic orthodontic appliance). The virtual components in this application were given the material characteristics of the biological constituents, as well as the additional components (brackets, tubes, and wires). Ultimately, FEM was used to apply the thermal simulations to the models. Also, data organization and processing were achieved, as well as data production for the virtual models.
In addition to obtaining some figures, graphs, or diagrams, Microsoft Office (Microsoft Corporation, Redmond, WA, USA) was utilized to organize and analyze the information gathered from the result data provided by the analysis in Ansys Workbench.
The following methods were used in order to produce the extreme thermal variations:
- -
- direct engineering techniques, which are specifically featured in the SolidWorks program; they enable the creation of virtual items that resemble the reality models;
- -
- reverse engineering techniques, which are specifically featured in the Geomagic program; they are used to prepare and edit models that were originally made up of so-called "cloud of points";
- -
- thermodynamics techniques, which are specifically featured in Ansys Workbench program;
- -
- FEM techniques, which are specifically featured in Ansys Workbench (AW) program; they represent the core of the mathematical algorithms included in the transient thermal module.
Petrescu S.M.S. et al. described the steps of the development of the 3D model of an orthodontic system considered identical to that of the patient. Also, the researchers modeled the metallic orthodontic components of the 3D system using the direct engineering techniques and positioned them on the teeth in compliance with the orthodontic guidelines [9].
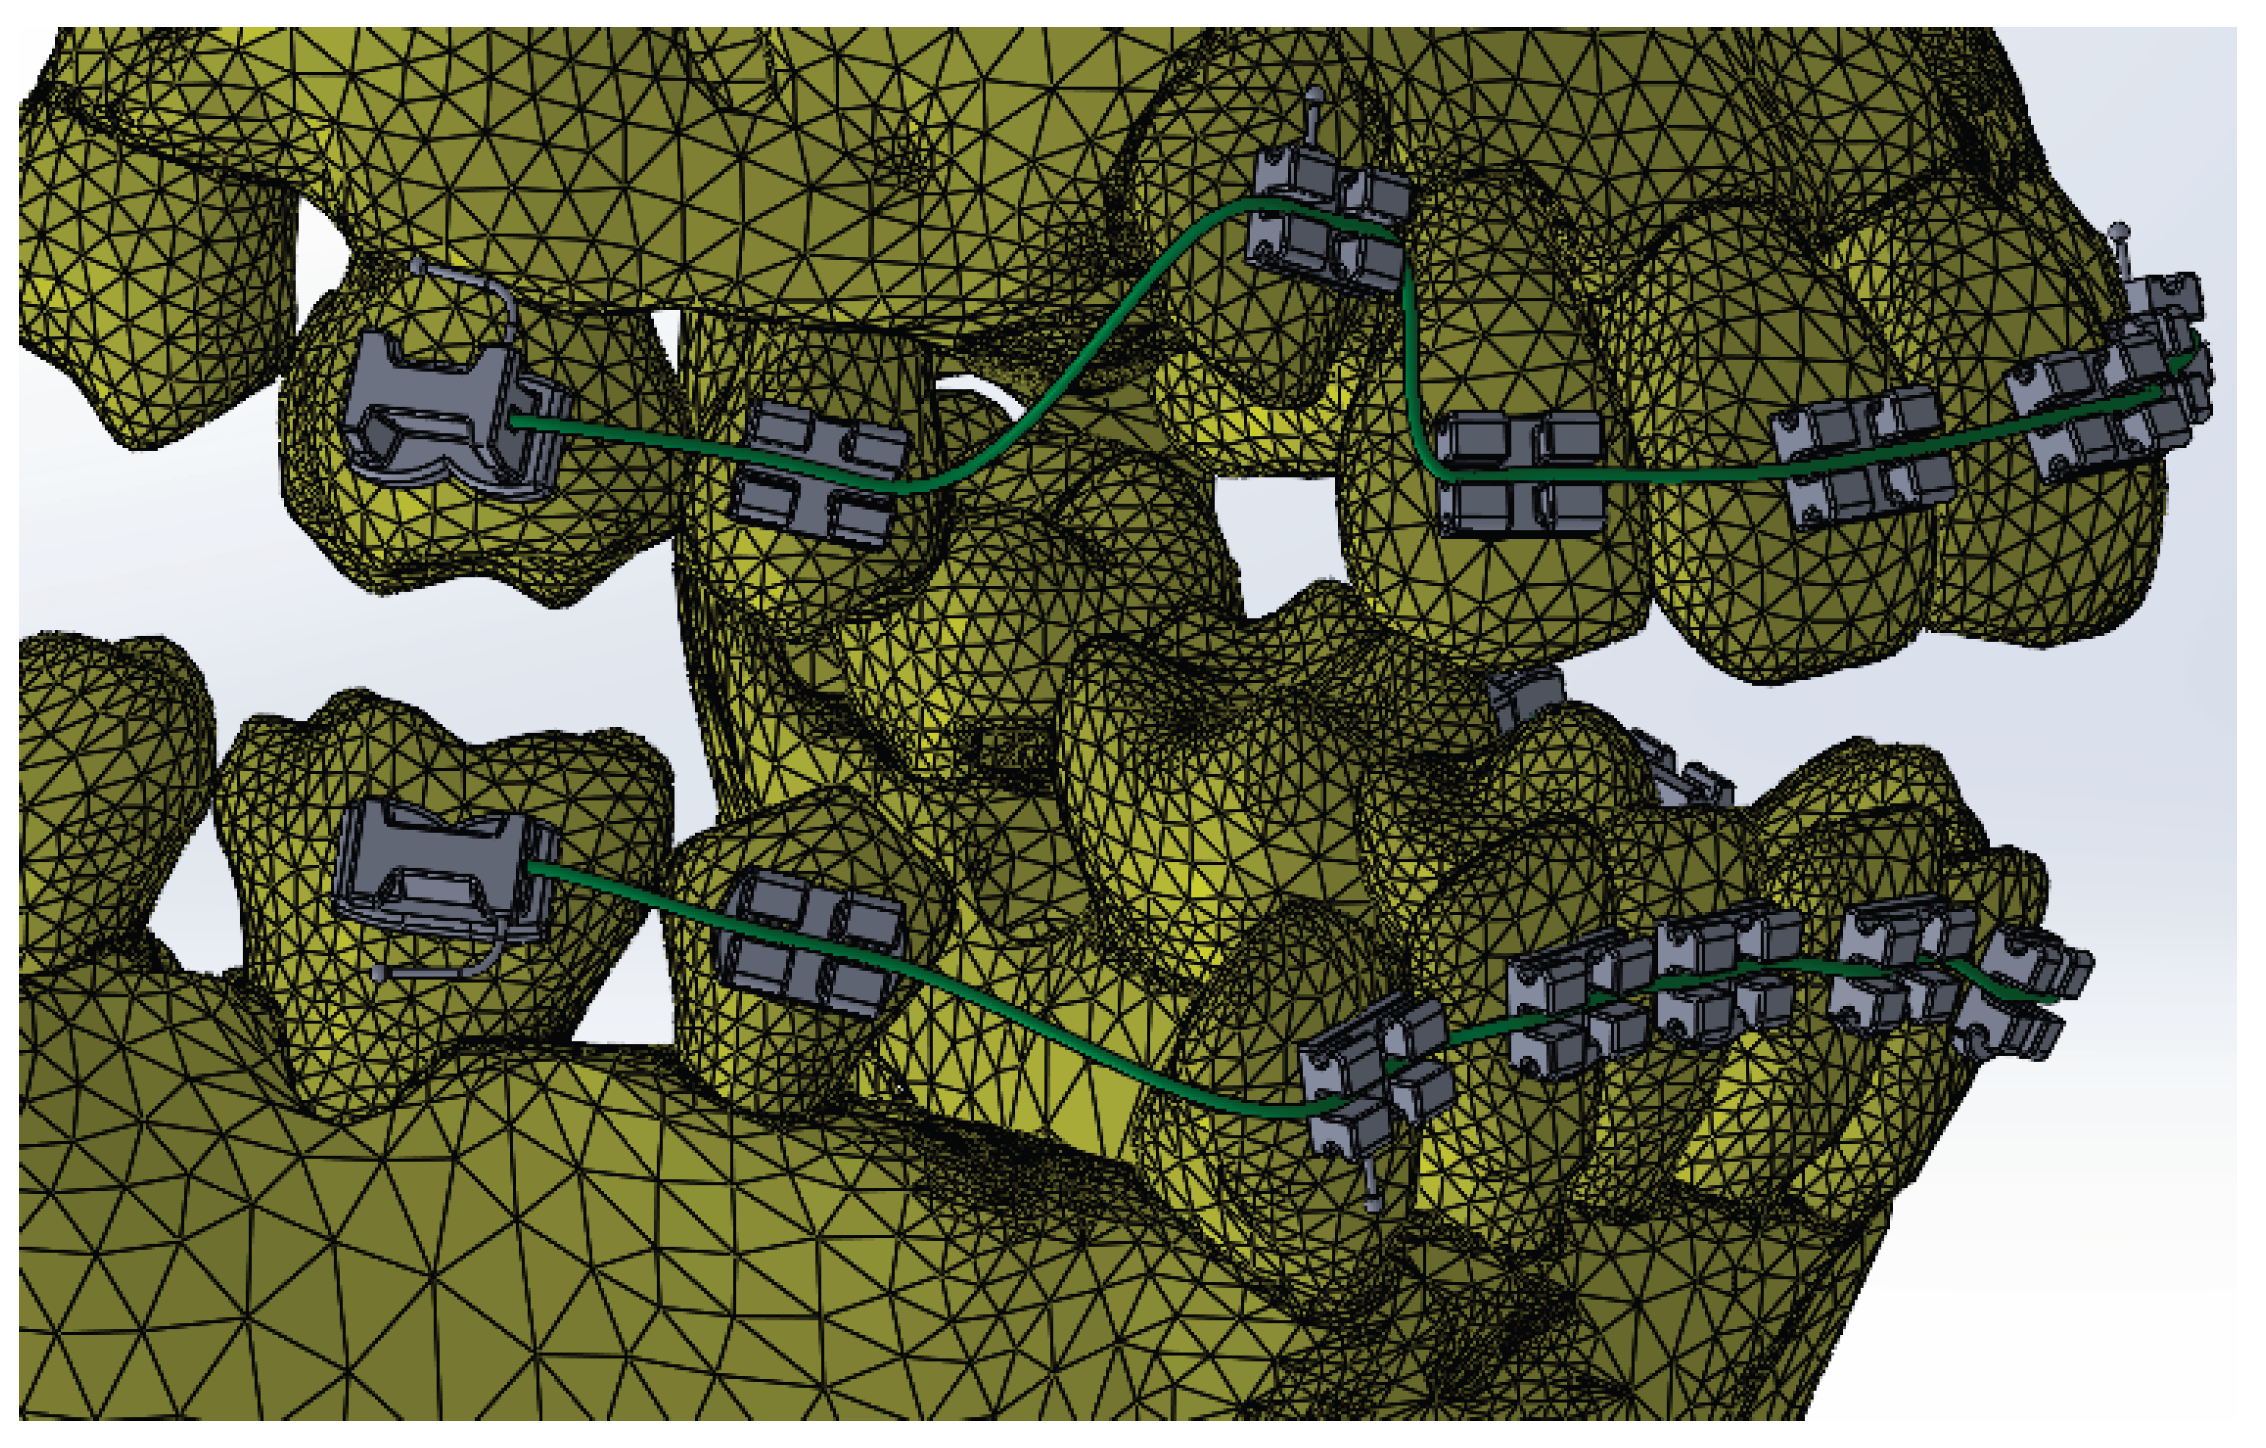
Figure 1.
The orthodontic system.
Two categories of simulations were sustained:
- -
- the oro-facial system (OFS);
- -
- the oro-facial system with metallic braces (OFSMB).
The transient thermal simulation module included in AW was used to load these two models. The control stomatognathic system model is a FEM structure with 1,248,243 nodes and 726,343 elements, while the FEM structure representing the stomatognathic system model with a fixed metallic orthodontic appliance had 1,489,889 nodes and 827,771 elements.
The Engineering Data module defined the tissues and materials used in the simulations based on their thermal characteristics. The utilized tissues and materials are listed in Table 1 [10,11,12].
Next, we defined the temperature sources highlighted at the level of surfaces that are exposed to temperature-diverse foodstuff.
Thus, we wanted to monitor the behavior of the two systems described previously in the following distinct situations:
- -
- hot foodstuff (70 ⁰C) for three seconds, followed by cold foodstuff (-18 ⁰C), then hot foodstuff (HCH) (Figure 2);
- -
- cold foodstuff (-18 ⁰C) for three seconds, followed by hot foodstuff (70 ⁰C), then cold foodstuff (CHC) (Figure 3);
The next step consisted in defining the areas of action of the convection phenomenon. The value that defines the convection phenomenon in the oral cavity is between 2 - 3 W/m2 [13].
Petrescu S.-M.-S. et al. selected teeth 1.1 and 4.1 for these virtual thermal simulations. The reason for choosing these dental units was that any external thermal stimulus acting on the dental arches makes initial contact with the upper and lower central incisors [9].
Taking into account the aforementioned, we used the same teeth to analyze the effects of extreme thermal variations on dental tissues. Thus, to determine the thermal fluctuations at the level of the coronal anatomical structures of 1.1 and 4.1, we used virtual probes of temperature. This operation was possible with the help of the Probe command. The virtual probes of temperature record time related temperature variations, and the obtained values were centralized in a Microsoft Excel document.
3. Results
3.1. Thermal Simulation Results for OFS Subjected Sequentially to HCH Probes of Temperature
Figure 4 illustrates the temperature distribution of the system under thermal simulation.
Using the Probe-type virtual temperature sensors, we obtained the temperature of the tooth enamel (ET) (Figure 5), dentine (DT) (Figure 6), pulp (PT) (Figure 7) and the comparative diagram of the dental structures for 1.1 (Figure 8). We also obtained ET (Figure 9), DT (Figure 10), PT (Figure 11) and the comparative diagram of the dental structures for 4.1 (Figure 12). Finally, we obtained the comparative diagram of the dental structures for 1.1 and 4.1 (Figure 13).
3.2. Thermal Simulation Results for OFS Subjected Sequentially to CHC Probes of Temperature
Figure 14 illustrates the temperature distribution of the system under thermal simulation.
Also, we obtained ET (Figure 15), DT (Figure 16), PT (Figure 17) and the comparative diagram of the dental structures for 1.1 (Figure 18). We also obtained ET (Figure 19), DT (Figure 20), PT (Figure 21) and the comparative diagram of the dental structures for 4.1 (Figure 22). We obtained the comparative diagram of the dental structures for 1.1 and 4.1 (Figure 23).
3.3. Thermal Simulation Results for OFSMB Subjected Sequentially to HCH Probes of Temperature
Figure 24 illustrates the temperature distribution of the system under thermal simulation.
In this simulation, we obtained ET (Figure 25), DT (Figure 26), PT (Figure 27) and the comparative diagram of the dental structures for 1.1 (Figure 28). We also obtained ET (Figure 29), DT (Figure 30), PT (Figure 31) and the comparative diagram of the dental structures for 4.1 (Figure 32). Also, we obtained the comparative diagram of the dental structures for 1.1 and 4.1 (Figure 33).
3.4. Thermal Simulation Results for OFSMB, Subjected Sequentially to CHC Probes of Temperature
Figure 34 illustrates the temperature distribution of the system under thermal simulation.
In that thermal simulation, we obtained ET (Figure 35), DT (Figure 36), PT (Figure 37) and the comparative diagram of the dental structures for 1.1 (Figure 38). We also obtained ET (Figure 39), DT (Figure 40), PT (Figure 41) and the comparative diagram of the dental structures for 4.1 (Figure 42). In the final, we obtained the comparative diagram of the dental structures for 1.1 and 4.1 (Figure 43).
3.5. Comparative Diagrams
According to dental research, an increase or decrease in intrapulpal temperature by approximately 5.5 ºC leads to irreversible damage to the pulp tissue [14,15]. Thus, the morpho-functional integrity of the dental pulp is unaffected by thermal changes between 31.5 and 42.5 ºC.
Figure 44 presents a comparative diagram illustrating the effect of temperature on the pulp of 1.1, subjected sequentially to HCH probe.
Figure 45 presents a comparative diagram illustrating the effect of temperature on the pulp of 4.1, subjected sequentially to HCH probe.
Figure 46 presents a comparative diagram illustrating the effect of temperature on the pulp of 1.1, subjected sequentially to CHC probe.
Figure 47 presents a comparative diagram illustrating the effect of temperature on the pulp of 4.1, subjected sequentially to CHC probe.
4. Discussion
Thermal studies using FEM in the field of orthodontics are relatively few, as this branch of dentistry focuses mainly on the analysis of the mechanical forces distribution on dental tissues, periodontal ligament and alveolar bone [16,17].
Thermal studies using FEM in orthodontics represent a relatively new field, but with significant promise in terms of deep understanding of the biomechanical and biophysical interactions that occur at the level of orthodontic devices and structures of the dento-maxillary apparatus. The most relevant situations are when the components of the stomatognathic system are affected by different thermal stimuli, such as those generated by the consumption of cold and hot foods and drinks, or by various treatments with external heat sources [18,19].
FEM involves dividing a complex body into small elementary volumes and numerically solving the differential equations that describe the thermal and mechanical behavior inside each element. FEM allows for detailed modeling of heat transfer in structures such as brackets, orthodontic wires and dental tissues. This approach is particularly valuable because it allows the evaluation of temperature distribution depending on the materials used, the geometry of the orthodontic device components, and the imposed boundary conditions (ambient temperature, saliva contact, etc.) [20].
Thus, FEM can be employed to develop a mathematical representation of the force that occurs as a result of the orthodontic wires deformation during a specialized treatment, using the straight-wire technique. Forces of different intensities were applied by the researchers, who then measured the resulting displacements at specific locations on the orthodontic wires. Simulations were performed for force intensities (F) from 0.1 to 10 N for both the upper and lower orthodontic wires. The value of the elastic constant (k) was also calculated, according to the relationship k=F/x. According to the authors, the ideal force for effective orthodontic treatment is up to 1 N, as higher forces can cause increased tensions at the root apex and alveolar bone [5].
Another FEM research quantified the extreme stresses, the orientation of applied forces, and the resulting tooth displacements in periodontal tissues with various extents of daterioration. The exerted forces reached a maximum value of 1 N. The main disadvantage of fixed orthodontic treatments is that the generated forces cannot be easily quantified in clinical practice. As with the conclusions of the previously mentioned study, the researchers also advise that force intensity should remain below 1 N for teeth affected by periodontal disease [21].
Regarding the main field of activity of FEM in orthodontics, namely biomechanics, this virtual analysis was also used in the assessment of displacement, strain and stress at the periodontal ligament level. This anatomical structure plays the most important role during orthodontic therapy, mediating the processes of bone resorption and apposition responsible for tooth displacements. Taking into account the data from the specialized literature, the researchers used forces between 0.5 and 1 N during the simulations. As conclusions, the evolution of the diagrams depending on the force applied to the metallic orthodontic components was almost linear. In addition to their inherent rigidity, the orthodontic systems demonstrated elasticity, resulting from the properties of the orthodontic wires and the periodontal ligaments [6].
A similar experimental study using FEM described the physical effects resulting from the action of distinct thermal agents on an OFS and on an OFSMB. Following the action of thermal stimuli on the virtual models, with the help of the AW program, based on FEM analysis, the authors concluded that temperature are significantly higher at the pulp of OFSMB [9].
Regarding the weaknesses of this study, we can refer to the lack of a thin film of orthodontic adhesive used for the bonding of bracket and tube-type elements. Modern composites, including those used in fixed orthodontic treatments, have physical properties similar to those of dental hard tissues, which theoretically does not influence the transmission of thermal stimuli to the dental pulp. Also, as previously mentioned, a thin film of adhesive is located between the enamel surface and the base of the brackets and tubes, the thermal isolation effect being reduced or even absent. Another disadvantage present in the case of thermal simulations performed at the level of the oral cavity using FEM is represented by the absence of saliva. Saliva can produce an attenuation of the thermal effect of various stimuli, helping to regulate the intraoral temperature. However, our study was conducted at the dental pulp level of 1.1 and 4.1, these being the first teeth to come into contact with foods and drinks, with minimal salivary protection.
As future research directions, we propose to analyze with the help of FEM the effect of different thermal agents (hot drinks) on clear aligners, in the event that the patient does not remove them from the oral cavity. According to studies in the specialized literature and manufacturers' indications, aligners should be removed from the oral cavity before consuming any type of drink and food.
5. Conclusions
FEM is a non-invasive method for analyzing thermal stress in the oral cavity, especially since it represents the first segment of the digestive tract and, as such, is in direct contact with the original temperature of foods and beverages.
The analysis of the resulting data led to the conclusion that, in simulations without the existence of metallic braces, the highest thermal values observed in the pulp of 1.1 were obtained in CHC regime. Also, in the simulations with metallic braces, the highest thermal values observed in the pulp of 1.1 were obtained in CHC regime. On the other hand, in the simulations without metallic braces, the highest thermal values observed in the pulp of 4.1 were obtained in HCH regime. Also, in the simulations with metallic braces, the highest thermal values observed in the pulp of 4.1 were obtained in HCH regime.
Subsequent to the simulations executed in this study, it can be observed that the thermal variations from the dental pulp are more severe in the case of OFSMB (regardless of the type of thermal stimulus used). Thus, even today, with all the facilities available in the dental materials industry, metallic orthodontic devices present significant thermal conductivity, generating harmful effects on the dental structures. Through studies of this kind carried out with the help of FEM, it is possible to achieve an improvement in the manufacturing technologies of orthodontic devices made of different metal alloys, as well as of the adjuvant consumable materials used in orthodontic therapy.
FEM studies on thermal variations in orthodontics represent niche but increasingly important research. This can be concluded from the fact that the extremely varied temperature in the oral cavity influence not only the tissues that compose the anatomical structures, but also the materials used in orthodontic treatments.
Author Contributions
Conceptualization, S.-M.-S.P., M.P., M.B., A.-M.R. and D.L.P.; methodology, S.-M.-S.P., M.R.P., G.B. and E.-M.C.; validation, M.R.P., S.-M.-S.P., M.P., D.L.P. and T.-C.D.; resources, S.-M.-S.P., M.P., A.-M.R., G.B. and M.B.; data curation, M.R.P., S.-M.-S.P., M.P., M.B. and D.L.P.; writing—original draft preparation, S.-M.-S.P., M.P., E.-M.C. and T.-C.D.; writing—review and editing, M.R.P., D.L.P. and M.B; visualization, S.-M.-S.P., M.P., A.-M.R. and G.B.; supervision, M.R.P., D.L.P. and E.-M.C.; project administration, S.-M.-S.P., M.P., D.L.P., A.-M.R and G.B. All authors have read and agreed to the published version of the manuscript.
Funding
The article processing charges were funded by the University of Medicine and Pharmacy of Craiova, Romania.
Institutional Review Board Statement
The study was conducted according to the guidelines of the Declaration of Helsinki and approved by the Ethics Committee of the University of Medicine and Pharmacy of Craiova (approval reference no. 127/09.04.2024).
Informed Consent Statement
Written informed consent was obtained from the legal guardian of the patient involved in this study.
Data Availability Statement
The authors declare that the data from this research are available from the corresponding authors upon reasonable request.
Conflicts of Interest
The authors declare no conflicts of interest.
References
- Yu, X.; Zhang, H.; Sun, L.; Pan, J.; Liu, Y.; Chen, L. Prevalence of malocclusion and occlusal traits in the early mixed dentition in Shanghai, China. PeerJ. 2019, 7, e6630. [Google Scholar] [CrossRef] [PubMed]
- Rodríguez-Olivos, L.H.G.; Chacón-Uscamaita, P.R.; Quinto-Argote, A.G.; Pumahualcca, G.; Pérez-Vargas, L.F. Deleterious oral habits related to vertical, transverse and sagittal dental malocclusion in pediatric patients. BMC Oral Health. 2022, 22, 88. [Google Scholar] [CrossRef] [PubMed]
- Tarniţă, D.; Boborelu, C.; Popa, D.L.; Tarniţă, C.; Rusu, L. The three-dimensional modeling of the complex virtual human elbow joint. Rom. J. Morphol. Embryol. 2010, 51, 489–495. [Google Scholar] [PubMed]
- Kaaber, L.; Matzen, L.H.; Schropp, L.; Spin-Neto, R. Low-dose CBCT protocols in implant dentistry: a systematic review. Oral Surg. Oral Med. Oral Pathol. Oral Radiol. 2024, 138, 427–439. [Google Scholar] [CrossRef] [PubMed]
- Petrescu, S.-M.-S.; Țuculină, M.J.; Popa, D.L.; Duță, A.; Sălan, A.I.; Voinea-Georgecu, R.; Diaconu, O.A.; Turcu, A.A.; Mocanu, H.; Nicola, A.G.; et al. Modeling and Simulating an Orthodontic System Using Virtual Methods. Diagnostics 2022, 12, 1296. [Google Scholar] [CrossRef] [PubMed]
- Katta, M.; Petrescu, S.-M.-S.; Dragomir, L.P.; Popescu, M.R.; Voinea-Georgescu, R.; Țuculină, M.J.; Popa, D.L.; Duță, A.; Diaconu, O.A.; Dascălu, I.T. Using the Finite Element Method to Determine the Odonto-Periodontal Stress for a Patient with Angle Class II Division 1 Malocclusion. Diagnostics 2023, 13, 1567. [Google Scholar] [CrossRef] [PubMed]
- Kendre, B.; Kumar, A.; Shetty, K.N.; Hedge, G.; Umale, V.; Kulshrestha, R. Evaluation of stress changes in the maxilla with fixed functional appliances - A 3D FEM study. J. Orthod. Sci. 2021, 10, 10. [Google Scholar] [CrossRef] [PubMed]
- Dailey, H.L.; Kersh, M.E.; Collins, C.J.; Troy, K.L. Mechanical Biomarkers in Bone Using Image-Based Finite Element Analysis. Curr. Osteoporos. Rep. 2023, 21, 266–277. [Google Scholar] [CrossRef] [PubMed]
- Petrescu, S.-M.-S.; Rauten, A.-M.; Popescu, M.; Popescu, M.R.; Popa, D.L.; Ilie, D.; Duță, A.; Răcilă, L.D.; Vintilă, D.D.; Buciu, G. Assessment of Thermal Influence on an Orthodontic System by Means of the Finite Element Method. Bioengineering 2024, 11, 1002. [Google Scholar] [CrossRef] [PubMed]
- Hashemipour, M.A.; Mohammadpour, A.; Nassab, S.A. Transient thermal and stress analysis of maxillary second premolar tooth using an exact three-dimensional model. Indian J. Dent. Res. 2010, 21, 158–164. [Google Scholar] [CrossRef] [PubMed]
- Ausiello, P.; Franciosa, P.; Martorelli, M.; Watts, D.C. Numerical fatigue 3D-FE modeling of indirect composite-restored posterior teeth. Dent. Mater. 2011, 27, 423–430. [Google Scholar] [CrossRef] [PubMed]
- Alnazzawi, A.; Watts, D.C. Simultaneous determination of polymerization shrinkage, exotherm and thermal expansion coefficient for dental resin-composites. Dent. Mater. 2012, 28, 1240–1249. [Google Scholar] [CrossRef] [PubMed]
- Xie, H.; Deng, S.; Zhang, Y.; Zhang, J. Simulation study on convective heat transfer of the tongue in closed mouth. In Proceedings of the 8th IEEE International Conference on Software Engineering and Service Science (ICSESS), Beijing, China, 24–26 November 2017; pp. 802–805. [Google Scholar]
- Zach, L.; Cohen, G. Pulp response to external heat. Oral Surg. 1965, 19, 515–530. [Google Scholar] [CrossRef]
- Stănuşi, A.Ş.; Popa, D.L.; Ionescu, M.; Cumpătă, C.N.; Petrescu, G.S.; Ţuculină, M.J.; Dăguci, C.; Diaconu, O.A.; Gheorghiță, L.M.; Stănuşi, A. Analysis of Temperatures Generated During Conventional Laser Irradiation of Root Canals–A Finite Element Study. Diagnostics 2023, 13, 1757. [Google Scholar] [CrossRef] [PubMed]
- Bonab, M.F.; Mojra, A.; Shirazi, M. A numerical-experimental study on thermal evaluation of orthodontic tooth movement during initial phase of treatment. J. Therm. Biol. 2019, 80, 45–55. [Google Scholar] [CrossRef] [PubMed]
- Kuc, A.E.; Sybilski, K.; Stankiewicz, M.; Kotuła, J.; Kuc, N.; Hajduk, G.; Małachowski, J.; Sarul, M. The Influence of Bone Density on Stresses in the Periodontal Ligament During Orthodontic Movement—Finite Element Study on Innovative Model. Materials 2025, 18, 776. [Google Scholar] [CrossRef] [PubMed]
- Țuculină, M.J.; Staicu, A.N.; Munteanu, M.C.; Cumpătă, C.N.; Dimitriu, B.; Rîcă, A.M.; Beznă, M.C.; Popa, D.L.; Popescu, A.D.; Țîrcă, T. Study on the Restoration of Class II Carious Cavities by Virtual Methods: Simulation of Mechanical Behavior. J. Funct. Biomater. 2023, 14, 354. [Google Scholar] [CrossRef] [PubMed]
- Staicu, A.N.; Țuculină, M.J.; Cumpătă, C.N.; Rîcă, A.M.; Beznă, M.C.; Popa, D.L.; Popescu, A.D.; Diaconu, O.A. A Finite Element Method Study on a Simulation of the Thermal Behaviour of Four Methods for the Restoration of Class II Cavities. J. Funct. Biomater. 2024, 15, 86. [Google Scholar] [CrossRef] [PubMed]
- Zeno, K.G.; Ammoury, M.J. The surge of finite element analysis in the study of orthodontic mechanics: are the findings applicable in practice? Seminars in Orthodontics. 2023, 29, 308–316. [Google Scholar] [CrossRef]
- Luchian, I.; Mârțu, M.A.; Tatarciuc, M.; Scutariu, M.M.; Ioanid, N.; Păsărin, L.; Kappenberg-Nițescu, D.C.; Sioustis, I.A.; Solomon, S.M. Using FEM to Assess the Effect of Orthodontic Forces on Affected Periodontium. Appl. Sci. 2021, 11, 7183. [Google Scholar] [CrossRef]
Figure 2.
Temperature source regime (HCH).
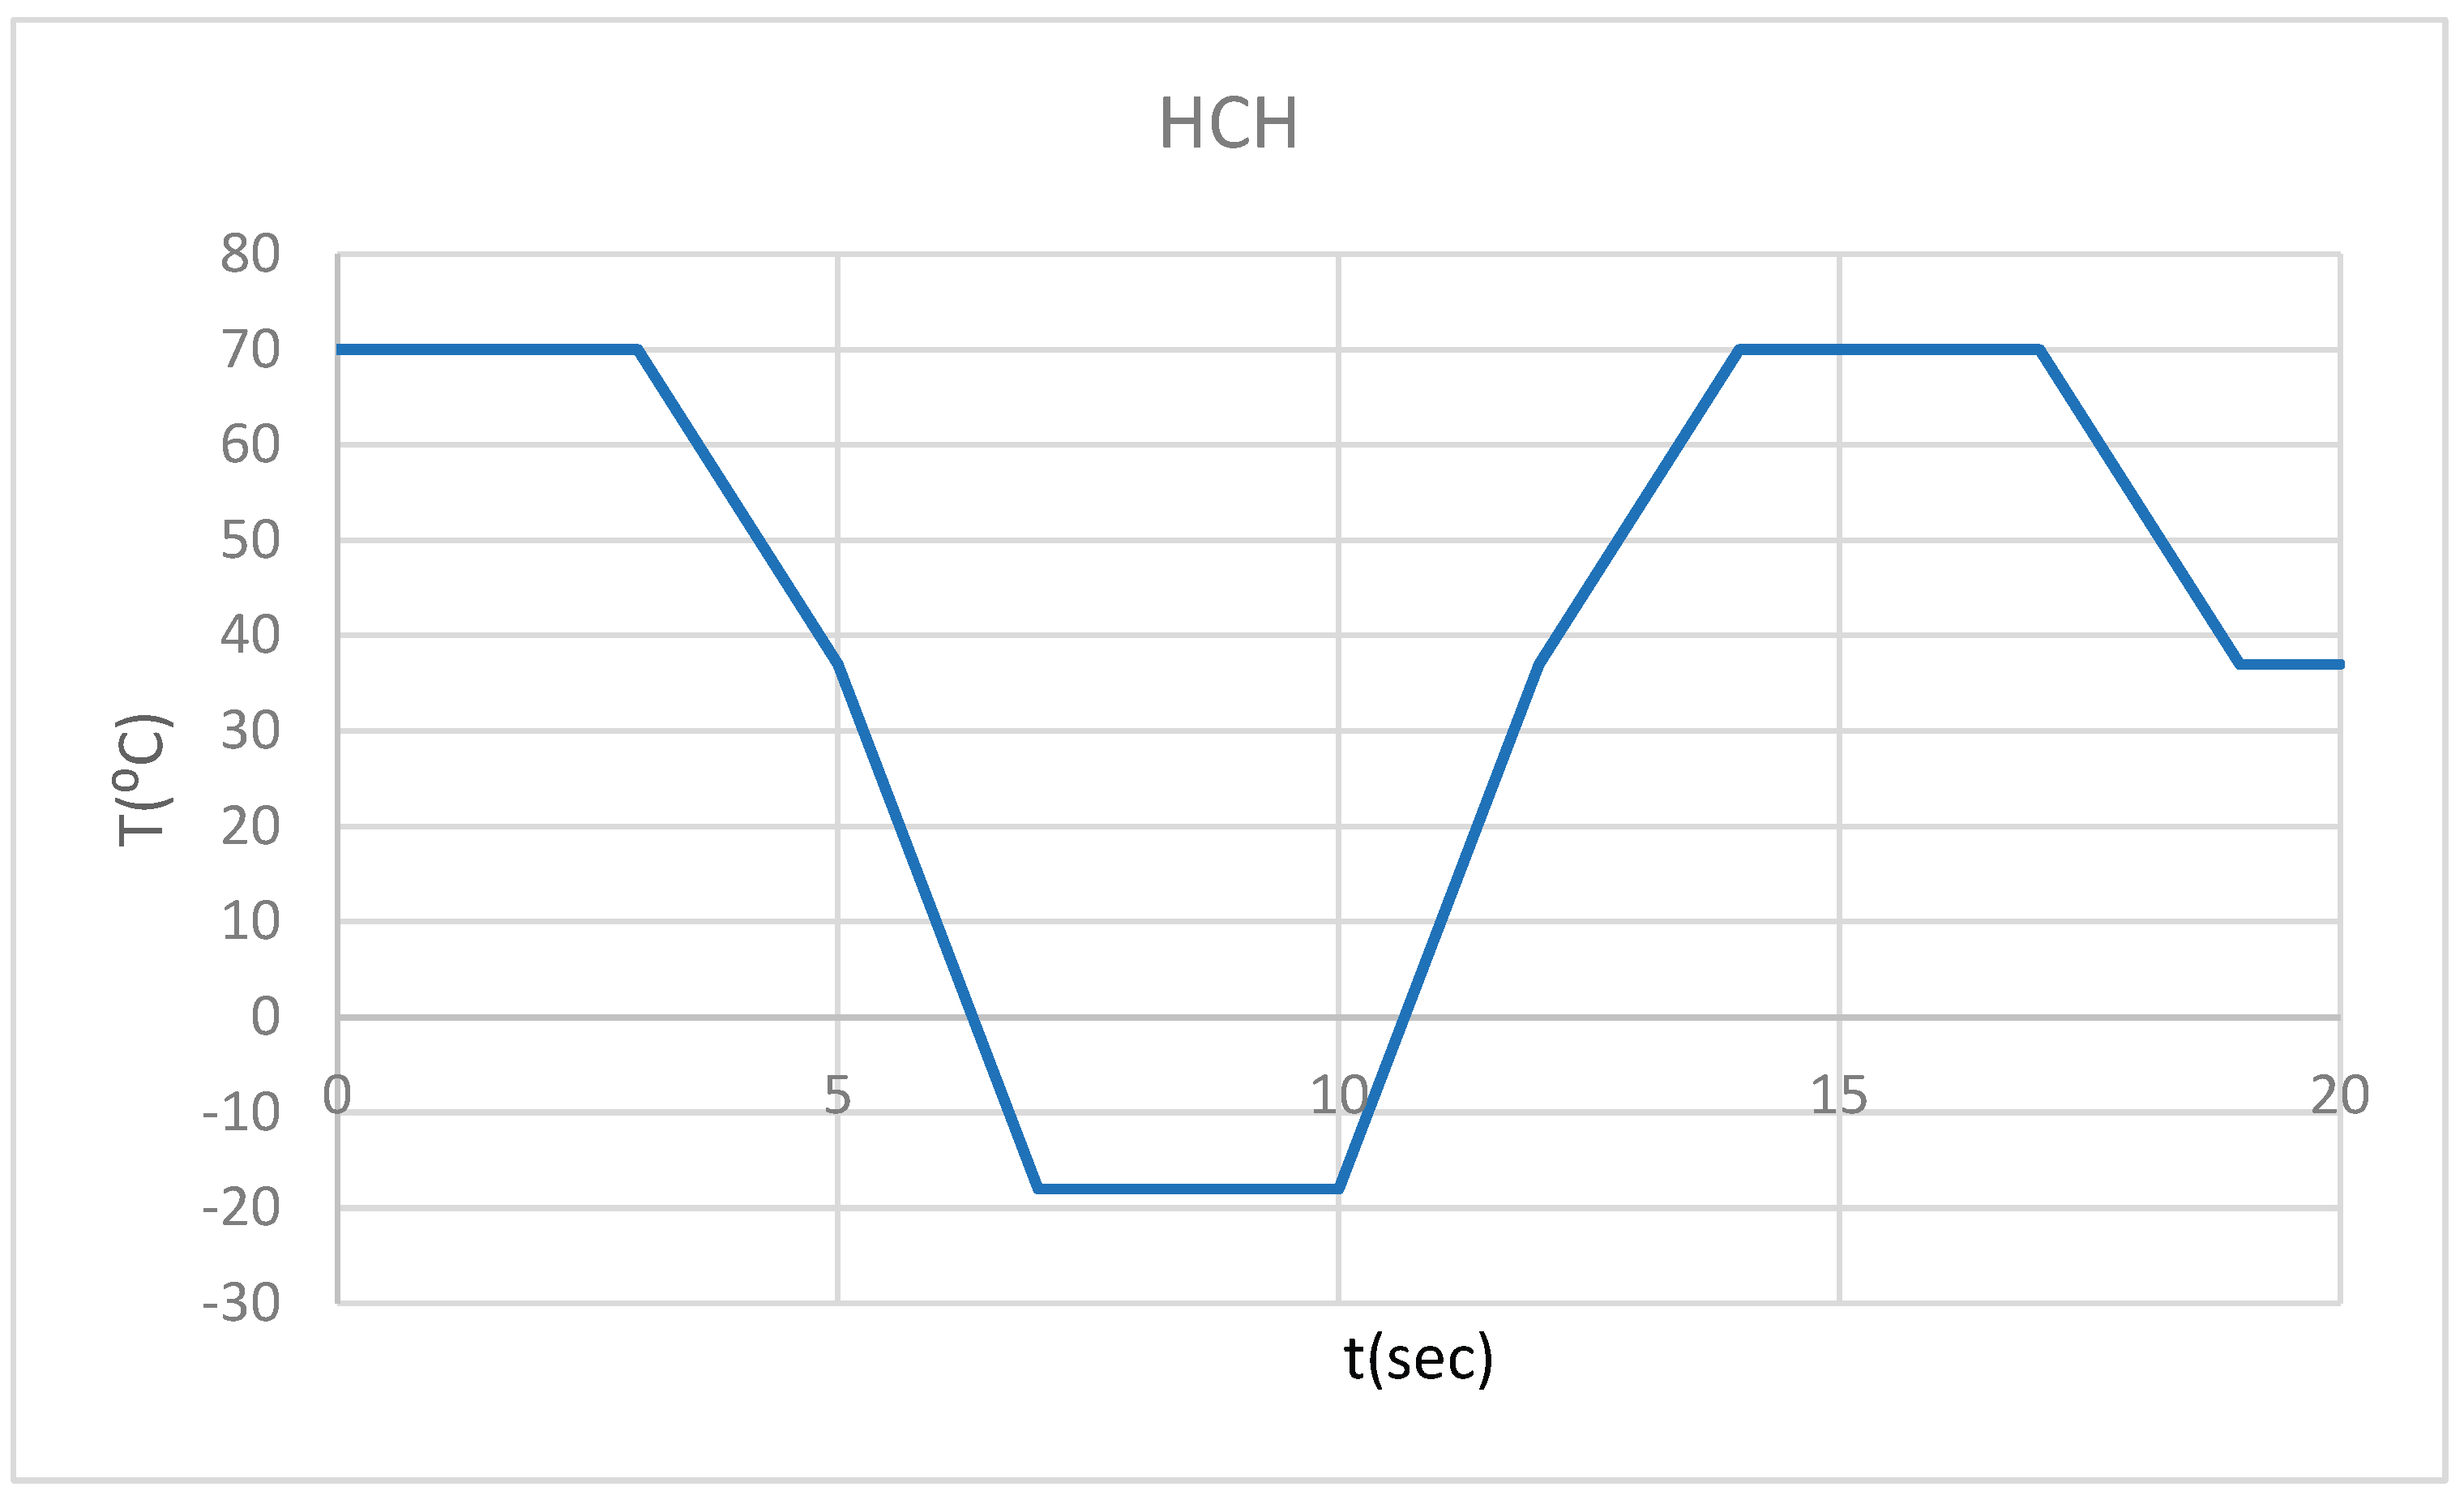
Figure 3.
Temperature source regime (CHC).
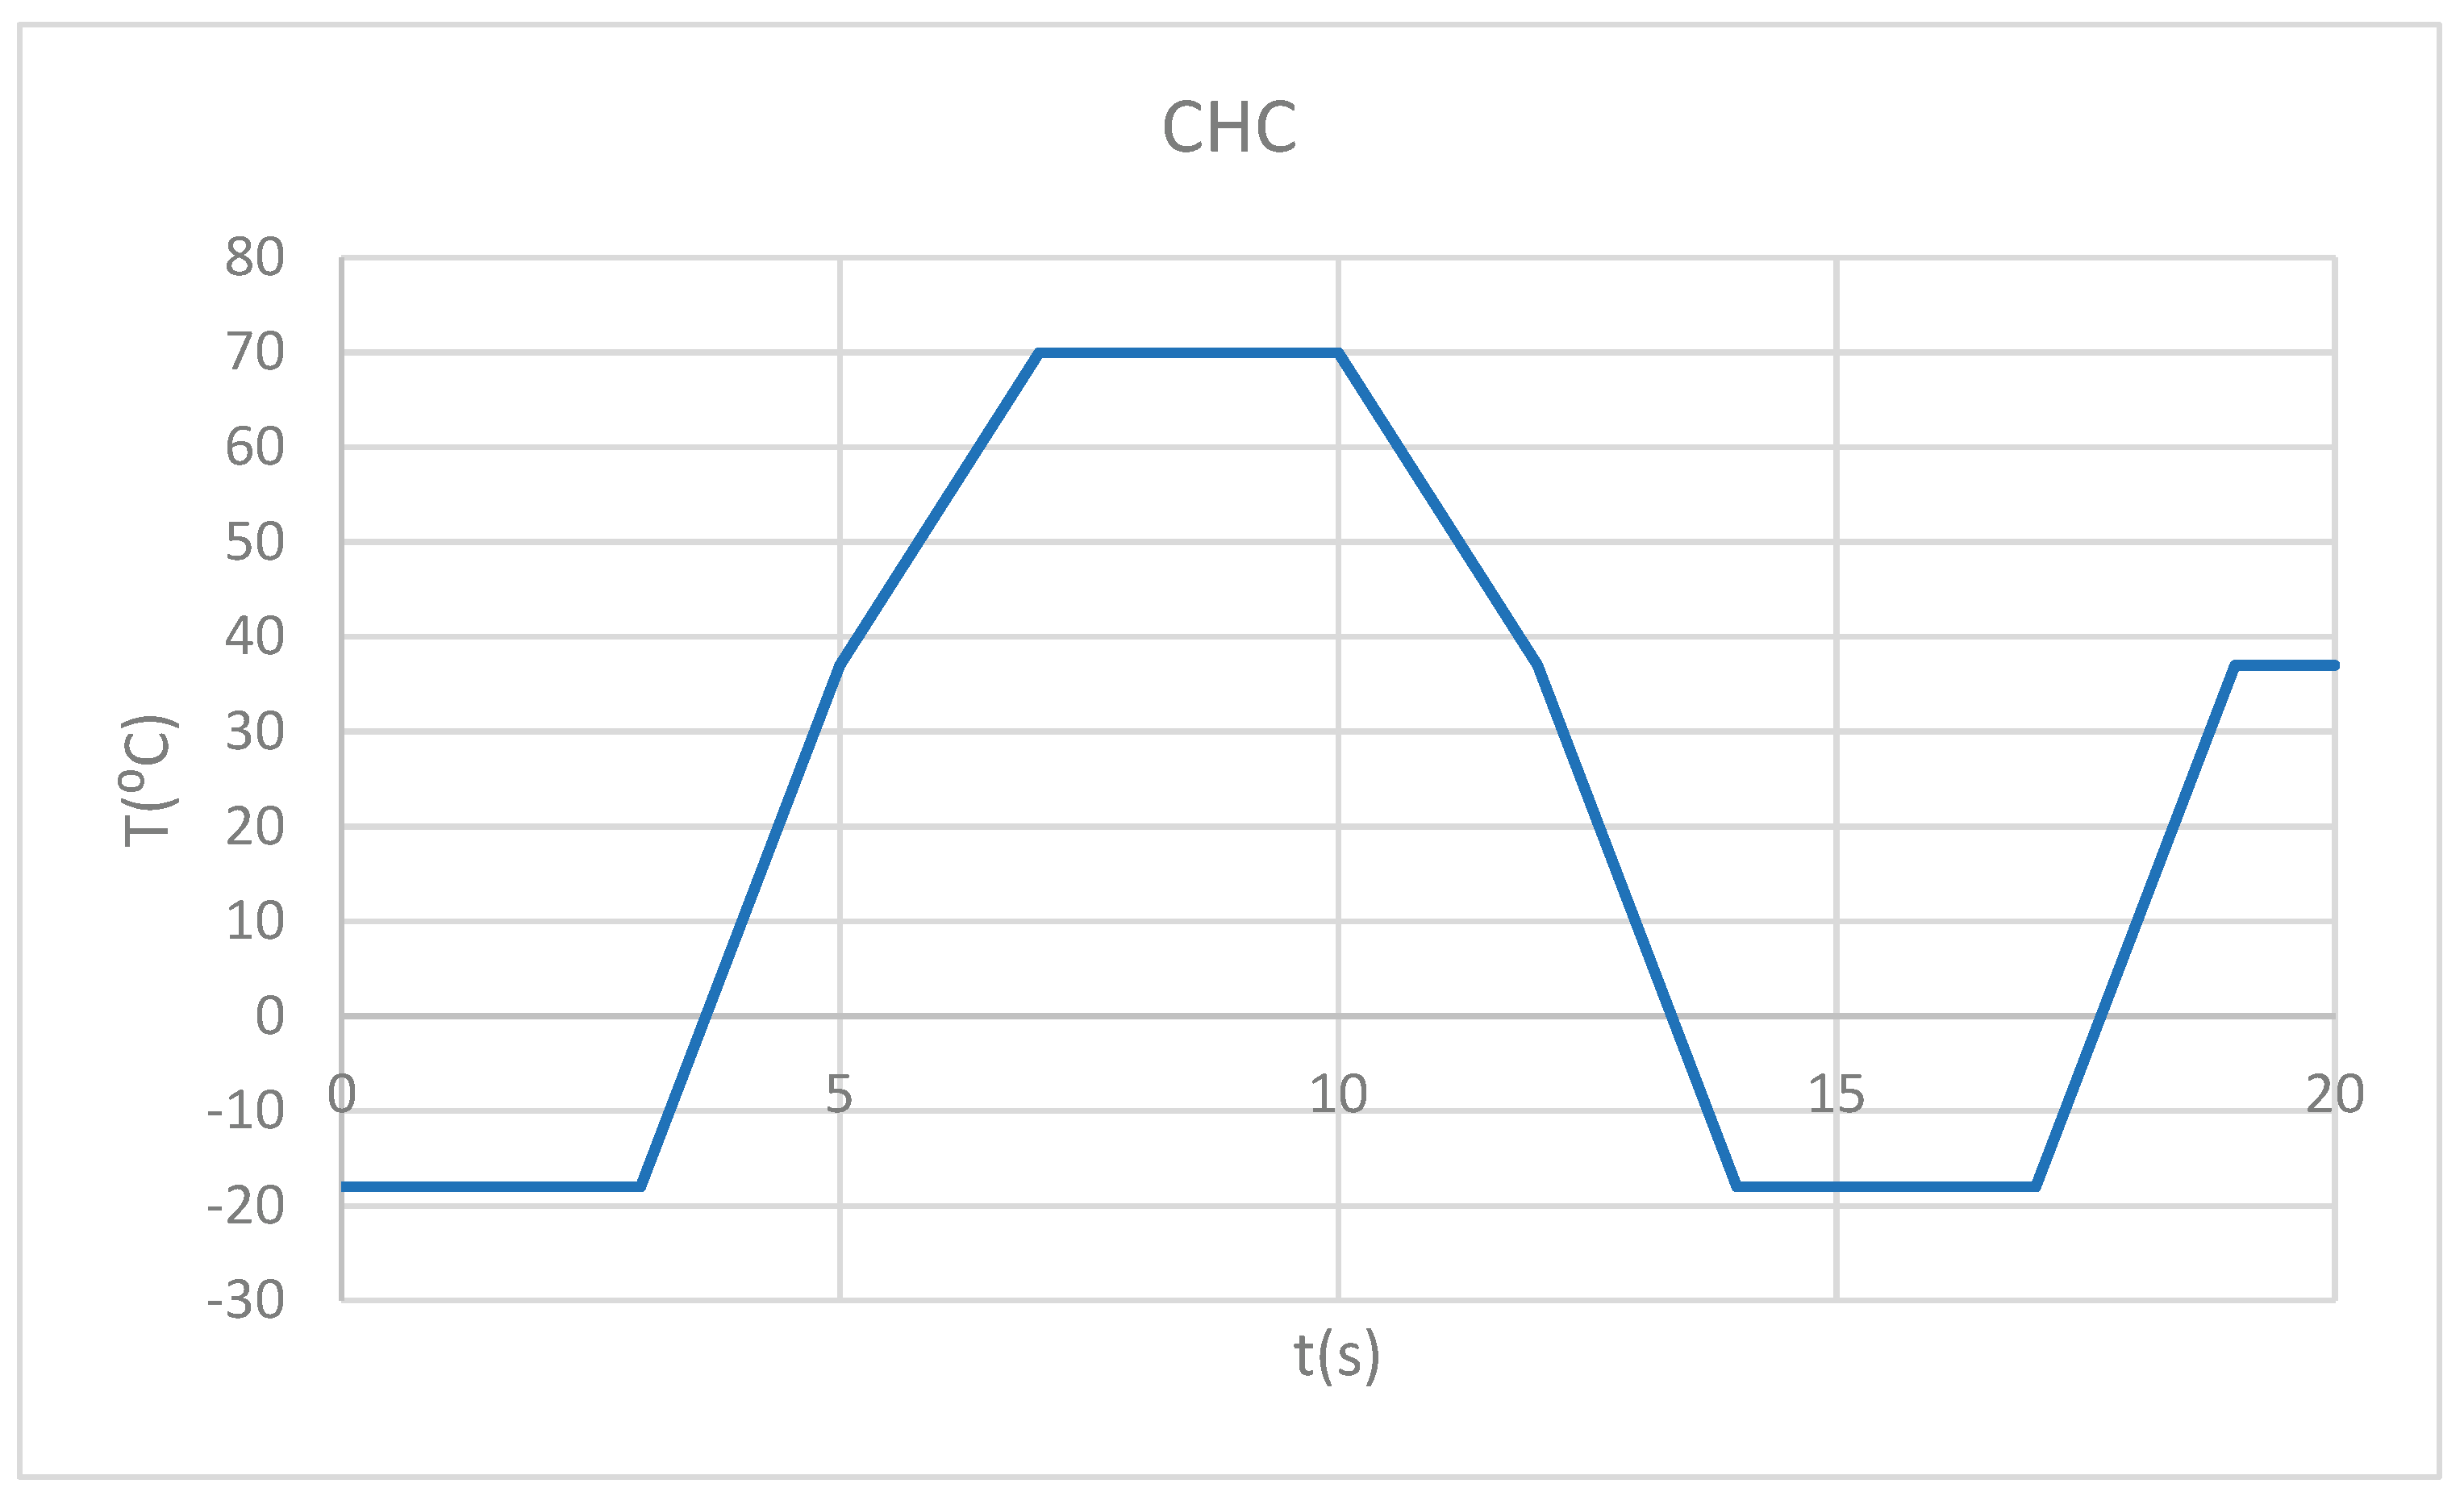
Figure 4.
Thermal map.
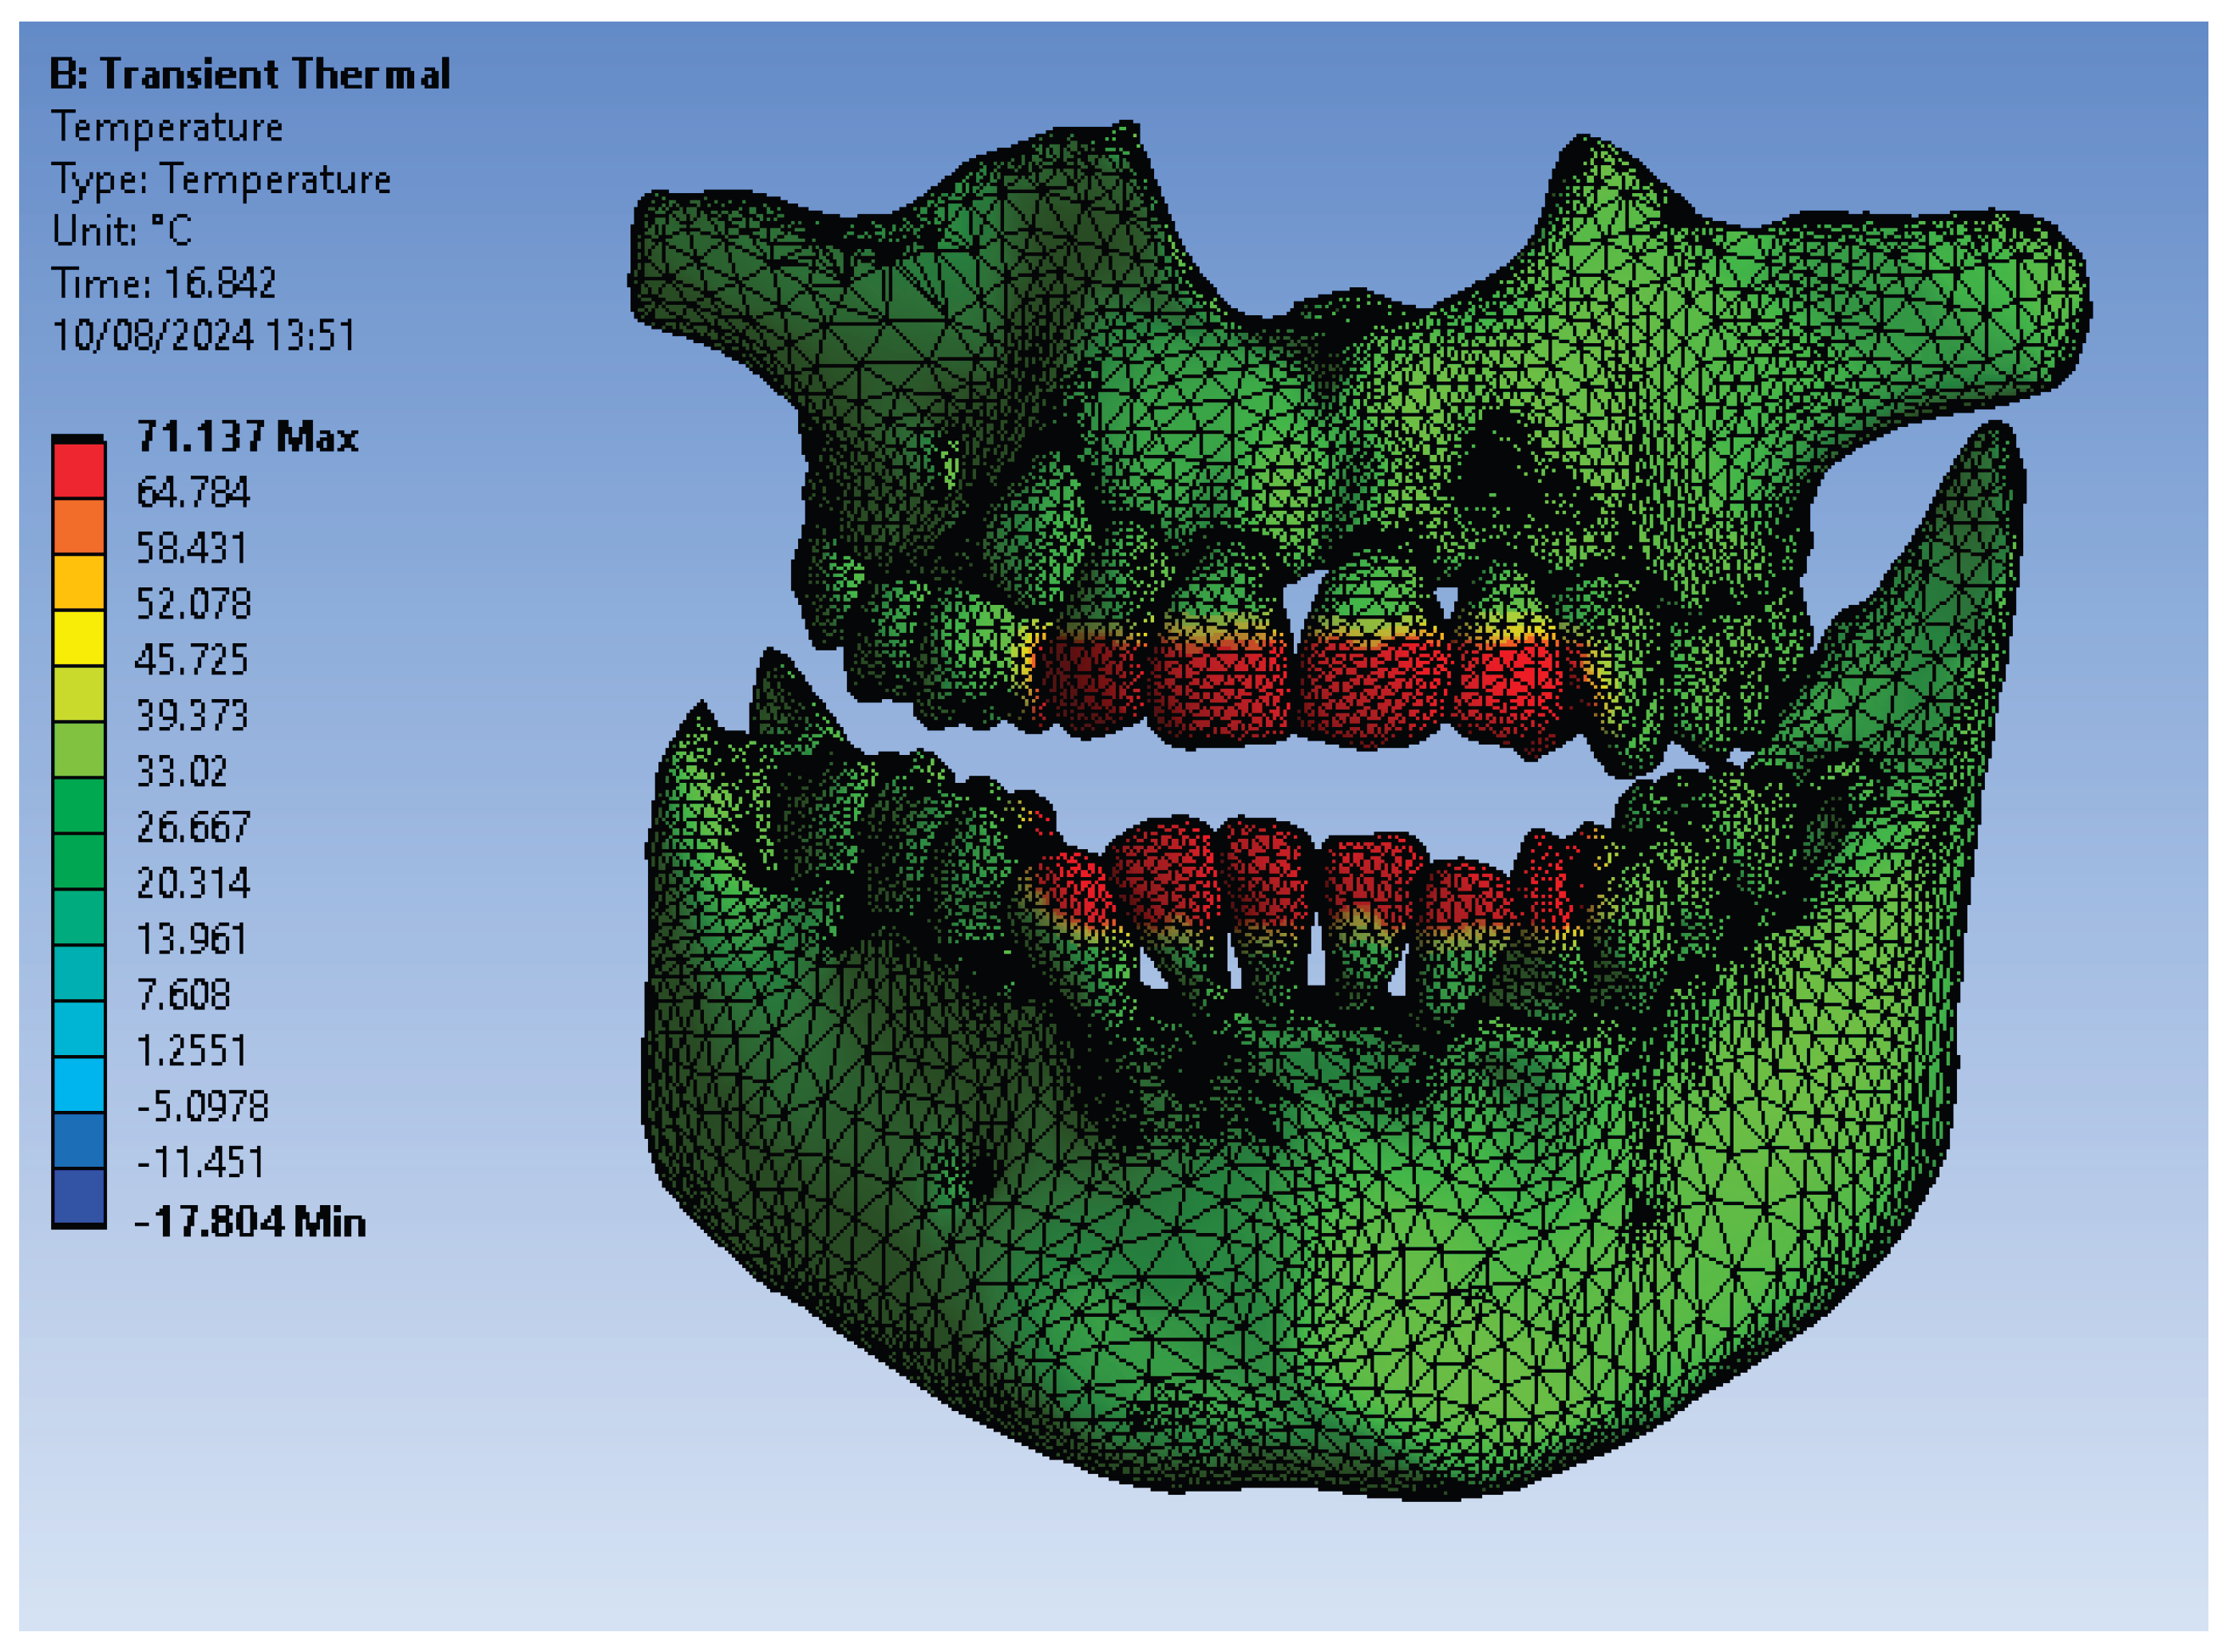
Figure 5.
ET for 1.1 subjected to HCH source.
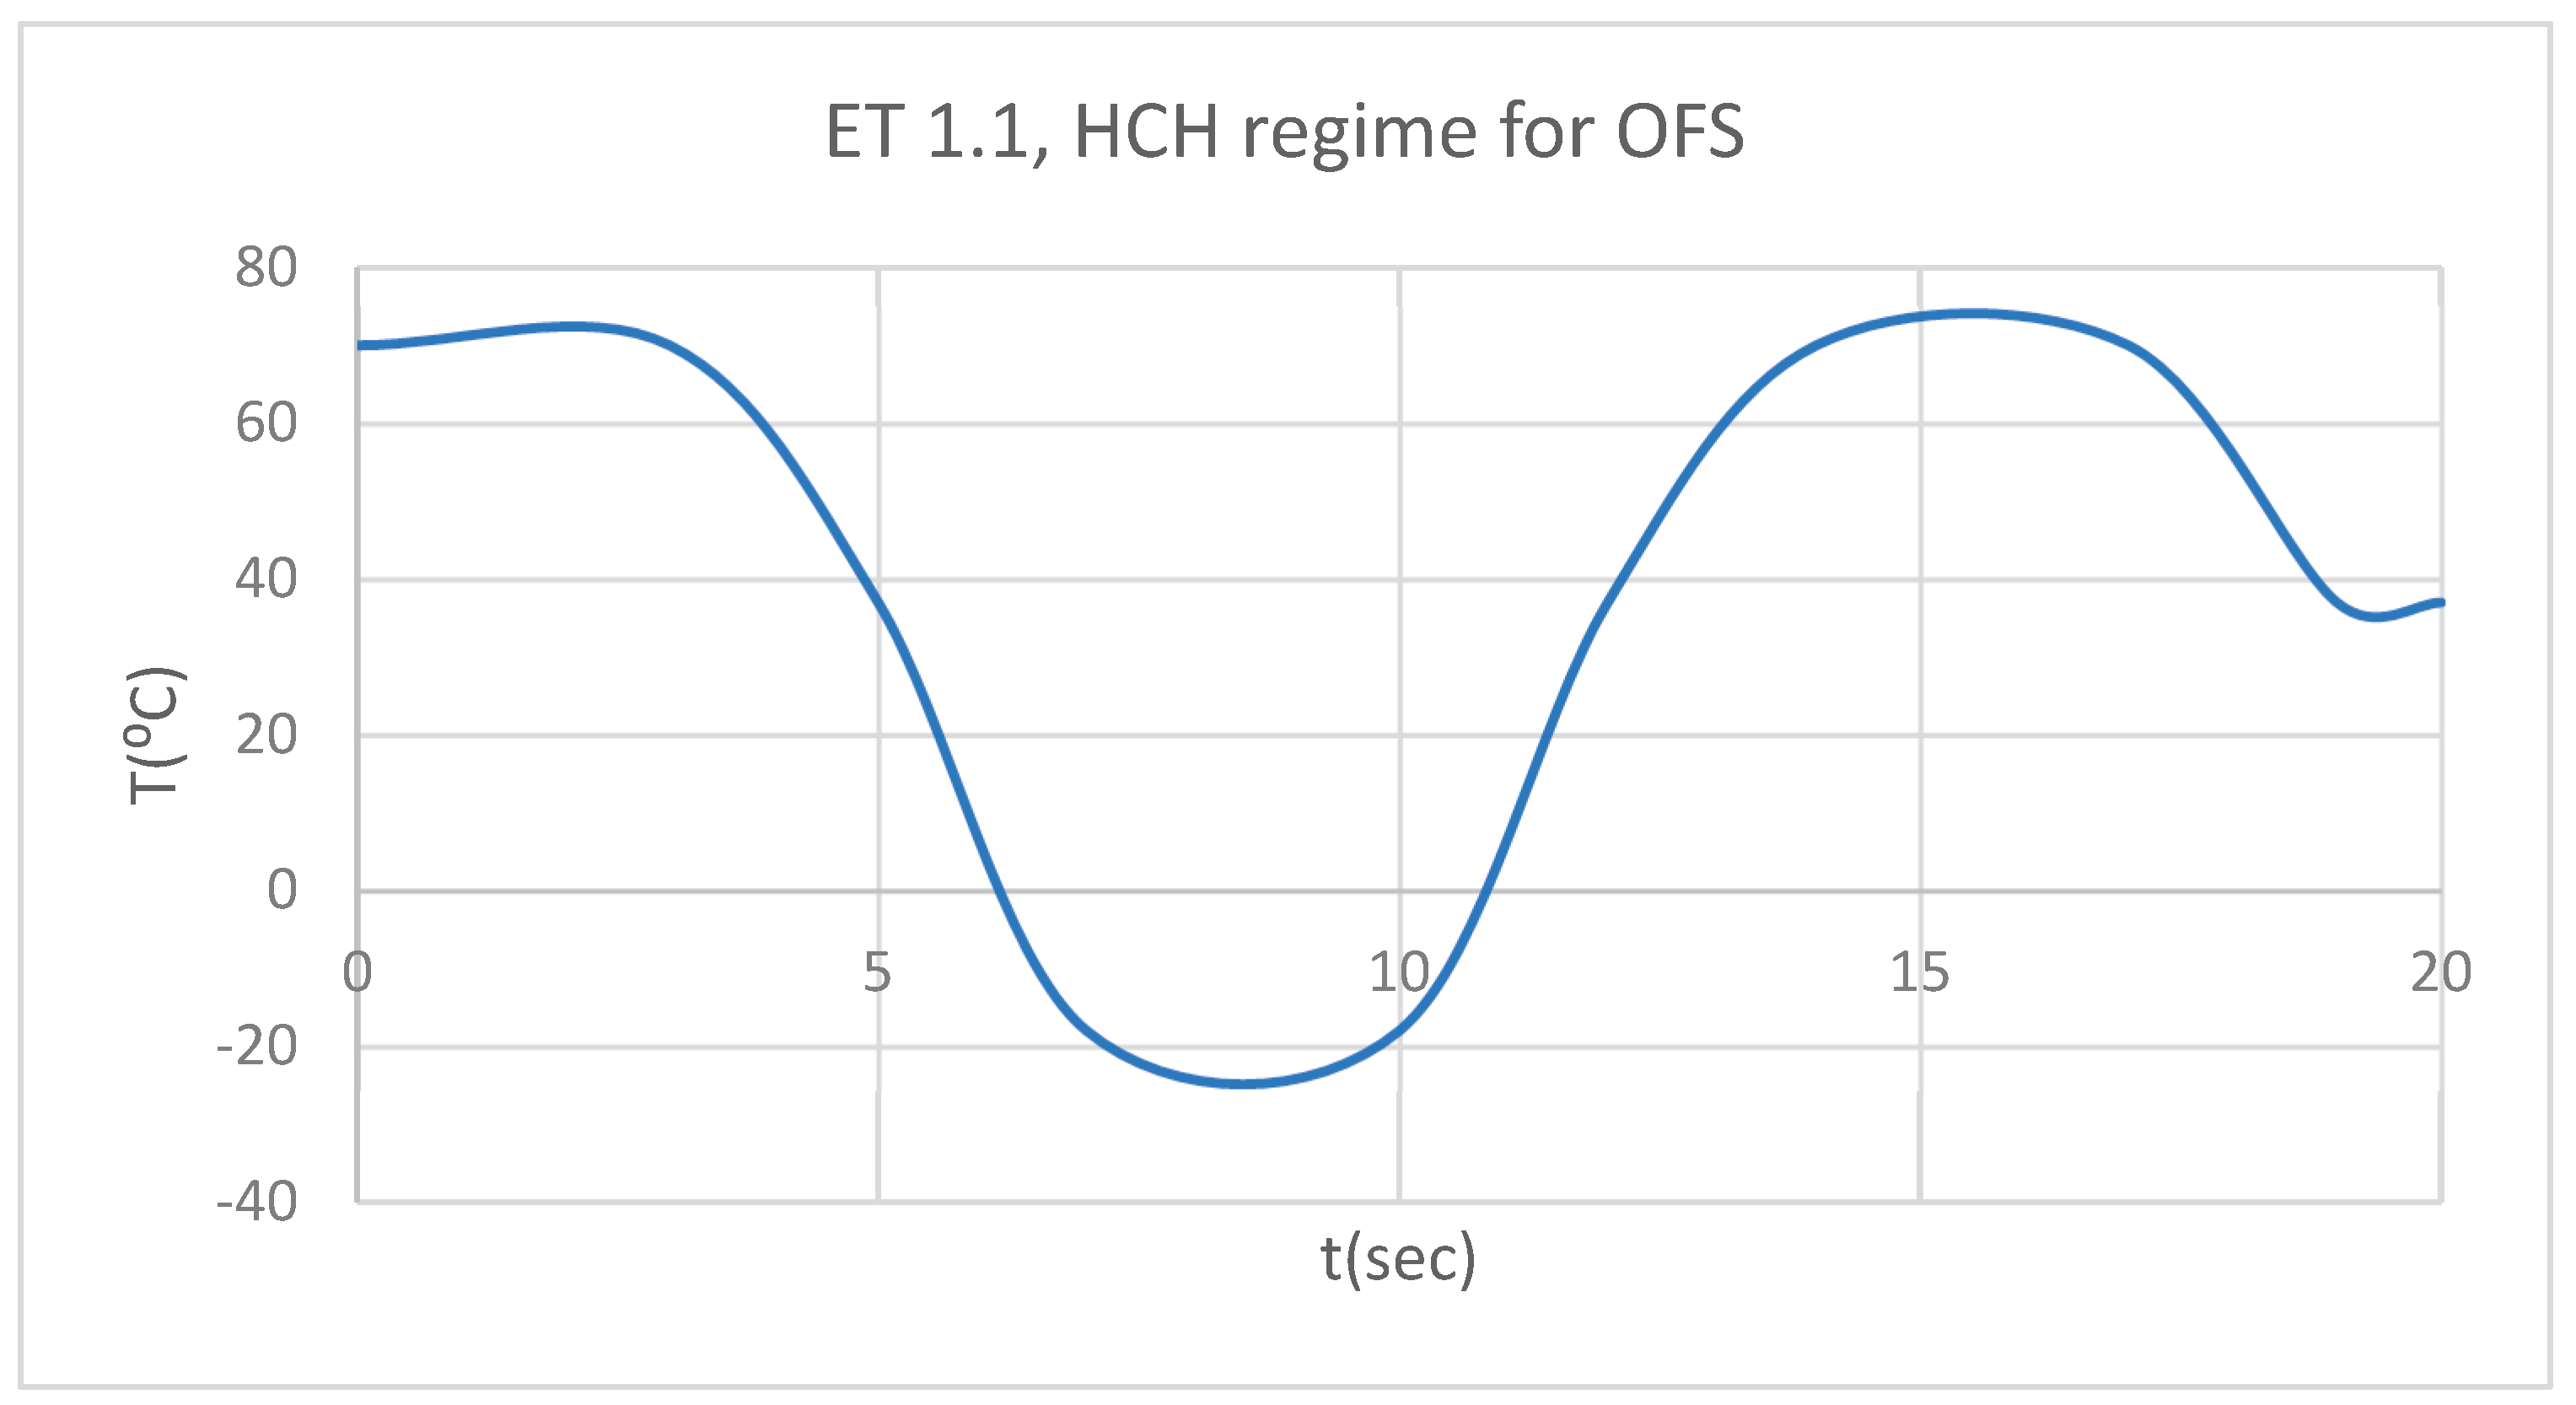
Figure 6.
DT for 1.1 subjected to HCH source.
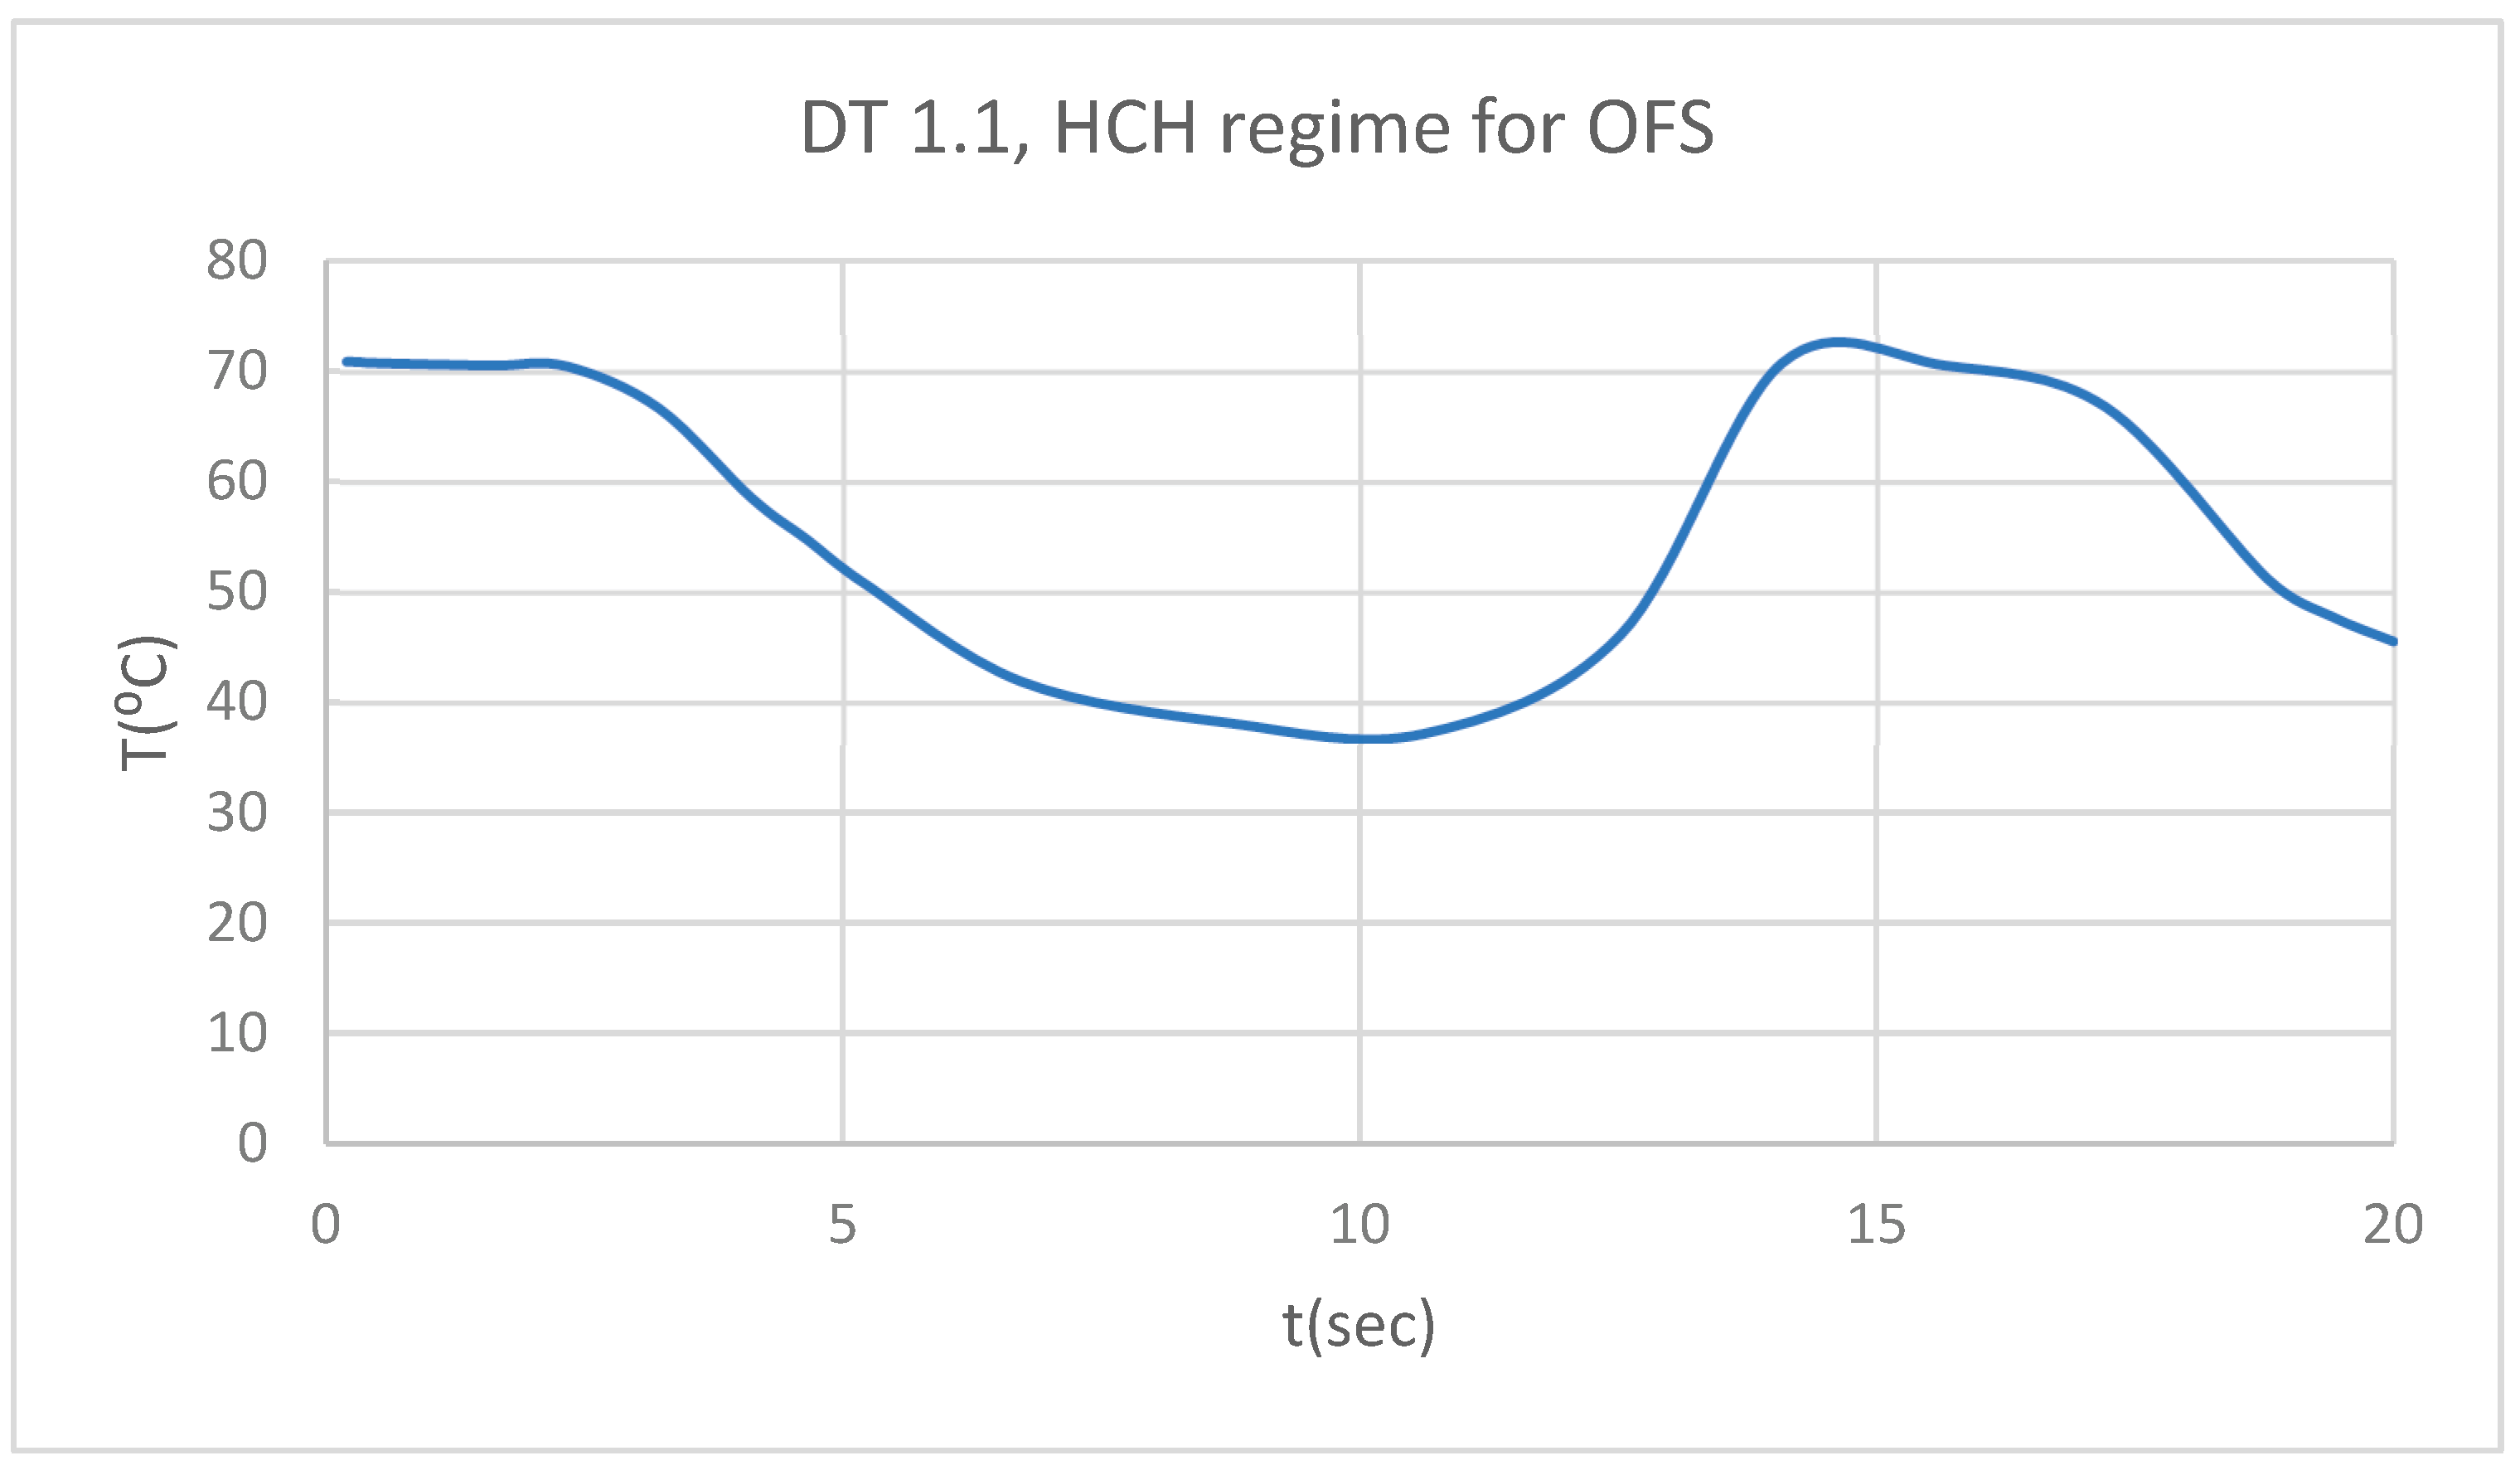
Figure 7.
PT for 1.1 subjected to HCH source.
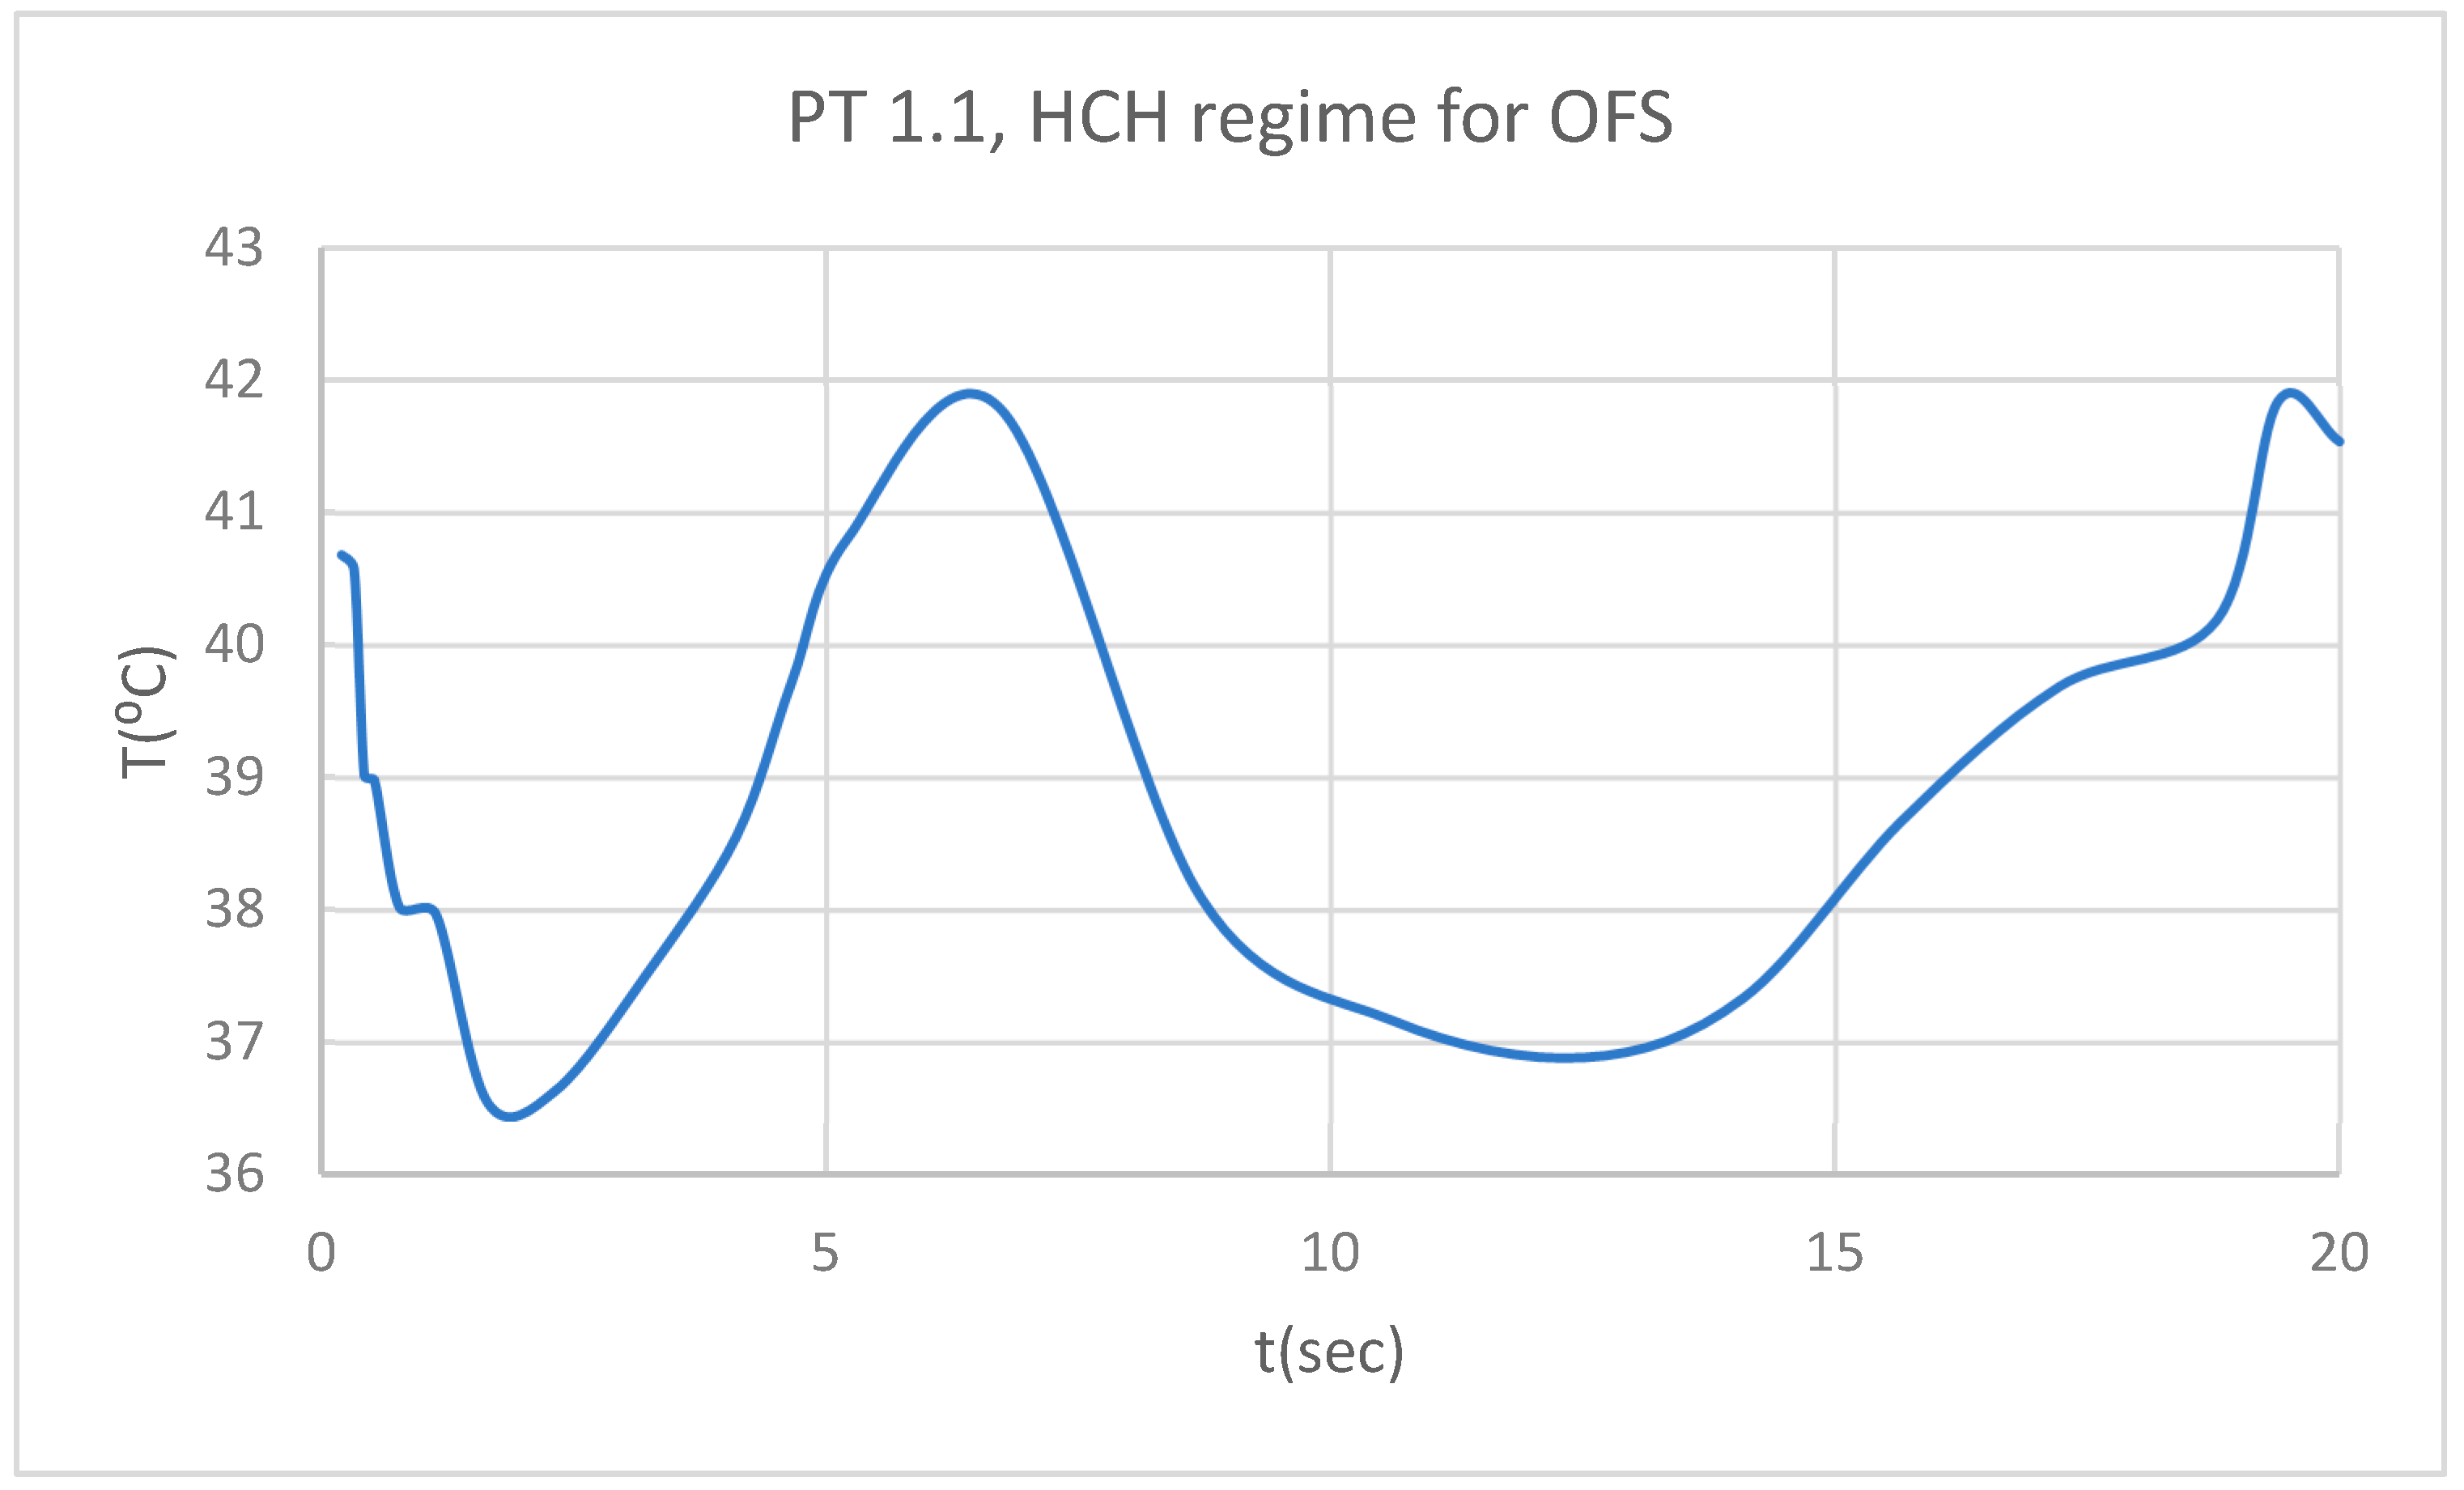
Figure 8.
Comparative diagram of the dental structures temperature for 1.1 subjected to HCH source.
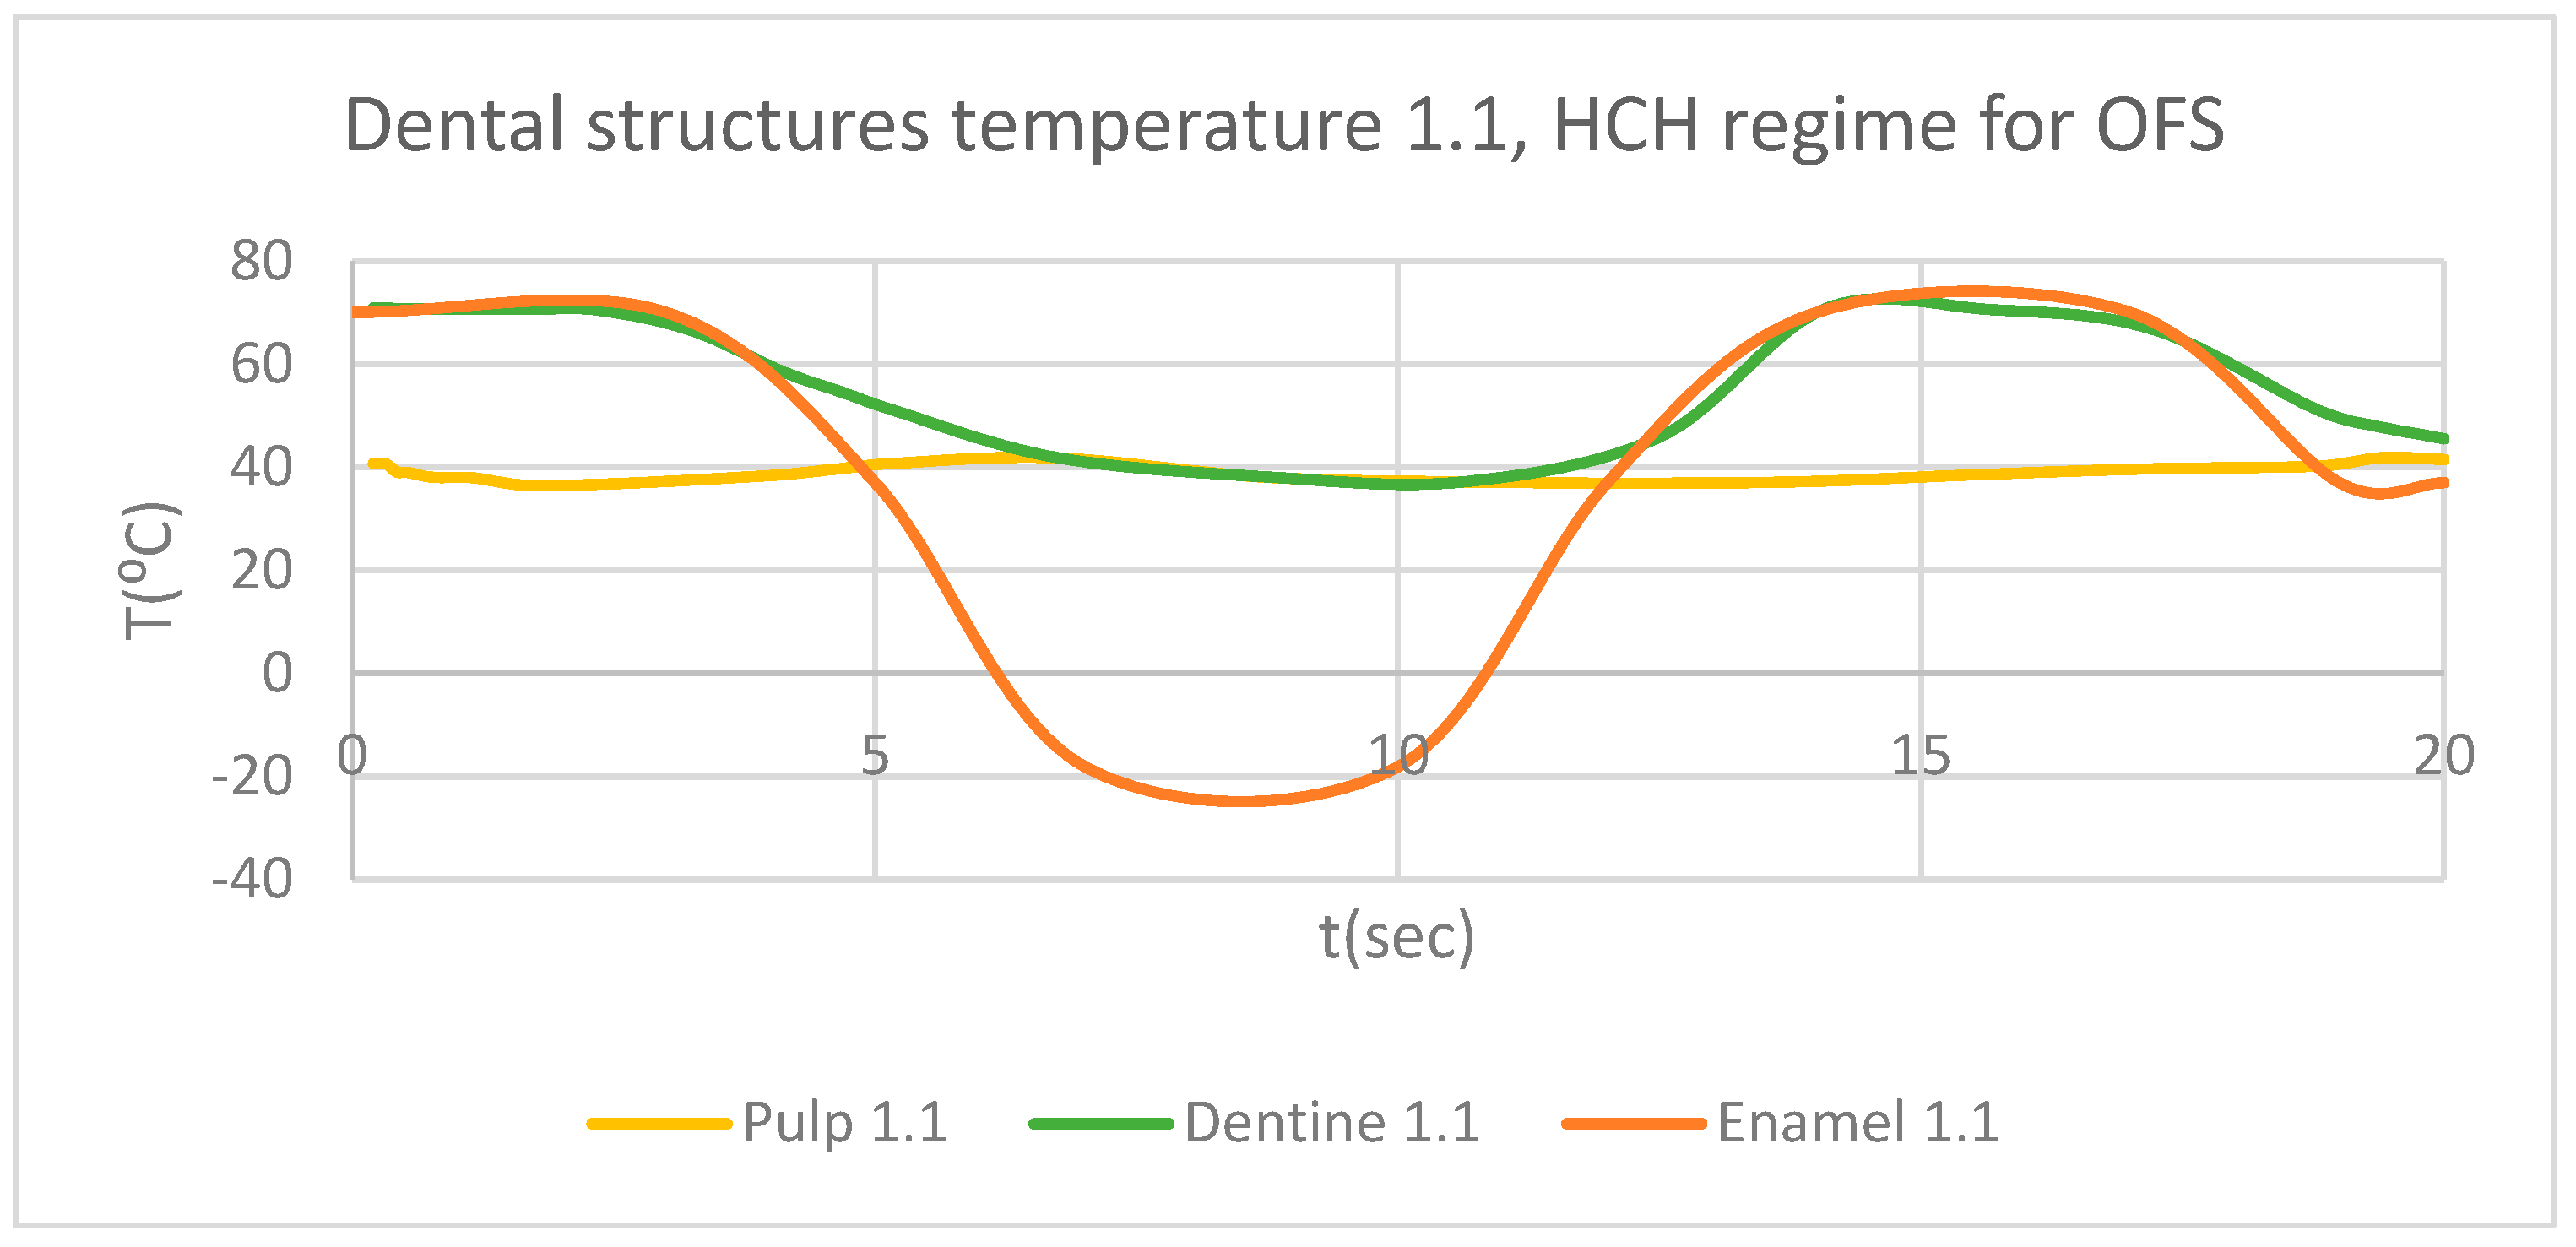
Figure 9.
ET for 4.1 subjected to HCH source.

Figure 10.
DT for 4.1 subjected to HCH source.
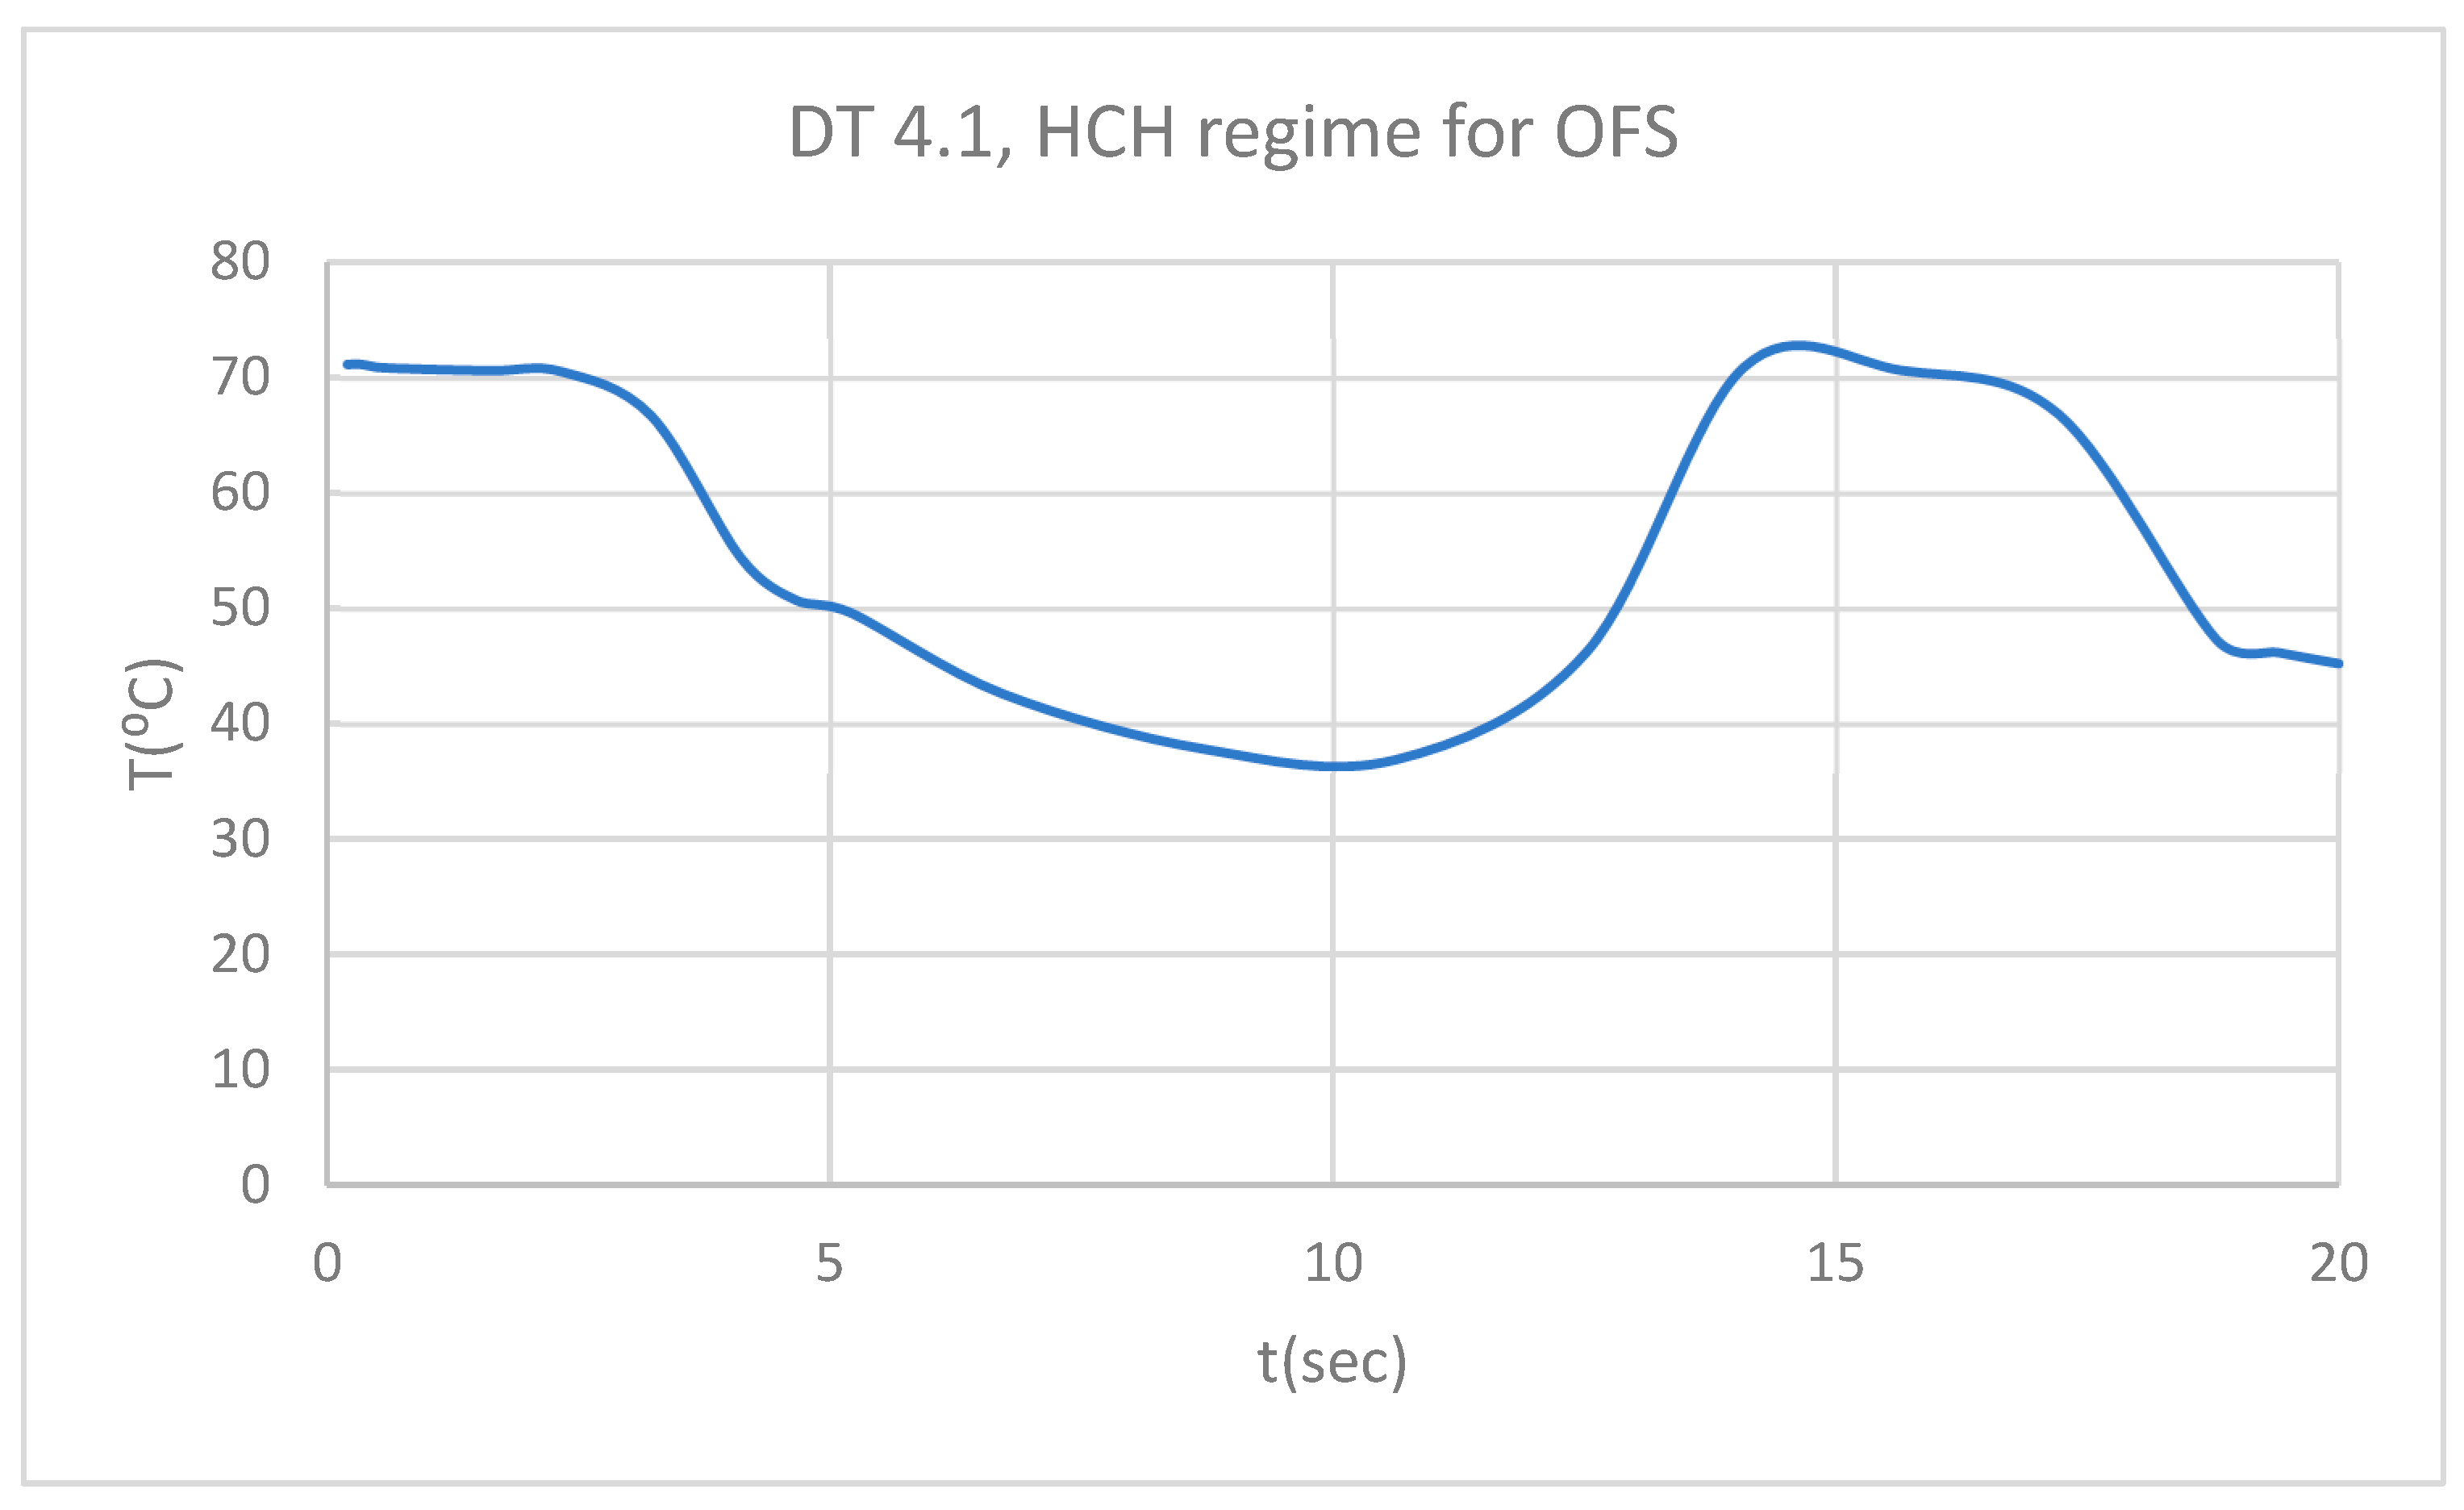
Figure 11.
PT for 4.1 subjected to HCH source.
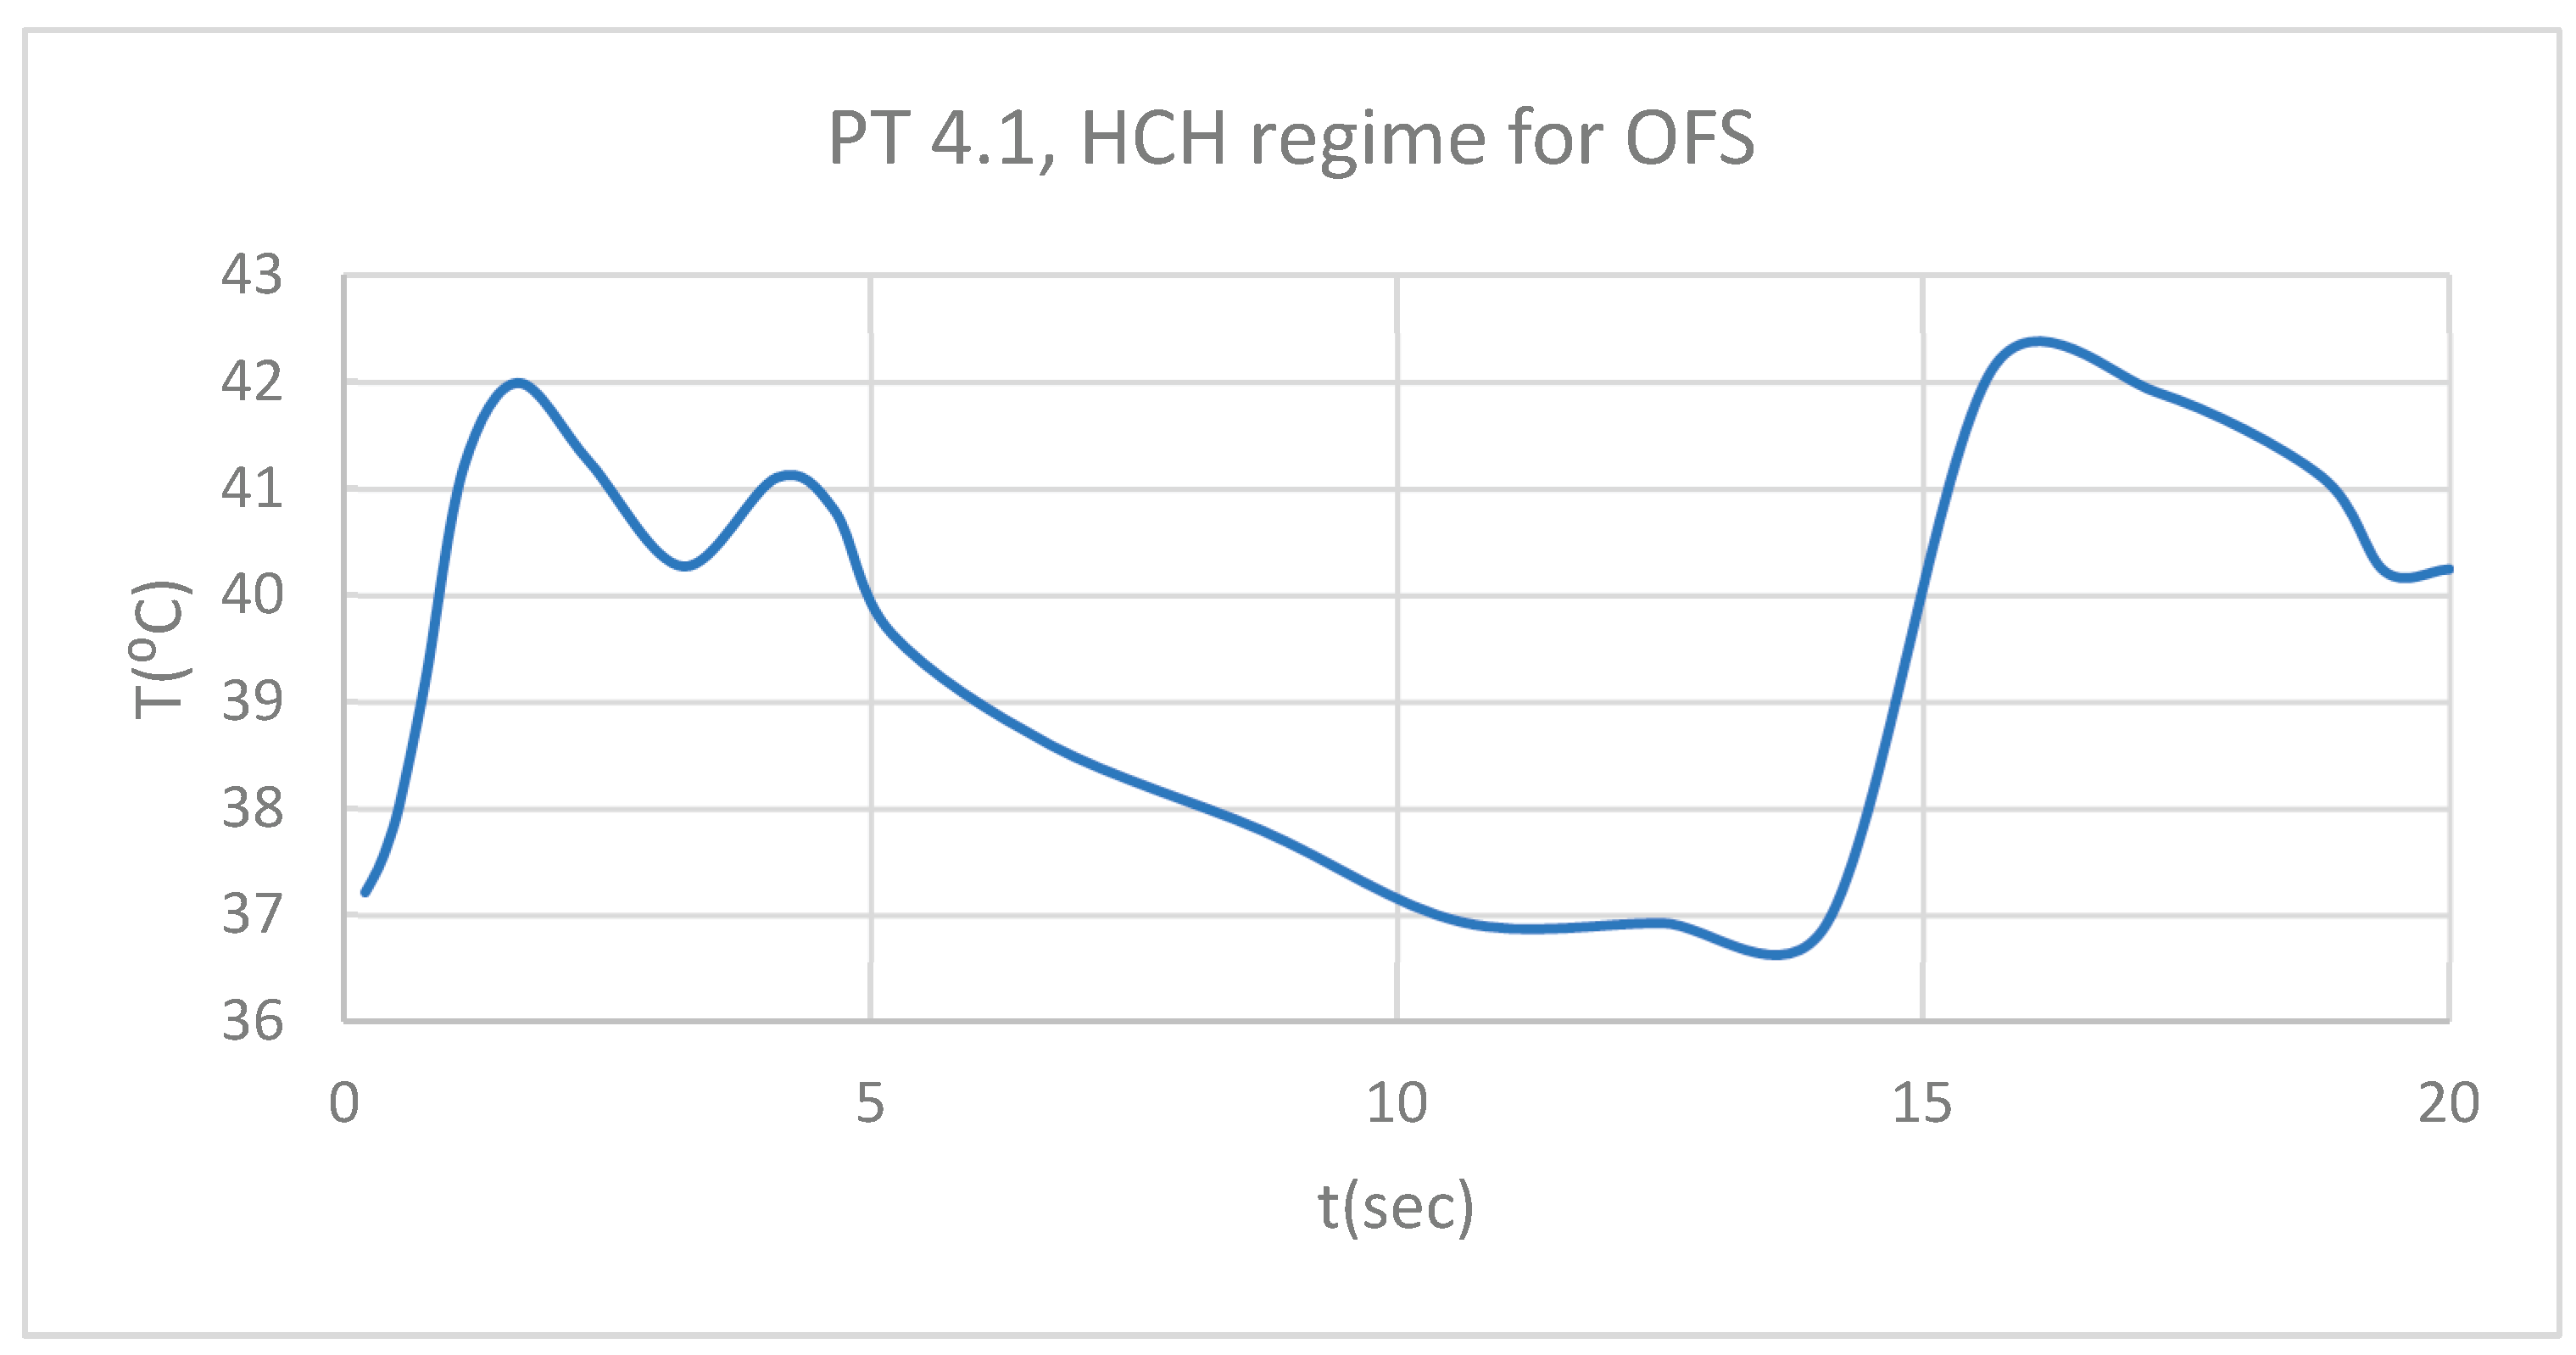
Figure 12.
Comparative diagram of the dental structures temperature for 4.1 subjected to HCH source.
Figure 12.
Comparative diagram of the dental structures temperature for 4.1 subjected to HCH source.
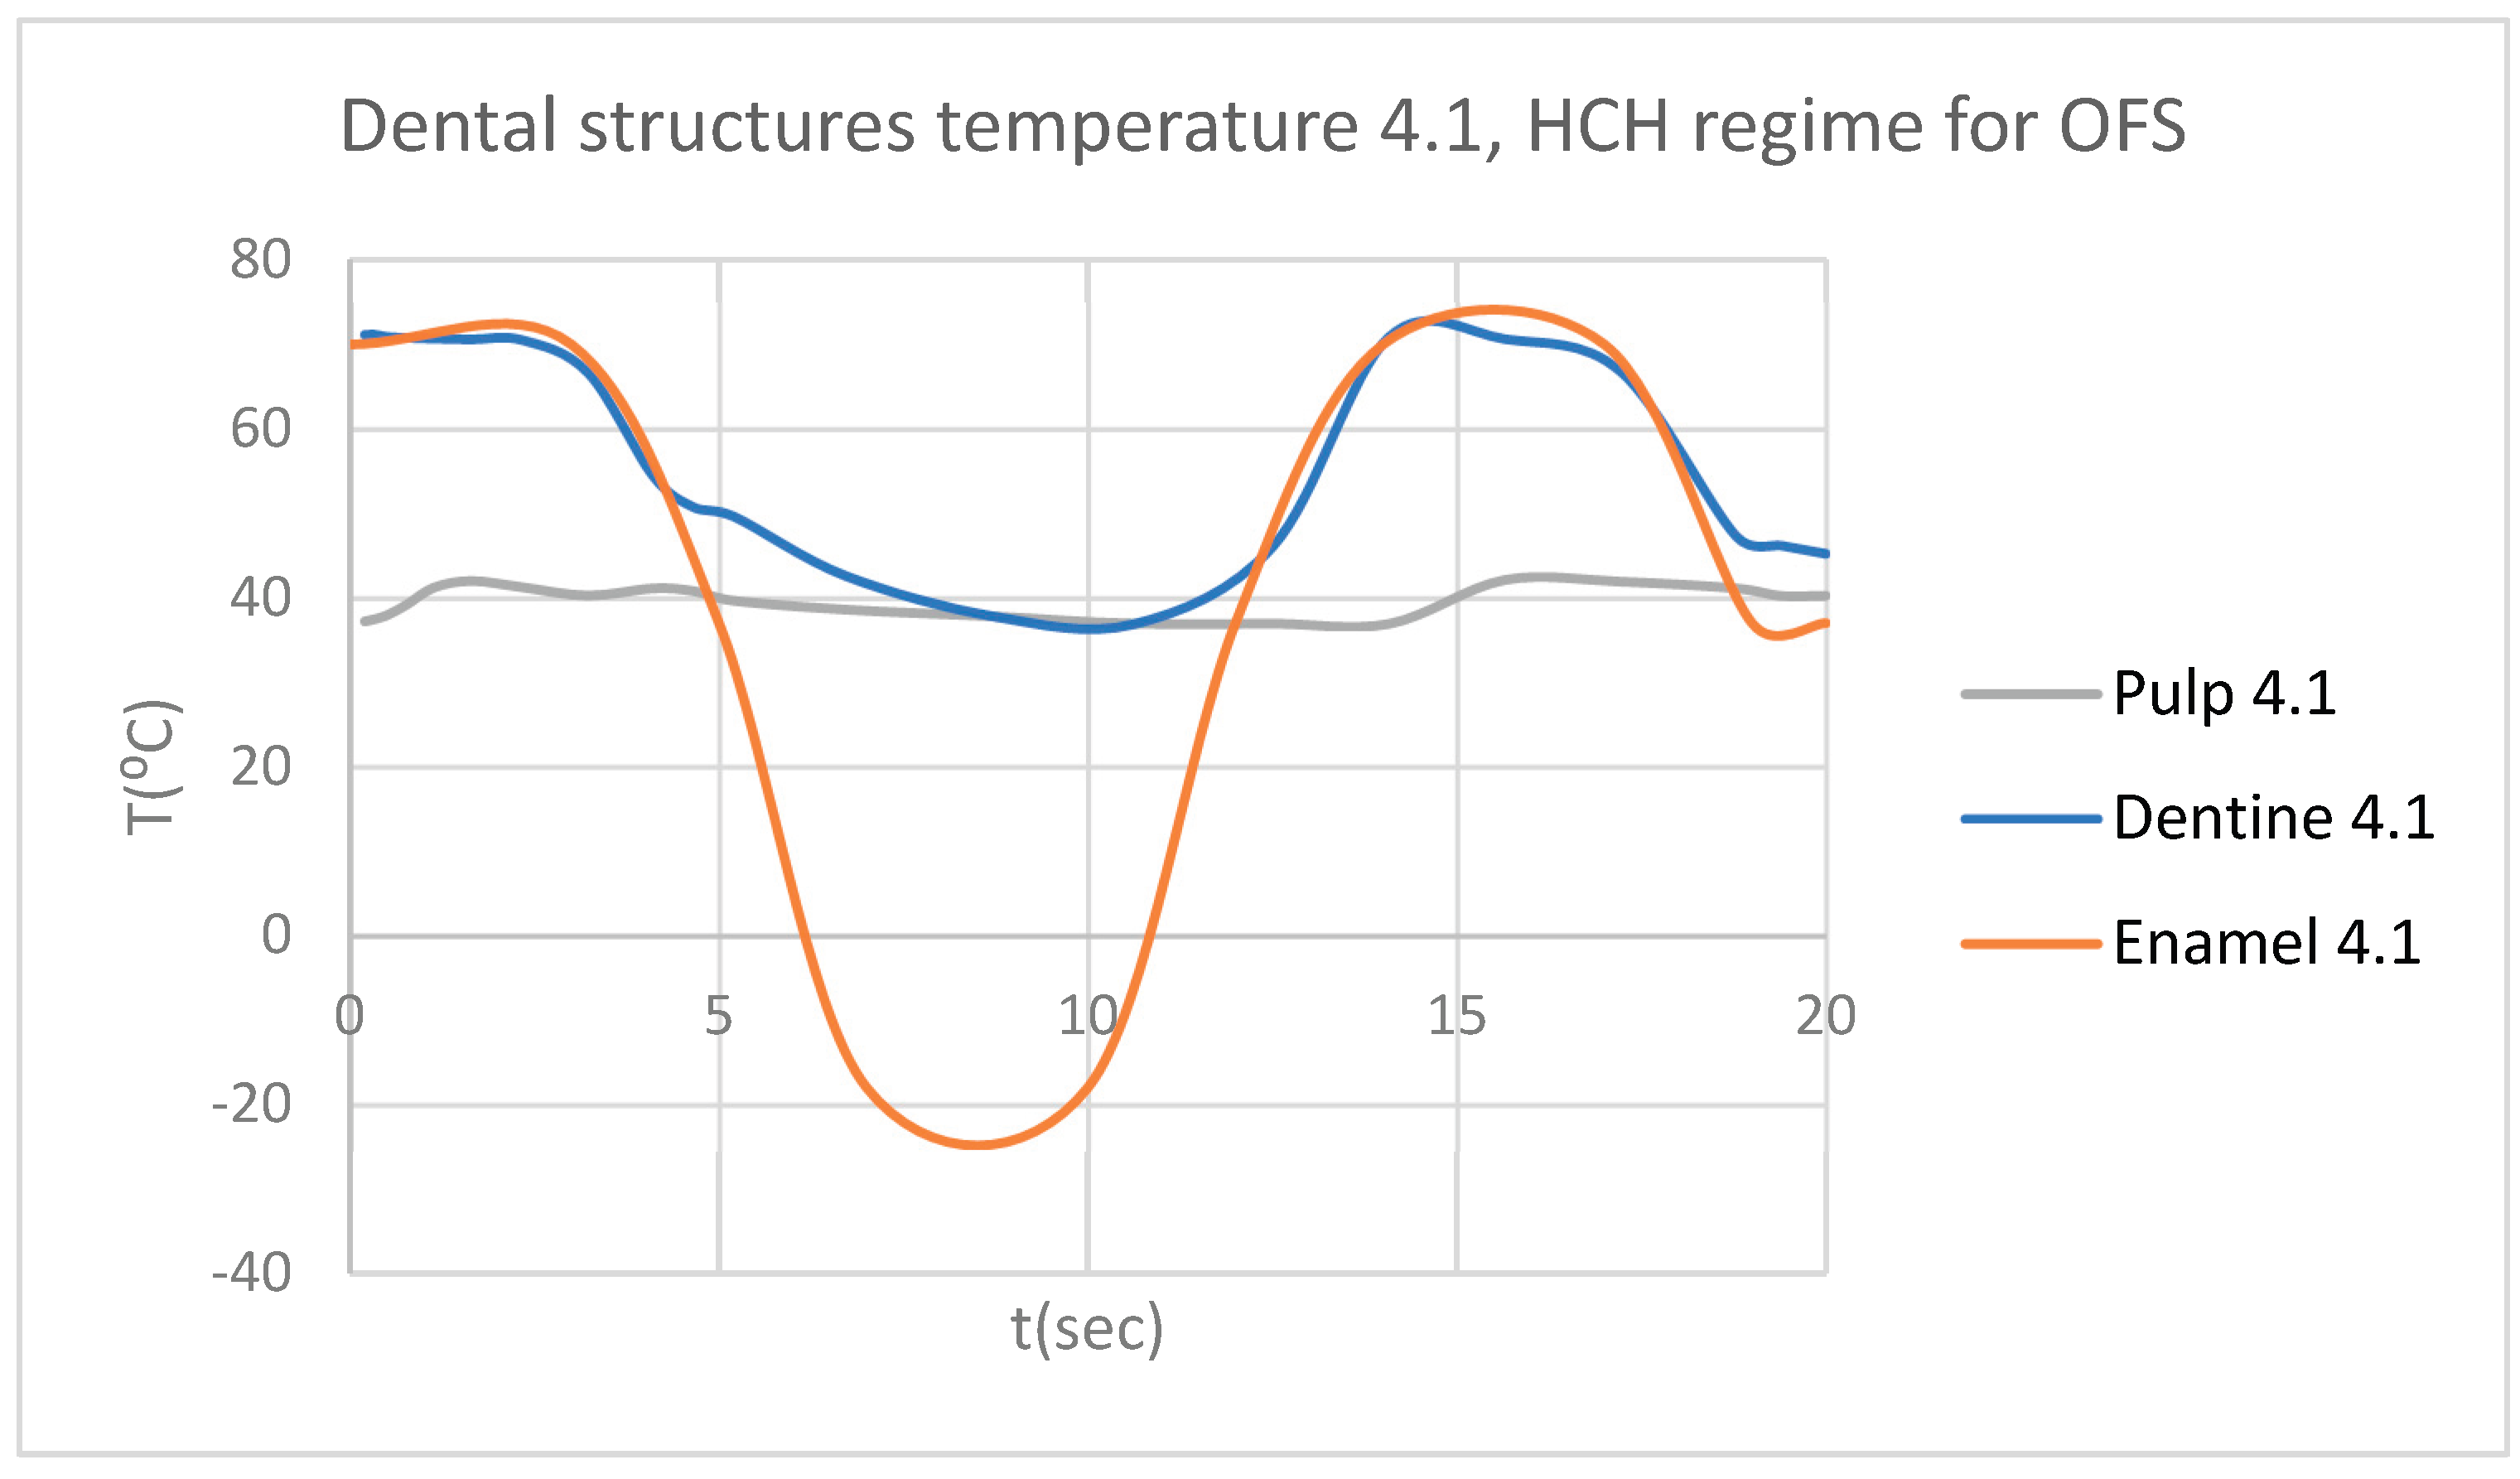
Figure 13.
Comparative diagram of the dental structures temperature for 1.1 and 4.1 subjected to HCH source.
Figure 13.
Comparative diagram of the dental structures temperature for 1.1 and 4.1 subjected to HCH source.
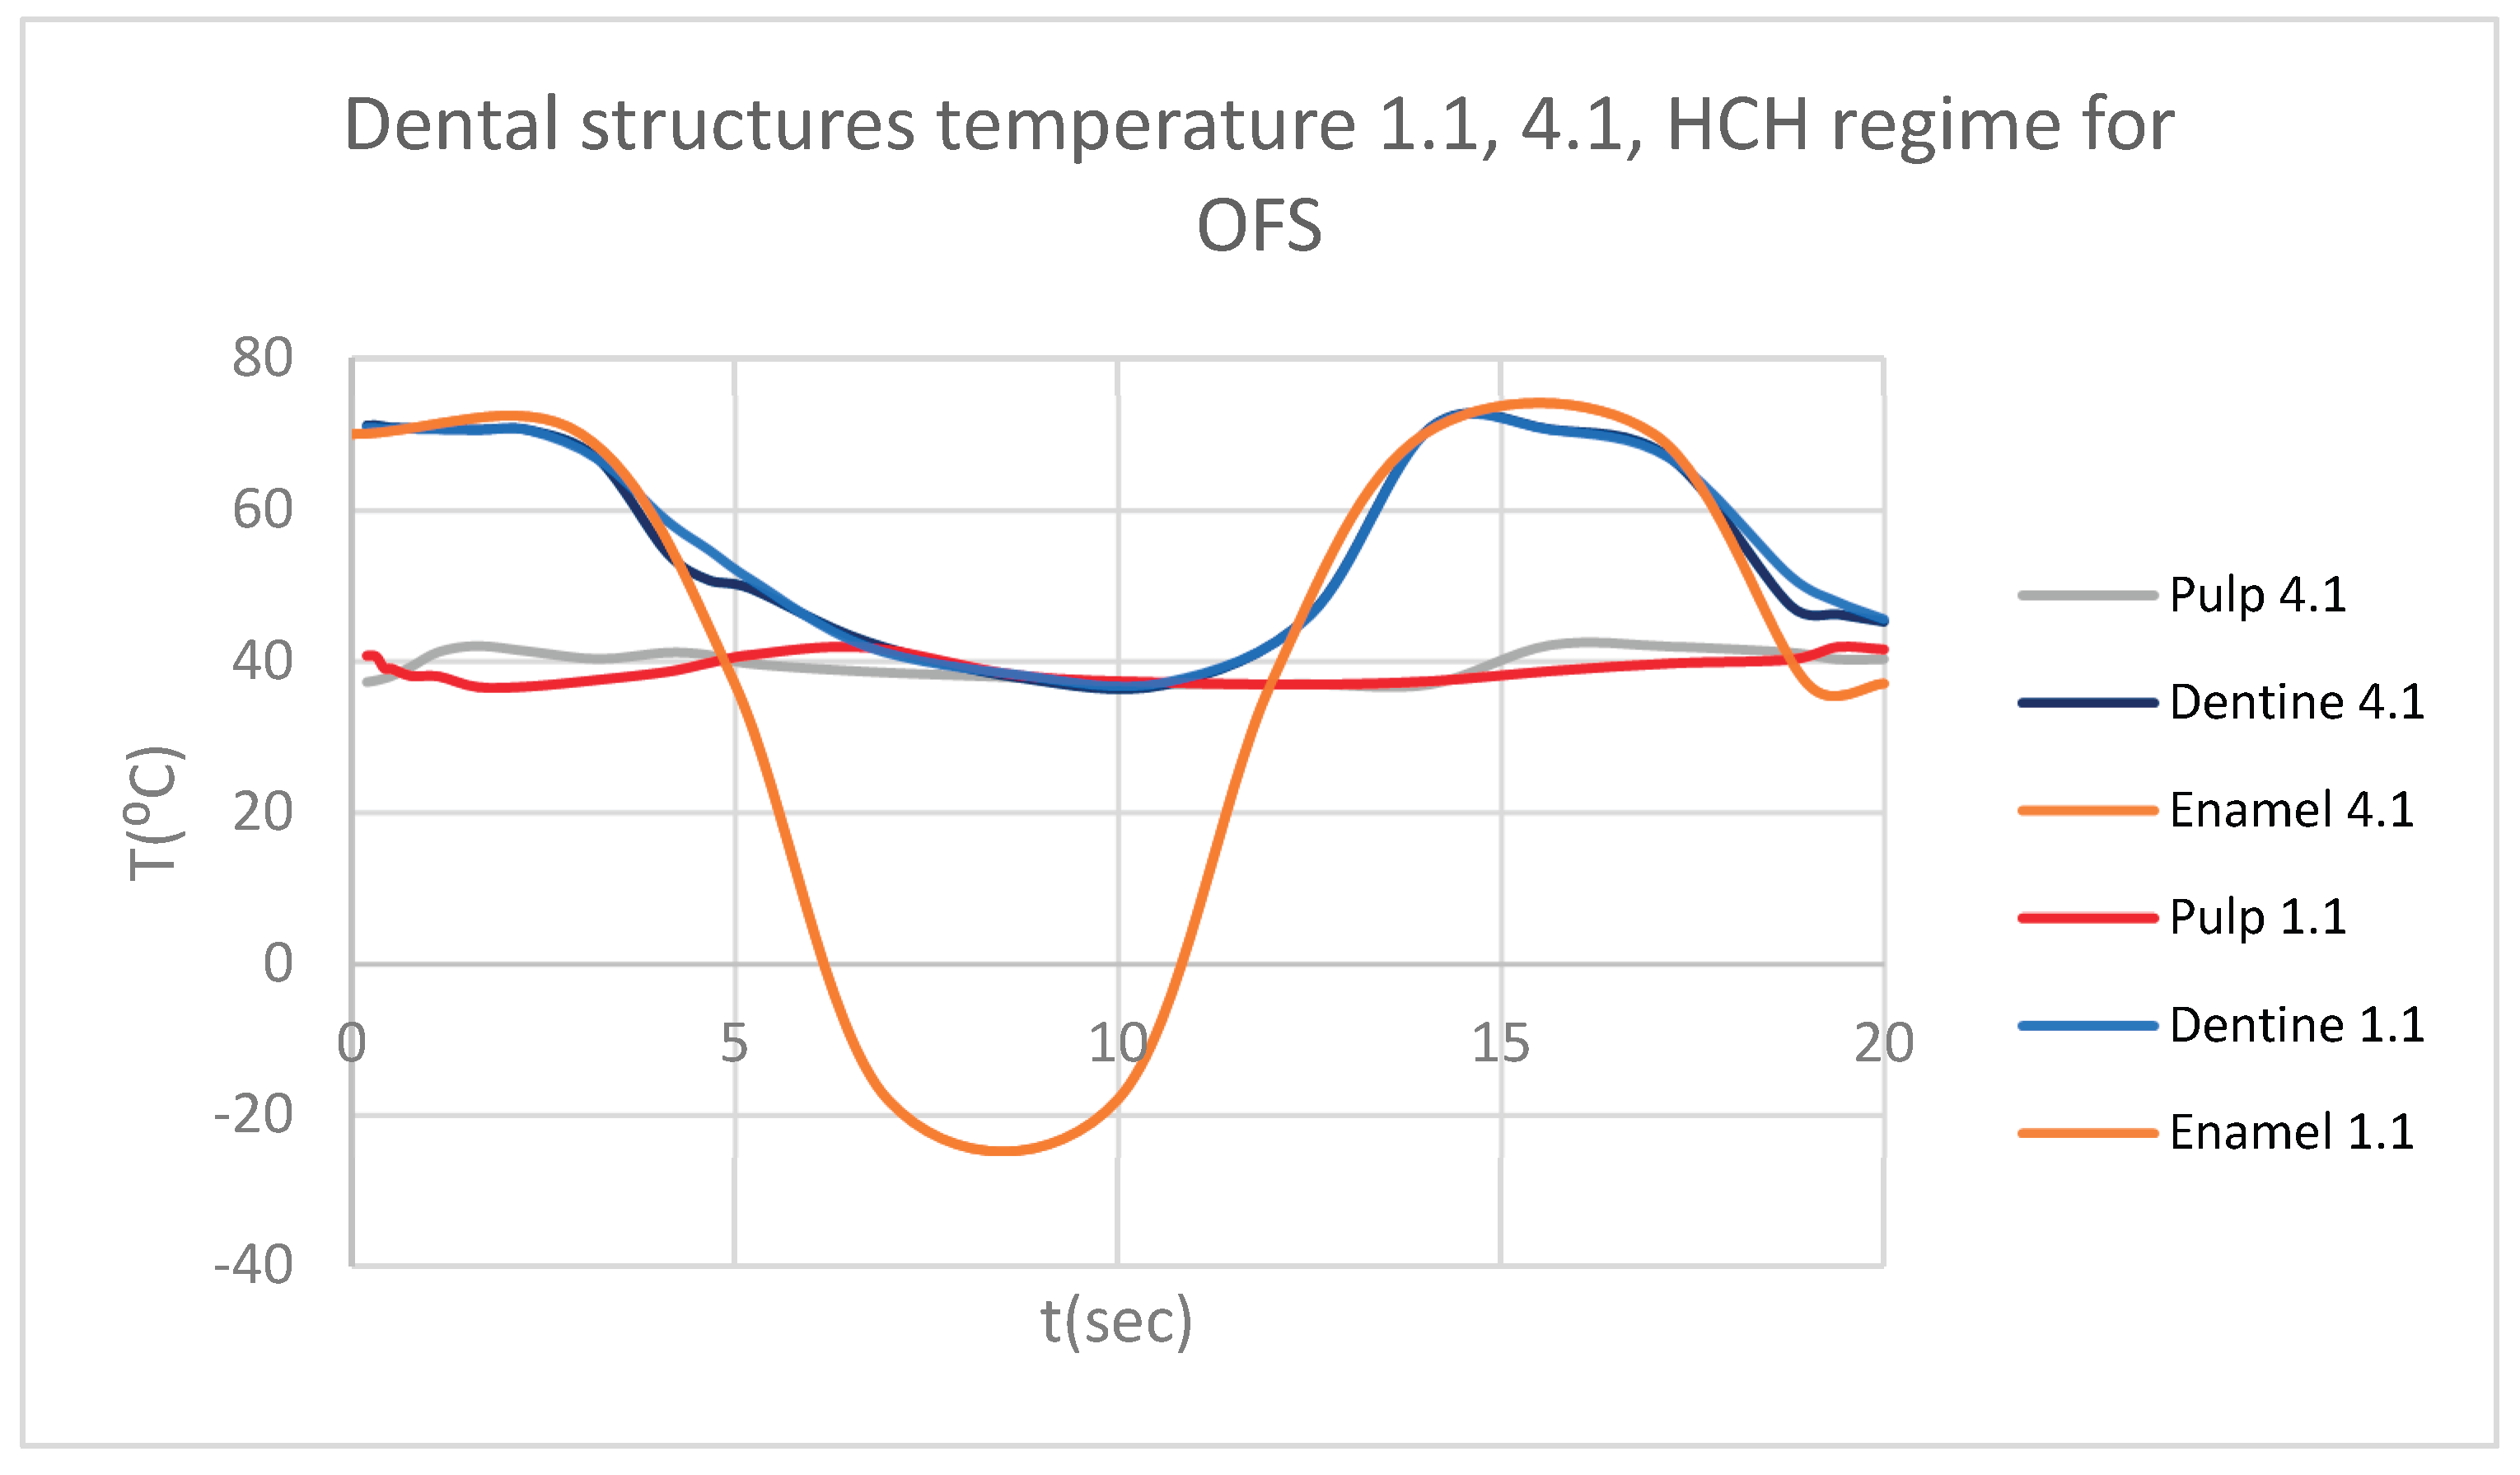
Figure 14.
Thermal map.
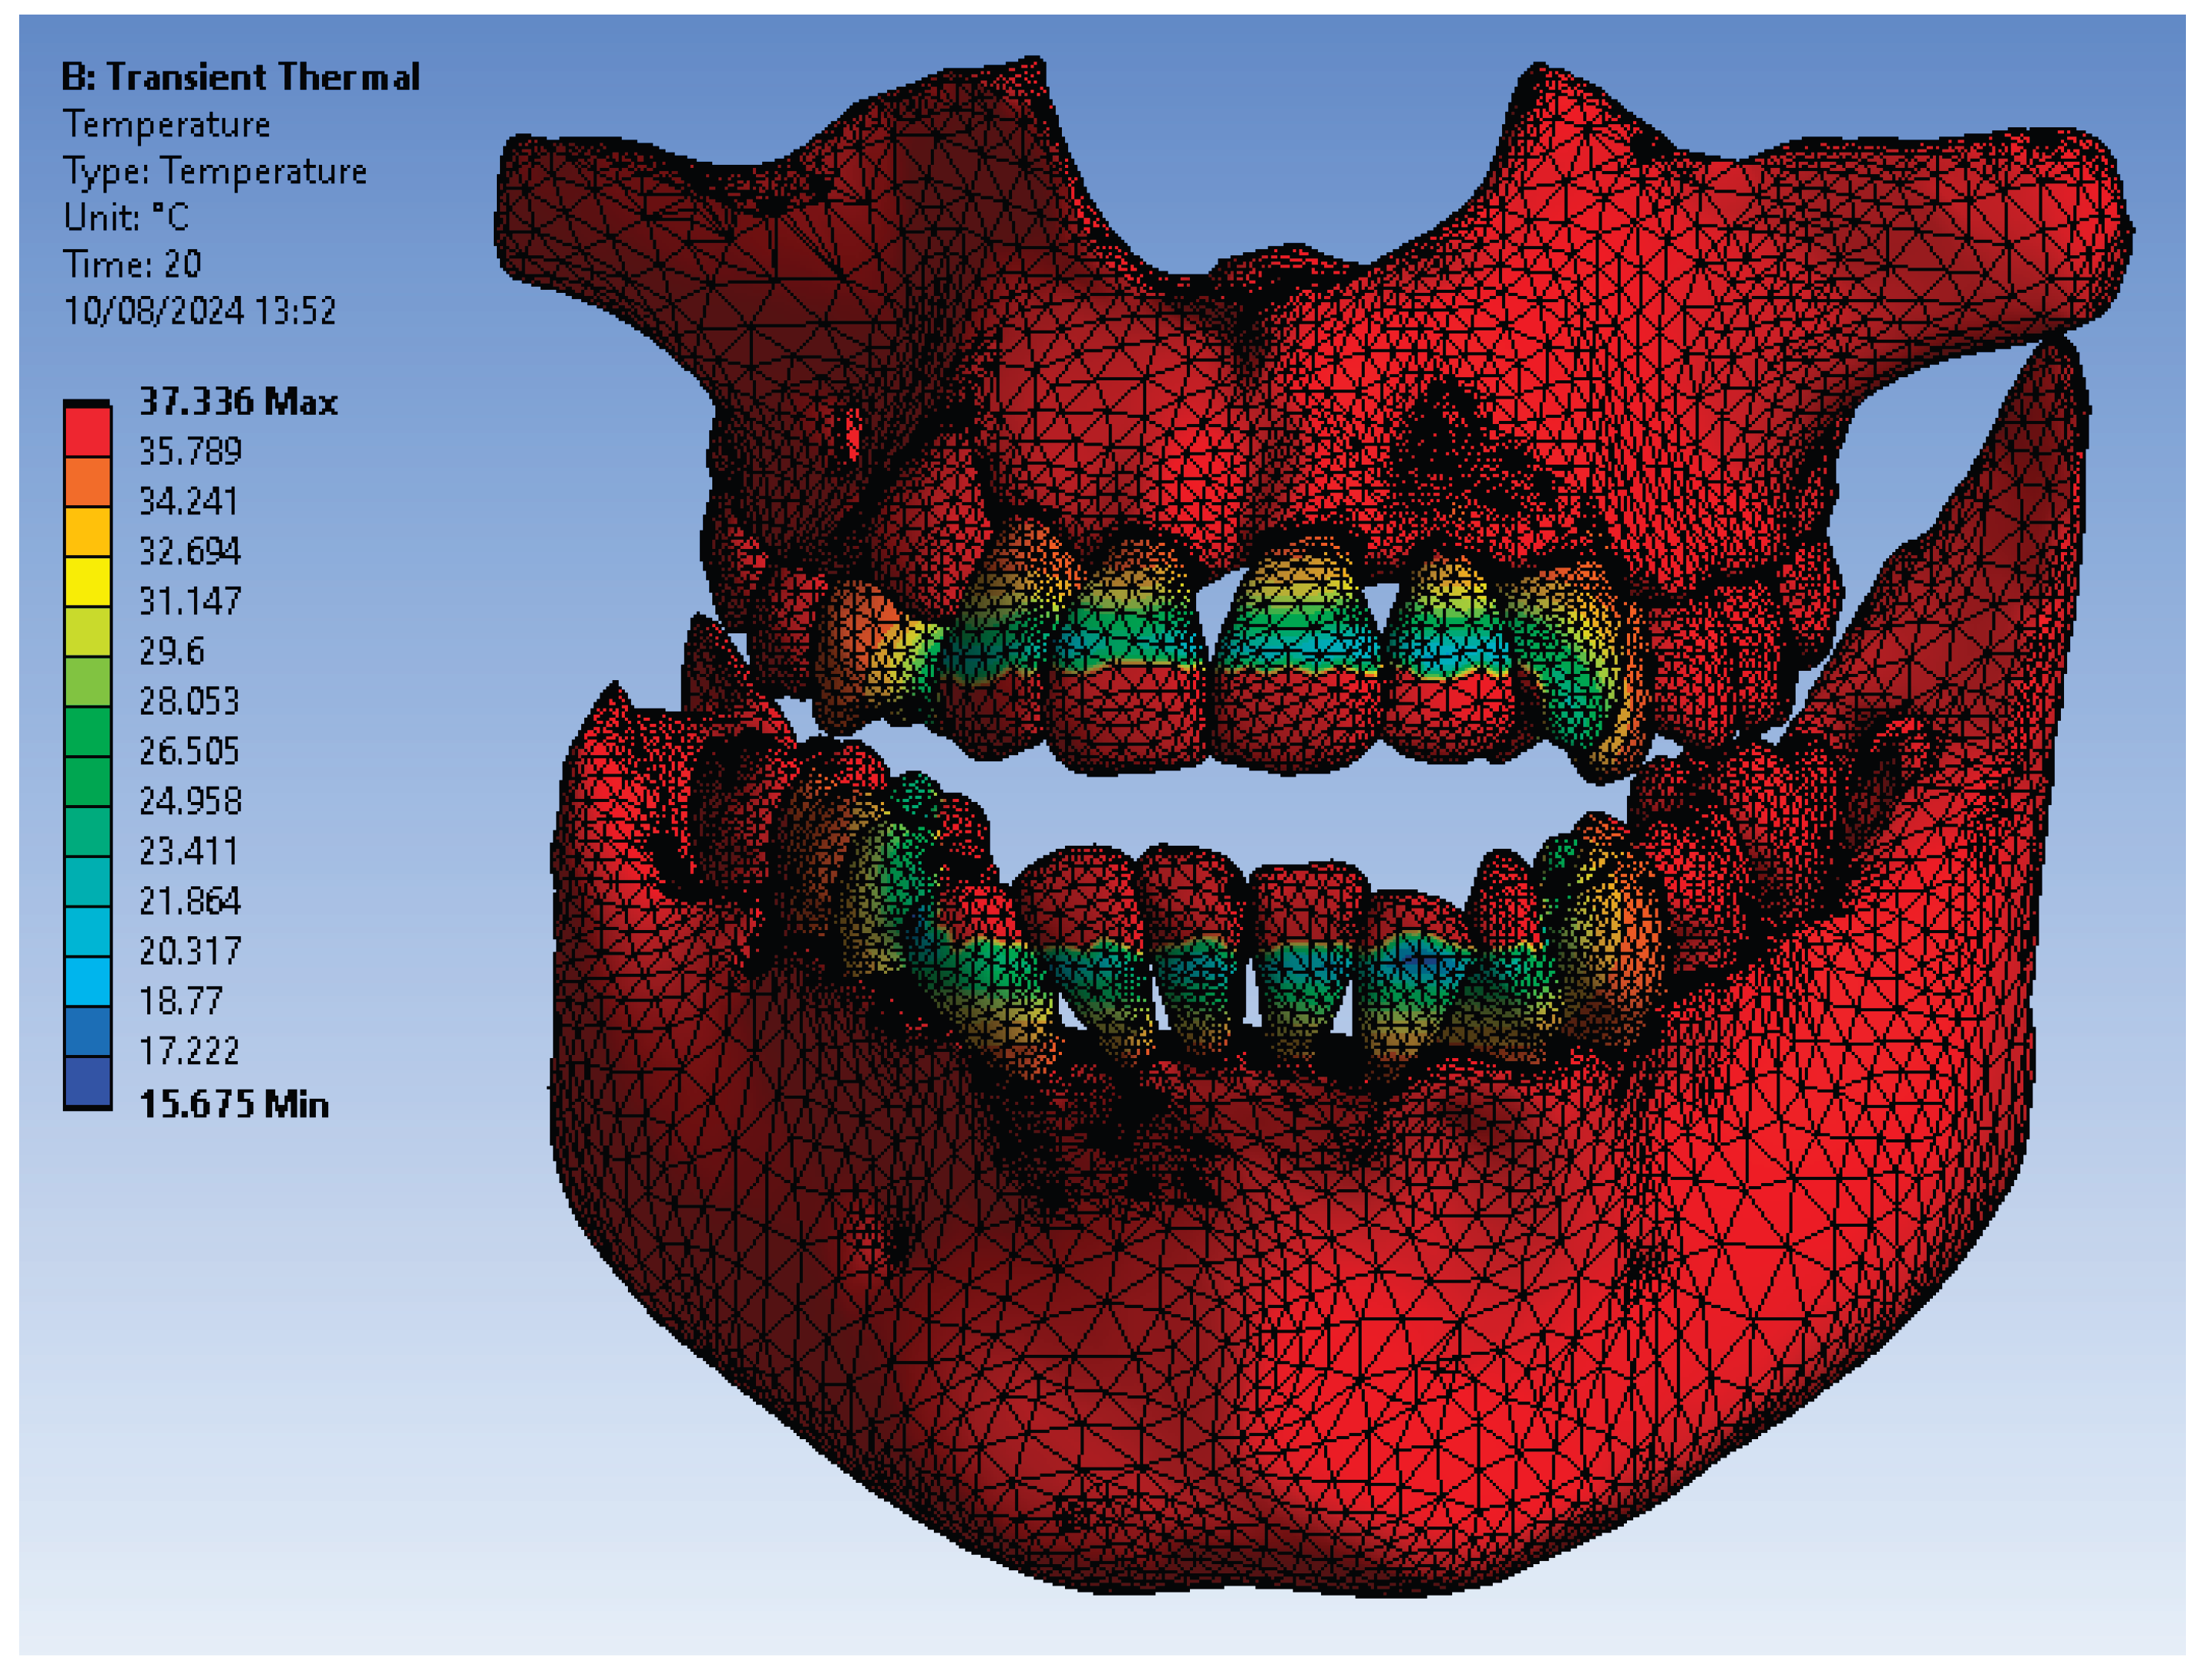
Figure 15.
ET for 1.1 subjected to CHC source.
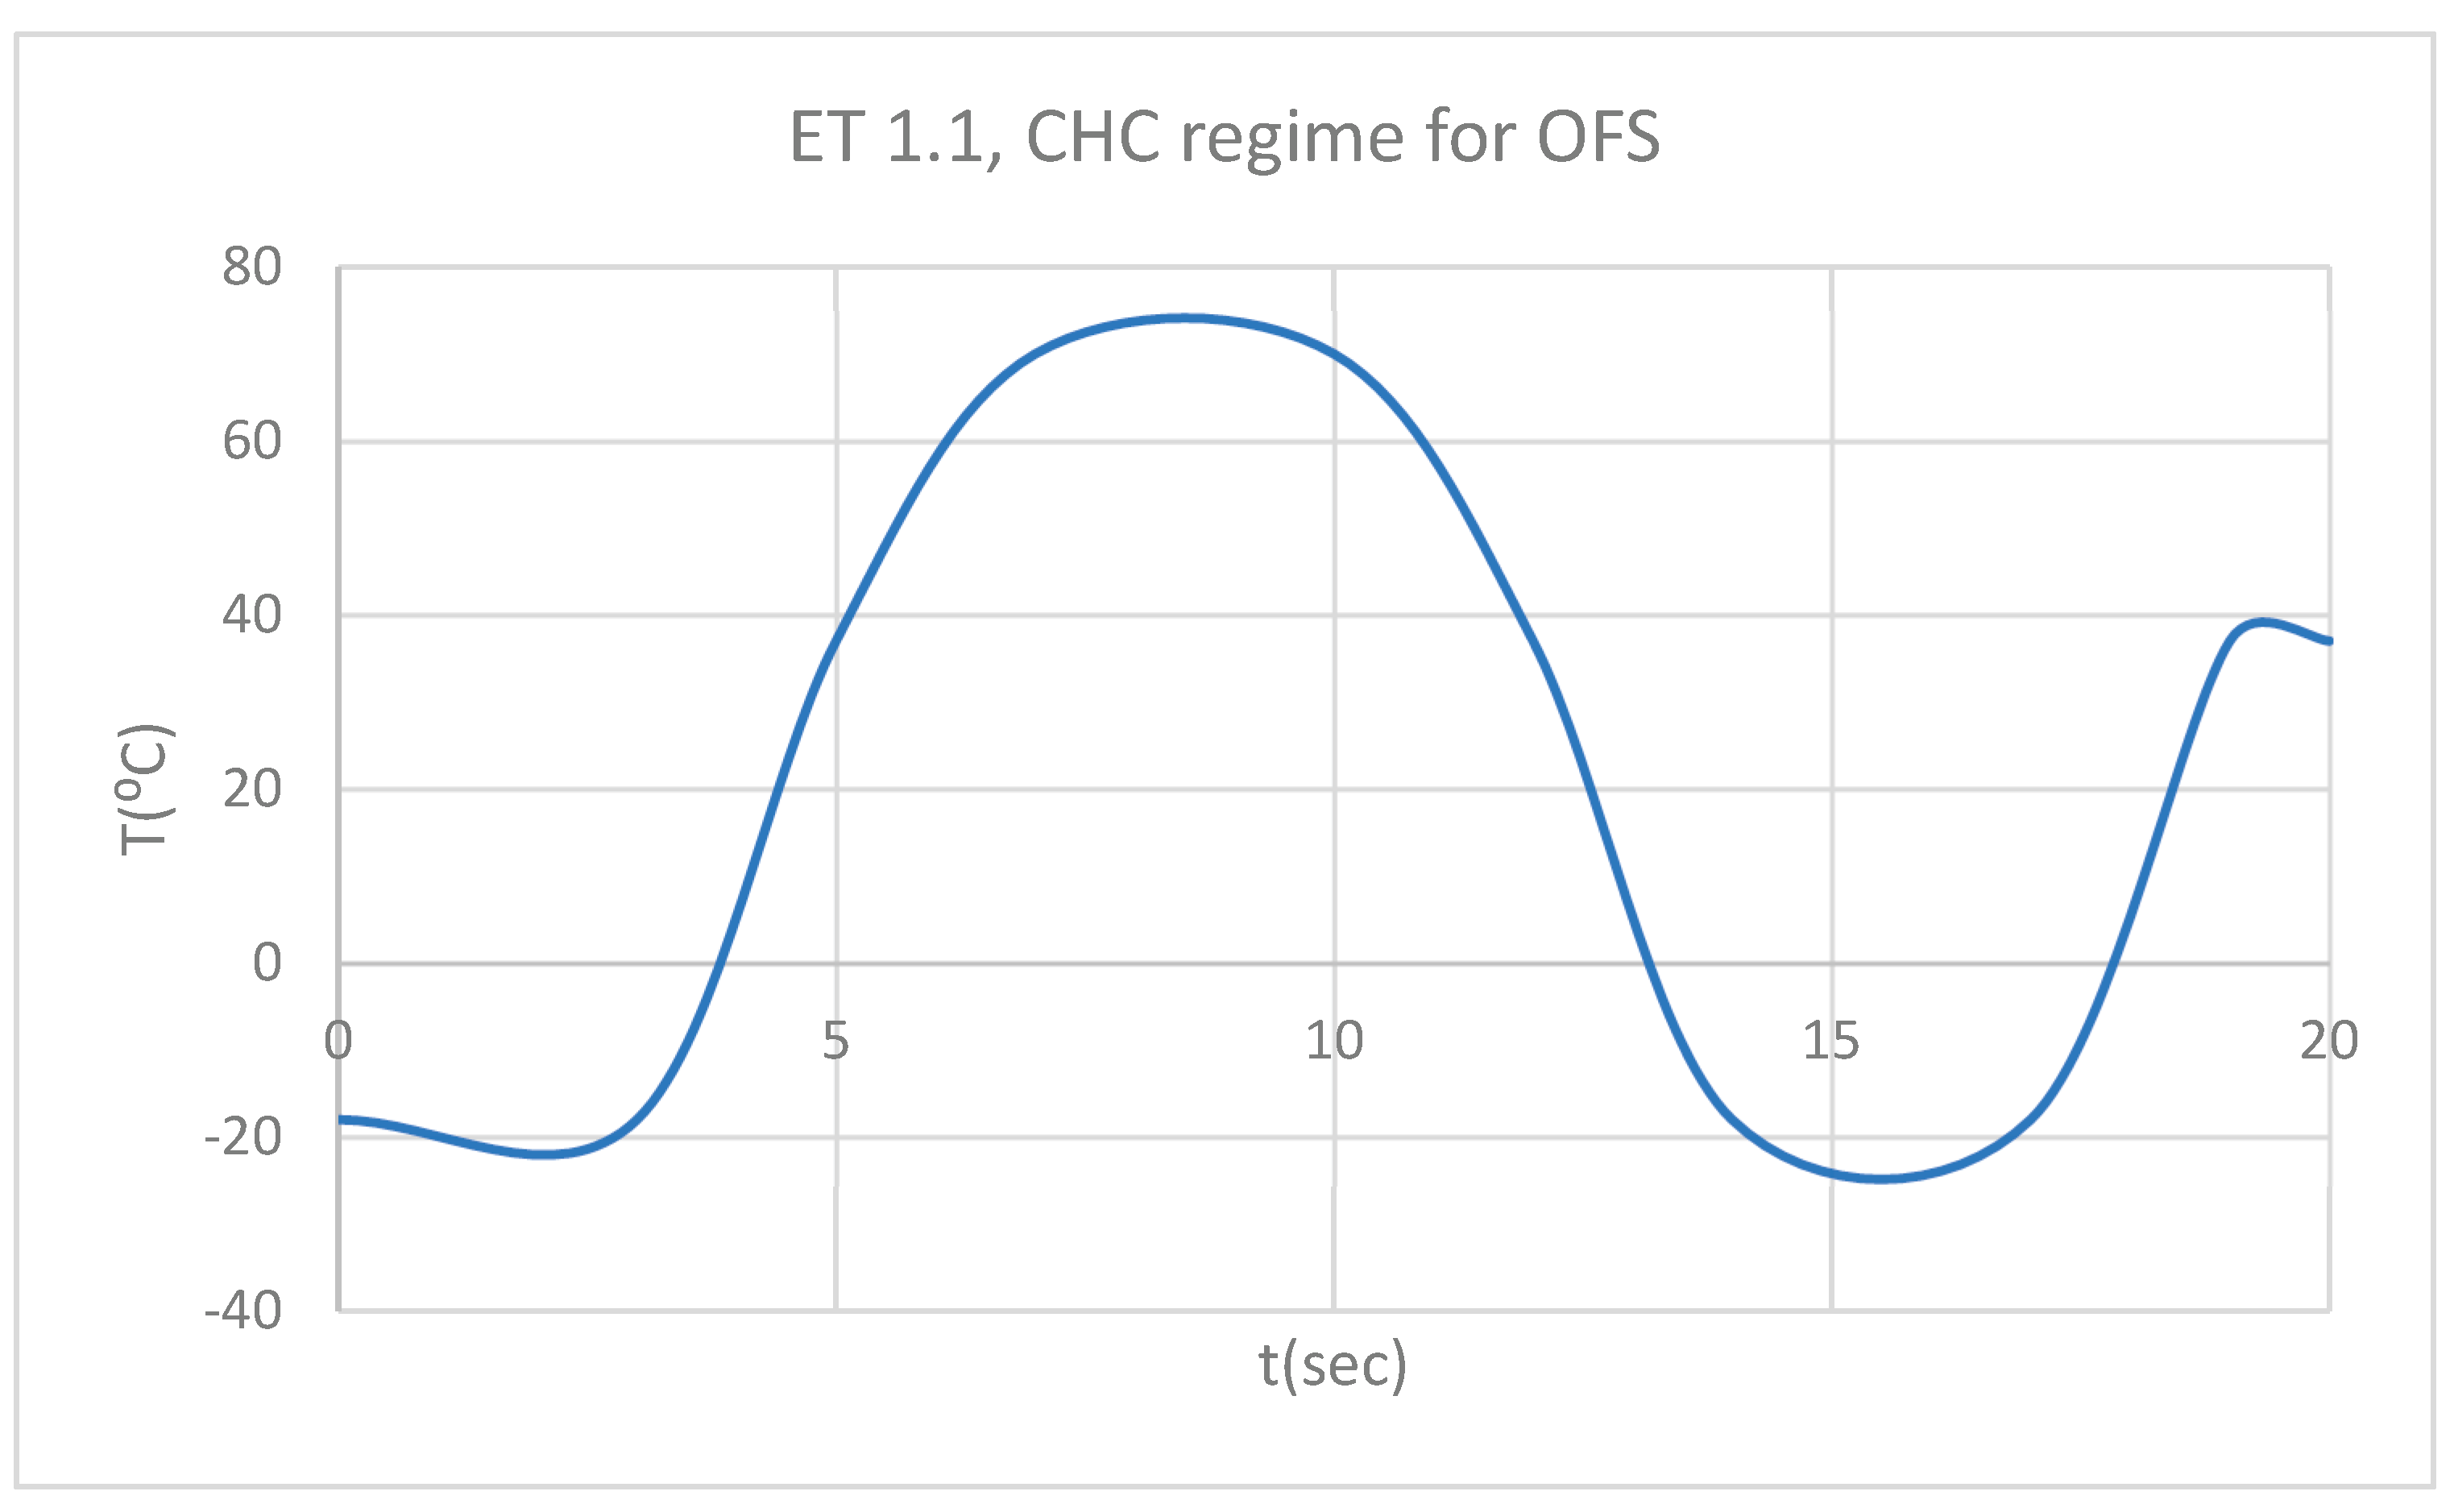
Figure 16.
DT for 1.1 subjected to CHC source.
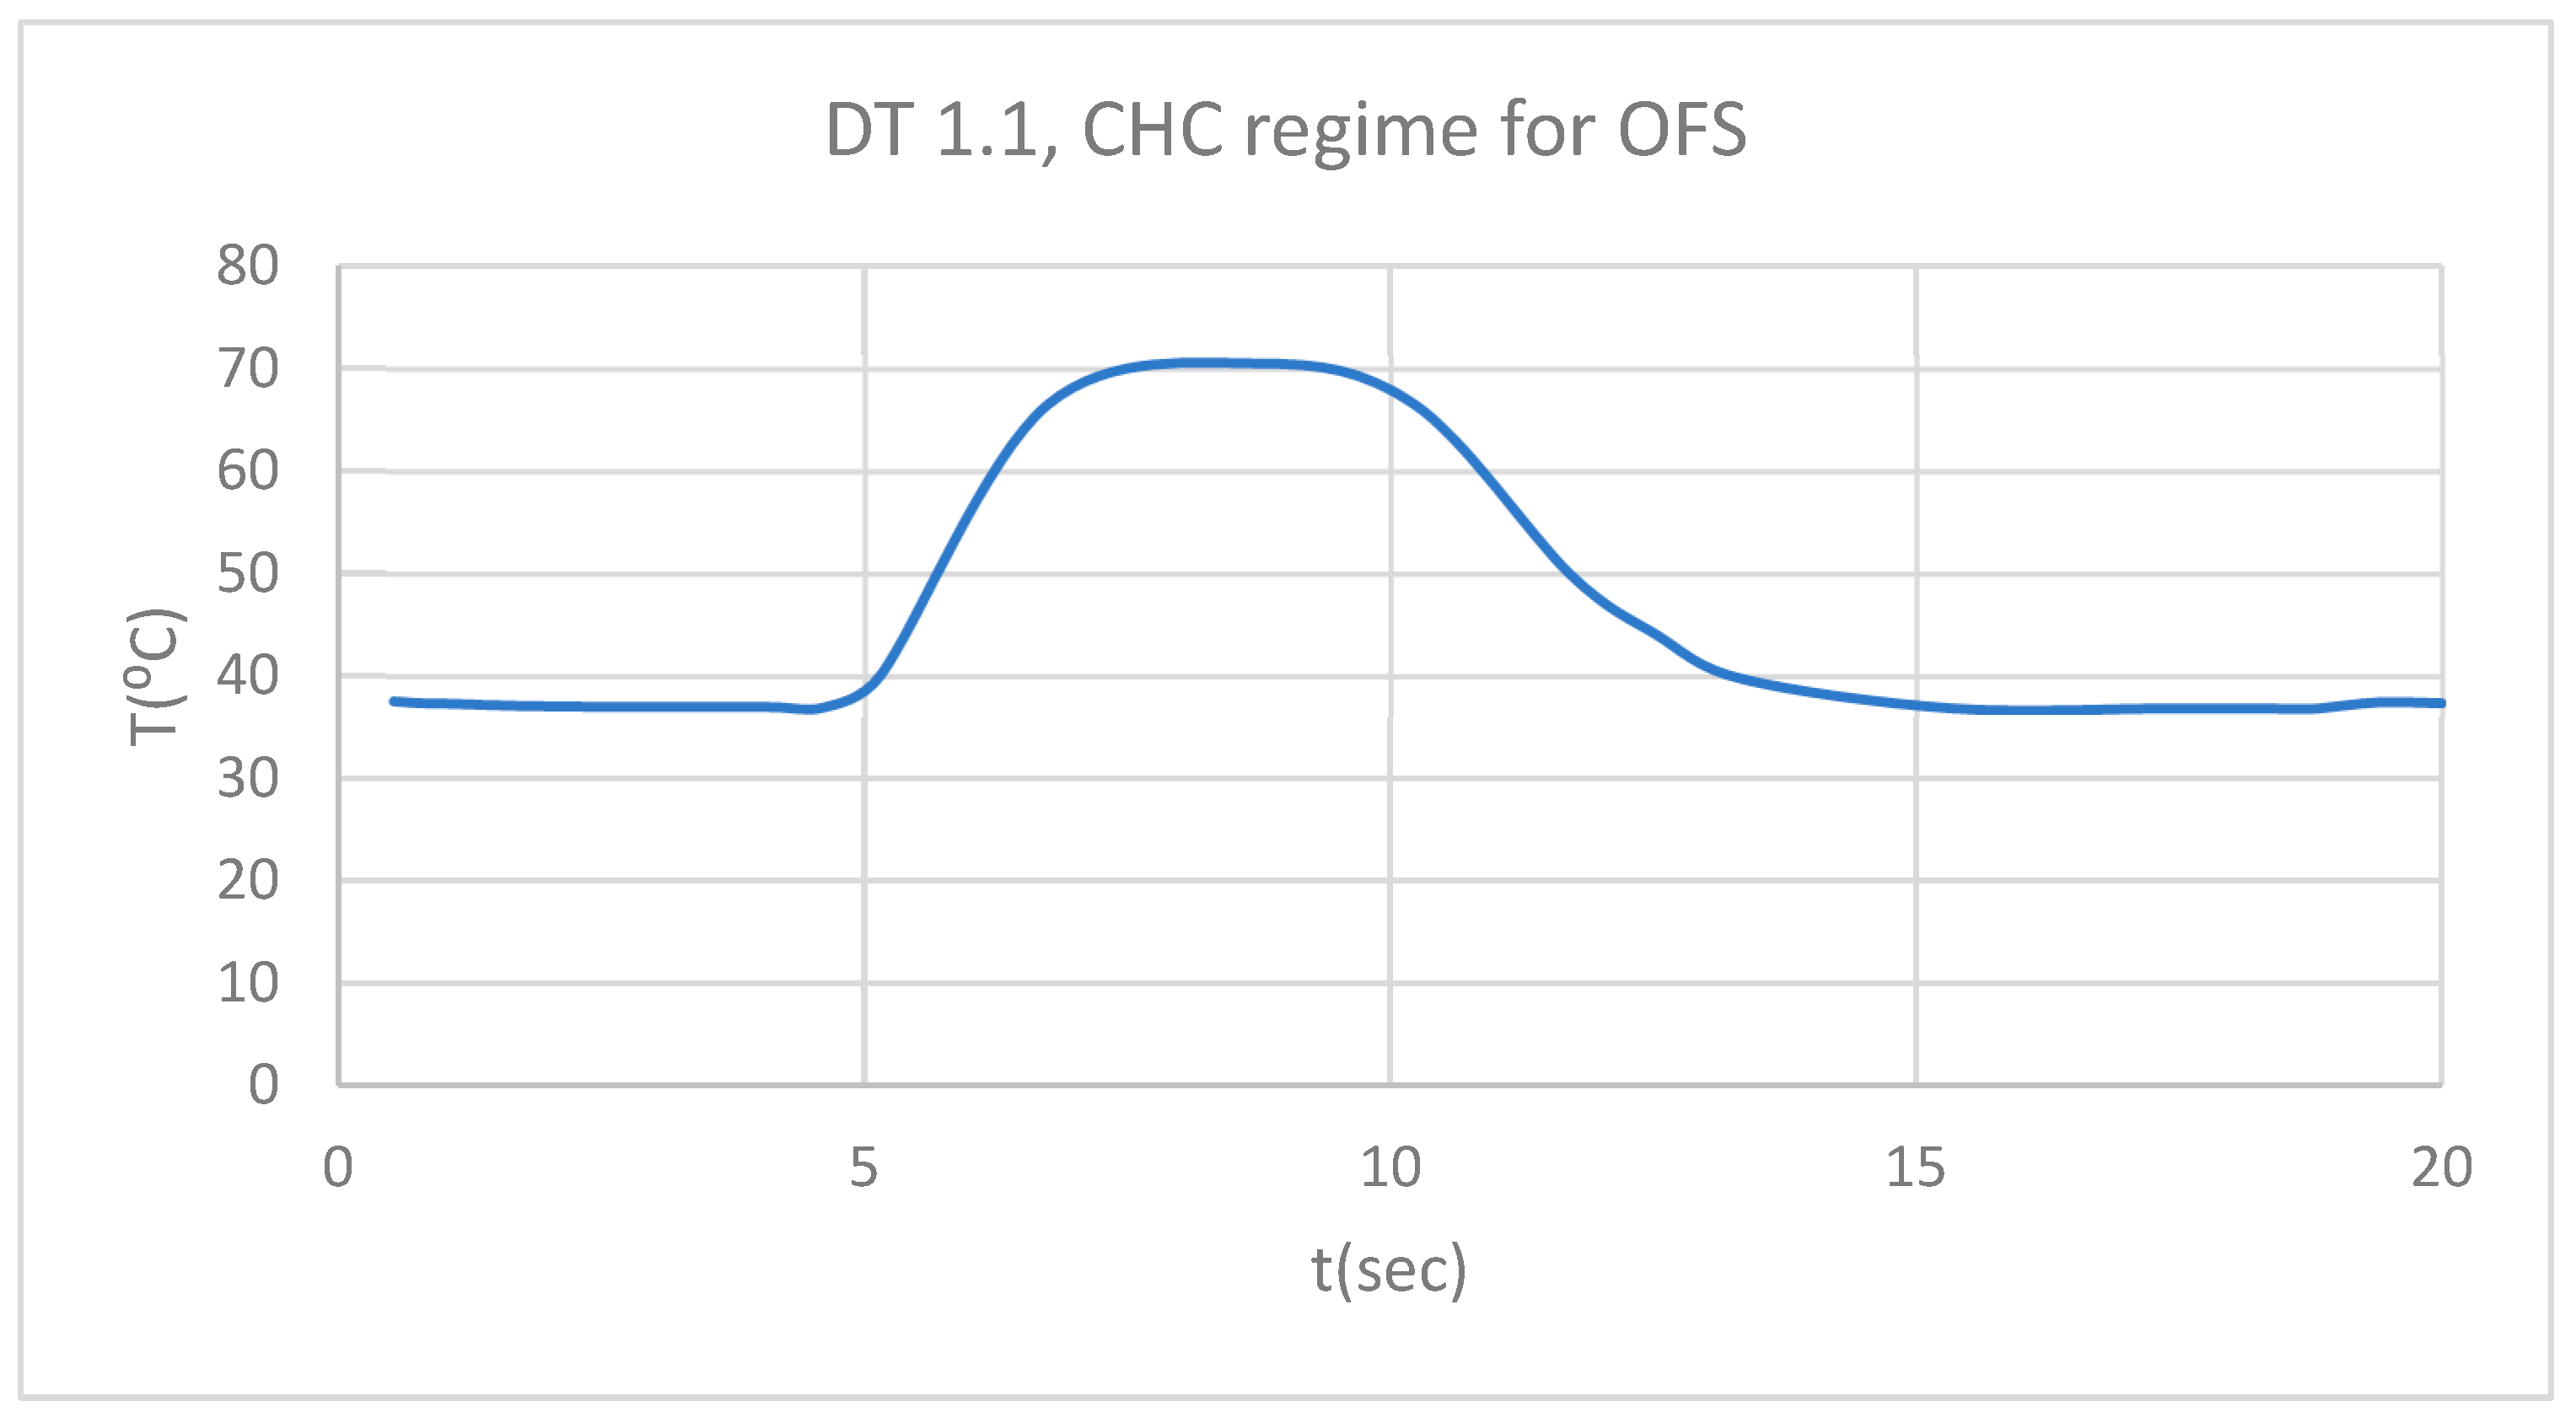
Figure 17.
PT for 1.1 subjected to CHC source.
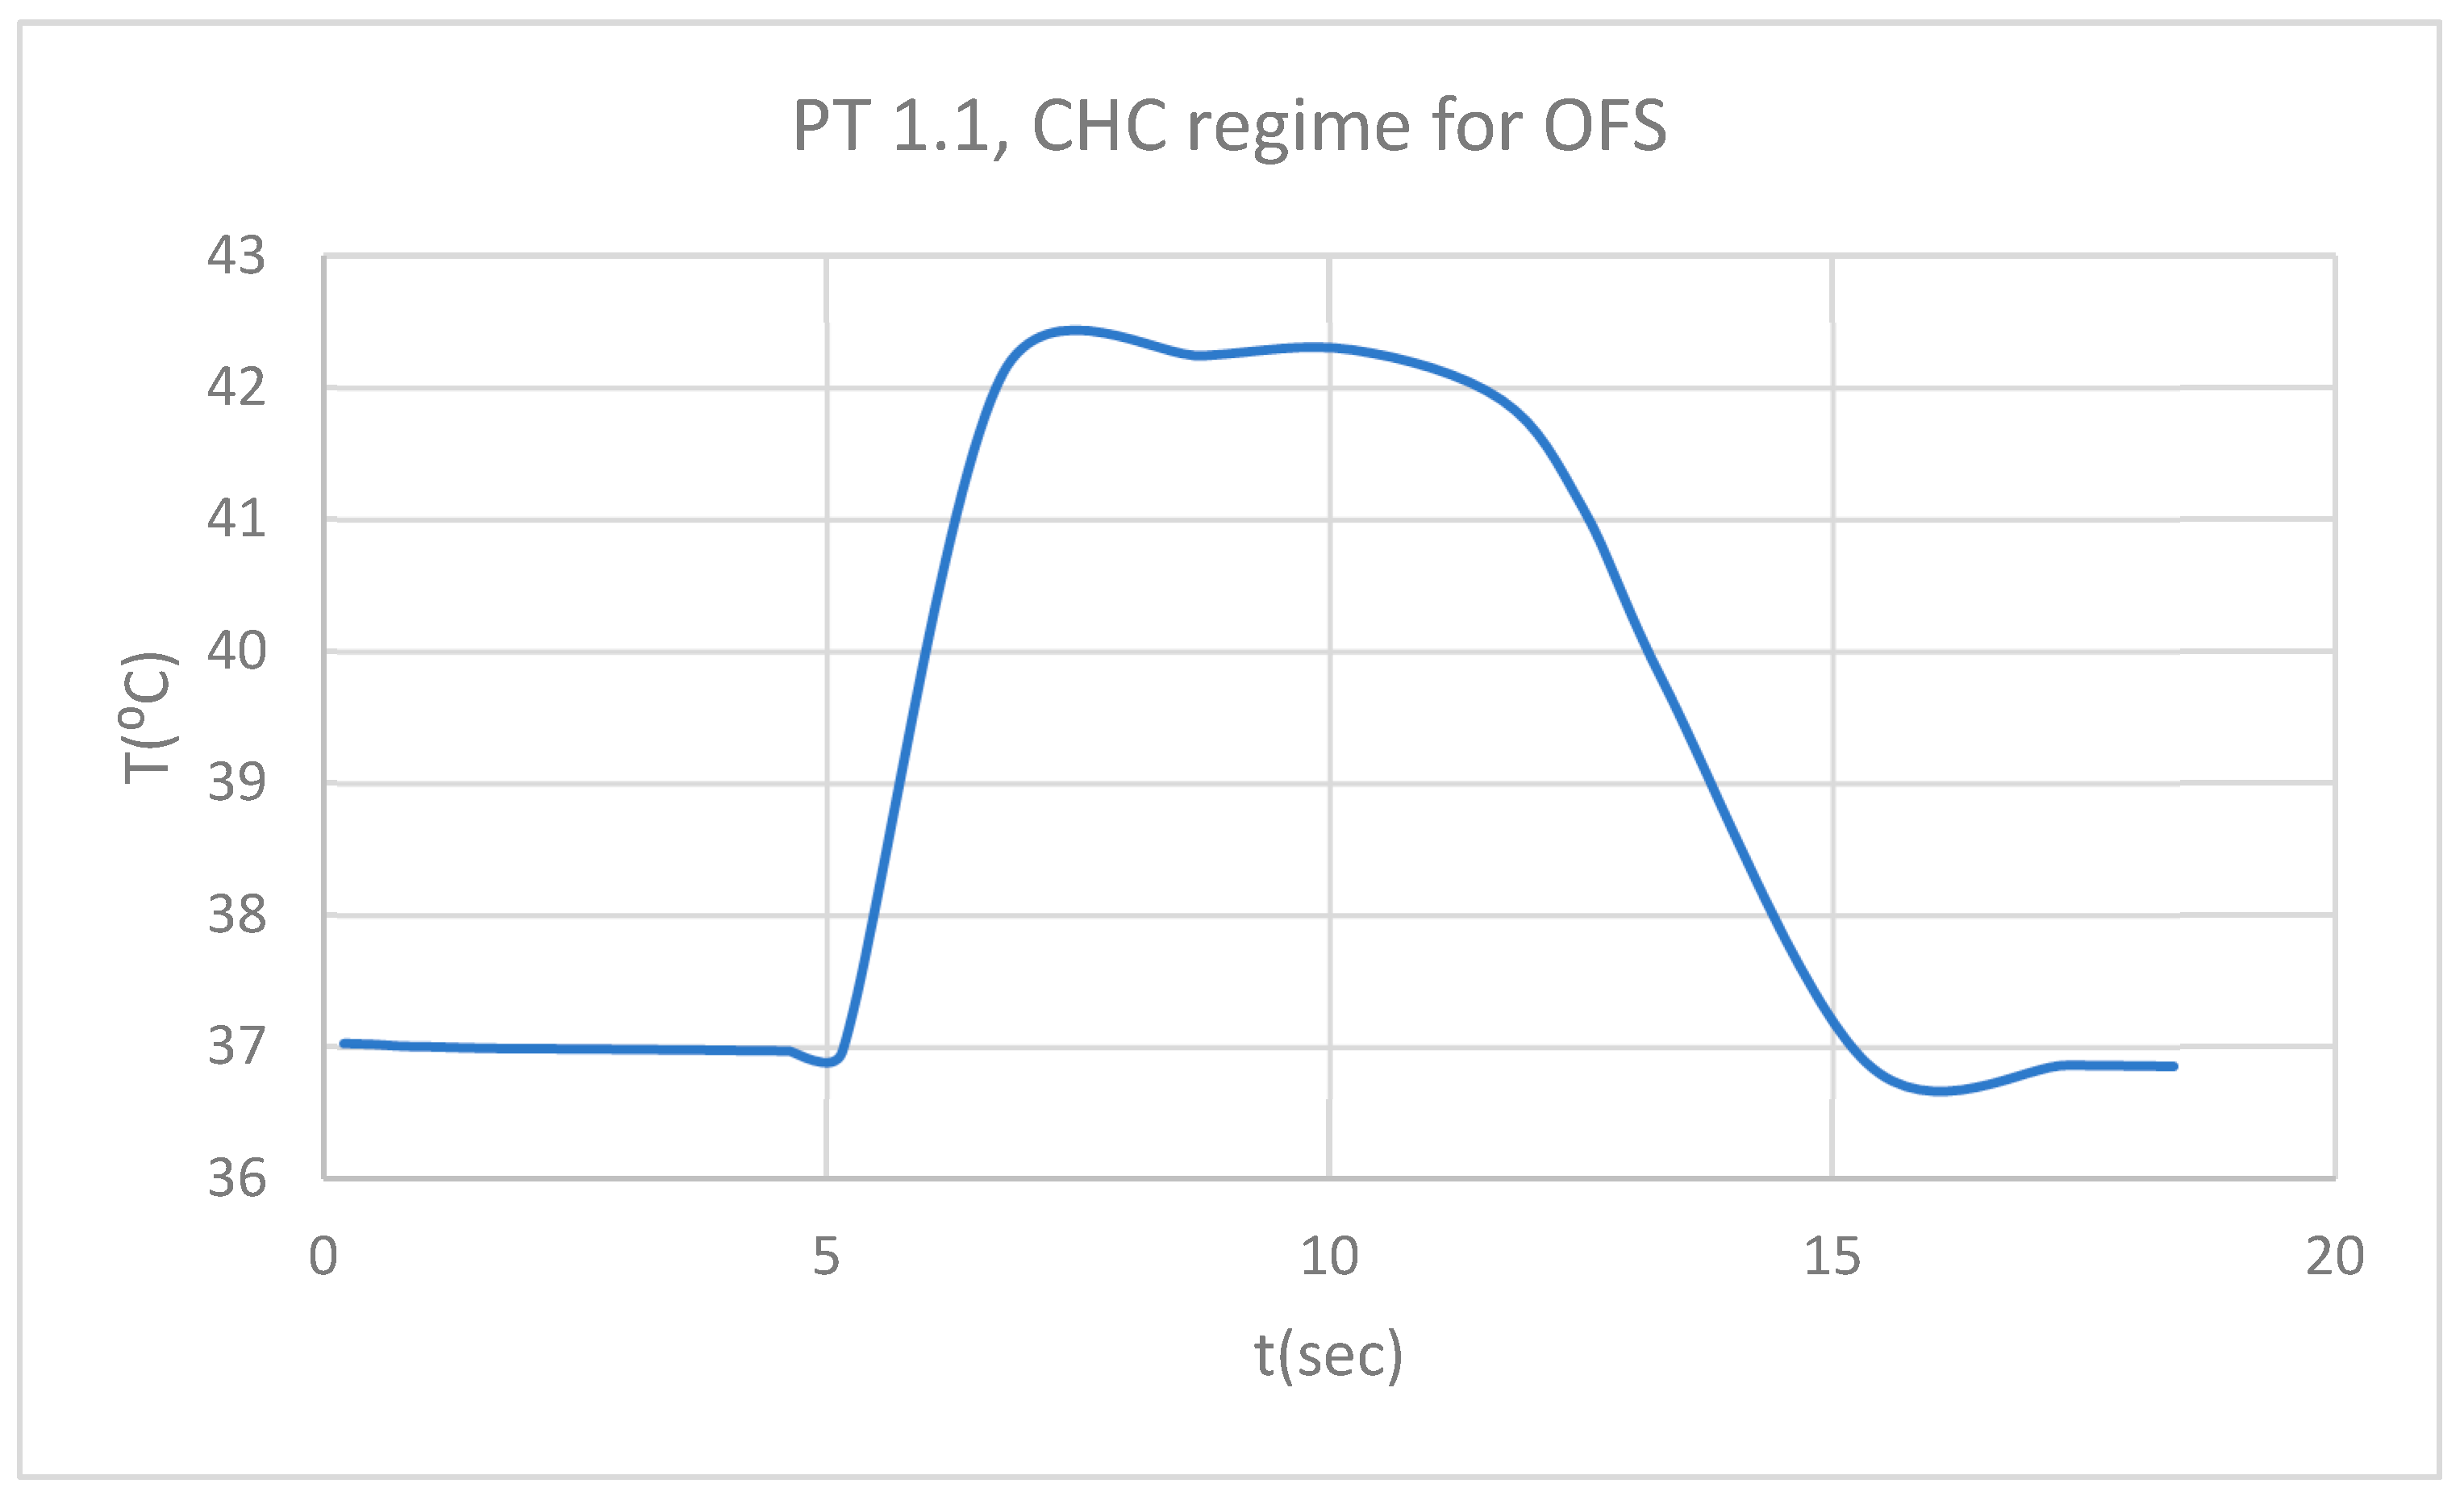
Figure 18.
Comparative diagram of the dental structures temperature for 1.1 subjected to CHC source.
Figure 18.
Comparative diagram of the dental structures temperature for 1.1 subjected to CHC source.
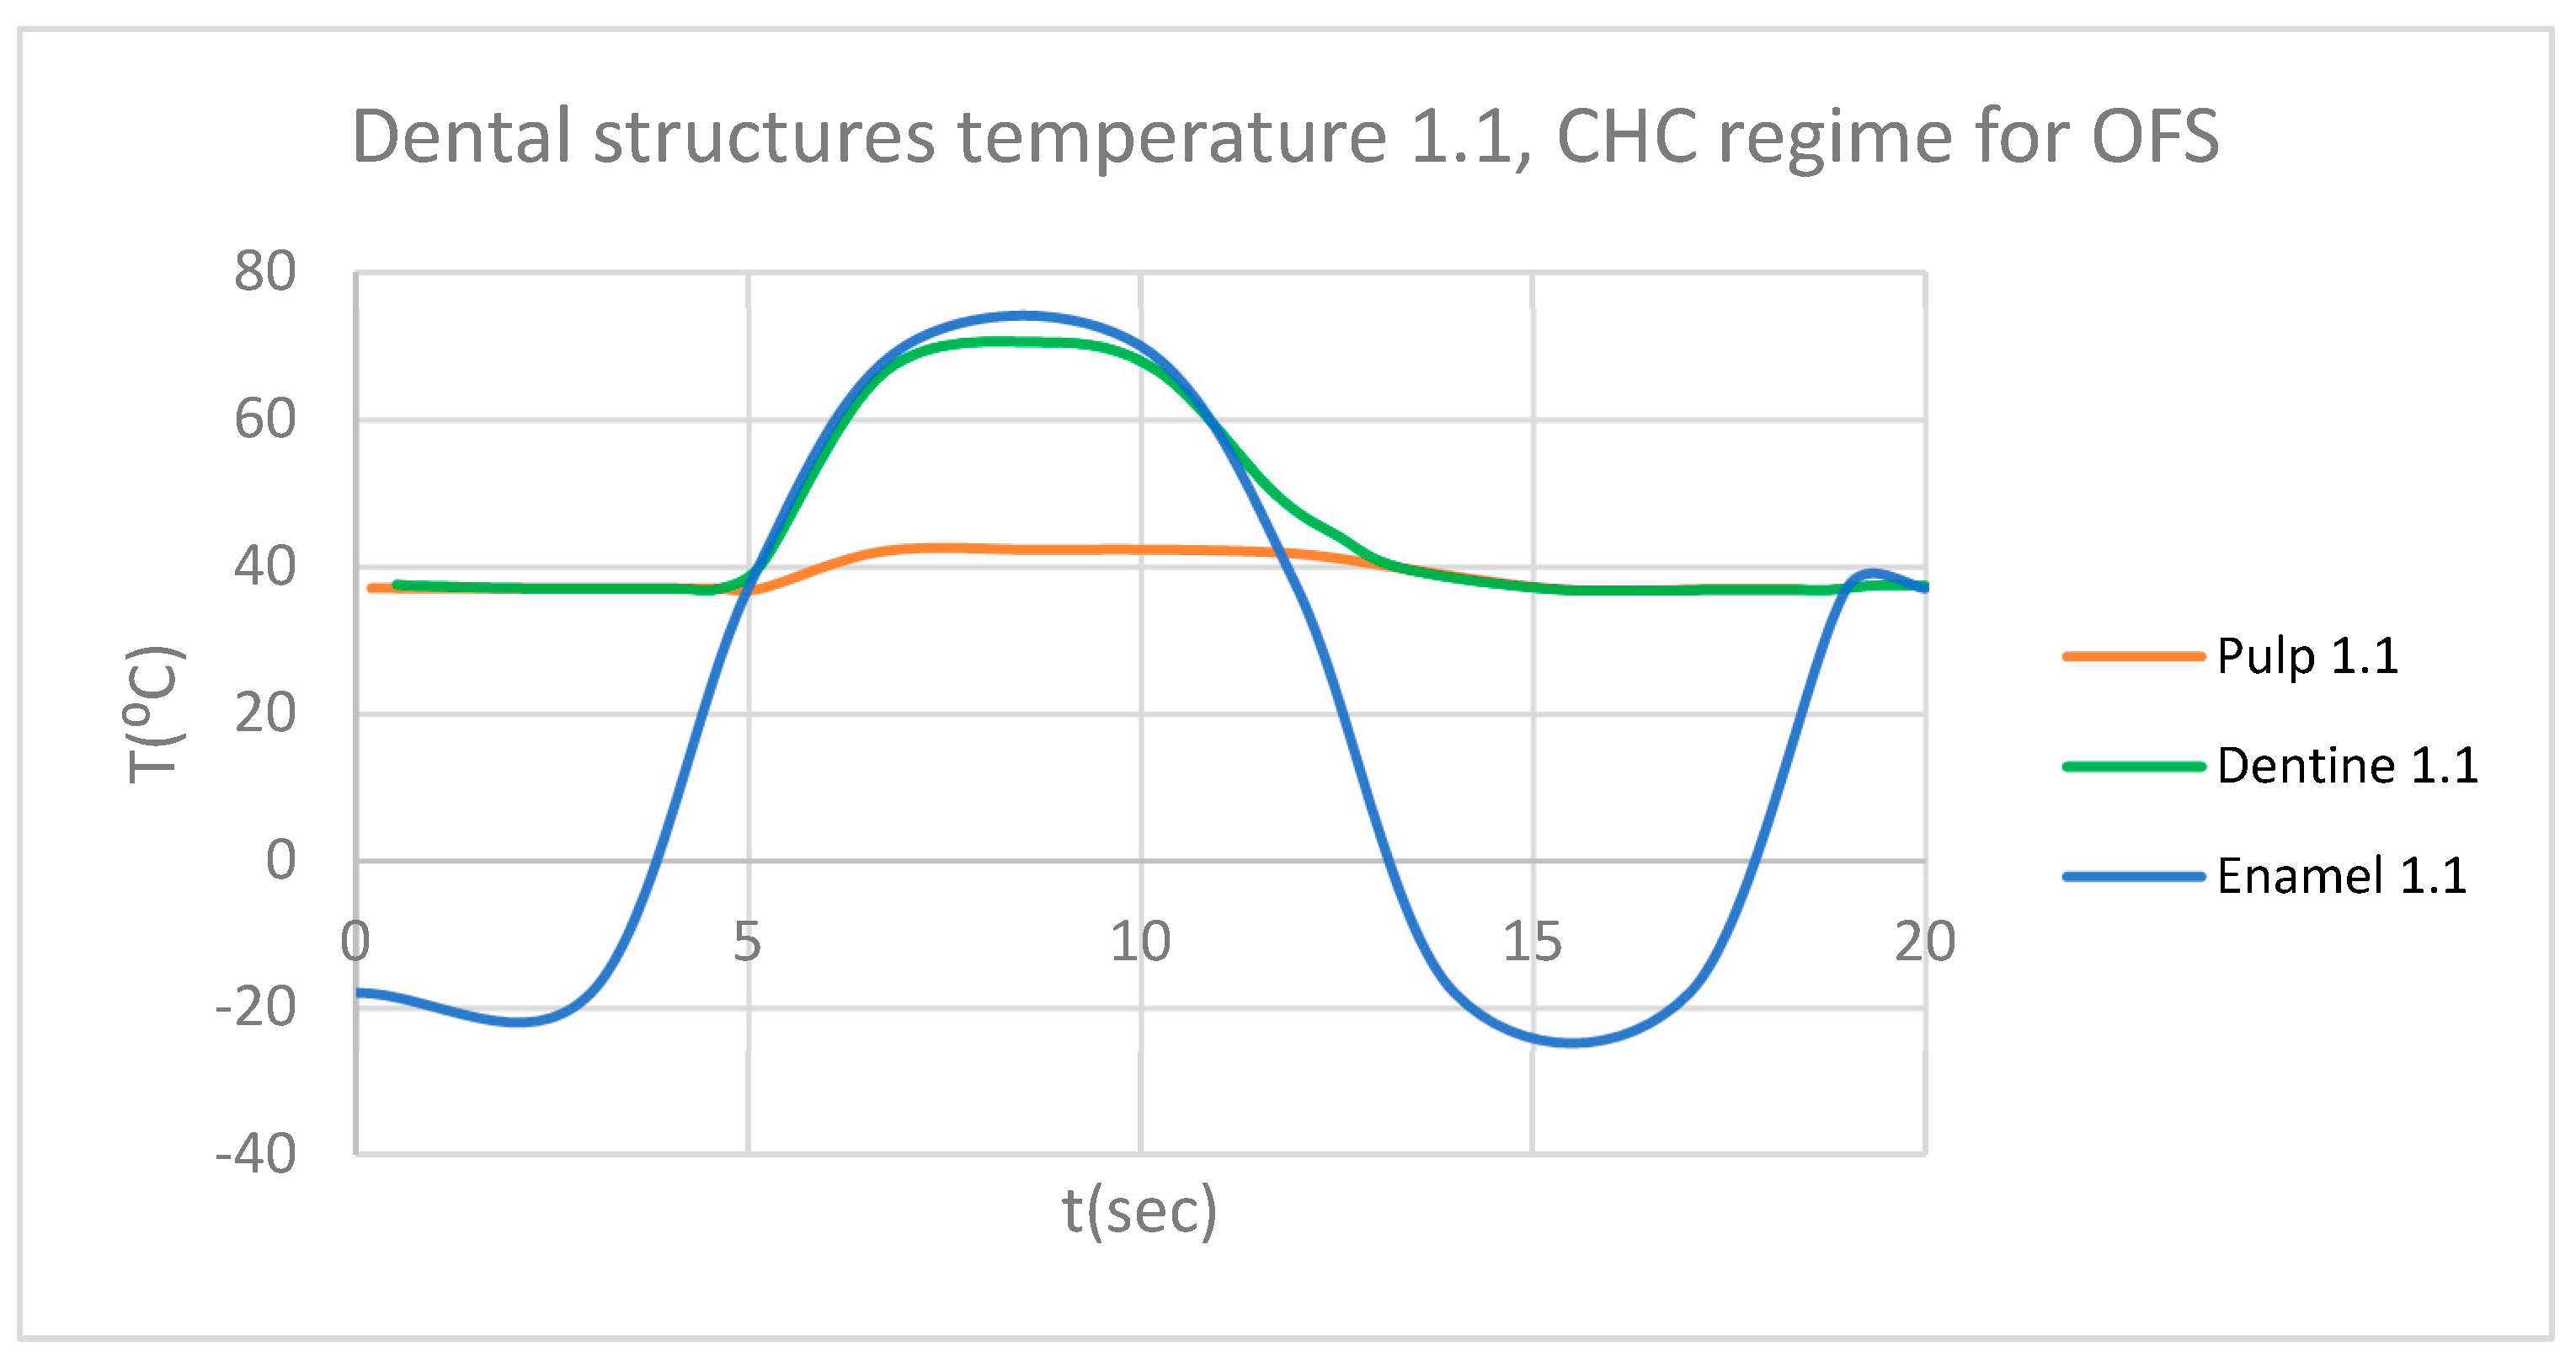
Figure 19.
ET for 4.1 subjected to CHC source.
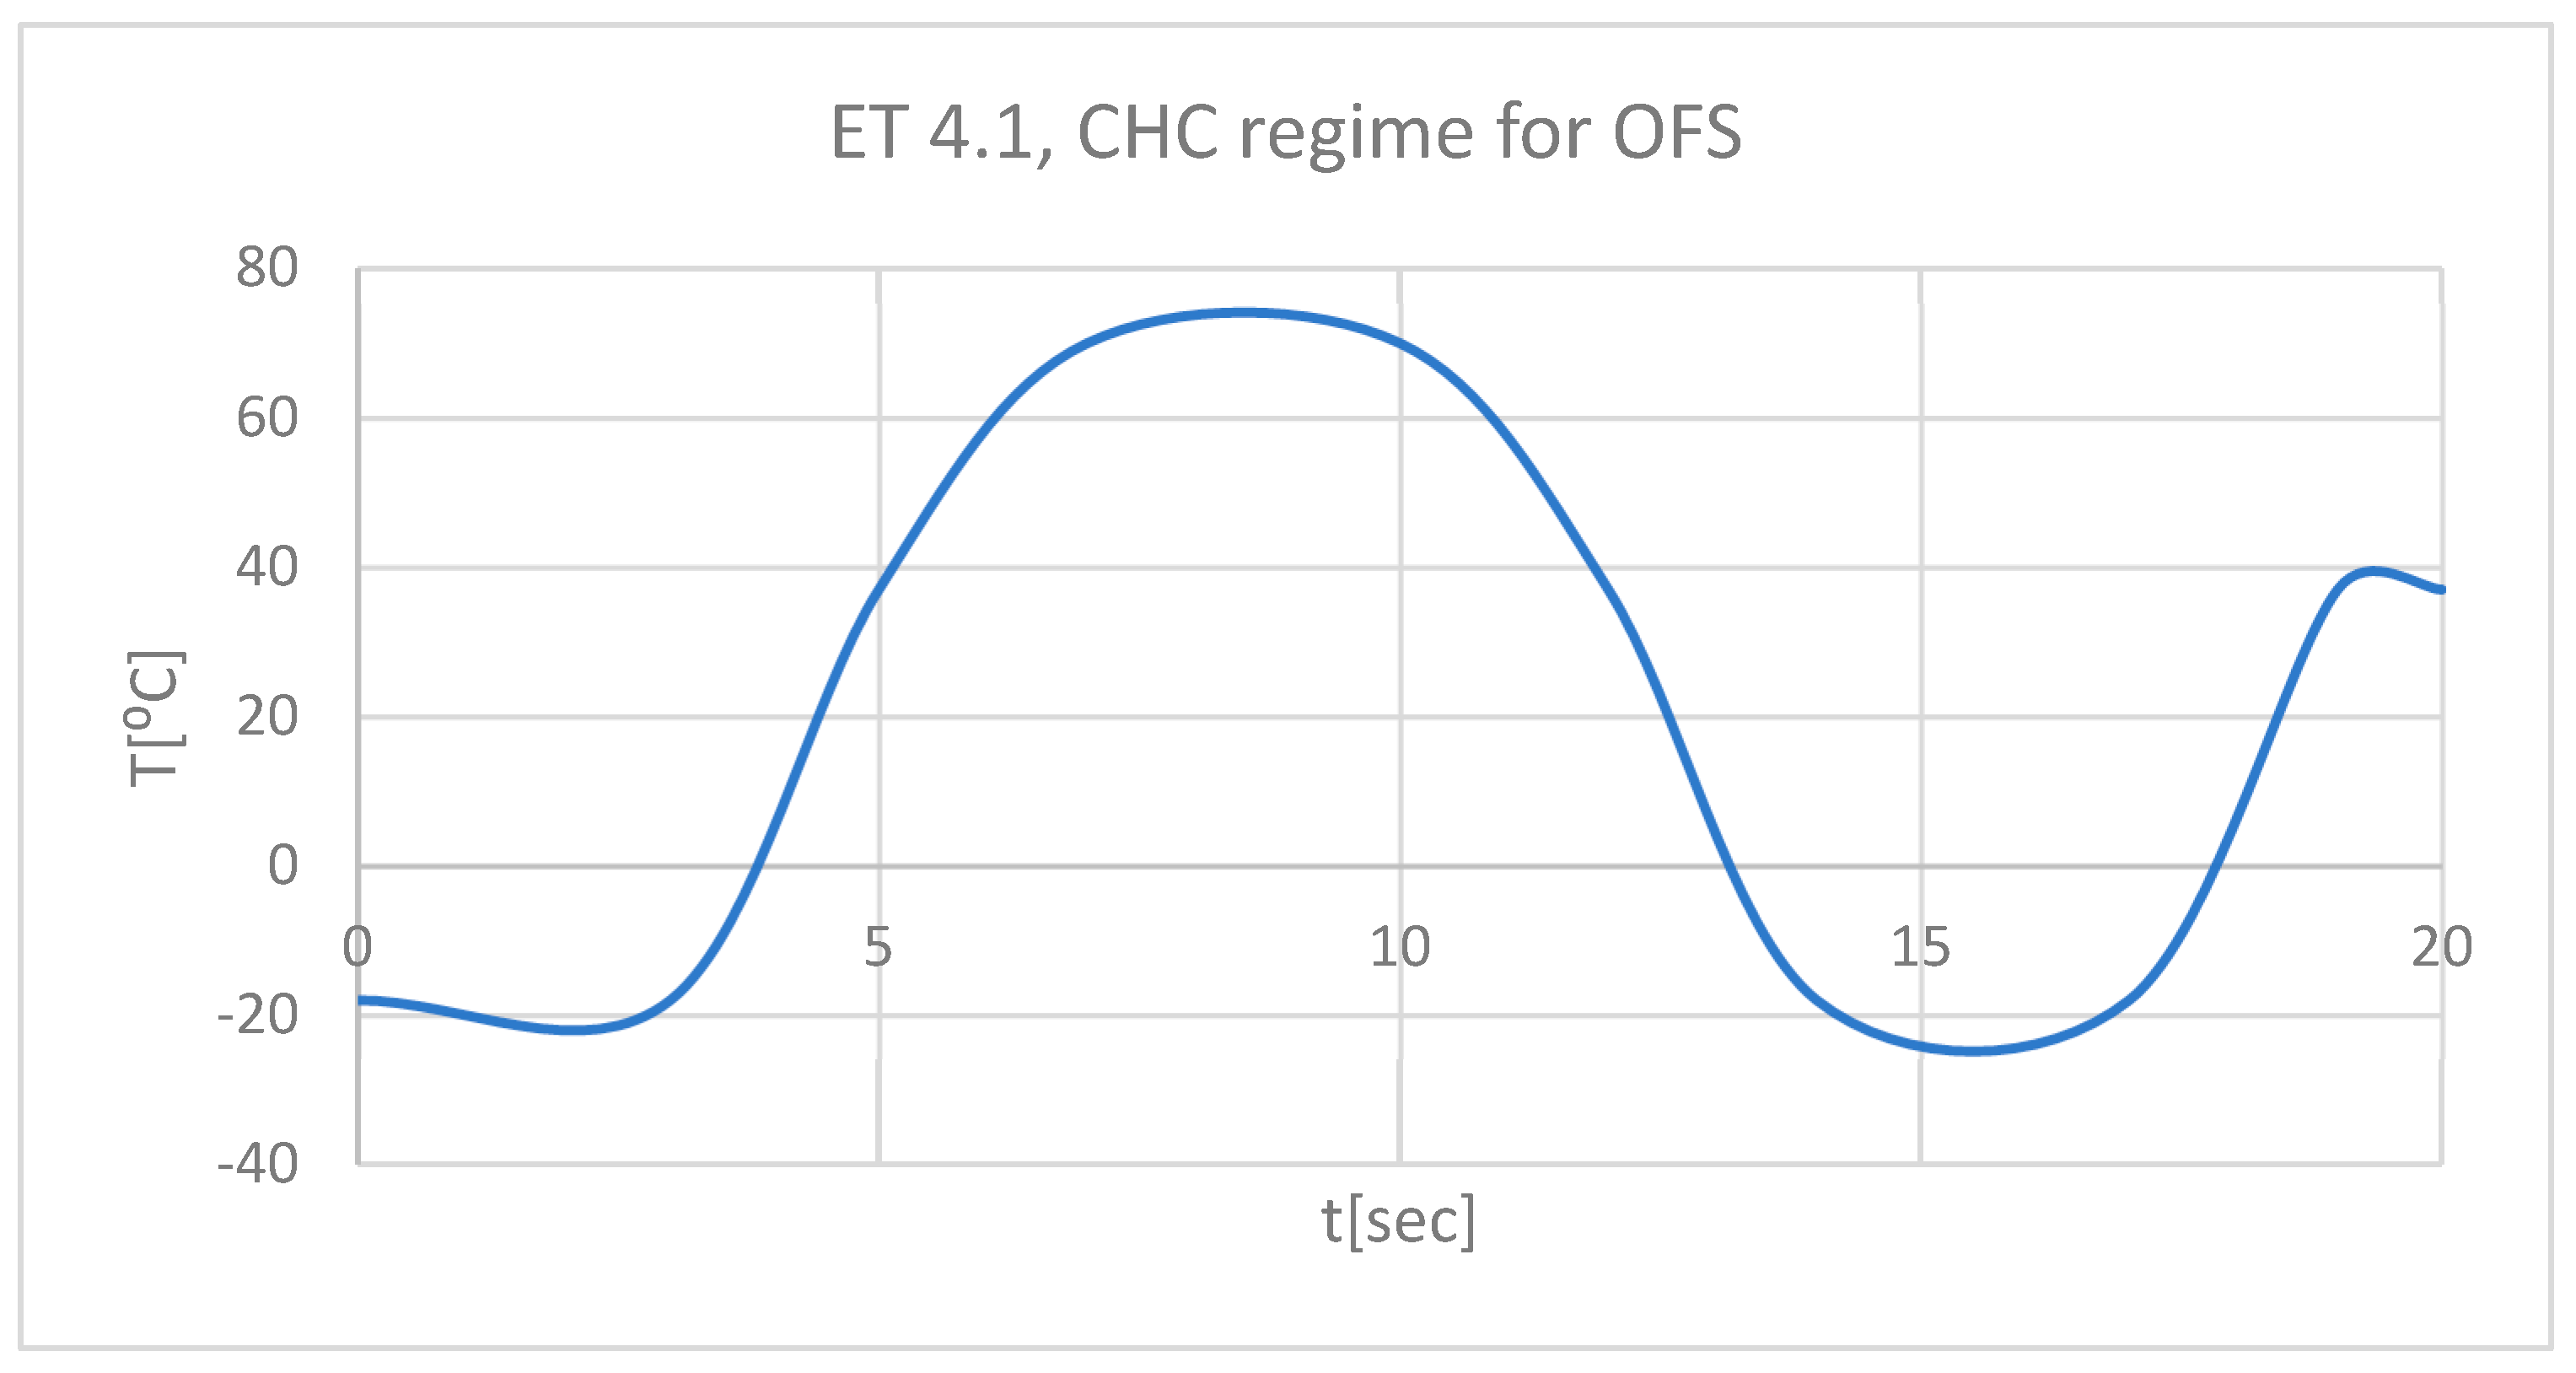
Figure 20.
DT for 4.1 subjected to CHC source.

Figure 21.
PT for 4.1 subjected to CHC source.
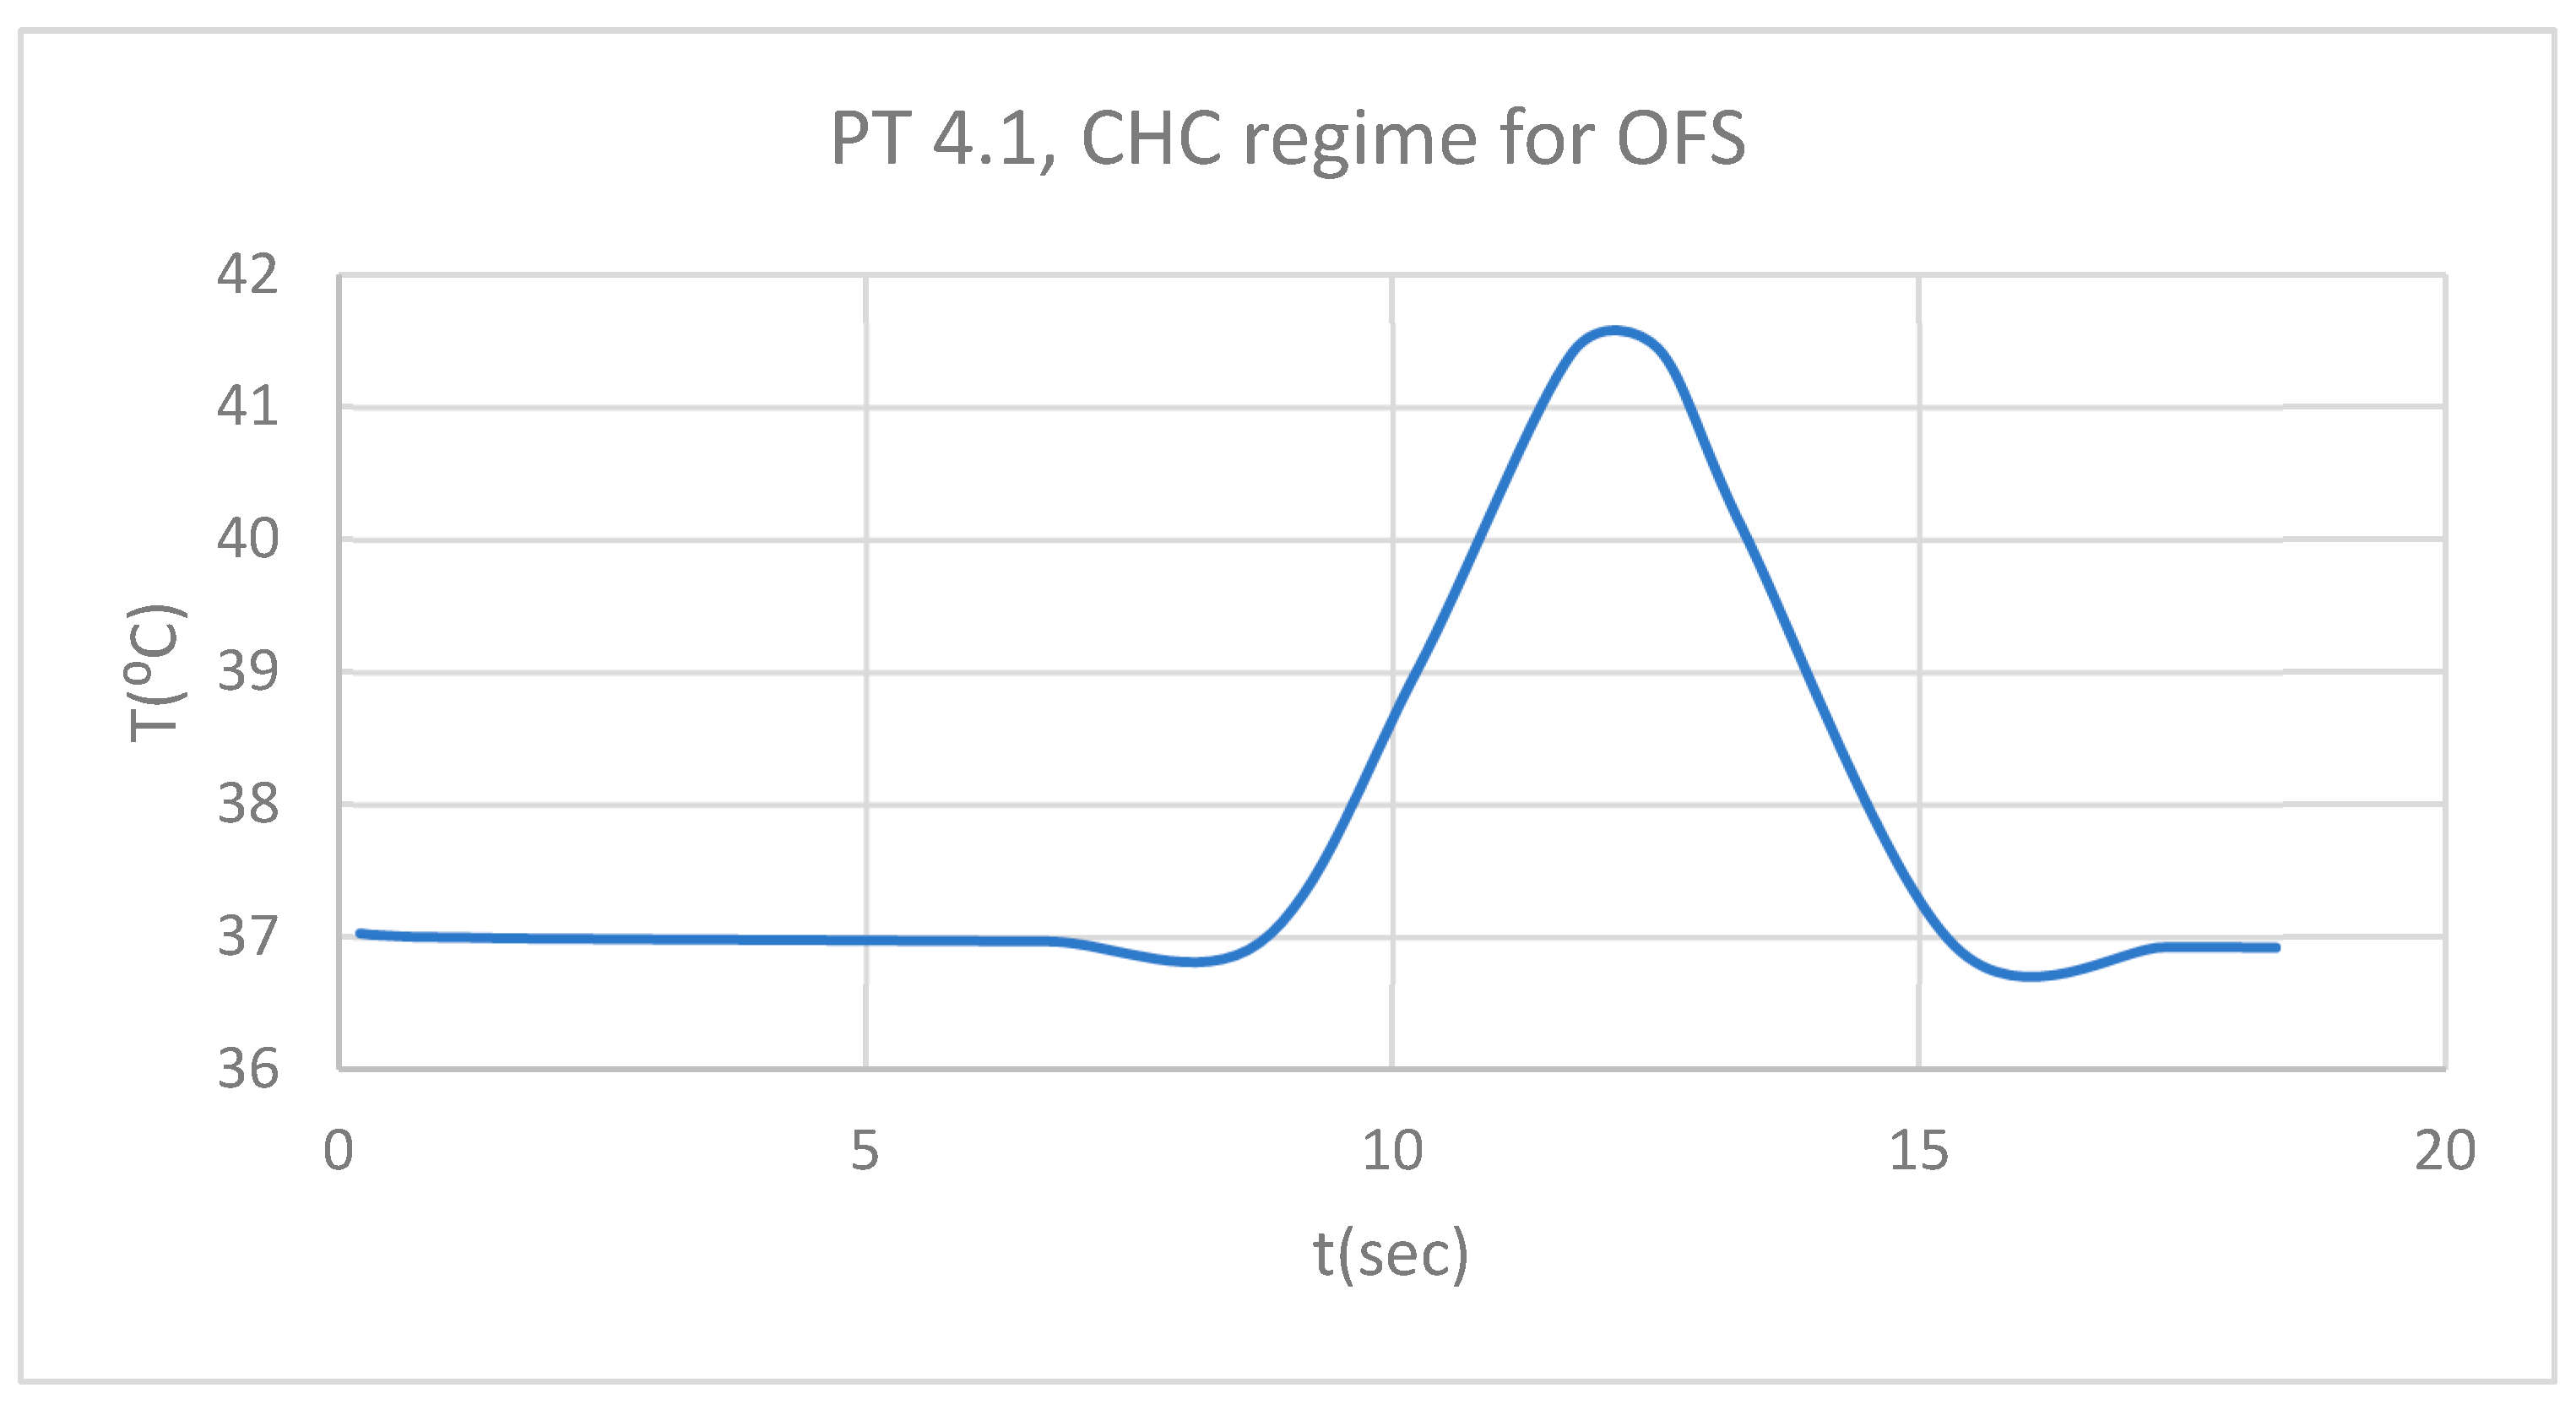
Figure 22.
Comparative diagram of the dental structures temperature for 4.1 subjected to CHC source.
Figure 22.
Comparative diagram of the dental structures temperature for 4.1 subjected to CHC source.
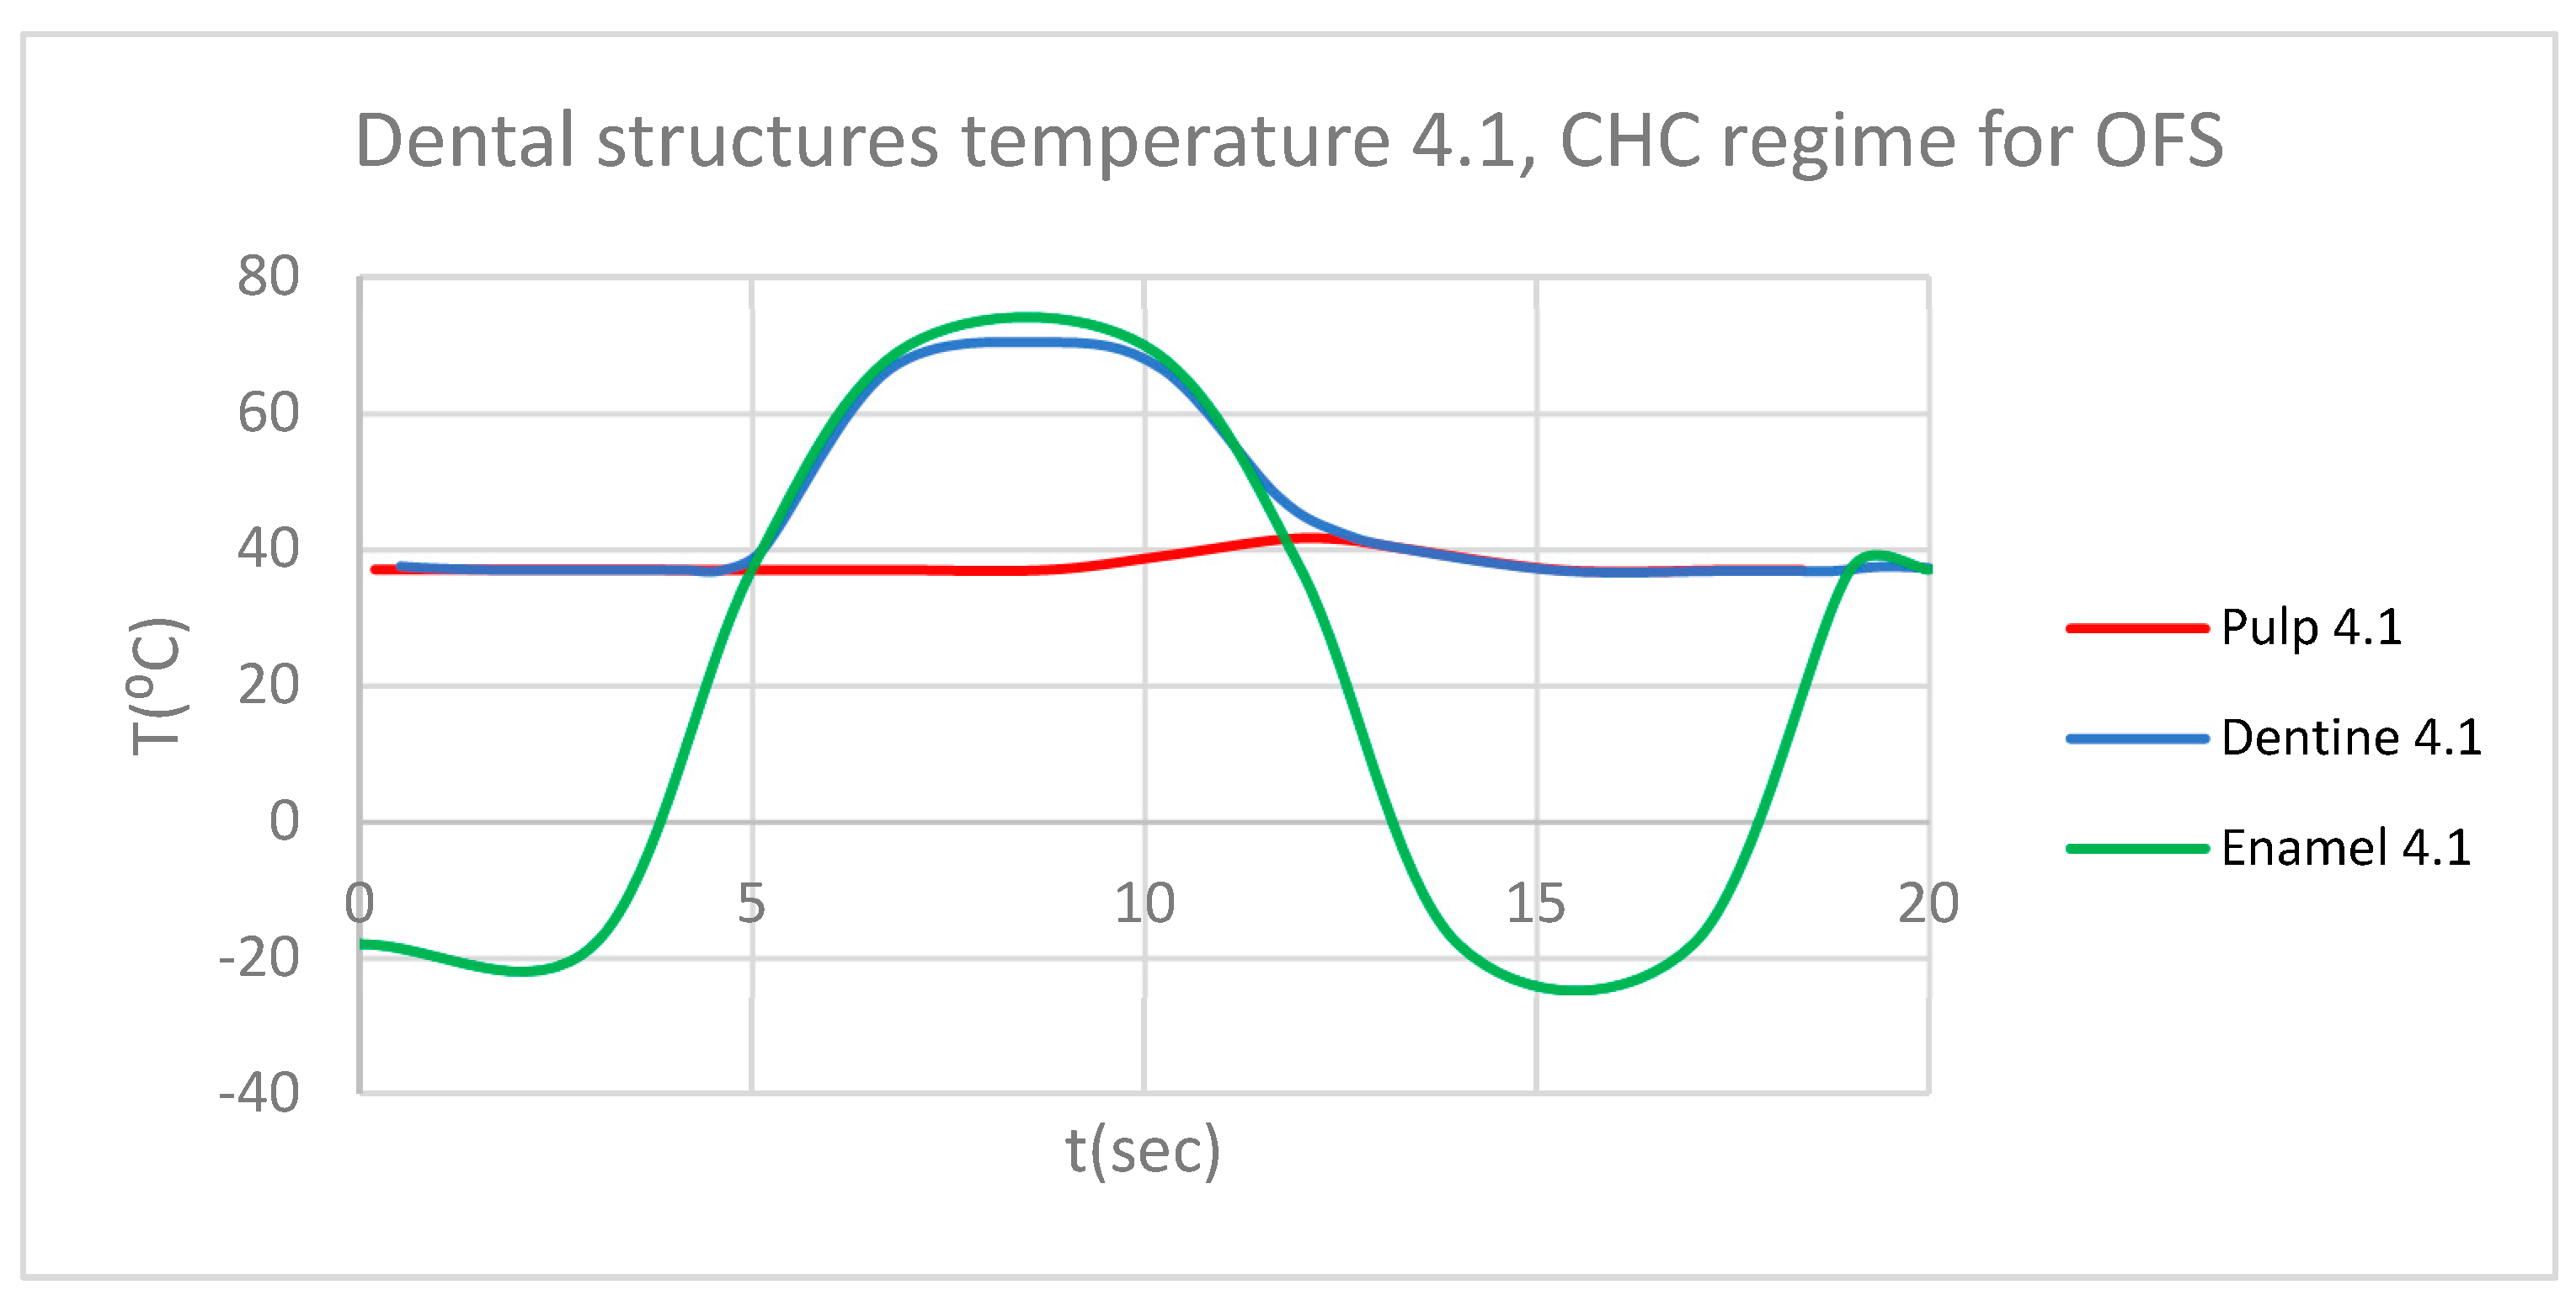
Figure 23.
Comparative diagram of the dental structures temperature for 1.1 and 4.1 subjected to CHC source.
Figure 23.
Comparative diagram of the dental structures temperature for 1.1 and 4.1 subjected to CHC source.
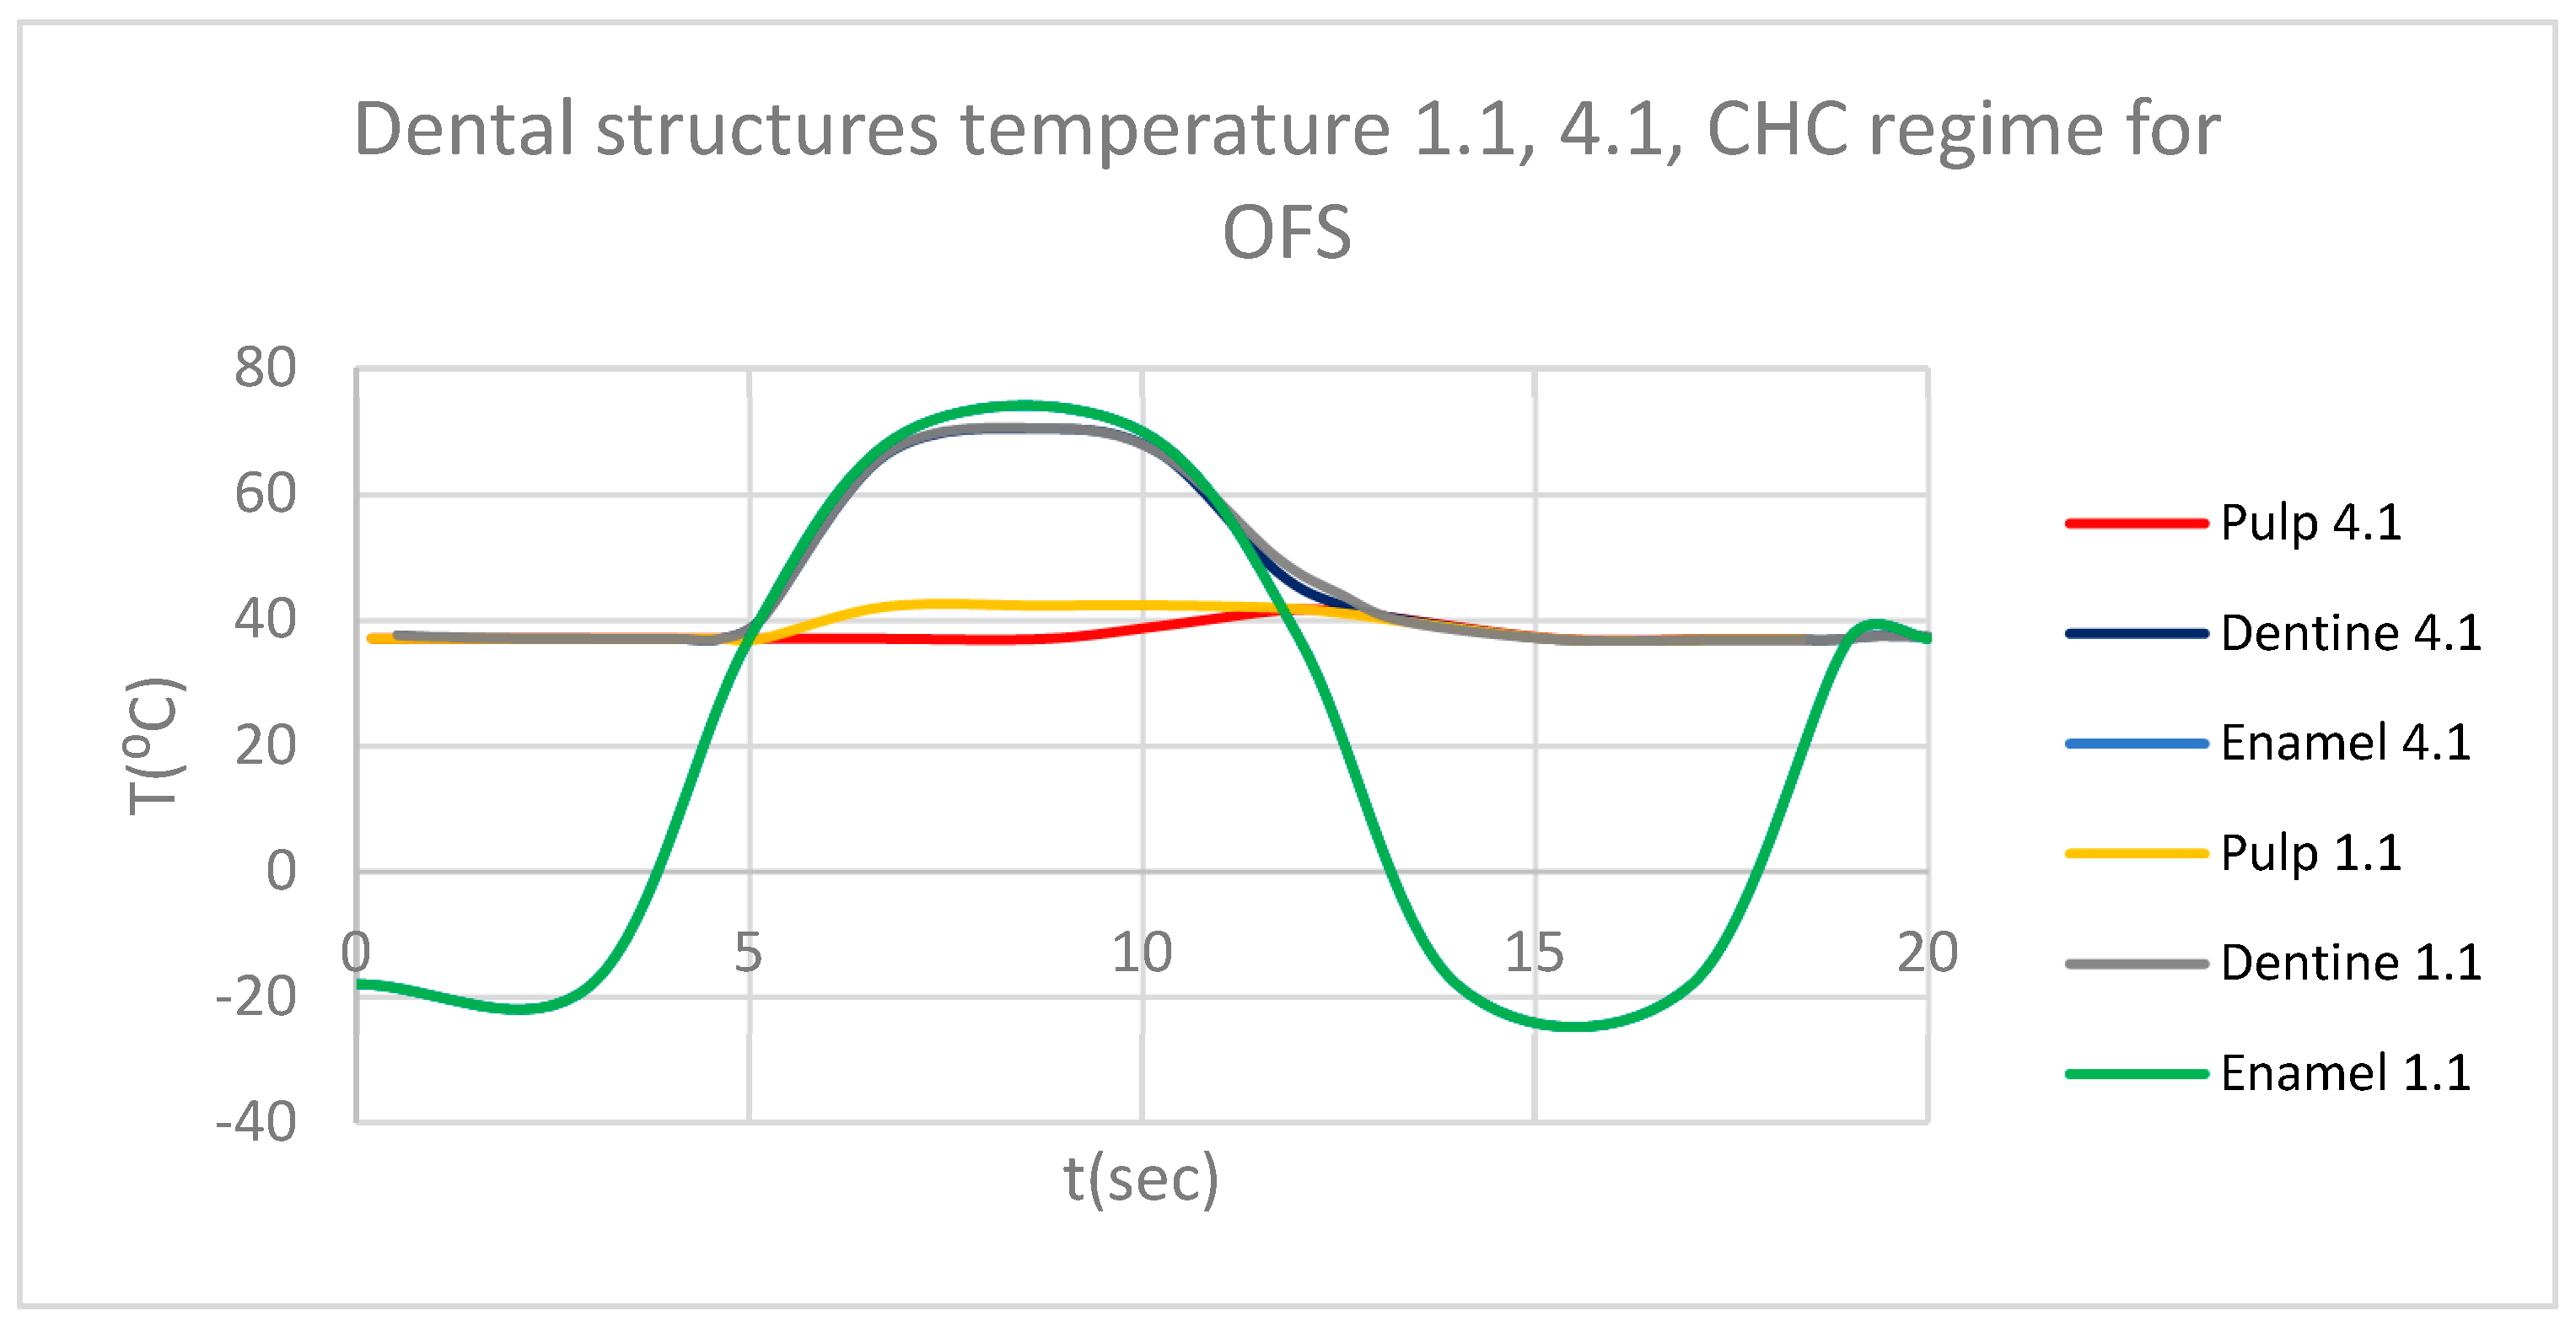
Figure 24.
Thermal map.
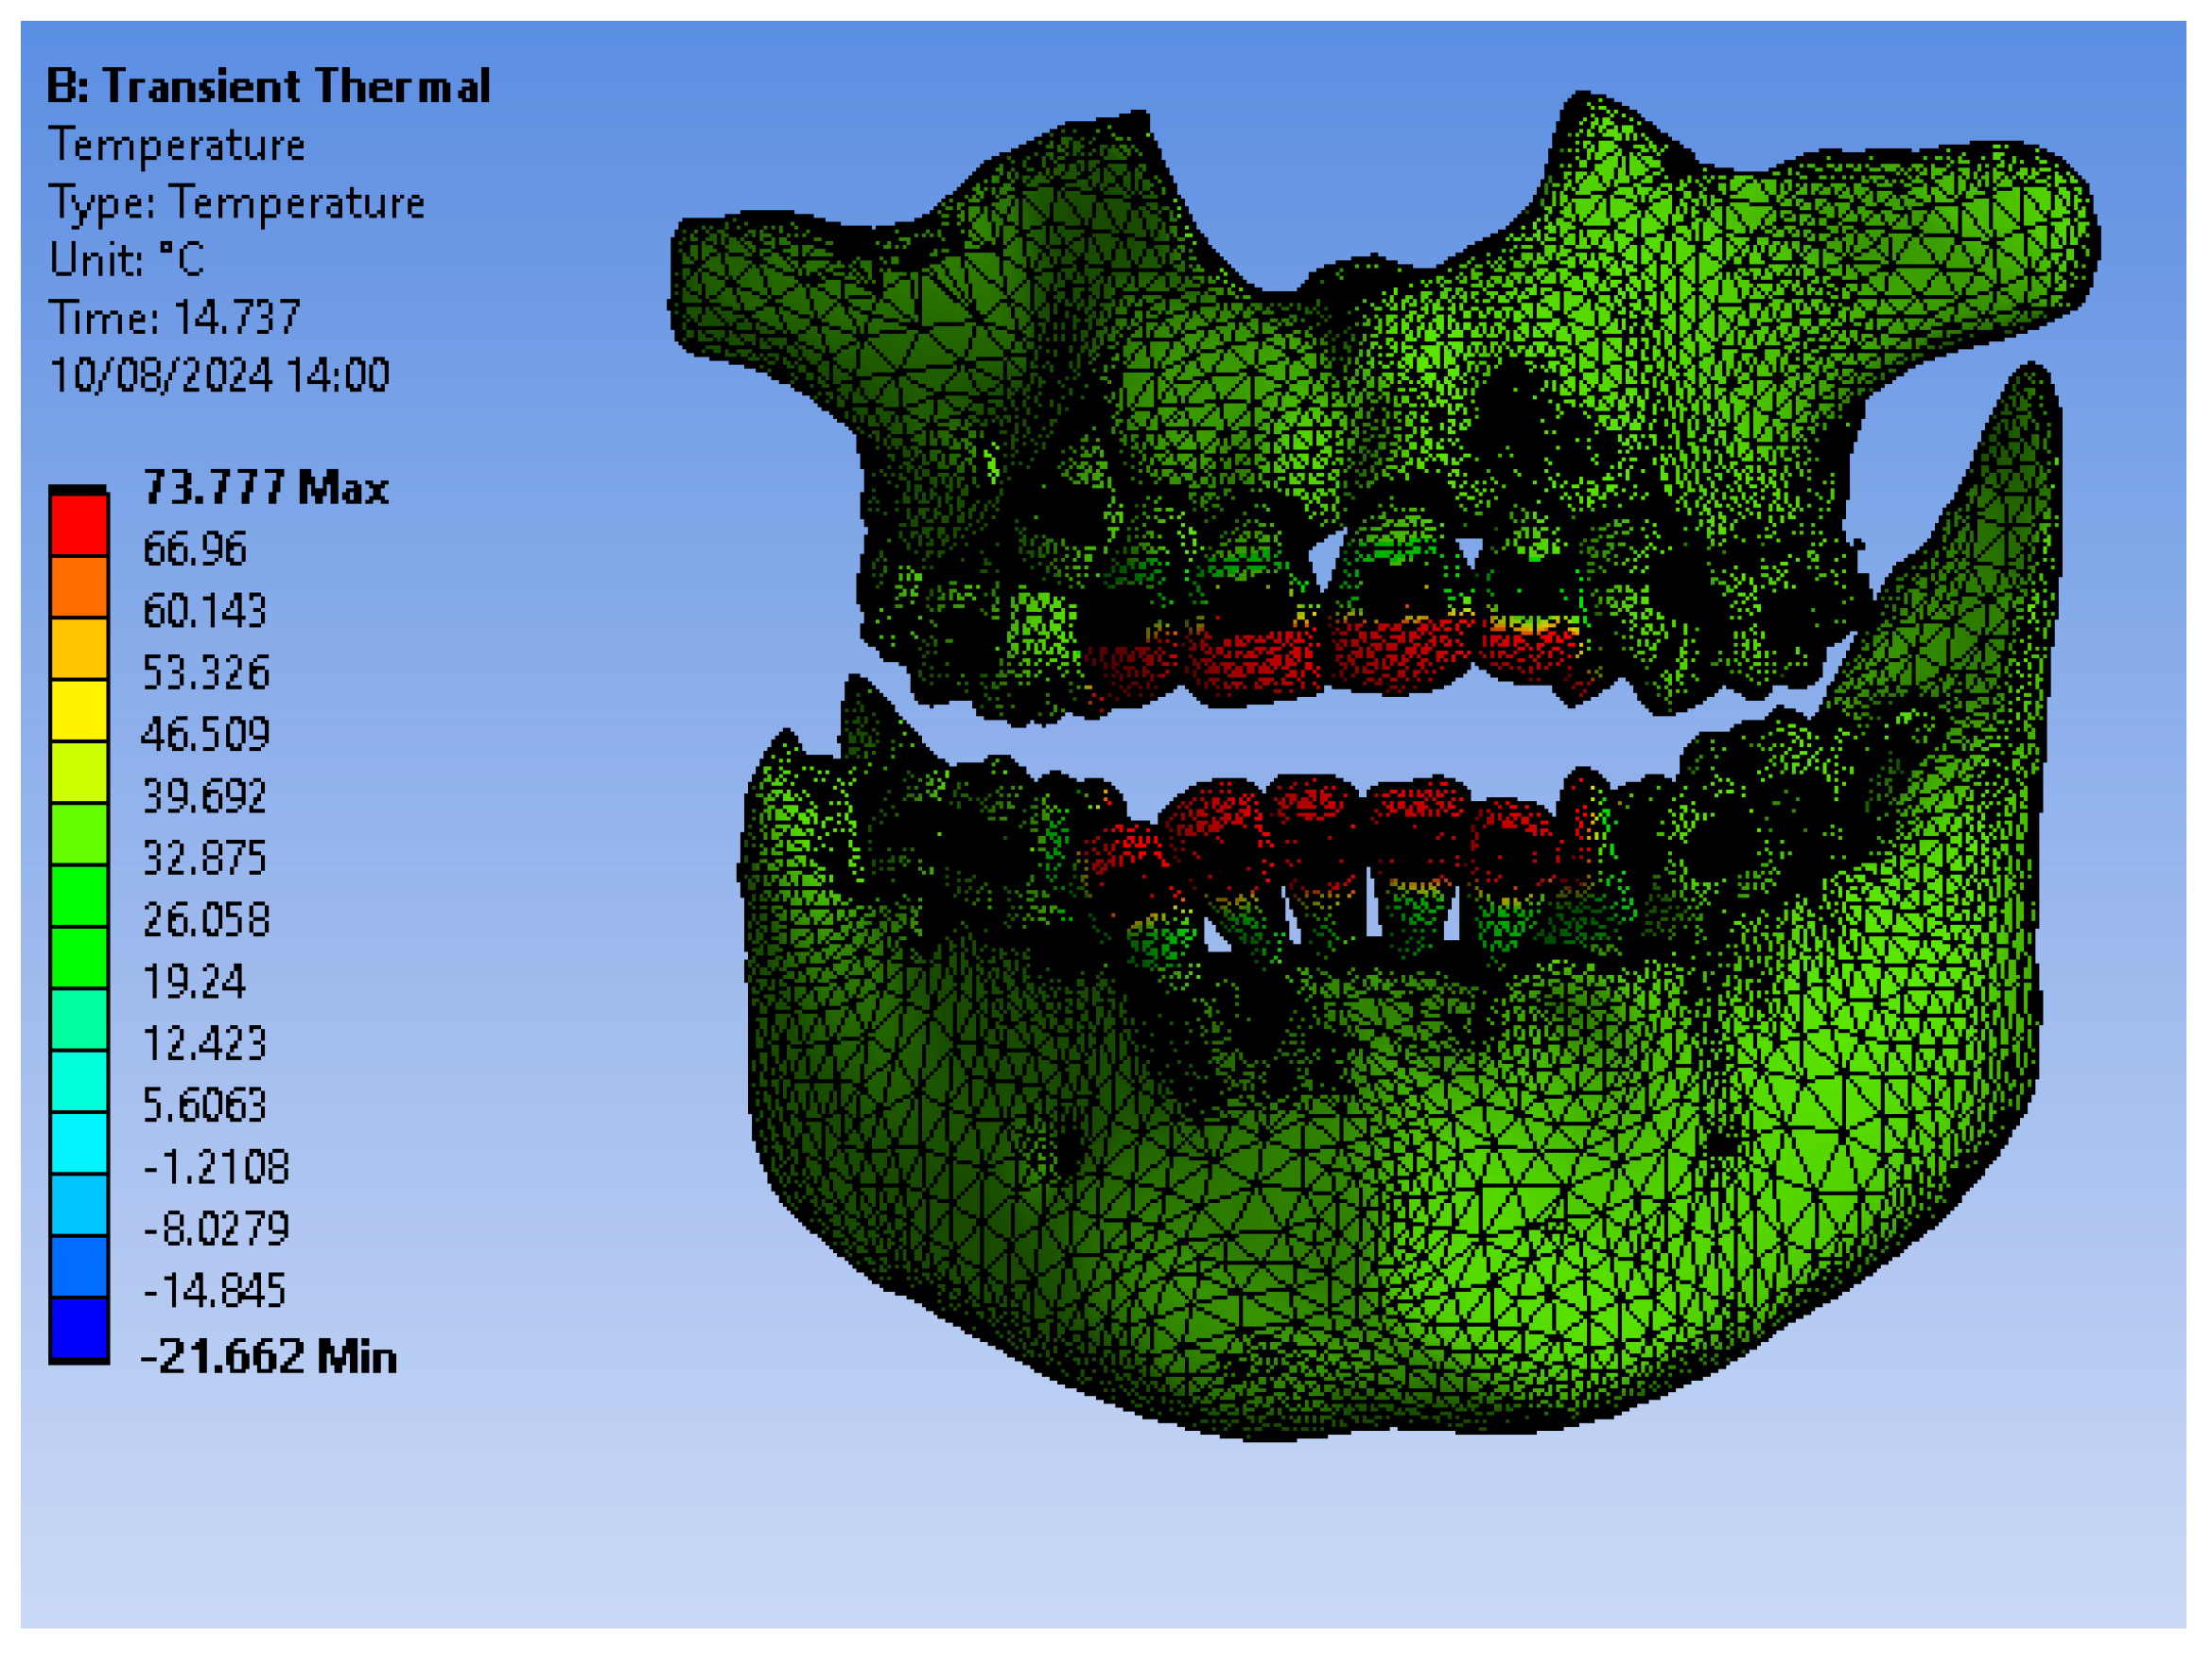
Figure 25.
ET for 1.1 subjected to HCH.
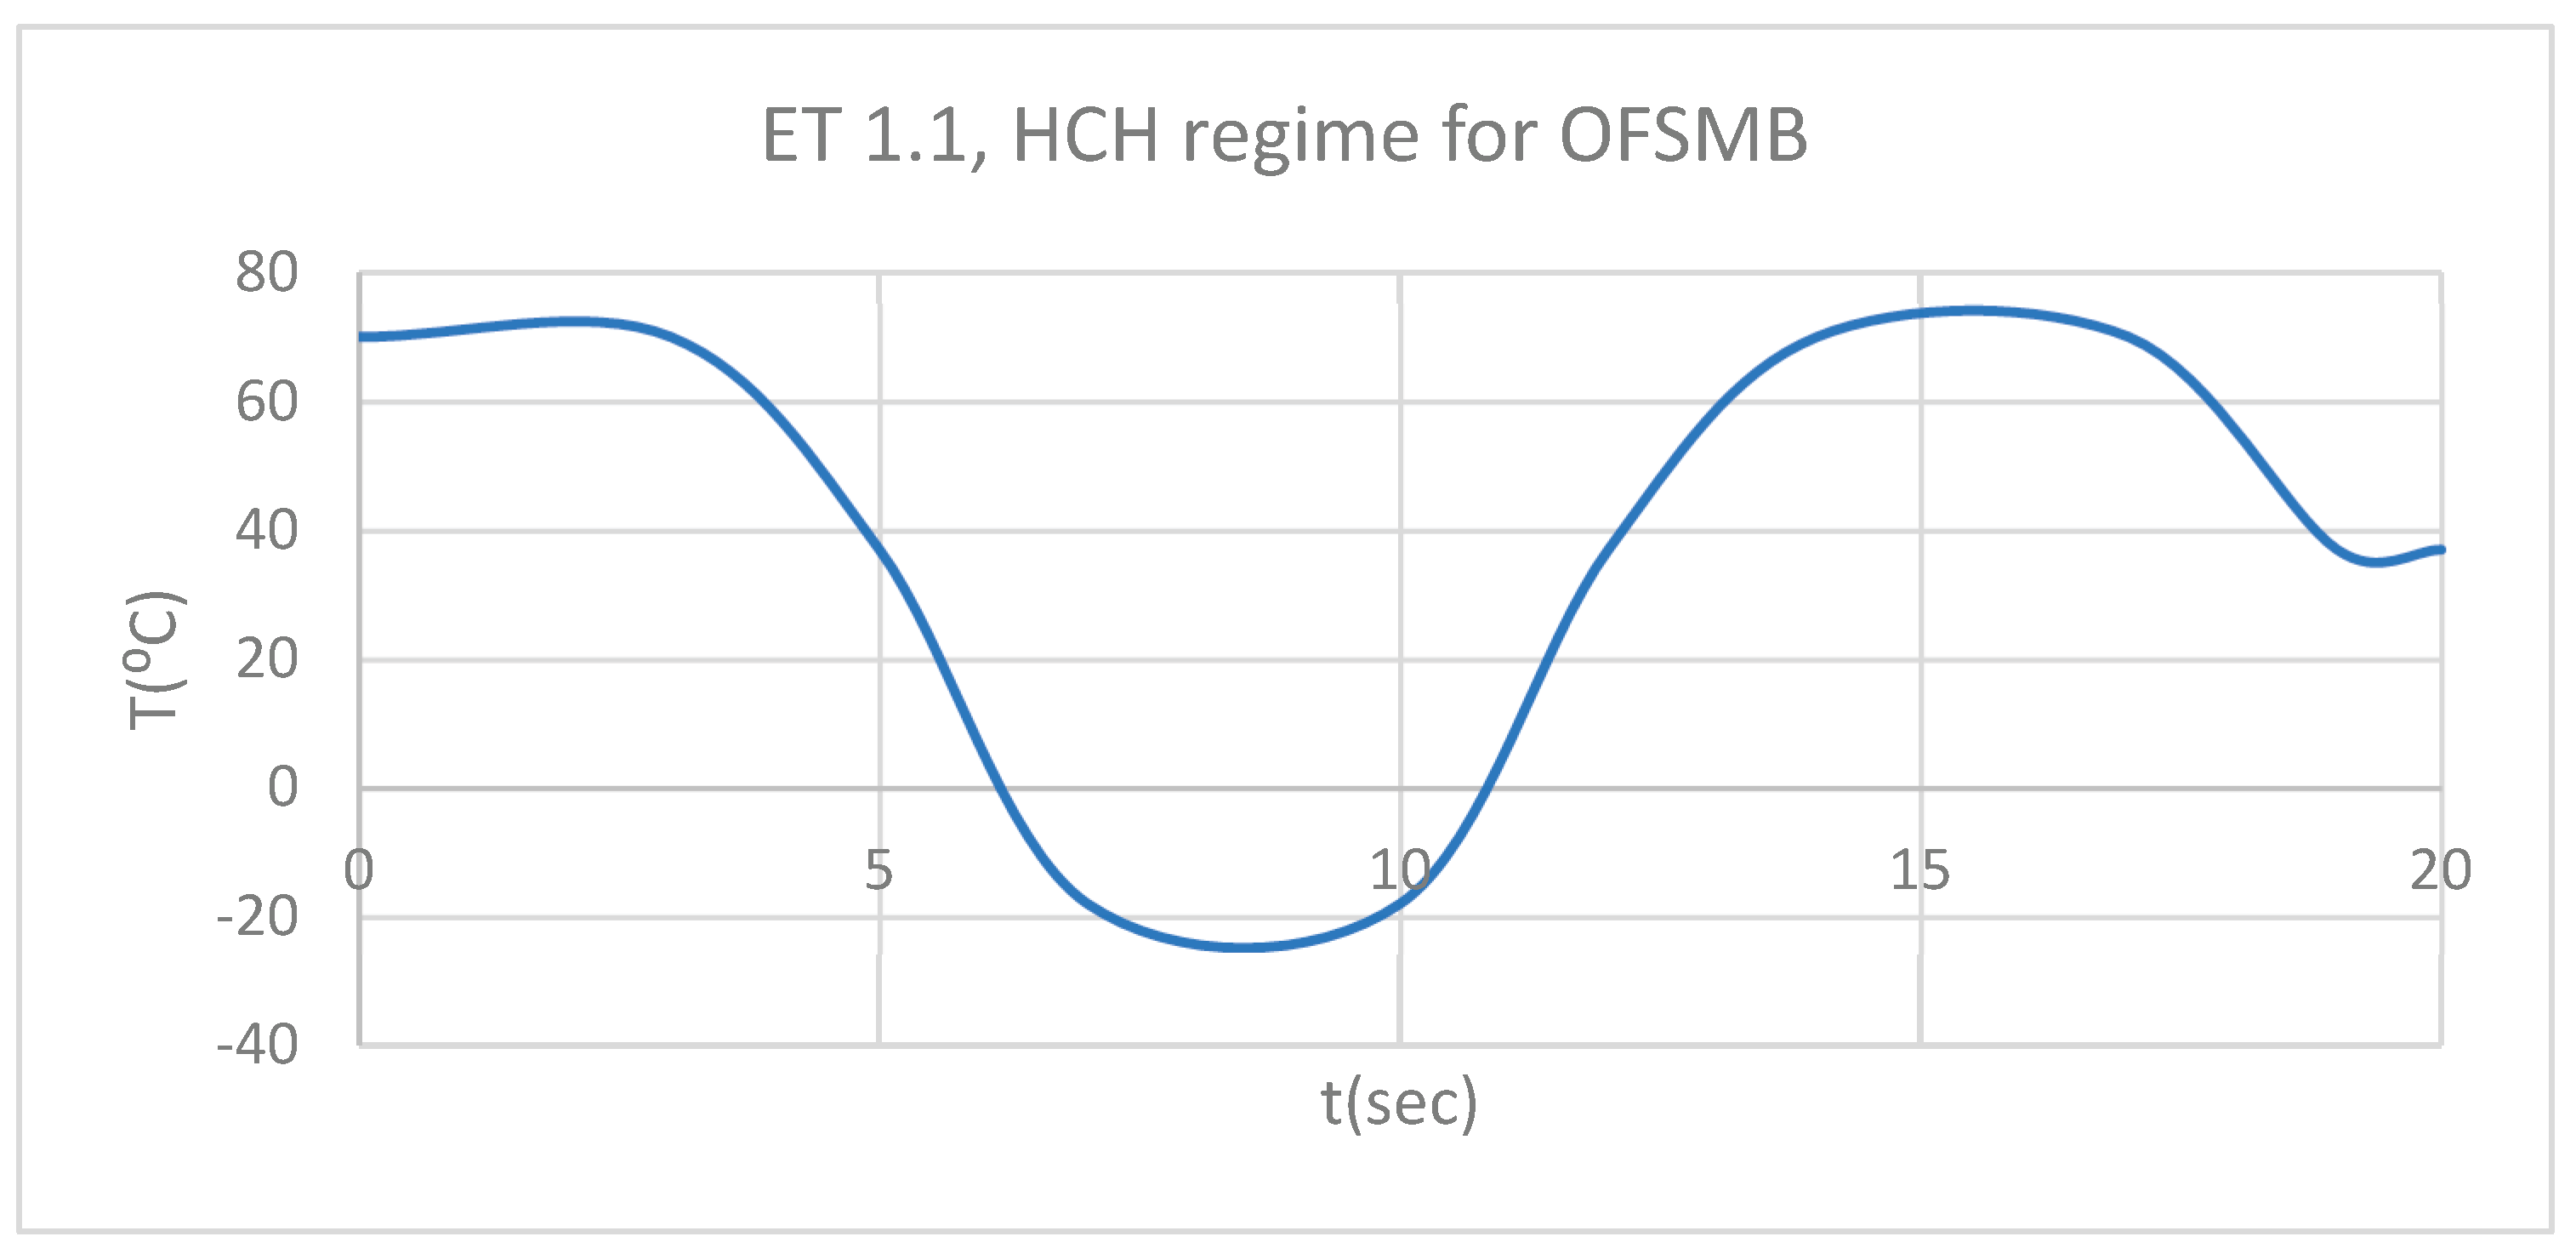
Figure 26.
DT for 1.1 subjected to HCH source.
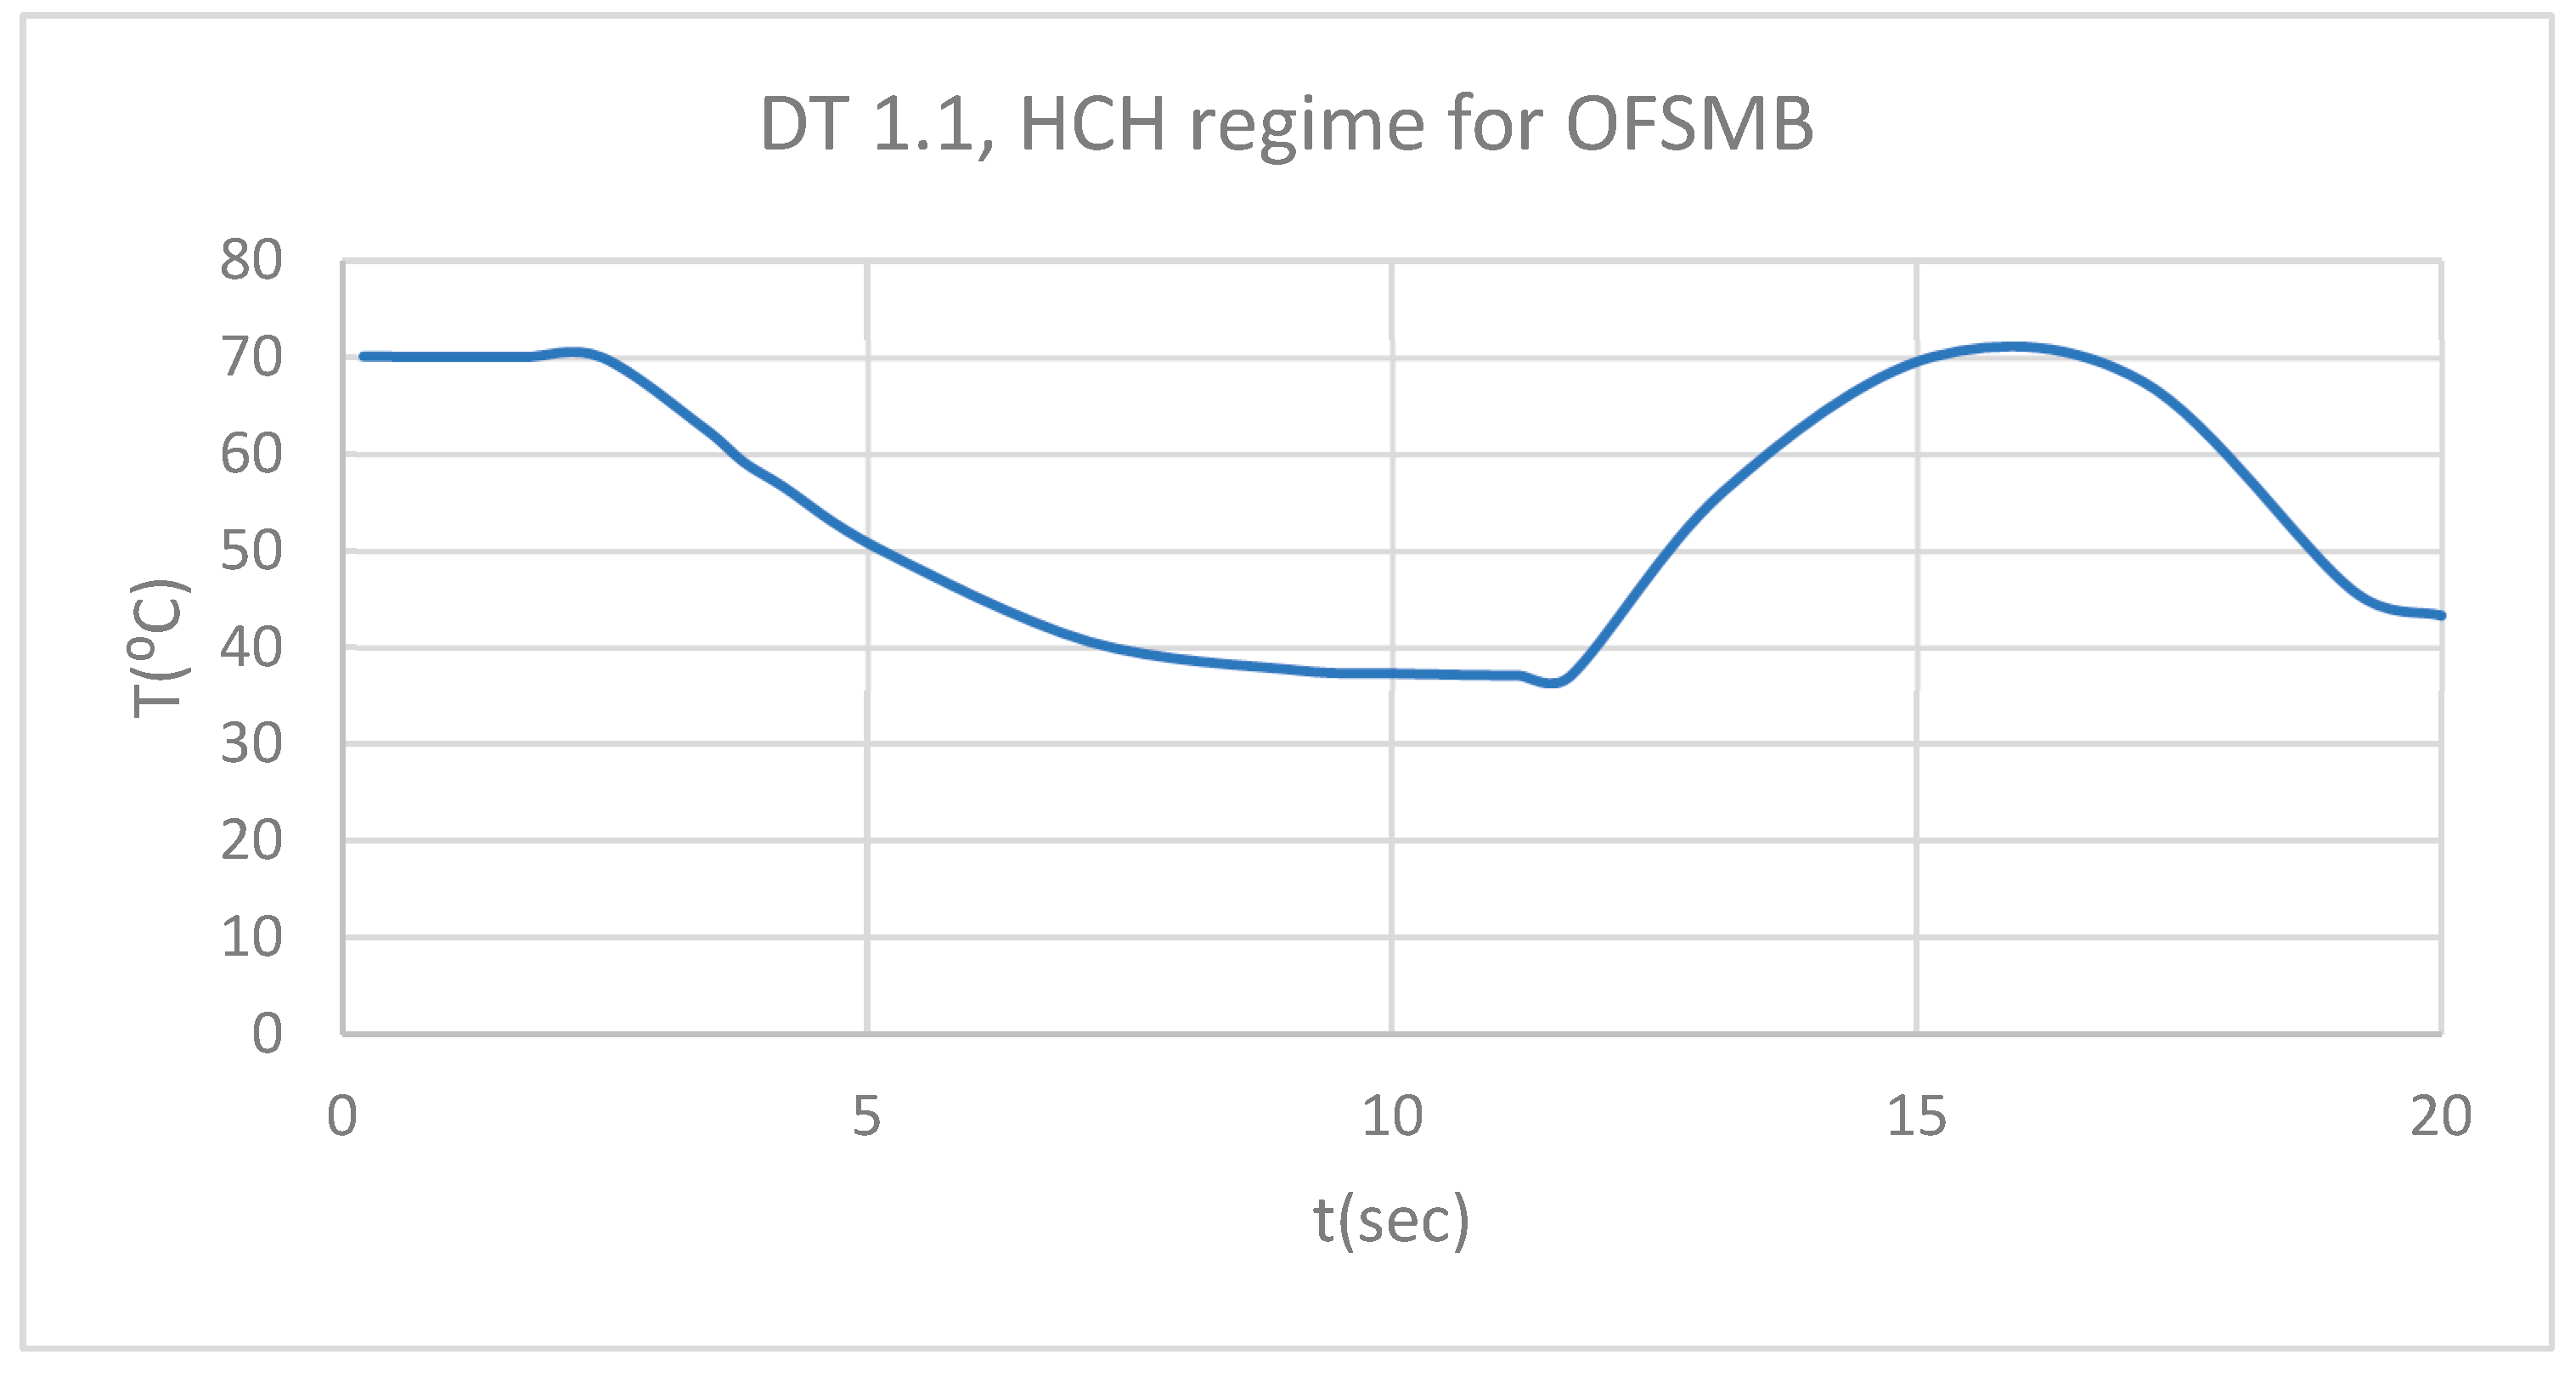
Figure 27.
PT for 1.1 subjected to HCH source.
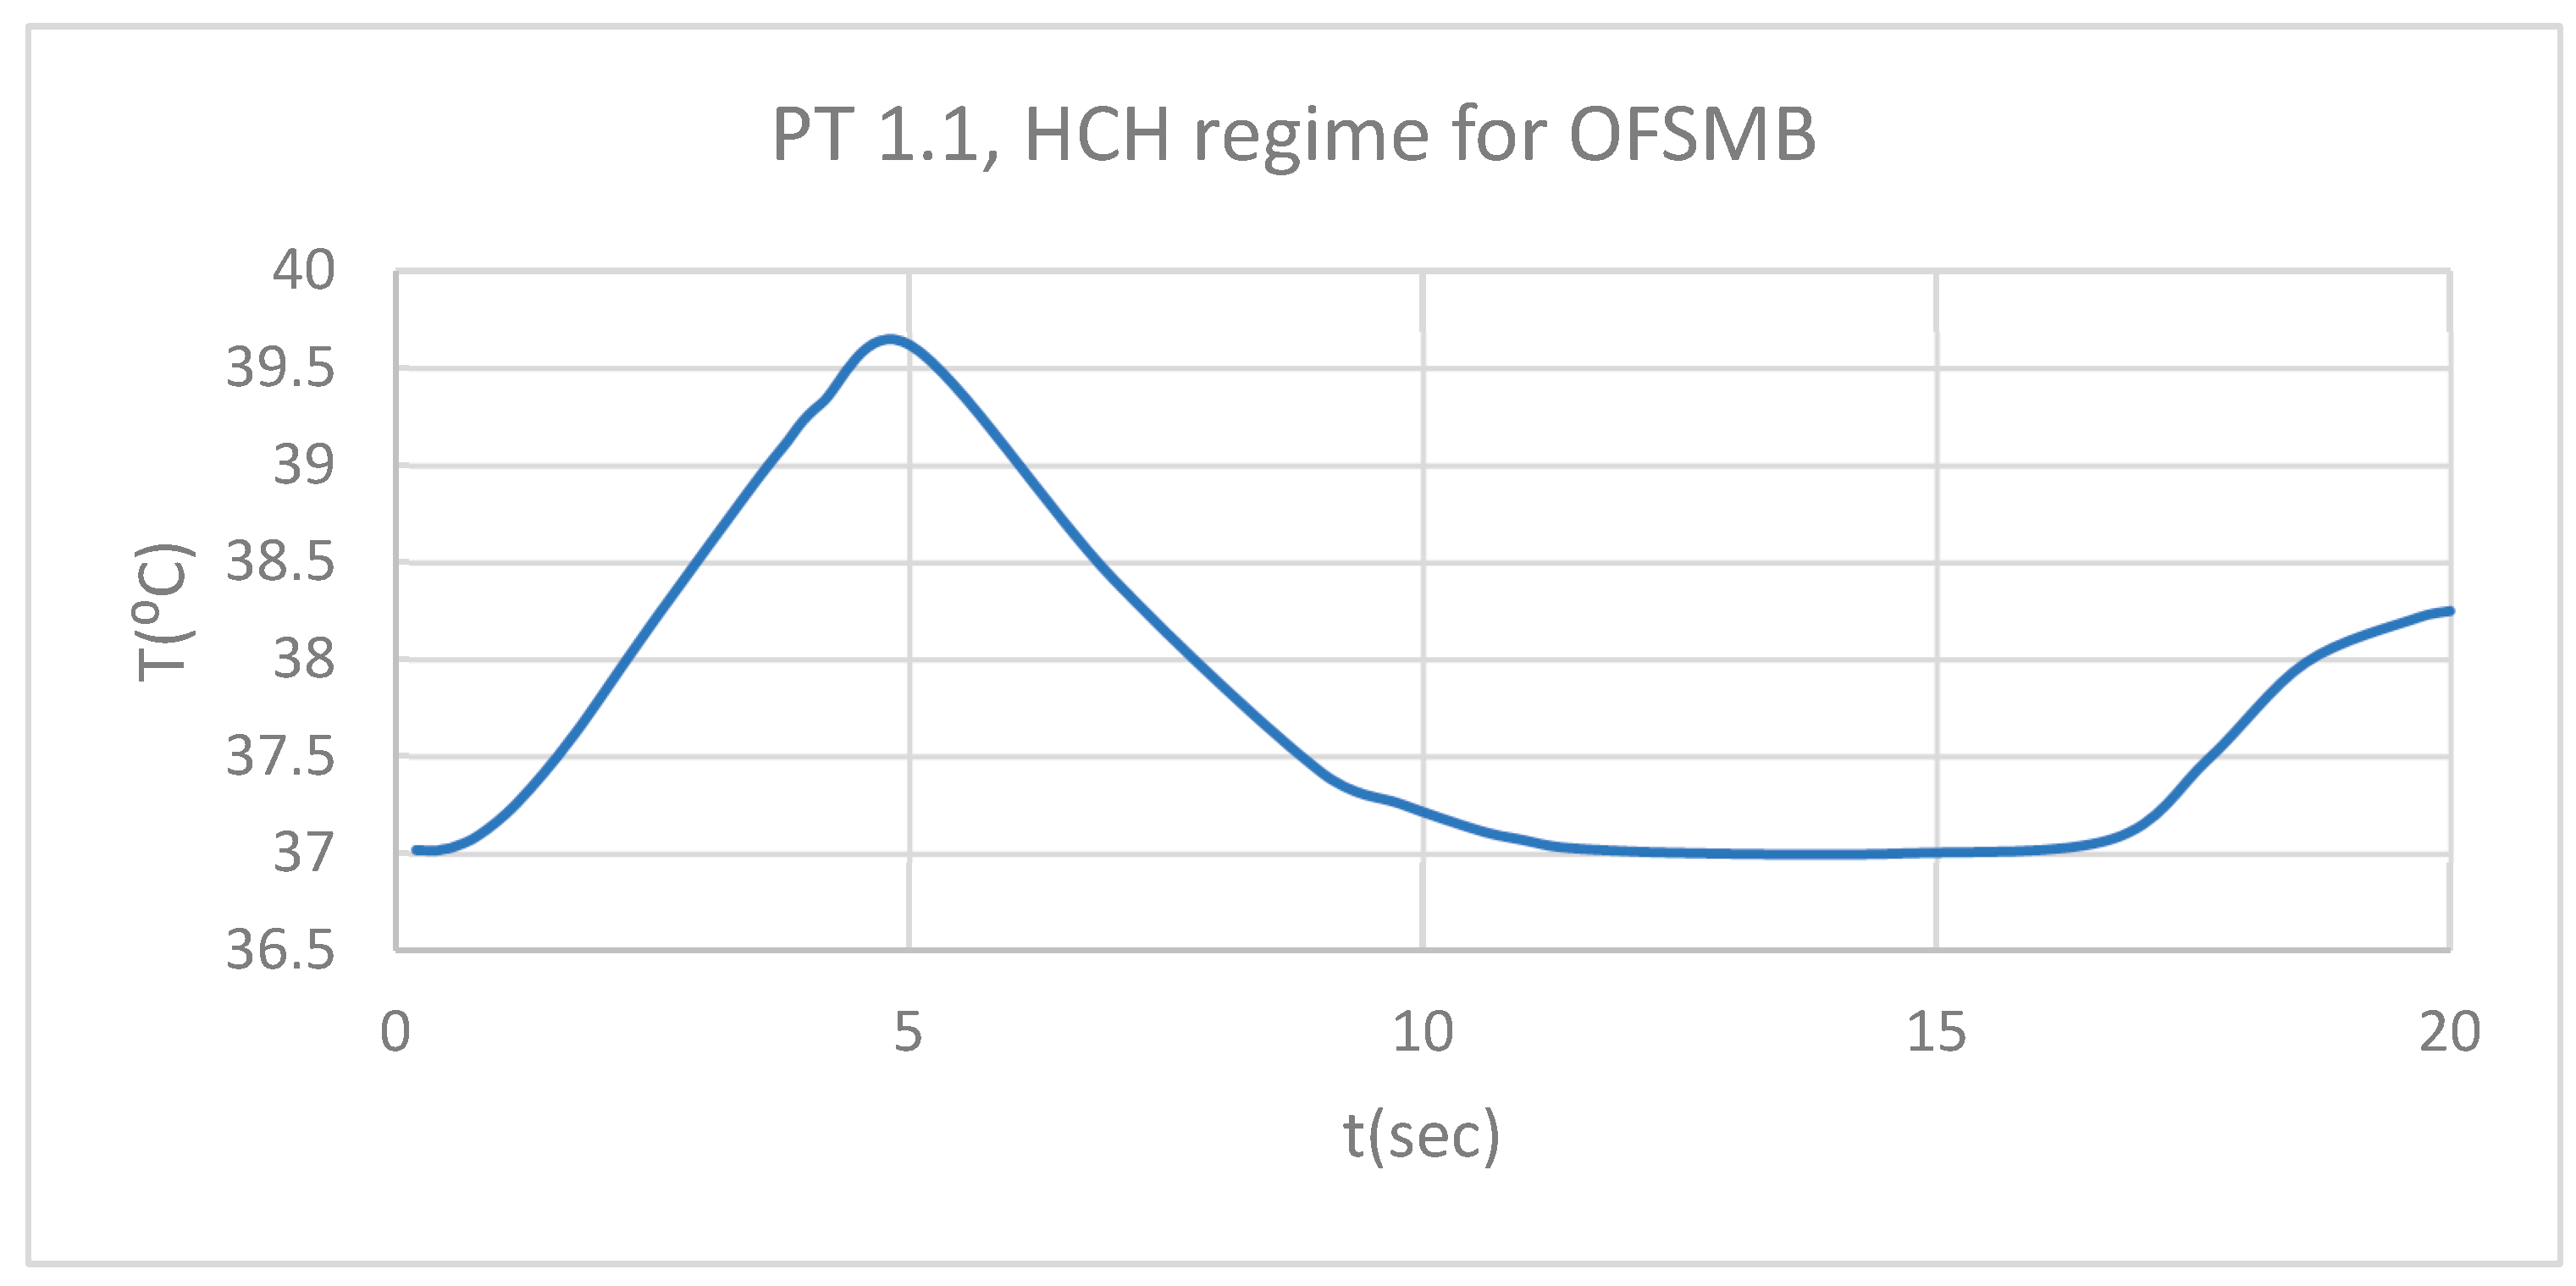
Figure 28.
Comparative diagram of the dental structures temperature for 1.1 subjected to HCH source.
Figure 28.
Comparative diagram of the dental structures temperature for 1.1 subjected to HCH source.
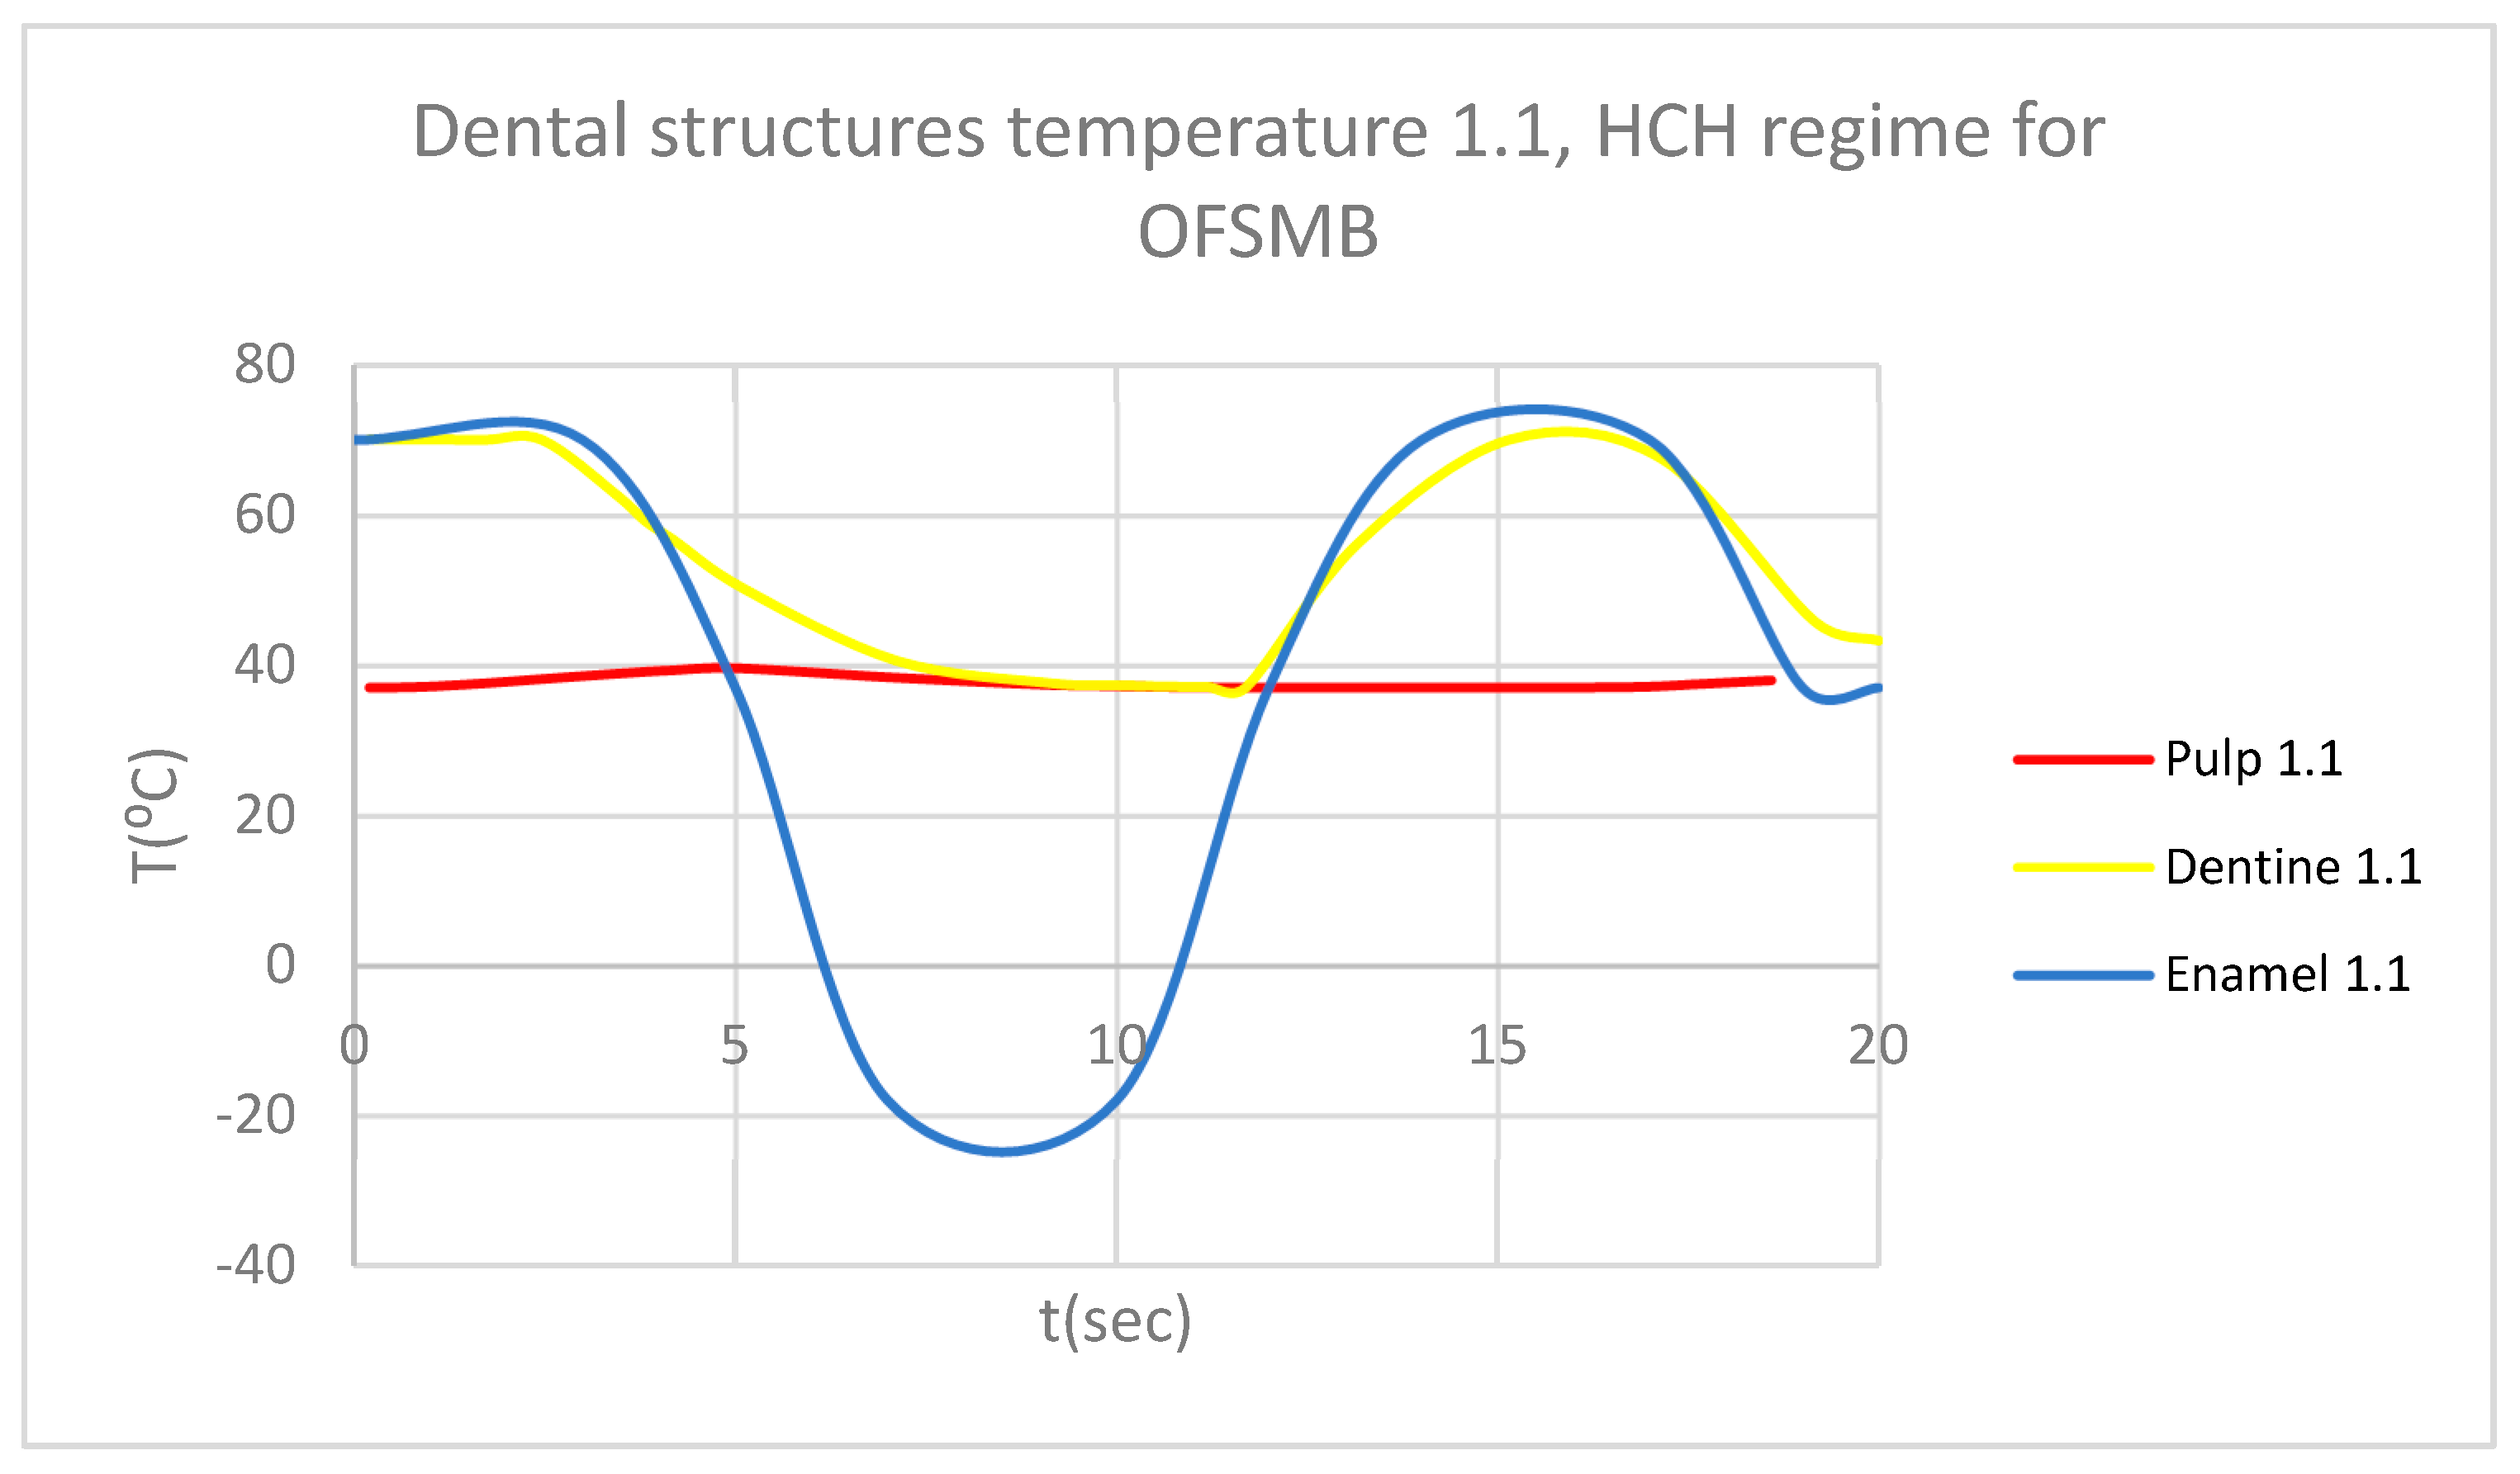
Figure 29.
ET for 4.1 subjected to HCH source.
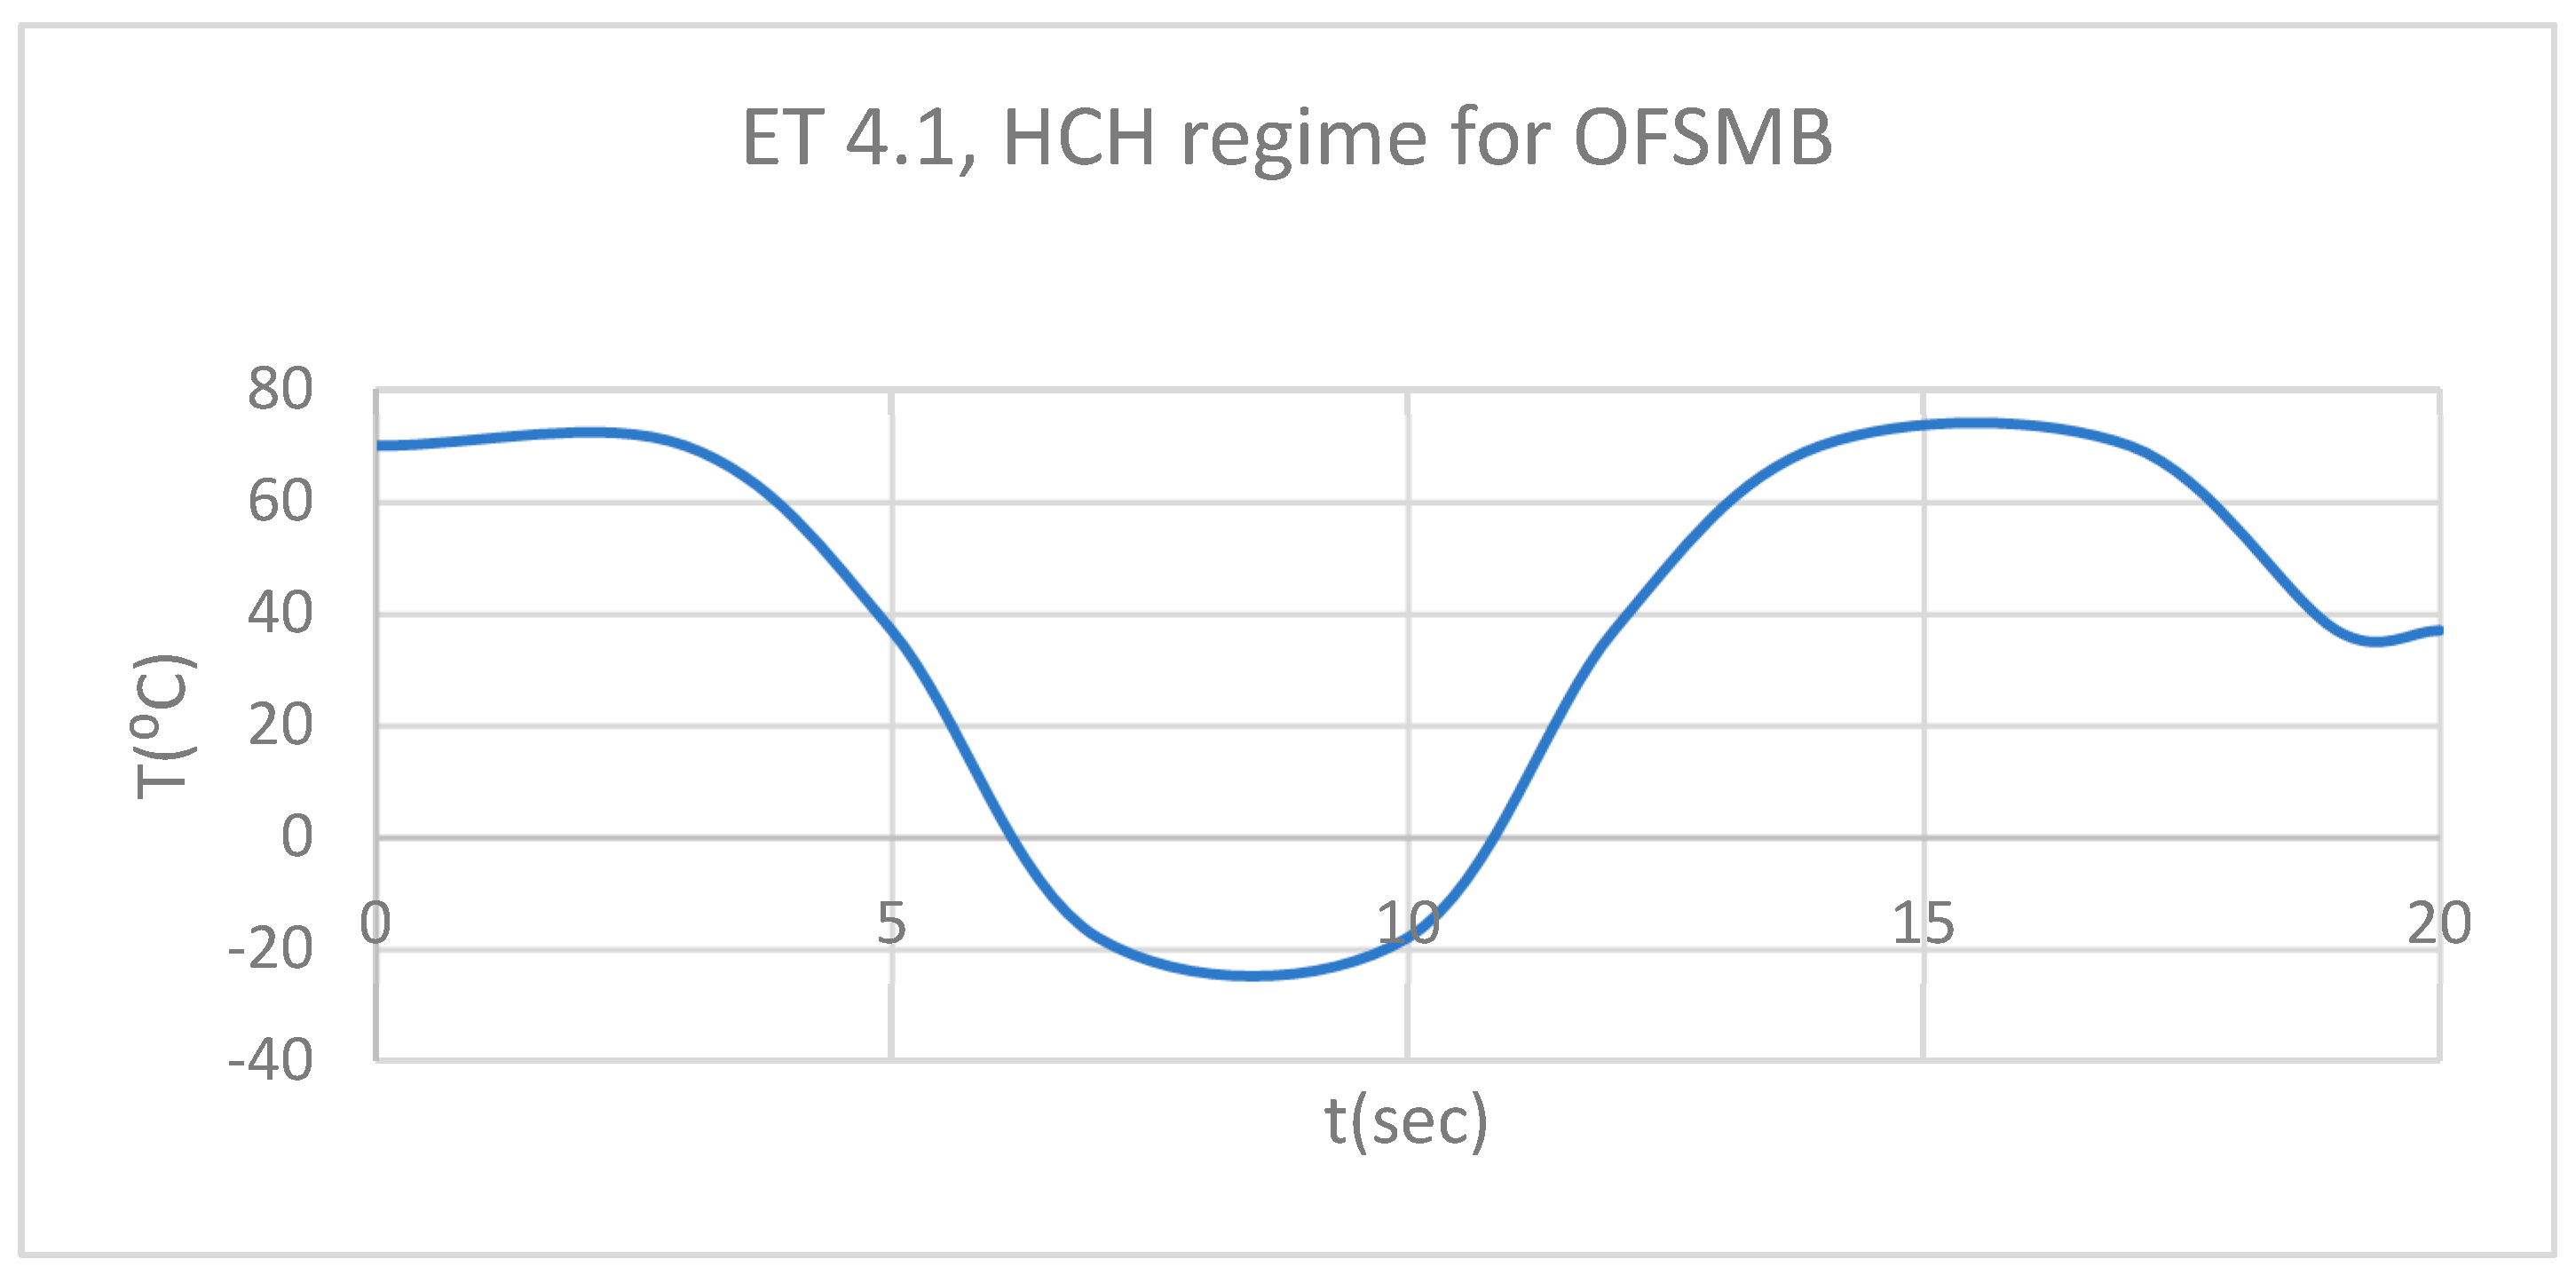
Figure 30.
DT for 4.1 subjected to HCH source.
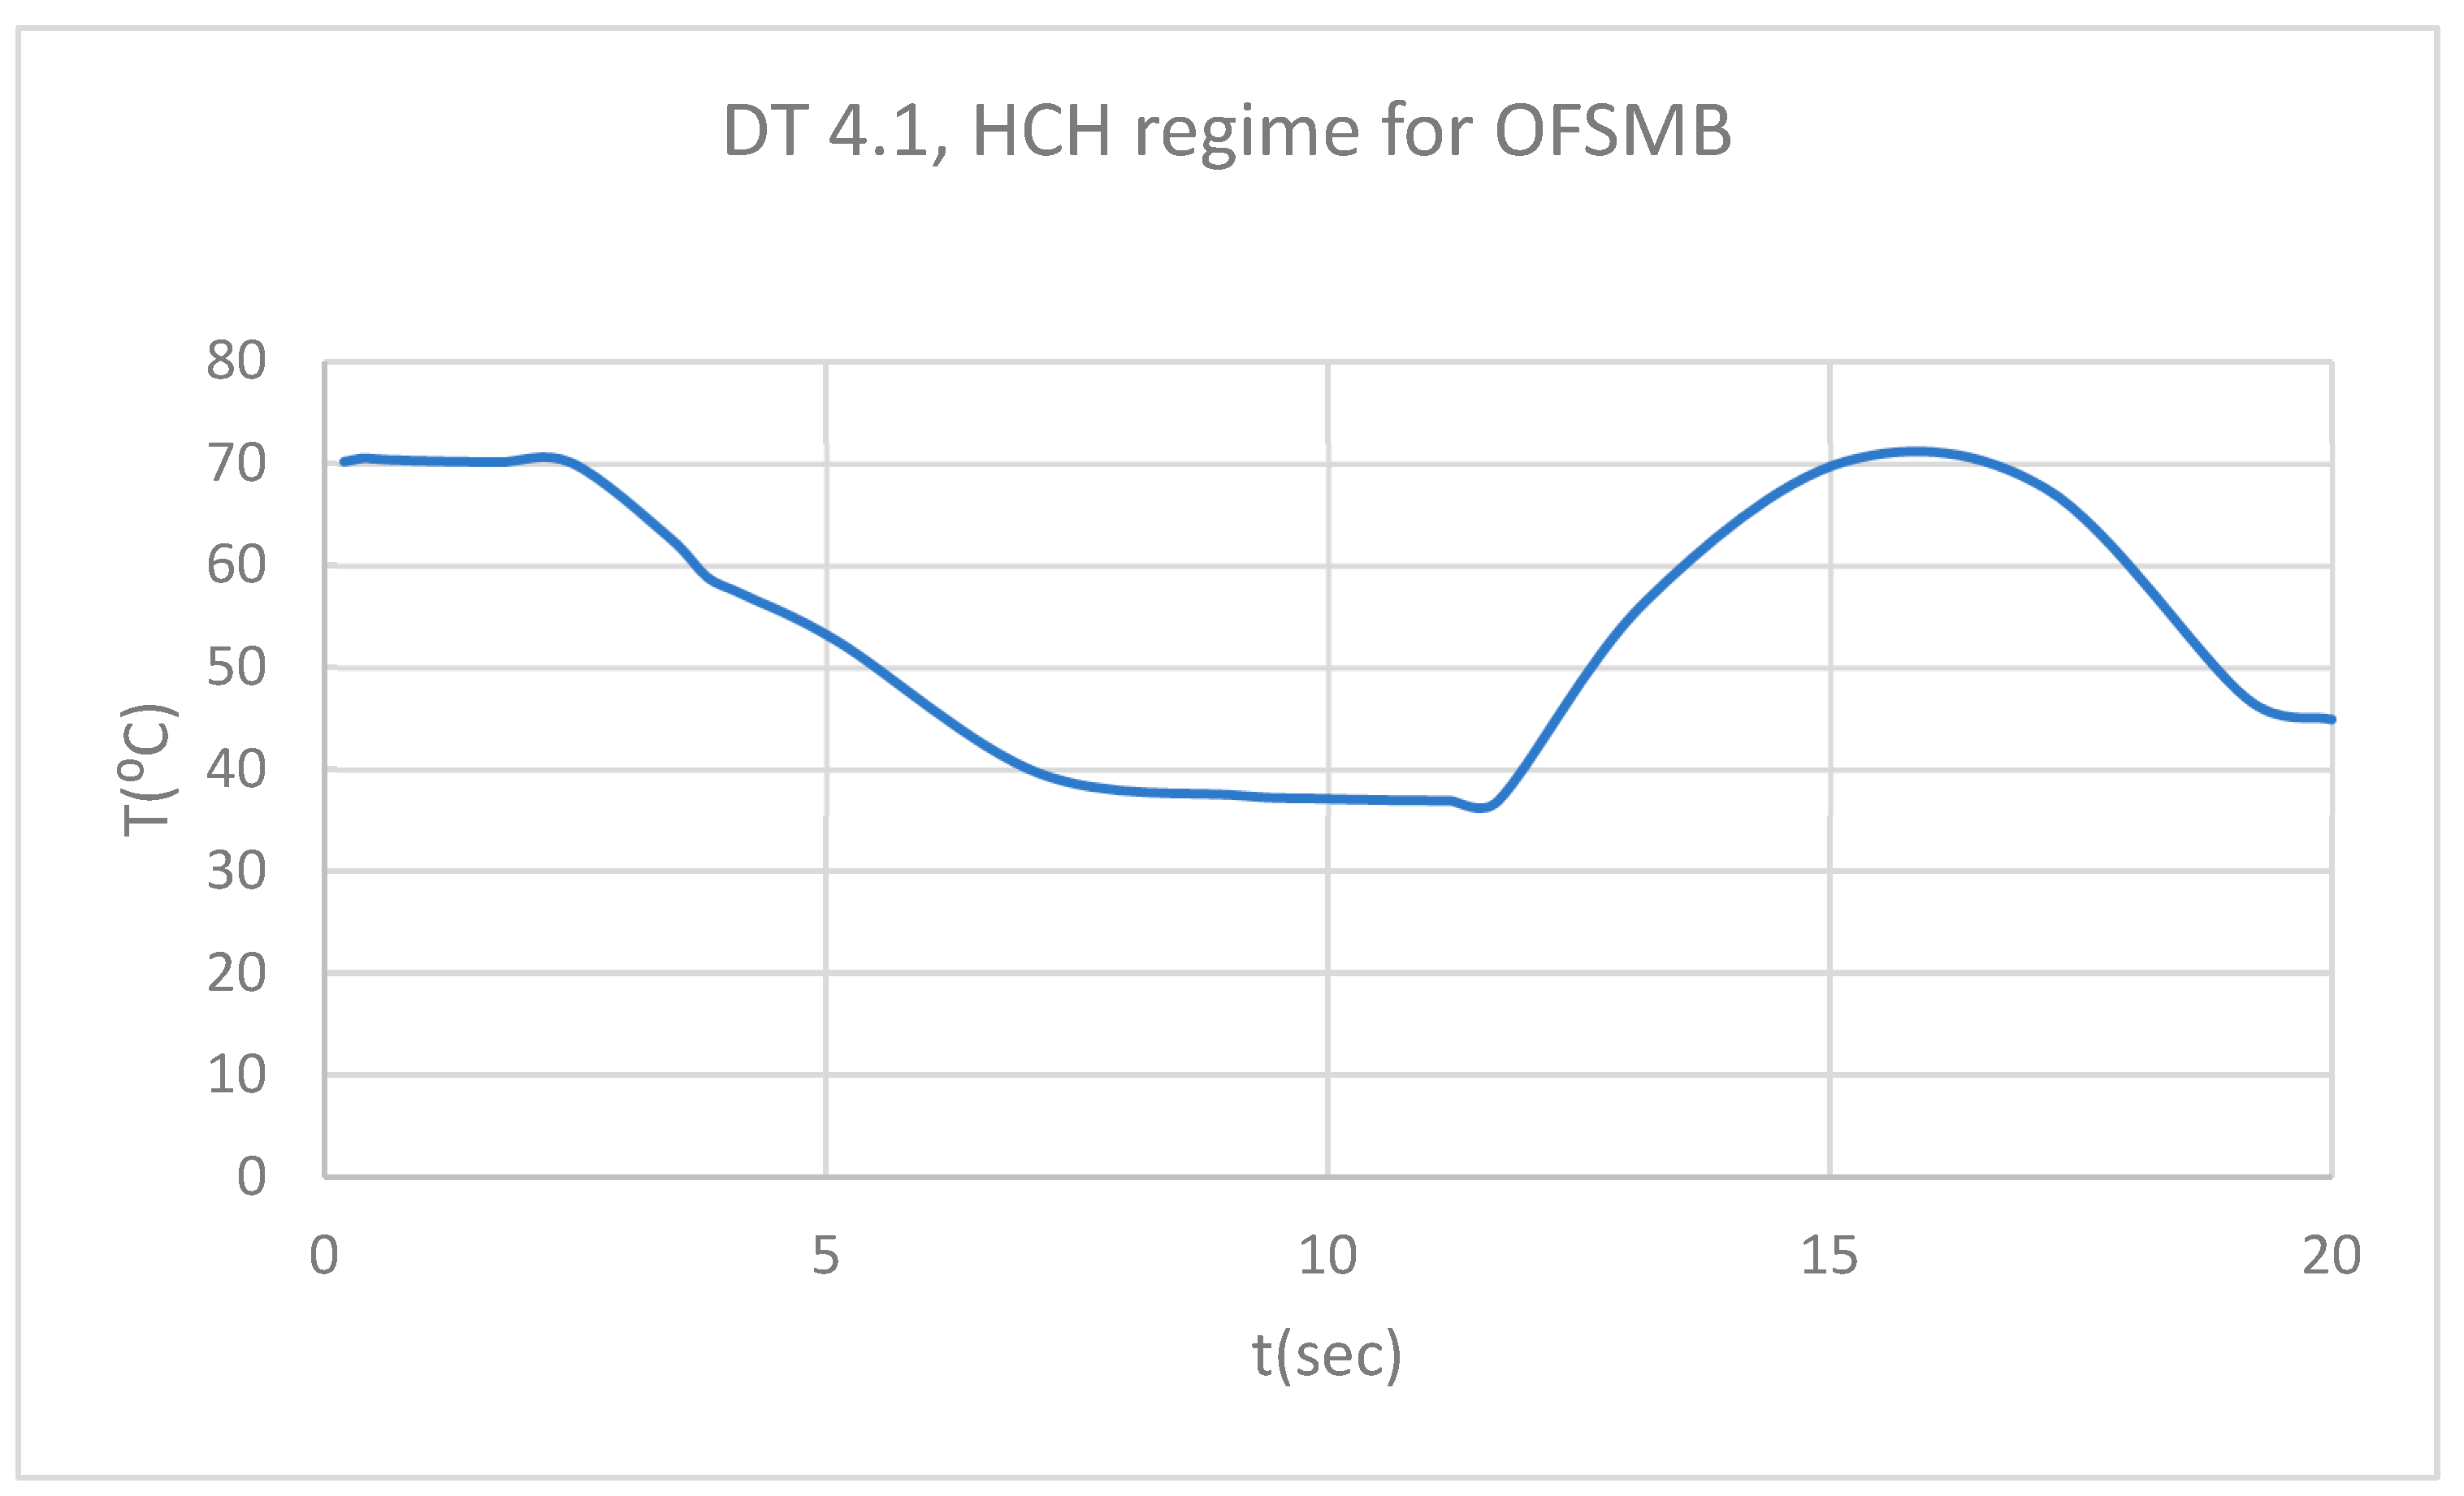
Figure 31.
PT for 4.1 subjected to HCH source.
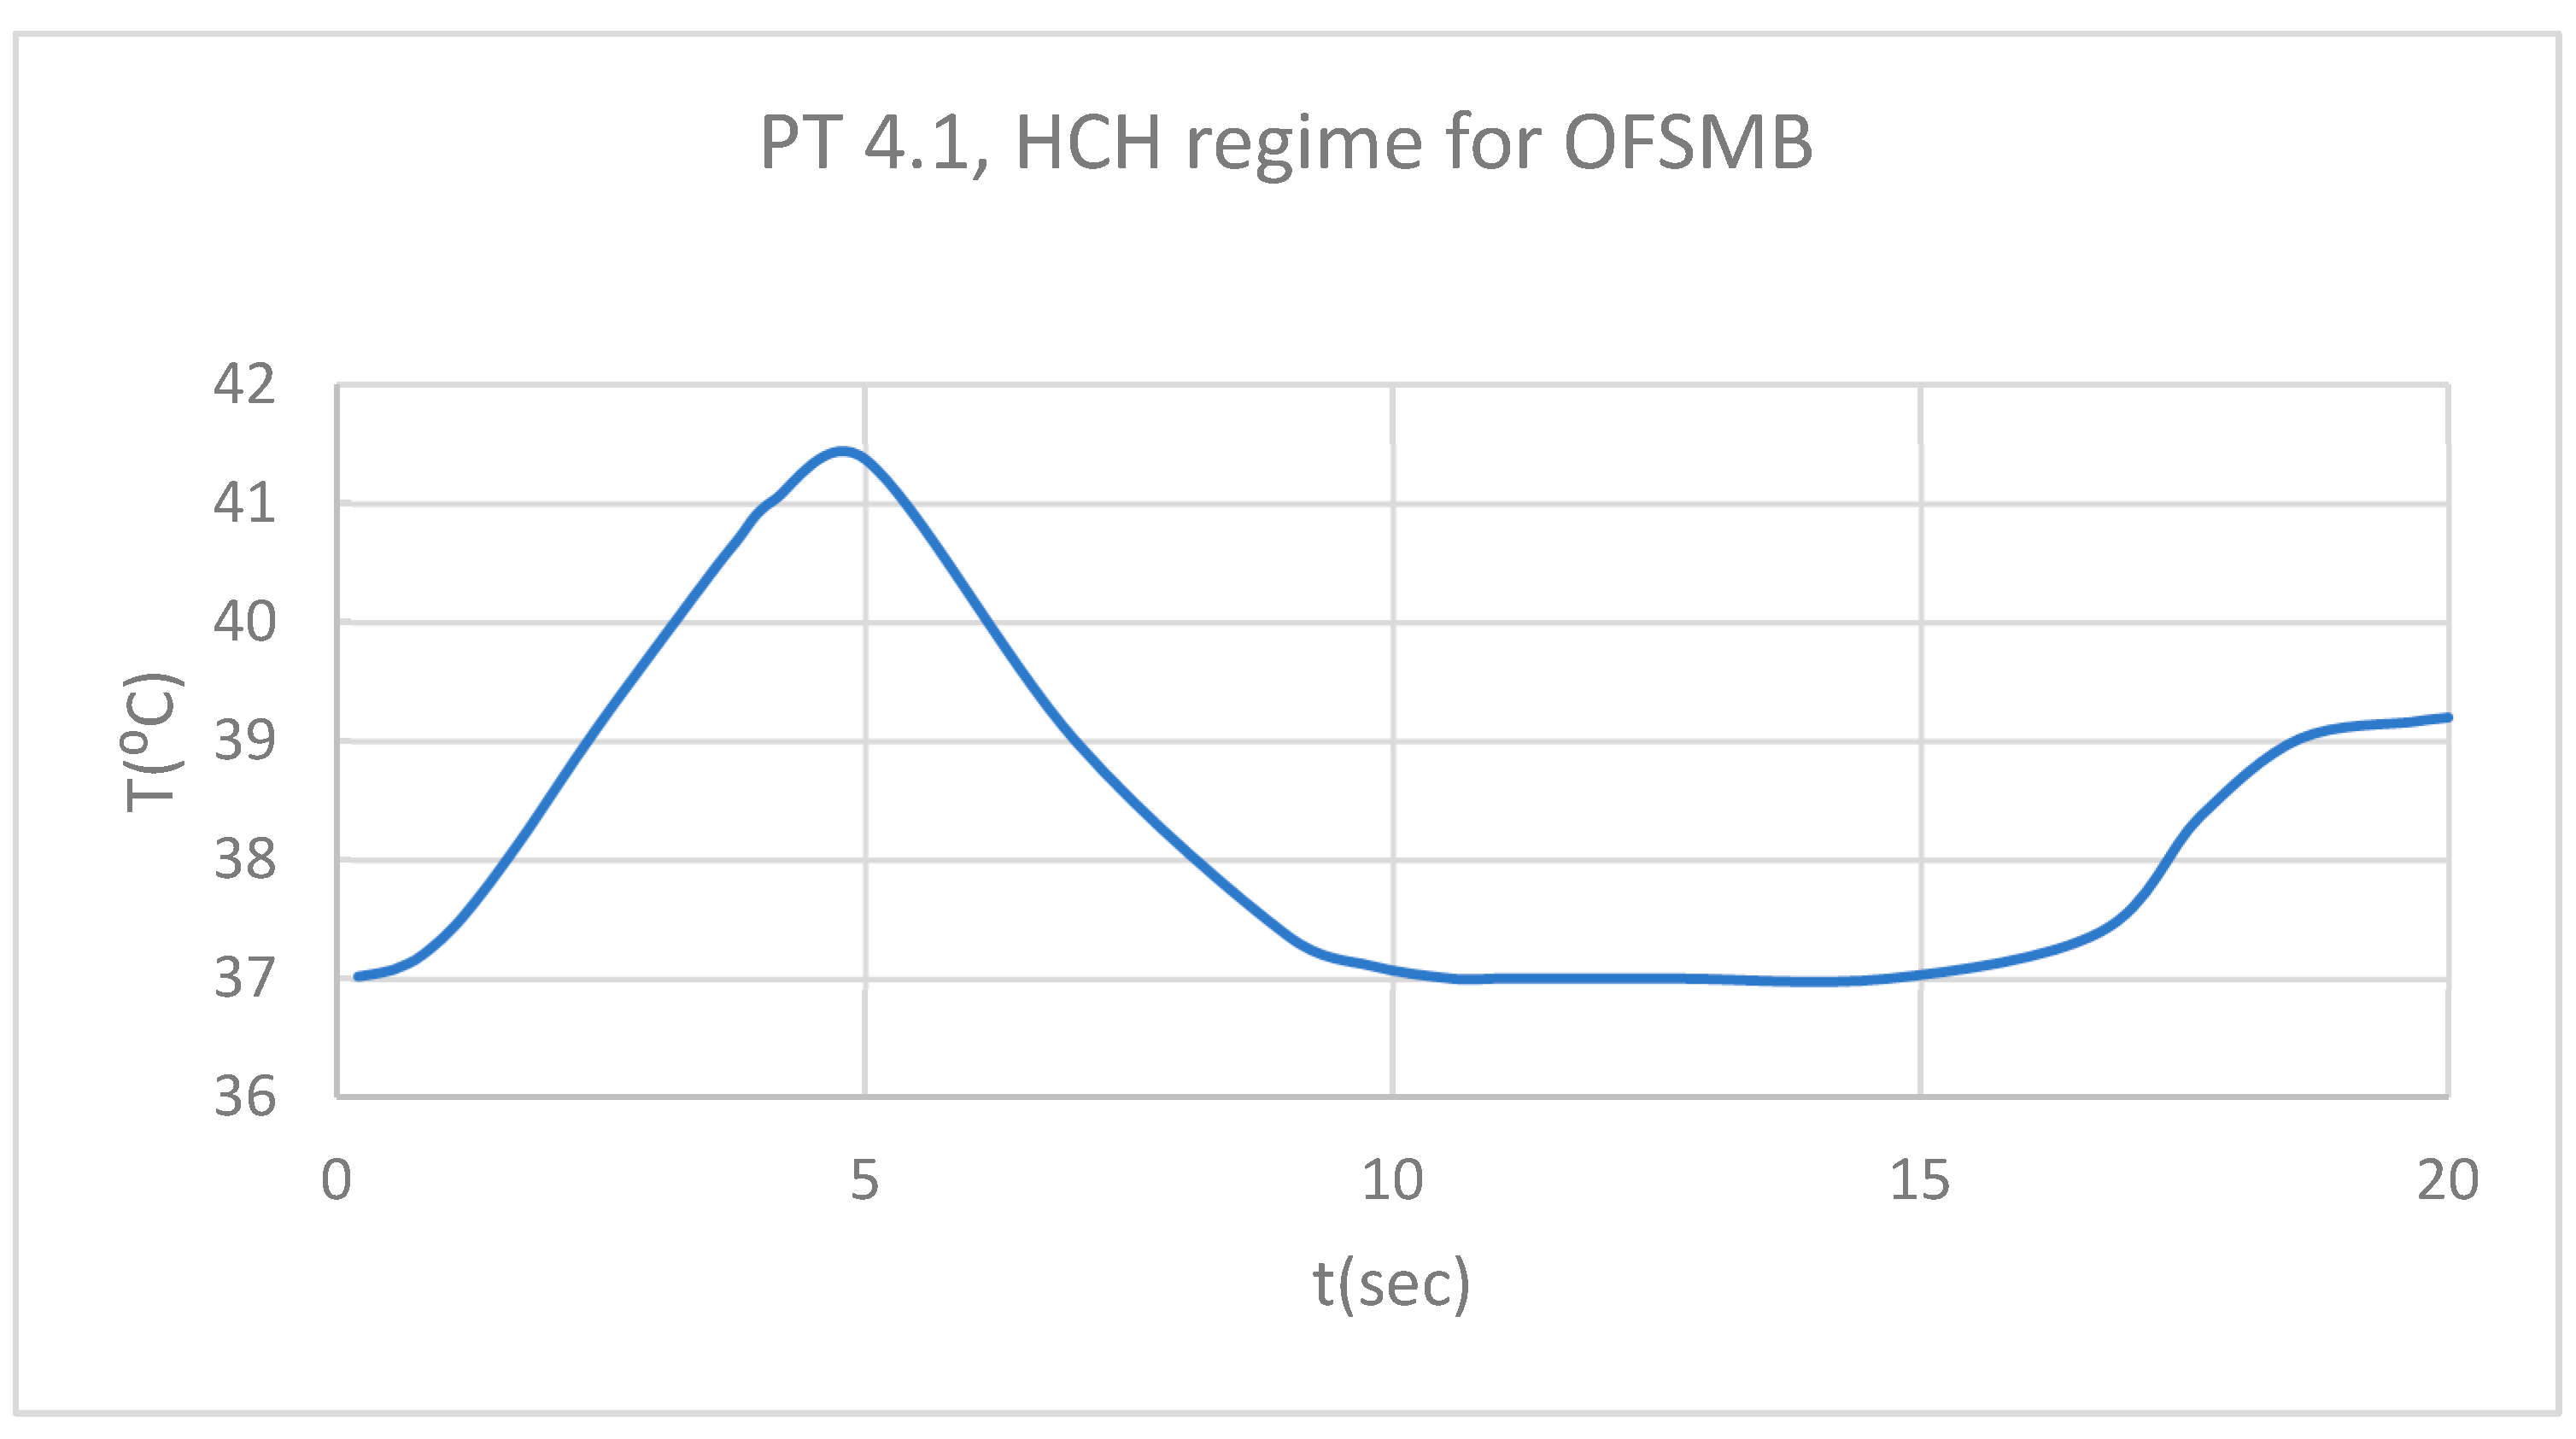
Figure 32.
Comparative diagram of the dental structures temperature for 4.1 subjected to HCH source.
Figure 32.
Comparative diagram of the dental structures temperature for 4.1 subjected to HCH source.
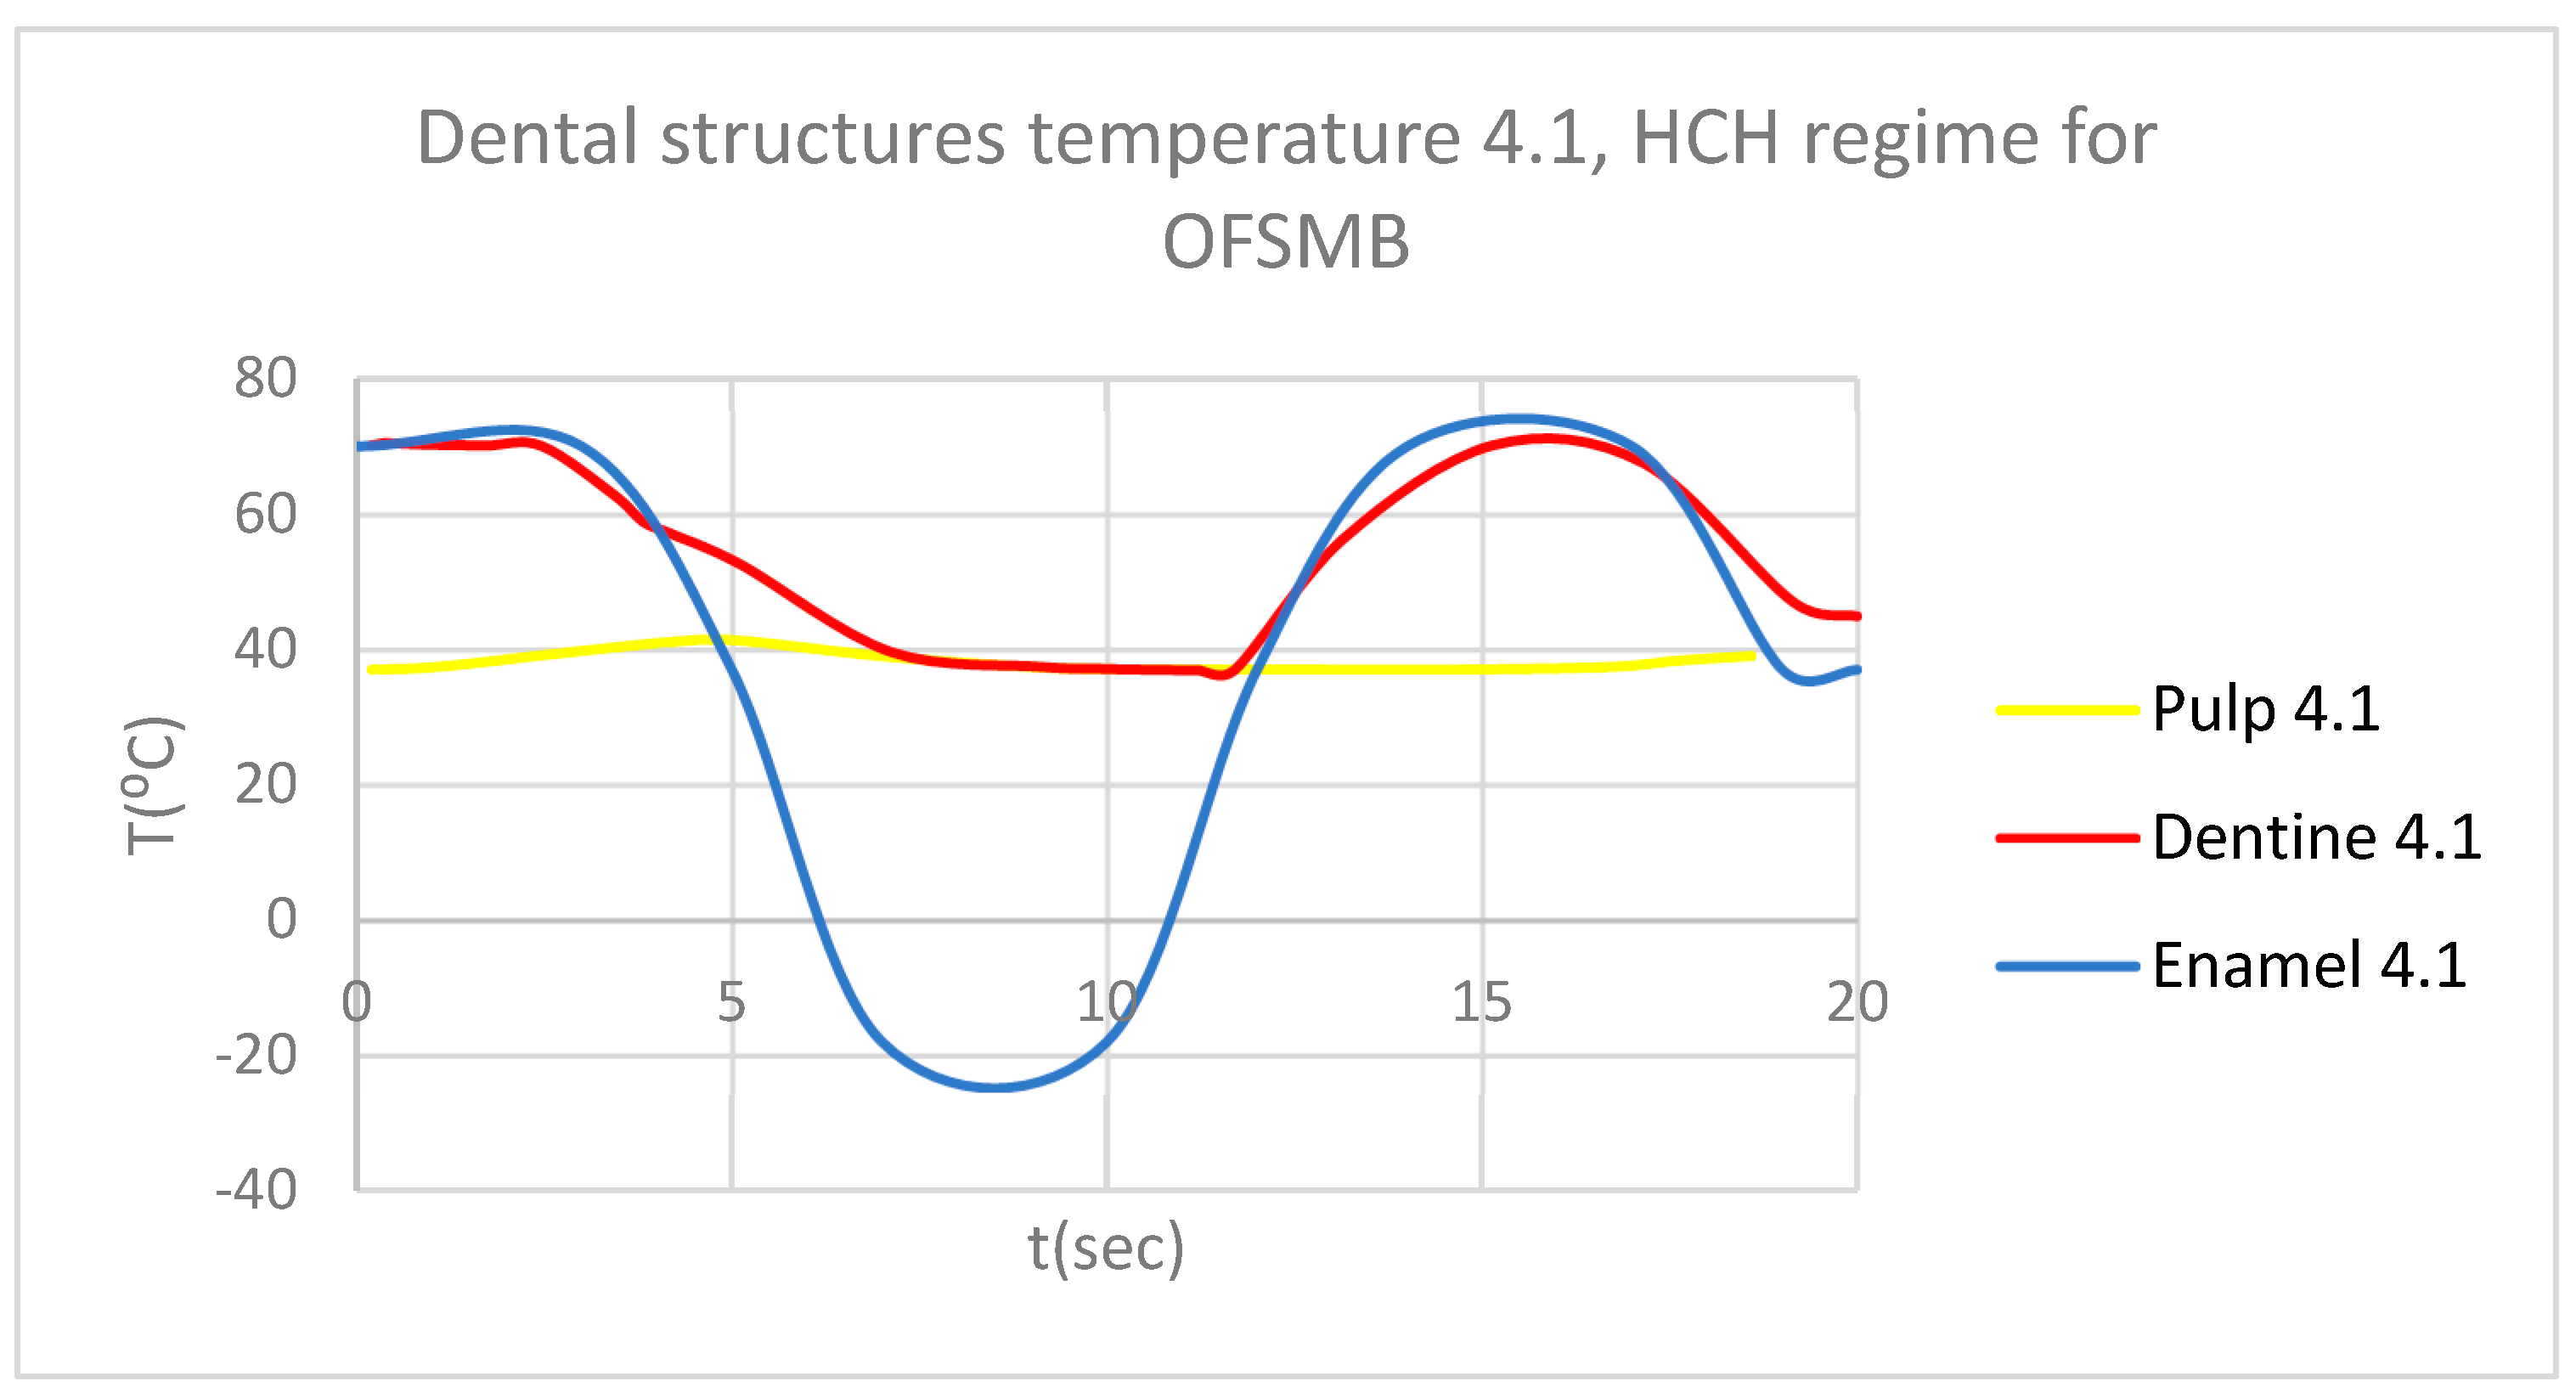
Figure 33.
Comparative diagram of the dental structures temperature for 1.1 and 4.1 subjected to HCH source.
Figure 33.
Comparative diagram of the dental structures temperature for 1.1 and 4.1 subjected to HCH source.
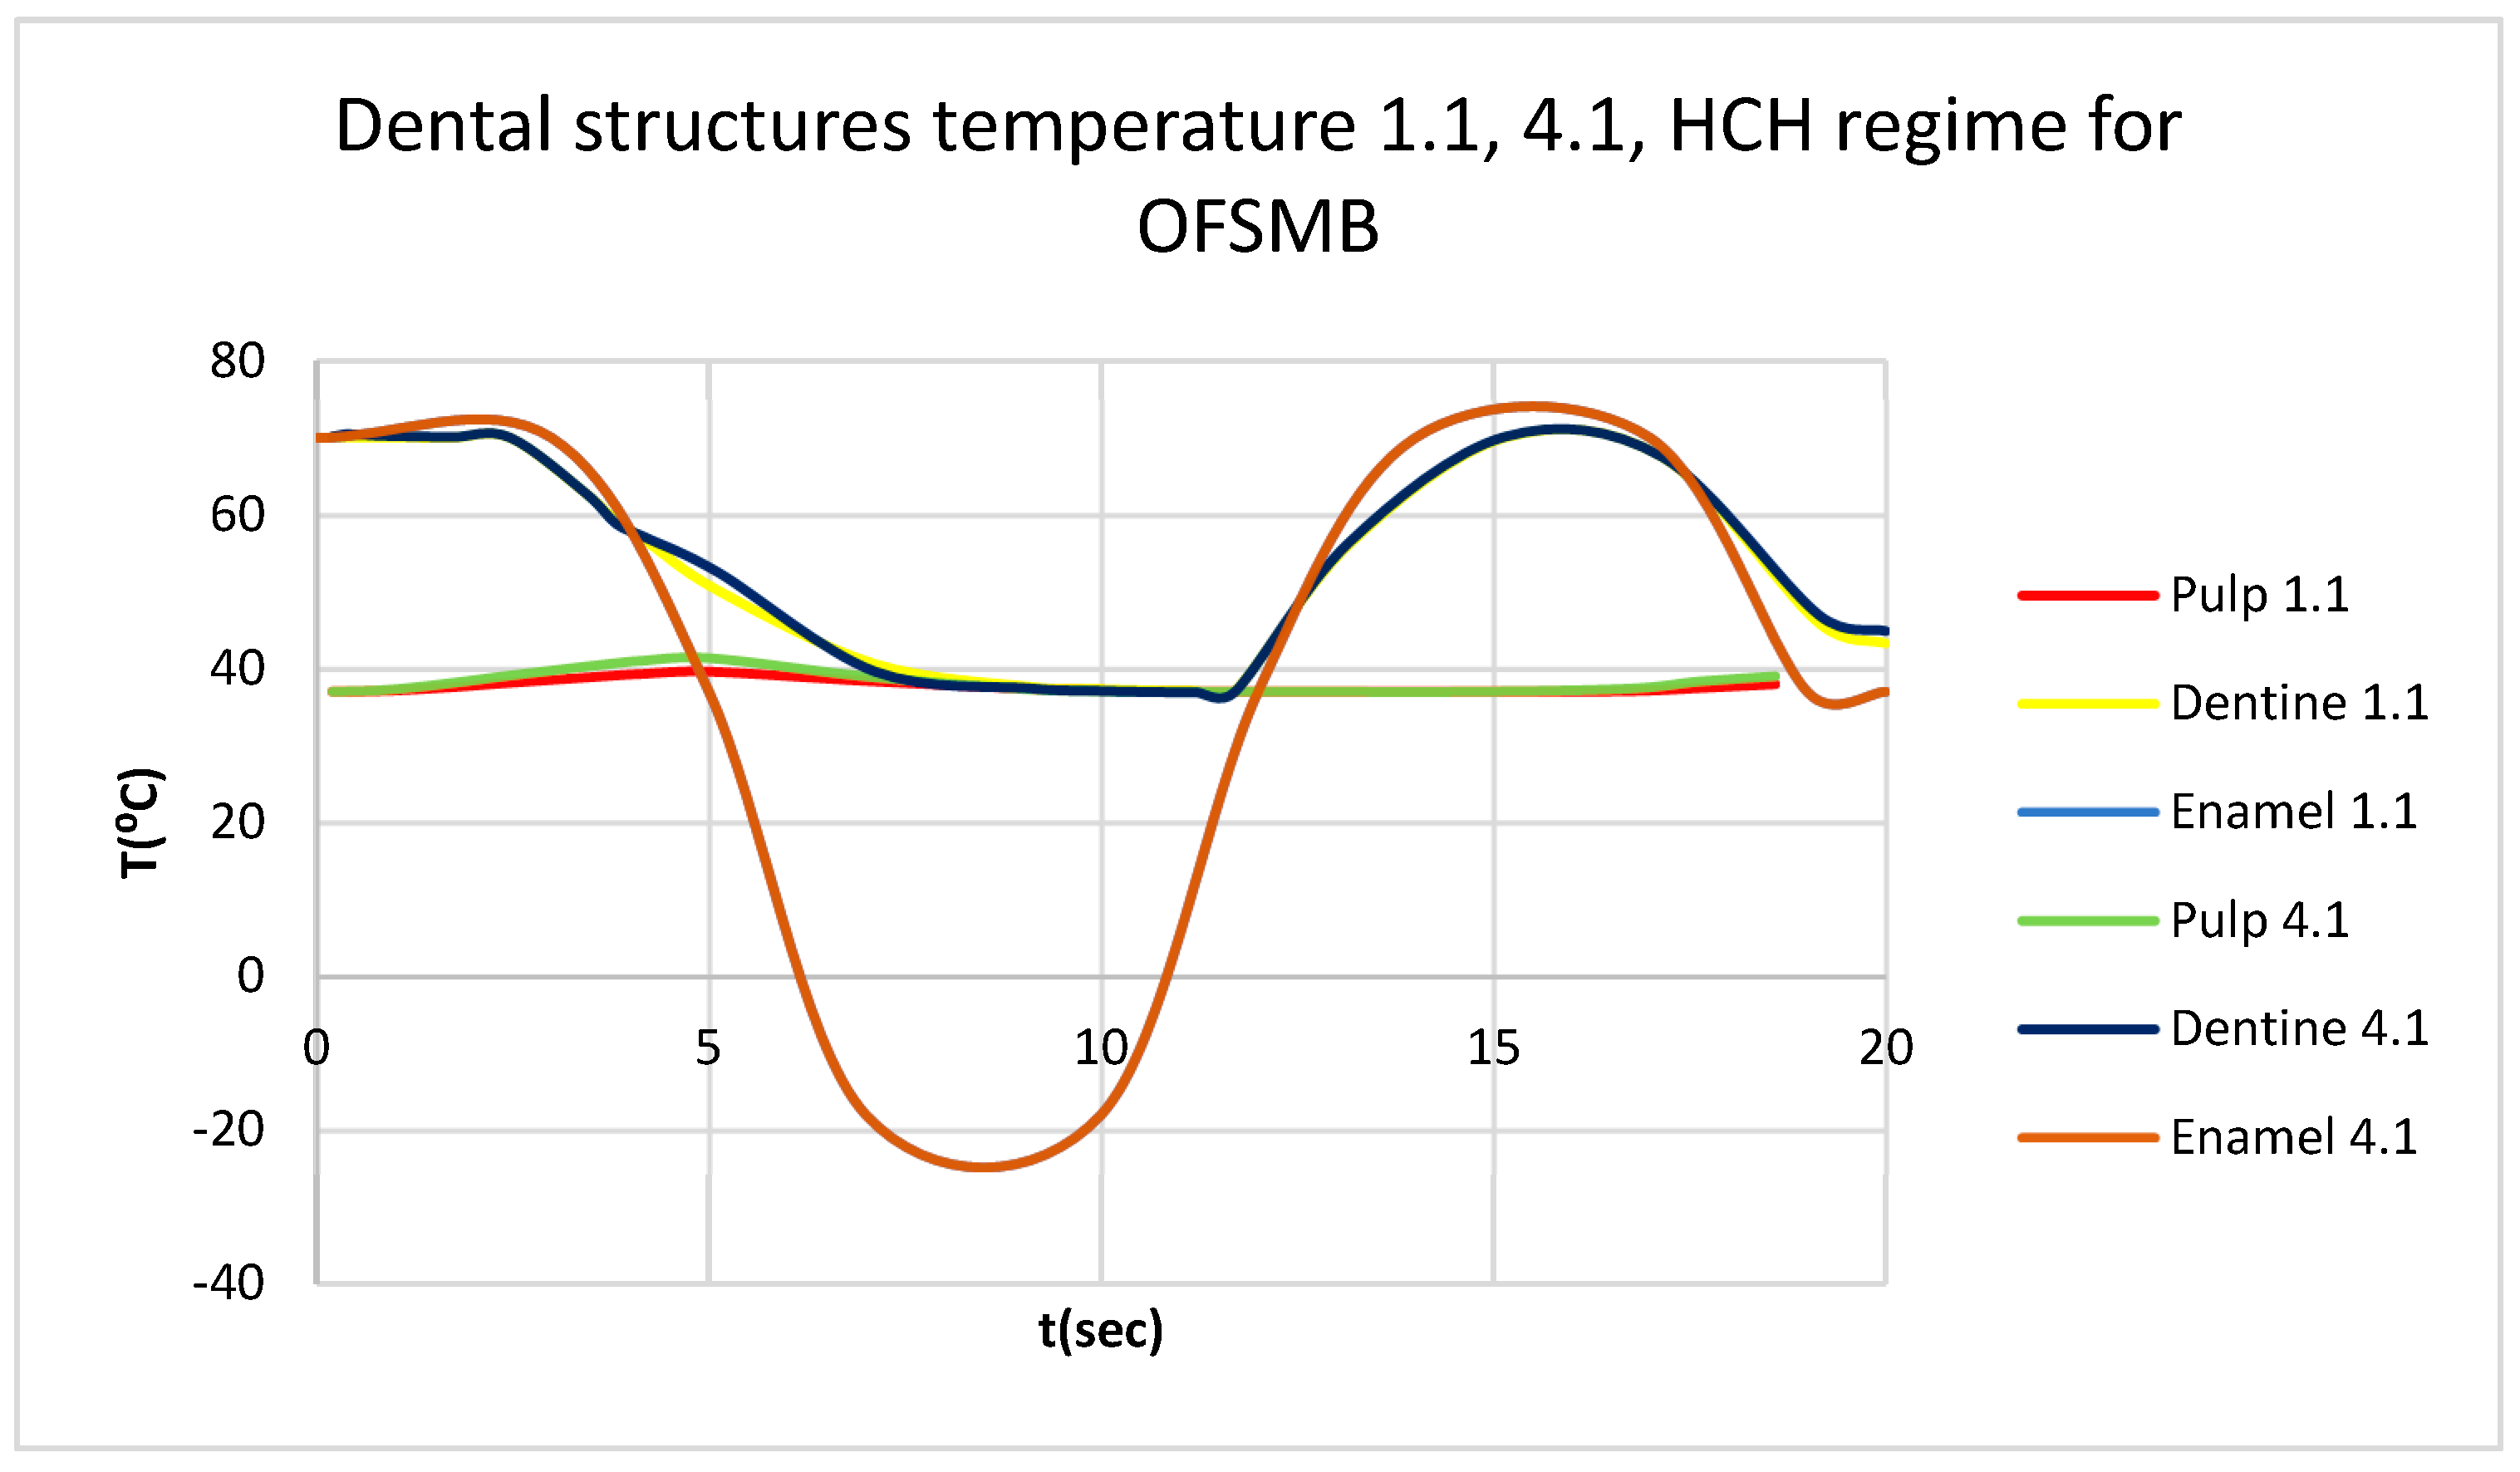
Figure 34.
Thermal map.
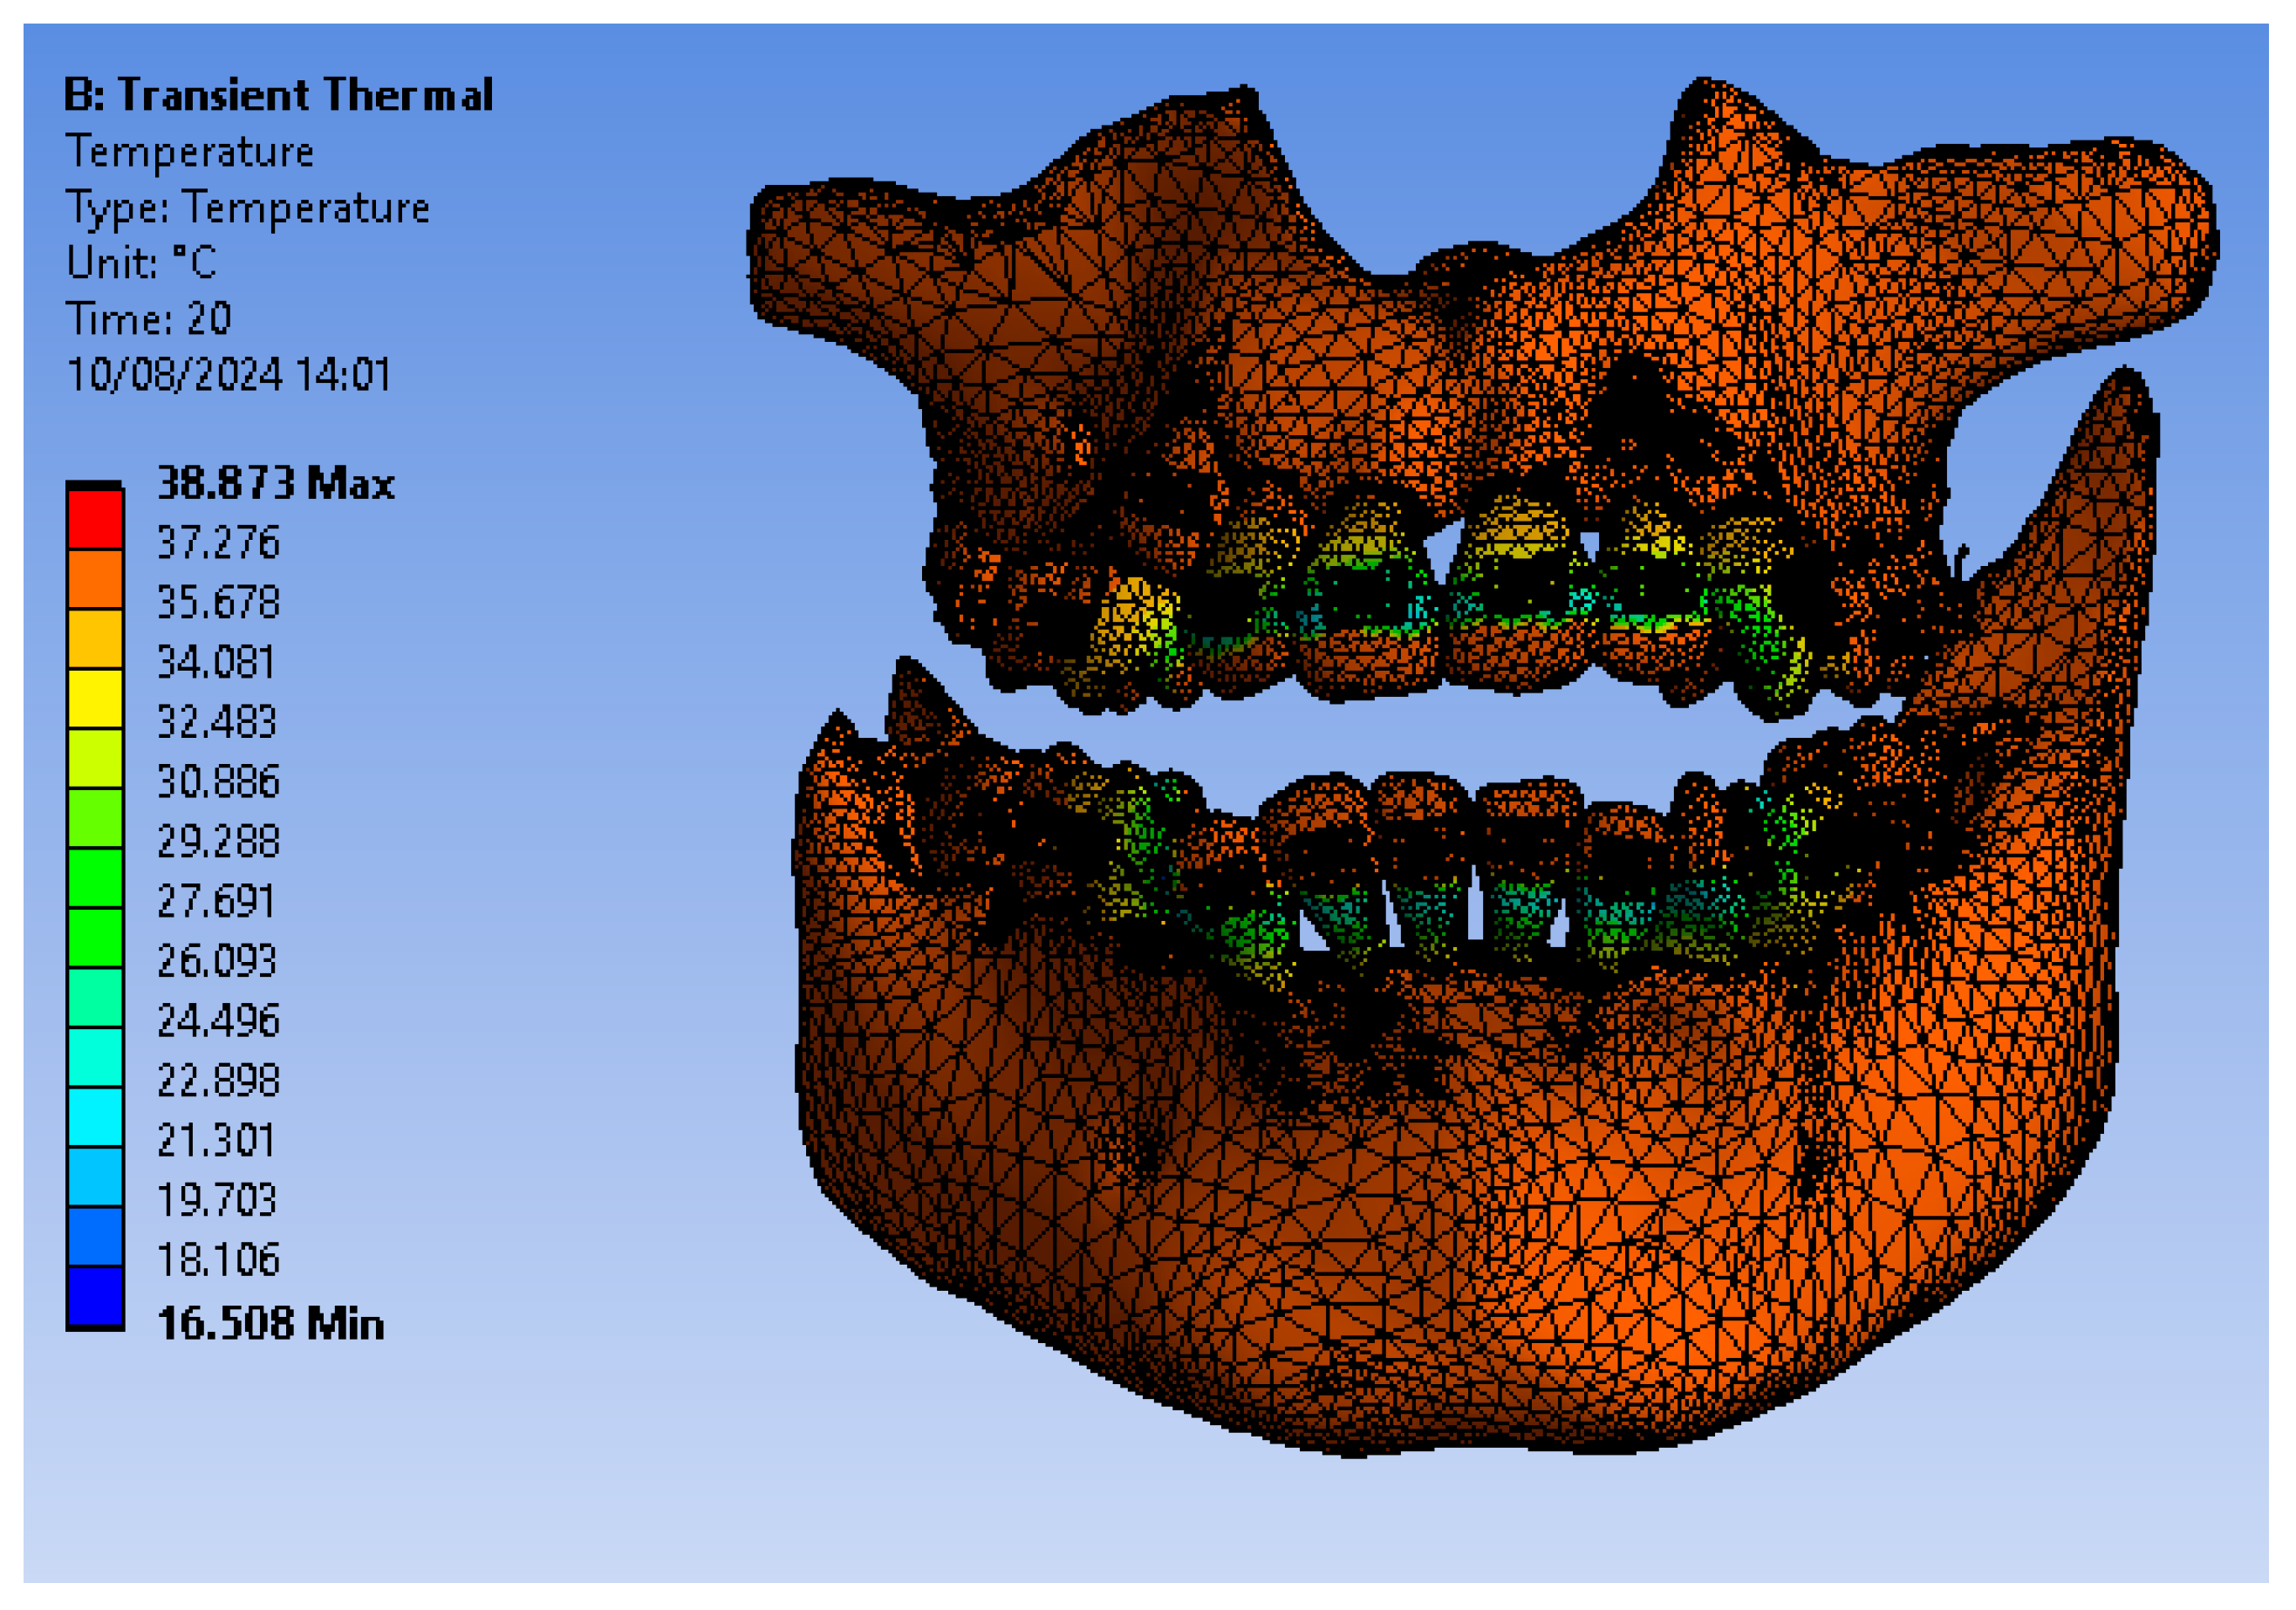
Figure 35.
ET for 1.1 subjected to CHC source.
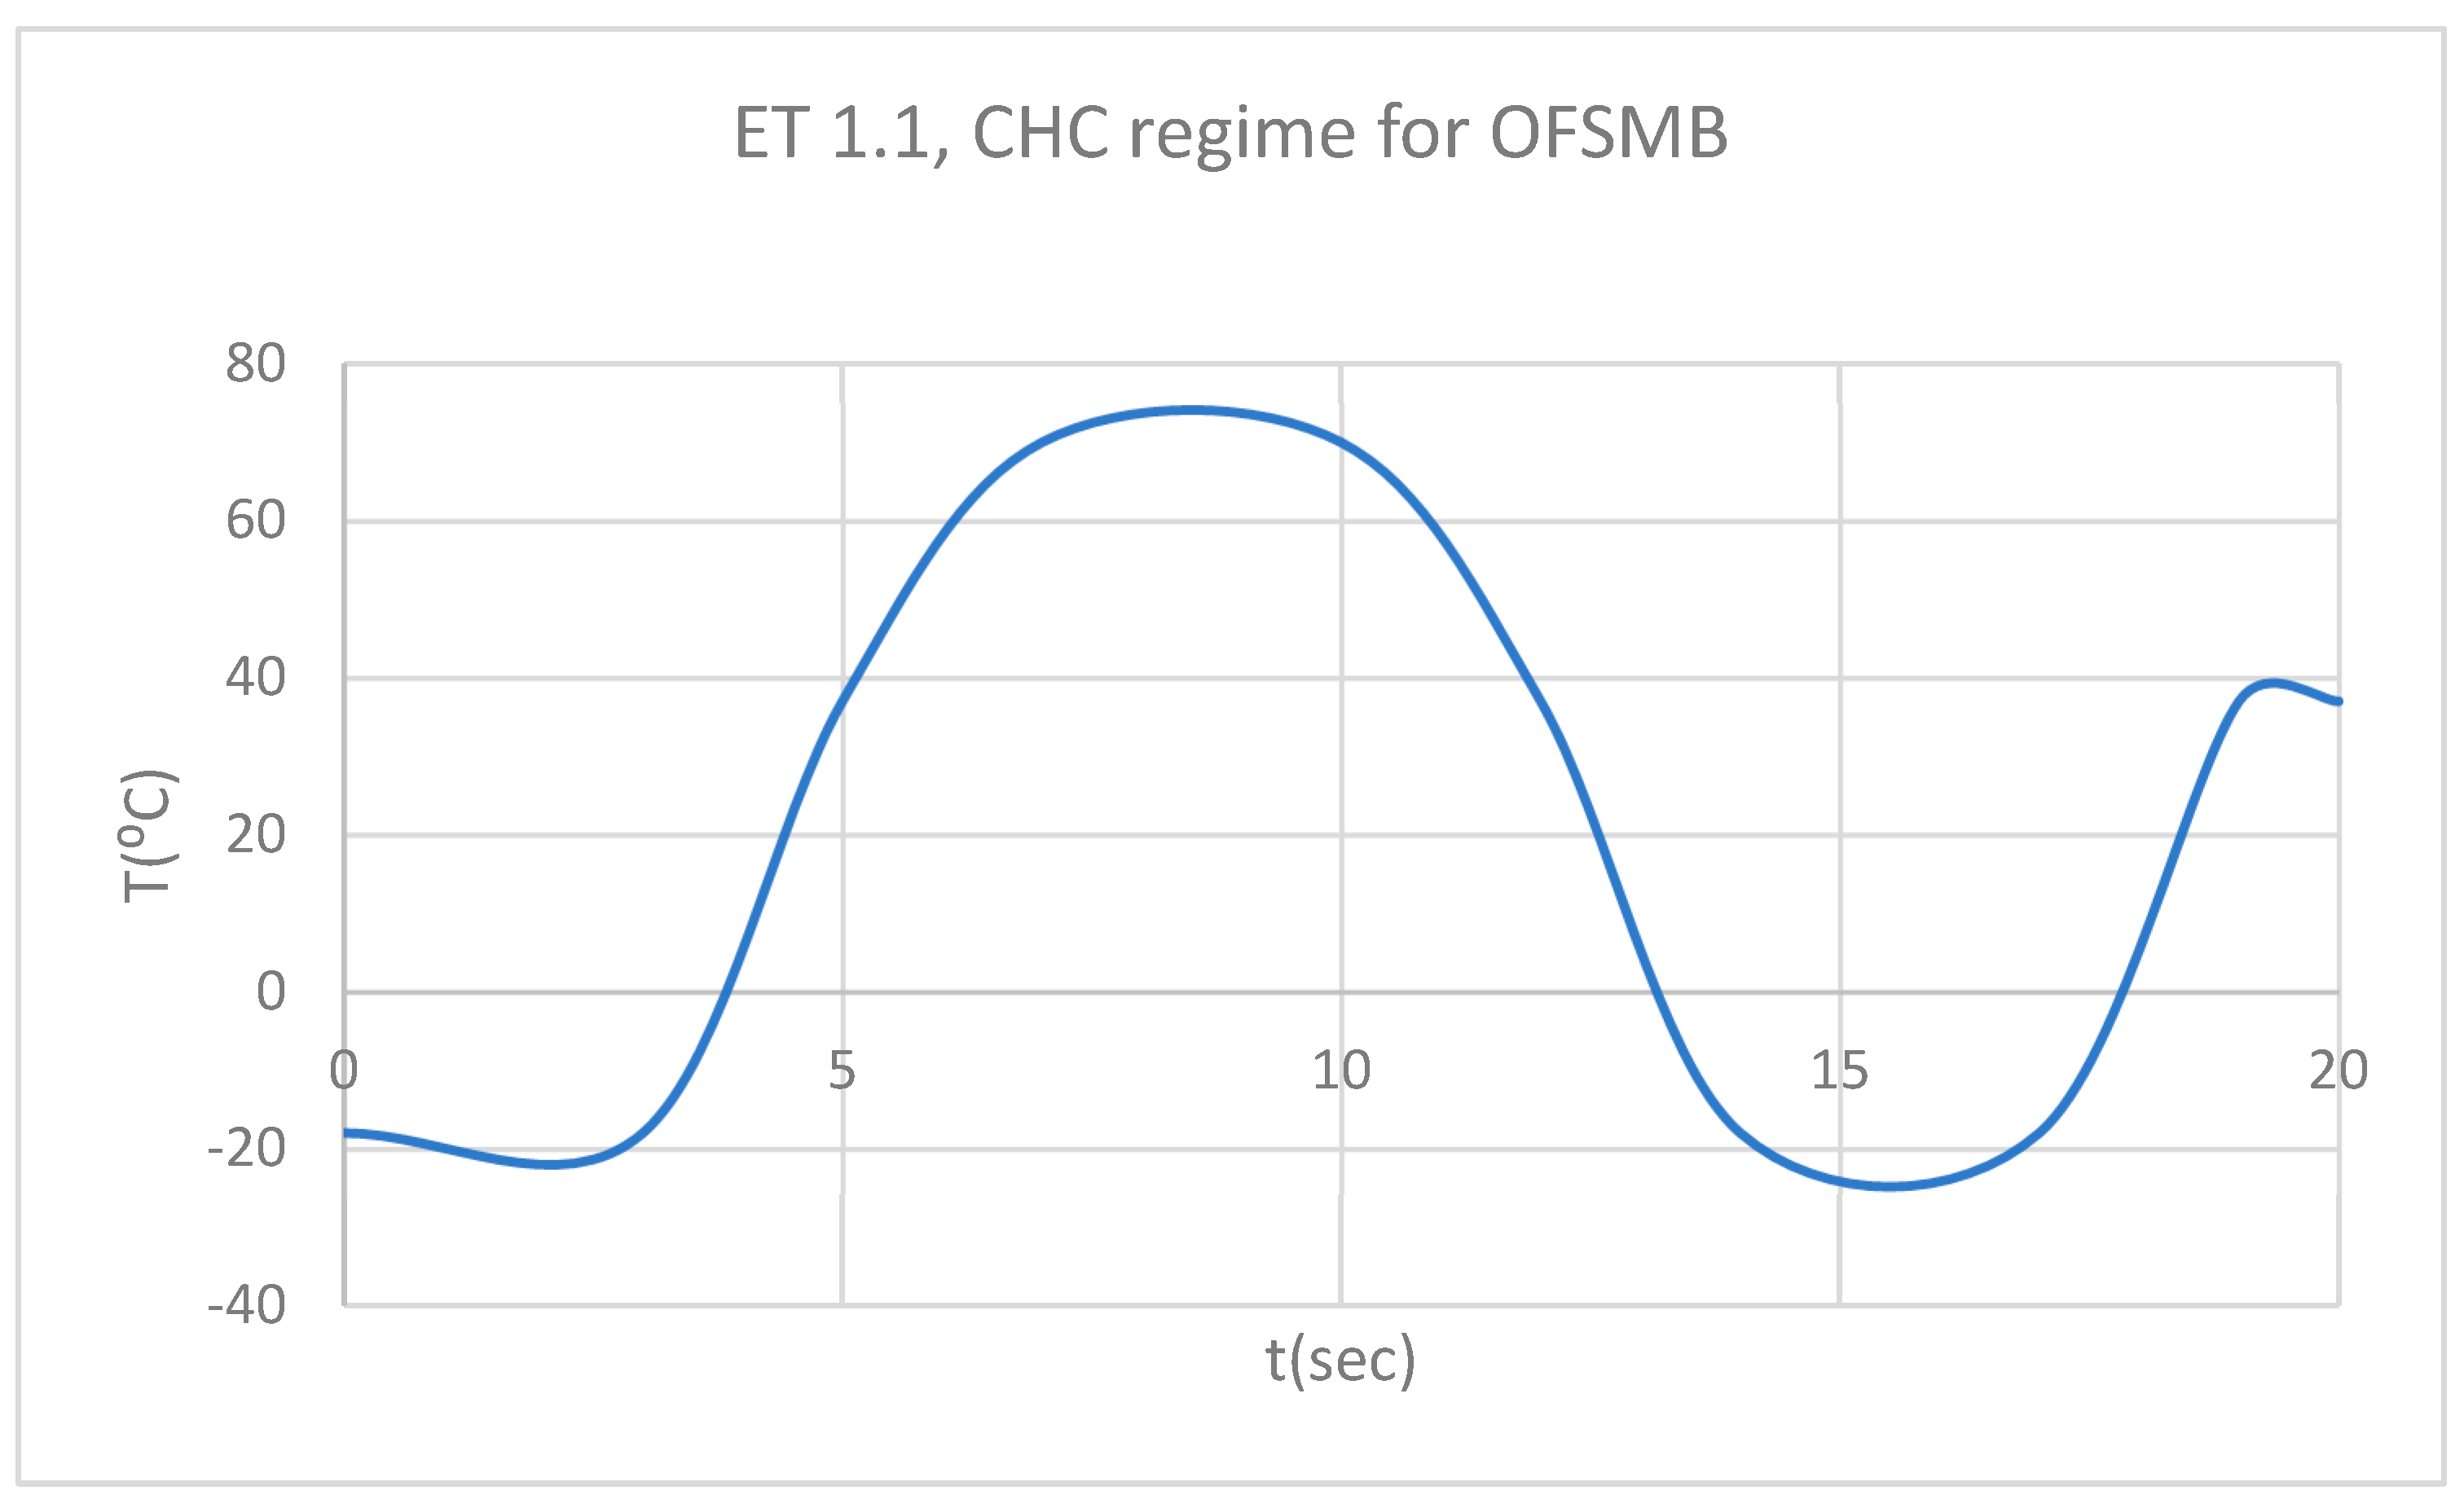
Figure 36.
DT for 1.1 subjected to CHC sorce.
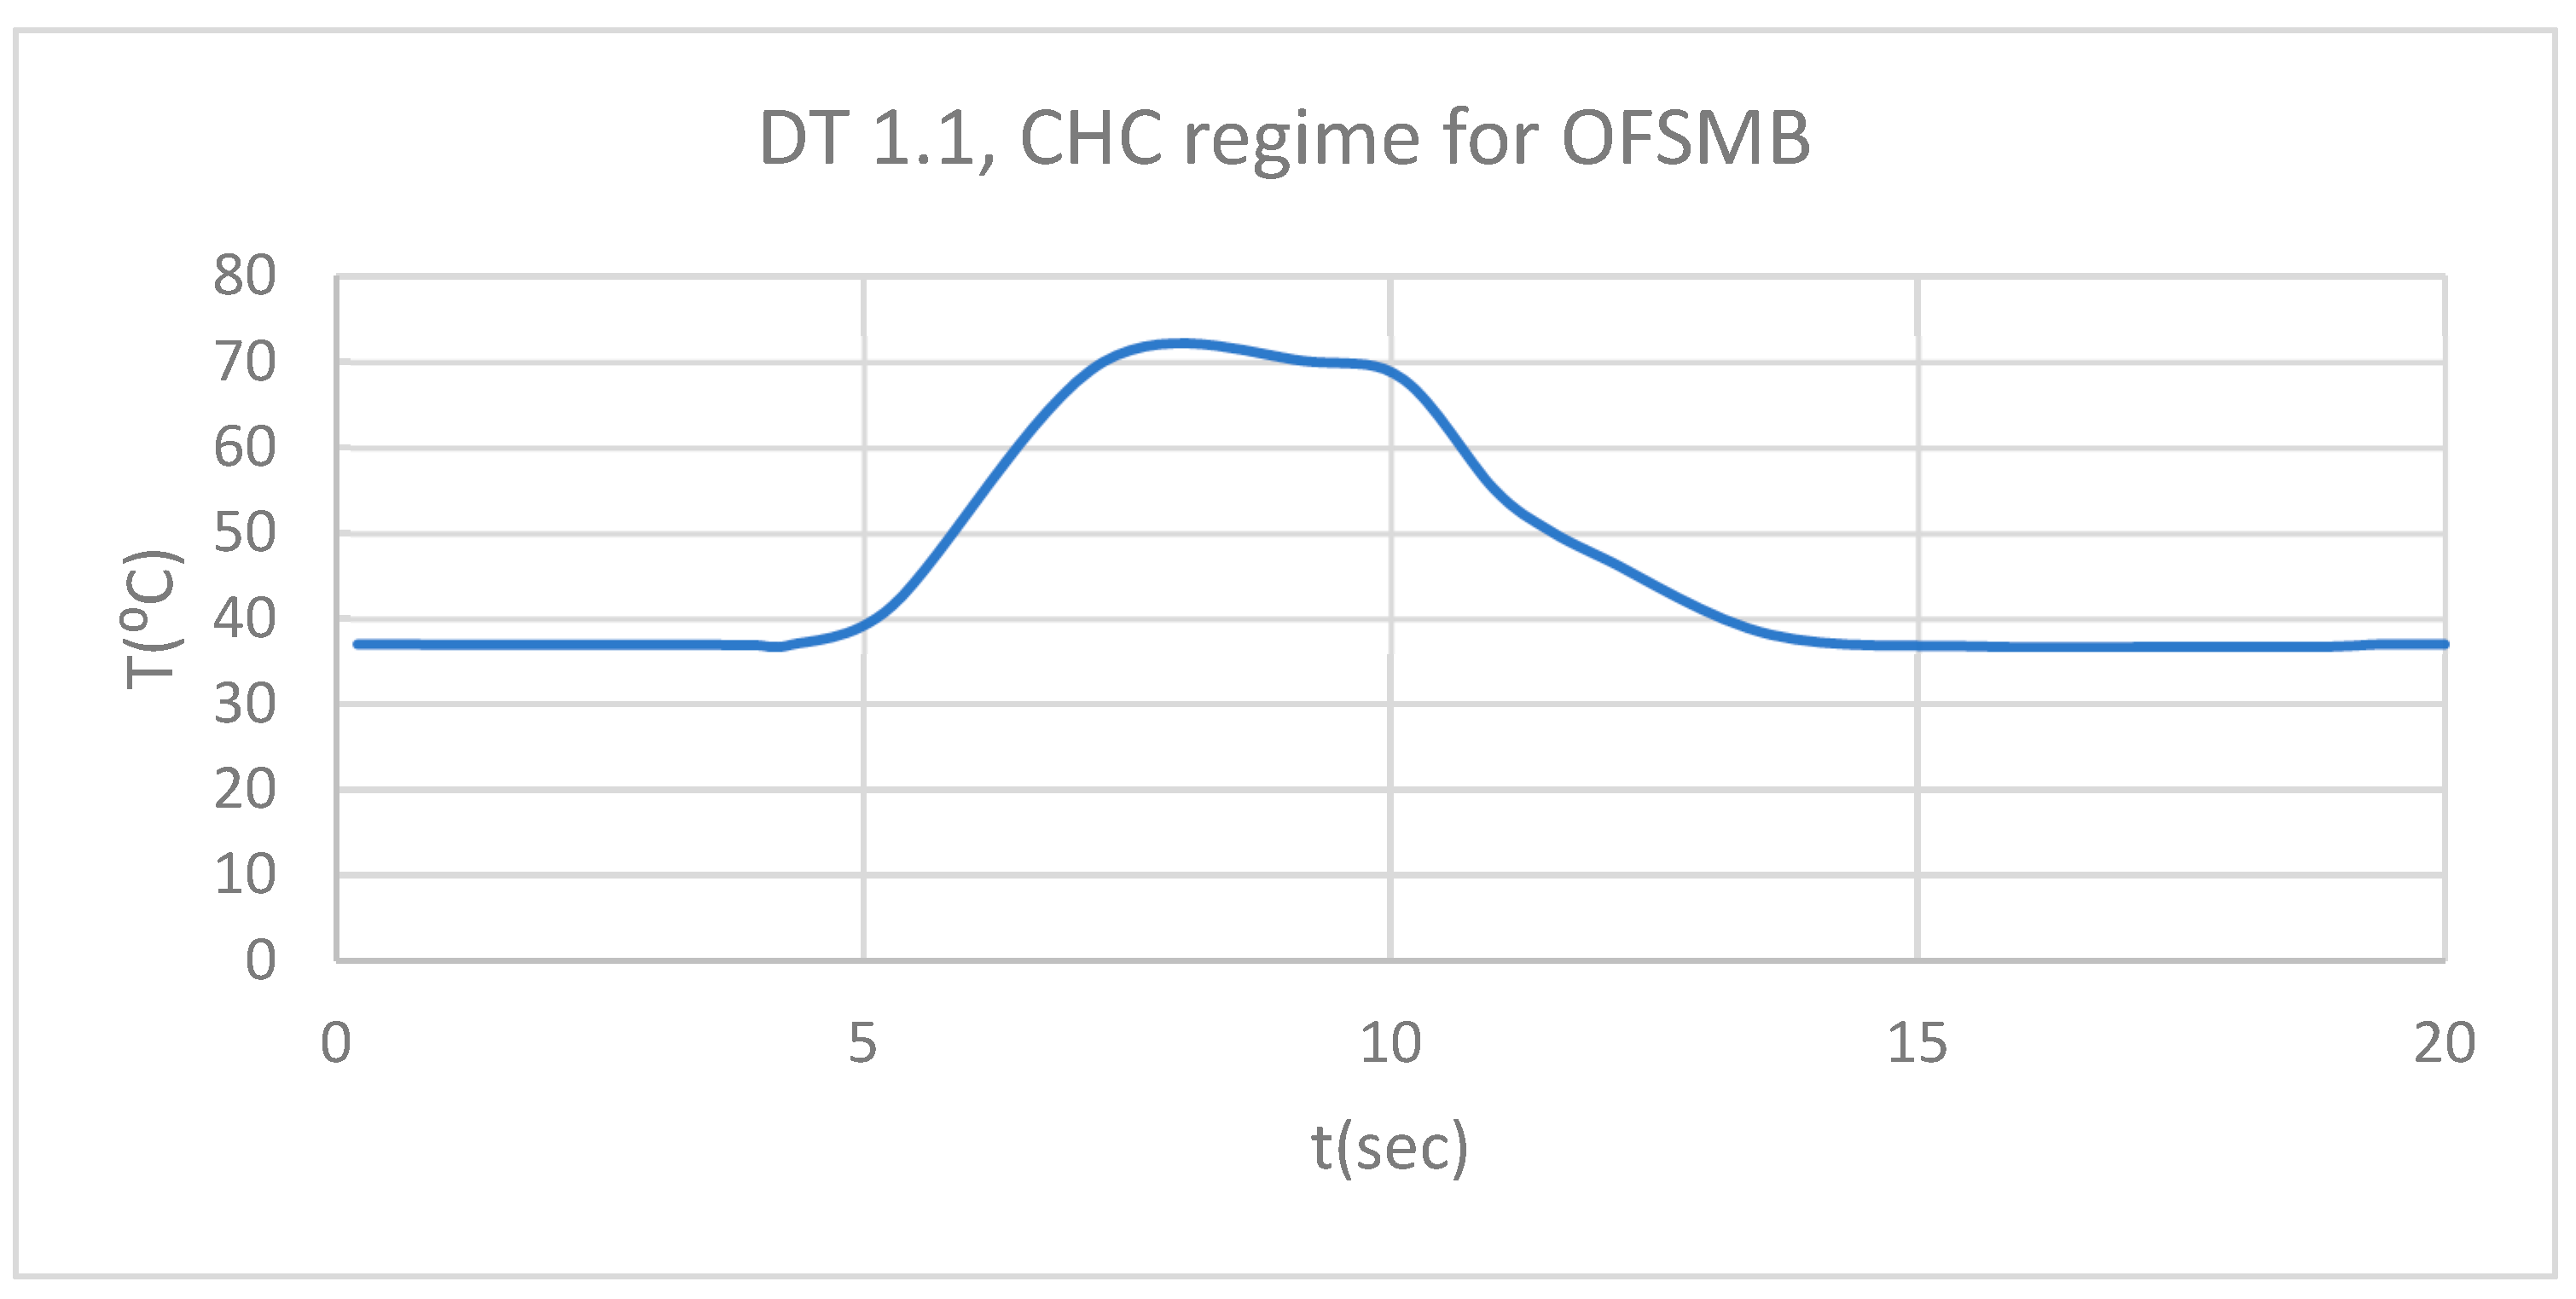
Figure 37.
PT for 1.1 subjected to CHC source.
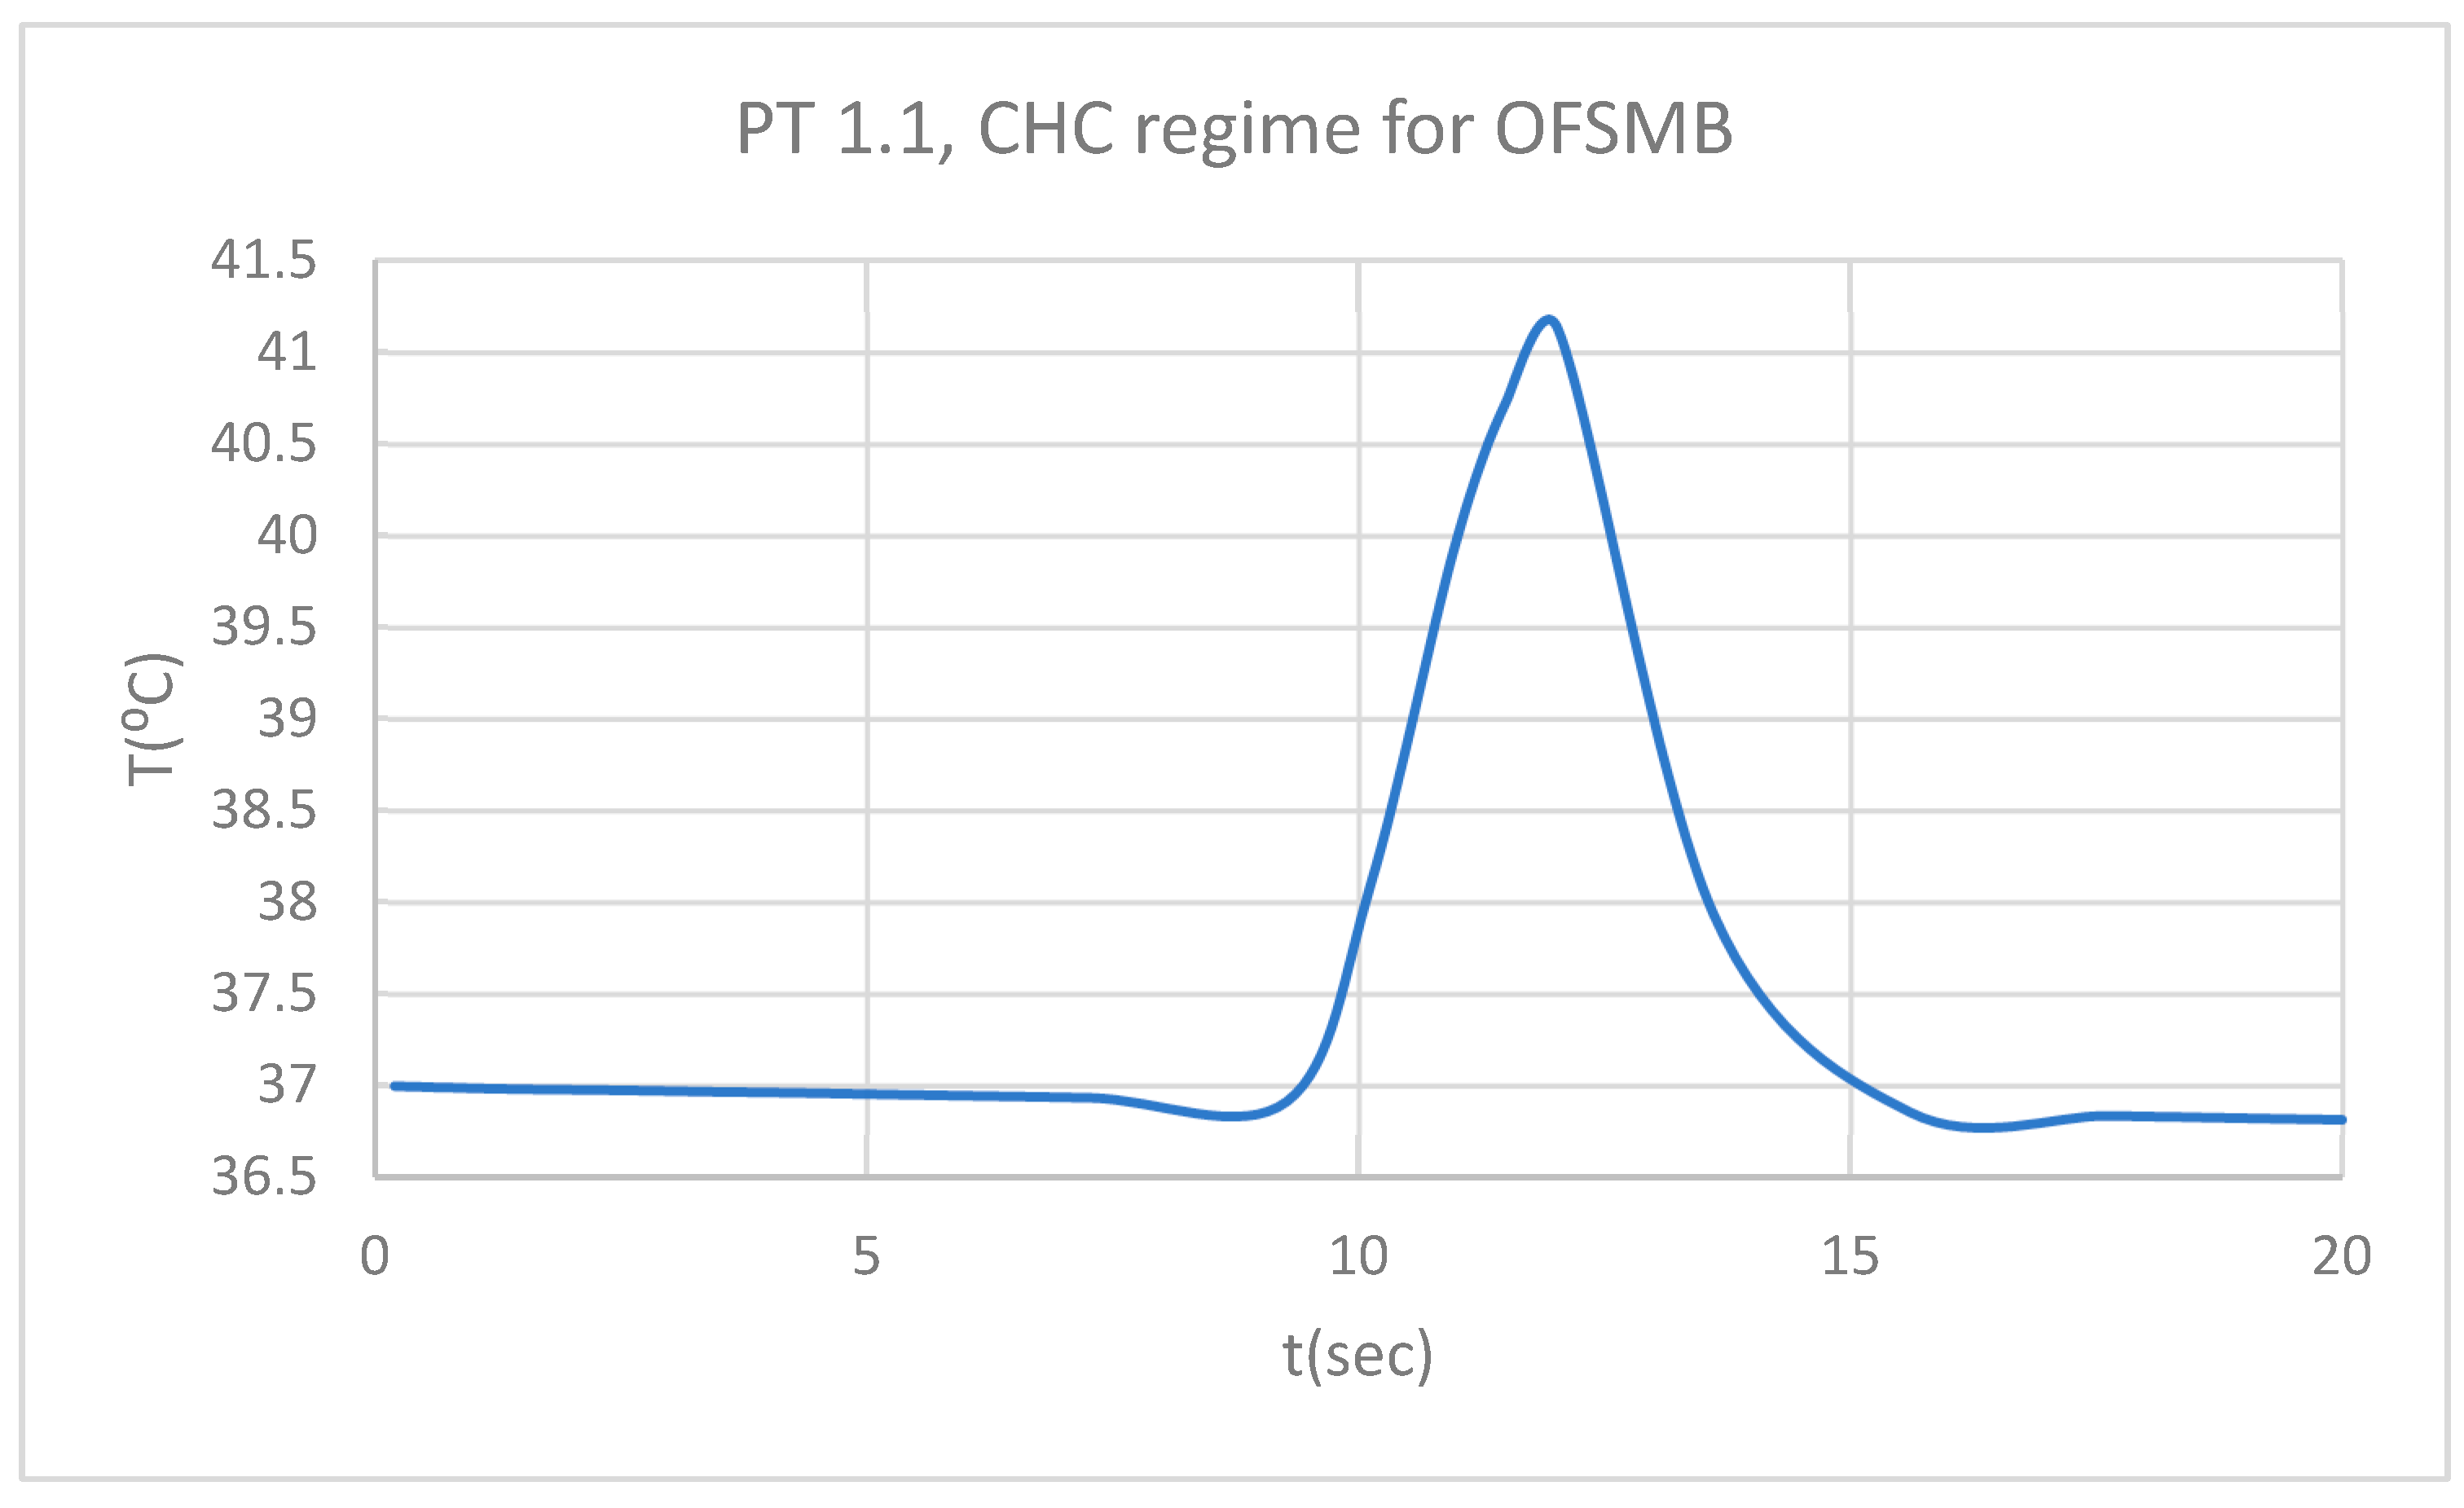
Figure 38.
Comparative diagram of the dental structures temperature for 1.1 subjected to CHC source.
Figure 38.
Comparative diagram of the dental structures temperature for 1.1 subjected to CHC source.
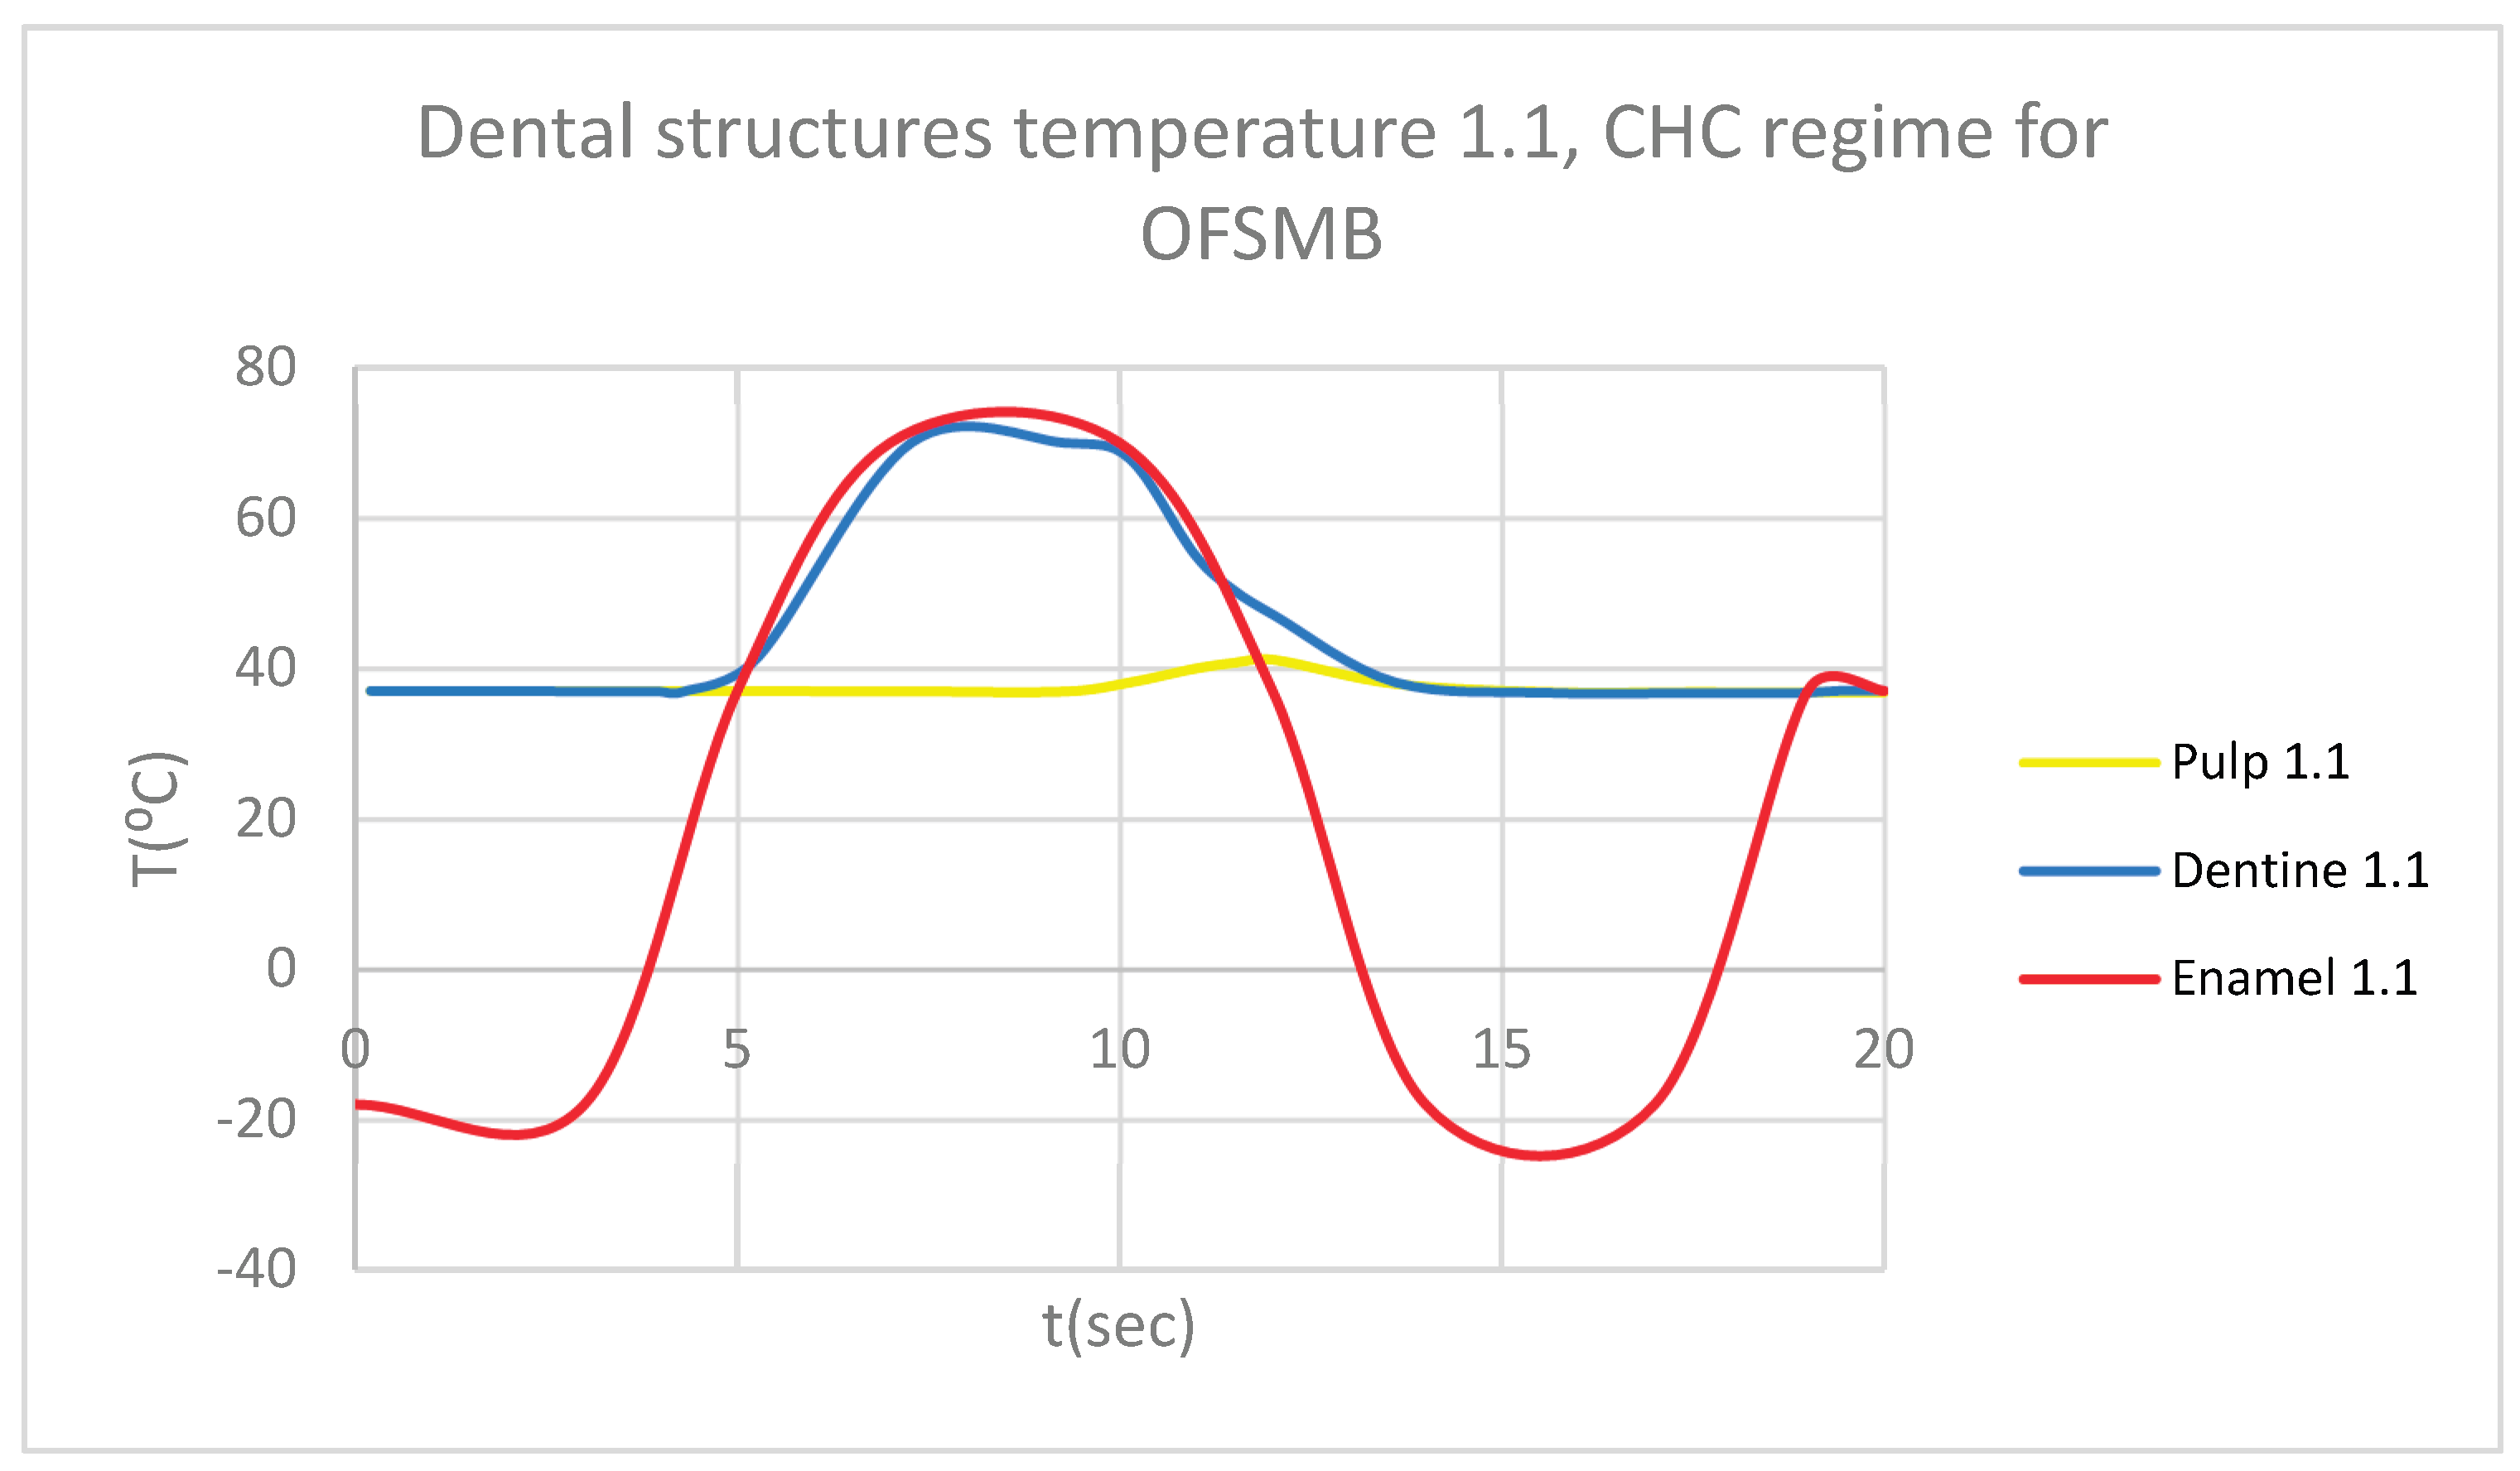
Figure 39.
ET for 4.1 subjected to CHC source.
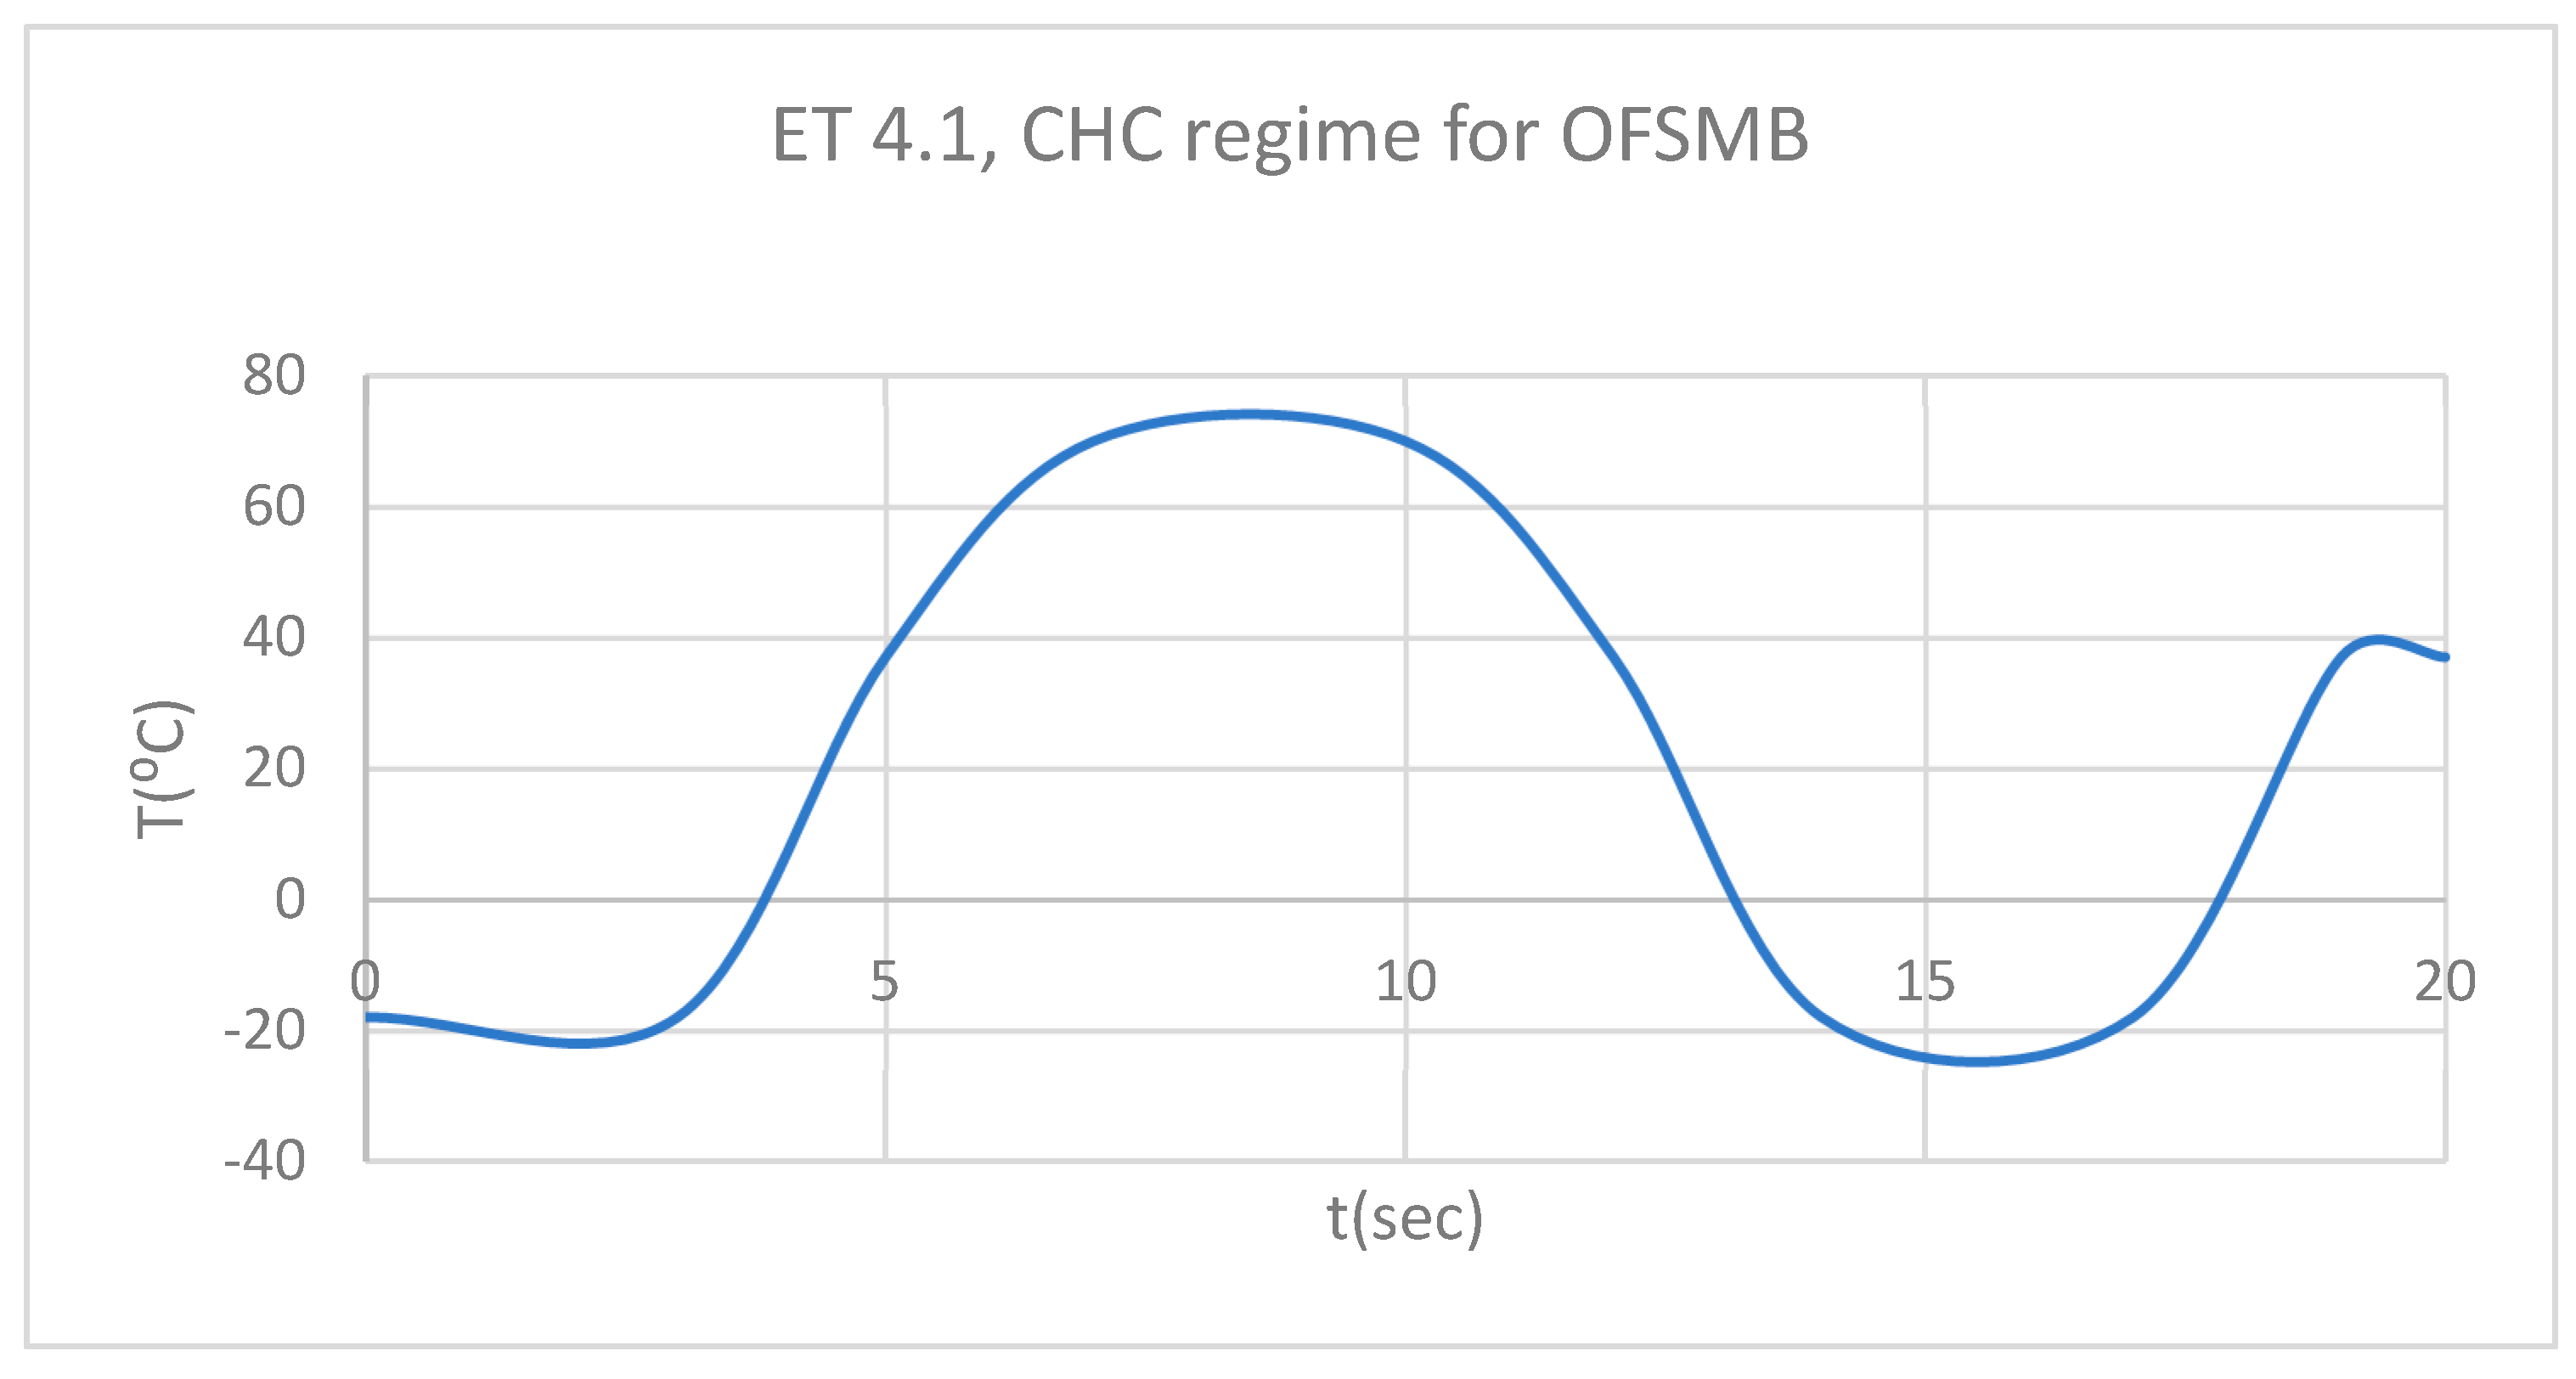
Figure 40.
DT for 4.1 subjected to CHC source.
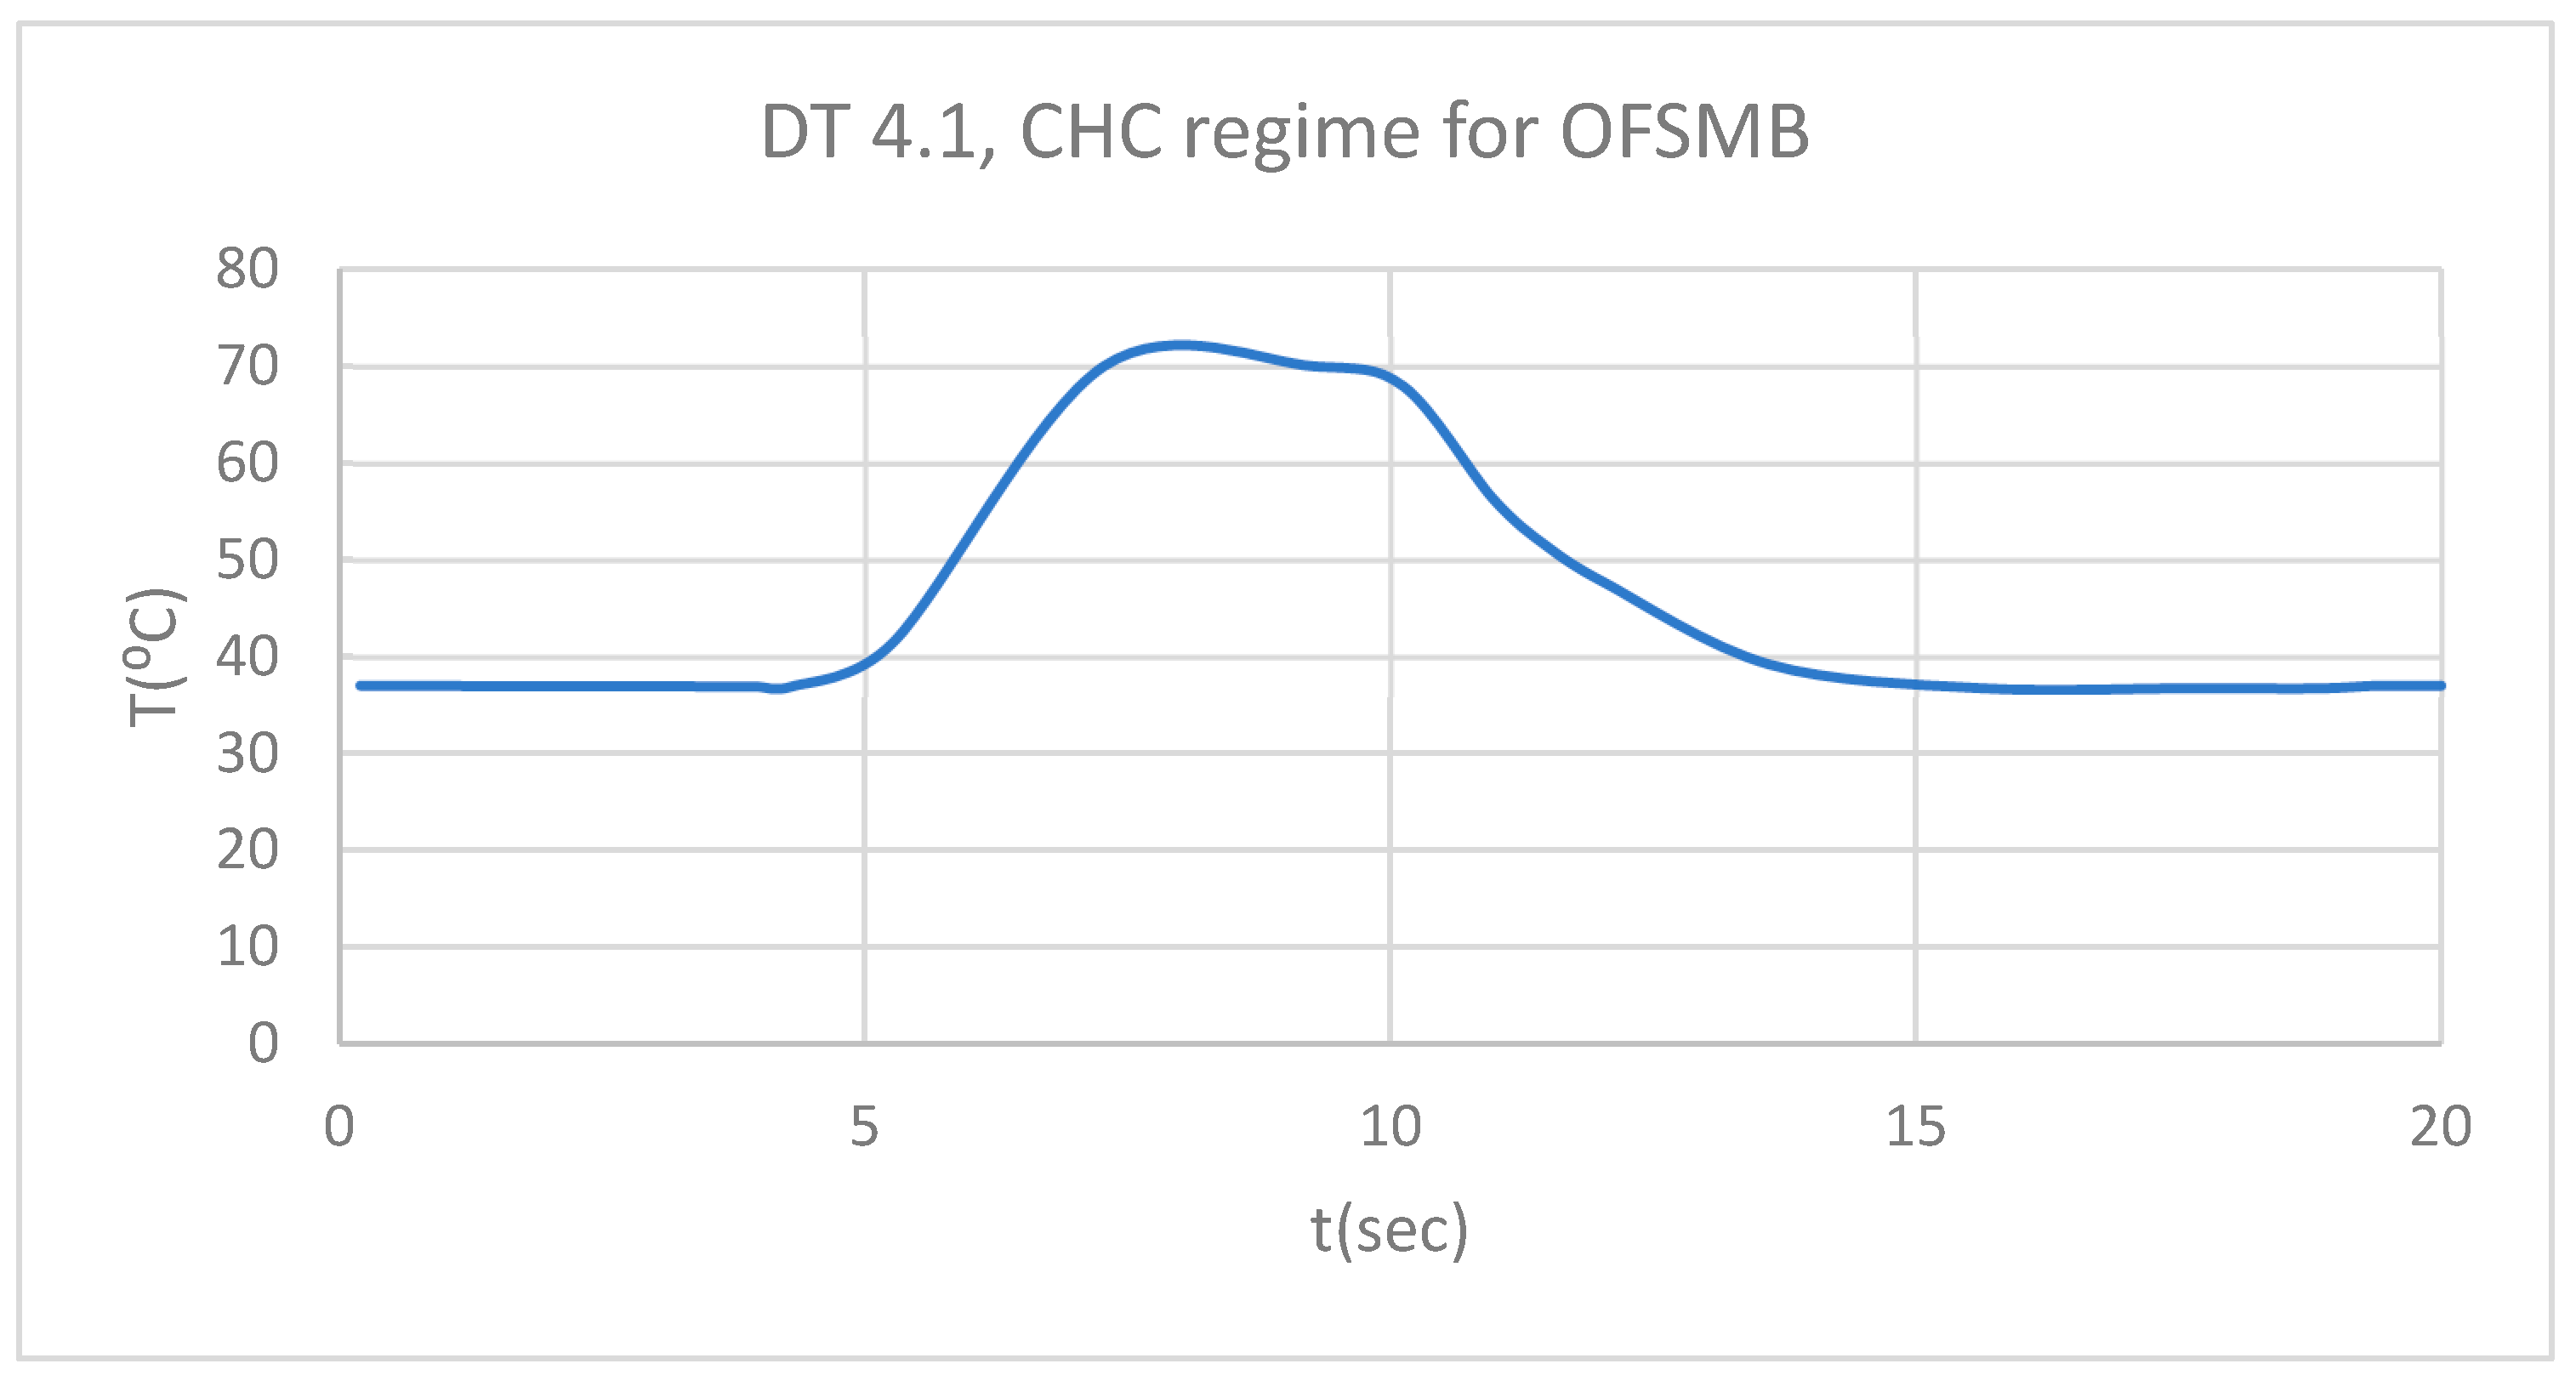
Figure 41.
PT for 4.1 subjected to CHC source.
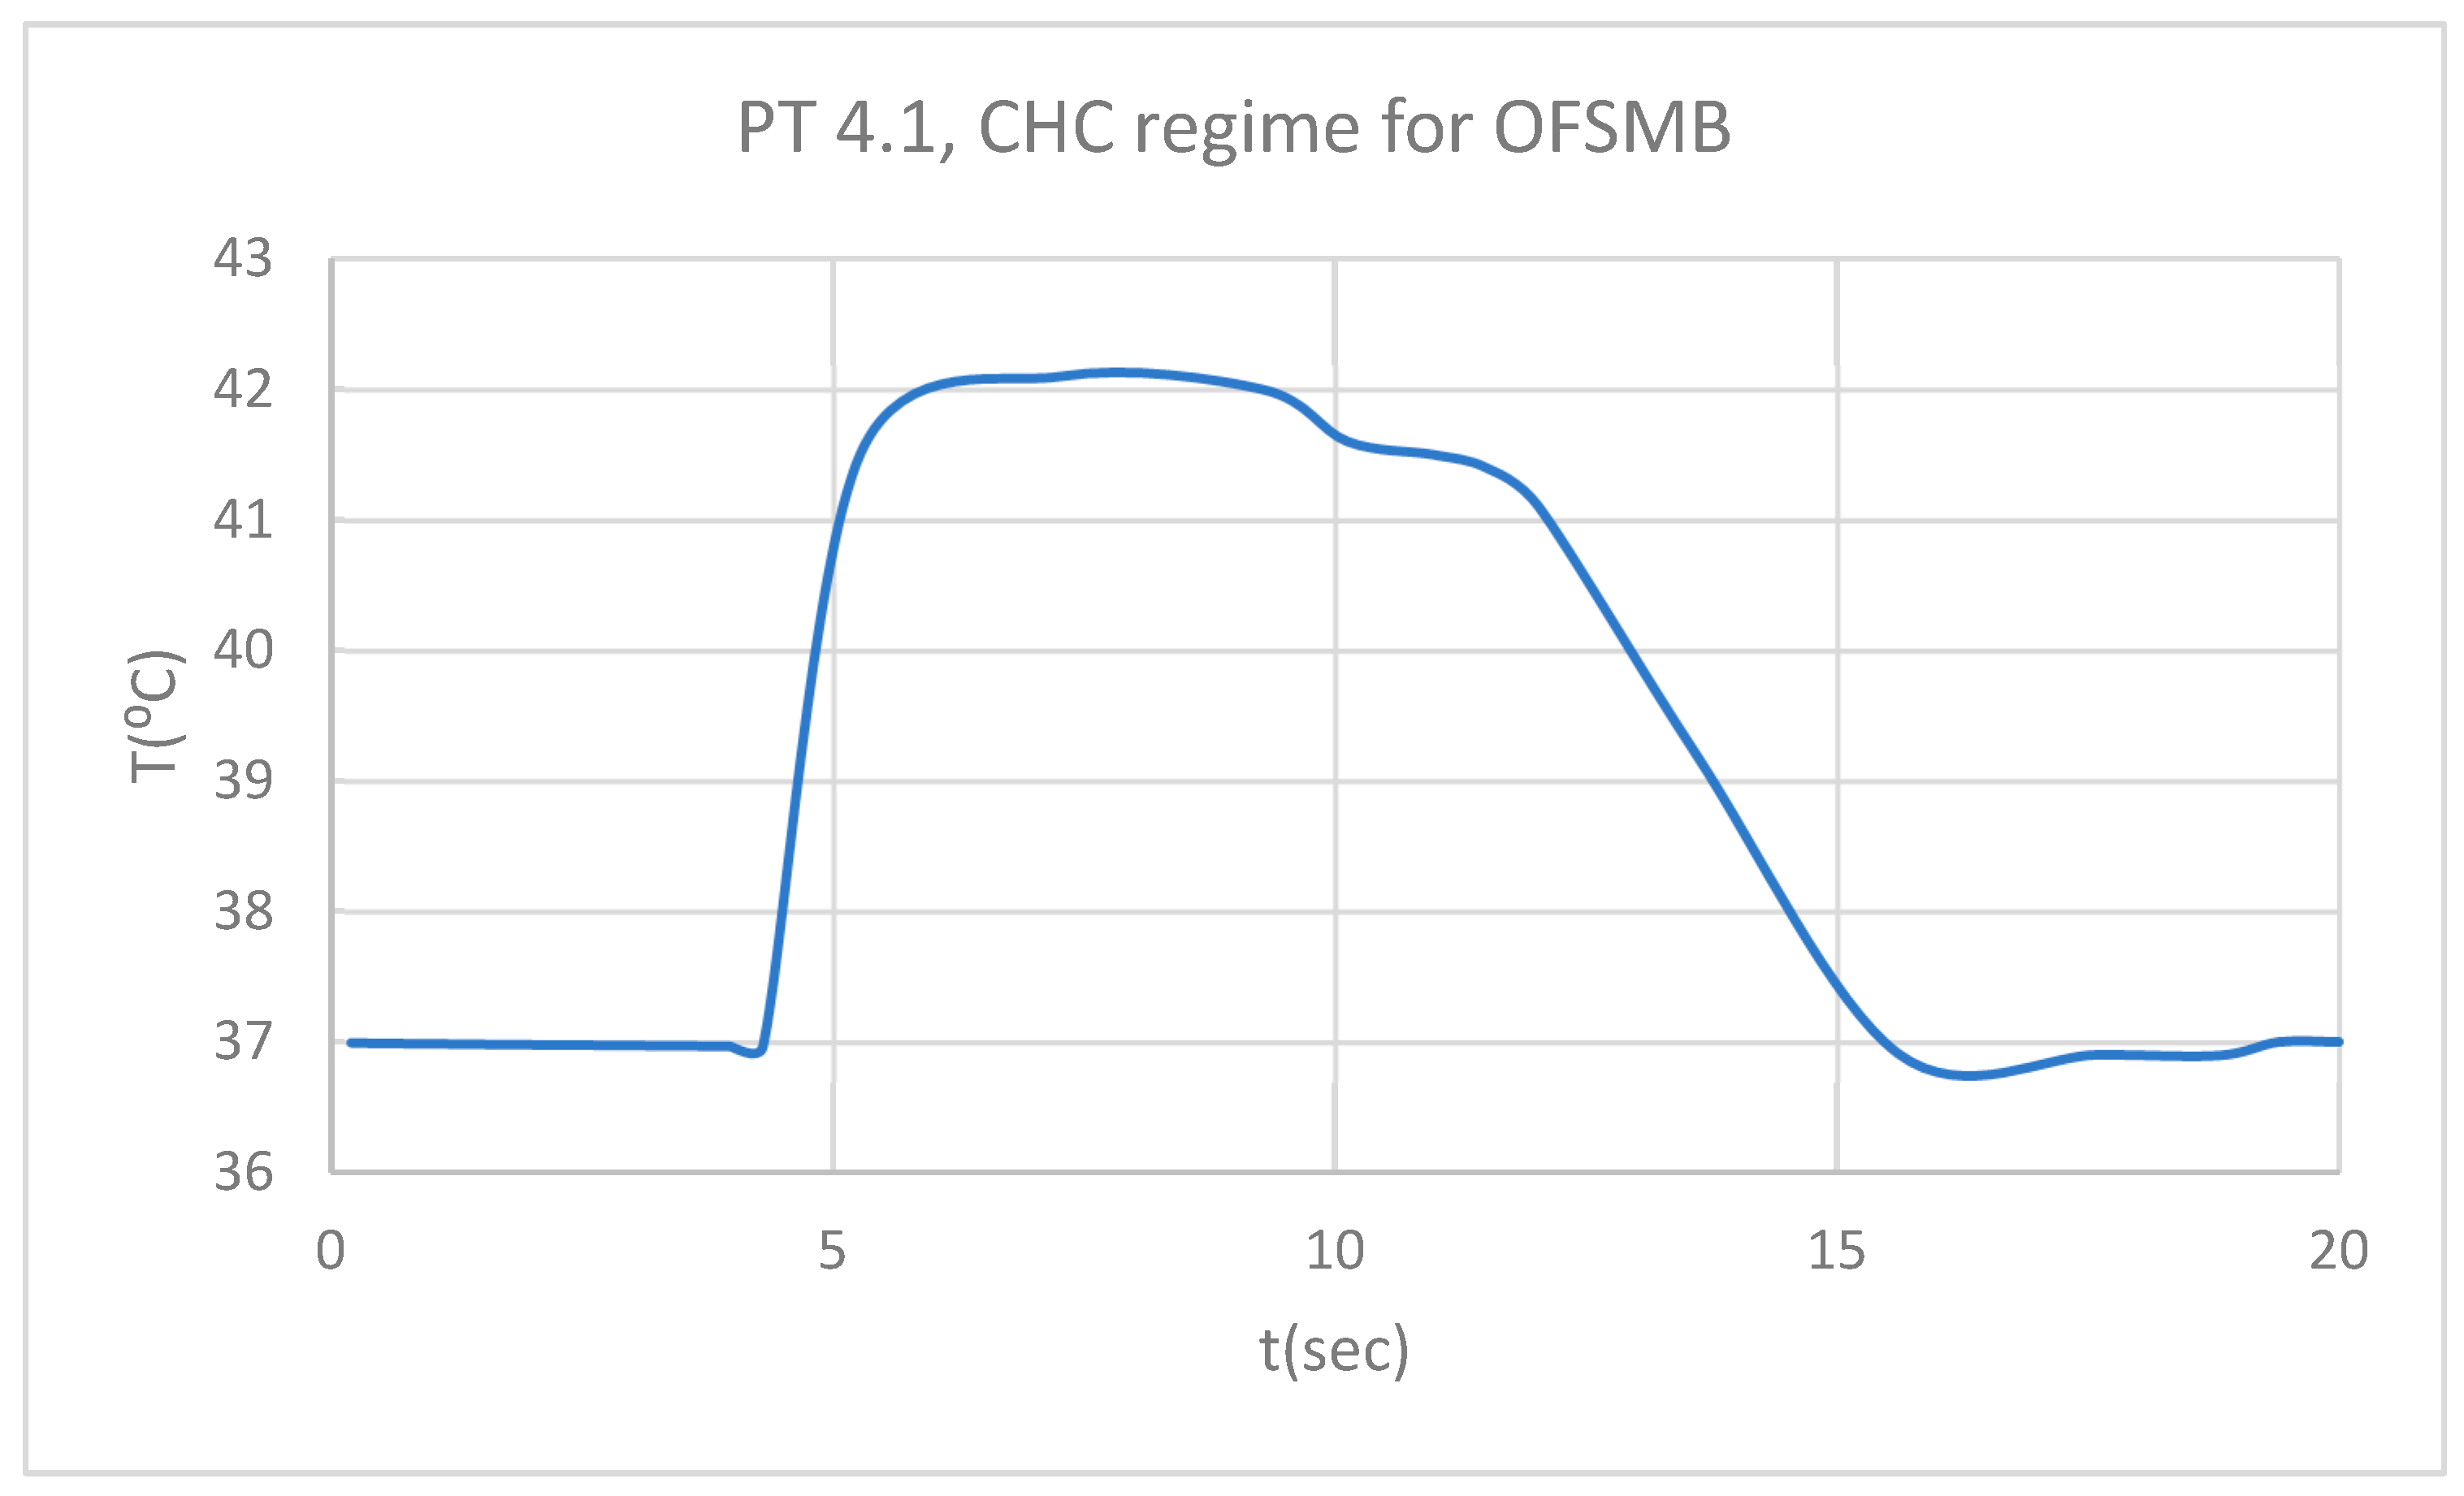
Figure 42.
Comparative diagram of the dental structures temperature for 4.1 subjected to CHC source.
Figure 42.
Comparative diagram of the dental structures temperature for 4.1 subjected to CHC source.
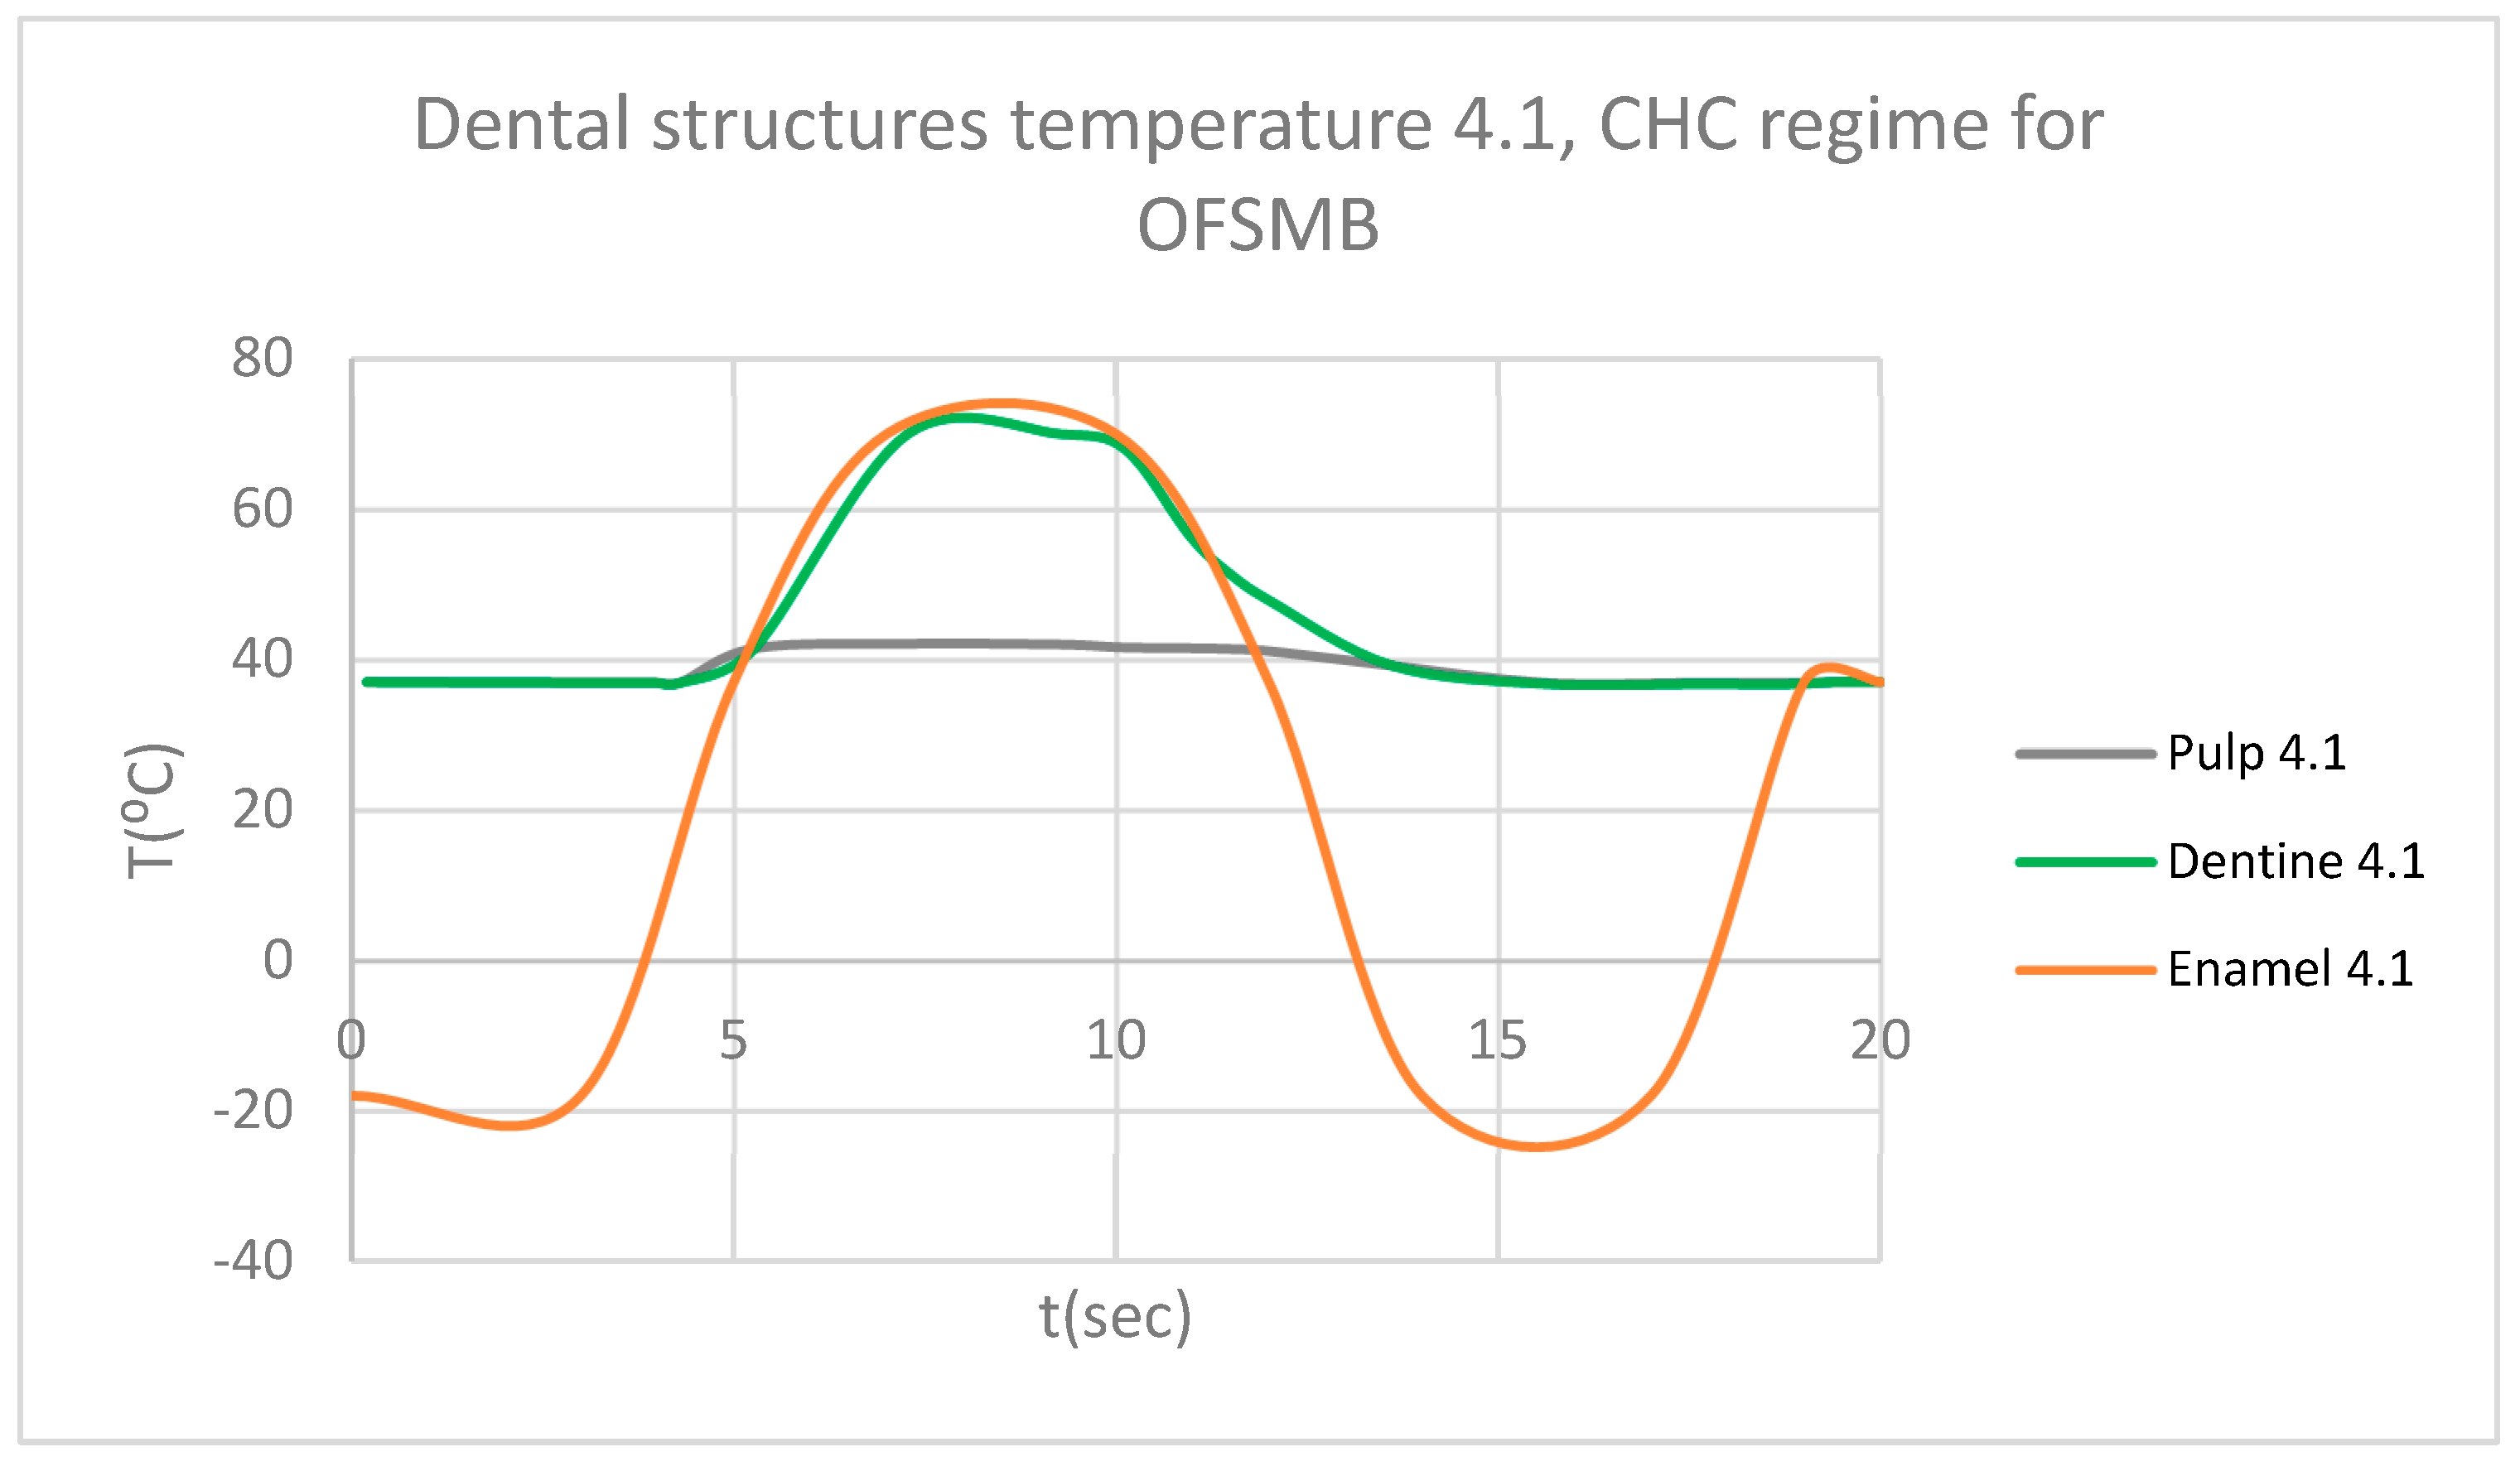
Figure 43.
Comparative diagram of the dental structures temperature for 1.1 and 4.1 subjected to CHC source.
Figure 43.
Comparative diagram of the dental structures temperature for 1.1 and 4.1 subjected to CHC source.
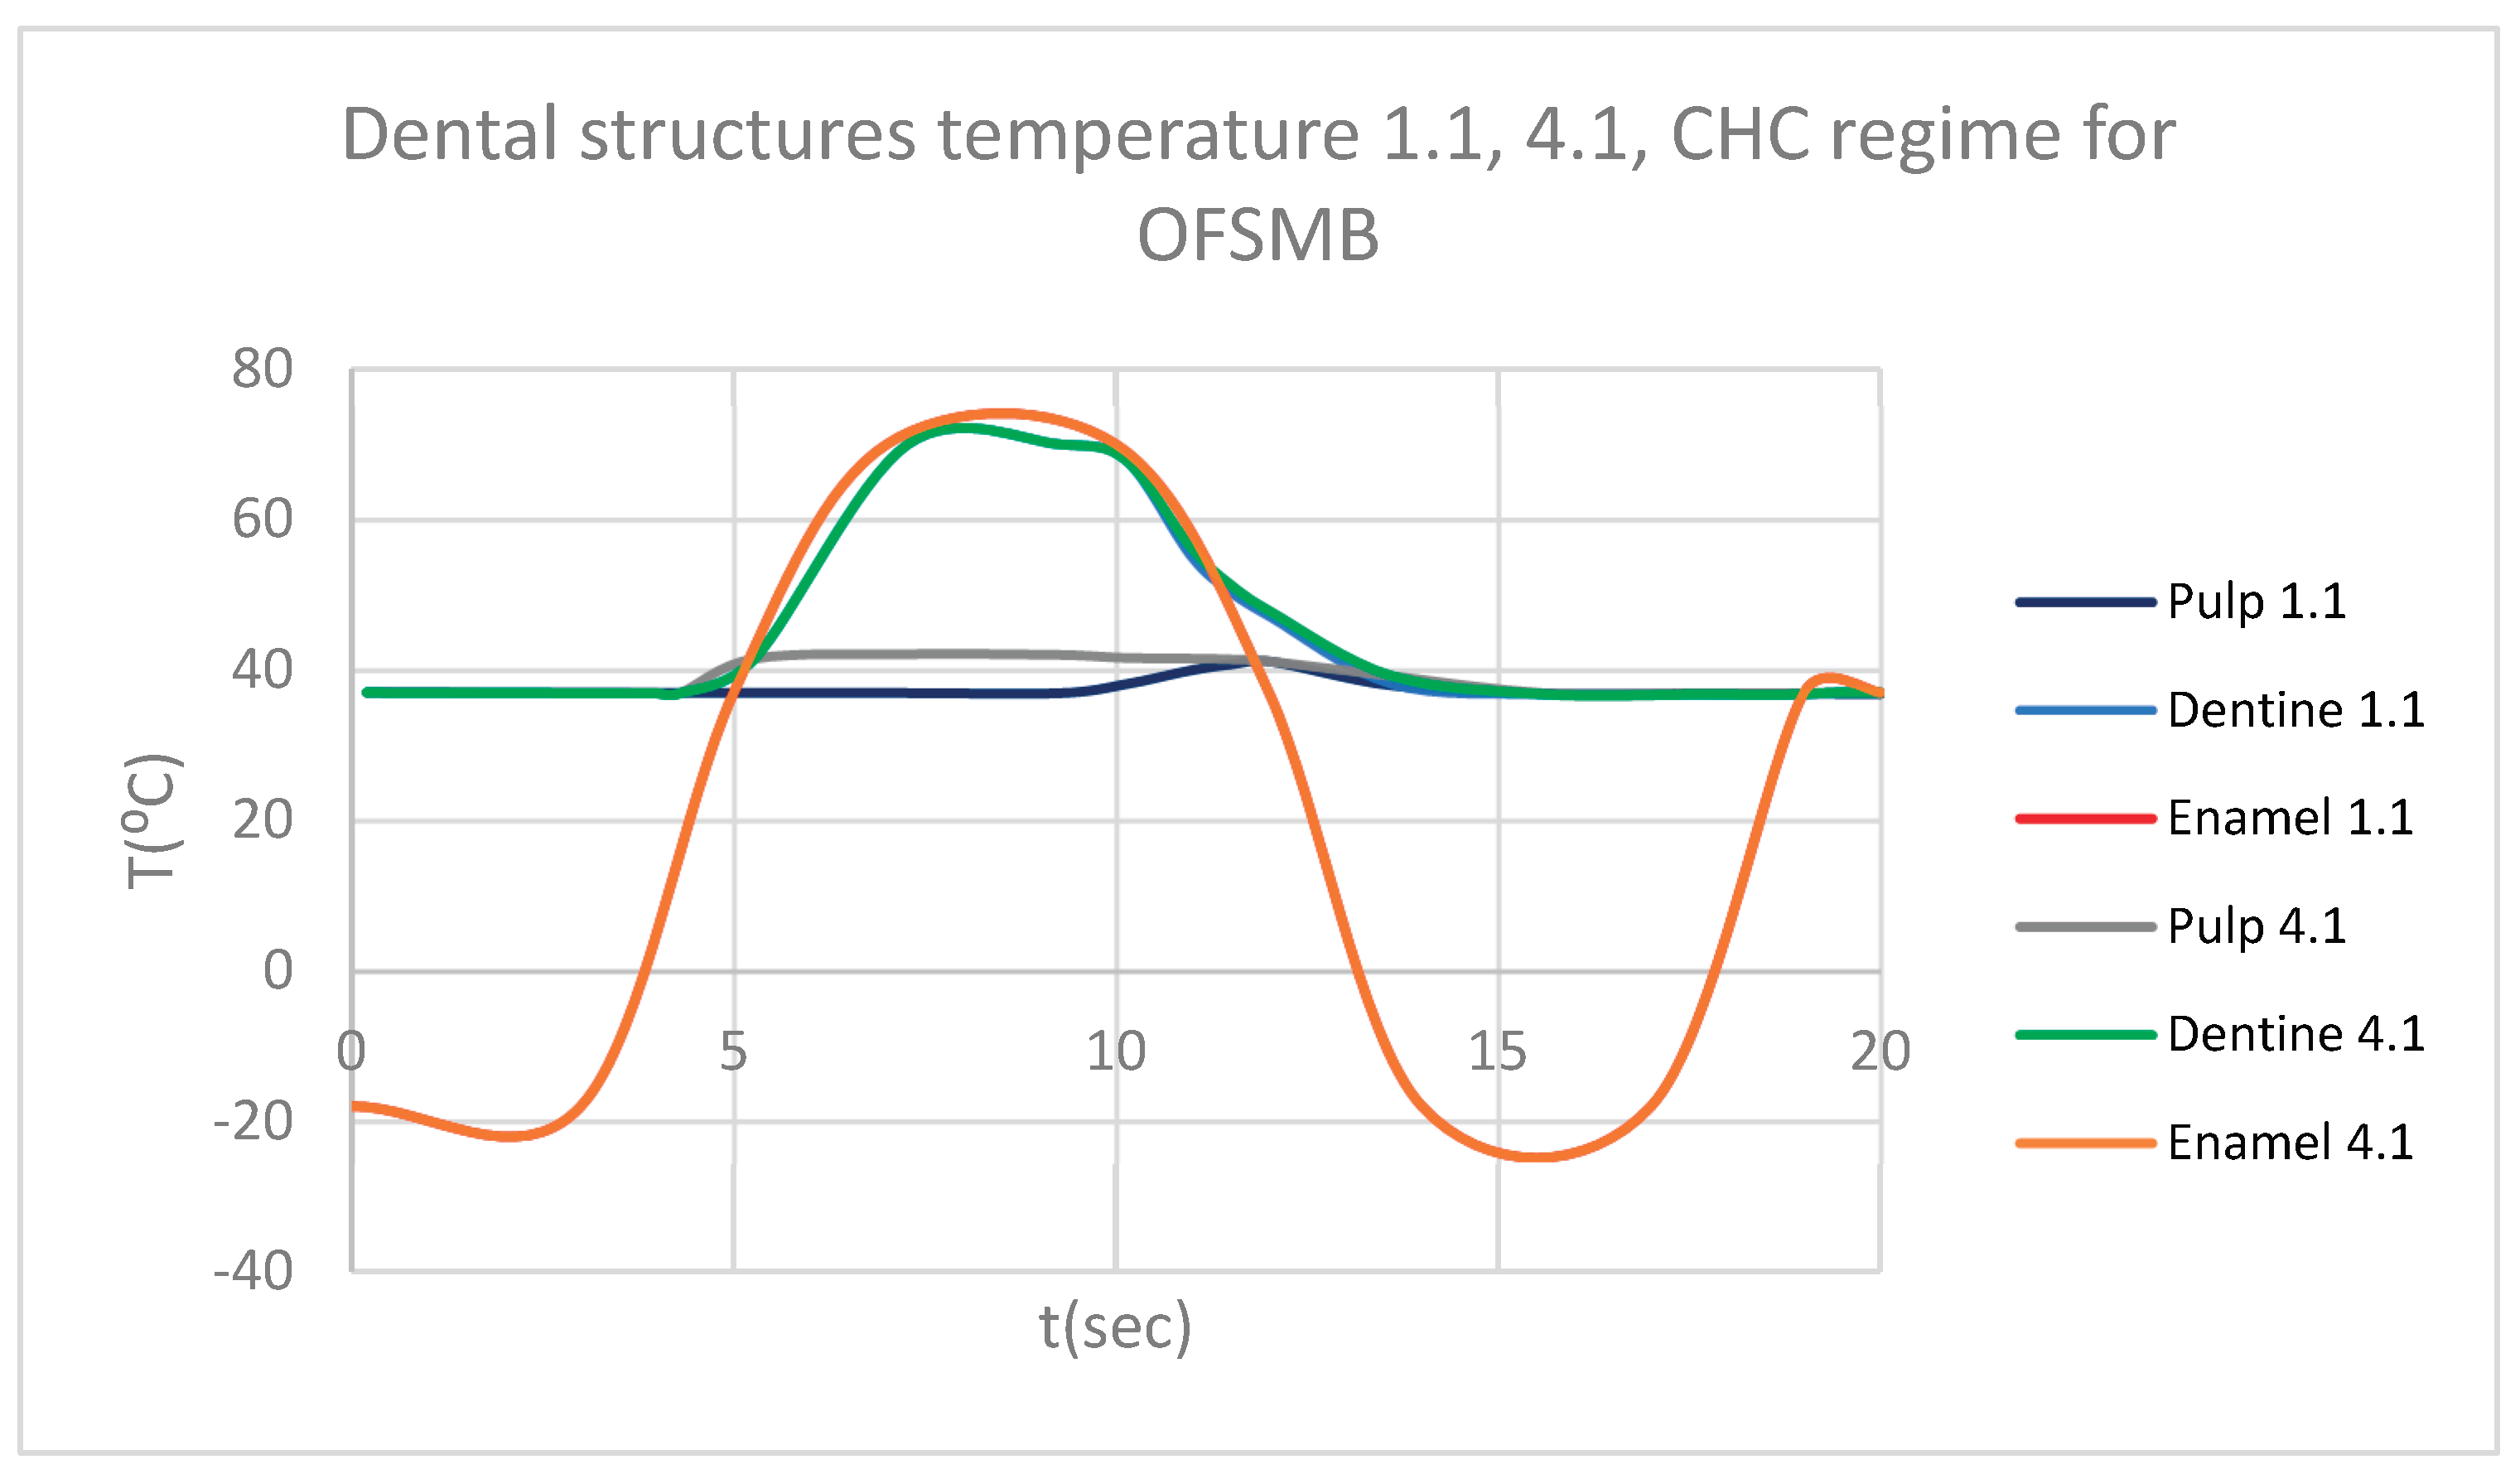
Figure 44.
Comparative diagram of how temperature impacts the pulp of 1.1, when subjected to HCH source.
Figure 44.
Comparative diagram of how temperature impacts the pulp of 1.1, when subjected to HCH source.
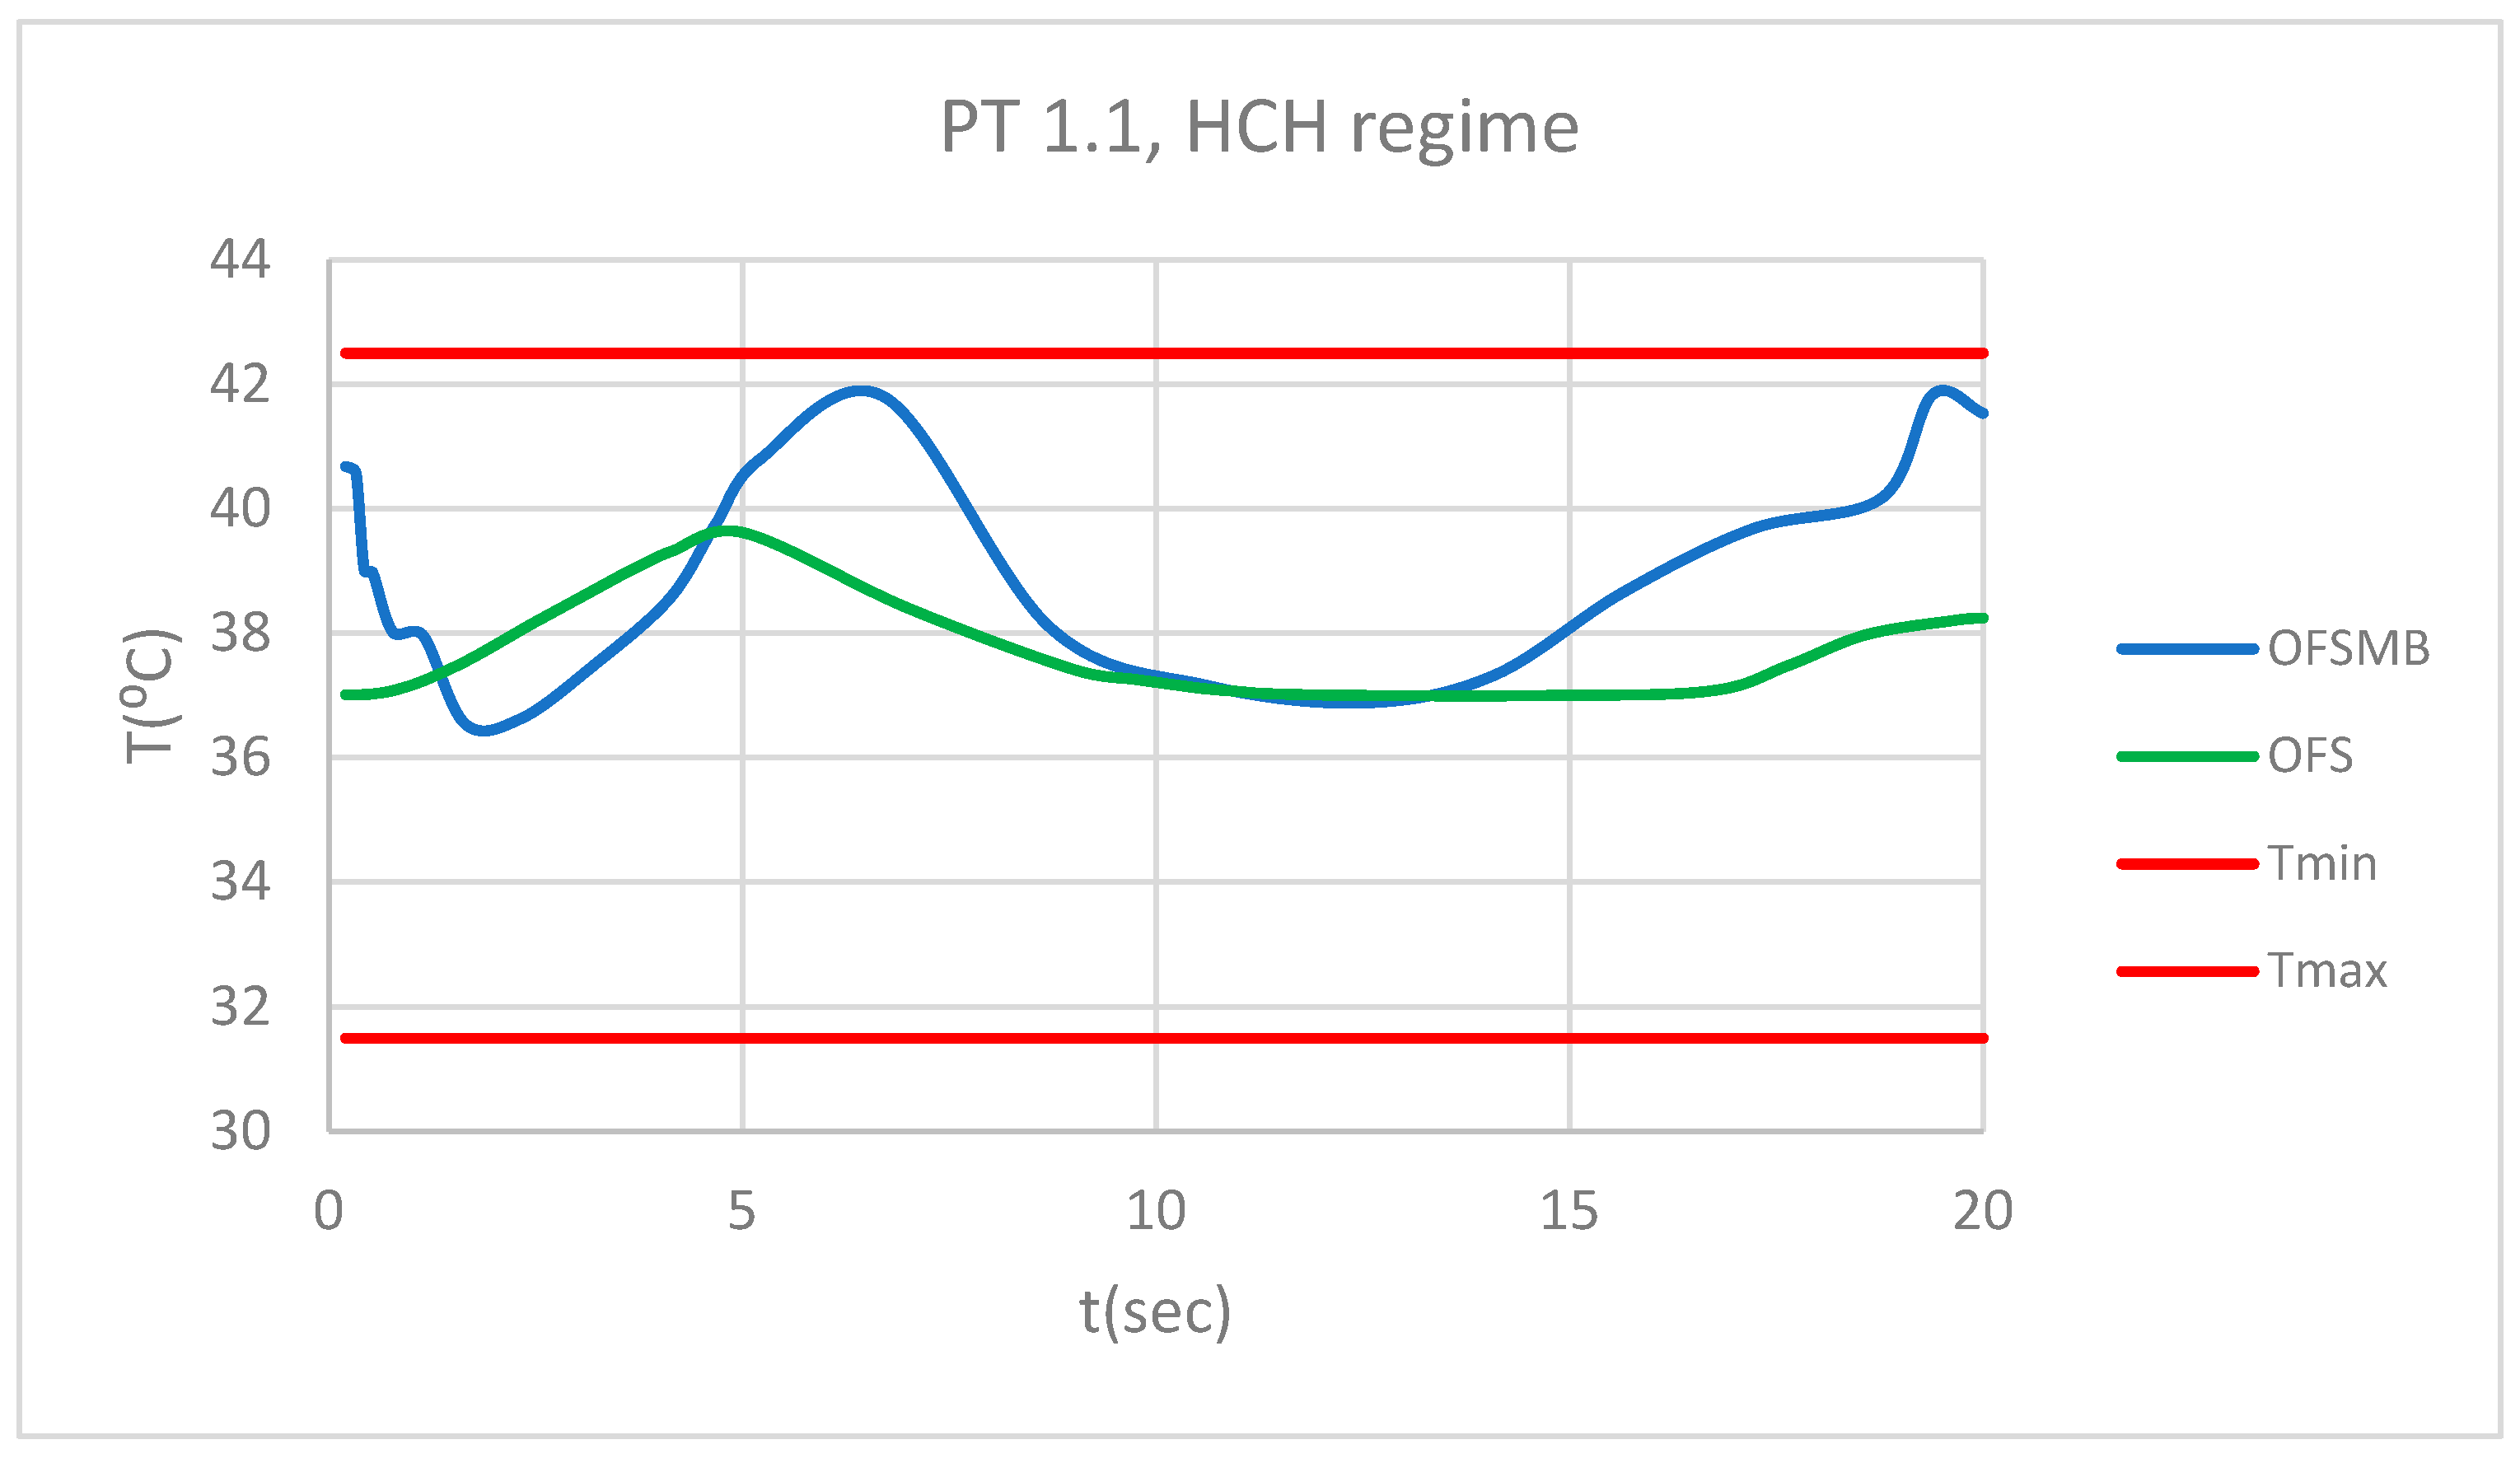
Figure 45.
Comparative diagram of how temperature impacts the pulp of 4.1, when subjected to HCH source.
Figure 45.
Comparative diagram of how temperature impacts the pulp of 4.1, when subjected to HCH source.
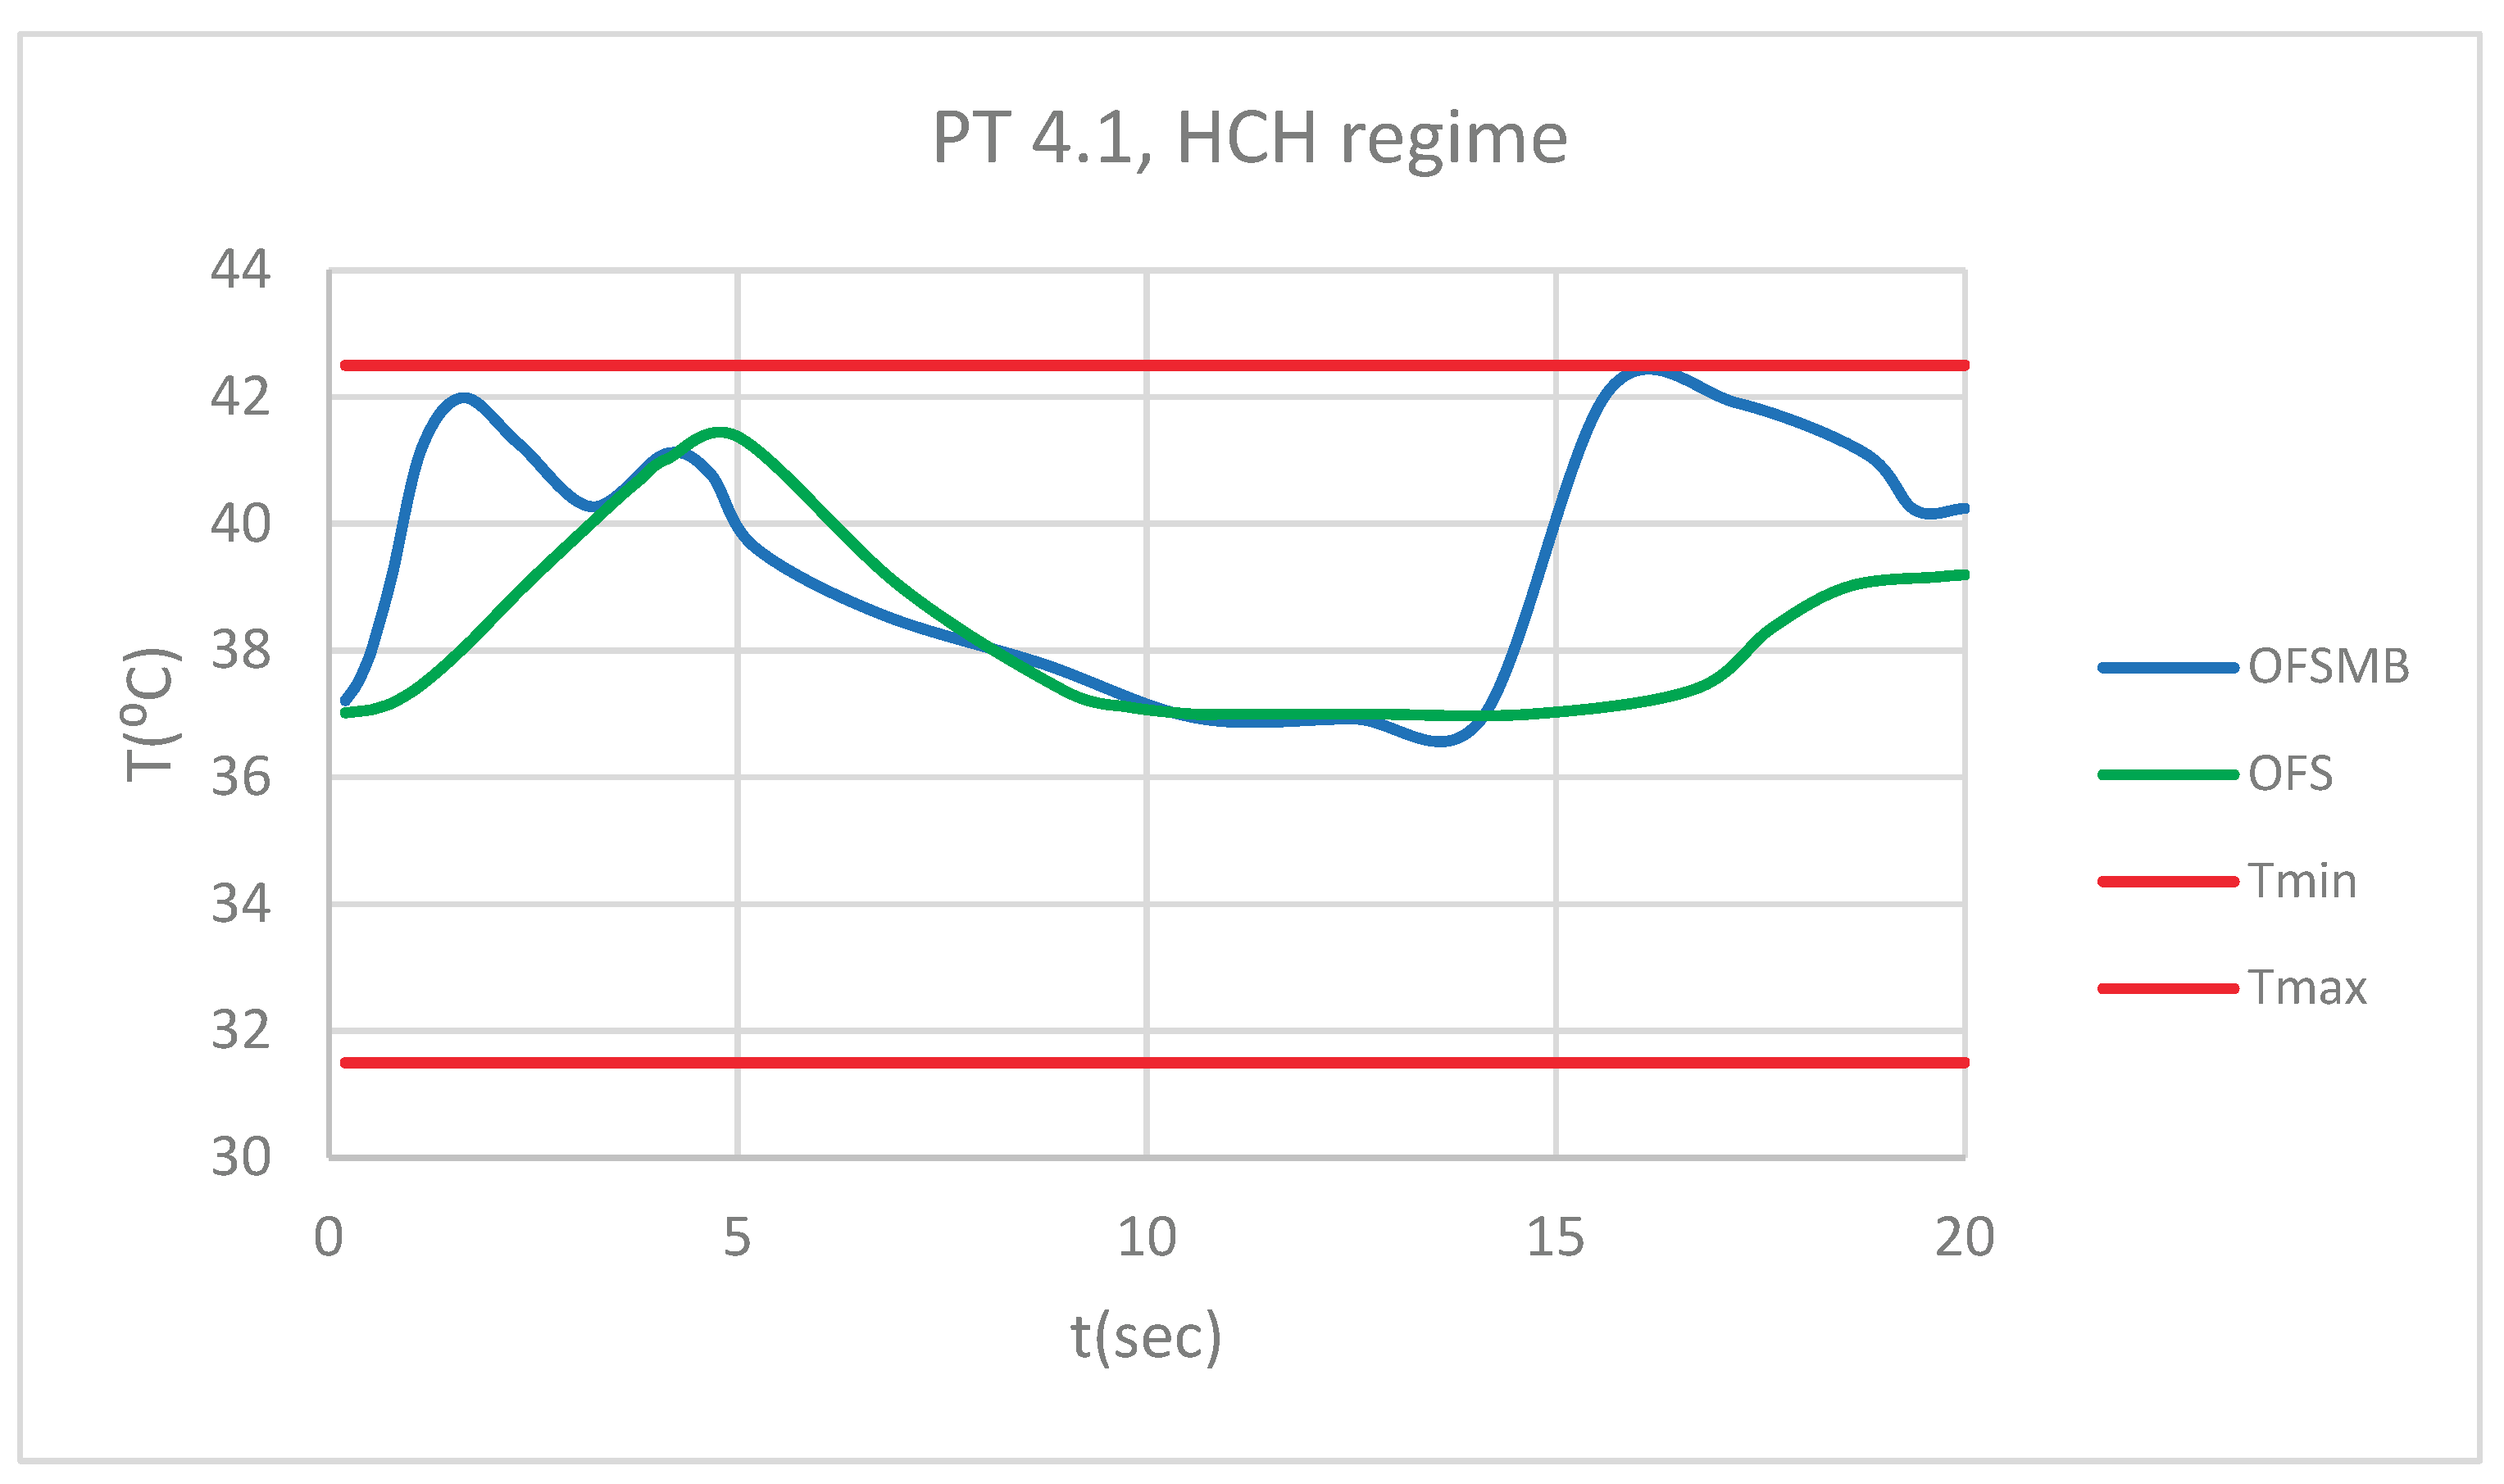
Figure 46.
Comparative diagram of how temperature impacts the pulp of 1.1, when subjected to CHC source.
Figure 46.
Comparative diagram of how temperature impacts the pulp of 1.1, when subjected to CHC source.
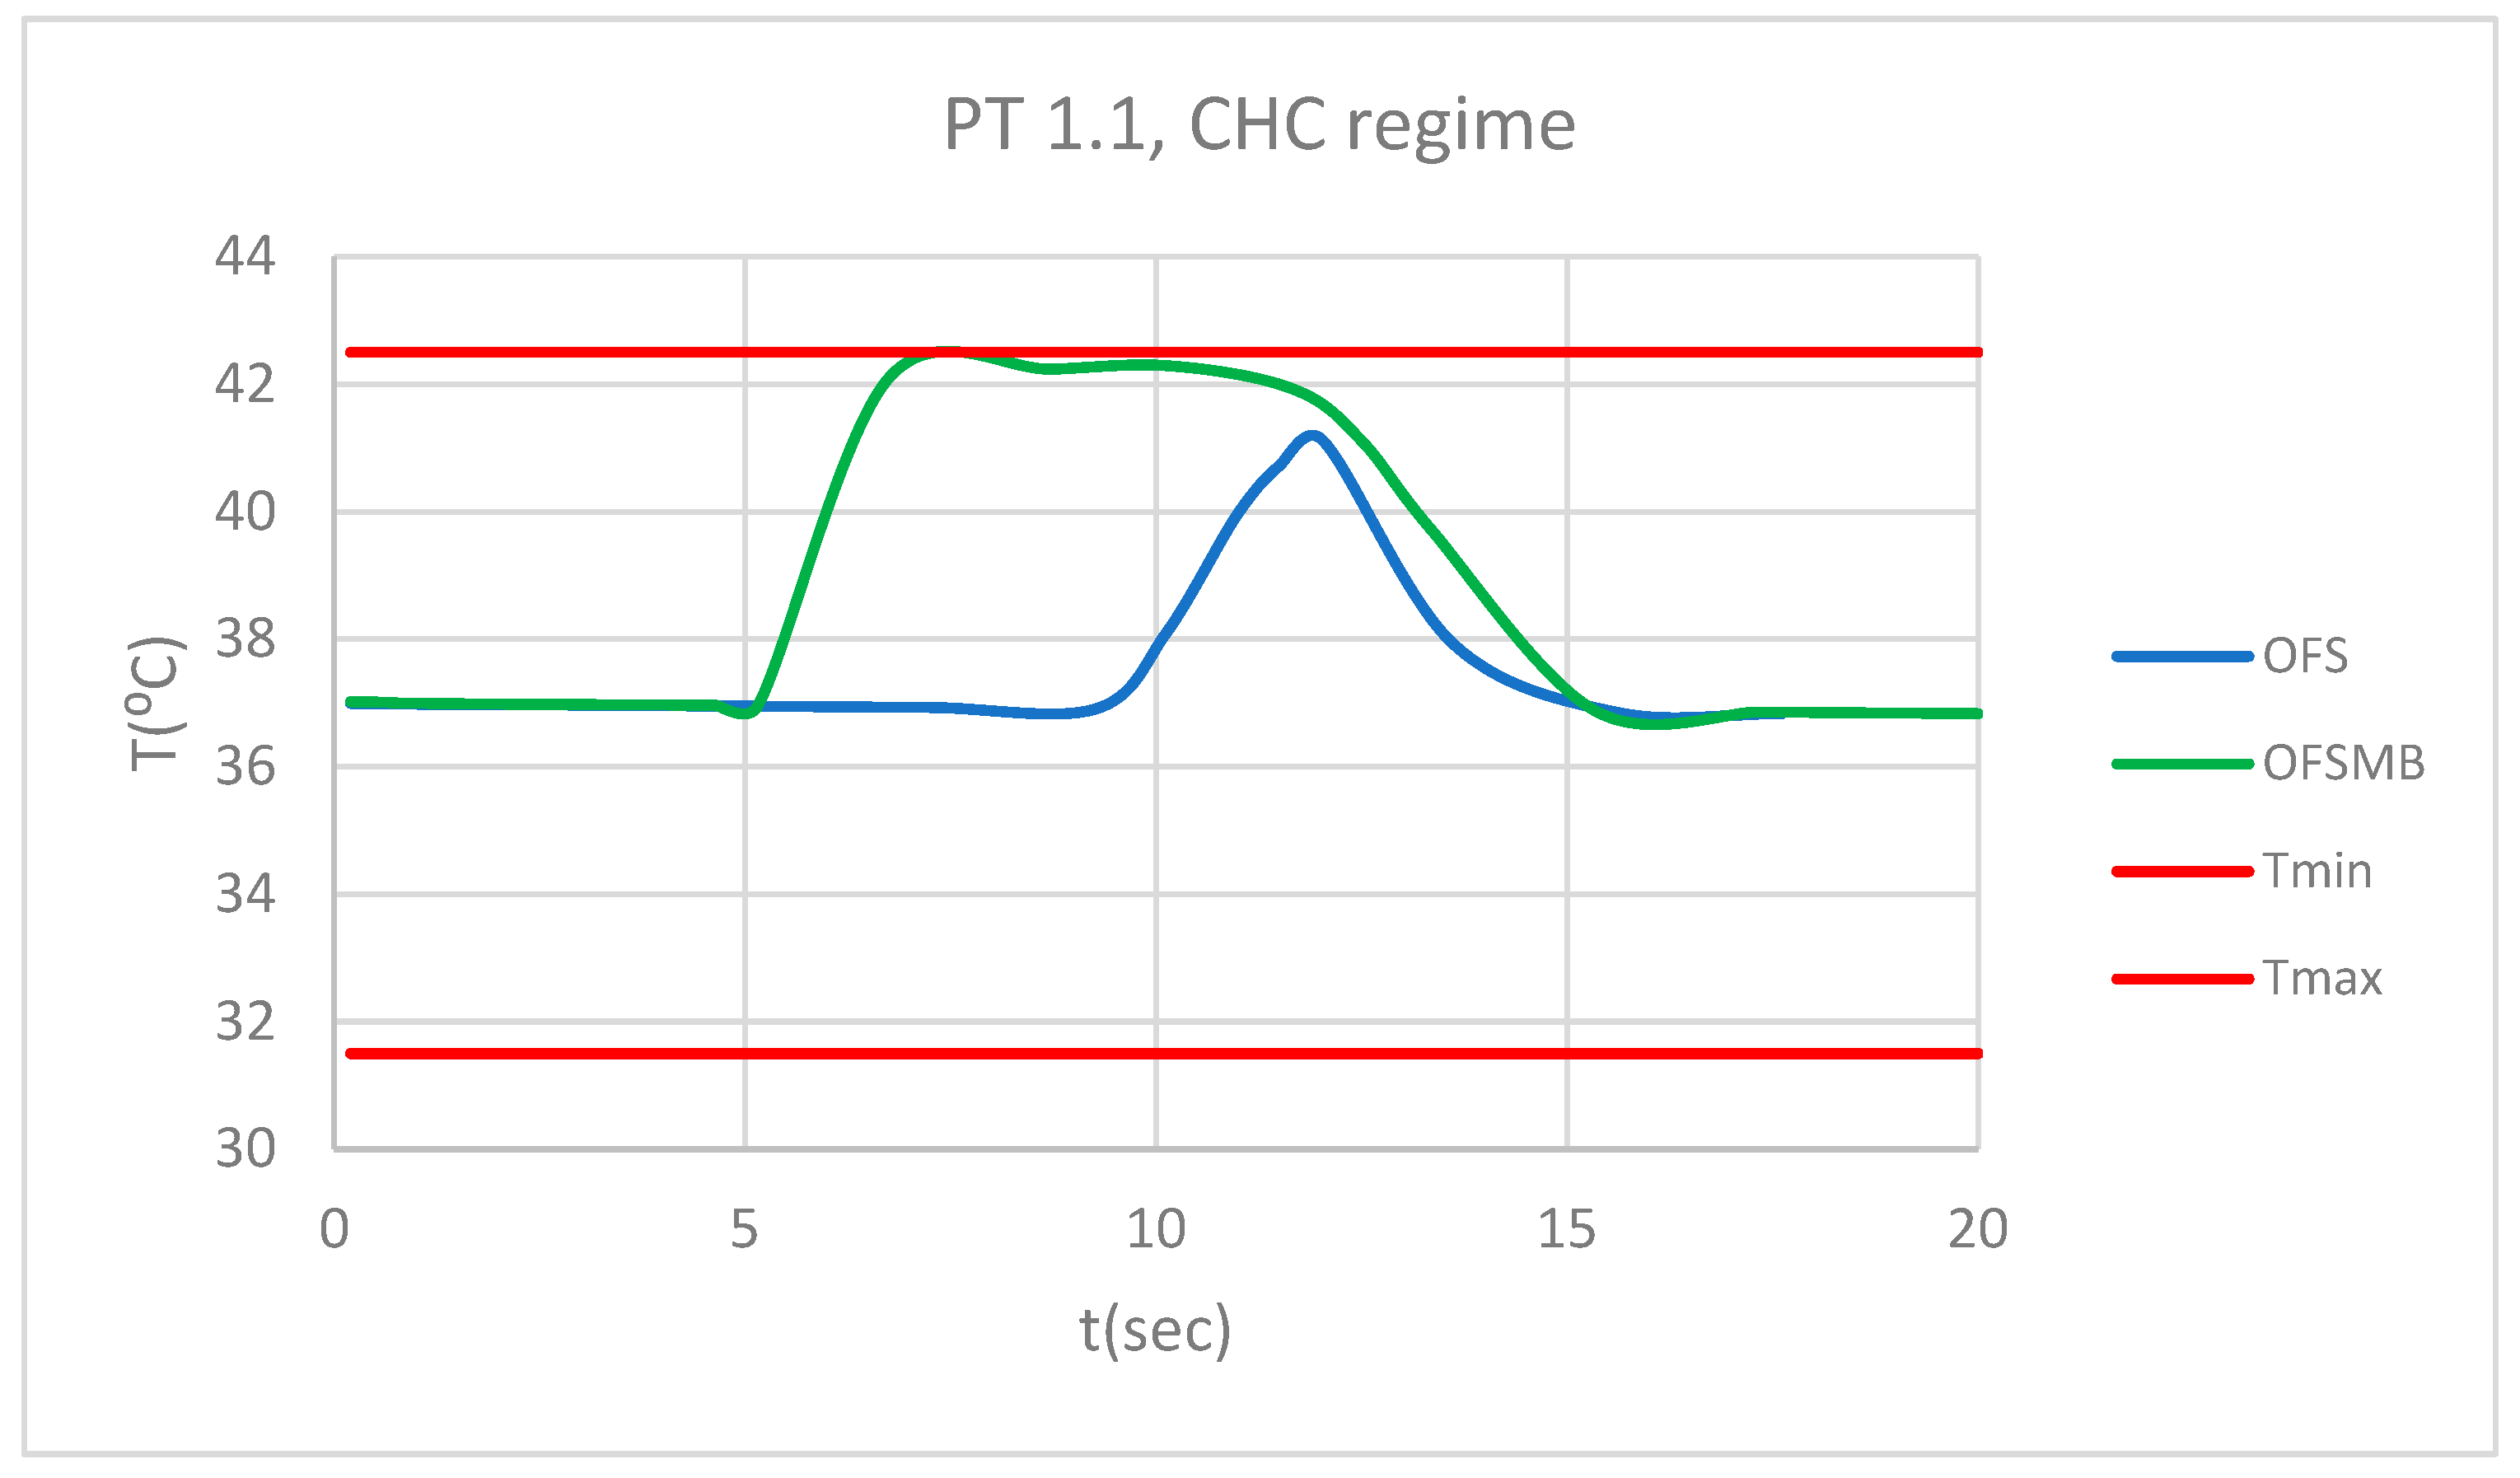
Figure 47.
Comparative diagram of how temperature impacts the pulp of 4.1, when subjected to CHC source.
Figure 47.
Comparative diagram of how temperature impacts the pulp of 4.1, when subjected to CHC source.
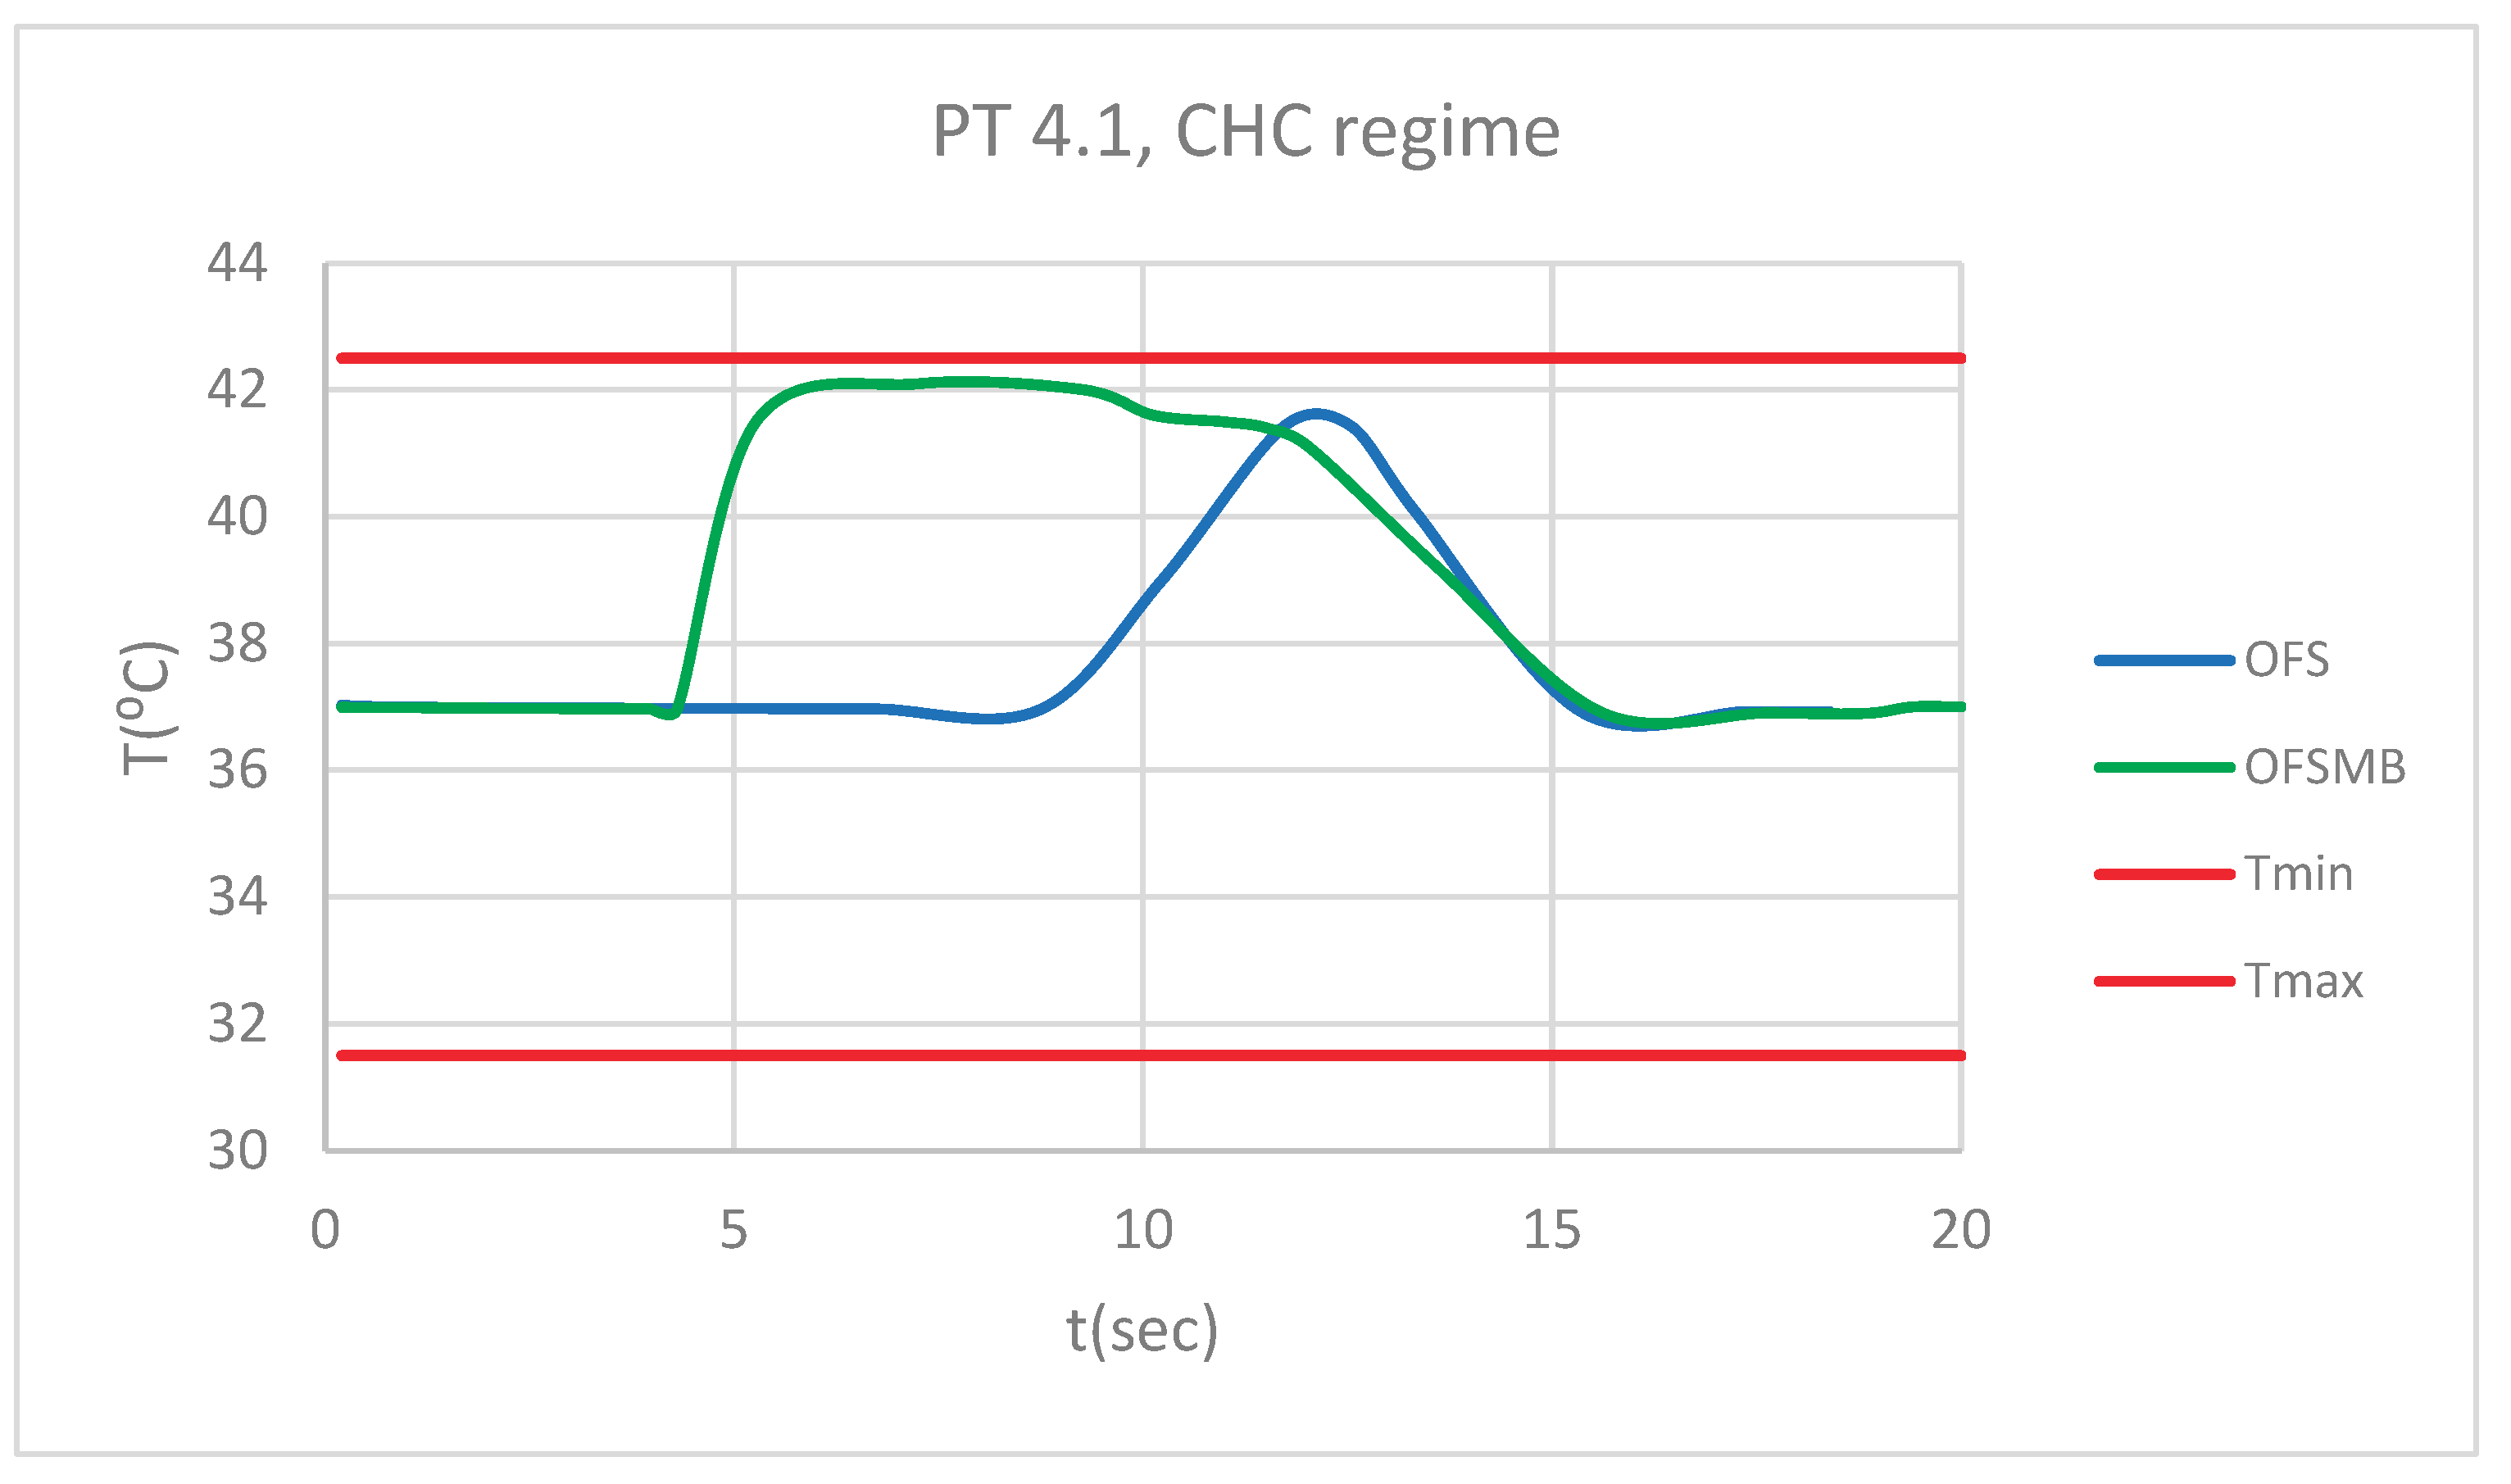

Table 1.
Thermal properties of the tissues and components used in simulations.
| Component | Density [Kg/m3] | Isotropic Thermal Conductivity [Wˑm/C⁰] | Specific Heat [JˑKg/ C⁰] |
| Enamel | 2958 | 0.93 | 710 |
| Dentine | 2140 | 0.36 | 1302 |
| Pulp | 1000 | 0.0418 | 4200 |
| Maxillary bones | 2310 | 1 | 2650 |
| Ni + Cr alloy (bracket and tube-type elements) | 8500 | 13 | 460 |
| Ni + Ti alloy (orthodontic wires) | 6450 | 60 | 457 |
Disclaimer/Publisher’s Note: The statements, opinions and data contained in all publications are solely those of the individual author(s) and contributor(s) and not of MDPI and/or the editor(s). MDPI and/or the editor(s) disclaim responsibility for any injury to people or property resulting from any ideas, methods, instructions or products referred to in the content. |
© 2025 by the authors. Licensee MDPI, Basel, Switzerland. This article is an open access article distributed under the terms and conditions of the Creative Commons Attribution (CC BY) license (http://creativecommons.org/licenses/by/4.0/).
Copyright: This open access article is published under a Creative Commons CC BY 4.0 license, which permit the free download, distribution, and reuse, provided that the author and preprint are cited in any reuse.


