Submitted:
24 July 2025
Posted:
28 July 2025
You are already at the latest version
Abstract
Understanding milk yield recovery following clinical mastitis (CM) and its influencing factors is essential for effective mastitis control. This study investigated the associations between quarter-level milk yield recovery and milk loss, somatic cell count (SCC), clinical severity, and causative pathogens. Recovery was measured as percentage recovery, for inflamed and uninflamed quarters separately. We analyzed 117 CM cases, identifying 117 quarter-level milk yield perturbations (qMYPs) in inflamed quarters and 299 in uninflamed quarters. qMYPs were categorized as quickly recovered, slowly recovered, or non-recovered. Recovery was compared across groups and quarter types using the average and slope of percentage recovery over time. Correlation and regression analyses were conducted to assess associations with milk loss, SCC, clinical severity, and pathogens. Inflamed quarters showed similar recovery to uninflamed quarters in recovered groups but worse recovery in the non-recovered group. In inflamed quarters, greater milk loss, higher SCC, more severe clinical signs, and major pathogen were associated with poorer recovery while these factors were linked to worse early recovery but better recovery over time in uninflamed quarters. Short- and long-term recovery were influenced differently in inflamed and uninflamed quarters. These findings improve understanding of CM recovery and may support selective treatment, reduce disease impact, and enhance animal welfare in dairy production.
Keywords:
clinical mastitis
; milk loss
; somatic cell count
; clinical severity
; pathogens
; mastitis control
; milk yield recovery dynamics
1. Introduction
Clinical mastitis (CM) is one of the most common and costly diseases in the dairy industry [1,2]. To minimize the impact of a CM case, it is crucial to strive for fast and comprehensive recovery, including quick healing of the intra-mammary tissue, complete clearance of the causal pathogen, disappearance of clinical symptoms, and fast return of milk production [3,4,5]. These different aspects of recovery not only reflect the udder health but are also a proxy for the cow’s general well-being and overall productivity. They display the economic and welfare challenges associated with CM and, upon better understanding, may help the development of selective treatment plans and ultimately contribute to reduced antibiotic use [6,7,8].
The eradication of pathogens and the disappearance of clinical symptoms of CM cases are generally defined as “pathogen cure” and “clinical cure” respectively [3,9]. Previous studies have found associations between CM clinical severity upon detection and the pathogen cure rate, with severe mastitis being associated with lower pathogen cure rates [9,10] Yet, no significant differences in clinical cure rates were found between mild, moderate and severe CM cases [11]. Although useful, evaluating the pathogen or clinical cure requires repeated milk sample taking or clinical scoring, both laborious tasks.
High-frequency milk yield data of individual cows are now available on the majority of dairy farms, even at udder quarter level for cows milked by an automatic milking system (AMS). These data allow us to study the impact of health and environmental challenges on milk yield dynamics and calculate associated milk losses [12,13,14] Following this approach, several studies have already quantified the milk yield dynamics and losses linked with CM cases [15,16,17]. Moreover, if milk yield data are available at udder quarter level, the milk yield dynamics of uninflamed and inflamed quarters can be studied separately, reflecting respectively the systemic effect of the inflammation (e.g., loss of appetite, disposition of energy for immune response and inflammation) and an accumulation of the local (e.g., tissue damage by pathogen toxins and immune response) and systemic effects [15]. Exploring these milk yield dynamics can help to improve our understanding of the underlying mechanisms and potential future impacts of CM. Additionally, this approach also opens the door for studying milk yield recovery after detection of CM, as the milk yield gradually returns to the expected “healthy production”, as well as factors affecting this process [18].
Previous studies have shown that milk loss, somatic cell count (SCC), clinical severity, and causative pathogens can influence mastitis outcomes [3,9,16,19]. In this study, we hypothesized that these factors offer valuable insight into quarter-level milk yield recovery in CM cases. The objectives were to: (1) the differences in milk yield recovery between inflamed and uninflamed quarters of cows with naturally occurring CM, (2) the variances in the milk yield recovery dynamics for these inflamed and uninflamed quarters, and (3) the associations between quarter-level milk yield recovery and milk loss, SCC, clinical severity and causative pathogens. These insights could aid in estimating recovery for different scenarios upon CM detection, facilitating individualized and optimized treatment protocols, and thereby maximizing timely recovery of CM with minimal antibiotic use and economic losses.
2. Materials and Methods
2.1. Data Collection, Selection and Preprocessing
Between January 2019 and August 2021, all naturally occurring CM cases were monitored at 3 farms with an automatic milking system (AMS) of DeLaval (VMS Classic, Tumba, Sweden) in Belgium and the Netherlands. All farms had more than 3 years of experience with the AMS before the start of the experiment. The CM cases were detected by the herdsmen using measures from the AMS and associated sensors, including quarter-level electrical conductivity (inter-quarter ration > 115%) [20,21], quarter-level milk blood concentration (> 600 ppm) [22], mastitis detection index (> 1.4) [23] and cow-level lactate dehydrogenase-based mastitis attention (> 70%) [21]. Trained herdsmen confirmed CM in suspected cows based on clinical signs and identified the inflamed quarter. For each case, cow identity (ID), detection date, inflamed quarter, and treatment were recorded.
Four main sources of data were collected for this research for each CM case. First, high-frequency quarter-level milk yield data (qMY) were automatically collected by the AMS. The daily quarter-level milk yield (dqMY) data was calculated by summing qMY per day. To account for variable milking intervals, every first milking after midnight was proportionally split between the previous and current day based on its milking interval. The second data source comprised weekly composite SCC results collected by the AMS for each lactating cow in the three herds [24], which were performed by an accredited lab (MCC – Milk Control Centre Flanders, Lier, Belgium) following official guidelines [25,26]. After CM detection, sampling frequency increased to every milking for the following 21 days. Third, clinical signs were recorded by herdsmen using a predefined protocol on detection day (day 0), day 3, and day 7 after CM detection. The clinical signs were marked as “present” or “absent” at three levels: the milk level (flocks, cloths/aggregates, blood in milk or watery milk), the quarter level (redness, hard, swollen, or painful udder), and the systemic level (fever, sunken eyes, or loss of appetite). The fourth data source included bacteriological culture results from milk samples collected from the inflamed quarter on day 0, frozen at –21°C, and analyzed for pathogens by the laboratory (MCC – Milk Control Centre Flanders, Lier, Belgium) following the National Mastitis Council guidelines [27]. The herdsmen were trained by M-team UGent veterinarians to identify CM cases using AMS and sensor data, score the clinical signs, and collect milk samples for culturing.
Clinical mastitis cases were included if they had: (1) at least one SCC measurement from 7 days before to 14 days after detection; (2) valid, uncontaminated pathogen culture results on day 0 (showing no more than two species in the culture results); (3) clinical sign records between day 0 and 7; and (4) only one inflamed quarter per case. Recurrent cases in the same quarter and lactation were included if clinical signs had fully resolved for four weeks.
2.2. Detection of Quarter-Level Milk Yield Perturbations Caused by CM
Altered milk yield dynamics caused by CM often appear as perturbations in the lactation curve [12]. To detect quarter-level milk yield perturbations (qMYP), the unperturbed lactation curve (ULC) of each quarter for each lactation was estimated using the iterative Wood model with variable thresholds [12,28]. The ULC of each quarter lactation was subtracted from the daily quarter-level milk yield (dqMY) to obtain the daily quarter-level milk loss (dqML) series (Figure 1). In our study, a qMYP was defined as a period of at least 3 successive days of negative milk loss for which dqMY dropped at least once below 90% of the expected yield (e.g. ULC). A qMYP was considered recovered if the dqML returned to a positive value. Additionally, a qMYP was attributed to a CM case when the period of the qMYP included the CM detection day or began within one week after the detection day.
2.3. Percentage Recovery
To define the percentage recovery, the qMYP was divided into a “developing phase” and a “recovery phase”. To this end, we smoothed the dqML series of each qMYP using a third-order Savitzky-Golay polynomial smoother with a window size of 5 days. The maximum milk loss (MML) was identified as the minimum of the smoothed dqML associated with the qMYP. The “developing phase” and the “recovery phase” of the qMYP are respectively the periods before and after the day of MML (i.e. the nadir day). The percentage recovery was defined as 1 - for each day during the recovery phase. The term , which is the proportion of milk loss in comparison to MML, represents the percentage of milk yield that cows would still need to recover to reach the expected level of milk production when no perturbation was present [12,29] An example of a qMYP and its associated percentage recovery is shown in Figure 2.
Most studies agree that the recovery of milk losses during CM can last up to 4 weeks after detection [16,30], therefore, the percentage recovery was calculated for at most 4 weeks after the nadir day. Due to the focus of our study on milk yield recovery, qMYPs without a recovery phase (i.e. showing only a developing phase) were excluded from our study.
2.4. Recovery Patterns Between Inflamed and Uninflamed Quarters
To identify different recovery dynamic patterns, qMYPs were classified separately for inflamed and uninflamed quarters into three groups based on recovery duration: quickly recovered (within two weeks), slowly recovered (between weeks 3 and 4), and non-recovered (beyond four weeks).
To quantify and compare the level and speed of recovery, we calculated the average percentage recovery (APR) and the slope of percentage recovery (SPR) in 5 distinct time intervals: days 1 to 3, days 4 to 7, week 2, week 3, and week 4 following the nadir day (day 0). The SPR was calculated as the slope of the percentage recovery between the first and last day within each time interval.
We conducted the following analysis to explore differences in recovery between inflamed and uninflamed quarters for different groups: First, we compared the distribution of APR (in %) and SPR in each time interval between inflamed and uninflamed quarters. Next, the distribution of APR and SPR between adjacent time intervals (e.g. between the time interval of days 1 to 3 and the time interval of days 4 to 7) were compared for inflamed and uninflamed quarters. Since APR and SPR were not normally distributed, a Mann-Whitney test was performed. The null hypothesis stated that there was no significant difference in the distributions between the two groups.
2.5. Associations Between Quarter-Level Milk Yield Recovery and Milk Loss, Somatic Cell Count, Clinical Signs, and Pathogens
Milk loss. For each CM case, we calculated the quarter-level maximum relative milk loss (qMRML) over the period from 7 days before to 14 days after the detection day (day 0) for inflamed and uninflamed quarters separately. Relative dqML series was obtained by dividing the absolute milk loss by the ULC for each day. For inflamed quarters, qMRML was calculated as the maximum relative dqML within the 3-week window. For uninflamed quarters, qMRML was calculated as the average of the qMRML across all uninflamed quarters during this period.
Somatic cells count. We calculated the maximum somatic cell count deviation (MSCCD) based on the difference between the maximum SCC value (max (SCC)) from day -7 till day 14 and a cow-level healthy SCC baseline (SCCh). SCCh was defined per lactation as the average of all SCC values below 200,000 cells/mL [31]. A cow-level baseline was used to account for differences in SCC between cows and parities [32]. To reduce variability and enhance suitability for statistical analysis, both SCC and SCCh were log-transformed. MSCCD was calculated as log(max(SCC)/1000) − log(SCCh/1000).
Clinical severity. Clinical severity was classified based on the presence of signs at the milk, udder, and systemic levels [33,34]. Between day 0 and day 7, cases showing only milk-level signs were categorized as “mild”. If udder-level signs were observed, the case was classified as “moderate”, and if systemic symptoms were present, it was considered “severe”.
Causative pathogens. The causative pathogen was identified from bacteriological culture results of milk samples collected from the inflamed quarter on day 0. Samples with negative bacteriological results, as well as those only containing Aerococcus spp., Bacillus cereus, or Bacillus spp., which were likely due to contamination during sample collection, were classified as “culture-negative”. Staphylococcus aureus, Streptococcus, Strep-like organisms, Coliforms, Yeasts, Serratia spp., Klebsiella spp. and Trueperella pyogenes were classified as “major pathogen” due to their higher virulence and greater damage to the udder compared to other pathogens [35,37]. If at least one major pathogen was detected, the case was categorized as “major pathogen”. Cases with no major pathogens and not classified as culture-negative were categorized as “minor pathogen”.
To investigate the associations between milk yield recovery and milk loss, SCC, clinical severity, and causative pathogens, we conducted two analyses. First, we investigated the pairwise correlations between the milk yield recovery (APR and SPR) and qMRML, MSCCD, clinical severity, causative pathogens by calculating the Spearman correlation values. Next, we performed the following regression analyses to explore the associations between the recovery indicators (APR and SPR) and qMRML, MSCCD, clinical severity, causative pathogens simultaneously:
where Y represents the APR or SPR in different time intervals, qMRMLi and qMRMLu represent the qMRML for inflamed and uninflamed quarters respectively, and is the error. qMRMLi and qMRMLu are continuous effects, while clinical severity and pathogens are ordinal categorical effects, with “mild” clinical severity and “culture-negative” pathogen serving as reference groups. Given the correlations among the independent variables (qMRML, MSCCD, clinical severity, and causative pathogens), we calculated variance inflation factors (VIF) to test for multicollinearity and ensure reliable estimation and prediction before conducting the regression analysis. To increase the interpretability of the regression models, qMRML and MSCCD were normalized by subtracting the mean and dividing by the standard deviations. Additionally, APR or SPR values for which the Cook’s distance exceeded four times the average were considered as outliers and excluded from the regression analysis, as such values bias the estimation of regression coefficients.
3. Results
During the trial period, 176 CM cases were detected from 135 cows on the three farms. After applying the selection criteria, 47 cases (27%) were excluded — 27 due to incomplete data and 20 due to inflammation in multiple quarters. This resulted in 129 CM cases, of which 122 (95%) concurred with a qMYP in the inflamed quarter whereas for 7, no perturbation was found. Out of the 122 cases with qMYPs, 5 (4%) only had the developing phase, 80 (66%) had a qMYP in all four quarters, 24 (20%) had a qMYP in three quarters, 11 (9%) had a qMYP in two quarters, and 2 (2%) had qMYP only in one (i.e. the inflamed) quarter. After exclusion of CM cases that without a detectable milk yield perturbation or that only had the developing phase, 117 CM cases from 96 cows and 104 lactations remained for our study, including 117 (96%) qMYPs in the inflamed quarters and 299 (97%) qMYPs in the uninflamed quarters.
3.1. Description of the Clinical Mastitis Cases
Table 1 presents the distribution of qMRML, MSCCD, clinical severity and causative pathogens of CM cases. As shown, inflamed quarters exhibited higher mean qMRML values compared to uninflamed quarters. Mild cases had the lowest qMRML and MSCCD compared to moderate and severe cases. Of the 117 total cases, 88 (75%) had pathogen test results, with major pathogens identified in 81% of these. Culture-negative cases showed higher qMRML and MSCCD values than minor pathogen cases.
3.2. Percentage Recovery
Table 2 shows the number of qMYPs in inflamed and uninflamed quarters that recovered within different time intervals. Overall, 47% (55/117) of inflamed quarters and 68% (203/299) of uninflamed quarters recovered within four weeks after the nadir day. Among all recovered quarters, 65% (36/55) of inflamed quarters and 74% (150/203) of uninflamed quarters were classified as “quickly recovered” group (recovered within two weeks).
The percentage recovery was calculated separately for inflamed and uninflamed quarters over the four weeks following the nadir day. To focus on the active recovery phase, qMYPs were excluded once recovery was achieved, therefore fewer qMYPs are included in the later periods over the course of four weeks. Overall, the median percentage recovery in the inflamed quarters was lower than in the uninflamed quarters, as shown in Figure 3. The inflamed quarter recovered approximately 30% from MML by day 3, 50% by day 7, and 60% by day 14, with a slight decline in the following weeks. In contrast, the uninflamed quarters recovered around 60% by day 3, 70% by day 7, and 80% by day 14, maintaining a similar recovery level thereafter.
3.3. Recovery Between Inflamed and Uninflamed Quarters
The comparisons of APR and SPR between inflamed and uninflamed quarters, in the different time intervals after the nadir day (days 1-3, days 4-7, week 2, week 3, and week 4) are shown in Table 3. For groups that recovered within four weeks, no differences (P>0.05) were observed in the APR and between inflamed and uninflamed quarters. For example, in the quickly recovered group (those recovered within two weeks), both inflamed and uninflamed quarters showed similar recovery patterns, with approximately 50% recovery from MML within the first three days, 75% recovery during days 4-7, and 85% recovery by week 2. Additionally, in the slowly recovered group, a significantly higher SPR (P<0.05) was found in inflamed quarters during week 3, indicating that inflamed quarters recovered faster than uninflamed quarters during this period.
For the non-recovered group, the APR was found to be significantly lower in inflamed quarters compared to uninflamed quarters across all time intervals. For instance, in the time interval of days 4-7, uninflamed quarters recovered 52% from MML, while inflamed quarters recovered around 25% (both median values). Additionally, a significantly lower SPR (P<0.05) was observed in inflamed quarters as compared to uninflamed quarters during days 1-3, suggesting that inflamed quarters recovered slower during this time interval. The difference in APR between inflamed and uninflamed quarters in all time intervals of the non-recovered group thus seems to originate from the difference in SPR during days 1-3. Besides that, APR has a greater IQR in inflamed quarters than uninflamed quarters, indicating greater variability in recovery levels among inflamed quarters.
3.4. Recovery Between Adjacent Time Intervals in Inflamed and Uninflamed Quarters
The differences in APR and SPR between adjacent time intervals in inflamed and uninflamed quarters are visualized in Figure 4. For groups that recovered within four weeks, both inflamed and uninflamed quarters showed a significant increase (P<0.05) in recovery levels (APR) between adjacent time intervals. However, differences were observed in recovery speed (SPR). In the quickly recovered group, the recovery speed (SPR) significantly decreased (P<0.05) from days 1–3 to days 4–7 in both inflamed and uninflamed quarters, with inflamed quarters continued to show a significant decline in recovery speed from days 4–7 to week 2 (P<0.05), whereas uninflamed quarters stabilized after the initial decrease. In the slowly recovered group, the recovery speed (SPR) followed similar patterns in both inflamed and uninflamed quarters. A significant decrease in SPR was observed from days 1–3 to days 4–7 (P<0.05). From week 2 to week 3, no significant change in recovery speed was noted (P>0.05), but a notable decline was observed from week 3 to week 4 (P<0.05).
For the non-recovered group, recovery levels in inflamed quarters increased significantly (P<0.05) only during the first two weeks, while uninflamed quarters continued to increase (P<0.05) for three weeks after the nadir day. Regarding recovery speed, both inflamed and uninflamed quarters experienced a significant decline (P<0.05) during the first three weeks, with no changes in week 4 (P>0.05).
3.5. Associations Between Quarter-Level Milk Yield Recovery And Milk Loss, Somatic Cell Count, Clinical Signs, and Pathogens
3.5.1. Correlation Analysis
Figure 5 presents the Spearman correlation coefficients between qMRML, MSCCD, clinical severity, causative pathogens, and APR as well as SPR across different time intervals. Most of the correlations are statistically significant (P<0.05), indicating meaningful associations between these factors and recovery levels. As shown in Figure 5, qMRML, MSCCD, clinical severity, and causative pathogens are negatively correlated with APR in inflamed quarters, indicating that greater milk loss, higher SCC, more severe clinical signs, and the presence of major pathogens are associated with poorer recovery. Similarly, these variables show negative correlations with SPR during the first three days in inflamed quarters. In uninflamed quarters, these variables show negative correlations with APR during the first week, indicating poorer early recovery, but shift to positive correlations in the following weeks, suggesting improved recovery over time. For SPR, negative correlations are observed during the first three days, but positive associations are observed in certain time periods thereafter.
3.5.2. Regression Analysis
All independent variables had VIF below 2.5, suggesting that the predictors contributed independently to the model, allowing for reliable interpretation for their effects. The regression results are presented in Table 4 and Table 5. As shown in Table 4, milk loss, SCC, clinical severity, and causative pathogens influence APR differently in inflamed and uninflamed quarters. For instance, each unit increase in qMRMLu during the first three days is associated with a 6% decrease in APR in inflamed quarters and a 9% decrease in uninflamed quarters. In inflamed quarters, qMRML negatively affected recovery throughout the first three weeks following the nadir day, whereas in uninflamed quarters, its impact was limited to the first two weeks. MSCCD was positively associated with APR in inflamed quarters during the initial three weeks but showed no significant effect in uninflamed quarters. Higher clinical severity was linked to better recovery, particularly in uninflamed quarters during the third and fourth weeks. In contrast, the presence of minor or major pathogens was associated with poorer recovery in both inflamed and uninflamed quarters compared to culture-negative cases. Overall, models predicting recovery in uninflamed quarters generally had lower R² values than those for inflamed quarters.
For SPR, milk loss, SCC, clinical severity, and causative pathogen have varying effects in inflamed and uninflamed quarters. For instance, with each additional unit increase in qMRMLu, the SPR decreased by 2.23% in the inflamed quarter and decreased by 3.32% in uninflamed quarters during the first three days. Consistent with the results in APR, qMRMLi affected SPR only in the inflamed quarters, whereas qMRMLu influenced SPR in both inflamed and uninflamed quarters. Additionally, MSCCD had a significant positive impact on the SPR in the inflamed quarter only during the first week, while it had no effect on the uninflamed quarters. Clinical severity and causative pathogens affected the SPR in both inflamed and uninflamed quarters to some extent. The R² value exceeds 20% for the model with inflamed and uninflamed quarters only during the first three days.
4. Discussion
4.1. Description of Clinical Mastitis Cases
Since dqMY can be influenced by factors such as parity and lactation stage, we calculated qMRML instead of absolute loss to enable a more meaningful and comparable assessments. In addition, MSCCD was calculated based on deviations from a cow-level SCC baseline, which not only reflects the “uninfected” status but also accounts for individual differences due to factors such as parity or disease history [32]. Causative pathogens were grouped into three categories: culture-negative, presence of only minor pathogens, and presence of major pathogens. This approach was intended to reduce variability and increase the sample size within each group, thereby enhancing statistical power to detect meaningful associations. It also allowed for a simplified analytical framework while retaining critical distinctions in recovery outcomes. However, we acknowledge that this grouping may mask specific characteristics associated with individual pathogens. Despite this limitation, as pathogen prevalence can vary considerably across farms [38,39], we believe that using these categories is appropriate to generate more generalizable results.
For CM cases, since inflamed quarters experience greater and more prolonged milk losses [40], qMRML was higher in inflamed quarters compared to uninflamed quarters. This difference highlights both local and systemic effects of mammary [41]. The mean MSCCD was 3.65, indicating that the maximum SCC during CM episodes was, on average, 38.47 times higher than the healthy baseline SCC, reflecting the rapid and pronounced immune response to inflammation [19,42].
Most CM cases in our dataset were classified as mild to moderate in clinical severity, aligning with prior studies; however, the proportion of severe cases was slightly higher in our sample [34,43,44]. In terms of pathogen distribution, 24% of cases were culture-negative, and the majority were caused by major pathogens, consistent with previous research [34,45]. These similarities with previous studies support the representativeness of our dataset, providing a strong basis for further analysis.
4.2. Quantification of the Recovery Via Quarter-Level Milk Yield Perturbations
Mastitis-associated milk losses in dairy cows significantly impact farm profitability and sustainability, manifesting as altered milk yield dynamics seen as perturbations in the lactation curve [12,38,46]. As a result, quarter-level milk yield perturbations (qMYPs) are often observed, particularly in the inflamed quarters, as CM has a detrimental impact on milk production [7]. In our study, 7 CM cases had no qMYP during the inflammation. All these cases occurred in early lactation. Detection of perturbations in early lactation is more difficult with our method, as deviating milk yield in early lactation might result in an underestimation of the ULC [14]. Also, 4% of qMYPs in the inflamed quarter and 3% of qMYPs in the uninflamed quarters lacked a recovery phase and were therefore excluded from our study. All these qMYPs occurred in late lactation, which might explain the reason why the quarters were dried off or fell dry after infection [47].
4.3. Percentage Recovery
Thanks to the implementation of sensor technology and the availability of high-frequency sensor data, conducting in-depth research into milk yield dynamics has become possible. In this study, we researched the milk yield recovery by calculating the percentage milk yield recovery during the recovery phase of the qMYP period linked to a CM case. The recovery dynamic might not be restricted to CM cases and this methodology could be applied to other datasets to investigate the effect of different causalities. For example, it can be used to analyze the perturbations caused by specific environmental challenges such as heat stress, enabling us to explore the impact on milk production and to identify animals with better responses to these challenges [48].
In our study, more than 60% of uninflamed quarters recovered to the expected dqMY within 4 weeks, aligning with previous studies suggesting that milk yield recovery may extend up to 4 weeks after the disease diagnosis [16,30,49]. However, more than half of the inflamed quarters did not return to the expected dqMY after 4 weeks, indicating more prolonged impact on inflamed quarters compared to uninflamed quarters [40] Although inflamed quarters recovered less and more slowly than uninflamed quarters, both followed a similar pattern: steep recovery in the first three days, slower recovery from days 4 to 7, and gradual recovery through weeks 2 to 4. This trend, also observed in the study of Sguizzato [16], suggests there may exist a general recovery trend shared by both inflamed and uninflamed quarters.
The results in the quickly recovered group showed that both inflamed and uninflamed quarters followed a similar trajectory, achieving comparable recovery levels and speeds for two weeks. Although both inflamed and uninflamed quarters experienced a significant increase in recovery levels over two weeks, the speed of recovery declined sharply for inflamed quarters in the second week, whereas uninflamed quarters maintained a stable recovery speed. The observed deceleration in recovery speed as inflamed quarters approach full recovery may be attributed to inherent limitations in tissue repair mechanisms, leading to a slowdown in healing as the tissue nears complete recovery, which aligns with the natural progression of wound healing [50].
In the slowly recovered group, we found that both inflamed and uninflamed quarters followed a similar healing trajectory. Additionally, inflamed quarters recovered significantly faster than uninflamed quarters in week 3, suggesting that achieving similar recovery levels may require an accelerated recovery process for inflamed quarters compared to uninflamed ones. Both inflamed and uninflamed quarters exhibited rapid recovery during days 1–3, followed by a sharp slowdown in days 4–7. Their recovery speed remained consistent from day 4 to week 3, after which they are slowed down as they approached full regeneration.
The results of the non-recovered group showed significantly worse recovery with bigger variability in inflamed quarters compared to uninflamed quarters. During week 4, uninflamed quarters generally recovered 73% from MML while inflamed quarters only recovered 52%, indicating that inflamed quarters generally suffered more severe effects of CM [40]. The observed variability may stem from differences in individual immune responses, severity of infection, or underlying tissue damage, as noted in previous studies [28,41]. Inflamed quarters showed significant recovery only during the first two weeks, while uninflamed quarters continued to recover significantly in week 3. This suggests that inflamed quarters may experience an early but limited recovery, potentially due to the longer-lasting effects of inflammation, tissue damage, or impaired milk production capacity [40,41]. Regarding the recovery speed, both inflamed and uninflamed quarters experienced a significant decline in recovery speed over the first three weeks, followed by a stable phase in week 4.
The recovery processes for both the quickly and slowly recovered groups were similar between inflamed and uninflamed quarters, which aligns with our expectations, given that these groups were initially defined based on the time at which recovery was achieved. For the non-recovered group, significantly worse recovery levels were observed in each time interval in inflamed quarters compared to uninflamed quarters. However, a slower recovery in inflamed quarters was only observed during days 1–3, where inflamed quarters showed significantly lower recovery speeds than uninflamed quarters. This suggests that the differences in recovery levels stem from the first three days, highlighting the critical importance of this early recovery phase. These findings elucidate some similarities and differences in recovery patterns between inflamed and uninflamed quarters for different recovery groups, thereby enhancing our understanding of CM and providing valuable insights for future applications. For example, if a quarter not recovered as expected, veterinarians should consider alternative interventions to support the recovery process. However, given the limited data available for each group, further data is necessary to draw more precise conclusions. The larger sample sizes will provide more robust and informative insights into recovery patterns and treatment efficacy.
4.4. Associations Between Quarter-Level Milk Yield Recovery and Milk Loss, Somatic Cell Count, Clinical Signs, and Pathogens
The correlation analysis results for inflamed quarters align with expectations, showing that greater milk loss, stronger immune response, more severe clinical signs, and the presence of major mastitis pathogens are associated with poorer recovery and slower recovery rates [16,51]. However, for uninflamed quarters, these associations were the same during the first week, followed by better and faster recovery over the next three weeks. This may be due to the inflammation and immune response affecting the relocation of nutrients, which in turn influences the number and activity of secretory cells in both inflamed and uninflamed quarters. Consequently, when a cow recovers, the systemic effects of the CM disappear. Although the inflamed quarter might need more time to heal the local damage in the quarter, the milk production losses in this quarter could be partially compensated by the other quarters. This compensation results in less overall milk loss and better recovery in the uninflamed quarters [52,53,54].
Consistent with the results of the correlation analysis, the regression analysis showed that greater maximum milk loss in both inflamed and uninflamed quarters negatively impacts recovery in the inflamed quarters over the subsequent four weeks. In contrast, for uninflamed quarters, maximum milk loss in uninflamed quarters significantly impacted recovery only during the first two weeks. The milk loss in the inflamed quarter comes from both local tissue damage and the systemic effects of inflammation, while in uninflamed quarters it is primarily from systemic effects [41]. Our results suggest that the systemic effects primarily influence short-term recovery in uninflamed quarters. while long-term recovery in these quarters may be driven by other factors, such as potential compensation for reduced production in the inflamed quarters [52,53,54].
Higher SCC appears to aid recovery in inflamed quarters, which seems to contradict the correlation analysis results. This discrepancy may arise because the regression model accounts for the influence of all independent variables, while correlation analysis only considers the relations between recovery and MSCCD. The regression analysis showed that MSCCD significantly affects recovery in the inflamed quarters while having no significant impact on the uninflamed quarters. SCC reflects the intensity of the immune response, which primarily occurs in the inflamed quarters, directly influencing their recovery [42]. In contrast, its effect on uninflamed quarters is minimal or absent. Additionally, these effects persist for up to three weeks, suggesting that an increase in SCC significantly aids the recovery in the inflamed quarters. However, beyond this period, a higher immune response may not continue to facilitate recovery, possibly because a higher immune response is also associated with increased tissue damage in inflamed quarters [41], which may hinder long-term healing.
For clinical severity, as expected, higher clinical severity in inflamed quarters is associated with poorer recovery, particularly during the first week [16]. However, in uninflamed quarters, higher clinical severity corresponds to better recovery from the second week onwards. This may also be attributed to milk compensation by the uninflamed quarters for the milk losses by the inflamed quarters, leading to improved recovery in uninflamed quarters [52,53,54].
Additionally, the regression results for causative pathogens also aligned with our expectations, showing that minor or major causative pathogens are associated with worse recovery in both inflamed and uninflamed quarters compared to culture-negative cases. Culture-negative CM cases in our study were found to have a higher qMRML as well as MSCCD compared to minor pathogen cases. Previous studies have shown that culture-negative mastitis can result in milk losses similar to less severe or rapidly cured gram-negative infections [55,56,57]. Culture-negative CM cases in our study may reflect strong immune responses that cleared the pathogens before detection yet still led to elevated SCC and notable milk loss [58,59].
This study conducted correlation and regression analyses to explore the associations between quarter-level milk yield recovery and milk loss, SCC, clinical signs, and pathogens. Correlation analysis helps us identify pairwise associations and regression analysis helps determine which factors significantly impact quarter-level milk recovery. Although the R2 values are relatively low, particularly for models with SPR, we opted for this approach because of its simplicity and ease of interpretation, as it can offer valuable insights into the associations. This combined approach provides a comprehensive understanding of the associations involved. First, it reveals the general relation. Greater milk loss, stronger immune response, more severe clinical signs, and the presence of major mastitis pathogens are associated with poorer recovery in inflamed quarters. In uninflamed quarters, these factors are linked to worse recovery during the first week while better recovery over the subsequent three weeks. Second, the regression analysis results offer insights into how these variables impact both short-term and long-term recovery of quarter-level milk yield. Short-term recovery in inflamed quarters is more influenced by milk loss, SCC, clinical severity and causative pathogens, whereas in uninflamed quarters, short-term recovery is primarily affected by milk loss and causative pathogens. For long-term recovery, the inflamed quarter is only not influenced by clinical severity, while in uninflamed quarters, long-term recovery is not impacted by milk loss and SCC. This information improves our understanding of the disease, could assist veterinarians in developing individual tailored treatment plans, and help herd managers make better management decisions.
4.5. Application Potential and Future Work
The results in our findings offer practical applications in several ways. Firstly, if more data were available, models could be developed to predict recovery from CM. This model could then assist in monitoring and forecasting milk yield recovery from CM, enabling veterinarians to identify underperforming quarters early and intervene promptly. Secondly, the associations between treatment and milk loss, SCC, clinical severity, causative pathogens as well as recovery need to be explored. This information can help veterinarians make individually tailored and data-based treatment plans, improving treatment success, reducing antibiotic use, and enhancing the sustainability of the dairy sector [8]. Additionally, by exploring the recovery dynamics in different groups, the results can aid in more precisely monitoring and forecasting final recovery outcomes, thus helping to evaluate the disease resistance of cows and identify animals that recover better from CM. When integrated with genetic information, the results also present an opportunity for breeding and selection. Beyond factors such as parity, LS and position, it is imperative to delve deeper into the impact of herd, farm, seasonal effects, and different management practices on milk yield recovery in CM cases [2,12,13]. More data will contribute to a more comprehensive understanding of these influences.
5. Conclusions
This study explored the quarter-level milk yield recovery in CM cases and the association with milk loss, SCC, clinical severity and causative pathogens. The inflamed and uninflamed quarters in the quickly and slowly recovered groups exhibited similar recovery patterns. However, in the non-recovered group, inflamed quarters showed worse and slower recovery than uninflamed quarters. Additionally, our analysis revealed that greater milk loss, stronger immune response, higher-level clinical signs, and the presence of major mastitis pathogens are associated with worse recovery in the inflamed quarters. In contrast, in uninflamed quarters, they are linked to worse recovery during the first week, but better recovery over the subsequent three weeks. Moreover, in inflamed quarters, short-term recovery depends on all four factors, while long-term recovery is affected by all except clinical severity. In uninflamed quarters, short-term recovery is affected by milk loss and pathogens, while long-term recovery is only affected by clinical severity and pathogens. These analyses improve our understanding of recovery from CM and offer opportunities for monitoring and forecasting the milk yield recovery from CM, which helps veterinarians and farmers make informed treatment decisions, thereby minimizing production loss and improving animal welfare.
Author Contributions
Conceptualization, Y.S., B.A. and I.A.; Data curation, M.G., B.A. and I.A.; Formal analysis, Y.S.; Funding acquisition, B.A.; Investigation, Y.S.; Methodology, Y.S., I.A. and B.A.; Project administration, B.A. and I.A.; Resources, B.A.; Software, Y.S.; Supervision, B.A. and I.A.; Validation, Y.S.; Visualization, Y.S. and I.A.; Writing – original draft, Y.S. and I.A.; Writing – review & editing, M.G., L.D. and B.A. All authors have read and agreed to the published version of the manuscript.
Funding
This research was funded by VLAIO as an LA-trajectory (Brussels, Belgium), with grant number HBC.2016.0774.
Institutional Review Board Statement
Ethical review and approval were waived for this study. All data collected for this study are obtained through observation as part of conventional diary management practices (clinical scoring, milk sample taking, mastitis treatment). No additional interference with the animals on top of normal dairy cow management was introduced in the context of this study. Therefore, no approval of the experiment by an ethical committee is needed according to the Belgian ethical guidelines.
Data Availability Statement
The data presented in this study are available upon request from the corresponding author. The data is not publicly available to protect the privacy of the farmers and farms involved in the research.
Acknowledgments
The authors express gratitude to the Chinese Scholarship Council (CSC) for financially supporting the Ph.D. study of Yifan Song. Lore D’Anvers and Martin Gote were each awarded a Ph.D. fellowship by the Fund for Scientific Research (FWO) Flanders (Brussels, Belgium), with grant numbers 1S82021N, and 1SE0922N respectively. During the preparation of this manuscript, the author(s) used ChatGPT for the purpose to polish the text. The authors have reviewed and edited the output and take full responsibility for the content of this publication.
Conflicts of Interest
The authors declare no conflicts of interest.
Abbreviations
| AMS | Automatic milking systems |
| APR | Average percentage recovery |
| CM | Clinical mastitis |
| dqMY | Daily quarter-level milk yield |
| dqML | Daily quarter-level milk loss |
| IQR | Interquartile ranges |
| MML | Maximum milk loss |
| MSCCD | Maximum somatic cell count deviation |
| qMRML | Quarter-level maximum relative milk loss |
| qMY | Quarter-level milk yield |
| qMYP | Quarter-level milk yield perturbation |
| SCC | Somatic cell count |
| SPR | Slope of percentage recovery |
| ULC | Unperturbed lactation curve |
| VIF | Variance inflation factors |
References
- W. He et al., “Prevalence, etiology, and economic impact of clinical mastitis on large dairy farms in China,” Vet Microbiol, vol. 242, p. 108570, Mar. 2020. [CrossRef]
- M. Richardet et al., “The Economic Evaluation of Mastitis Control Strategies in Holstein-Friesian Dairy Herds,” Animals, vol. 13, no. 10, p. 1701, May 2023. [CrossRef]
- Y. Lavon, D. Gilad, and G. Leitner, “Recovery Rates of Treated vs. Non-Treated Dairy Cows with Subclinical Mastitis,” Dairy, vol. 2, no. 4, pp. 576–584, Oct. 2021. [CrossRef]
- G. Leitner, S. E. Blum, O. Krifuks, N. Edery, and U. Merin, “Correlation between Milk Bacteriology, Cytology and Mammary Tissue Histology in Cows: Cure from the Pathogen or Recovery from the Inflammation,” Pathogens, vol. 9, no. 5, p. 364, May 2020. [CrossRef]
- K. L. Smith, “Standards for somatic cells in milk: Physiological and regulatory. ,” IDF Mastit. Newsl., pp. 7–9, 1996.
- S. De Vliegher, L. K. Fox, S. Piepers, S. McDougall, and H. W. Barkema, “Invited review: Mastitis in dairy heifers: Nature of the disease, potential impact, prevention, and control,” J Dairy Sci, vol. 95, no. 3, pp. 1025–1040, Mar. 2012. [CrossRef]
- J. Detilleux, “Tolerance to bovine clinical mastitis: Total, direct, and indirect milk losses,” J Dairy Sci, vol. 101, no. 4, pp. 3334–3343, 2018. [CrossRef]
- E. de Jong et al., “Invited review: Selective treatment of clinical mastitis in dairy cattle,” J Dairy Sci, vol. 106, no. 6, pp. 3761–3778, Jun. 2023. [CrossRef]
- Rees, C. Fischer-Tenhagen, and W. Heuwieser, “Udder firmness as a possible indicator for clinical mastitis,” J Dairy Sci, vol. 100, no. 3, pp. 2170–2183, Mar. 2017. [CrossRef]
- F. Fredebeul-Krein, A. Schmenger, N. Wente, Y. Zhang, and V. Krömker, “Factors Associated with the Severity of Clinical Mastitis,” Pathogens, vol. 11, no. 10, p. 1089, Sep. 2022. [CrossRef]
- W. Steeneveld, T. van Werven, H. W. Barkema, and H. Hogeveen, “Cow-specific treatment of clinical mastitis: An economic approach,” J Dairy Sci, vol. 94, no. 1, pp. 174–188, Jan. 2011. [CrossRef]
- Adriaens et al., “Milk losses and dynamics during perturbations in dairy cows differ with parity and lactation stage,” J Dairy Sci, vol. 104, no. 1, pp. 405–418, Jan. 2021. [CrossRef]
- Adriaens et al., “Method for short-term prediction of milk yield at the quarter level to improve udder health monitoring,” J Dairy Sci, vol. 101, no. 11, pp. 10327–10336, Nov. 2018. [CrossRef]
- G. Ranzato et al., “Comparison of 3 mathematical models to estimate lactation performance in dairy cows,” J Dairy Sci, vol. 107, no. 9, pp. 6888–6901, Sep. 2024. [CrossRef]
- Adriaens, I. Van Den Brulle, K. Geerinckx, L. D’Anvers, S. De Vliegher, and B. Aernouts, “Milk losses linked to mastitis treatments at dairy farms with automatic milking systems,” Prev Vet Med, vol. 194, p. 105420, Sep. 2021. [CrossRef]
- L. L. Sguizzato, T. E. da Silva, J. C. C. Chagas, A. M. Argüelo, N. M. Gonçalves, and M. I. Marcondes, “Understanding the dynamics of mastitis in milk yield: decoding onset and recovery patterns in response to mastitis occurrence,” JDS Communications, Jul. 2024. [CrossRef]
- L. D’Anvers, I. Adriaens, S. Piepers, M. J. Gote, B. De Ketelaere, and B. Aernouts, “Association between management practices and estimated mastitis incidence and milk losses on robotic dairy farms,” Prev Vet Med, p. 106033, Sep. 2023. [CrossRef]
- Y. Shinozuka, S. Kaneko, T. Kurose, A. Watanabe, K. Kuruhara, and K. Kawai, “Factors associated with marketable milk production recovery after treatment of naturally occurring acute coliform mastitis,” Journal of Veterinary Medical Science, vol. 78, no. 5, pp. 917–920, 2016. [CrossRef]
- C. Kirkeby et al., “Dynamics of somatic cell count (SCC) and differential SCC during and following intramammary infections,” J Dairy Sci, vol. 104, no. 3, pp. 3427–3438, Mar. 2021. [CrossRef]
- F. J. Ferrero, M. Valledor, and J. C. Campo, “Screening method for early detection of mastitis in cows,” Measurement, vol. 47, pp. 855–860, Jan. 2014. [CrossRef]
- K. Fogsgaard, P. Løvendahl, T. W. Bennedsgaard, and S. Østergaard, “Changes in milk yield, lactate dehydrogenase, milking frequency, and interquarter yield ratio persist for up to 8 weeks after antibiotic treatment of mastitis,” J Dairy Sci, vol. 98, no. 11, pp. 7686–7698, Nov. 2015. [CrossRef]
- Hammer, J. Morton, and K. Kerrisk, “Quarter-milking-, quarter-, udder- and lactation-level risk factors and indicators for clinical mastitis during lactation in pasture-fed dairy cows managed in an automatic milking system,” Aust Vet J, vol. 90, no. 5, pp. 167–174, May 2012. [CrossRef]
- Lusis, V. Antane, and A. Laurs, “Effectiveness of mastitis detection index for cow monitoring and abnormal milk detection in milking robots,” May 2017. [CrossRef]
- ICAR, “ICAR guidelines.” Accessed: Aug. 08, 2024. [Online]. Available: https://www.icar.org/Guidelines/11-Milk-recording-devices-Overview.pdf.
- ICAR, “ICAR guidelines.” Accessed: May 07, 2024. [Online]. Available: https://www.icar.org/Guidelines/12-Milk-Analysis.pdf.
- ISO, “Milk: Enumeration of somatic cells.” Accessed: May 07, 2024. [Online]. Available: https://www.iso.org/standard/40260.html#:~:text=ISO%2013366%2D2%7CIDF%20148,applied%20in%20the%20counting%20section. has context menu.
- NMC, “NMC guidelines.” Accessed: Jun. 13, 2023. [Online]. Available: https://www.nmconline.org/nmc-protocols-guidelines-and-procedures/.
- Y. Song et al., “Evaluating clinical mastitis in four dimensions: definition and correlation analysis of the production, somatic cell count, clinical and pathogen severity,” Dec. 06, 2025. [CrossRef]
- Poppe, R. F. Veerkamp, M. L. van Pelt, and H. A. Mulder, “Exploration of variance, autocorrelation, and skewness of deviations from lactation curves as resilience indicators for breeding,” J Dairy Sci, vol. 103, no. 2, pp. 1667–1684, Feb. 2020. [CrossRef]
- C. Nielsen, “Economic impact of mastitis in dairy cows.,” Doctoral Thesis, Swedish University of Agricultural Sciences, Uppsala, Sweden, 2009.
- Fernandes, I. Guimaraes, N. R. Noyes, L. S. Caixeta, and V. S. Machado, “Effect of subclinical mastitis detected in the first month of lactation on somatic cell count linear scores, milk yield, fertility, and culling of dairy cows in certified organic herds,” J Dairy Sci, vol. 104, no. 2, pp. 2140–2150, Feb. 2021. [CrossRef]
- P. Winter, J. Hofrichter, W. Obritzhauser, K. Zottl, and C. Egger-Danner, “Health monitoring in Austria–statistical models based on somatic cell count at cow level for early detection of udder health problems developed,” in ICAR Technical Series, 2010, pp. 153–157.
- P. L. Ruegg, “New Perspectives in Udder Health Management,” Veterinary Clinics of North America: Food Animal Practice, vol. 28, no. 2, pp. 149–163, Jul. 2012. [CrossRef]
- Verbeke, S. Piepers, K. Supré, and S. De Vliegher, “Pathogen-specific incidence rate of clinical mastitis in Flemish dairy herds, severity, and association with herd hygiene,” J Dairy Sci, vol. 97, no. 11, pp. 6926–6934, Nov. 2014. [CrossRef]
- S. M. Rowe, S. M. Godden, E. Royster, J. Timmerman, and M. Boyle, “Postcalving udder health and productivity in cows approaching dry-off with intramammary infections caused by non-aureus Staphylococcus, Aerococcus, Enterococcus, Lactococcus, and Streptococcus species,” J Dairy Sci, vol. 104, no. 5, pp. 6061–6079, May 2021. [CrossRef]
- Y. Miao, T. Ding, Y. Liu, X. Zhou, and J. Du, “The Yeast and Hypha Phases of Candida krusei Induce the Apoptosis of Bovine Mammary Epithelial Cells via Distinct Signaling Pathways,” Animals, vol. 13, no. 20, p. 3222, Oct. 2023. [CrossRef]
- D. ISHIYAMA et al., “Factors affecting the incidence and outcome of Trueperella pyogenes mastitis in cows,” Journal of Veterinary Medical Science, vol. 79, no. 3, pp. 626–631, 2017. [CrossRef]
- D’Anvers et al., “Key udder health parameters on dairy farms with an automated milking system,” Livest Sci, vol. 287, p. 105522, Sep. 2024. [CrossRef]
- J. Levison et al., “Incidence rate of pathogen-specific clinical mastitis on conventional and organic Canadian dairy farms,” J Dairy Sci, vol. 99, no. 2, pp. 1341–1350, Feb. 2016. [CrossRef]
- A. Ballou, “GROWTH AND DEVELOPMENT SYMPOSIUM: Inflammation: Role in the etiology and pathophysiology of clinical mastitis in dairy cows1,” J Anim Sci, vol. 90, no. 5, pp. 1466–1478, May 2012. [CrossRef]
- X. Zhao and P. Lacasse, “Mammary tissue damage during bovine mastitis: Causes and control1,” J Anim Sci, vol. 86, no. suppl_13, pp. 57–65, Mar. 2008. [CrossRef]
- Wellnitz and R. M. Bruckmaier, “The innate immune response of the bovine mammary gland to bacterial infection,” The Veterinary Journal, vol. 192, no. 2, pp. 148–152, May 2012. [CrossRef]
- L. Oliveira, C. Hulland, and P. L. Ruegg, “Characterization of clinical mastitis occurring in cows on 50 large dairy herds in Wisconsin,” J Dairy Sci, vol. 96, no. 12, pp. 7538–7549, Dec. 2013. [CrossRef]
- T. Tomazi et al., “Association of herd-level risk factors and incidence rate of clinical mastitis in 20 Brazilian dairy herds,” Prev Vet Med, vol. 161, pp. 9–18, Dec. 2018. [CrossRef]
- A. Hertl, Y. H. Schukken, F. L. Welcome, L. W. Tauer, and Y. T. Gröhn, “Pathogen-specific effects on milk yield in repeated clinical mastitis episodes in Holstein dairy cows,” J Dairy Sci, vol. 97, no. 3, pp. 1465–1480, Mar. 2014. [CrossRef]
- Ben Abdelkrim, T. Tribout, O. Martin, D. Boichard, V. Ducrocq, and N. C. Friggens, “Exploring simultaneous perturbation profiles in milk yield and body weight reveals a diversity of animal responses and new opportunities to identify resilience proxies,” J Dairy Sci, vol. 104, no. 1, pp. 459–470, Jan. 2021. [CrossRef]
- J. Vilar and P. J. Rajala-Schultz, “Dry-off and dairy cow udder health and welfare: Effects of different milk cessation methods,” The Veterinary Journal, vol. 262, p. 105503, Aug. 2020. [CrossRef]
- G. Ranzato, I. Lora, B. Aernouts, I. Adriaens, F. Gottardo, and G. Cozzi, “Sensor-based behavioral patterns can identify heat-sensitive lactating dairy cows,” Int J Biometeorol, vol. 67, no. 12, pp. 2047–2054, Dec. 2023. [CrossRef]
- J. Rajala-Schultz, Y. T. Gröhn, C. E. McCulloch, and C. L. Guard, “Effects of Clinical Mastitis on Milk Yield in Dairy Cows,” J Dairy Sci, vol. 82, no. 6, pp. 1213–1220, Jun. 1999. [CrossRef]
- R. F. Diegelmann, “Wound healing: an overview of acute, fibrotic and delayed healing,” Frontiers in Bioscience, vol. 9, no. 1–3, p. 283, 2004. [CrossRef]
- A.-M. Heikkilä, E. Liski, S. Pyörälä, and S. Taponen, “Pathogen-specific production losses in bovine mastitis,” J Dairy Sci, vol. 101, no. 10, pp. 9493–9504, Oct. 2018. [CrossRef]
- R. S. Morris, “THE DEPRESSION OF QUARTER MILK YIELD CAUSED BY BOVINE MASTITIS, AND THE RESPONSE OF YIELD TO SUCCESSFUL THERAPY,” Aust Vet J, vol. 49, no. 3, pp. 153–156, Mar. 1973. [CrossRef]
- Hamann and J. Reichmuth, “Compensatory milk production within the bovine udder: effects of short-term non-milking of single quarters,” Journal of Dairy Research, vol. 57, no. 1, pp. 17–22, Feb. 1990. [CrossRef]
- C. Hagnestam-Nielsen, U. Emanuelson, B. Berglund, and E. Strandberg, “Relationship between somatic cell count and milk yield in different stages of lactation,” J Dairy Sci, vol. 92, no. 7, pp. 3124–3133, Jul. 2009. [CrossRef]
- D. E. Morin and P. D. Constable, “Characteristics of dairy cows during episodes of bacteriologically negative clinical mastitis or mastitis caused by Corynebacterium spp.,” J Am Vet Med Assoc, vol. 213, no. 6, pp. 855–61, Sep. 1998.
- R. N. Gonzalez et al., “Clinical Mastitis in Two California Dairy Herds Participating In Contagious Mastitis Control Programs,” J Dairy Sci, vol. 73, no. 3, pp. 648–660, Mar. 1990. [CrossRef]
- Y. T. Gröhn et al., “Effect of Pathogen-Specific Clinical Mastitis on Milk Yield in Dairy Cows,” J Dairy Sci, vol. 87, no. 10, pp. 3358–3374, Oct. 2004. [CrossRef]
- Y. Tsugami et al., “Differences in antimicrobial components between bacterial culture-positive and culture-negative bovine clinical mastitis milk,” Animal Science Journal, vol. 93, no. 1, Jan. 2022. [CrossRef]
- S. Kuehn et al., “Bacterial Community Profiling of Milk Samples as a Means to Understand Culture-Negative Bovine Clinical Mastitis,” PLoS One, vol. 8, no. 4, p. e61959, Apr. 2013. [CrossRef]
Figure 1.
Example of daily quarter-level milk yield (dqMY) and daily quarter-level milk loss (dqML) series. The red area indicates the quarter-level milk yield perturbation (qMYP) period. The dark blue line represents the dqMY series, and the dark red solid line represents the estimated unperturbed lactation curve (ULC). The light blue solid line represents the dqML series, which was calculated by subtracting the ULC from the dqMY.
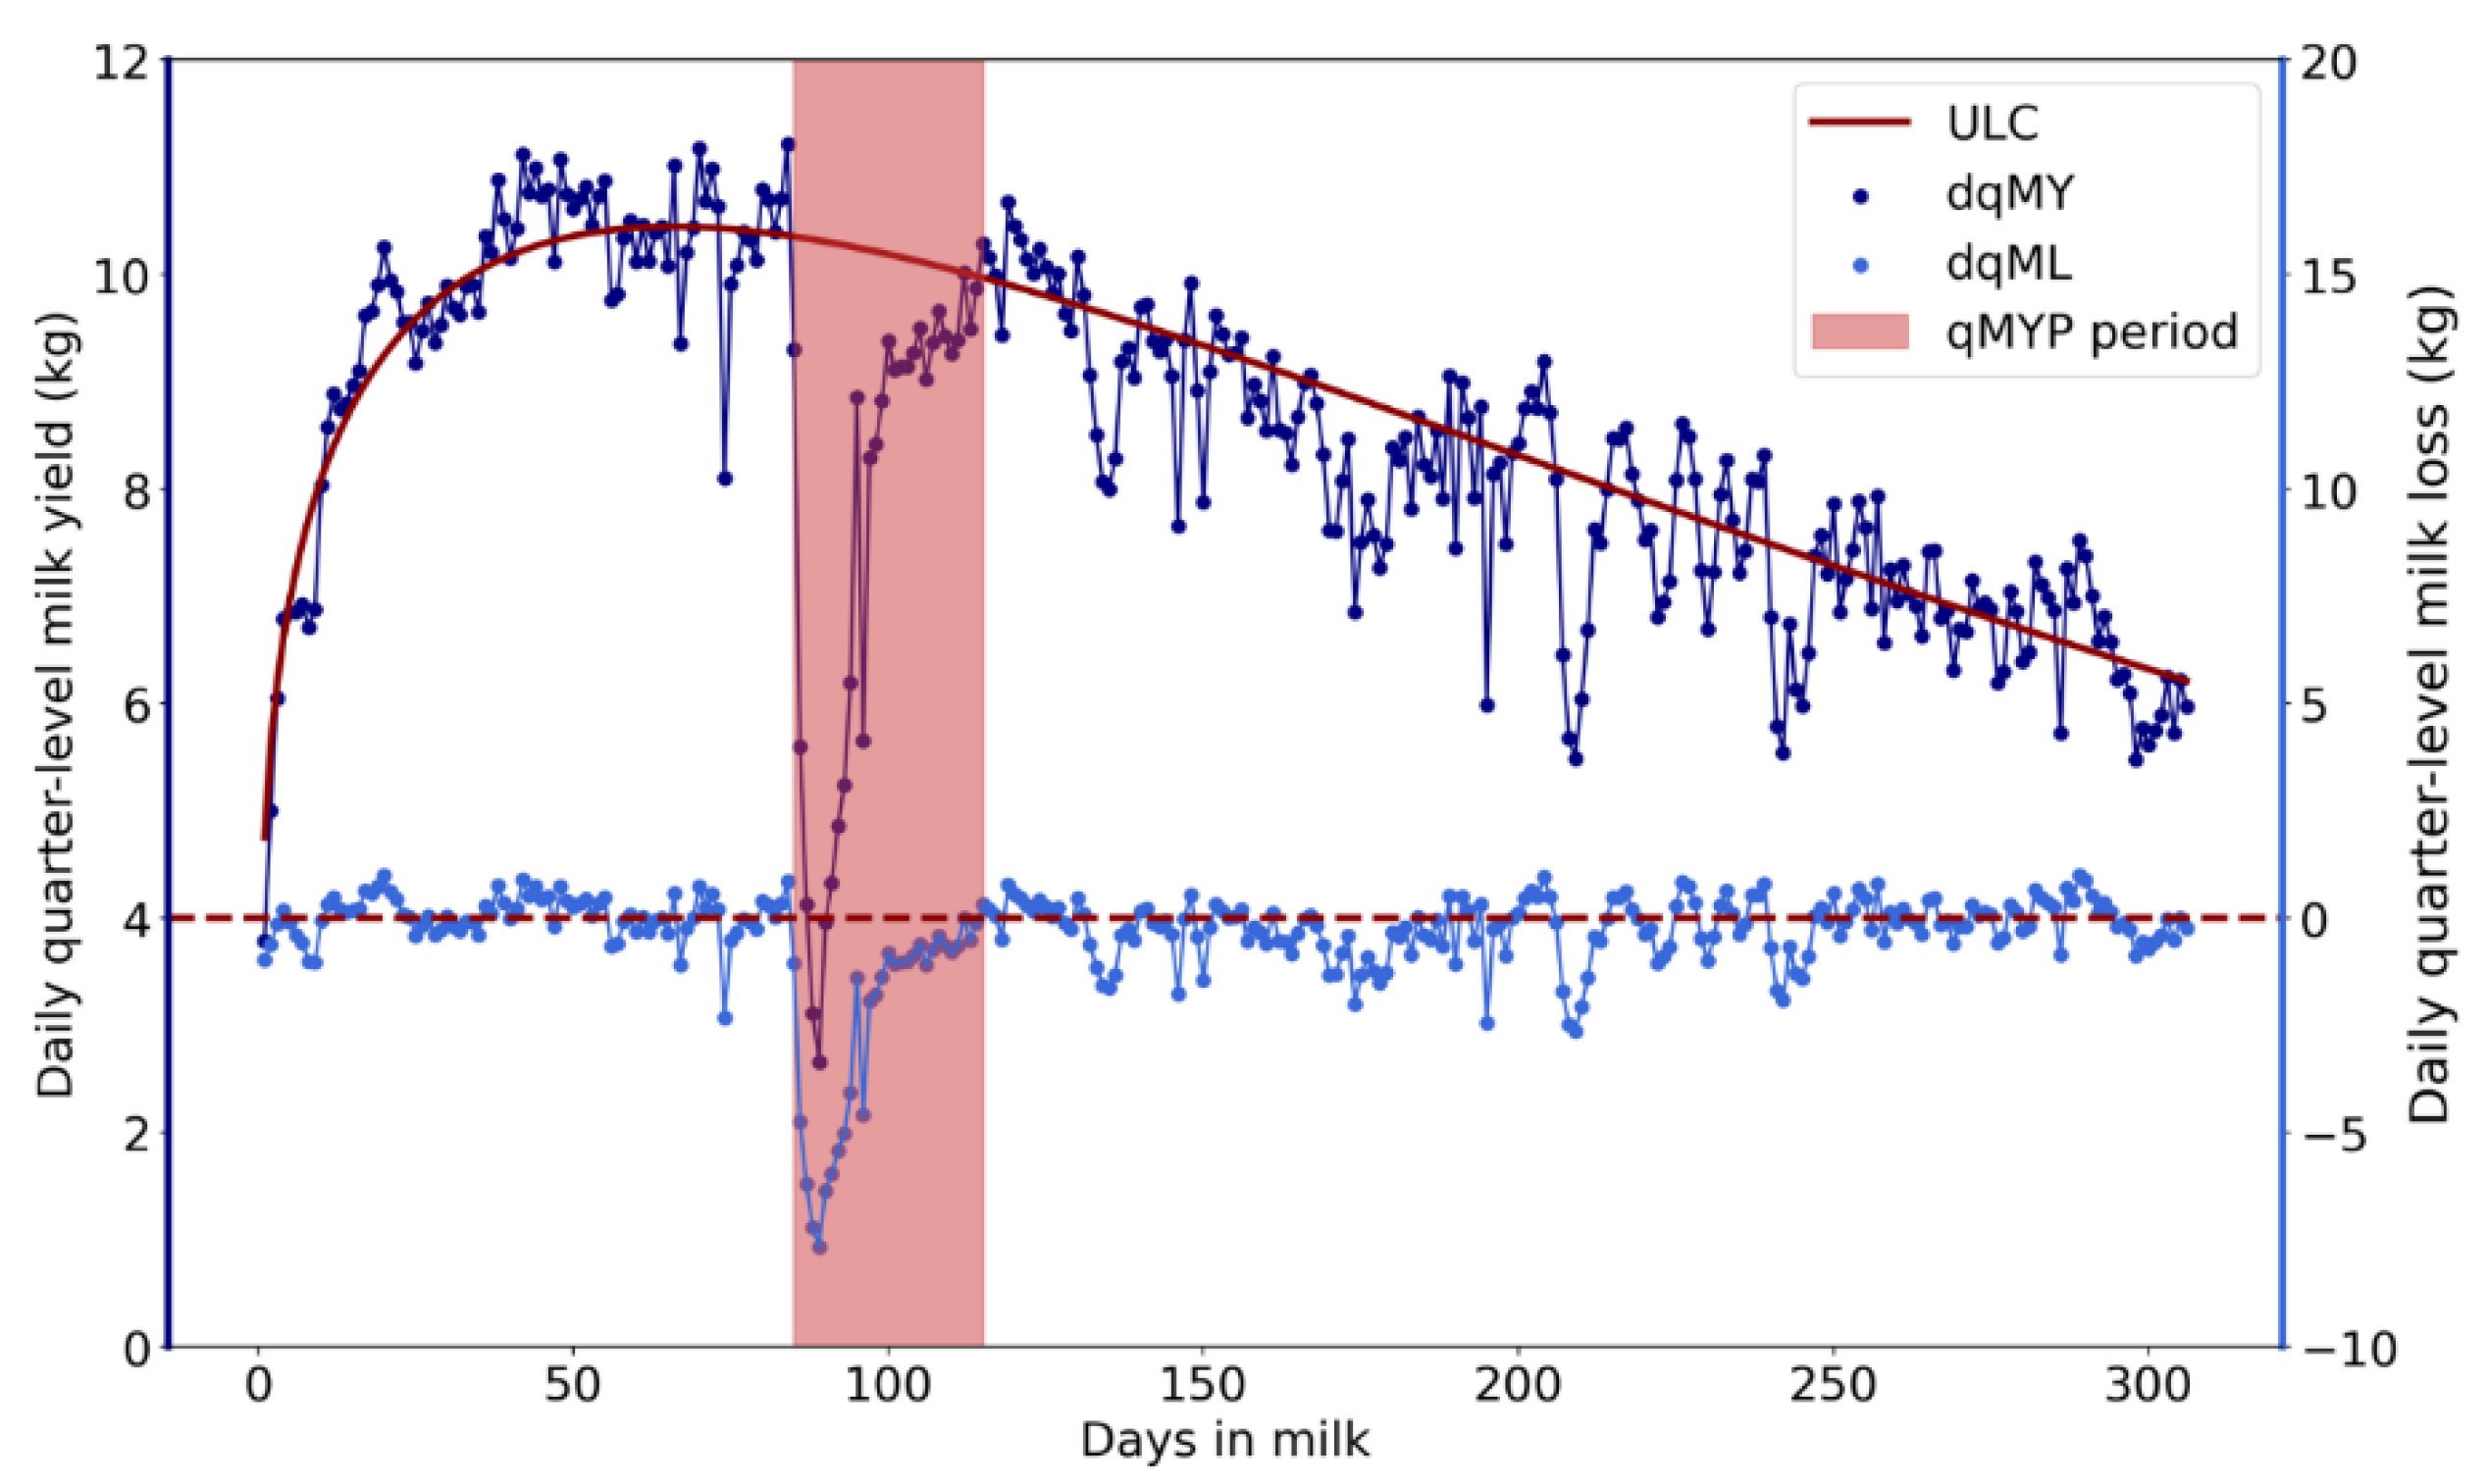
Figure 2.
Example of quarter-level milk yield perturbation (qMYP). The red area indicates the qMYP period. The dark blue lines represent the daily quarter-level milk loss (dqML), with the "X" markers denoting the raw dqML and the solid dark blue circles indicating the smoothed dqML. The green line represents the percentage recovery.
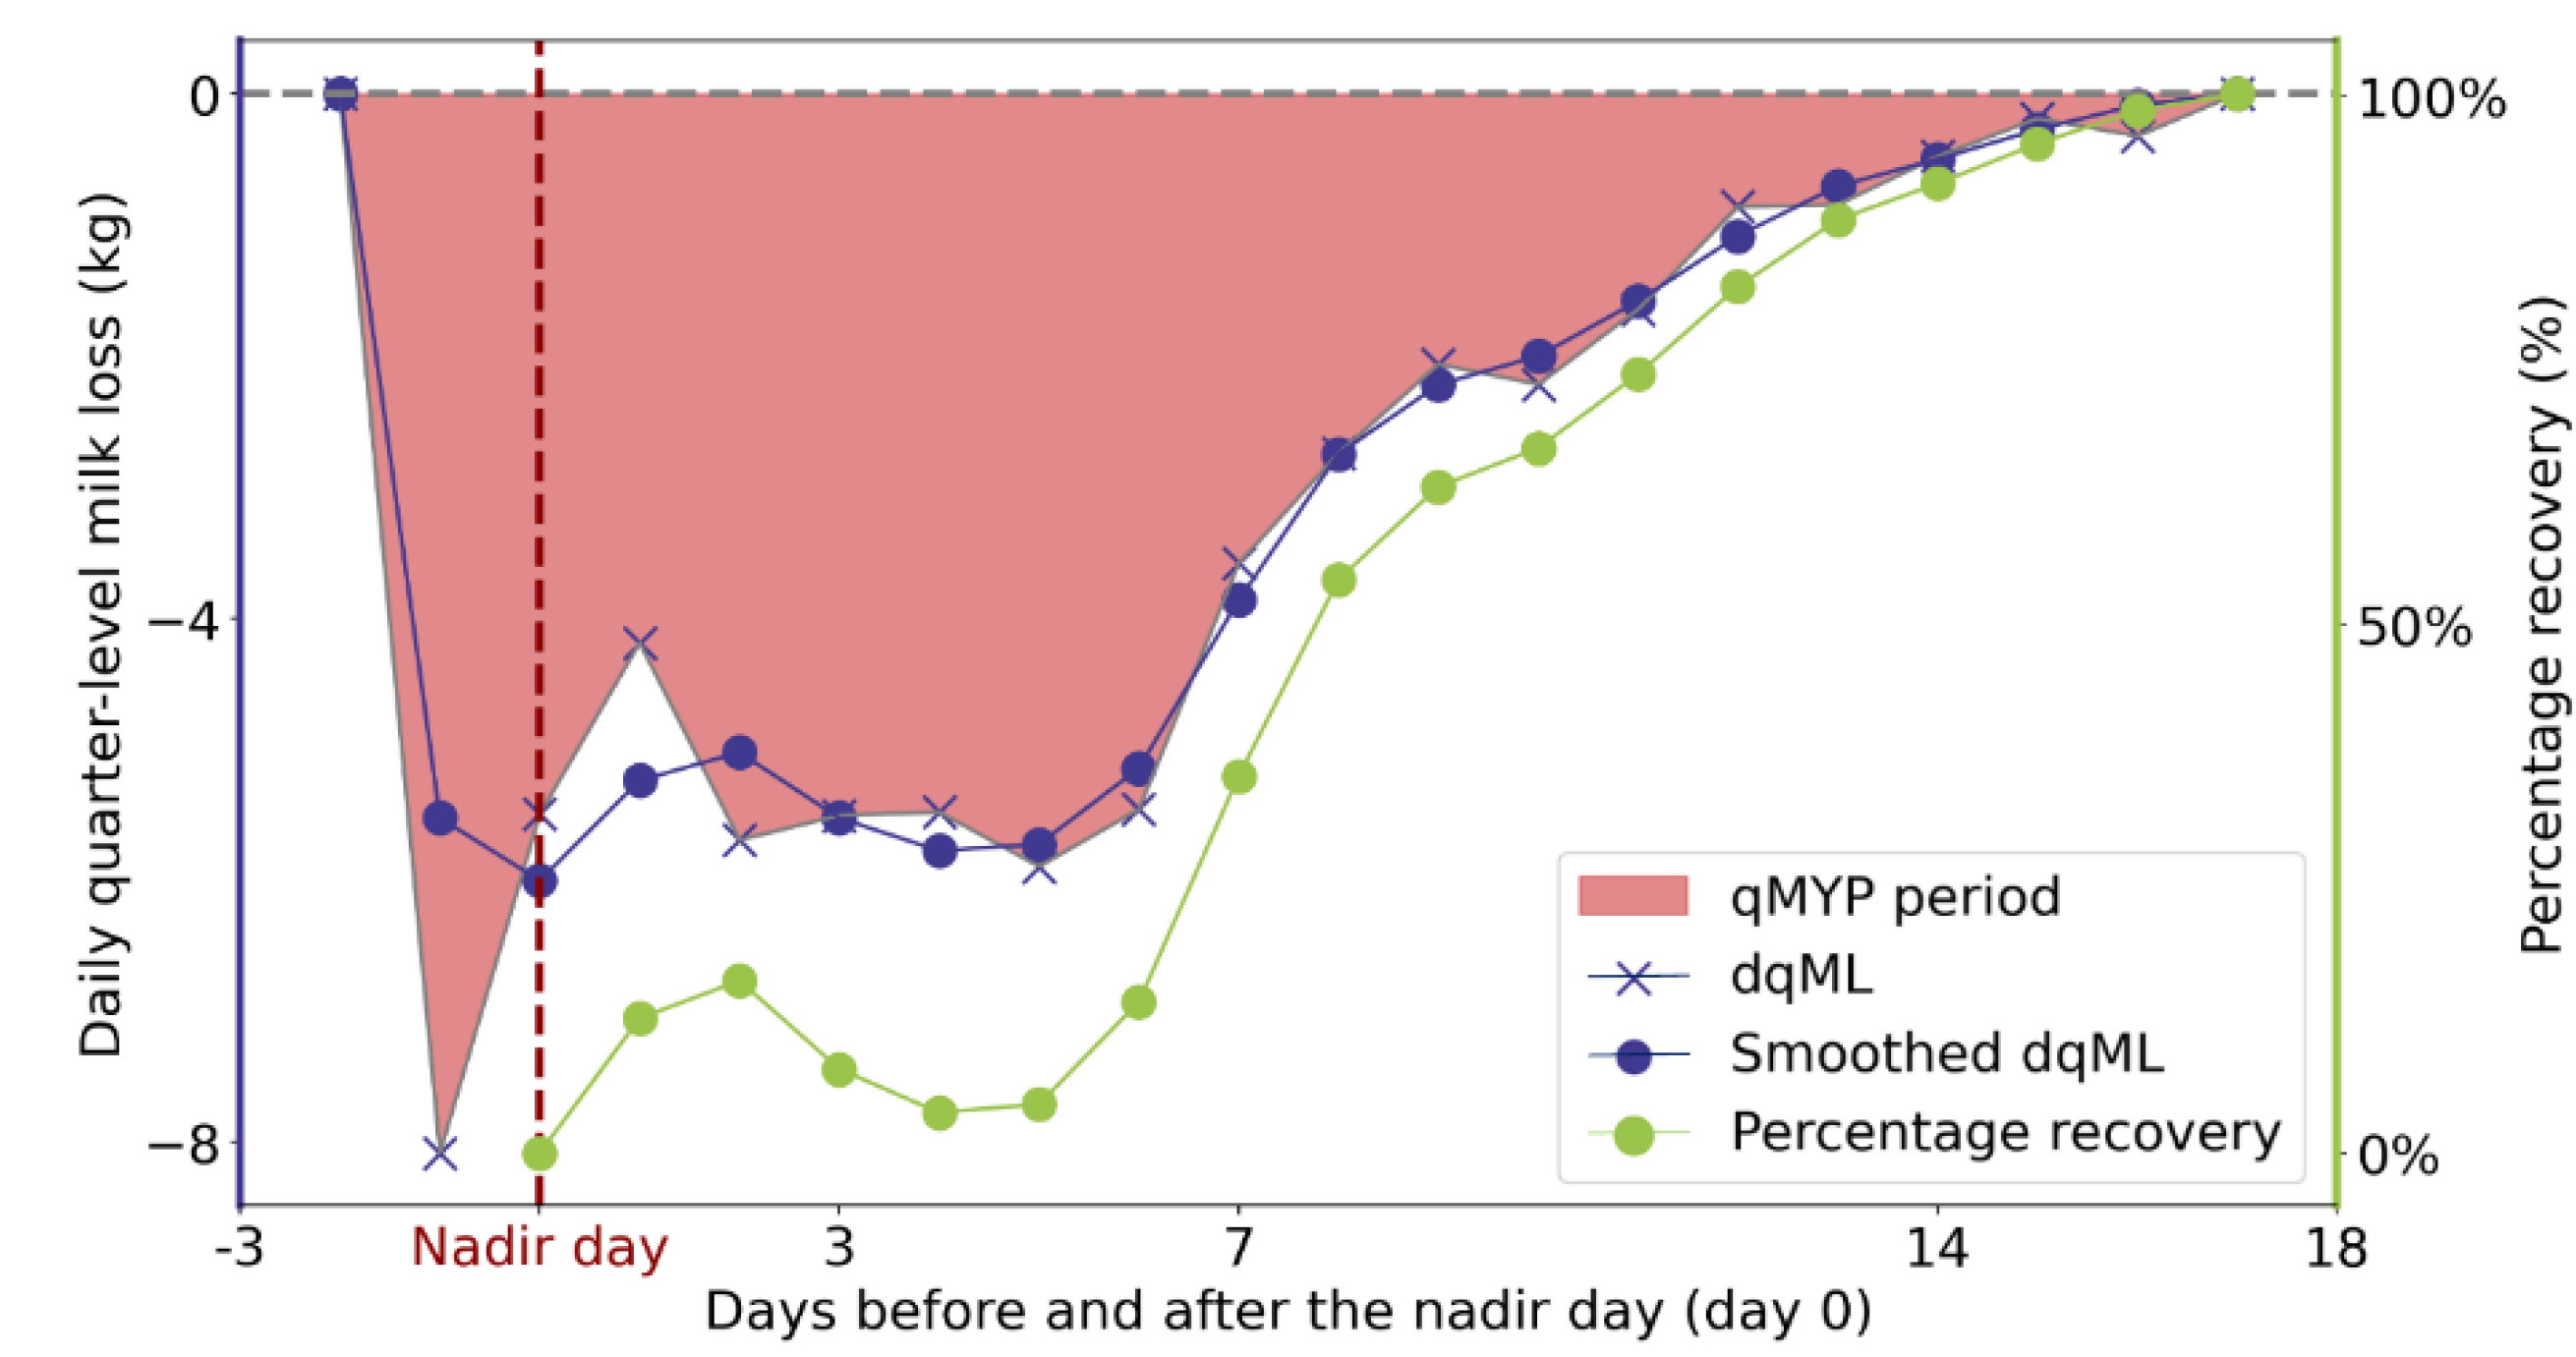
Figure 3.
The median, 25% quantile, 75% quantile of percentage recovery (top) and the percentage of unrecovered quarter-level milk yield perturbations (qMYP) (bottom), both in the four weeks following the nadir day. The red color represents the inflamed quarter, and the purple color represents uninflamed quarters.
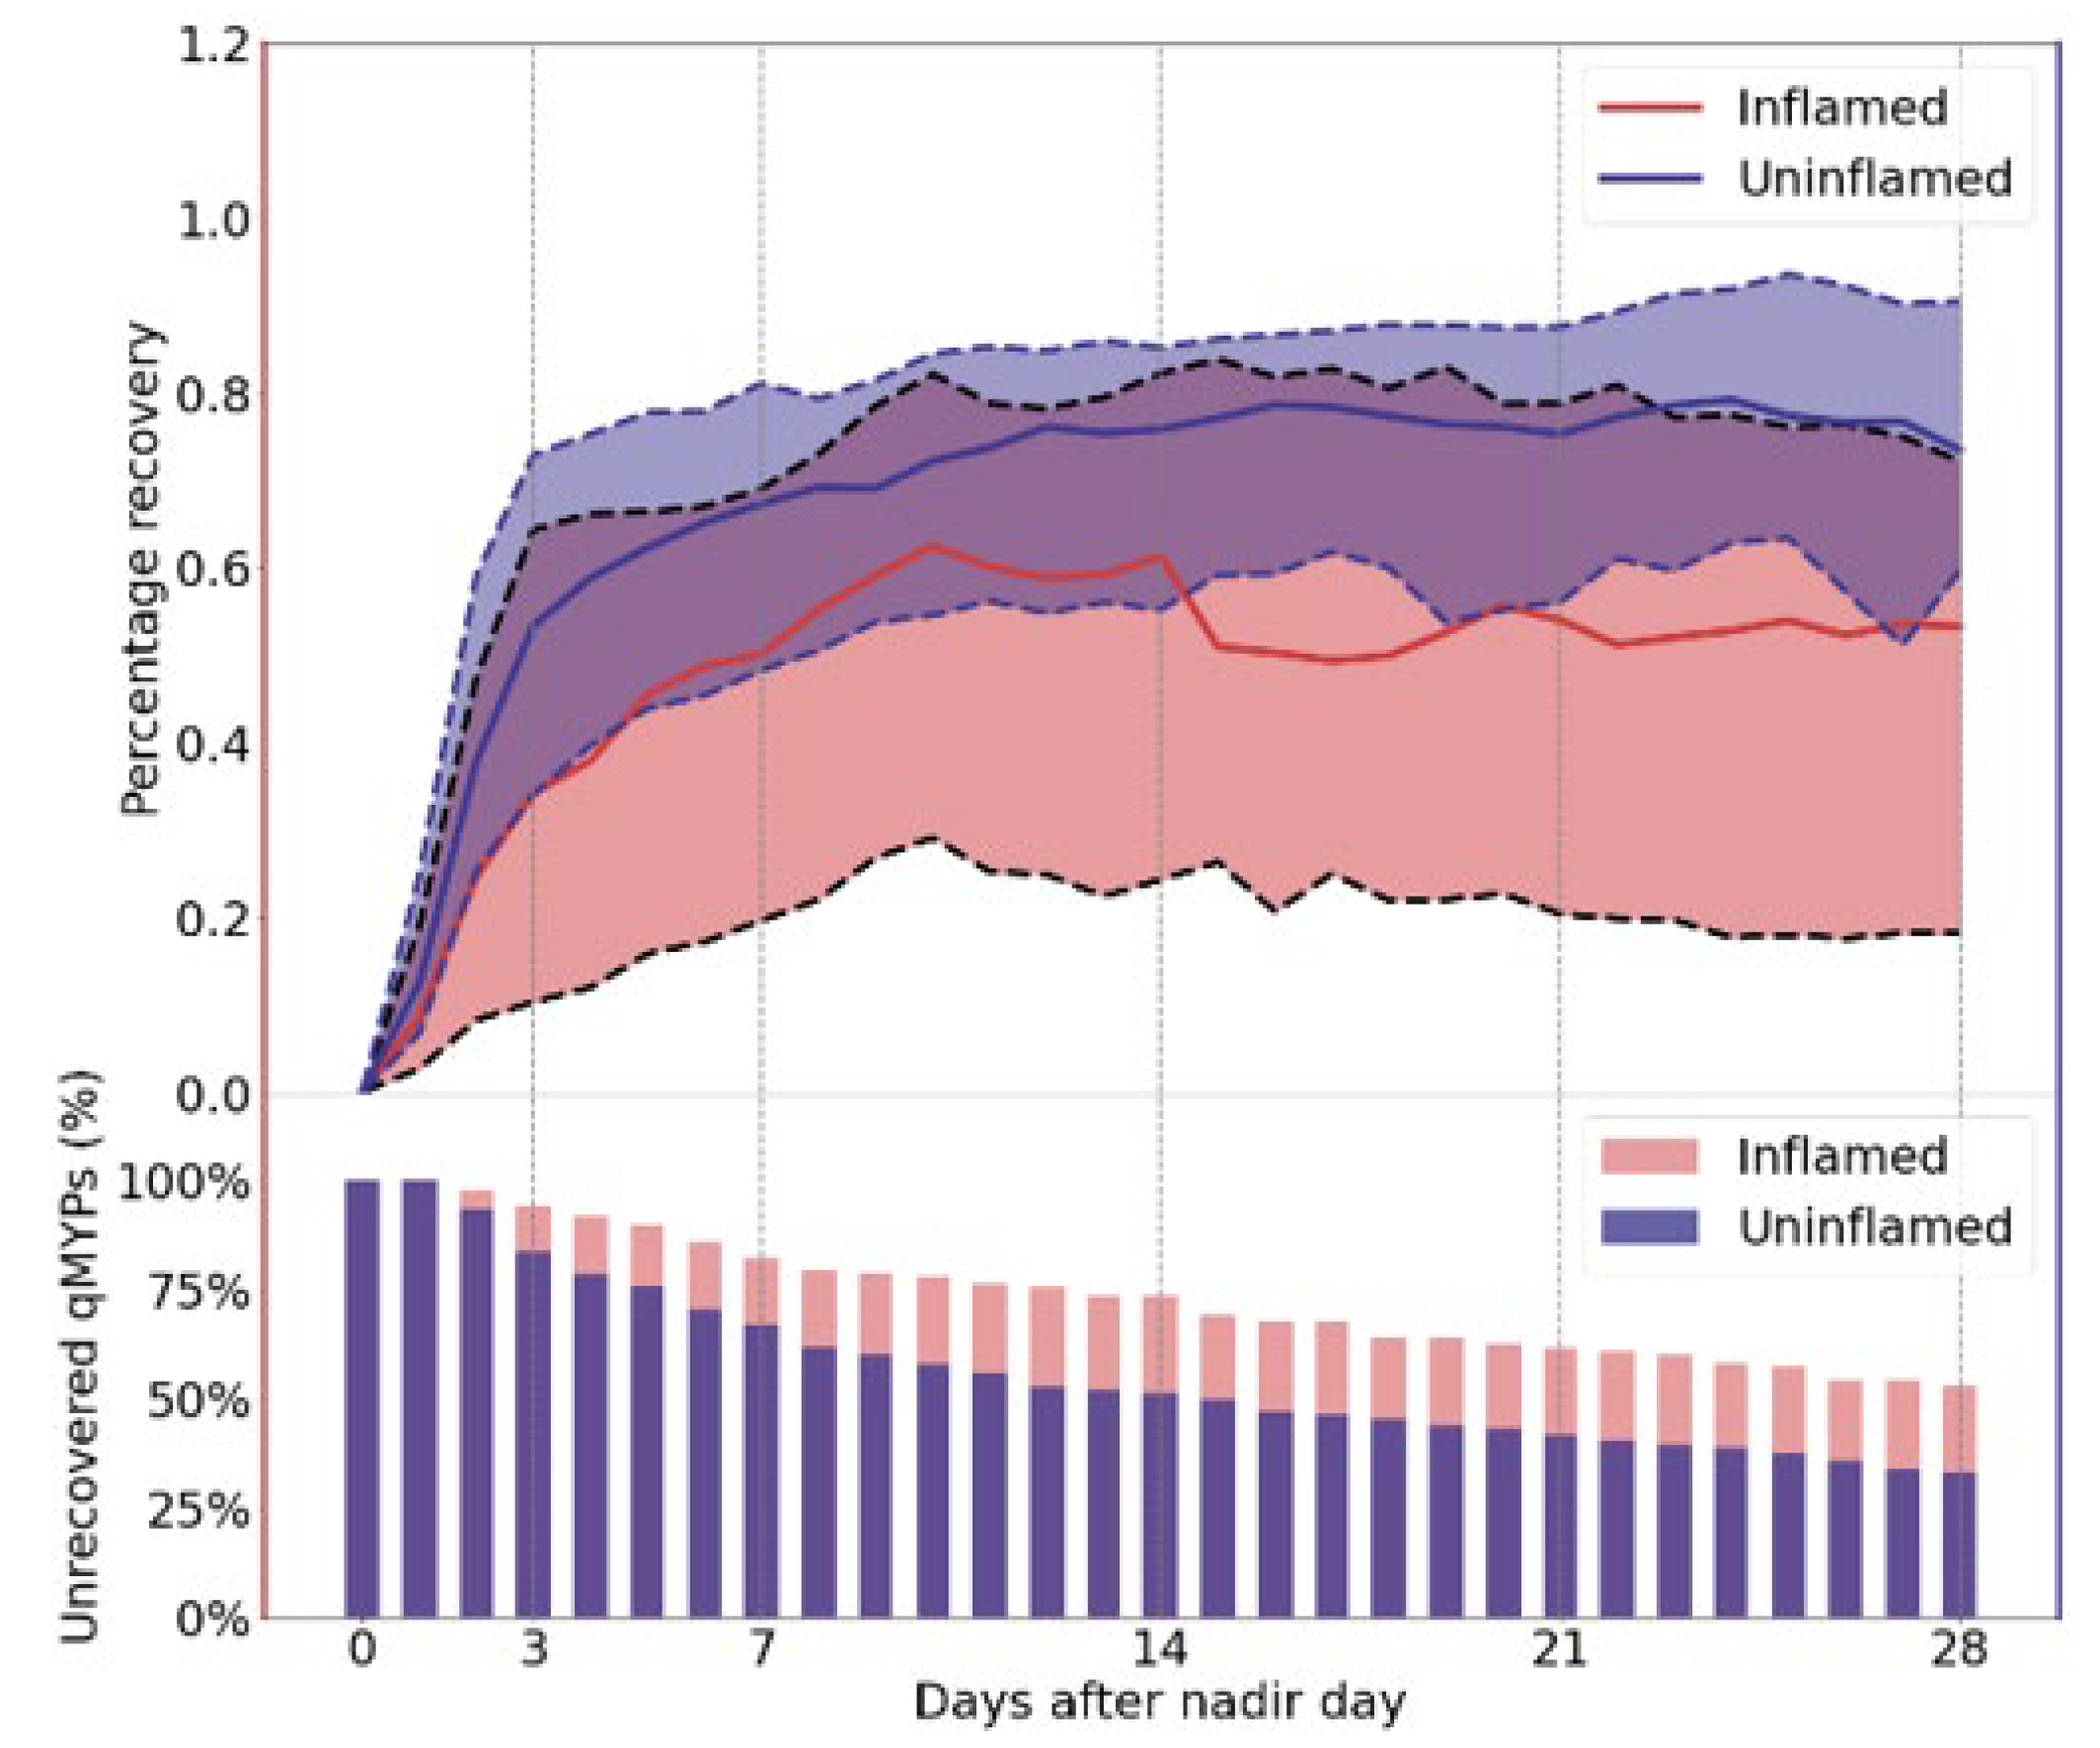
Figure 4.
Boxplots of (a) average percentage recovery (APR) and (b) the slope of percentage recovery (SPR) in inflamed and uninflamed quarters within different groups. Groups were separated by the recovery length of quarter-level milk yield perturbation (qMYP): quickly recovered (qMYPs recovered before week 2), slowly recovered (qMYPs recovered between week 3 and week 4), non-recovered (qMYPs not recovered within four weeks). The markers above each box represent the results of comparing APR and SPR between adjacent time intervals using the Mann-Witney test. “*” ,“**” and “***” indicates significant differences with P<0.05, P< 0.01 and P<0.001, respectively, between these groups, while “ns” indicates no significant difference.
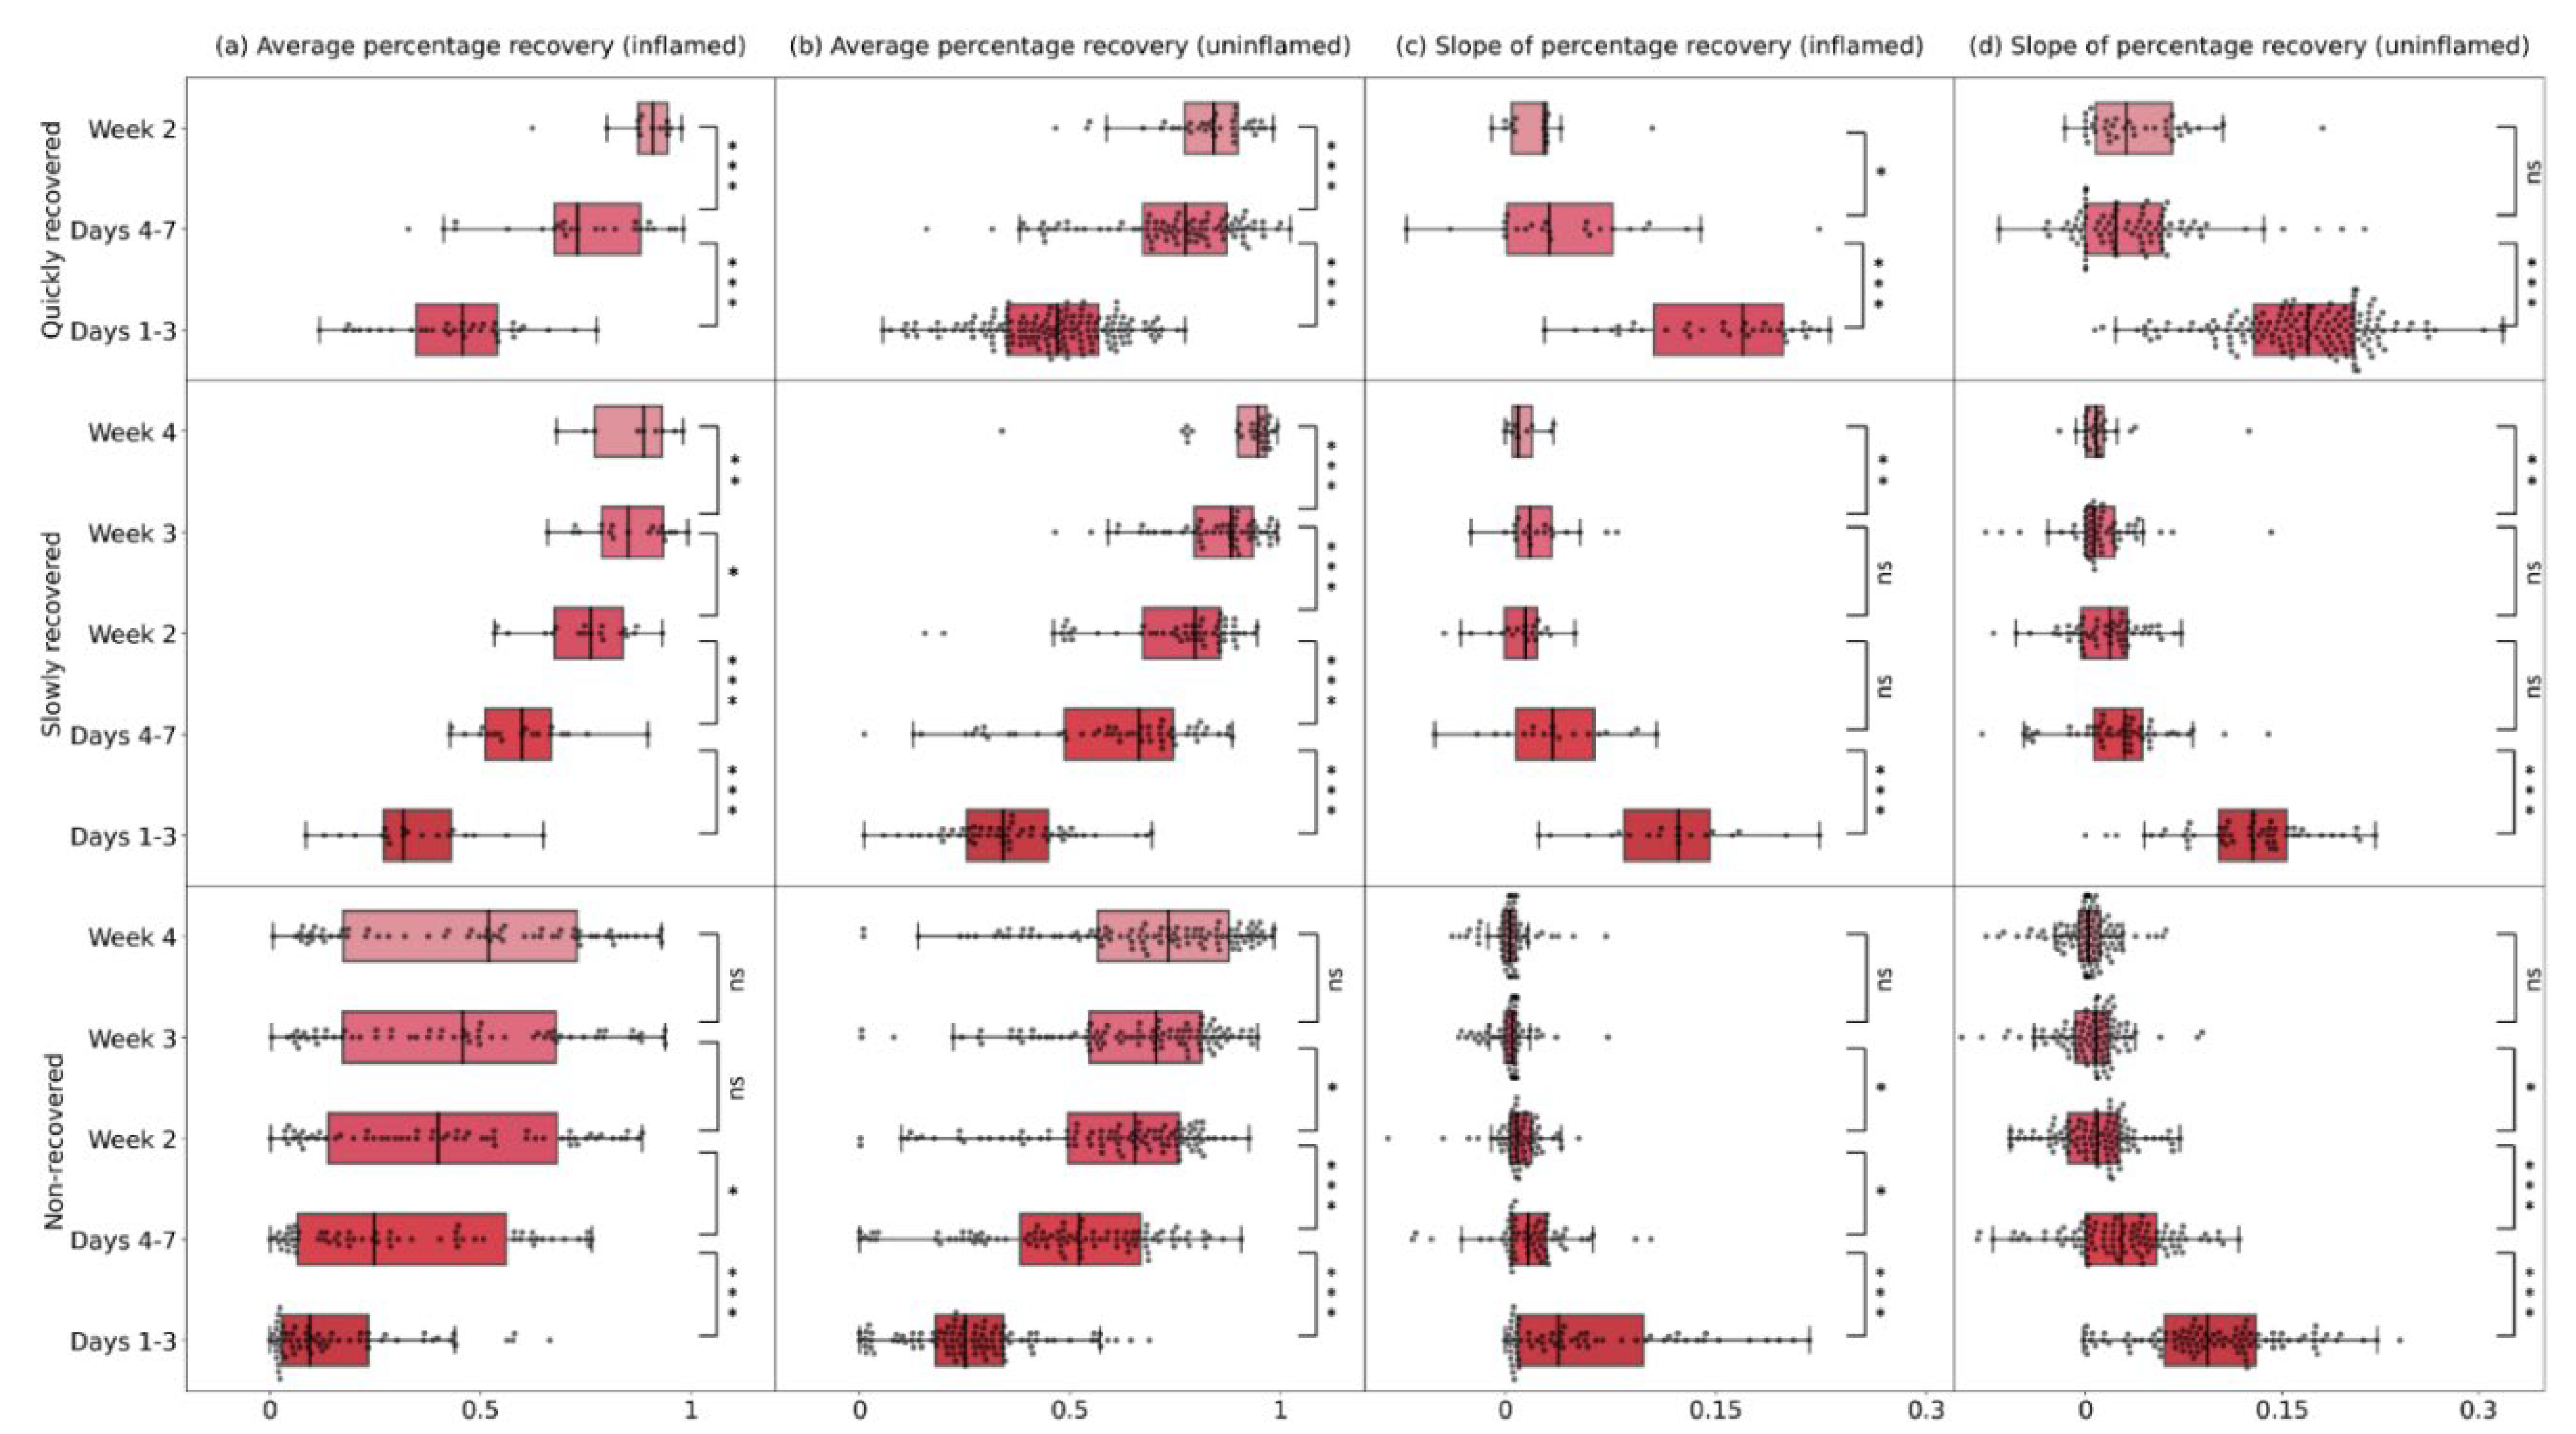
Figure 5.
The heatmap of correlation values between quarter-level maximum relative milk loss (qMRML), maximum somatic cell counts deviation (MSCCD), clinical severity, causative pathogens and the average percentage recovery (APR), slope of percentage recovery (SPR). qMRMLi and qMRMLu represent qMRML for inflamed and uninflamed quarters. The asterisk indicates the correlation value is significant from 0 (* for P < 0.05, ** for P < 0.01, and *** for P < 0.001).
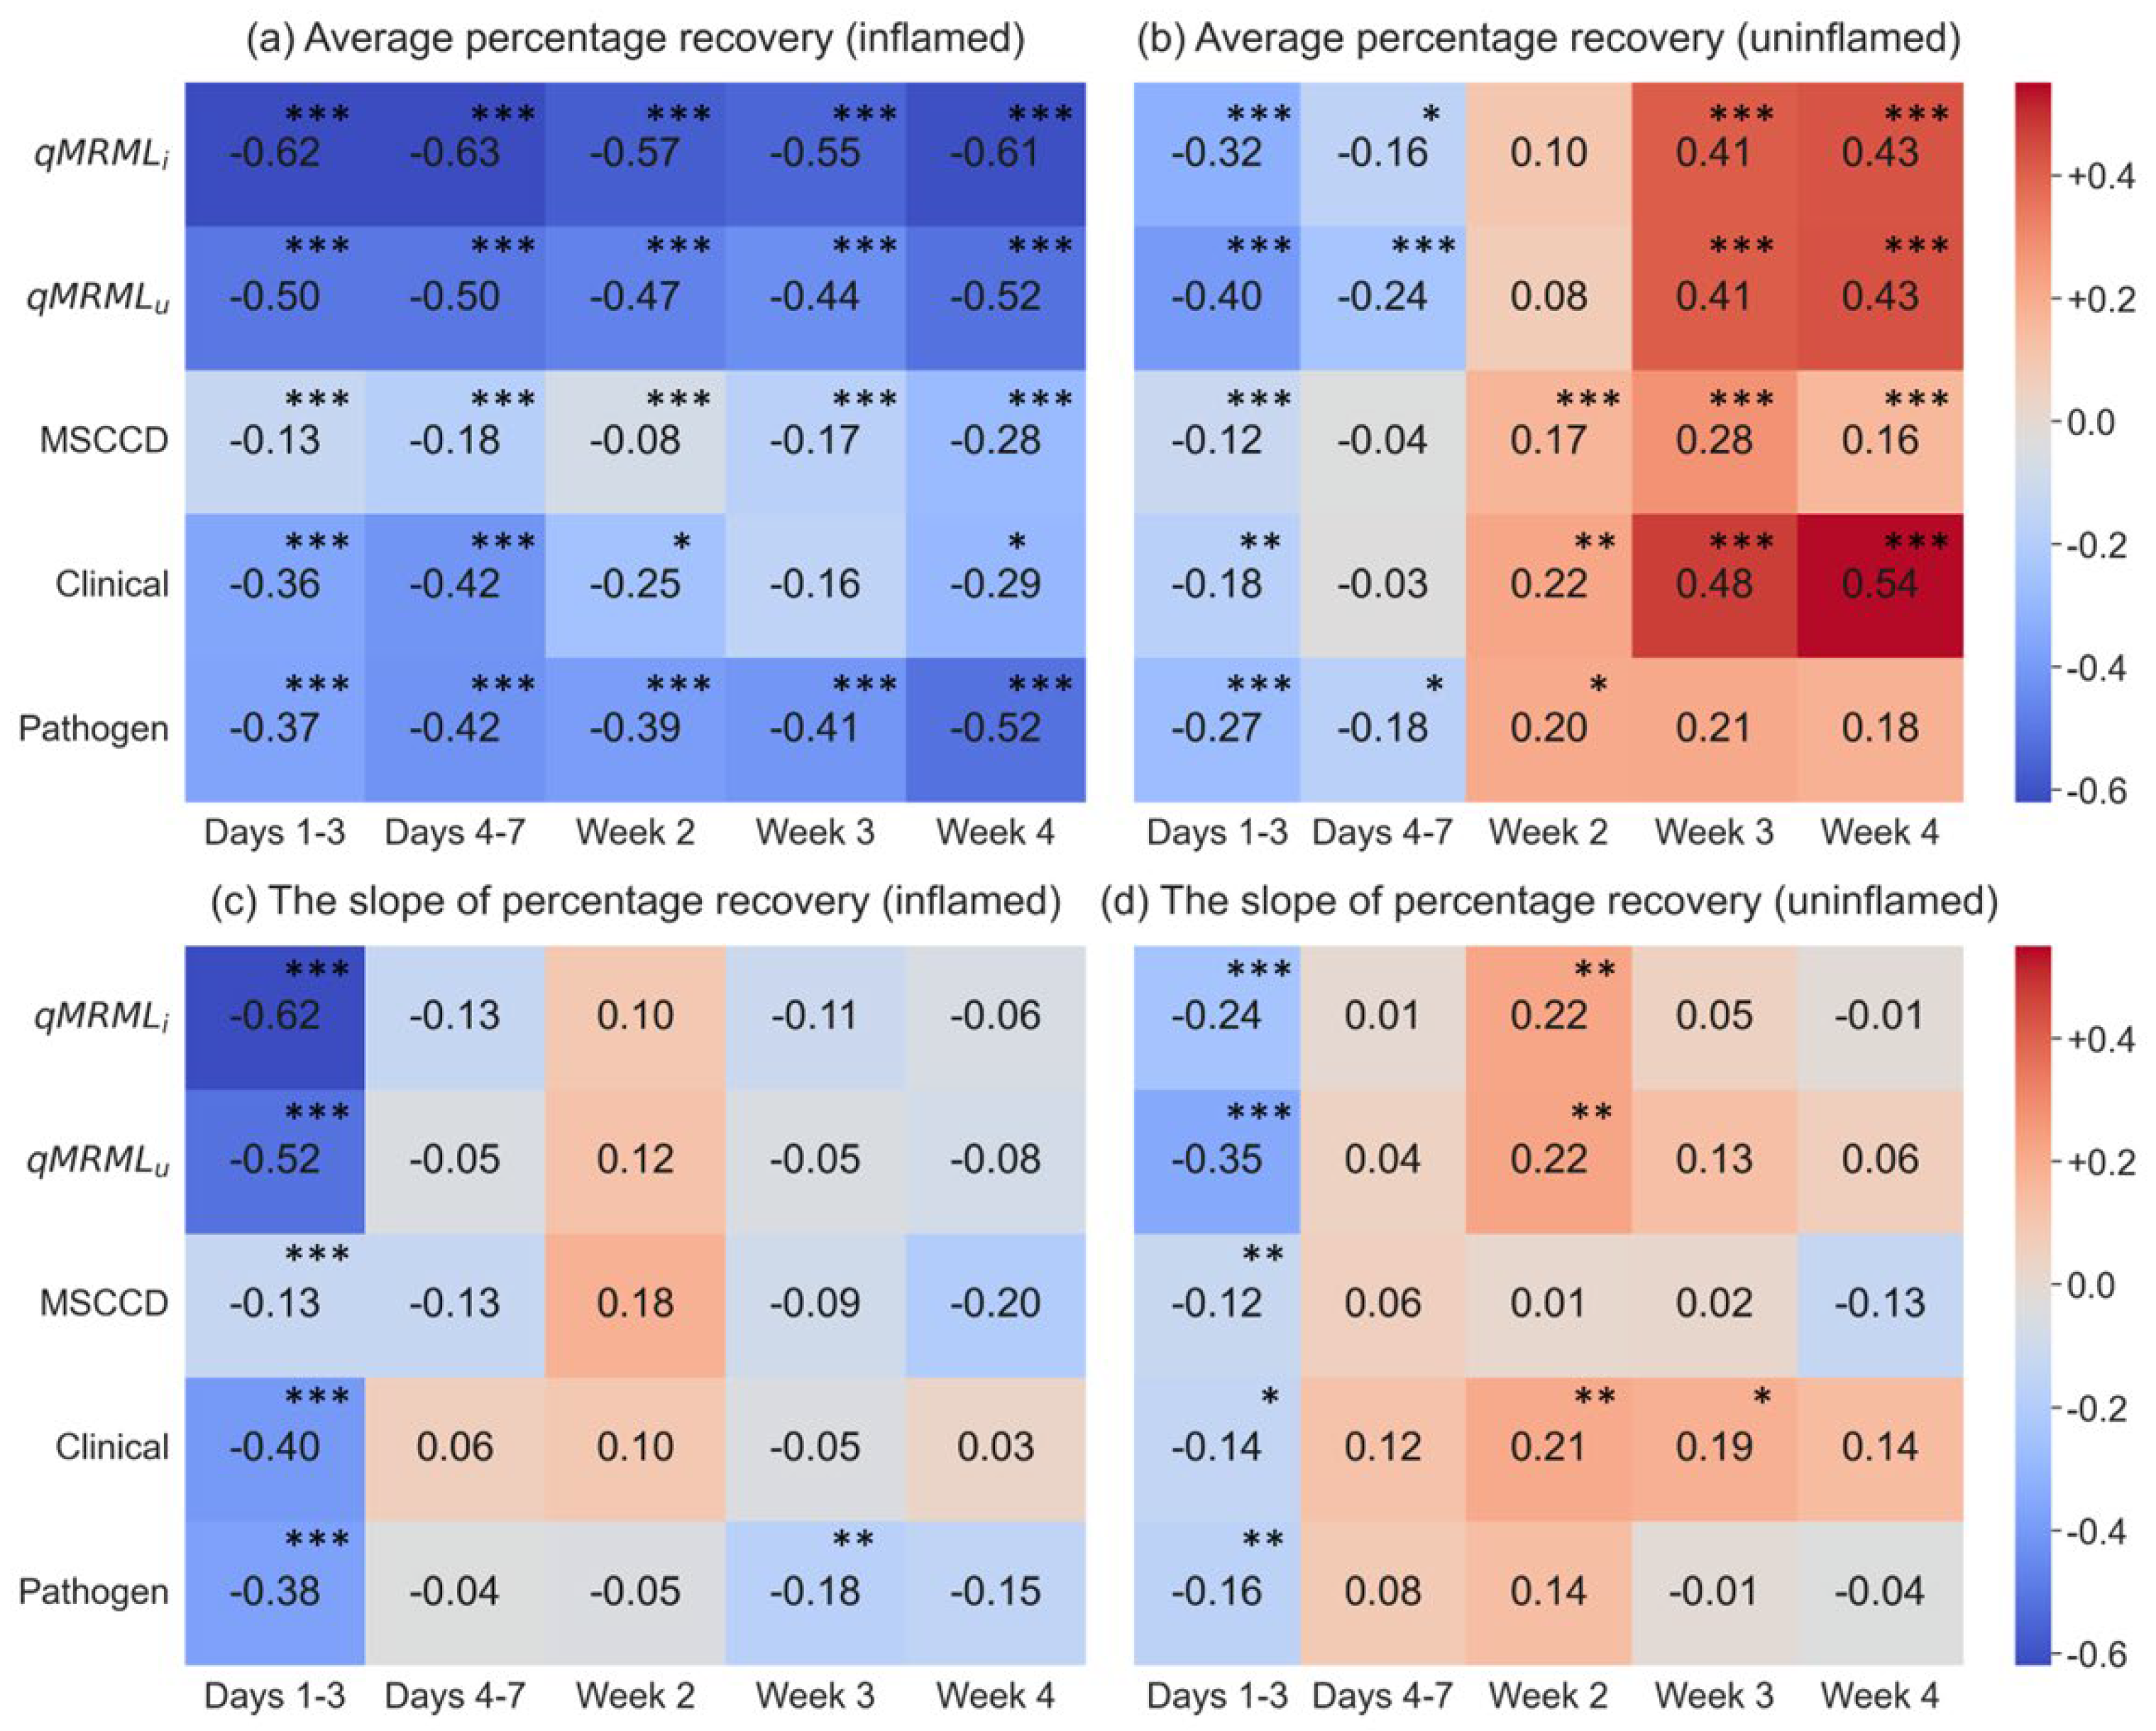

Table 1.
The distribution of quarter-level maximum relative milk loss and maximum somatic cell count deviation in different clinical severity (mild, moderate, severe), causative pathogens (culture-negative, minor pathogens, major pathogens), and total cases.
Table 1.
The distribution of quarter-level maximum relative milk loss and maximum somatic cell count deviation in different clinical severity (mild, moderate, severe), causative pathogens (culture-negative, minor pathogens, major pathogens), and total cases.
| Quarter-level maximum relative milk loss | Maximum somatic cell count deviation (Mean ± Std) | Number of cases (percentage) | ||||
| Inflamed (Mean ± Std) | Uninflamed (Mean ± Std) | |||||
| Clinical severity | ||||||
| Mild | 0.50 ± 0.25 | 0.24 ± 0.20 | 3.30 ± 0.97 | 48 (41%) | ||
| Moderate | 0.67 ± 0.27 | 0.36 ± 0.22 | 3.92 ± 0.64 | 36 (31%) | ||
| Severe | 0.81 ± 0.21 | 0.59 ± 0.28 | 3.88 ± 1.13 | 33 (28%) | ||
| Causative pathogens | ||||||
| Culture negative | 0.54 ± 0.24 | 0.29 ± 0.22 | 3.9 ± 1.20 | 29 (25%) | ||
| Minor pathogens | 0.46 ± 0.22 | 0.20 ± 0.12 | 3.25 ± 0.86 | 17 (15%) | ||
| Major pathogens | 0.73 ± 0.27 | 0.46 ± 0.28 | 3.86 ± 0.84 | 71 (61%) | ||
| Total | 0.64 ± 0.28 | 0.38 ± 0.27 | 3.65 ± 0.97 | 117 (100%) | ||
Table 2.
The number of quarter-level milk yield perturbations (qMYPs) in inflamed and uninflamed quarters recovered within various time intervals or remained unrecovered after four weeks.
Table 2.
The number of quarter-level milk yield perturbations (qMYPs) in inflamed and uninflamed quarters recovered within various time intervals or remained unrecovered after four weeks.
| Quarter-level milk yield perturbations Numbers (percentage) |
||
| Inflamed | Uninflamed | |
| Recovered within day 1 - 3 | 10 (9%) | 64 (21%) |
| Recovered within day 4 - 7 | 13 (11%) | 50 (17%) |
| Recovered within week 2 | 13 (11%) | 36 (12%) |
| Recovered within week 3 | 10 (9%) | 27 (9%) |
| Recovered within week 4 | 9 (8%) | 26 (9%) |
| Not recovered | 62 (53%) | 96 (32%) |
| Total | 117 (100%) | 299 (100%) |
Table 3.
The distribution of average percentage recovery (APR) and slope of percentage recovery (SPR), along with the comparison results of APR and SPR between inflamed and uninflamed quarters.
Table 3.
The distribution of average percentage recovery (APR) and slope of percentage recovery (SPR), along with the comparison results of APR and SPR between inflamed and uninflamed quarters.
| Number of cases | Time interval | Average percentage recovery | Slope of percentage recovery | |||||||
| Inflamed | Uninflamed | Median ± IQR1 | P value | Median ± IQR1 | P value | |||||
| Inflamed | Uninflamed | Inflamed | Uninflamed | |||||||
| Quickly recovered | 36 | 150 | Days 1-3 | 0.46±0.19 | 0.47±0.22 | 0.65 | 0.1691 ± 0.0921 | 0.1700 ± 0.0766 | 0.32 | |
| Days 4-7 | 0.73±0.20 | 0.77±0.20 | 0.84 | 0.0314 ± 0.0752 | 0.0232 ± 0.0581 | 0.32 | ||||
| Week 2 | 0.91±0.07 | 0.84±0.13 | 0.06 | 0.0277 ± 0.0250 | 0.0313 ± 0.0584 | 0.16 | ||||
| Slowly recovered | 19 | 53 | Days 1-3 | 0.32±0.16 | 0.34±0.19 | 0.84 | 0.1233 ± 0.0607 | 0.1279 ± 0.0516 | 0.574 | |
| Days 4-7 | 0.60±0.16 | 0.66±0.26 | 0.36 | 0.0366 ± 0.0554 | 0.0298 ± 0.0369 | 0.51 | ||||
| Week 2 | 0.76±0.16 | 0.80±0.18 | 0.51 | 0.0142 ± 0.0227 | 0.0187 ± 0.0351 | 0.41 | ||||
| Week 3 | 0.85±0.15 | 0.88±0.14 | 1 | 0.0177 ± 0.0249 | 0.0068 ± 0.0220 | 0.02 | ||||
| Week 4 | 0.89±0.16 | 0.95±0.07 | 0.14 | 0.0092 ± 0.0140 | 0.0079 ± 0.0133 | 0.43 | ||||
| Non-recovered | 62 | 96 | Days 1-3 | 0.09±0.20 | 0.25±0.16 | <0.001 | 0.0377 ± 0.0899 | 0.0928 ± 0.0697 | <0.001 | |
| Days 4-7 | 0.25±0.50 | 0.52±0.29 | <0.001 | 0.0160 ± 0.0248 | 0.0271 ± 0.0540 | 0.11 | ||||
| Week 2 | 0.40±0.54 | 0.65±0.26 | <0.001 | 0.0087 ± 0.0150 | 0.0094 ± 0.0384 | 0.96 | ||||
| Week 3 | 0.46±0.51 | 0.70±0.27 | <0.001 | 0.0051 ± 0.0079 | 0.0080 ± 0.0254 | 0.14 | ||||
| Week 4 | 0.52±0.55 | 0.73±0.31 | <0.001 | 0.0033 ± 0.0089 | 0.0020 ± 0.0159 | 0.54 | ||||
| Total | 117 | 299 | Days 1-3 | 0.24±0.35 | 0.36±0.25 | <0.001 | 0.0902 ± 0.1276 | 0.1381 ± 0.0959 | <0.001 | |
| Days 4-7 | 0.50±0.50 | 0.66±0.31 | <0.001 | 0.0210 ± 0.0352 | 0.0279 ± 0.0512 | 0.46 | ||||
| Week 2 | 0.62±0.51 | 0.74±0.25 | <0.001 | 0.0094 ± 0.0188 | 0.0174 ± 0.0351 | 0.22 | ||||
| Week 3 | 0.63±0.56 | 0.78±0.26 | <0.001 | 0.0069 ± 0.0118 | 0.0079 ± 0.0217 | 0.67 | ||||
| Week 4 | 0.55±0.57 | 0.78±0.33 | <0.001 | 0.0038 ± 0.0086 | 0.0031 ± 0.0148 | 0.64 | ||||
| IQR1: Interquartile range, representing the difference between the 75% and 25% quantile. | ||||||||||
Table 4.
The estimated coefficients of fixed effect models between quarter-level maximum relative milk loss (qMRML), maximum somatic cell counts deviation (MSCCD), clinical severity, causative pathogens and average percentage recovery (APR) in different time intervals.
Table 4.
The estimated coefficients of fixed effect models between quarter-level maximum relative milk loss (qMRML), maximum somatic cell counts deviation (MSCCD), clinical severity, causative pathogens and average percentage recovery (APR) in different time intervals.
| Model parameters | VIF1 | Days 1-3 | Days 4-7 | Week 2 | Week 3 | Week 4 | |||||||||||
| Inflamed | Uninflamed | Inflamed | Uninflamed | Inflamed | Uninflamed | Inflamed | Uninflamed | Inflamed | Uninflamed | ||||||||
| qMRMLi2 | 1.97 | -0.07*** | 0.01 | -0.10*** | 0.02 | -0.13** | 0.02 | -0.11* | 0.03 | -0.09 | 0.04 | ||||||
| qMRMLu3 | 2.1 | -0.06** | -0.09*** | -0.08** | -0.09*** | -0.11** | -0.04** | -0.09* | 0 | -0.07 | 0.02 | ||||||
| MSCCD4 | 1.15 | 0.03* | 0 | 0.05* | 0 | 0.08** | 0.02 | 0.07* | 0.02 | 0.04 | -0.03 | ||||||
| Clinical severity | 1.45 | ||||||||||||||||
| Mild | |||||||||||||||||
| Moderate | -0.09* | 0.02 | -0.13* | 0.07 | -0.01 | 0.06 | -0.08 | 0.06* | -0.08 | 0.15*** | |||||||
| Severe | -0.03 | 0.02 | -0.01 | 0.07 | 0.12 | 0.12*** | 0.15 | 0.15*** | 0.08 | 0.22*** | |||||||
| Pathogens | 1.17 | ||||||||||||||||
| Culture-negative | |||||||||||||||||
| Minor pathogens | 0.07 | -0.05 | -0.03 | -0.12* | -0.07 | -0.13** | -0.13 | -0.17*** | -0.09 | -0.07 | |||||||
| Major pathogens | -0.04 | -0.07** | -0.13* | -0.07* | -0.13* | 0.06 | -0.21** | -0.04 | -0.24** | -0.07 | |||||||
| Intercept | 21.51 | 0.32*** | 0.41*** | 0.60*** | 0.65*** | 0.64*** | 0.62*** | 0.72*** | 0.71*** | 0.75*** | 0.69*** | ||||||
| R2 | 50.52% | 30.14% | 52.93% | 13.44% | 48.01% | 23.69% | 43.07% | 46.62% | 44.28% | 45.38% | |||||||
| “*”, “**”, “***” represent P-value of the estimated coefficient is < 0.05, < 0.01 and < 0.001 respectively, implying a meaningful association between the fixed effect and APR in different time intervals. VIF1: variance inflation factor (VIF) qMRMLi2: quarter-level maximum relative milk loss for inflamed quarters qMRMLu3: quarter-level maximum relative milk loss for uninflamed quarters MSCCD4: maximum somatic cell counts deviation | |||||||||||||||||
Table 5.
The estimated coefficients of fixed effect models between quarter-level maximum relative milk loss (qMRML), maximum somatic cell counts deviation (MSCCD), clinical severity, causative pathogens and slope of percentage recovery (SPR) in different time intervals.
Table 5.
The estimated coefficients of fixed effect models between quarter-level maximum relative milk loss (qMRML), maximum somatic cell counts deviation (MSCCD), clinical severity, causative pathogens and slope of percentage recovery (SPR) in different time intervals.
| Model parameters | VIF1 | Days 1-3 | Days 4-7 | Week 2 | Week 3 | Week 4 | |||||||||
| Inflamed | Uninflamed | Inflamed | Uninflamed | Inflamed | Uninflamed | Inflamed | Uninflamed | Inflamed | Uninflamed | ||||||
| qMRMLi2 | 1.97 | -0.0182* | 0.0067 | -0.0143** | -0.007 | 0.0042 | -0.0028 | -0.0017 | -0.0098*** | -0.0007 | -0.0001 | ||||
| qMRMLu3 | 2.1 | -0.0223** | -0.0332*** | 0.0022 | 0.0012 | -0.002 | 0.0060* | 0.0008 | 0.0069* | -0.0001 | 0.0008 | ||||
| MSCCD4 | 1.15 | 0.0122* | -0.0016 | -0.0072* | 0.0044 | 0.002 | -0.0016 | -0.0027 | -0.002 | -0.0037* | -0.0012 | ||||
| Clinical severity | 1.45 | ||||||||||||||
| Mild | |||||||||||||||
| Moderate | -0.0434*** | 0.0101 | 0.0212* | 0.0081 | 0.002 | 0.0022 | 0.0073 | 0.0182*** | 0.0012 | -0.0011 | |||||
| Severe | -0.0143 | 0.0107 | 0.0290** | 0.0122 | 0.0039 | 0.0125* | 0.0036 | 0.0147* | 0.0038 | 0.0028 | |||||
| Pathogens | 1.17 | ||||||||||||||
| Culture-negative | |||||||||||||||
| Minor pathogens | 0.0096 | -0.0193 | -0.0075 | 0.0226* | 0.0022 | 0.0141 | -0.0083 | -0.0116 | 0.0134 | 0.0136* | |||||
| Major pathogens | -0.0273* | -0.0118 | 0.0066 | 0.0132 | -0.0076 | 0.0094 | -0.0089* | -0.0063 | 0.0017 | 0.003 | |||||
| Intercept | 21.51 | 0.1295*** | 0.1396*** | 0.008 | 0.0093 | 0.0142*** | 0.0001 | 0.0103* | 0.0006 | 0.0014 | -0.0003 | ||||
| R2 | 51.46% | 22.47% | 16.48% | 7.71% | 9.19% | 10.69% | 15.25% | 19.27% | 15.82% | 6.75% | |||||
| “*”, “**”, “***” represent P-value of the estimated coefficient is < 0.05, < 0.01 and < 0.001 respectively, implying a meaningful association between the fixed effect and APR in different time intervals. VIF1: variance inflation factor qMRMLi2: quarter-level maximum relative milk loss for inflamed quarters qMRMLu3: quarter-level maximum relative milk loss for uninflamed quarters MSCCD4: maximum somatic cell counts deviation | |||||||||||||||
Disclaimer/Publisher’s Note: The statements, opinions and data contained in all publications are solely those of the individual author(s) and contributor(s) and not of MDPI and/or the editor(s). MDPI and/or the editor(s) disclaim responsibility for any injury to people or property resulting from any ideas, methods, instructions or products referred to in the content. |
© 2025 by the authors. Licensee MDPI, Basel, Switzerland. This article is an open access article distributed under the terms and conditions of the Creative Commons Attribution (CC BY) license (https://creativecommons.org/licenses/by/4.0/).
Copyright: This open access article is published under a Creative Commons CC BY 4.0 license, which permit the free download, distribution, and reuse, provided that the author and preprint are cited in any reuse.


