Submitted:
23 July 2025
Posted:
24 July 2025
You are already at the latest version
Abstract
The implementation of improved solutions aimed at enhancing energy efficiency and optimizing the performance of water cycle management requires a comprehensive tool to assess all relevant information. To address this, analyzing a substantial amount of operational data poses a challenge. This study aims to contribute to defining a methodology that leverages information and knowledge derived from data related to energy intensity and parameters describing sanitation system performance. In the pursuit of sustainability, new metrics and indicators must consider environmental, social, and economic dimensions, with a focus on energy and climate change mitigation strategies. This research, based on data from 29 wastewater treatment plants, shows that statistical analysis and sustainable value assessment can serve as effective tools for integrating performance data and energy intensity information within wastewater treatment plants. The adoption of sustainable value management showed to be an innovative strategy for the aggregation of monitoring data necessary for a benchmark approach in wastewater treatment plants.
Keywords:
energy efficiency
; energy intensity
; benchmarking
; sustainable value
; wastewater treatment plant
1. Introduction
Water and wastewater systems are significant energy consumers, considered as energy-intensive facilities [1]. A significant portion of the energy consumed in the water sector can be attributed to wastewater treatment. Projections indicate that energy demand will increase by over 60% by 2040, driven by the rising need to remediate polluted water [2]. Water and energy are intrinsically linked resources, and the concept of the water–energy nexus helps explain this connection [3]. In wastewater utilities (WWU) worldwide, electricity costs typically range from 5% to 30% of total operating costs. Unfortunately, these costs can become unsustainable, impacting the financial health of WWU and straining public/municipal budgets. In some cases, this situation may even necessitate raising tariffs for their customer base [4]. In 2014, the energy demand of the water sector worldwide amounted to 120 million tons of oil equivalent (Mtoe). This energy consumption was predominantly in the form of electricity, accounting for approximately 4% of the total global electricity consumption. Specifically, the breakdown of electricity usage within the water sector was as follows: 40% for water extraction; 25% for wastewater treatment; 20% for water distribution [5]. Additionally, as highlighted by the International Energy Agency (IEA), electricity consumption in the water sector is projected to more than double in the coming decades. Historically, Waste Water Treatment Plants (WWTP) have been designed primarily to meet effluent quality requirements, often without sufficient consideration of energy demands. However, a notable shift toward sustainability in wastewater treatment practices has emerged. According to data from the European Benchmarking Cooperation, the average electricity consumption for wastewater treatment stands at 33.4 kilowatt-hours per person equivalent (kWh/PE) [6]. Common energy intensity indicators often focus solely on the ratio between the flowrate treated and the energy expended [7], without considering the specific degree of treatment associated with each WWTP. The energy consumption in this sector is expected to increase due to the growing population concentration in large urban centers. Therefore, we can anticipate the development of longer and more complex drainage and wastewater treatment systems. Additionally, stringent environmental regulations, particularly those stemming from European Directives (such as those related to urban wastewater treatment, nitrates, bathing water quality, freshwater fish habitats, sludge management, the Water Framework Directive, and the priority list of hazardous substances), necessitate a holistic approach that considers not only economic factors but also ecosystem equilibrium and social considerations.
The EU Energy Efficiency Directive (EED) recommends an annual target of 1.7% reduction in energy consumption for all public sectors, including water and wastewater treatment facilities [8,9].
To address these challenges, expensive and complex efforts are underway to improve and expand existing infrastructure. Globally, several initiatives are being implemented with the objective of reducing greenhouse gas emissions. The European Union (EU) is at the forefront of the fight against climate change and has committed to achieving three main objectives by 2020: a 20% reduction in greenhouse gas emissions, a 20% increase in the share of renewable energies, and a 20% decrease in energy consumption. However, new targets have been defined beyond 2020, and the challenge remains significant.
For the sanitation systems management sector, the key task is to optimize processes to reduce energy consumption and greenhouse gas emissions resulting from wastewater management and treatment. This optimization must be achieved without compromising the discharge licenses that these systems are legally obligated to meet.
Wastewater treatment primarily involves three major processes: biochemical treatments, liquid/solid separation operations, and thermal processes for sludge treatment and valorization. While much of the work in this field focuses on water quality, it is crucial to consider the relationship between water quality and pollutant removal efficiency in WWTP and their energy aspects. As we navigate future industrial practices in the context of global warming and the scarcity of fossil resources, energy costs will play a pivotal role [10].
Energy costs constitute a significant controllable expense in providing wastewater services through public Water Resource Recovery Facilities (WRRFs). Large WRRFs often consume substantial amounts of energy during biological treatment, especially when relying on conventional activated sludge processes [11]. Energy is consumed in all stages of wastewater transport and treatment. However, the most significant energy-intensive operations are elevation (such as pumping water to higher levels) and aeration (which enhances biological treatment processes) [12]. It is crucial to evaluate the energy intensity of WWTP. This evaluation involves an indicator that integrates several factors, including the volume of wastewater treated, the number of pollutants removed, and the energy required for treatment. Implementing energy management systems is essential in this context. Quantitative performance metrics, such as performance indicators, play a pivotal role in assessing WWTP [13,14]. These indicators serve as a benchmarking tool for evaluating and comparing energy performance across different WWTP [15]. Energy costs in the wastewater industry, particularly related to energy intensity, have been on the rise due to several factors:
- Stringent Legal Discharge Limits: Regulatory requirements for nutrient removal, microbiology control, and other contaminants have become more demanding. In some cases, meeting these limits necessitates the use of energy-intensive technologies.
- Advanced Sludge Treatment: Processes such as drying, incineration, and pyrolysis for sludge treatment contribute to higher energy consumption.
- Aging Infrastructure: The natural aging of wastewater transport systems leads to increased infiltration, which, in turn, requires additional energy for pumping and transport.
- Electricity Rate Increases: The cost of electric power has significantly risen, impacting overall energy expenses.
In response to these escalating costs and the existing legal framework, water and sanitation management entities have been implementing energy management measures to mitigate the impact on their operations.
Benchmarking, as a business management practice, is designed to systematically evaluate products, services, and work processes within organizations with the goal of continuous improvement [16]. In the context of energy efficiency, energy benchmarking involves a systematic comparison of energy performance relative to a reference standard. The primary objective is to identify the most efficient units and best practices [17].
The International Water Association (IWA) has established a task group specifically focused on benchmarking control strategies for WWTP. This collaborative effort aims to enhance energy efficiency and optimize operational practices in the water sector [18]. Improvements can indeed be achieved, and energy efficiency significantly increased by comparing different processes and learning from best practices. The benchmarking approach has proven to be a valuable tool for assessing the energy intensity of WWTP. Through benchmarking, WWTP can identify areas for improvement and implement strategies to reduce energy consumption [1,19,20,21].
Different authors such as Reis [22], Torregrossa et al. [23], Hernández-Sancho and Sala-Garrido [24] and Sala-Garrido et al. [25] have investigated the reduction energy costs, through benchmarking approaches. This benchmarking review has been performed either on a monthly or yearly basis [3,25,26,27]. Analyzing a large amount of operational data within water cycle management entities can indeed be challenging. The need to extract meaningful insights from this data, particularly related to energy intensity, is crucial for improving energy efficiency. To address this, researchers and practitioners have been working on developing decision support tools that assist WWTP managers in identifying various strategies and actions for optimization [3].
The concept of the Circular Economy (CE) emphasizes that products and materials should never become waste; instead, they should remain in circulation within the economy for as long as possible [6]. Unlike the traditional linear model of “take-make-waste,” a circular economy aims to be regenerative by design. It achieves this through processes such as maintenance, reuse, refurbishment, remanufacture, recycling, and composting.
In the context of wastewater treatment plants, there is a significant opportunity to contribute to the circular economy. This can be achieved by Energy Production Integration:
- WWTP can play a crucial role by integrating energy production into their operations. For instance, capturing biogas from sludge treatment processes can generate renewable energy (such as electricity or heat).
- By utilizing energy recovery technologies, WWTP can minimize waste and simultaneously produce valuable resources.
- Materials Recovery: WWTP can recover valuable materials from wastewater streams. For example: nutrients - extracting nutrients (such as nitrogen and phosphorus) from wastewater can create fertilizers; bioplastics - certain microorganisms can produce bioplastics from organic matter in wastewater; reusable water - treating wastewater to a high standard allows for its reuse in non-potable applications (e.g., irrigation, industrial processes) [28].
The manuscript aims to contribute to the definition of a methodology and establishment of metrics and indicators for energy intensity in wastewater treatment plants. By doing so, it seeks to enhance WWTP energy efficiency and promote a path towards sustainability.
2. Materials and Methods
2.1. Data Organization
The Simtejo dataset, which pertains to the Portuguese integrated sanitation of the municipalities of Tejo and Trancão, S. A., has been analyzed in the context of 29 wastewater treatment plants located in the Lisbon region. The analysis is based on a common framework that supports the assessment of all WWTP (Figure 1). Here are the key components of this framework:
Wastewater Drainage Basin
- This refers to the geographical area from which wastewater is collected and transported to the WWTP;
- Understanding the characteristics of the drainage basin is essential for assessing the overall system.
Raw Material (Wastewater Influx)
- The incoming wastewater (raw material) is qualitatively and quantitatively classified;
- Qualitative aspects include parameters such as pollutant levels, contaminants, and composition;
- Quantitative aspects involve measuring the volume and flow rate of wastewater.
WWTP as a Black Box
- The WWTP is conceptualized as a black box that receives raw material (wastewater) and performs treatment processes;
- It consumes energy during these processes;
- Despite variations in specific WWTP designs, they share common attributes, allowing for meaningful comparisons.
Energy Consumption
- Energy usage within WWTP is a critical factor.
- Specifically, energy consumption is related to processes such as organic material oxidation (e.g., biological treatment) and hydraulic motors (e.g., pumping and transport).
By analyzing these components, researchers and practitioners can gain insights into WWTP performance, identify areas for improvement, and promote energy efficiency in wastewater treatment.
Every WWTP must comply with discharge limits regarding the quality of treated effluent. Since they all discharge according to the same discharge standards, it was considered that the concentration of pollutants in the wastewater effluent from treated wastewater was uniform across all WWTP.
One of the main challenges in this study relates to the time dimension of the variables. The data is referenced over a one-year period, which limits the ability to analyze variations in energy efficiency over time. However, this data still provides valuable insights for research and decision-making.
2.2. Variables
A sanitation system should be analyzed as a whole, considering the collection system and the transport of wastewater to the WWTP, as well as the treatment plant, the treated effluent discharge system, and the receiving environment.
Chemical reactions may occur in the wastewater drainage system, leading to changes in wastewater characteristics along the system. Some variables related to the collection system were considered to explore their possible relationship with energy intensity, climate, dimension, and general hydraulic characteristics of the system. Additionally, the catchment area was used to characterize the variable dimension. To complement this information, the length of the collection system and the number of pumping stations in each subsystem were also considered.
Considering the energy intensity analysis of the WWTP as the main objective of this study, a methodology was defined based on the two main vectors that characterize the raw wastewater (raw material) arriving at the WWTP: quality and quantity.
The data about the influent to the WWTP was representative of the quantity of the wastewater to characterize the vector quantity. The sampling considered in this study was based on a monthly average. The flowrate is assessed through flowmeters at the entrance of the WWTP, and it is expressed in m³/h.
Wastewater was characterized in terms of organic and inorganic material. The variable selection and construction took into consideration both the load of organic and inorganic material arriving at the WWTP and the relationship between those two components, to facilitate future analysis of potential correlations between them. Due to the large number of possible variables, choices had to be made. The variables used as a basis correspond to the analytical evaluation based on a composite sample for the following parameters: chemical oxygen demand (COD), biochemical oxygen demand (BOD5), total suspended solids (TSS), and total nitrogen Kjeldahl (Nk). The available data results from the sampling plan accomplished in each plant and the corresponding annual average basis.
In a WWTP, the main electricity-consuming operation is aeration during secondary treatment, responsible for 30-60% of the total consumption. Therefore, variables that consider the characterization of the organic carbon and nitrogen compounds’ source—specifically, the influent load of total nitrogen Kjeldahl—were also considered.
The variety of WWTP typology, including dimensions, hydraulic configuration, unit operations in the treatment lines for liquid and solid phases, and the presence or absence of complementary treatment steps, indicates the importance of organizing data based on these characteristics (Table 1). Consequently, several variables—mostly qualitative ones—such as the existence of primary or secondary treatment, nitrogen and phosphorus removal, disinfection, anaerobic digestion, dewatering type, and odor treatment, were considered. The only quantitative variable at this stage relates to the number of pump stations during the liquid phase, as their existence may significantly increase energy consumption.
The metrics associated with energy intensity pose an interesting challenge. In this study, we adopted an approach that is both straightforward and comprehensive, allowing us to consider the variables relevant to our objectives. These variables were established based on total energy consumption by WWTP. To gain a better understanding of the relationships between different factors, we defined energy indicators based on the characteristics of raw wastewater. The outcome was the creation of indicators linked to the energy intensity in wastewater treatment.
The available energy data for this study pertains to WWTP rather than specific treatment steps.
2.3. Principal Component Analysis
Principal Component Analysis (PCA) is a factorial analysis that aims to summarize information from a given dataset with minimal loss. This summarization is achieved through data reduction and the identification of underlying structures. In PCA, the information contained in the initial variables is synthesized into a set of indicators known as principal components.
The outcome of applying this technique is a deeper understanding of the initial data structure. Analysts can identify associations between variables related to specific factors and uncover new dimensions. It’s essential to emphasize that PCA [29] was employed in this study as an exploratory technique rather than for predictive modeling.
The objective of applying PCA in this work is to determine which variables are most suitable for characterizing the energy intensity of the 29 WWTP studied. These variables correspond to data typically available in management systems.
2.4. Sustainable Value
Sustainable value is another indicator adopted for WWTP benchmarking. It considers the treatment level, efficiency, and resources involved. The chosen indicator for comparing different technologies is the Sustainable Value, which results from the application of the Sustainable Value Methodology. This methodology adapts conventional phases to the specificities of the study subject.
To evaluate the performance considered in the numerator of the Sustainable Value quotient, a set of performance evaluation criteria applicable to the WWTP involved was identified. The relative importance of each criterion was established. Then, it was determined how each WWTP met these criteria, using a specific scale (Table 2). The proposal is to adopt an indicator that considers not only the WWTP flowrate but also performance related to organic and solid matter, nutrients, microbial content, odors removal, and associated energy consumption.
According to the EN 1325:2014 standard, the value of a study subject can be described as the relationship between the satisfaction of needs (performance) and the resources used in achieving that satisfaction as:
This approach aims to integrate parameters that can enhance the value of the study object. For instance, it involves improving the efficiency of existing processes, products, and technologies or reducing the required resources—such as energy purchases—by incorporating renewable energy technologies [30].
For each of the 29 WWTP, value was estimated based on the relationship between plant performance and resource utilization. To calculate this value, we employed various steps from the sustainable value methodology, including global inventory and functional analysis. Overall, the methodology is supported by an eight-phase working plan [31]:
Phase 1. Gathering of general data from the company;
Phase 2. Definition of specific data about the project;
Phase 3. Global inventory;
Phase 4. Functional analysis;
Phase 5. Problems synthesis;
Phase 6. Identification and selection of ideas;
Phase 7. Viability analysis;
Phase 8. Action plan.
During the global inventory, data about the entire system was collected, allowing us to estimate the resources used, particularly energy consumption.
Functional Analysis is a systematic process that fully describes the functions of the study subject and their relationships. It enables us to identify, characterize, classify, and evaluate these functions and their interconnections. Rather than analyzing the study subject merely as an assembly of components, we also consider its set of functions. Ultimately, user satisfaction depends on the performance of these functions.
Functional analysis can be applied to products, processes, or services. Notably, it has been successfully used in assessing WWTP in Portugal [12].
In the present study, we aimed to address various sustainability components through functional analysis. Considering that WWTP serve an environmental global function and a social global function while integrating resource considerations, we characterized plant performance based on the functions that fulfill user needs. These functions include removing BOD5 (biochemical oxygen demand), COD (chemical oxygen demand), TSS (total suspended solids), odors, microbial load, and treating sludge (Table 2). We quantified these functions in relation to each WWTP’s performance criteria and linked them to different sustainability components. The example in the table illustrates a WWTP where these six functions were identified, and the Sustainable Value was calculated.
For each function, specific criteria were identified and characterized to evaluate its performance. The satisfaction level (S) for each function was estimated based on several factors, including for all the functions the parameter flowrate (m³/year). For the functions "Remove BOD5", "Remove COD" and "Remove TSS" initial concentration and removal efficiency (removal efficiency expressed as the parameter η in percentage) related to key parameters such as BOD5, COD, and TSS were multiplied by the flowrate. For the functions "Remove microbial load", "Remove odors" and "Treat sludge" satisfaction terms were multiplied by the flowrate to obtain the satisfaction level (S). Here’s how the satisfaction terms were allocated for specific functions:
Remove Microbial Load – Satisfaction terms are:
- 0% when the effluent discharged into the environment undergoes no disinfection.
- 50% when chlorination is applied.
- 75% if UV treatment is used.
- 100% if a membrane process (more advanced than ultrafiltration) is employed.
Remove Odors - Five alternatives for satisfaction terms were considered:
- Zero if no deodorization
- 50% if odor removal with activated carbon or odor removal with chemical washing (two steps) or odor removal with biofiltration
- 100% if odor removal with chemical washing (four steps)
Treat Sludge - Satisfaction terms are:
- Zero if sludge treatment is not performed.
- 25% if air drying (using drying beds) is the method.
- 50% if a belt filter is used.
- 75% if centrifugation is employed.
- 100% if anaerobic digestion is the chosen process.
These satisfaction terms play a crucial role in assessing the overall performance of wastewater treatment plants.
Figure 2 illustrates the comparison of the six identified functions and their relative importance. These functions correspond to various WWTP performance criteria. Specifically:
- Removal of Solid and Organic Load - This function primarily addresses environmental criteria. It involves removing solid and organic matter from wastewater.
- Odor Removal and UV Disinfection - Odor removal and disinfection using ultraviolet (UV) light are essentially social criteria. They relate to the well-being of populations, including factors like smell perception and water quality for human use.
- Sludge Dewatering - Sludge dewatering is an economic criterion associated with the efficient operation of WWTP. It directly impacts waste handling costs.
- WWTP Energy Exploration Costs - Another economic criterion considered in this approach is the energy exploration costs associated with operating WWTP.
- Since not all functions carry equal importance, a weighting exercise was conducted using a matrix (shown in Figure 2).
In this process, functions were compared in pairs:
- A value of 1 was assigned if a function was considered less important.
- A value of 2 indicated slightly more importance.
- A value of 3 reflected somewhat greater importance.
- A value of 4 represented the maximum degree of importance attributed to a function.
The final relative importance (parameter φ, expressed as a percentage) for each function considered the sum of these partial values in relation to the total obtained ("Total" column). An adjustment was made to function D – Remove Odors, which initially showed a zero value ("Adjustment" column). This was because it was recognized that the importance of the odor removal function in WWTP is not zero, despite not having been valued in the function comparison exercise. Therefore, one unit value was added to this function, as well as to function E – Remove Microbial Load, to maintain the differentiation in importance between them, while maintaining the order of importance among the functions considered. The values obtained in the "Adjustment" column were converted to relative percentages in the "Relative Importance, φ (%)" column. Relative importance represents the concerns and expectations related to WWTP performance, including considerations related to existing legislation.
3. Results
The study results are presented and discussed in this section. Figure 3 displays a diagram containing all the variables considered in the Principal Component Analysis study. This diagram, through a global analysis of all the variables enables to identify which of them has higher amplitude in the wastewater sample and therefore a higher potential of discriminative capacity, specifically, the monthly flow rate (Fmonthly), population, COD, BOD5, TSS, total nitrogen Kjeldahl, and monthly energy consumption.
The 29 studied wastewater treatment plants have flow rates ranging from 1000 to 1000000 m3/month, with 80% of them having flow rates above 100000 m3/month. This asymmetric distribution arises from the varying dimensions of the WWTP considered in this study. Additionally, the monthly energy variable represents a non-uniform sample, which is expected due to the diverse dimensions of the WWTP considered in the study.
Total Kjeldahl nitrogen, from all the variables related to analytical parameters analyzed in the effluents, is the one presenting a more uniform distribution. A correlation analysis was conducted for all the variables to detect possible relationships between them. The parameters of the regression models exhibit significant variation, particularly the regression coefficient (line slope). This variation may be related to the scale effect in the plant, as it is expected that energy-specific consumption decreases with an increase in the volume of treated flowrate from the WWTP influent.
There is a strong linear correlation between the monthly flow rate and the monthly energy consumption. Even if we analyze the sample with medium and large dimension WWTP separately or exclude one of the WWTP, the linear correlation between these variables remains high. For the Alcantara WWTP, the expected linear correlation is influenced by both industrial and pluvial components. However, using monthly average values throughout the year may mask important information needed for a more accurate analysis.
Results from the studied WWTP show a strong linear correlation between the specific oxygen consumption expressed in chemical oxygen demand (COD) and biochemical oxygen demand (BOD5). This suggests that using these two indicators for benchmarking is very similar within the sample. The same conclusion can be drawn for the correlation between COD and total suspended solids (TSS) [11].
The data collected for the WWTP sample reveals a weak correlation between the selected variables related to the drainage system and the influent wastewater arriving at the treatment plant. This situation may be attributed to the sampling conditions, which result from monthly averages over the course of a year. Regarding the relationship between influent wastewater and energy intensity indicators, despite the existing correlations, it is essential to incorporate additional information into the analysis. Specifically, considering variables related to process efficiency will allow for a more accurate evaluation of WWTP efficiency and its association with conventional existing indicators.
Gallo et al [3] published an extensive review on methodologies for the energy benchmarking of wastewater treatment plants. The limitations of commonly used key performance indicators (KPI) in WWTP benchmarking studies have been highlighted. In this complex system, some KPI are suitable for specific stages, while others are inappropriate for assessing a single treatment stage or the entire plant. For instance, KPI related to the volume of treated wastewater (such as kWh/m3) are universally applicable during preliminary treatment but do not fully represent the entire plant’s performance or pollutant removal.
The results of applying the PCA technique to the original variables lead to the identification of three main components:
Factor 1 - WWTP dimension: WWTP dimension is represented by seven variables: monthly flowrate (Q mensal), population (Pop), chemical oxygen demand (COD) in kg/day, biochemical oxygen demand (BOD5) in kg/day, total suspended solids (TSS) in kg/day, total nitrogen (Nk) in kg/day, and monthly energy consumption (En Mensal). These variables are proportional to each other and collectively account for 47% of the total variance. Notably, three variables have factorial weights higher than 0.6, emphasizing their importance. These variables relate to the intercepting system and contribute to the analysis coherence, particularly in aspects related to WWTP dimension. Larger plants serve a greater area, have more lift stations in the intercepting system, and possess a longer wastewater intercepting system.
Factor 2 - Organic load: This component comprises five variables: COD (mg/l), BOD5 (mg/l), COD/TSS, BOD5/TSS, and BOD5/COD. It reflects the quality of the organic load in the effluent arriving at the wastewater treatment plant influent and accounts for 18% of the total variance.
Factor 3 - Energy intensity: The third component includes five variables: energy consumption related to BOD5 (EC_BOD5) in kWh/mg/l, energy consumption related to COD (EC_COD) in kWh/mg/l, energy consumption related to TSS (EC_TSS) in kWh/mg/l, energy consumption per flowrate (EC_Q) in kWh/m3/day, and energy consumption per population (EC_pop) in kWh/PE (population equivalent). This component likely represents the energy intensity indicators of WWTP and contributes to 14% of the total variance.
It is possible to analyze the relationships between different WWTP based on selected dimensions by projecting the WWTP onto a factor plane. Specifically, the projection of Factor 1 against Factor 2 provides insights related to the existing dimensions within the data structure, including both the physical size of the WWTP and the quality of the effluent organic matter arriving at each WWTP.
Factor 1 - WWTP dimension: As Factor 1 (representing WWTP dimension) increases, the corresponding factorial weight also increases along the X-axis. The Alcantara WWTP stands out prominently, along with a second group composed of Beirolas, Chelas, Frielas, and São João da Talha WWTP. Notably, the Rondulha plant also stands out due to other positive weight factors (such as temperature and the number of pumping stations in both WWTP and the intercepting system). Despite its small dimension, the Rondulha plant achieves a high factorial score, likely influenced by its relationship with the São João da Talha plant. The remaining plants exhibit little dispersion along the X-axis, correctly representing plants within the same dimension range.
Factor 2 - Organic load: Factor 2, represented along the Y-axis, accounts for only 18% of the total variance. It reflects the quality of the effluent organic matter arriving at each WWTP.
Integrated Analysis of Factors 1 and 2: Considering the integrated analysis of Factor 1 and Factor 2, we assume that they represent WWTP dimension and the quality of effluent organic matter. Interestingly, there appears to be no clear relationship between dimension and effluent quality. Some plants, regardless of size, exhibit typical or atypical organic matter quality associated with domestic effluents.
The graphical projection of the three components (WWTP dimension, organic load, and energy intensity) in Figure 4 allows for a quick assessment of which WWTP stand out in each component.
The application of Principal Component Analysis (PCA) to operational data could contribute to decision support, particularly as an energy intensity indicator for WWTP. In this context, it would also be interesting to incorporate cost variables and investment project viability analysis to assess the cost-benefit dimension.
The PCA application in this study resulted in an energy intensity performance ranking, as shown in Figure 5. By using statistical multivariate PCA, there is potential for analyzing the energy intensity of a set of WWTP. Specifically, the PCA allowed us to relate WWTP dimensions with the quality of effluent organic matter and a set of energy intensity indicators.
Based on the results, it is recommended that energy intensity analysis for WWTP consider multiple criteria decision analysis, rather than relying solely on indicators related to energy and flowrate. Performance indicators should be used in an integrated manner, considering both the quantity and quality of treated water.
The other indicator suggested for WWTP benchmarking, the Sustainable Value (SV) was calculated using the same original data that was previously analyzed with PCA. SV is obtained by dividing performance (∑φS) by the resources (R) involved (Table 2 shows an example of Sustainable Value estimation for one WWTP). While operational costs in monetary terms can be used to quantify resources, in this study, we used the annual energy amount (measured in MWh/year) as the denominator. This choice aligns with the main objective of achieving an integrated energy intensity indicator for the WWTP.
Using the Sustainable Value methodology, we estimated 29 Sustainable Value indicators, which are shown in Figure 6. Notably, some WWTP have their own energy production through anaerobic digestion processes. As a result, the approach differentiated the results in terms of consumed energy versus purchased energy. Figure 6 highlights the advantage of WWTP with internal energy production, which exhibits higher sustainable values. Specifically, this difference is evident when comparing the sustainable value obtained considering purchased energy versus consumed energy. Notable examples include WWTP S. J. Talha, Beirolas, Chelas, and Frielas, all of which utilize anaerobic digestion and purchase less energy than they consume.
The two approaches described exhibit some similarities in the resulting indicators related to energy intensity. Specifically, smaller wastewater treatment plants such as Rondulha, S. Sebastião, and Vila Nova tend to have lower values for energy intensity. Conversely, some of the larger WWTP with better performance, including S. J. Talha, Beirolas, Encarnação, and Chelas, exhibit higher energy intensity values. These observations are based both on an analysis of main components and the sustainable value methodology.
While the exact values do not match, there exists a discernible range that allows us to identify WWTP with better performance and another group corresponding to those with lower performance. Consequently, the indicators obtained reflect this distinction.
Interestingly, despite differences in behavior, the WWTP Alcantara still follows the overall trend observed through principal component analysis (PCA). This suggests that both methodologies—analysis of main components and Sustainable Value assessment—can yield robust results for performance evaluation. Furthermore, they enable the development of solid benchmarking exercises, contributing to a more comprehensive assessment of WWTP efficiency improvements.
Of particular significance is the Sustainable Value indicator, which facilitates benchmarking based on environmental, social, and economic components. By consolidating assessments and decision support within sustainability criteria, this indicator plays a crucial role in evaluating WWTP.
The results obtained with these different approaches to WWTP performance indicators may still raise other questions. One such question raises the possibility of an inherent relationship between dimension and energy efficiency, and the existence of an optimal dimension range for operating a WWTP, due to scale effect. Indeed, better performance was observed in larger WWTPs compared to smaller ones, but it was not possible to conclude that an optimal range exists. In fact, it remains important to ensure service in small, isolated communities with small WWTPs, which may have lower performance indicators (also associated with lower treatment requirements, such as odor control in less populated areas). For these smaller WWTPs, it is also important to use these indicators to improve their performance, using best practices or equipment modifications. Other authors have recognized the importance of identifying the limiting stages or dysfunctions of the WWTP and, therefore, determining investment needs and priority assets for rehabilitation or retrofit [32].Other authors refer to the nexus between wastewater treatments and energy demand is a well-known problem [33] and the treatment capacity beyond the treatment technology used, for example recognizing that large-scale WWTP employing MBR technology have a higher average energy intensity [34].
One way to improve WWTP performance indicators is through the adoption of renewable energy sources. Renewable energy recovery technologies, such as anaerobic digestion (the most widely adopted technology due to its efficiency in treating sewage sludge and its ability to generate biogas), microbial fuel cells, and sludge gas (a technology for managing municipal sewage sludge, generating renewable energy production—syngas, which further decreases sludge volume and operating costs with sludge management, helps eliminate associated odors, and destroys pathogens) contribute to overcoming issues of high operating costs and high dependence on electricity from the main grid, but their successful integration requires addressing challenges such as technological maturity, economic feasibility, and regulatory frameworks [35,36].
4. Conclusions
Reducing energy consumption and operational costs in WWTP is crucial for achieving sustainability, especially considering that WWTP are significant energy consumers in the public sector. This study highlights the potential of statistical analysis and value management tools to support the sanitation systems management sector in optimizing processes and minimizing energy consumption—without compromising the discharge licenses that WWTP are obligated to maintain.
Effective management practices rely on systematic evaluations of water quality, pollutant removal efficiency, and energy consumption. Additionally, benchmarking exercises play a vital role in driving improvements. Ongoing benchmarking studies among WWTP have successfully measured energy consumption. In the context of a case study involving 29 WWTP, both conventional principal component factor analysis and sustainable value management emerged as suitable tools for integrating WWTP performance data, including energy intensity information. While statistical analyses generate indicators on various parameters that need to be interpreted in management activities, the Sustainable Value indicator contains aggregated information that allows for expedited benchmarking studies. Thus, this innovative sustainable management strategy not only enhances system information but also facilitates the aggregation and integration of monitoring data necessary for a comprehensive WWTP benchmarking approach. By focusing not only on performance optimization and energy efficiency, but also on decision-support indicators that encompass various aspects of sustainability, this approach contributes to better management of WWTP as a system, where environmental and energy aspects—and consequently greenhouse gas emissions and decarbonization—are valued, along with the social component related to the lives of the population, in an indicator that very concretely includes issues associated with the management of the WWTP itself.
Author Contributions
Conceptualization, J.C., P.P. and J.H.; methodology J.C., P.P. and J.H.; formal analysis, P.P. and J.C.; investigation, J.C., A.P., P.P., J.H; data curation, P.P.; writing—original draft preparation, J.H.; writing—review and editing, A.P. and J. C.; project administration, P.P. All authors have read and agreed to the published version of the manuscript. The Microsoft Copilot was used for English language correction.
Acknowledgments
To Simtejo the legal owner of data used in this work, consisting of a set of a yearly operational information.
Conflicts of Interest
The authors declare no conflicts of interest.
References
- Maziotis, A.; Sala-Garrido, R.; Mocholi-Arce, M.; Molinos-Senante, M. A. comprehensive assessment of energy efficiency of wastewater treatment plants: An efficiency analysis tree approach. Sci. Total Environ. 2023, 885, 163539. [CrossRef]
- di Cicco, M.R.; Spagnuolo, A.; Masiello, A.; Vetromile, C.; Nappa, M.; Lubritto, C. Energetic and environmental analysis of a wastewater treatment plant through static and dynamic monitoring activities. Int. J. Environ. Sci. Technol. 2020, 17, 4299–4312. [CrossRef]
- Gallo, M.; Malluta, D.; Del Borgi, A.; Gagliano, E. A Critical Review on Methodologies for the Energy Benchmarking of Wastewater Treatment Plants. Sustainability 2024, 16 (5), 1922. [CrossRef]
- World Bank. A primer on energy efficiency for municipal water and wastewater utilities. Energy Sector Management Assistance Program; technical report 001/12. Washington, DC: World Bank 2012. http://documents.worldbank.org/curated/en /256321468331014545/A-primer-on-energy-efficiency-for-municipal-water-and-wastewater-utilities.
- IEA (International Energy Agency). WEO 2016 Special Report: Water-Energy Nexus. Paris, France: International Energy Agency .
- Neczaj, E.; Grosser, A. Circular Economy in Wastewater Treatment Plant – Challenges and Barriers. In 3rd EWaS International Conference on “Insights on the Water-Energy-Food Nexus”, Lefkada Island, Greece, 27–30 June 2018.
- Paraschiv, S.; Paraschiv, S.L.; Serban, A. An overview of energy intensity of drinking water production and wastewater treatment, Energy Reports, Volume 9, Supplement 11. 2023, pp 118-123, ISSN 2352-4847. [CrossRef]
- Council of the European Union. Directive (EU) 2023/1791 of the European Parliament and of the Council on Energy Efficiency and Amending Regulation (EU) 2023/955 (Recast); Council of the European Union: Brussel, Belgium, 2023.
- Council of the European Union. Proposal for a Directive of the European Parliament and of the Council Concerning Urban Wastewater Treatment (Recast); European Commission: Brussels, Belgium, 2023.
- Descoins, N.; Deleris, S.; Lestienne, R.; Trouvé, E.; Marécha, F. Energy efficiency in waste water treatments plants: Optimization of activated sludge process coupled with anaerobic digestion. Energy 2021, 41, 1, 153-164. [CrossRef]
- Póvoa, P.; Oehmen, A.; Inocêncio, P.; Matos, J.S.; Frazão, A. Modelling energy costs for different operational strategies of a large water resource recovery facility. Water Sci. Technol. 2017, 75(9): 2139-2148. [CrossRef]
- Henriques, J.; Catarino, J. Sustainable value - An energy efficiency indicator in wastewater treatment plants. J. Clean. Prod 2017, 142 (1), 323-330. [CrossRef]
- Silva, C.; Rosa, M. J. Energy performance indicators of wastewater treatment: a field study with 17 Portuguese plants. Water Sci Technol. 2015, 72 (4), 510-9. [CrossRef]
- Hernández-Sancho, F.; Molinos-Senante, M.; Sala-Garrido, R. Energy efficiency in spanish wastewater treatment plants: a non-radial DEA approach. Sci. Total Environ. 2011, 409 (14), 2693–2699. [CrossRef]
- Longo, S.; d'Antoni, B.M.; Bongards, M.; Chaparro, A.; Cronrath, A.; Fatone, F., Lema, J.M.; Mauricio-Iglesias, M.; Soares, A.; Hospido, A. Monitoring and diagnosis of energy consumption inwastewater treatment plants. A state of the art and proposals for improvement. Appl. Energy 2016, 179, 1251–1268. [CrossRef]
- Spendolini, M. The Benchmarking Book. New York, NY. 1992. American Management Society/AMACOM Publishing.
- Esteves, F.; Cardoso, J.C.; Leitão, S.; Pires, E.; Baptista, J. Review of Energy Audit and Benchmarking Tools to Study Energy Efficiency through Reducing Consumption in Wastewater Treatment Systems. Br. J. Ed., Technol. Soc. 2022, 15, 150–165. [CrossRef]
- American Water Works Association (AWWA). Energy Index Development for Benchmarking Water and Wastewater Utilities, 2007. AWWA Research Foundation.
- Wett B.; Buchauer K.; Fimml C. Energy self-sufficiency as a feasible concept for wastewater treatment systems, Institute of Infrastructure and Environmental Engineering, 2007. University of Innsbruck, Austria.
- Cardoso, B.J; Rodrigues, E.; Gaspar, A.R.; Gomes, A. Energy performance factors in wastewater treatment plants: a review. J. Clean. Prod. 2021, 322, 129107. [CrossRef]
- Molinos-Senante, M.; Maziotis, A. Evaluation of energy efficiency of wastewater treatment plants: The influence of the technology and aging factors. Applied Energy 2022, 310, 118535. [CrossRef]
- Reis, C. Assessing and improving wastewater treatment performance. A contribution to the 3rd generation of the assessment system. PhD Thesis in Environmental Engineering. Instituto Superior Técnico, Lisbon, 2017.
- Torregrossa, D.; Schutz, G.; Cornelissen, A.; Hernández-Sancho, F.; Hansen, J. Energy saving in WWTP: Daily benchmarking under uncertainty and data availability limitations. Environmental Research 2016, 148, 330–337. [CrossRef]
- Hernández-Sancho, F.; Sala-Garrido, R. Technical efficiency and cost analysis in wastewater treatment processes: a DEA approach. Desalination 2009 249 (1), 230–234. http://linkinghub.elsevier.com/retrieve/pii/S0011916409008236. [CrossRef]
- Sala-Garrido, R.; Molinos-Senante, M.; Hernández-Sancho, F. Comparing the efficiency of wastewater treatment technologies through a DEA metafrontier model. Chem. Eng. J. 2011 173 (3), 766–772. [CrossRef]
- Molinos-Senante, M.; Hernandez-Sancho, F.; Sala-Garrido, R. Benchmarking in wastewater treatment plants a tool to save operational costs. Clean. Technol. Environ. Policy 2014, 16 (1), 149 –161. http://link.springer.com/10.1007/s10098-013-0612-8.
- Mizuta, K.; Shimada, M. Benchmarking energy consumption in municipal wastewater treatment plants in Japan. Water Sci. Technol 2010, 62 (10), 2256–2262. http://www.ncbi.nlm.nih.gov/pubmed/21076210. [CrossRef]
- Guven, H.; Dereli, R. K.; Ozgun, H.; Evren Ersahin, M.; Ozturk, I. Towards sustainable and energy efficient municipal wastewater treatment by up-concentration of organics. Progress in Energy and Combustion Science 2019, 70, 45–168. [CrossRef]
- Hair, J.; Black, W.; Babin, B.; Anderson, R.; Tatham, R.; Black, W. Multivariate Data Analysis. 2010, 7th edition, Prentice-Hall International Inc., Upper Saddle River.
- Simões, S.; Catarino, J.; Picado, A.; Lopes, T.; di Berardino, S.; Amorim, F.; Gírio, F.; Rangel, CM.; Ponce de Leão, T. Water availability and water usage solutions for electrolysis in hydrogen production. J. Clean. Prod. 2021, 315 (5), 128124. [CrossRef]
- Henriques, J.; Catarino, J. Sustainable value and cleaner production–research and application in 19 Portuguese SME. J. Clean. Prod. 2015, 96, 379–386. [CrossRef]
- Cassidy, J.; Silva, T.; Semião, N.; Ramalho, P.; Santos, A.R.; Feliciano, J.F.; Silva, C.; Rosa, M.J. Integrating Reliability and Energy Efficiency Assessments for Pinpointing Actionable Strategies for Enhanced Performance of Urban Wastewater Treatment Plants. Sustainability 2023, 15, 12965. [CrossRef]
- Kłosok-Bazan, I.; Rak, A.; Boguniewicz-Zabłocka, J.; Kuczuk, A.; Capodaglio, A.G. Evaluating Energy Efficiency Parameters of Municipal Wastewater Treatment Plants in Terms of Management Strategies and Carbon Footprint Reduction: Insights from Three Polish Facilities. Energies 2024, 17, 5745. [CrossRef]
- Huang, D.; Jin, L.; Liu, J.; Han, G.; Liu, W.; Huber-Lee, A. The Current Status, Energy Implications, and Governance of Urban Wastewater Treatment and Reuse: A System Analysis of the Beijing Case. Water 2023, 15, 630. [CrossRef]
- Lima, D.; Li, L.; Appleby, G. A Review of Renewable Energy Technologies in Municipal Wastewater Treatment Plants (WWTPs). Energies 2024, 17, 6084. [CrossRef]
- Twi-Yeboah, N.; Osei, D.; Dontoh, W.H.; Asamoah, G.A.; Baffoe, J.; Danquah, M.K. Enhancing Energy Efficiency and Resource Recovery in Wastewater Treatment Plants. Energies 2024, 17, 3060. [CrossRef]
Figure 1.
Simplified chart of WWTP flow analysis and the identification of critical variables .
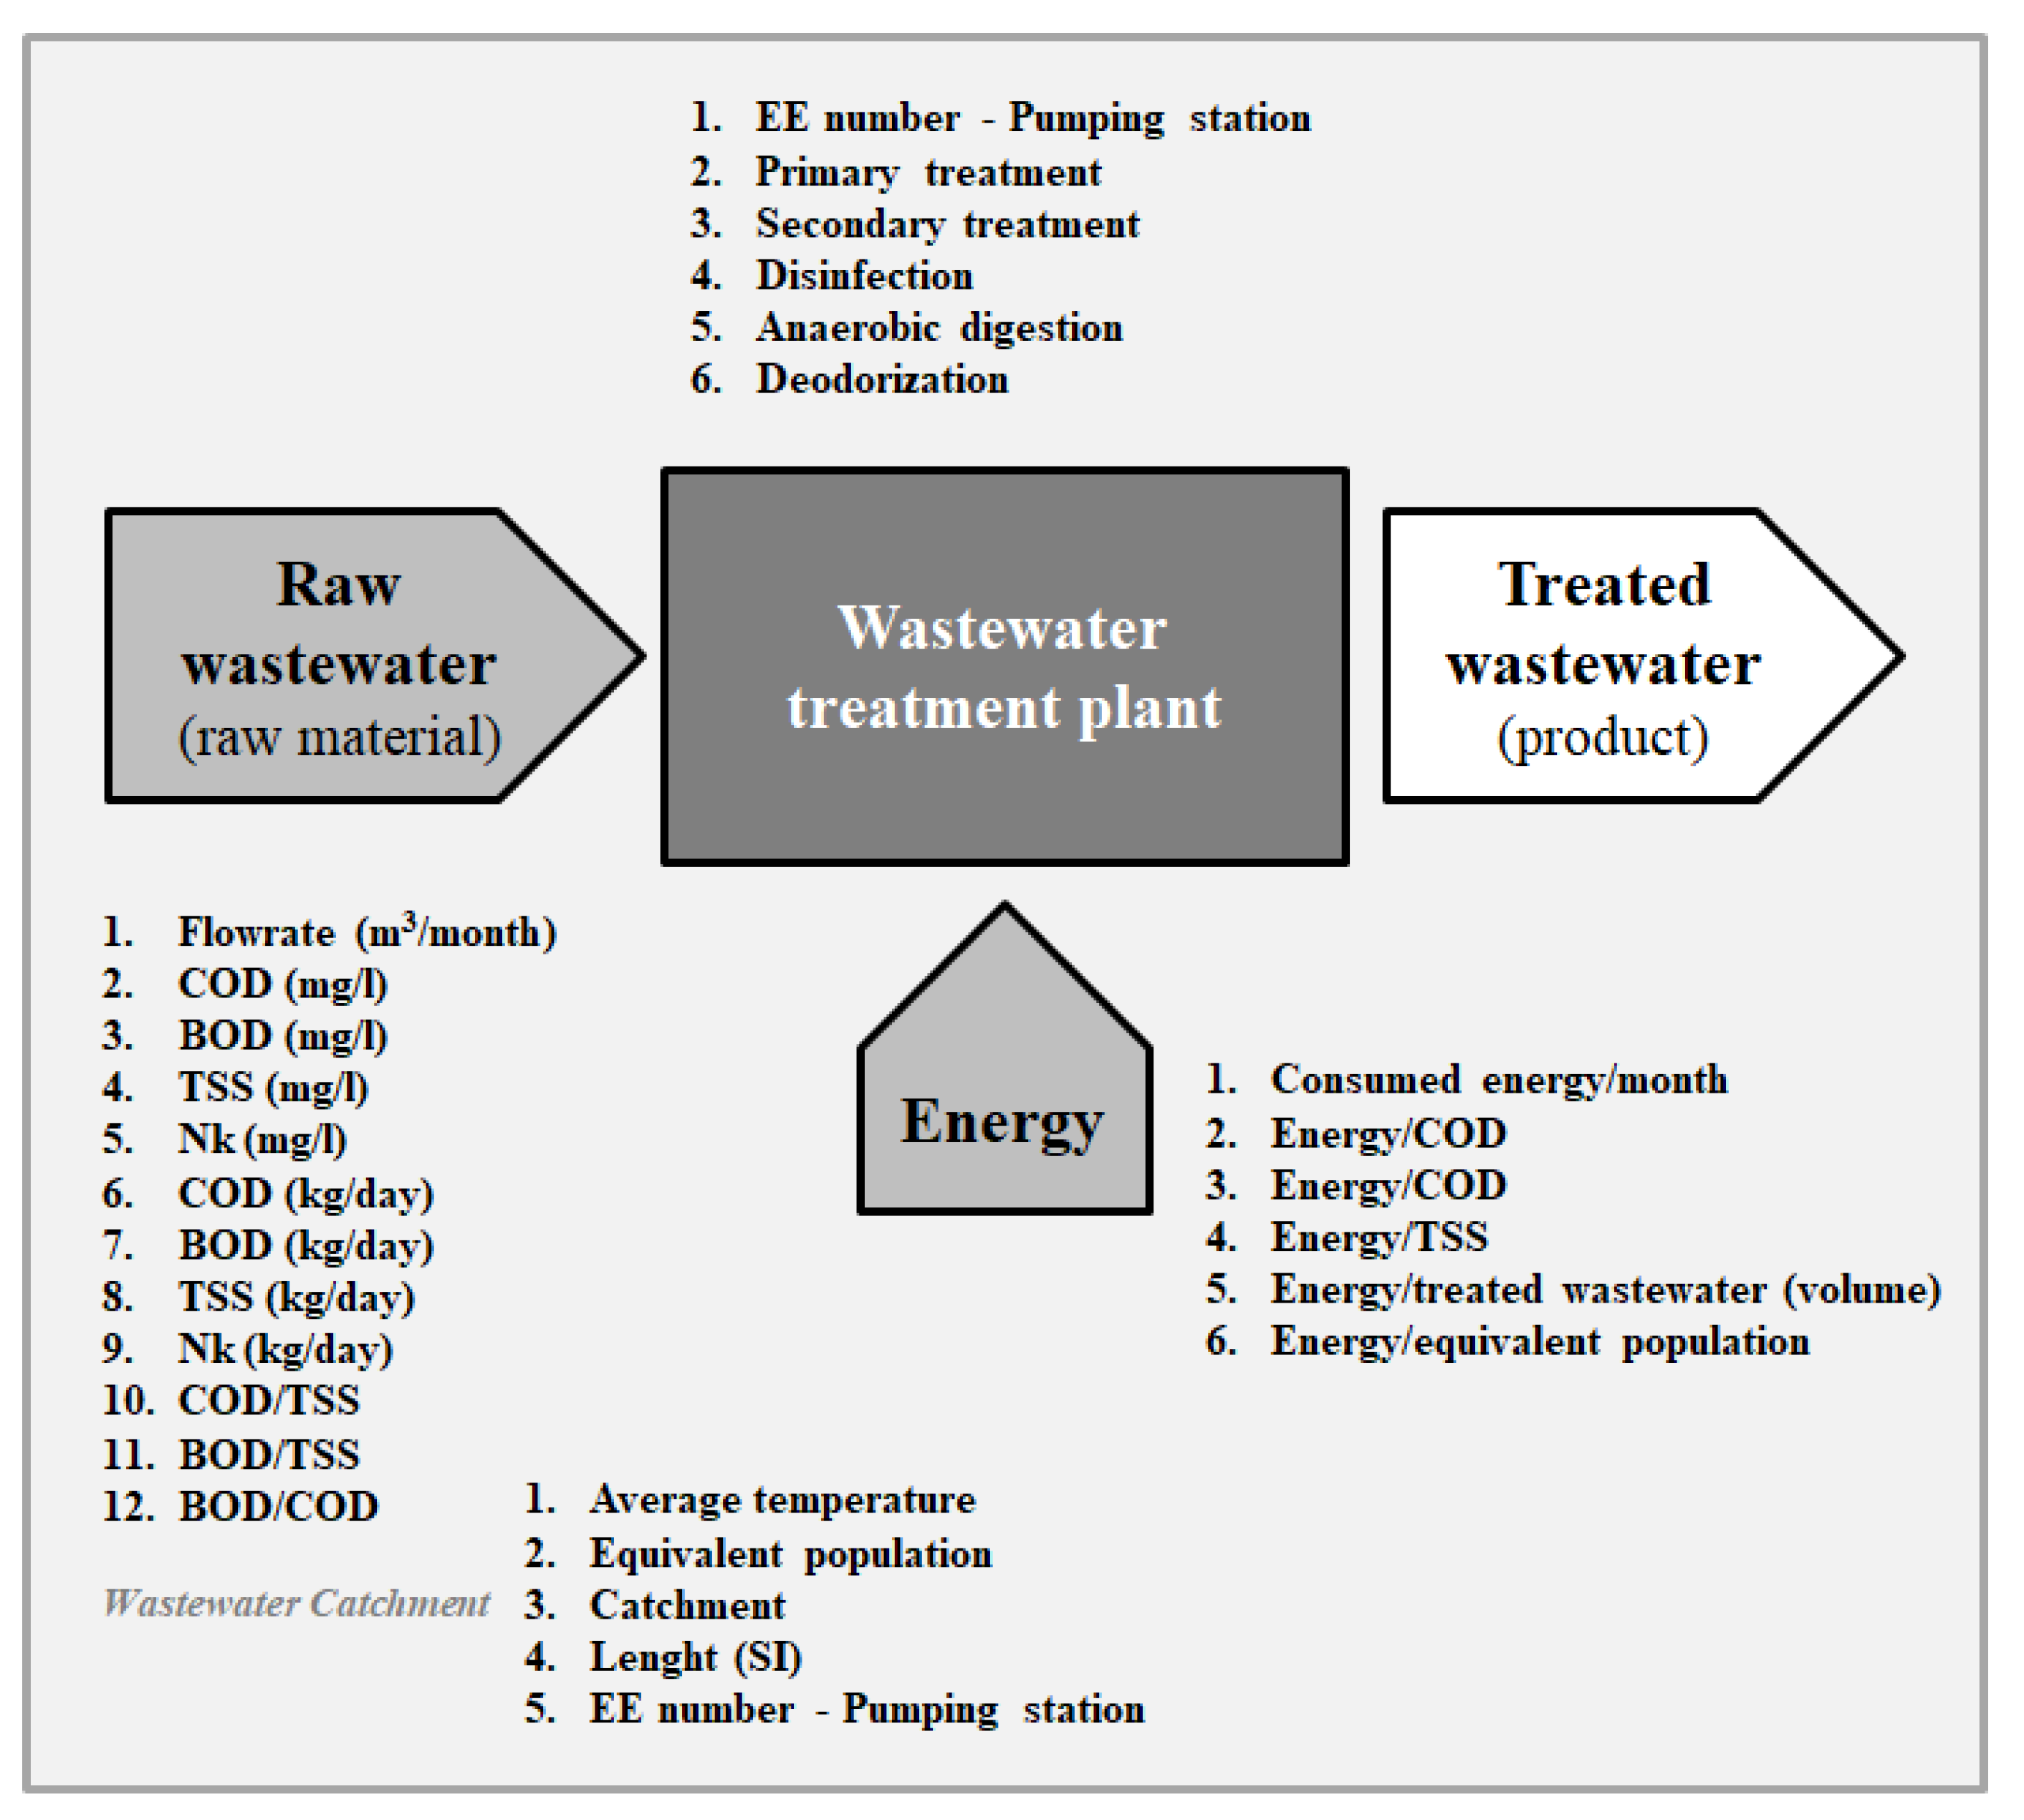
Figure 2.
Function’s relative importance - process of quantification.
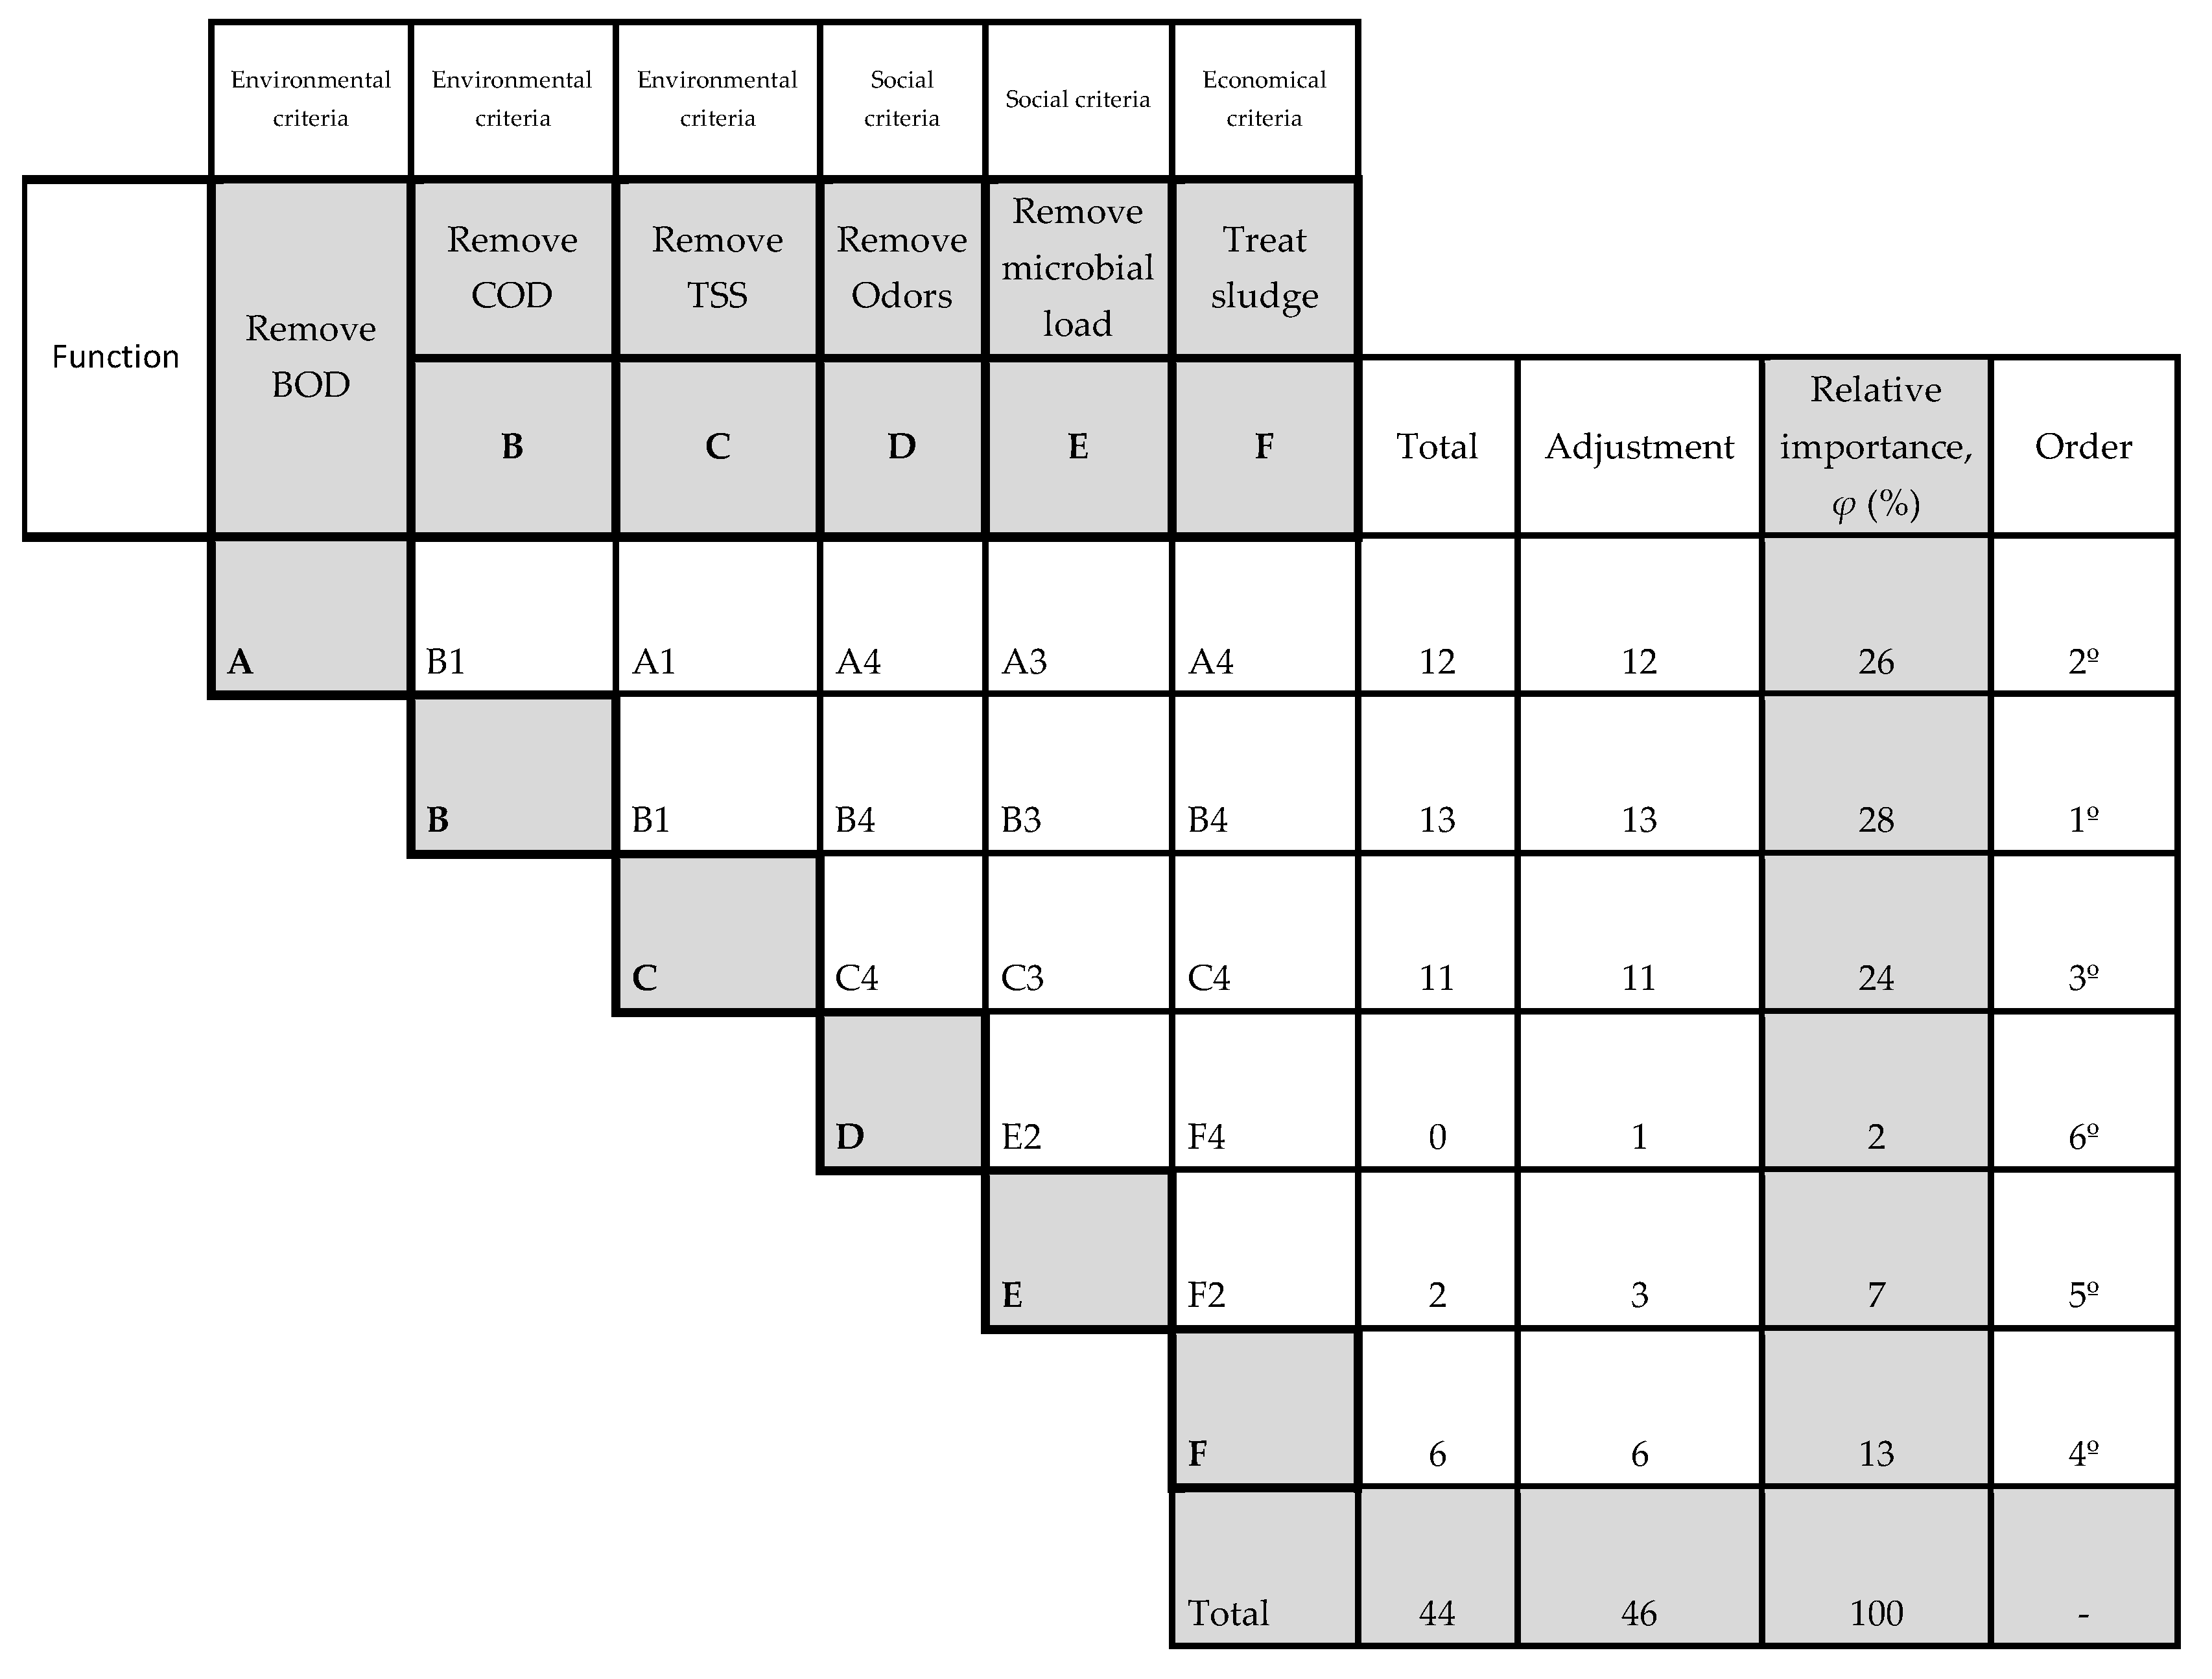
Figure 3.
PCA variables diagram.
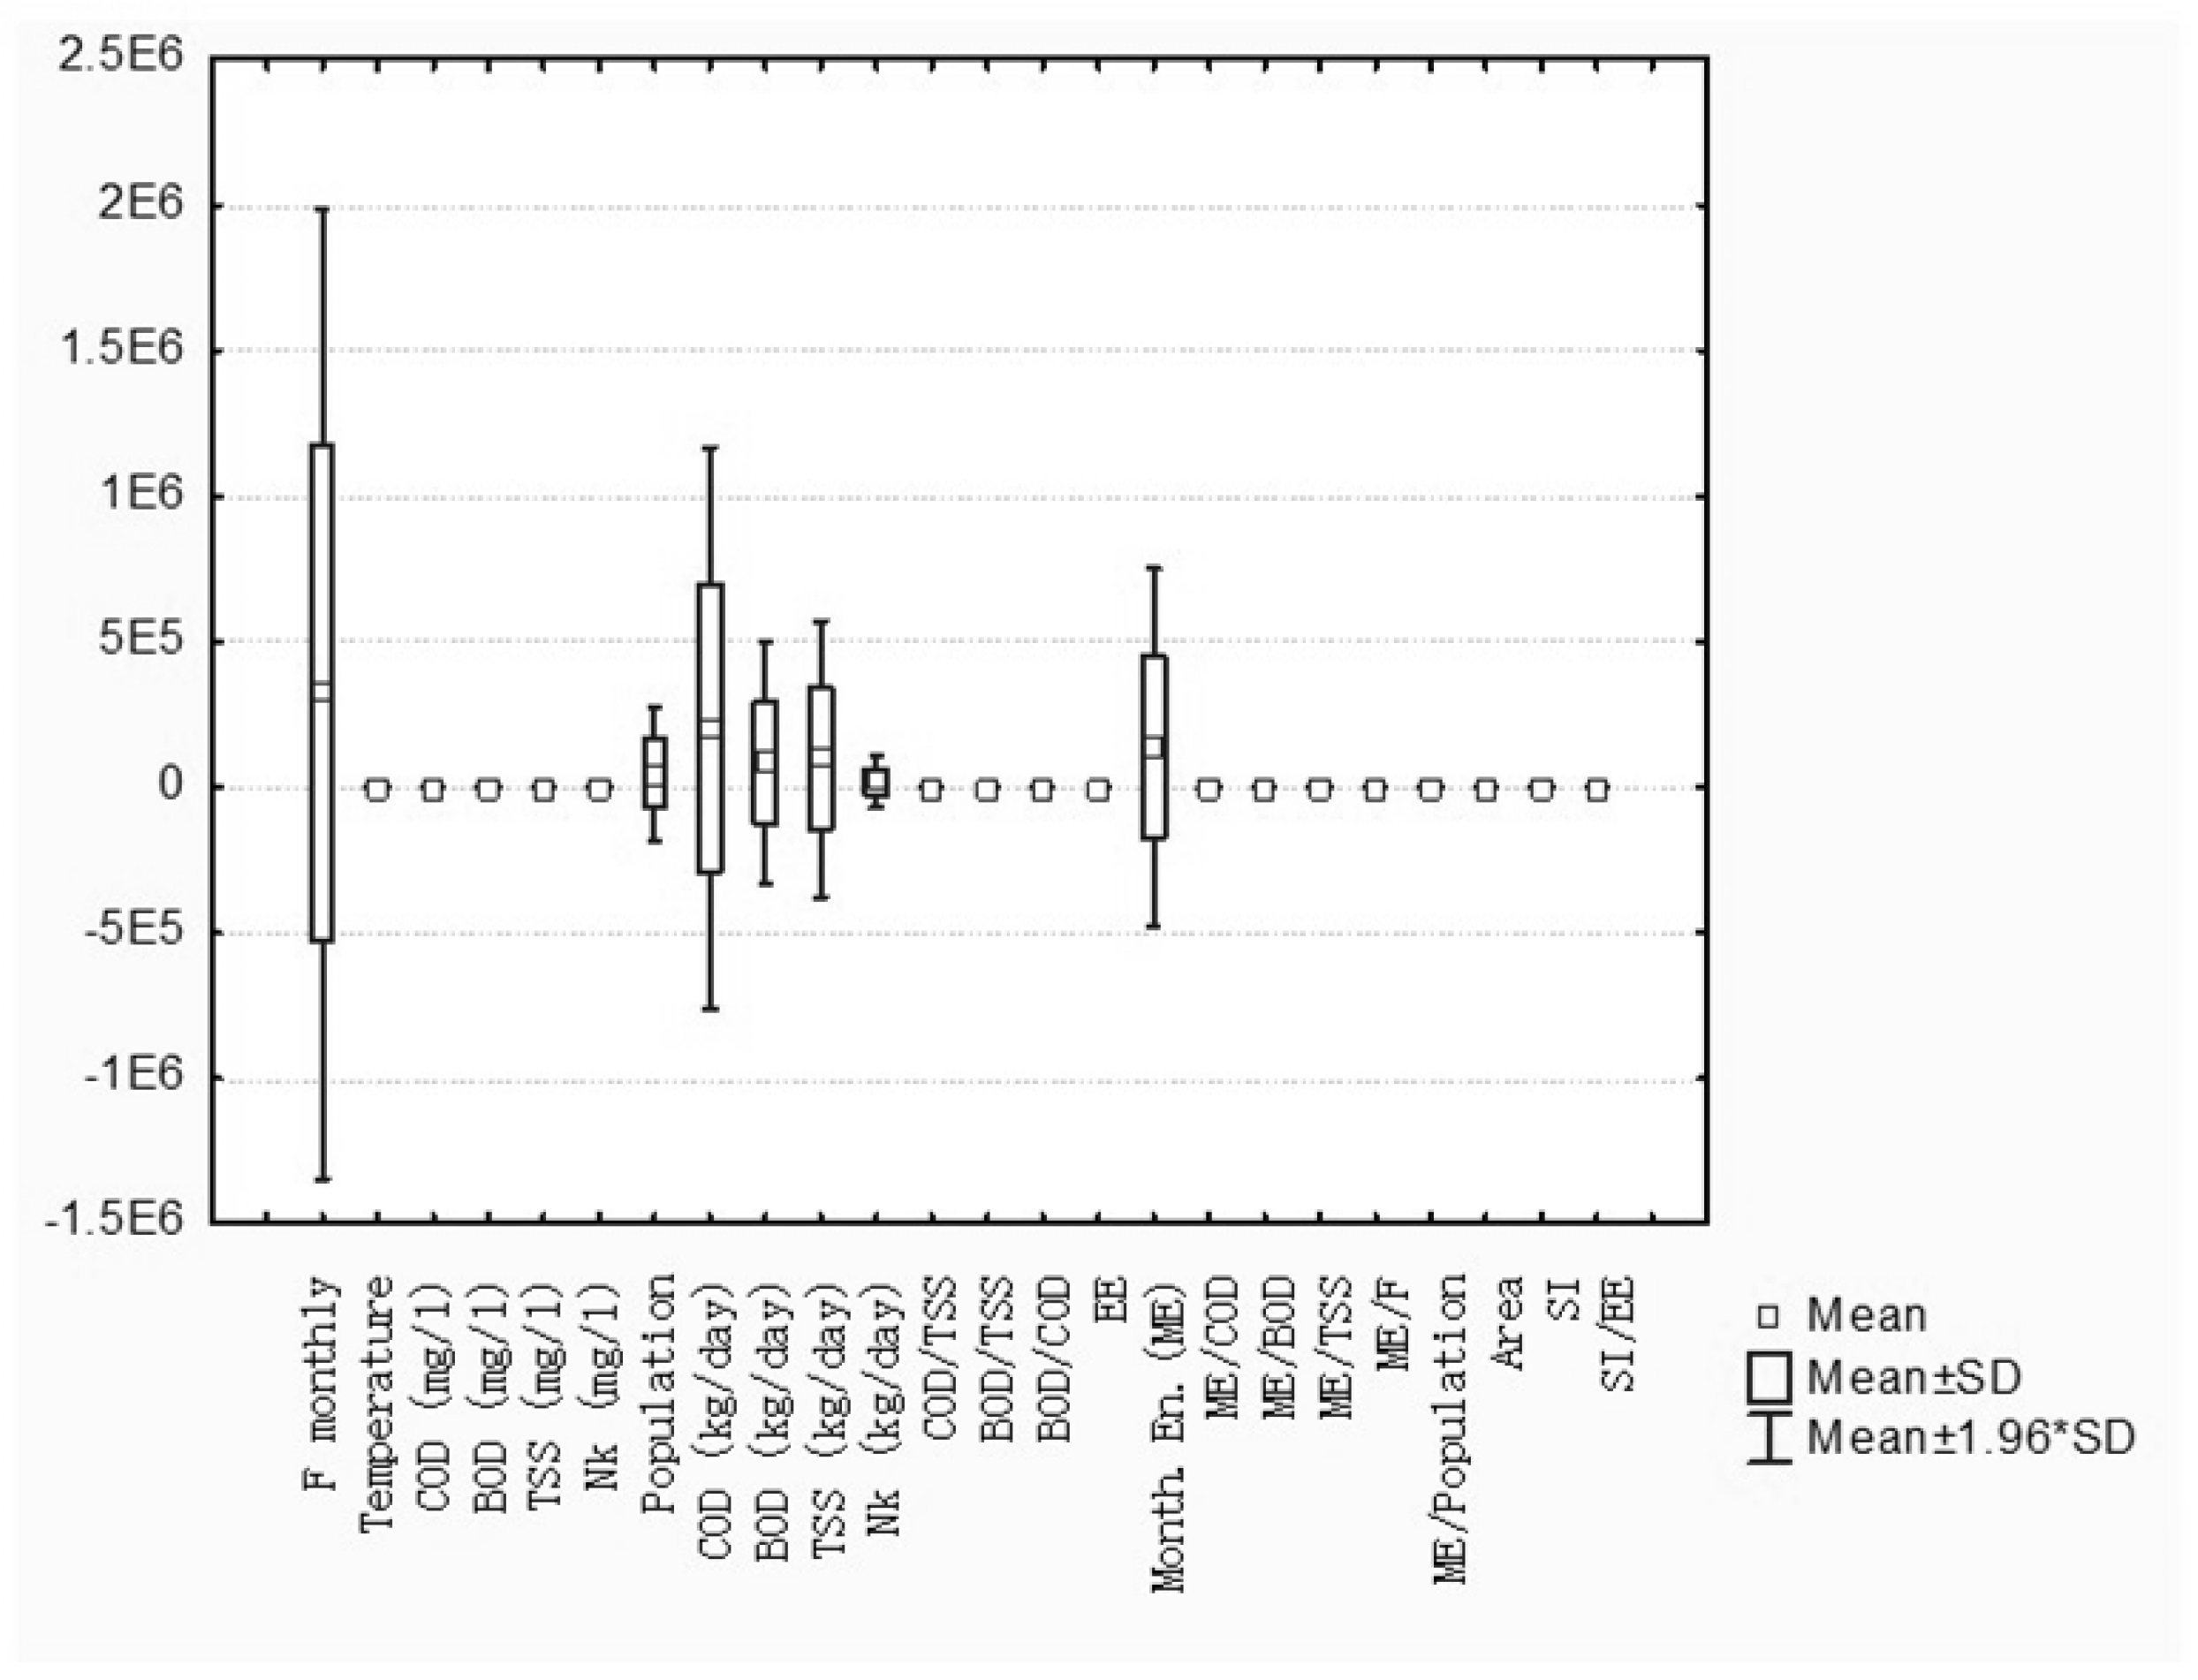
Figure 4.
PCA: Graphical representation of factorial ranking of factors dimension, organic load and energy intensity.
Figure 4.
PCA: Graphical representation of factorial ranking of factors dimension, organic load and energy intensity.
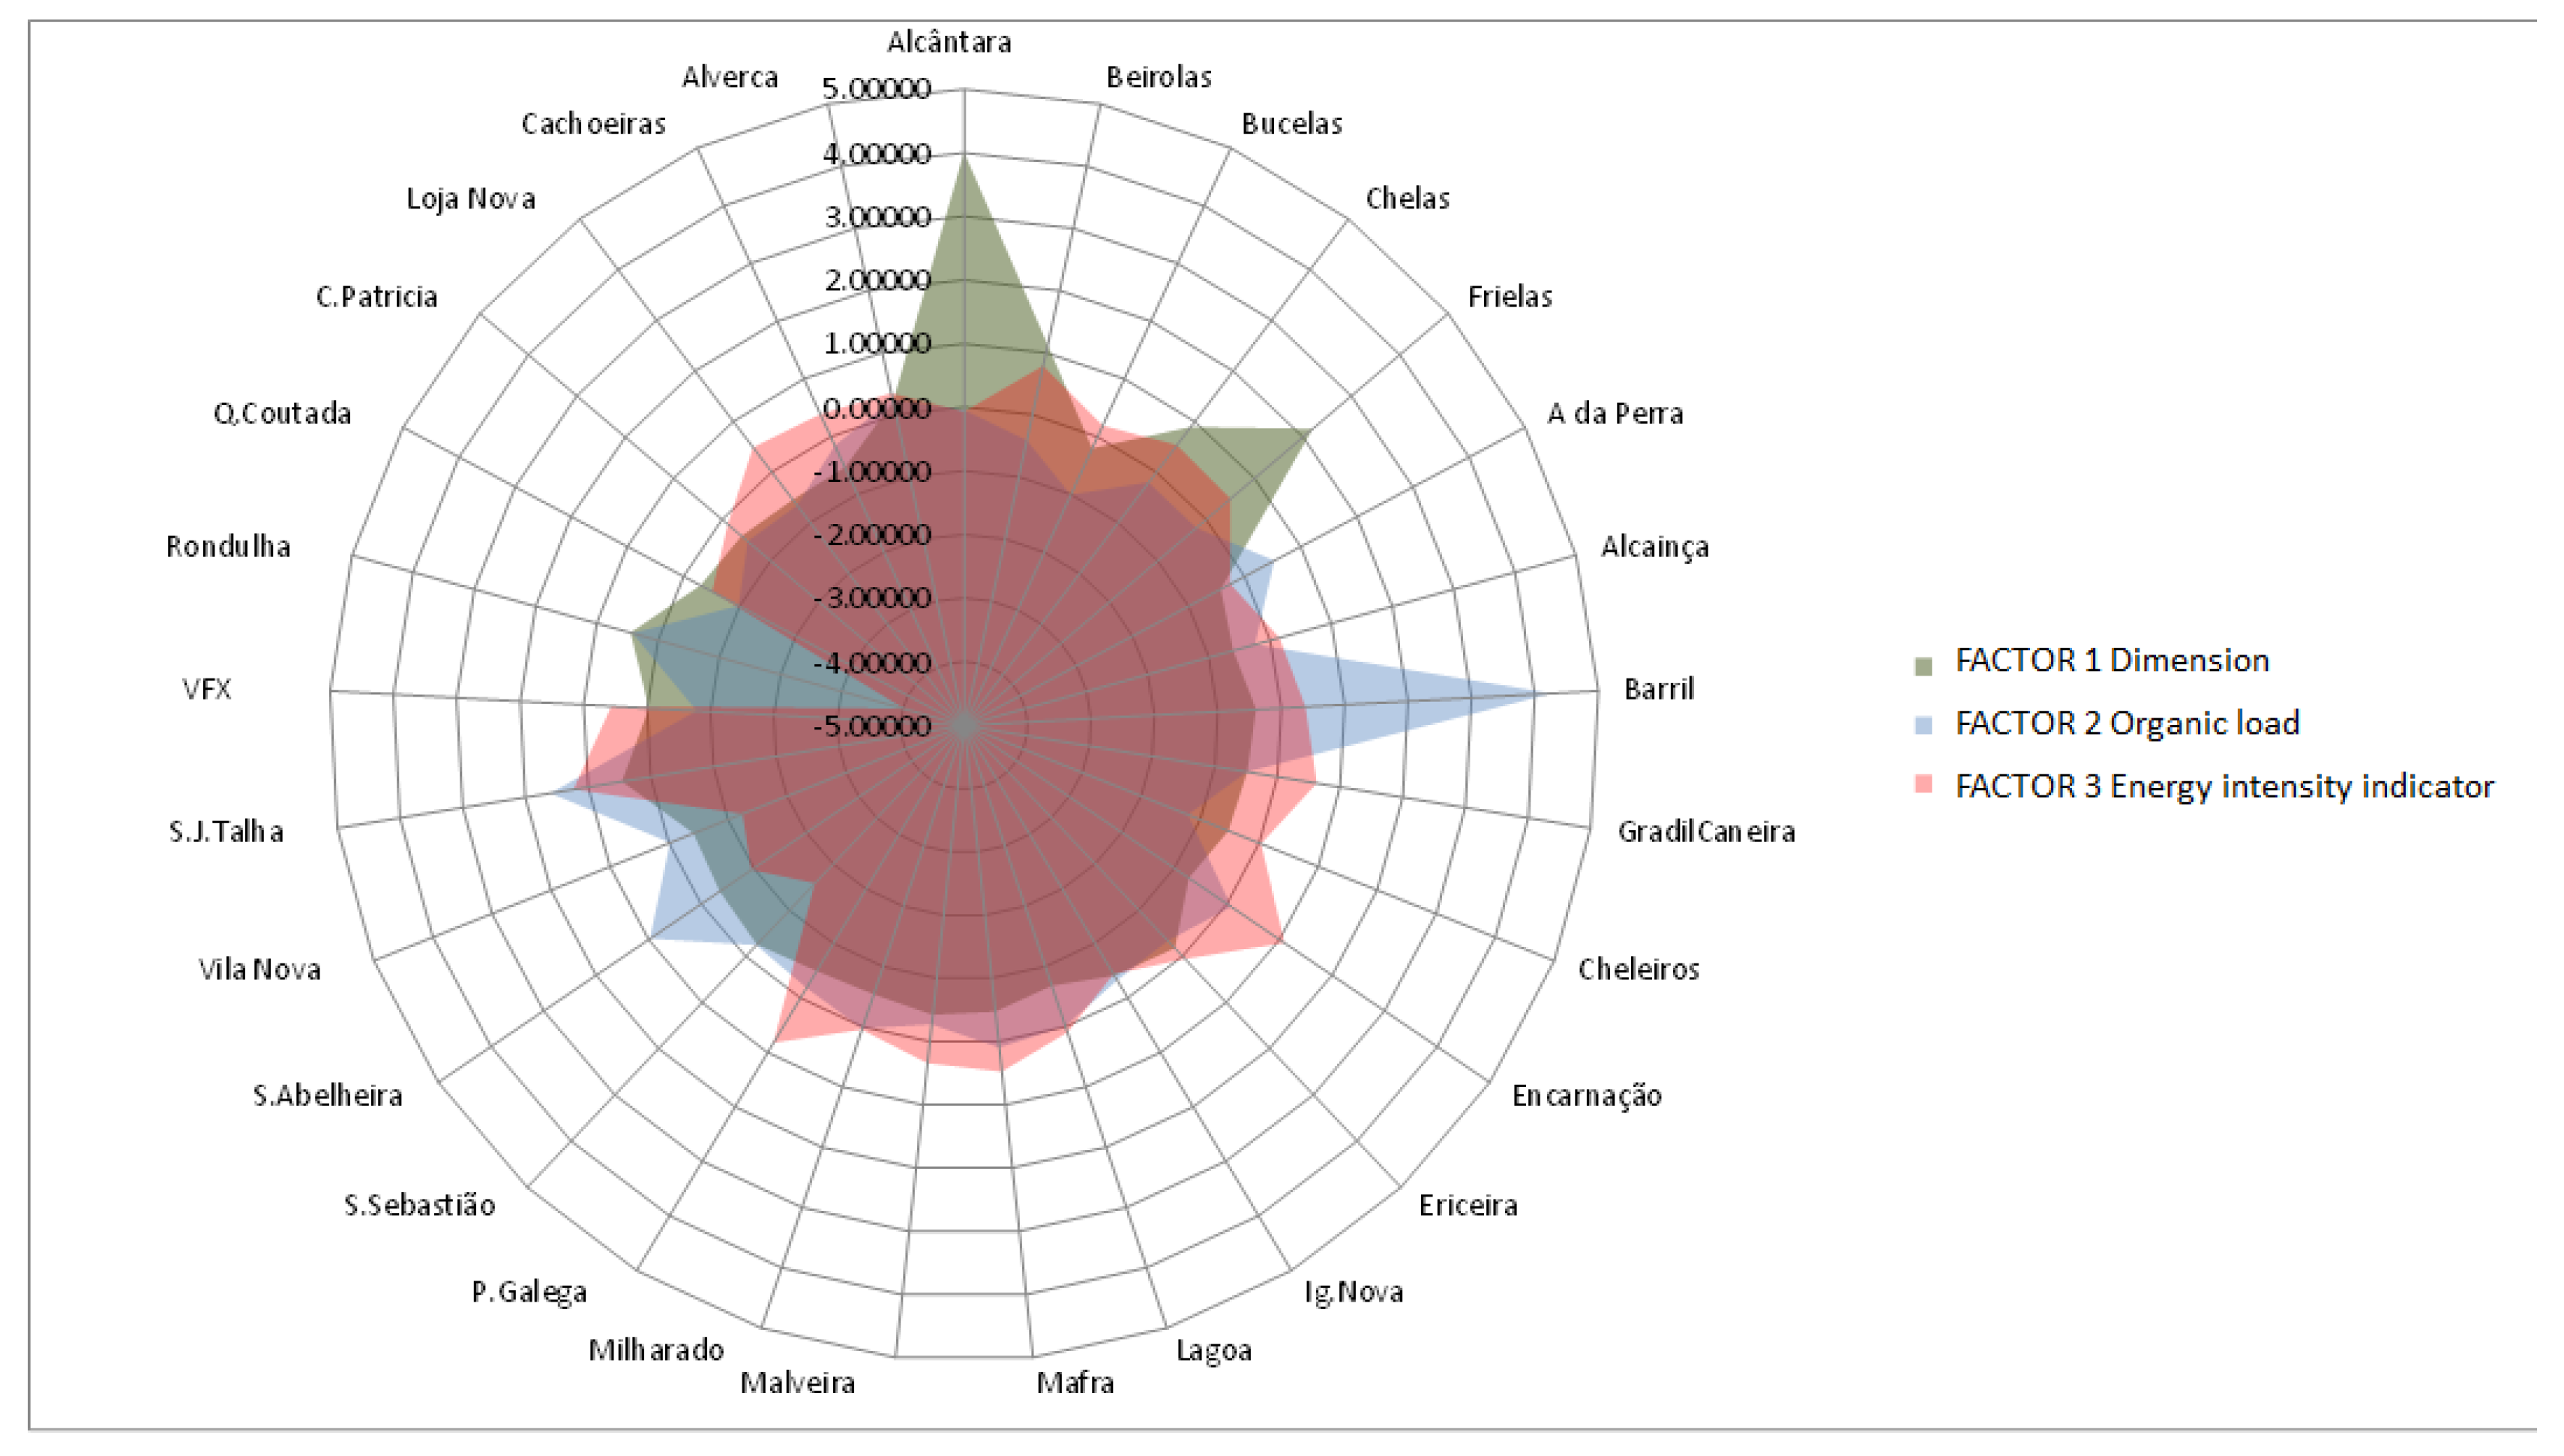
Figure 5.
PCA: principal component factorial ranking: energy intensity indicators.
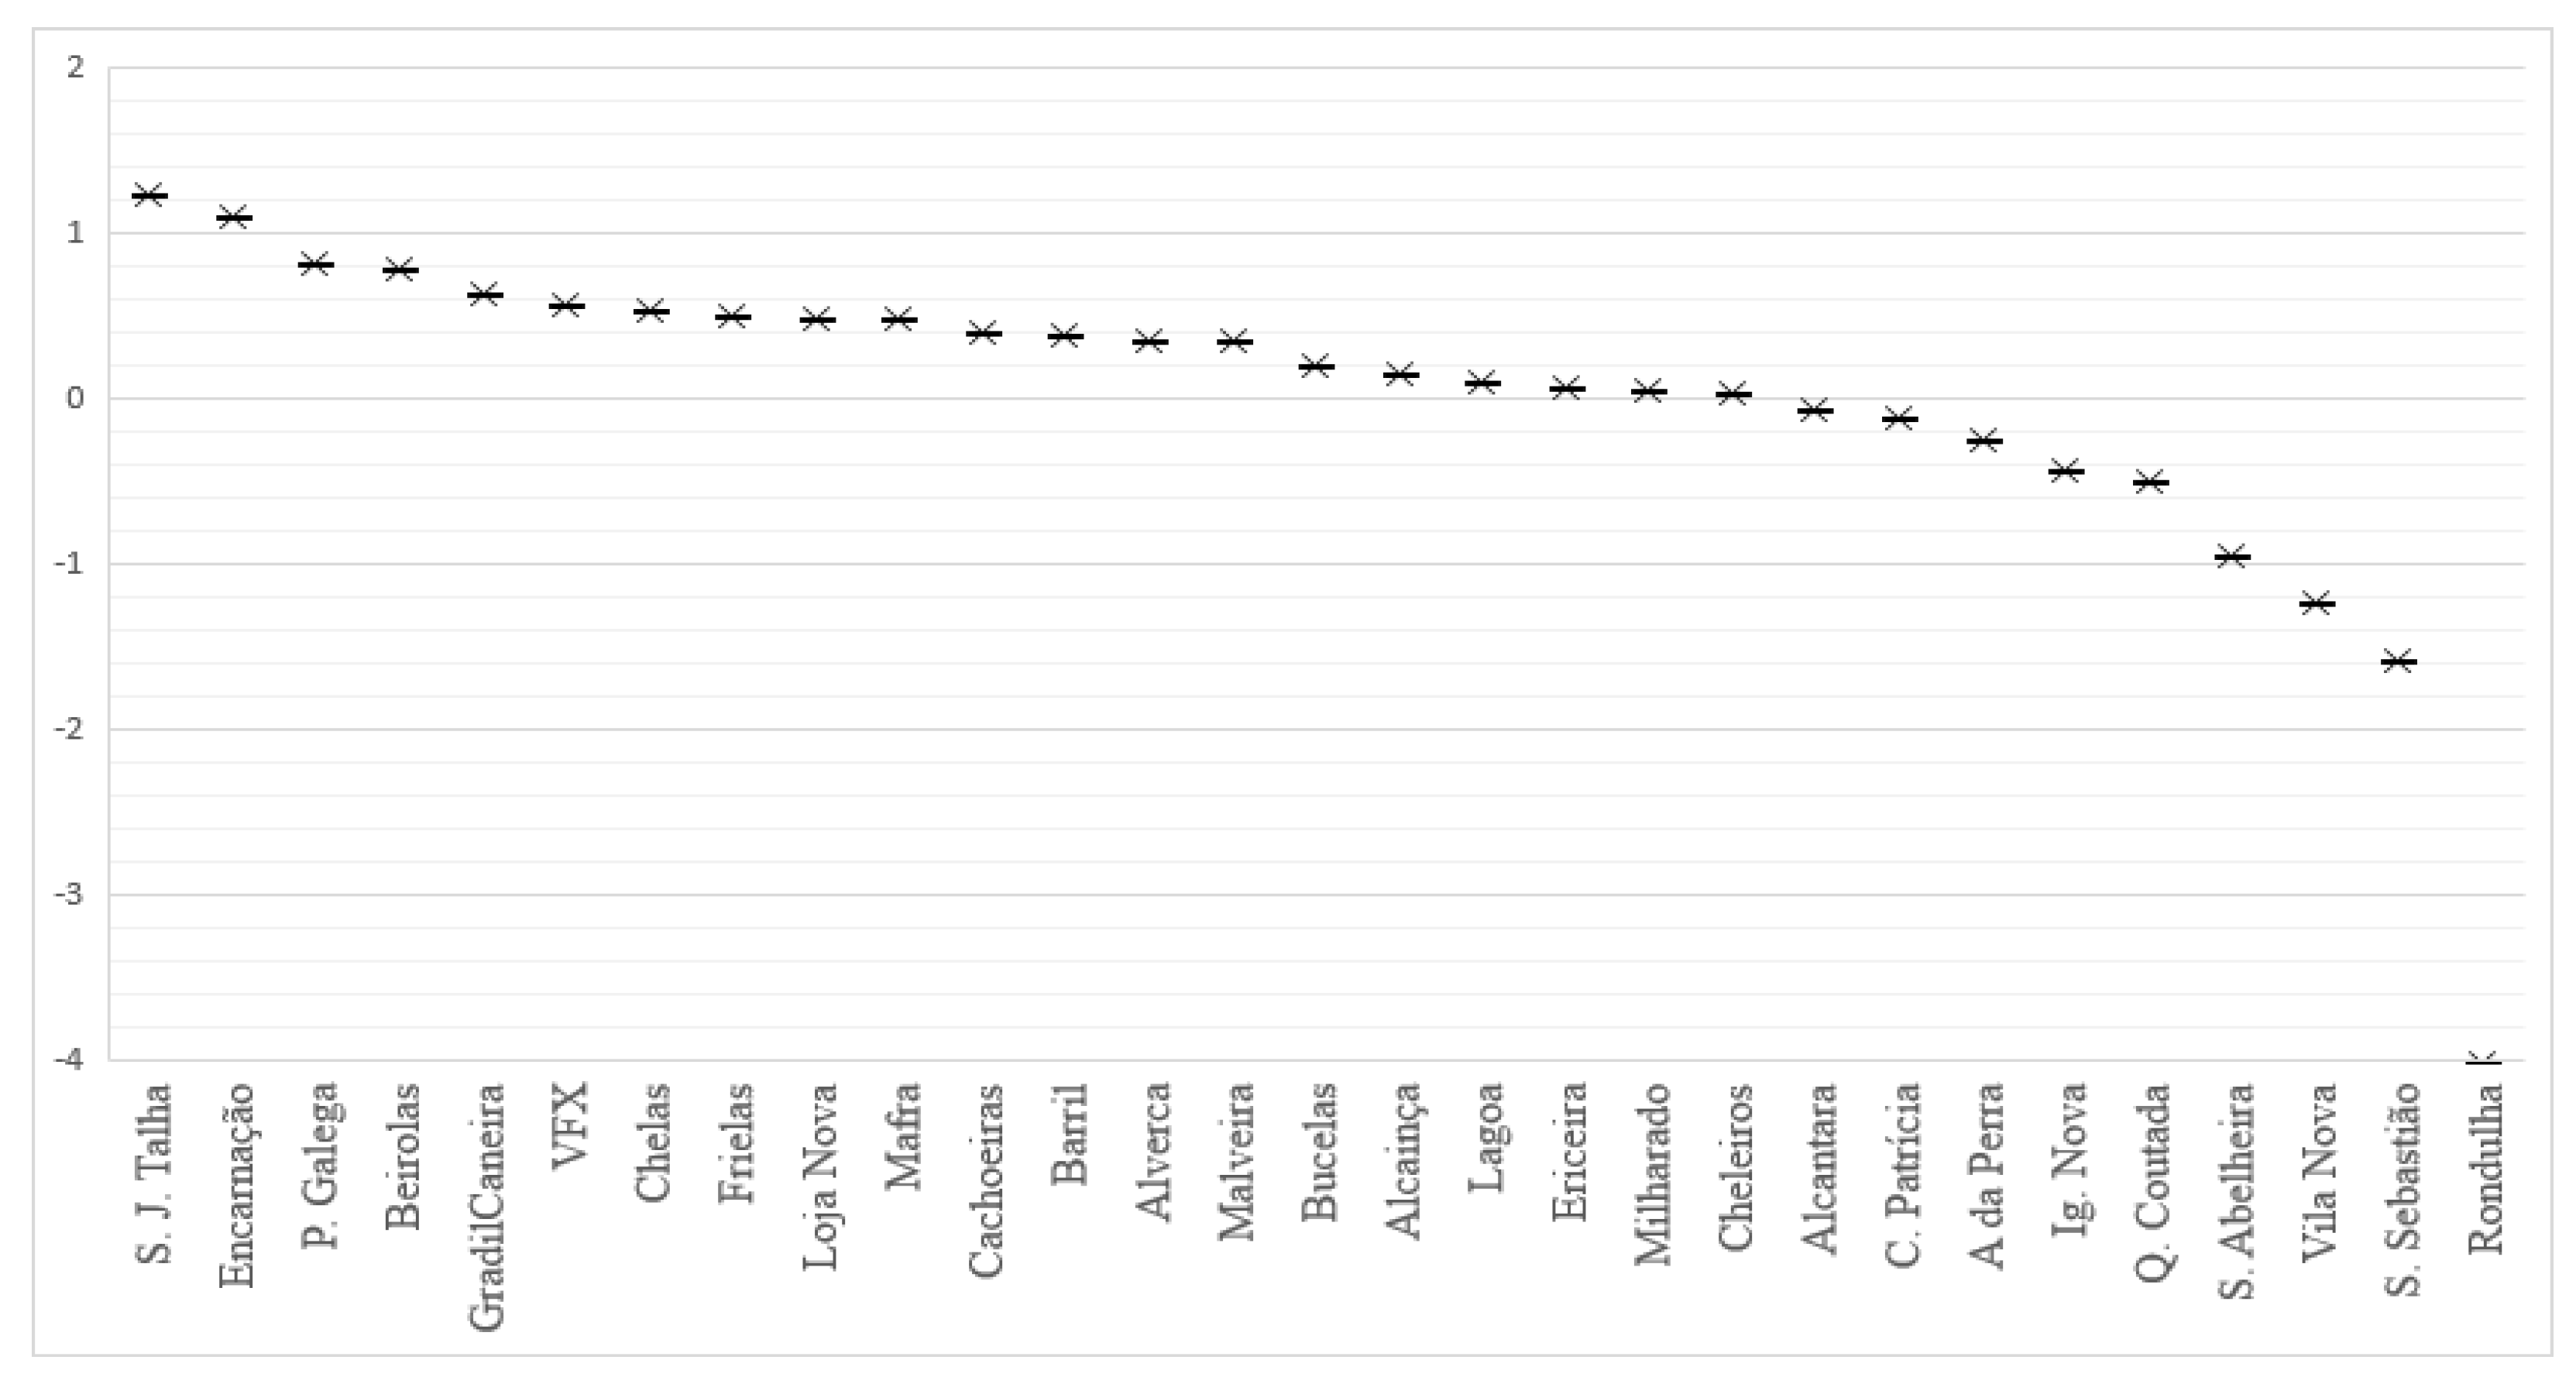
Figure 6.
Sustainable Value for the 29 WWTP.
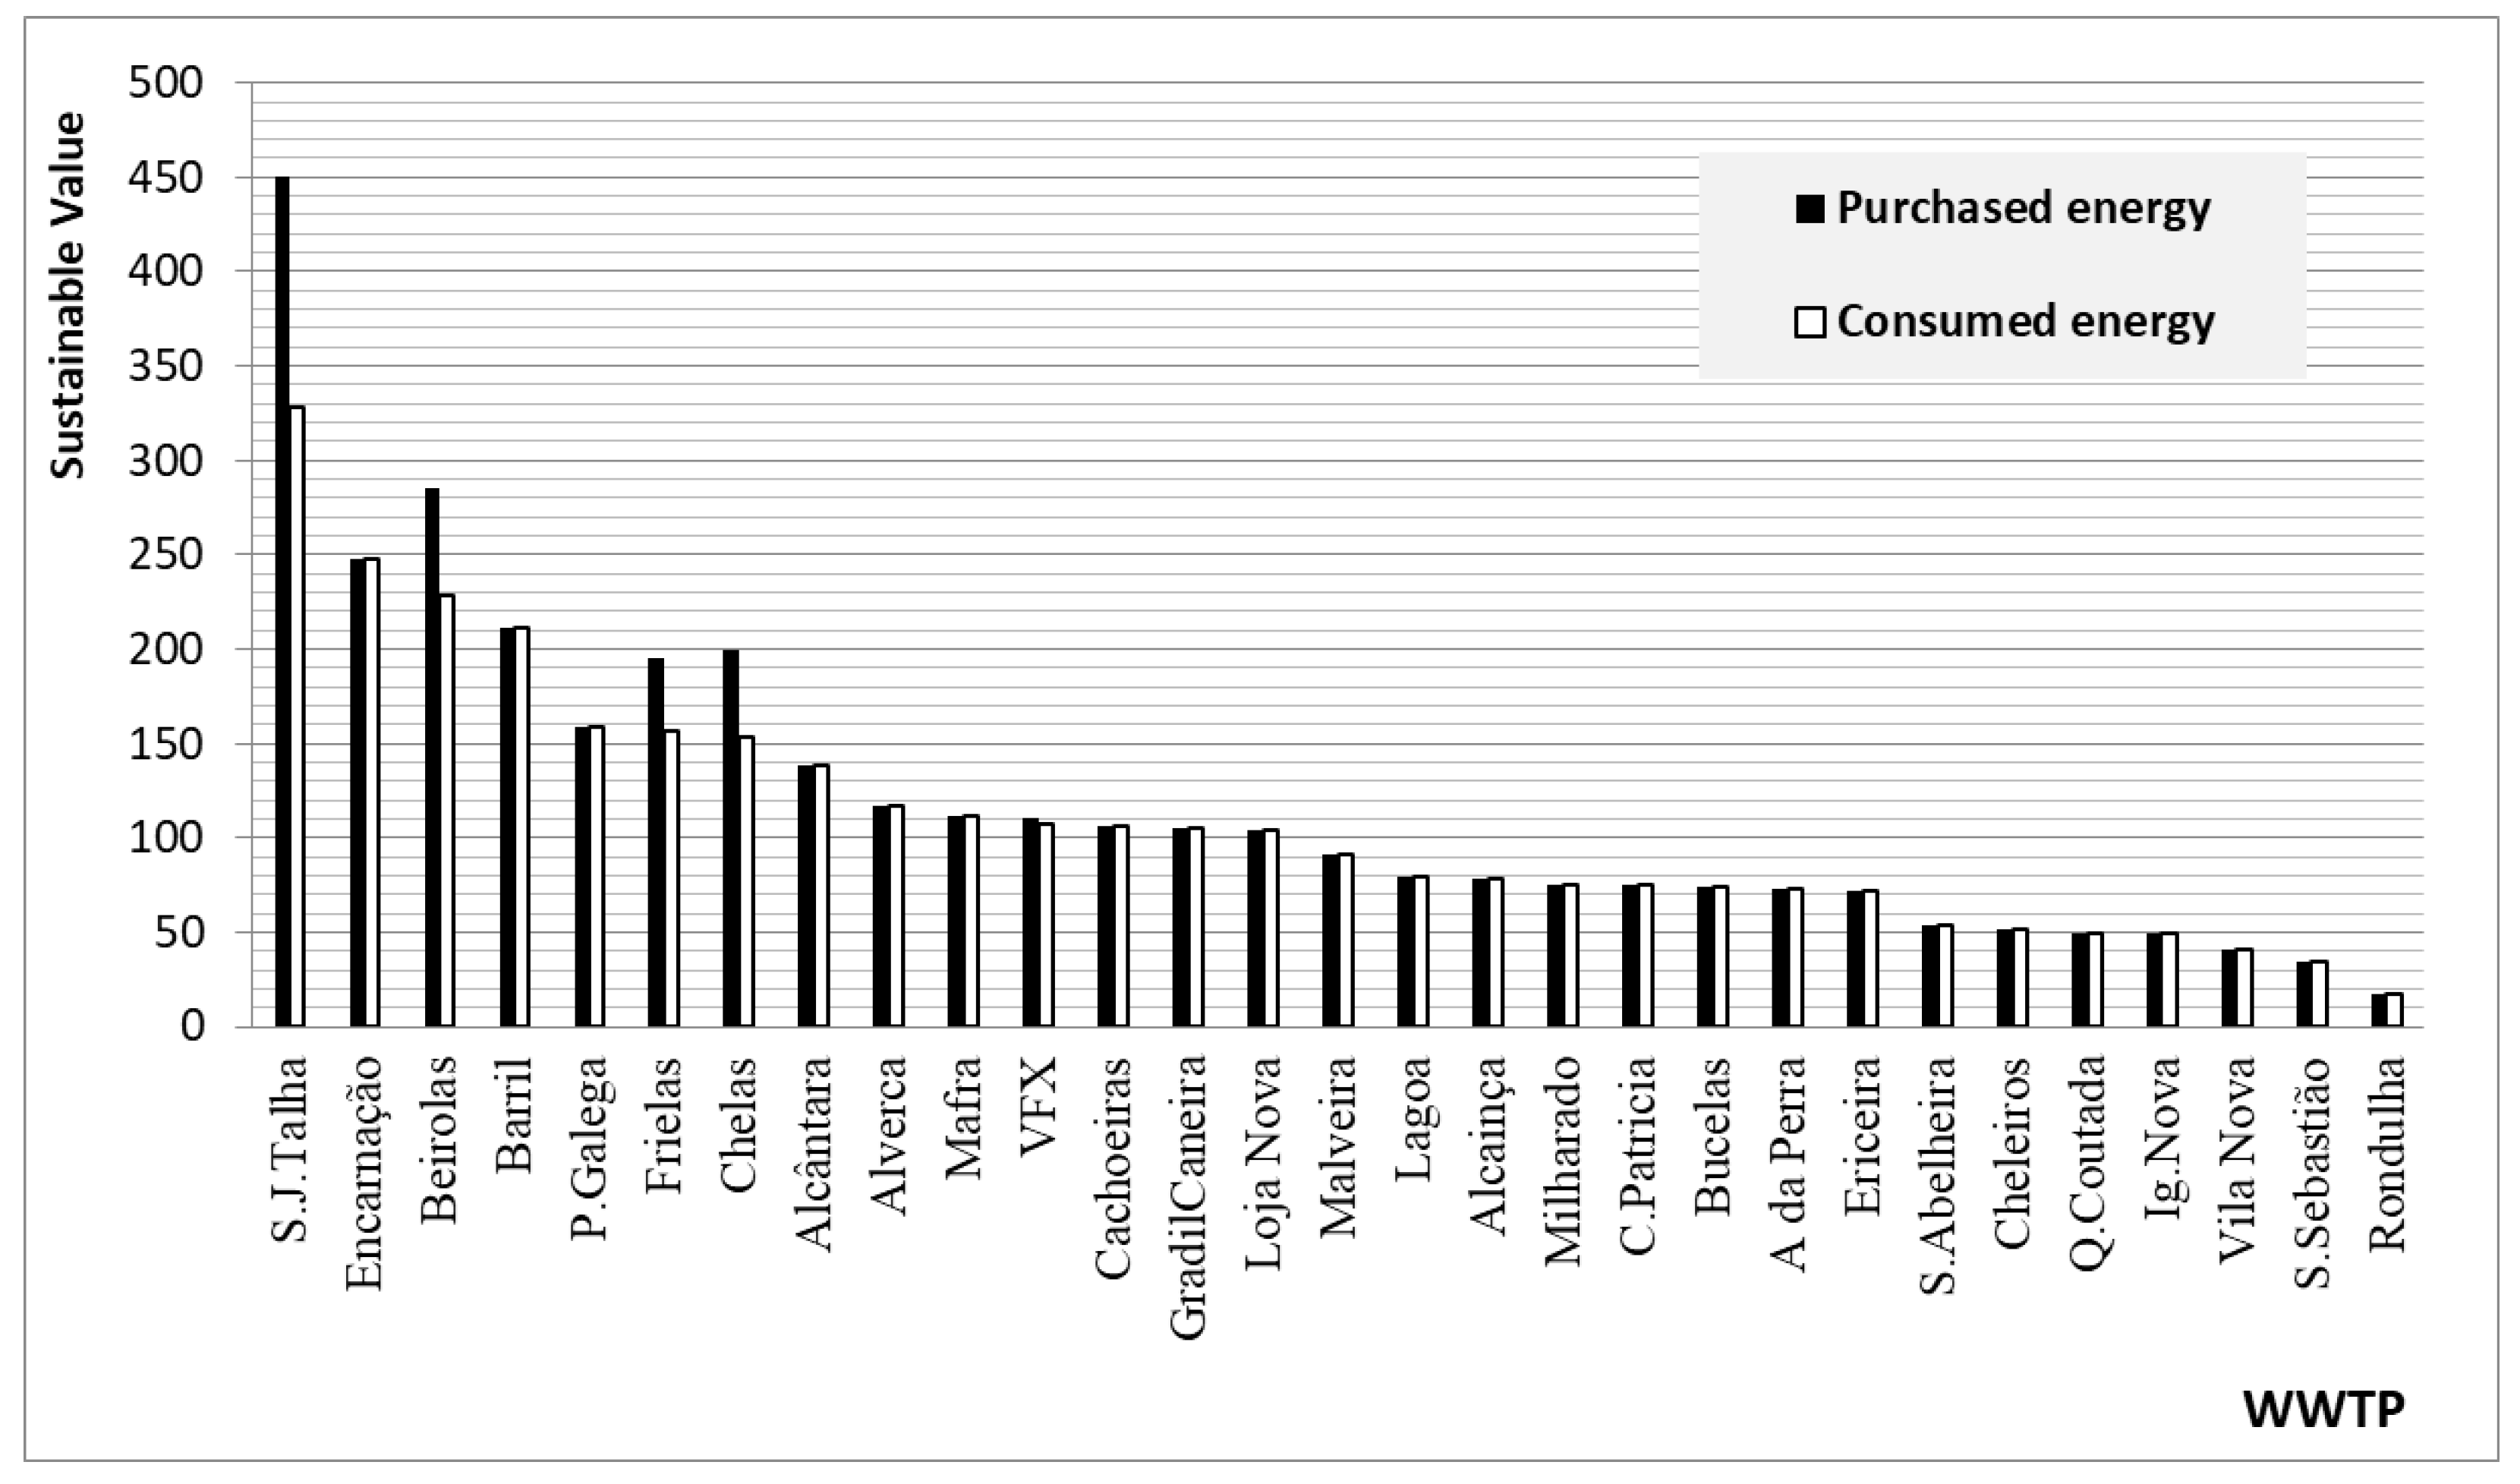

Table 1.
Wastewater treatment processes in the 29 WWTP.
| WWTP | Disinfection | Sludge Treatment | Deodorization |
|---|---|---|---|
| Alcântara | None | Centrifugation | CW4S1 + biofiltration |
| Beirolas | None | AD1 + centrifugation | None |
| Bucelas | UV1 | Belt filter | |
| Chelas | None | AD1 + centrifugation | CW2S1 |
| Frielas | UV1 | AD1 + centrifugation | CW2S1 |
| A da Perra | None | DB1 | None |
| Alcainça | None | DB1 | None |
| Barril | None | DB1 | None |
| Gradil Caneira | None | Centrifugation | None |
| Cheleiros | None | DB1 | None |
| Encarnação | None | DB1 | None |
| Ericeira | None | Centrifugation | None |
| Ig.Nova | None | DB1 | None |
| Lagoa | None | DB1 | None |
| Mafra | None | Belt filter | None |
| Malveira | None | Belt filter | None |
| Milharado | None | DB1 | None |
| P. Galega | None | Belt filter | None |
| S. Sebastião | None | DB1 | None |
| S. Abelheira | None | DB1 | None |
| Vila Nova | None | DB1 | None |
| S. J. Talha | None | AD + centrifugation | CW2S1 |
| VFX | None | AD + centrifugation | CW2S1 |
| Rondulha | None | DB1 | None |
| Q. Coutada | None | DB1 | None |
| C. Patricia | None | DB1 | None |
| Loja Nova | None | DB1 | None |
| Cachoeiras | None | DB1 | None |
| Alverca | None | Centrifugation | CW2S |
1 Anaerobic Digestion (AD); Chemicals washing 4 steps (CW4S); Chemicals washing 2 steps (CW2S); Ultraviolet (UV); Drying beds and drying bags (DB).
Table 2.
Functional Analysis – function relative importance, satisfaction value and value estimation.
Table 2.
Functional Analysis – function relative importance, satisfaction value and value estimation.
| Sustainability component | Function | Importance (φ) | Criteria | Satisfaction value (S) | Satisfaction value (S) -example- |
Performance (φS) -example- |
Resources (R) -example- |
Value (∑ φS/R) -example- |
|---|---|---|---|---|---|---|---|---|
|
Environmental criteria |
Remove BOD5 | 26% | Flowrate, F Removal efficiency, ɳBOD5 BOD5initial |
Flowrate (m3/month) x ɳ BOD5 (%) x BOD5 initial (g/l) |
F x ɳ BOD5 x BOD5initial= 918834 x 95,9 x 0,27 |
6185756 |
Energy 1102 MWh/year |
26,2 (*103) |
| Remove COD | 28% | Flowrate, F Removal efficiency, ɳCOD CODinitial |
Flowrate (m3/month) x ɳ COD (%) x COD initial (g/l) |
F xɳCOD x CODinitial= 918834 x 88,9 x 0,88 | 20127022 | |||
|
Social criteria |
Remove TSS | 24% | Flowrate, F Removal efficiency, ɳTSS TSSinitial |
Flowrate (m3/month) x ɳ TSS (%) x TSS initial (g/l) |
F x TSSinitial x ɳTSS= 918834 x 93,8 x 0,21 |
4343806 | ||
|
Social criteria |
Remove microbial load |
7% | Flowrate, F Type of disinfection |
Flowrate (m3/month) x satisfaction term |
F x 75 | 4823879 | ||
| Remove odors | 2% | Flowrate, F Type of deodorisation |
Flowrate (m3/month) x satisfaction term |
F x 0 | 0 | |||
| Economical criteria |
Treat sludge | 13% | Flowrate, F Type of sludge treatment |
Flowrate (m3/month) x satisfaction term |
F x 50 | 5972421 |
Disclaimer/Publisher’s Note: The statements, opinions and data contained in all publications are solely those of the individual author(s) and contributor(s) and not of MDPI and/or the editor(s). MDPI and/or the editor(s) disclaim responsibility for any injury to people or property resulting from any ideas, methods, instructions or products referred to in the content. |
© 2025 by the authors. Licensee MDPI, Basel, Switzerland. This article is an open access article distributed under the terms and conditions of the Creative Commons Attribution (CC BY) license (http://creativecommons.org/licenses/by/4.0/).
Copyright: This open access article is published under a Creative Commons CC BY 4.0 license, which permit the free download, distribution, and reuse, provided that the author and preprint are cited in any reuse.


