
Submitted:
23 July 2025
Posted:
25 July 2025
You are already at the latest version
Preprints on COVID-19 and SARS-CoV-2
Abstract
APOBEC3B (A3B) has been implicated in host-virus interactions, but its role in SARS-CoV-2 infection is unclear. Here, we demonstrate that A3B is overexpressed in bronchoalveolar lavage fluid (BALF) cells from severe COVID-19 patients compared to those with mild disease. A3B knockdown in Caco-2 cells significantly reduces SARS-CoV-2 infectivity, likely through attenuation of the PKR-mediated integrated stress response, a pathway proposed to promote SARS-CoV-2. Single-cell RNA sequencing (scRNA-seq) data suggest that BALF cells from severe COVID-19 patients exhibit a repressed state for cellular translation, potentially mediated by eIF2α phosphorylation. However, in A549-ACE2 cells SARS-CoV-2 does not activate PKR, but A3B knockdown still reduces SARS-CoV-2 infectivity, suggesting an alternative mechanism of action in different cellular contexts. To further investigate A3B’s role in severe COVID-19, we employed Geneformer, a transformer-based machine learning model, which predicted that A3B knockout would perturb AMPD2 (Adenosine Monophosphate Deaminase 2), a key enzyme in purine metabolism and immune regulation. We validated this prediction using bulk RNA-seq and clinical scRNA-seq data, confirming that AMPD2 expression is downregulated in severe COVID-19 but restored upon A3B knockdown. Together, these findings suggest that A3B plays a pro-viral role in SARS-CoV-2 infection by modulating translational control and immune regulatory networks, warranting further studies to elucidate the underlying mechanistic details.
Keywords:
APOBEC
; SARS-CoV-2
; APOBEC3B
; proviral
1. Introduction
Apolipoprotein B mRNA editing enzyme, catalytic polypeptide 3B (APOBEC3B) is a member of the 11-protein APOBEC family of cytidine deaminases. All APOBEC family members share a conserved cytidine deaminase domain [1], characterized by the conserved His-X-Glu-X23-28-Pro-Cys-X2-4-Cys consensus sequence [2,3], and are believed to have evolved through a series of duplication events and subsequent diversifications [1]. The seven member APOBEC3 sub-family is clustered in tandem on chromosome 22q13.1 [1], and consists of both single-domain (APOBEC3A, APOBEC3C, APOBEC3H) and double-domain (APOBEC3B, APOBEC3DE, APOBEC3F, APOBEC3G) proteins [4]. While the C-terminal deaminase domain (CTD or CD2) catalyzes cytidine deamination, the N-terminal deaminase domain (NTD or CD1), though catalytically inactive, enhances substrate binding and deamination efficiency [1,5,6].
The APOBEC3 sub-family gained prominence in the early 2000s when it was discovered that they can function as intrinsic antiviral factors against Human Immunodeficiency Virus infection [7]. Initially, this anti-HIV function was primarily thought to result from the catalytic cytosine-to-uracil mutations on HIV cDNA [8], but it was later determined that APOBEC3s have both deamination-dependent and deamination-independent mechanisms for restricting retro-viral infection [9]. Additionally, it soon became clear that, in addition to HIV, APOBEC3s played a role in restricting other retroviruses and para-retroviruses such as Human T Cell Lymphotropic Virus 1 [10,11], and Hepatitis B Virus [12,13]; single-stranded DNA viruses such as Parvovirus [14,15]; and double-stranded DNA viruses such as Human Papillomavirus [16,17]. Herpes viruses such as Epstein-Barr Virus (EBV) [18], Kaposi’s Sarcoma Herpes Virus [19], Cytomegalovirus [20,21], and Herpes Simplex virus [22] have all been shown to upregulate APOBEC expression. Moreover, several herpesviruses (such as EBV) use the viral-encoded ribonucleotide reductase (RNR) large subunit to bind to A3B active site, leading to the inactivation of A3B deaminase activity and the relocalization from the nucleus to the cytoplasm [23].
While APOBEC3s are known for their antiviral roles, APOBEC3-mediated mutation of viral DNA in polyomavirus and HIV is reported to provide evolutionary fuel for the viruses, allowing them to escape immune detection in vivo [24,25]. Recently, cell culture experiments have shown that APOBEC3A-mediated mutations of viral RNA promote Severe Acute Respiratory Syndrome Coronavirus-2 (SARS-CoV-2) infectivity and fitness [26]. However, no studies have yet described a deamination-independent, proviral role for APOBEC proteins.
Recently, a study showed that APOBEC3B (A3B) uses a deaminase-independent anti-viral mechanism to restrict Sendai virus (SeV) [27]. After SeV infection, A3B was shown to activate protein kinase R that phosphorylates eIF2⍺ to repress protein translation [28]. By doing so, A3B promotes a cellular anti-viral pathway that down-regulates total protein synthesis to reduce the expression of viral proteins [29]. Interestingly, previous studies have shown that several viruses, including SARS-CoV-2 [30,31,32], Zika and Dengue viruses [33], are able to take advantage of non-canonical translation initiation pathways, allowing these viruses to avoid translation repression caused by PKR-induced eIF2⍺ phosphorylation.
In addition to PKR-mediated translational repression, SARS-CoV-2 has been shown to hijack host nucleotide biosynthesis and inflammatory response pathways to promote viral infectivity [34]. Qin et al. [34] showed that SARS-CoV-2 NSP9 promotes de novo purine synthesis, building upon a previous finding that SARS-CoV-2 infection dysregulates purine metabolism and is significantly associated with cytokine release in COVID-19 patients [35]. More specifically, they found that COVID-19 patients had significantly increased serum AMP levels and that these were positively correlated with Cytokine Release Syndrome (CRS)-related cytokines IL-10 and IL-18, which displayed progressive increases from healthy controls to mild and severe patients [35]. From these studies, it appears that SARS-CoV-2 hijacks host metabolism to increase flux through the purine de-novo biosynthesis pathway while altering purinergic signaling to increase pro-inflammatory cytokine release.
Geneformer [36,37] is a context-aware, attention-based deep learning model, representing a state-of-the-art tool in the burgeoning field of context-specific network biology. Leveraging a massive pre-training database of over 95 million single-cell RNA-sequencing (scRNA-Seq) transcriptomes across diverse cellular and pathological contexts [37], Geneformer predicts gene network dynamics under previously unseen conditions. The model can either be fine-tuned on new datasets for specialized predictive tasks or used “out of the box” for multiple analyses. One of its most powerful features is its in-silico perturbation analysis, in which a gene’s expression can be up- or down-regulated (in silico) within a specific experimental or clinical context. Using its pretraining knowledge, Geneformer predicts transcriptome-wide changes in gene embeddings, where larger shifts in cosine similarity indicate stronger regulatory effects. This function was previously used to predict genes whose perturbation could shift diseased cardiomyocytes toward a healthy state [36]. Subsequent CRISPR-mediated knockouts validated these predictions, demonstrating restoration of cardiomyocyte contractility and disease phenotype rescue [36].
In this study, we present the first evidence of a proviral role for endogenous A3B, demonstrating that it enhances SARS-CoV-2 infectivity in two different cell lines, proposing two distinct mechanisms for the proviral activity of A3B. Specifically, we show that 1) SARS-CoV-2 infection activates the PKR/eIF2⍺ pathway in Caco-2 cells, and this activation of PKR/eIF2⍺ pathway is A3B dependent, resulting in promoting viral replication. 2) Using Geneformer, we predict a potential mechanism in which A3B knockdown triggers a compensatory upregulation of Adenosine Monophosphate Deaminase 2 (AMPD2), thereby possibly altering purinergic inflammatory signaling and purine nucleotide biosynthesis, reducing SARS-CoV-2 infectivity. These findings provide a potential paradigm shift in our understanding of A3B’s role in viral pathogenesis and suggest potential new therapeutic strategies targeting A3B-related translational, inflammatory, and metabolic pathways.
2. Results
2.1. A3B Is Overexpressed in Broncho-Alveolar Lavage Fluid from Patients with Severe SARS-CoV-2 Infection
To investigate differential expression of host restriction factors in SARS-CoV-2-infected patients [38], we analyzed single-cell RNA Sequencing (scRNA-Seq) gene expression data from broncho-alveolar lavage fluid (BALF) of individuals with mild and severe COVID-19 (GSE145926) (https://doi.org/10.1038/s41591-020-0901-9) [38]. As expected, we observed a significant increase in A3A expression in patients with severe disease compared to mild (fold change = 1.74, FDR<0.01; Figure 1a), corroborating previous findings that A3A may enhance SARS-CoV-2 infectivity [26]. Surprisingly, we observed the strongest increase in expression of A3B (fold change = 4.93, FDR<0.01; Figure 1A) in this analysis.
To determine whether elevated A3B expression in severe cases was driven by increased infiltration of immune cells, which are likely enriched in severe relative to mild patients, we subsetted airway epithelial cells using the known epithelial airway markers KRT18, KRT5, and TPPP3 [38] (Figure 1B, Supplementary Figure S1). Notably, differential expression analysis of A3B within this epithelial subset revealed an even greater upregulation in severe disease (fold change = 7.88, FDR<0.01; Figure 1C-D). Furthermore, A3B was expressed in a higher percentage of total cells and airway epithelial cells in severe cases compared to mild cases (Supplementary Figure S2), which implies a potential role of A3B in COVID-19 pathogenesis.
2.2. A3B Knockdown Significantly Reduces SARS-CoV-2 Infectivity in Caco-2 Cells
To investigate the causal relationship between A3B expression and SARS-CoV-2 infectivity, we conducted a series of cell culture experiments using the SARS-CoV-2 USA-WA1/2020 strain and siRNA-mediated knockdown of endogenous A3B. We selected Caco-2 cells, a well-established model for SARS-CoV-2 infection [26,39,40], as our initial in vitro system.
Cells were transfected with either siRNAs targeting A3B (siA3B) or non-targeting control siRNA (siCNT), followed by infection with 8000 pfu (MOI= 0.1). At 2-, 3-, and 4-days post-infection, we collected media supernatant and intracellular RNA for viral quantification. RT-qPCR analysis revealed a significant reduction in intracellular SARS-CoV-2 RNA following siA3B treatment (Figure 2A), while plaque assays revealed a decrease in secreted infectious virions in the supernatant at all three timepoints (Figure 2B), suggesting that A3B is required for SARS-CoV-2 replication in infected cells.
2.3. A3B Knockdown Reduces SARS-CoV-2 Infectivity in Caco-2 via Attenuation of PKR/eIF2⍺ Pathway
A recent study demonstrated that A3B promotes activation of the PKR/eIF2⍺ stress response pathway to dsRNA as a mechanism to restrict single-stranded RNA virus know to activate PKR such as SeV, poliovirus (PV), or sindbis (SINV) infection [27]. To determine whether this pathway is involved in SARS-CoV-2 infection, we performed western blot analysis 2- and 3-days post-infection in Caco-2 cells (Figure 2C). We found that SARS-CoV-2 infection increased phosphorylation (activation) of both PKR and eIF2⍺, indicating pathway activation. However, this activation was completely abolished upon A3B knockdown, suggesting that A3B is required for PKR-eIF2⍺ activation during infection. The activation of the PKR pathway was associated with an increase in intracellular SARS-CoV-2 nucleocapsid protein (Figure 2C). This effect persisted under higher viral load conditions (MOI=1) and a shorter infection time-course (16-36 hours post-infection) (Figure 2D). Confirming our qPCR and plaque assay data, A3B knockdown showed a decrease in SARS-CoV-2 protein expression (Figure 2C-E).
Although PKR and eIF2⍺ are traditionally considered part of the host antiviral defense response, [41] our observation suggests a proviral role for this pathway in SARS-CoV-2 infection. This aligns with recent work [30] showing that loss of eIF2A reduces SARS-CoV-2 replication, likely in part due to eIF2A’s essential role in supporting programmed -1 ribosomal frameshifting, which regulates the translation of SARS-CoV-2’s polycistronic RNAs. This recent study indicated that SARS-CoV-2 relied on non-canonical translation initiation pathways, relying on eIF2A, thus escaping the translation repression by eIF2⍺ phosphorylation that downregulates the host protein translation.
To determine whether PKR knockdown alone was sufficient to explain the reduction in SARS-CoV-2 observed with A3B knockdown, we performed PKR knockdown in Caco-2 cells, followed by western blot analysis (Figure 2E) and plaque assay (Figure 2F) at 3 days post-infection. PKR knockdown led to a decreased intracellular viral nucleocapsid protein and reduced secretion of infectious virions.
2.4. Severe COVID-19 Patient BALF Cells Show Signs of p-PKR/p-eIF2⍺ Pathway Activation
It is challenging to demonstrate PKR/eIF2⍺ activation in RNA-sequencing data, as both proteins are regulated post-translationally through phosphorylation. Previous studies have indicated that activation of PKR/eIF2α does not increase their mRNA levels, despite increased levels of phosphorylated protein [30]. However, we used gene expression data of known markers indicative of eIF2⍺ phosphorylation (eIF2B, GADD34, and ATF4) [28] as surrogate measures for assessing increases in p-eIF2⍺ in vivo. In severe COVID-19 patient BALF, we observed severe downregulation of all eIF2B isoforms (eIF2B1-5; Figure 3A) and an upregulation of GADD34 and ATF4 in relative to mild COVID-19, all indicative of increases in p-eIF2⍺, suggesting that severe COVID-19 patient BALF cells are likely in a translationally repressed state, driven by eIF2⍺ phosphorylation.
2.5. A3B Knockdown Reduces SARS-CoV-2 Infectivity in A549-ACE2 Independently of PKR Activation
To determine whether this novel A3B-mediated pro-viral mechanism for CoV-2 infection was present in a second cell line, we infected A549-ACE2 and performed RT-qPCR to measure intracellular N gene at 3 days post-infection (MOI=0.1 in Figure 4A, MOI=1 in Supplementary Figure S3). As expected from previous observation in Caco-2 cells, we observed a roughly 65-fold decrease in viral N gene with siA3B treatment at MOI=0.1. The reduction of N gene was roughly 7-fold at MOI=1, possibly indicating that much higher initial viral concentration might overcome the restrictive effect of A3B knockdown. To determine if activation of PKR/eIF2⍺ was also driving this effect, we performed a western blot analysis at 2- and 3-days post-infection. Interestingly, SARS-CoV-2 infection did not increase the levels of p-PKR with or without A3B knockdown (Figure 4B). However, A3B knockdown still resulted in a clear reduction in the viral nucleocapsid protein levels at 72 hours (3 days) post-infection. Consistent with this observation is that PKR knockdown had no detectable effect on viral nucleocapsid protein levels (Figure 4C). These findings were further supported by immunofluorescence quantification, where A3B knockdown significantly reduced nucleocapsid intensity, but PKR knockdown did not (Figure 4D). Together, these results suggest that unlike in Caco-2 cells, the decrease in SARS-CoV-2 infectivity upon A3B knockdown in A549 ACE2 cells is independent of p-PKR/p-eIF2⍺ pathway, indicating an alternative proviral mechanism distinct from that observed in Caco-2 cells.
2.6. Geneformer Predicts A3B Knockout Dysregulates AMPD2 in the Context of Severe SARS-CoV-2 Infection
Since A3B knockdown reduced SARS-CoV-2 infectivity in A549-ACE2 cells independently of its role in promoting the PKR/eIF2⍺ pathway, we sought to identify alternative mechanisms underlying this effect. To do so, we used Geneformer [36] to predict whether A3B knockdown alters gene network dynamics in the context of severe COVID-19, where A3B expression is high.
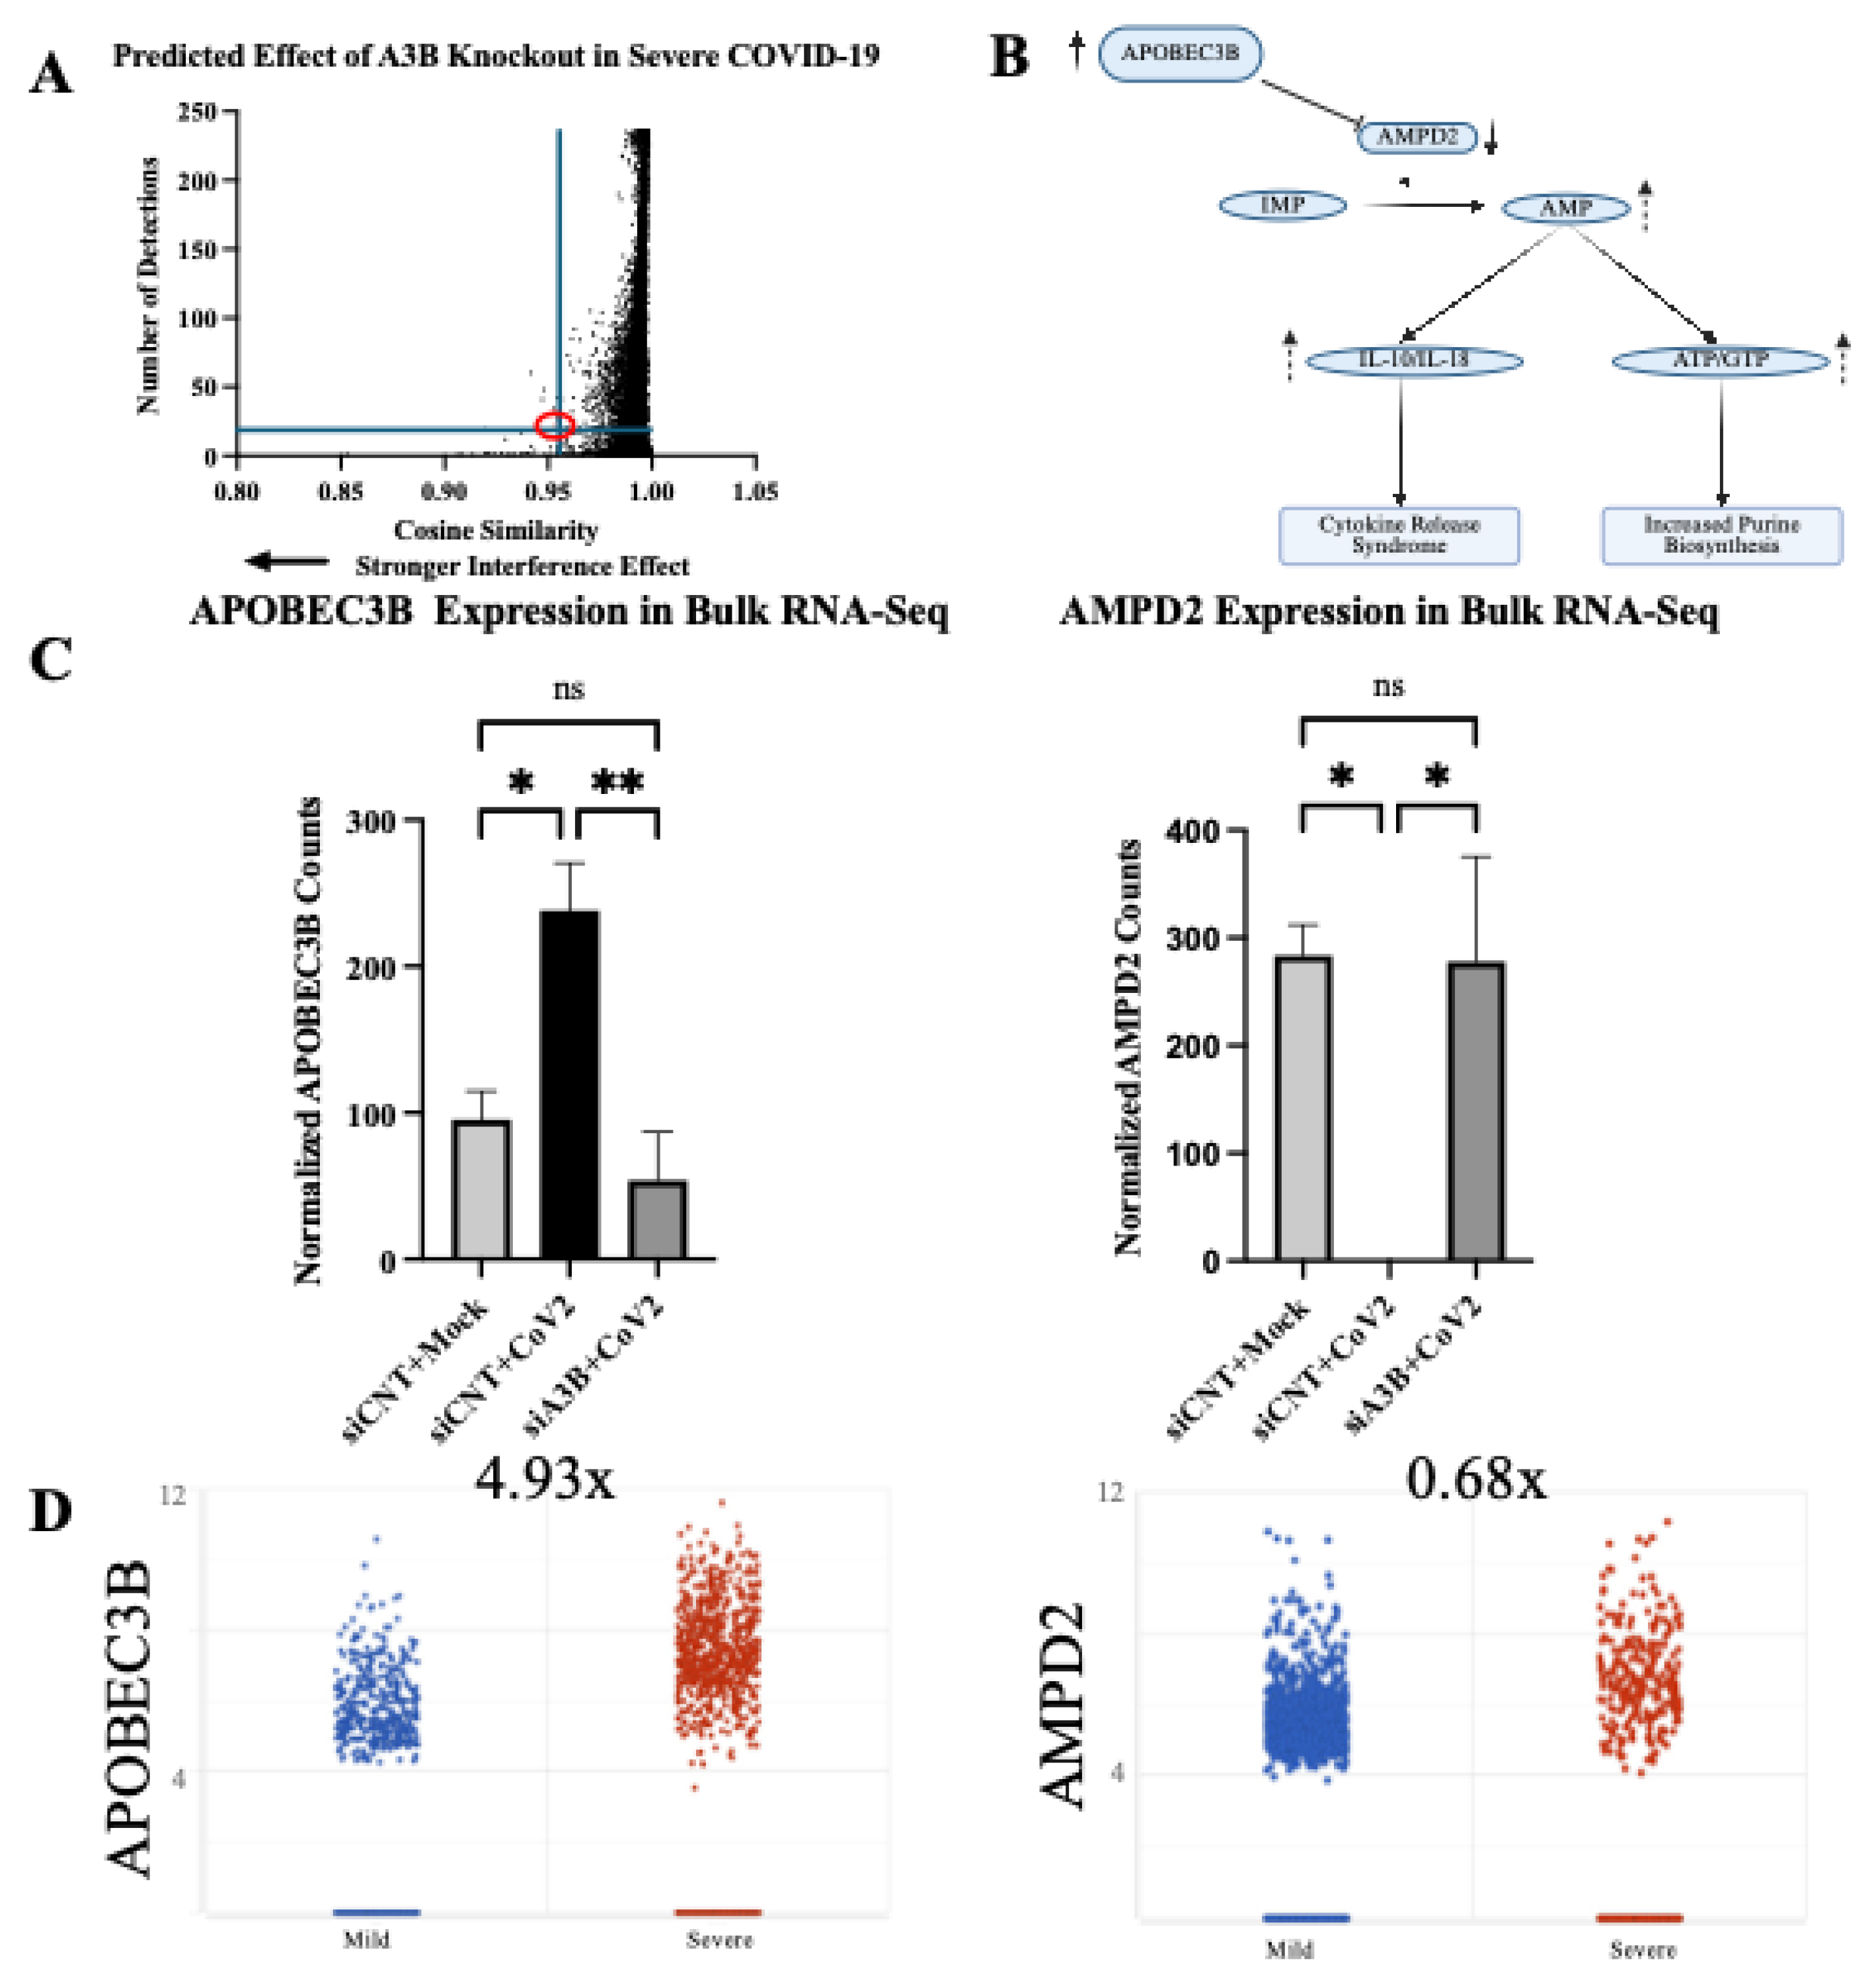
We obtained the raw single-cell gene expression counts from airway epithelial cells of six severe COVID-19 patients (GSE145926). [38] These counts were tokenized using Geneformer’s Transcriptome Tokenizer (tokenize.data function) and subsequently used as input in Geneformer’s in-silico perturbation analysis. A3B (ENSG00000179750) expression was knocked out computationally using Geneformer’s InSilicoPerturber function and gene embedding shifts were analyzed. A total of 14498 gene embedding shifts were produced. Bulk RNA Sequencing was performed on A549-ACE2 to validate the Geneformer prediction. Interestingly, Adenosine Monophosphate Deaminase-2 (AMPD2), an enzyme that catalyzes the conversion of adenosine monophosphate to inosine monophosphate, exhibited the 5th largest shift in embedding of those genes with >20 detections (out of 9768 genes), indicating a strong interference effect (Figure 5A), was indeed shown to have a statistically significant change in expression (FDR<0.001) following A3B knockdown in the context of SARS-CoV-2 infection. This change was observed consistently across all three replicates and inversely correlated with A3B expression levels (r =-0.65 p=0.06) when comparing mock infection, siCNT + SARS-CoV-2, and siA3B + SARS-CoV-2 (Figure 5C).
To further investigate the clinical significance of AMPD2 in SARS-CoV-2 infection, we performed differential gene expression (DGE) using the data from GSE145926 (https://doi.org/10.1038/s41591-020-0901-9) [38]. The clinical data further corroborate the inverse relationship between A3B and AMPD2 expression in severe COVID-19. BALF samples from severely infected patients, which exhibited a 4.93-fold increase in A3B expression (Figure 1A, shown again in Figure 5D), demonstrated a corresponding 32% decrease (0.68-fold) in AMPD2 expression (Figure 5C), as well as a decreased proportion of cells expressing AMPD2 (Supplementary Figure S4). These results suggest that A3B upregulation in severe SARS-CoV-2 infection suppresses AMPD2 expression, potentially altering purine metabolism, energy homeostasis, and anti-inflammatory signaling in infected cells (Figure 5B).
3. Discussion
Previously, endogenous A3B has only been shown to play an antiviral role. We report here that SARS-CoV-2 infection upregulates A3B expression, which in turn enhances the viral replication and infectivity. The mechanisms for the proviral activity of A3B for SARS-CoV-2 infection are cell-type dependent, which showed either PKR/eIF2⍺ pathway dependent in Caco-2 or independent in A549-ACE2. Our studies suggest two possible mechanisms: (1) In Caco-2, increased A3B drives the activation of the PKR/eIF2⍺ pathway to downregulate host protein translation, which is considered a classical antiviral response [27]. However, SARS-CoV-2 infection is not inhibited with the activation of this pathway, instead SARS-CoV-2 exploits this pathway, likely to selectively enhance translation of its own viral proteins [30]. (2) In A549-ACE2, infection-mediated increased A3B did not activate PKR/eIF2⍺ pathway. Rather, it appears to suppress AMPD2 expression, possibly leading to the elevated purine nucleotide synthesis and altered anti-inflammatory purinergic signaling, contributing to cytokine release syndrome and worsening disease severity in COVID-19 patients.
Our finding that SARS-CoV-2 infection induces high levels of A3B expression, driving the activation of the p-PKR/p-eIF2⍺ stress response which is hijacked by the virus for its own benefit provides an example of novel APOBEC/virus interaction. Here, we demonstrate that A3B’s ability to drive p-PKR/p-eIF2⍺ [27], is actually co-opted by SARS-CoV-2 to promote viral infectivity and gene expression, likely through the use of SARS-CoV-2’s non-canonical translation initiation pathways [30,31]. Because new viral strains are emerging frequently, it is important to identify host proviral factors whose inhibition may be used as an antiviral pharmacological treatment strategy in multiple cases. This study identifies A3B as a potentially druggable target for treating SARS-CoV-2 and potentially other viruses, yet to be discovered, that rely on the same mechanism to promote infectivity.
Notably, we utilized Geneformer to generate a hypothesis in a scenario where the underlying mechanism remained elusive. Geneformer predicted that A3B knockout in the context of severe SARS-CoV-2 infection would dysregulate AMPD2 expression. Previous studies [34,35] support the role of AMPD2 and purine biosynthesis in SARS-CoV-2 infection and disease severity. To validate Geneformer’s prediction, we performed bulk RNA-Sequencing and differential gene expression analysis, comparing mock-infected, control-infected, and A3B knockdown-infected cells. We found that SARS-CoV-2 infection significantly reduced AMPD2 expression, supporting previous findings demonstrating an increased flux through the de novo purine biosynthesis pathway during SARS-CoV-2 infection [34]. Validating Geneformer’s prediction, A3B knockdown restored AMPD2 expression during SARS-CoV-2 infection.
AMPD2 is an anti-inflammatory gene previously shown to be downregulated during severe COVID-19 infection [42]. AMPD2 catalyzes the conversion of extra-cellular adenosine-monophosphate (AMP), a molecule implicated in inflammation, into inosine monophosphate (IMP) [43]. Given that elevated AMP levels correlate with increased inflammatory cytokines (IL-10 and IL-18) during COVID-19 infection [35], decreased AMPD2 may exacerbate disease pathology by allowing AMP accumulation [34], thereby driving excessive cytokine release. We propose that high A3B expression induced by SARS-CoV-2 infection may suppress AMPD2 expression, given A3B’s role in inflammation modulation. Specifically, elevated A3B expression occurs in response to viral infection and inflammatory signaling, potentially repressing AMPD2 to further increase AMP accumulation and subsequent cytokine release. This mechanism suggests a potential positive-feedback loop wherein SARS-CoV-2 infection elevates A3B via inflammatory signaling (such as JAK1/STAT3/NF-κB) [44,45,46], resulting in further amplification of the cytokine storm observed in severe COVID-19 cases. Such feedback loop aligns with previous studies showing the IL-6/JAK1/STAT3 pathway enhance A3B expression [47], which itself stabilizes IL-6 mRNA [48], intensifying inflammatory signaling pathways and functioning to help drive a pro-inflammatory response.
To explore a potential relationship between A3B and AMPD2, we examined scRNA-Sequencing data from BALF of severe and mild COVID-19 patients. We observed a trend toward elevated A3B expression and reduced AMPD2 expression in severe cases relative to mild infection. While this pattern does not establish causality, it raises the hypothesis of a possible inverse relationship between these two genes in the context of SARS-CoV-2 infection. By applying Geneformer, we generated preliminary insights into a candidate gene network that would have been challenging to identify using traditional next generation sequencing analysis methods. However, the underlying mechanisms driving this putative relationship remain unclear and will require future experimental validation and mechanistic investigation.
Given our novel finding that SARS-CoV-2 infection induces A3B expression, which in turn promotes SARS-CoV-2 infectivity, we speculate on its potential implications for long-haul COVID-19 patients. A3B is a well-established source of DNA mutagenesis and is implicated in tumor evolution [49,50,51]. Prolonged A3B expression, particularly in the setting of chronic inflammation, can result in clustered hypermutation signatures known as kataegis [52,53], a mutational process associated with cancer progression. Because of the known risks of prolonged A3B activity, long COVID-19 patients should be monitored for potential immune cell and lung cancers displaying the A3B mutational signature [50,54]. Future studies should investigate whether persistent A3B upregulation in post-COVID-19 patients contributes to an increased risk of malignancy and whether targeting A3B activity could serve as a potential therapeutic intervention in severe COVID-19 patients.
4. Materials and Methods
4.1. Cell Culture
Cells were cultured at 37°C in a 5% CO2 atmosphere using a ThermoScientific™ Forma Series II Water Jacket CO2 Incubator. Caco-2 (ATCC-#HTB-37) were maintained in Eagle’s Minimum Essential Media (EMEM) supplemented with 10% Fetal Bovine Serum (FBS) and 1% Penicillin-Streptomycin (PS) (Gibco-#15140122). A549-ACE2 (BEI-#NR53821) were cultured in Dulbecco’s Modified Eagle’s Medium (DMEM) containing 4.5g/L glucose, L-glutamine, and sodium pyruvate; supplemented with 10% FBS, 1% P/S, and 100µg/µL blasticidin. Vero-e6-ACE2 cells were cultured in DMEM containing 4.5g/L glucose, L-glutamine, and sodium pyruvate; supplemented with 10% FBS, 1% P/S, and 2.5µg/mL puromycin.
4.2. RNA Interference
Small-interfering RNA (siRNA) was purchased from ThermoFisher under the Silencer-Select product line (siRNA sequences and catalog numbers are available in Supplementary Table S3). For each gene knockdown, two siRNAs were used per target gene to ensure effective knockdown. Cells were seeded into 6- or 12-well plates and transfected with 10µM siRNA using Lipofectamine RNAiMax (Thermo Fisher, #13778150) in Opti-MEM™ and antibiotic-free media 2 days prior to infection. After 1 day, media was replaced with standard culture media, and cells were incubated until infection.
4.3. SARS-CoV-2 Virus Infections
SARS-CoV-2 USA-WA1/2020 was obtained from University of Southern California (BSL3 Core) and was originally gifted from BEI Resources (NR-52281). All SARS-CoV-2 stock virus production, infection, and titration were performed as previously described, [26] with some modifications. All work with SARS-CoV-2 was conducted within the BSL-3 Laboratories at USC. Vero E6-hACE2 cells were used for SARS-CoV-2 stock propagation. Cells were seeded at 3x10 [6] cells in a T75 flask for 24 hours before infection with SARS-CoV-2 (plaque isolate USA-WA1/2020) at a multiplicity of infection (MOI) of 0.005. Virus-containing supernatant was collected approximately 72 hours post infection (hpi).
Virus was titrated by plaque assay, as previously described. [26] Vero E6-hACE2 cells were seeded in 6-well plates, and once cultures reached 100% confluence, they were infected with serially diluted SARS-CoV-2 virus stock (500µL per well). After 60 minutes of incubation on a gentle shaker in the cell-culture incubator, the media was removed, and the cells were overlaid with a medium containing FBS-free DMEM and 1% low-melting-point agarose (Gibco #12100-046). After plaque formation around 72 hpi, cells were fixed with 4% paraformaldehyde (PFA) overnight at room temperature. Solid DMEM-agarose was removed, and cells were stained with 0.2% crystal violet. Plaques were counted on a lightbox to determine viral titers.
Caco-2, A549-ACE2, and Vero-e6-ACE2 cells were infected with SARS-CoV-2 in serum-free media (250µL or 500µL per well for 12- or 6-well plates, respectively) at 37°C, 5%CO2 on a gentle shaker at the indicated MOI for 60 minutes to allow for viral adsorption. After adsorption, infection media was replaced with standard culture media, and infections were continued for the indicated duration of infection.
4.4. Reverse Transcription-Quantitative Polymerase Chain Reaction
Total RNA was extracted from SARS-CoV-2 or mock-infected cells using TRIzol™ Reagent (Thermo Fisher, #15596026). The purity and concentration of extracted RNA was measured with a Nanodrop spectrophotometer (Thermo #ND-ONEC-W). 100ng of total RNA was reverse transcribed into complementary cDNA using Protoscript II (New England Biolabs, #M0368S) in a 20µL reaction containing: 1µL of 100µM gene-specific reverse primer or 2µL of 100µM random hexamer primers (NEB #S1330S), 4µL 1x Protoscript II buffer, 1µLof 10 mM dNTP, 1µL of 0.1 M DTT, 8U RNase Inhibitor (NEB #M0314S), and 200U Protoscript II reverse transcriptase. Reverse transcription was performed at 42 °C for 60 minutes, followed by enzyme inactivation at 65°C for 25 minutes.
Quantitative PCR (qPCR) was performed using SYBR Green-based detection in a Bio-Rad™ FGX Opus 96 Real-Time PCR System (Bio-Rad #12011319). Reactions were prepared in 20µL volume per well containing: 2µL of cDNA, 1µL of forward and reverse primers (10µM each), 10µL of 2x SYBR Green Master Mix (Bio-Rad #1725120), 7µL nuclease-free water. PCR cycling conditions were set as follows: (95C x 30s, ((95C x 5s, 60C x 30s) x 39)). Gene expression levels were quantified using either: standard curve quantification based on SARS-CoV-2 N gene standard (IDT #10006625), or by relative quantification using the 2^-ΔΔCt method, and normalized to β-Actin expression. qPCR data were analyzed using Bio-Rad CFX Maestro v2.3. Primer sequences used in this study are listed in Supplementary Table S1.
4.5. Western-Blots
Samples were subjected to a standard SDS-PAGE protocol and were subsequently transferred onto a PVDF membrane (Sigma, #IPVH00010). The membrane was then blocked for 1 hour at room temperature using a blocking buffer composed of TSB-T (1× TBS and 0.05% Tween-20, and 5% milk. The membrane was then incubated overnight at 4°C in the blocking buffer containing the primary antibody. After incubation, the membrane was washed three times with TBS-T, then incubated for 1 hour with a rabbit/mouse-HRP conjugated secondary antibody diluted in TBS-T and washed thrice with TBS-T again. Protein signals were detected using the SuperSignal West Dura Extended Duration Substrate (Thermo Scientific, #34075) and visualized using a ChemiDoc MP Imaging System (Bio-Rad).
4.6. Immunofluorescence
Paraformaldehyde was used to fix the cells (3% paraformaldehyde and 2% sucrose in 1× PBS) for 20 minutes, followed by two washes with 1× PBS. Permeabilization was carried out with a buffer containing 1× PBS and 0.2% Triton X-100 for 5 minutes. Next, cells were washed twice with 1× PBS and blocked for 1 hour in PBS-T (1× PBS and 0.05% Tween-20) supplemented with 2% BSA and 10% milk. Primary antibody incubation was performed at room temperature for 2 hours in 1× PBS containing 2% BSA and 10% milk. Coverslips were washed thrice with PBS-T before being incubated for 1 hour with the appropriate fluorophore-conjugated secondary antibodies (Alexa-488 or Cy3). Following three additional washes with PBS-T, cells were stained with DAPI (5 µg/mL, MilliporeSigma #D9542), and coverslips were mounted using slow-fade mounting media (Thermo Fisher Scientific, #S36936). Imaging was conducted using a Leica DMi8 THUNDER microscope.
4.7. Bulk RNA Sequencing
A549-ACE2 were harvested 3 days post-infection using TRIzol™ Reagent (Thermo Fisher, #15596026). Frozen TRIzol lysates were shipped to a commercial sequencing facility for library preparation (poly-A selection) and RNA sequencing.
4.8. Bulk RNA Sequencing Analysis
All bulk RNA sequencing analyses were performed using Partek Flow™ (version 10). [55] The analysis pipeline included base trimming from both ends (min QS=30); filtering contaminants (rDNA, tRNA, mtDNA) using Bowtie 2.2.5; adapter trimming using Cutadapt 1.12; alignment to hg38-CoV-2WA1 hybrid genome using STAR 2.7.8a; filtering low quality alignments (minimum quality =20); quantifying to the annotation model (Partek E/M); noise reduction (maximum count >10); count normalization using median ratio; and differential gene expression (DGE) analysis using DeSeq2.
4.9. Single-Cell RNA Sequencing Analysis and Cell Type Identification
All single-cell RNA-sequencing data analyses were performed using Partek Flow™ (version 10). The analysis pipeline included filtering counts (<10% mitochondrial counts, <20% ribosomal counts, retaining 58368/108230 cells); noise reduction (exclude genes whose counts=0 in 100% of cells); and count normalization (Counts-Per-Million (CPM) +1 Log2 transformation). For DGE analysis, Severe COVID-19 samples were then down-sampled to 1053 cells/sample to allow fair comparison with mild COVID-19 samples; DGE analysis was completed using GSA and Hurdle Model.
To identify cell types, we performed the following steps after normalization: Principal Component Analysis (PCA) using the top 3000 most variable features; graph-based-clustering; UMAP was the run using the top 10 PCs. Epithelial Airway cells were defined by expression of KRT18, KRT5, and TPPP3.
4.10. Geneformer
Geneformer [36,37] was executed on Google Colab using an NVIDIA A100 GPU for transcriptome tokenization, in-silico deletion, and statistical analysis. The code used to run Geneformer will be made publicly available on the first author’s Github repository (https://github.com/bfixman) upon publication.

Table 1.
Primer Sequences.
| Primer | Sequence | Company |
|---|---|---|
| Actin - Forward | CTGGCACCCAGCACAATG | IDT DNA |
| Actin - Reverse | GCCGATCCACACGGAGTACT | IDT DNA |
| CoV-2 N1 - Forward | GGACCCCAAAATCAGCGAAAT | IDT DNA |
| CoV-2 N1 - Reverse | TTCTGGTTACTGCCAGTTGAATCTG | IDT DNA |
4.11. Antibodies
The antibodies used in this study are listed in Table 2.
Table 2.
Antibodies.
| Antibody | Isotype | Company | Catalog Number |
|---|---|---|---|
| SARS-CoV-2 Nucleocapsid | Rabbit monoclonal | Cell Signaling technology | 86326 |
| GAPDH | Rabbit polyclonal | EMD Millipore | ABS16 |
| Vinculin | Mouse monoclonal | Sigma | V9264 |
| PKR | Mouse monoclonal | BD Biosciences | 610764 |
| PKR-pT446 | Rabbit monoclonal | Abcam | ab32036 |
| eIF2ab | Rabbit monoclonal | Cell Signaling technology | 5324T |
| eIF2a-pS51 | Rabbit monoclonal | Abcam | 32157 |
| A3B | Rabbit monoclonal | Abcam | 184990 |
Table 3.
siRNA Sequences.
| siRNA | Sequence | Company | Catalog Number |
|---|---|---|---|
| Control | Thermo Fisher Scientific | 4390843 | |
| APOBEC3B | CCUCAGUACCACGCAGAAATT | Thermo Fisher Scientific | s18411 |
| APOBEC3B | GAGAUUCUCAGAUACCUGATT | Thermo Fisher Scientific | s18412 |
| PKR | GGUGAAGGUAGAUCAAAGATT | Thermo Fisher Scientific | s11187 |
| PKR | GACGGAAAGACUUACGUUATT | Thermo Fisher Scientific | s11185 |
4.12. Statistical Analysis and Plotting
All data visualization was performed with Partek Flow™ (version 10) or GraphPad Prism™ (v10.4.0, Macintosh). Statistical significance was assessed by ANOVA followed by pairwise comparison with Student’s t-test with correction for multiple comparisons; scRNA-seq differential expression analysis was conducted using Gene-Specific-Analysis in Partek, while bulk RNA-seq differential expression analysis was conducted using DeSeq2. For immunofluorescence image quantification, CellProfiler™ (Broad Institute) was used for automated image analysis and fluorescence intensity measurements. FIJI™ was used to overlay multiple channels for the representative images.
Supplementary Materials
The following supporting information can be downloaded at the website of this paper posted on Preprints.org. Supplementary Figure S1: UMAP plot showing distribution of cells from all samples and colored for epithelial airway marker KRT5 (left) and TPPP3 (right). Identified airway epithelial cells are circled in purple. Supplementary Figure S2: Proportion of Total and Airway Epithelial Cells Expressing APOBECs from mild and severe COVID-19 patients. Supplementary Figure S3: A549-ACE2 cells were infected at MOI=1 and RNA was harvested 3-days post infection for quantification by RT-qPCR. Bar graph shows mean ± SEM. Supplementary Figure S4: Proportion of Total and Airway Epithelial Cells Expressing AMPD2 from mild and severe COVID-19 patients
Figure S1.
UMAP plot showing distribution of cells from all samples and colored for epithelial airway marker KRT5 (left) and TPPP3 (right). Identified airway epithelial cells are circled in purple.
Figure S1.
UMAP plot showing distribution of cells from all samples and colored for epithelial airway marker KRT5 (left) and TPPP3 (right). Identified airway epithelial cells are circled in purple.
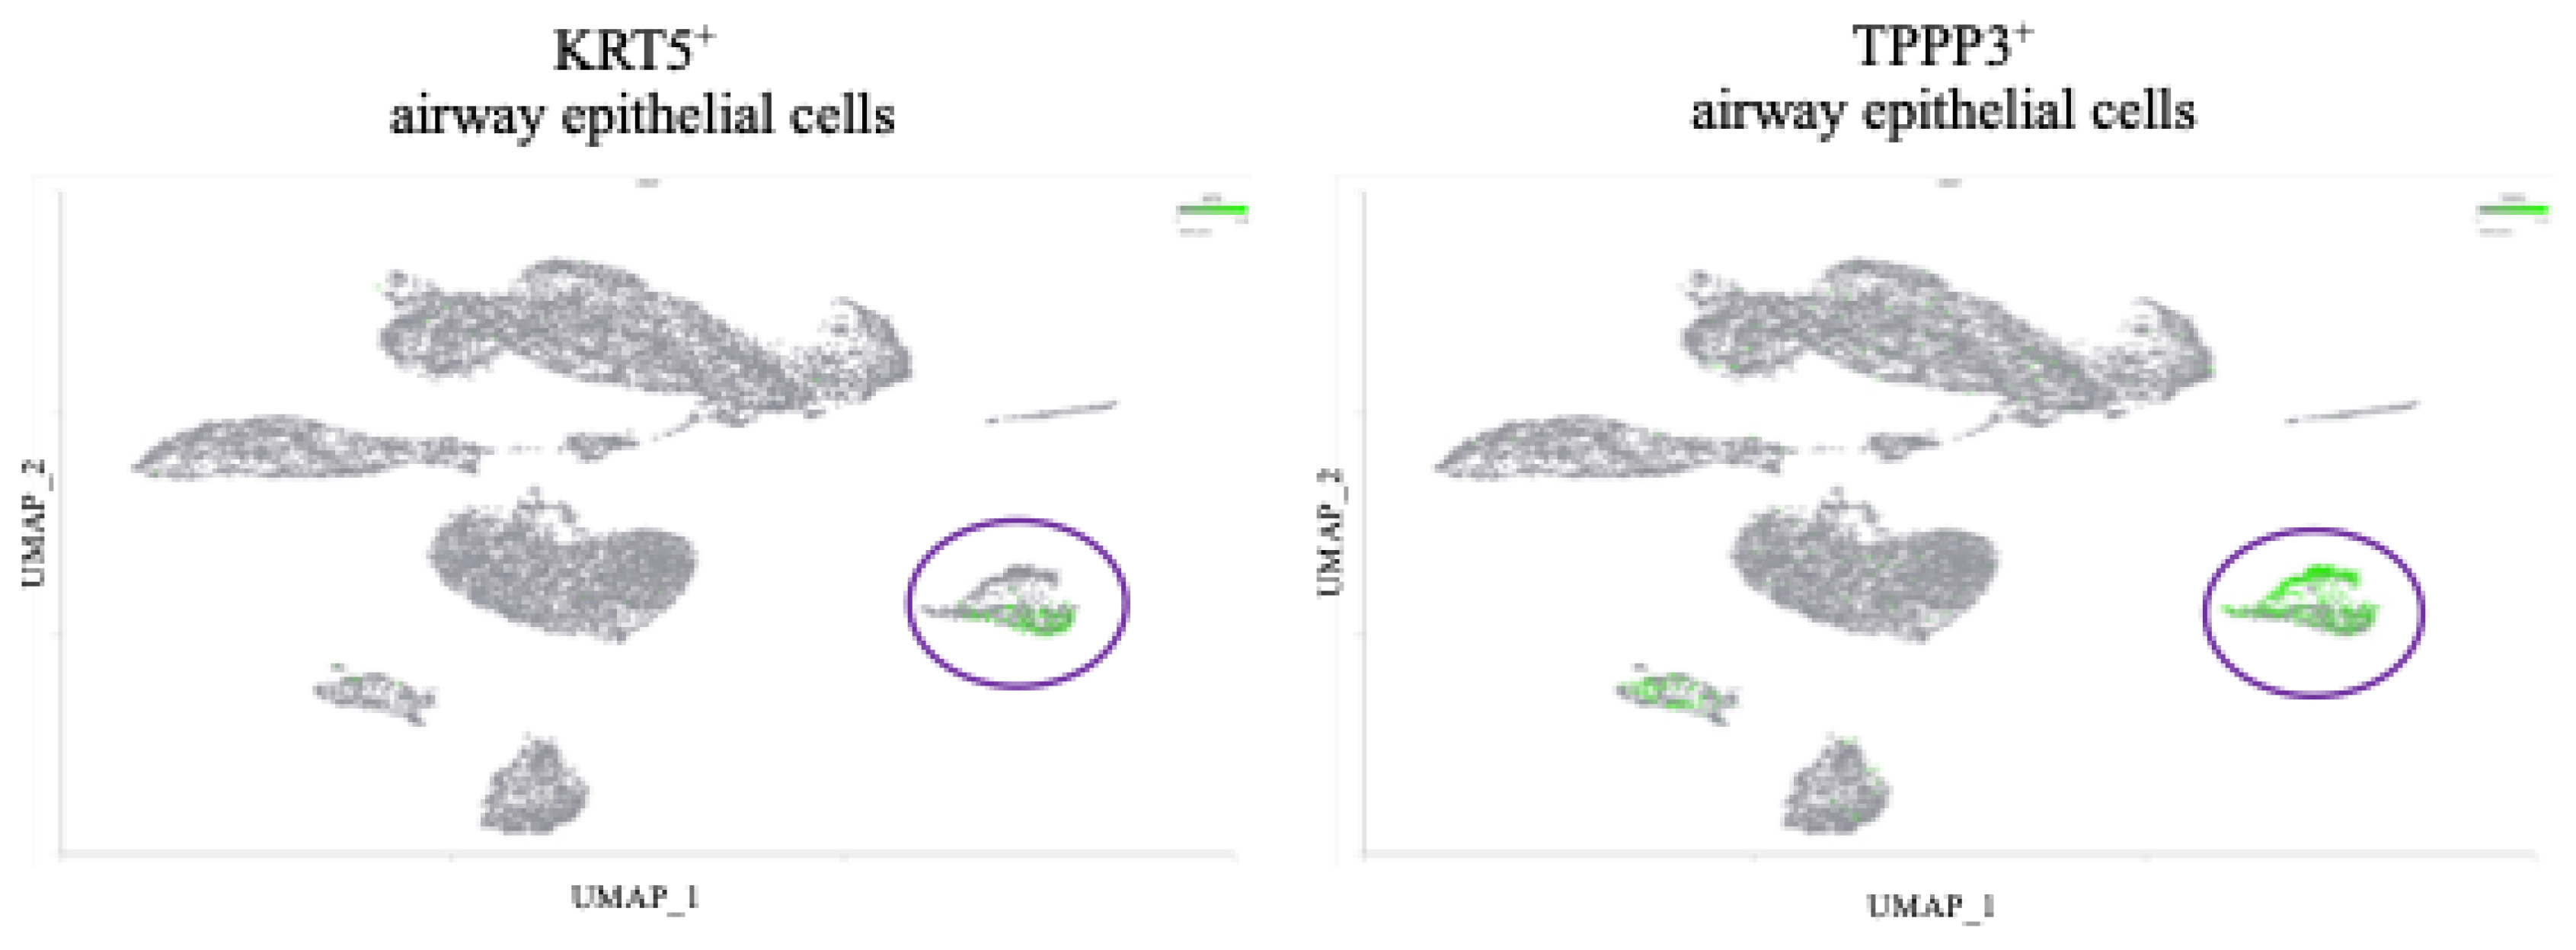
Figure S2.
Proportion of Total and Airway Epithelial Cells Expressing APOBECs from mild and severe COVID-19 patients.
Figure S2.
Proportion of Total and Airway Epithelial Cells Expressing APOBECs from mild and severe COVID-19 patients.
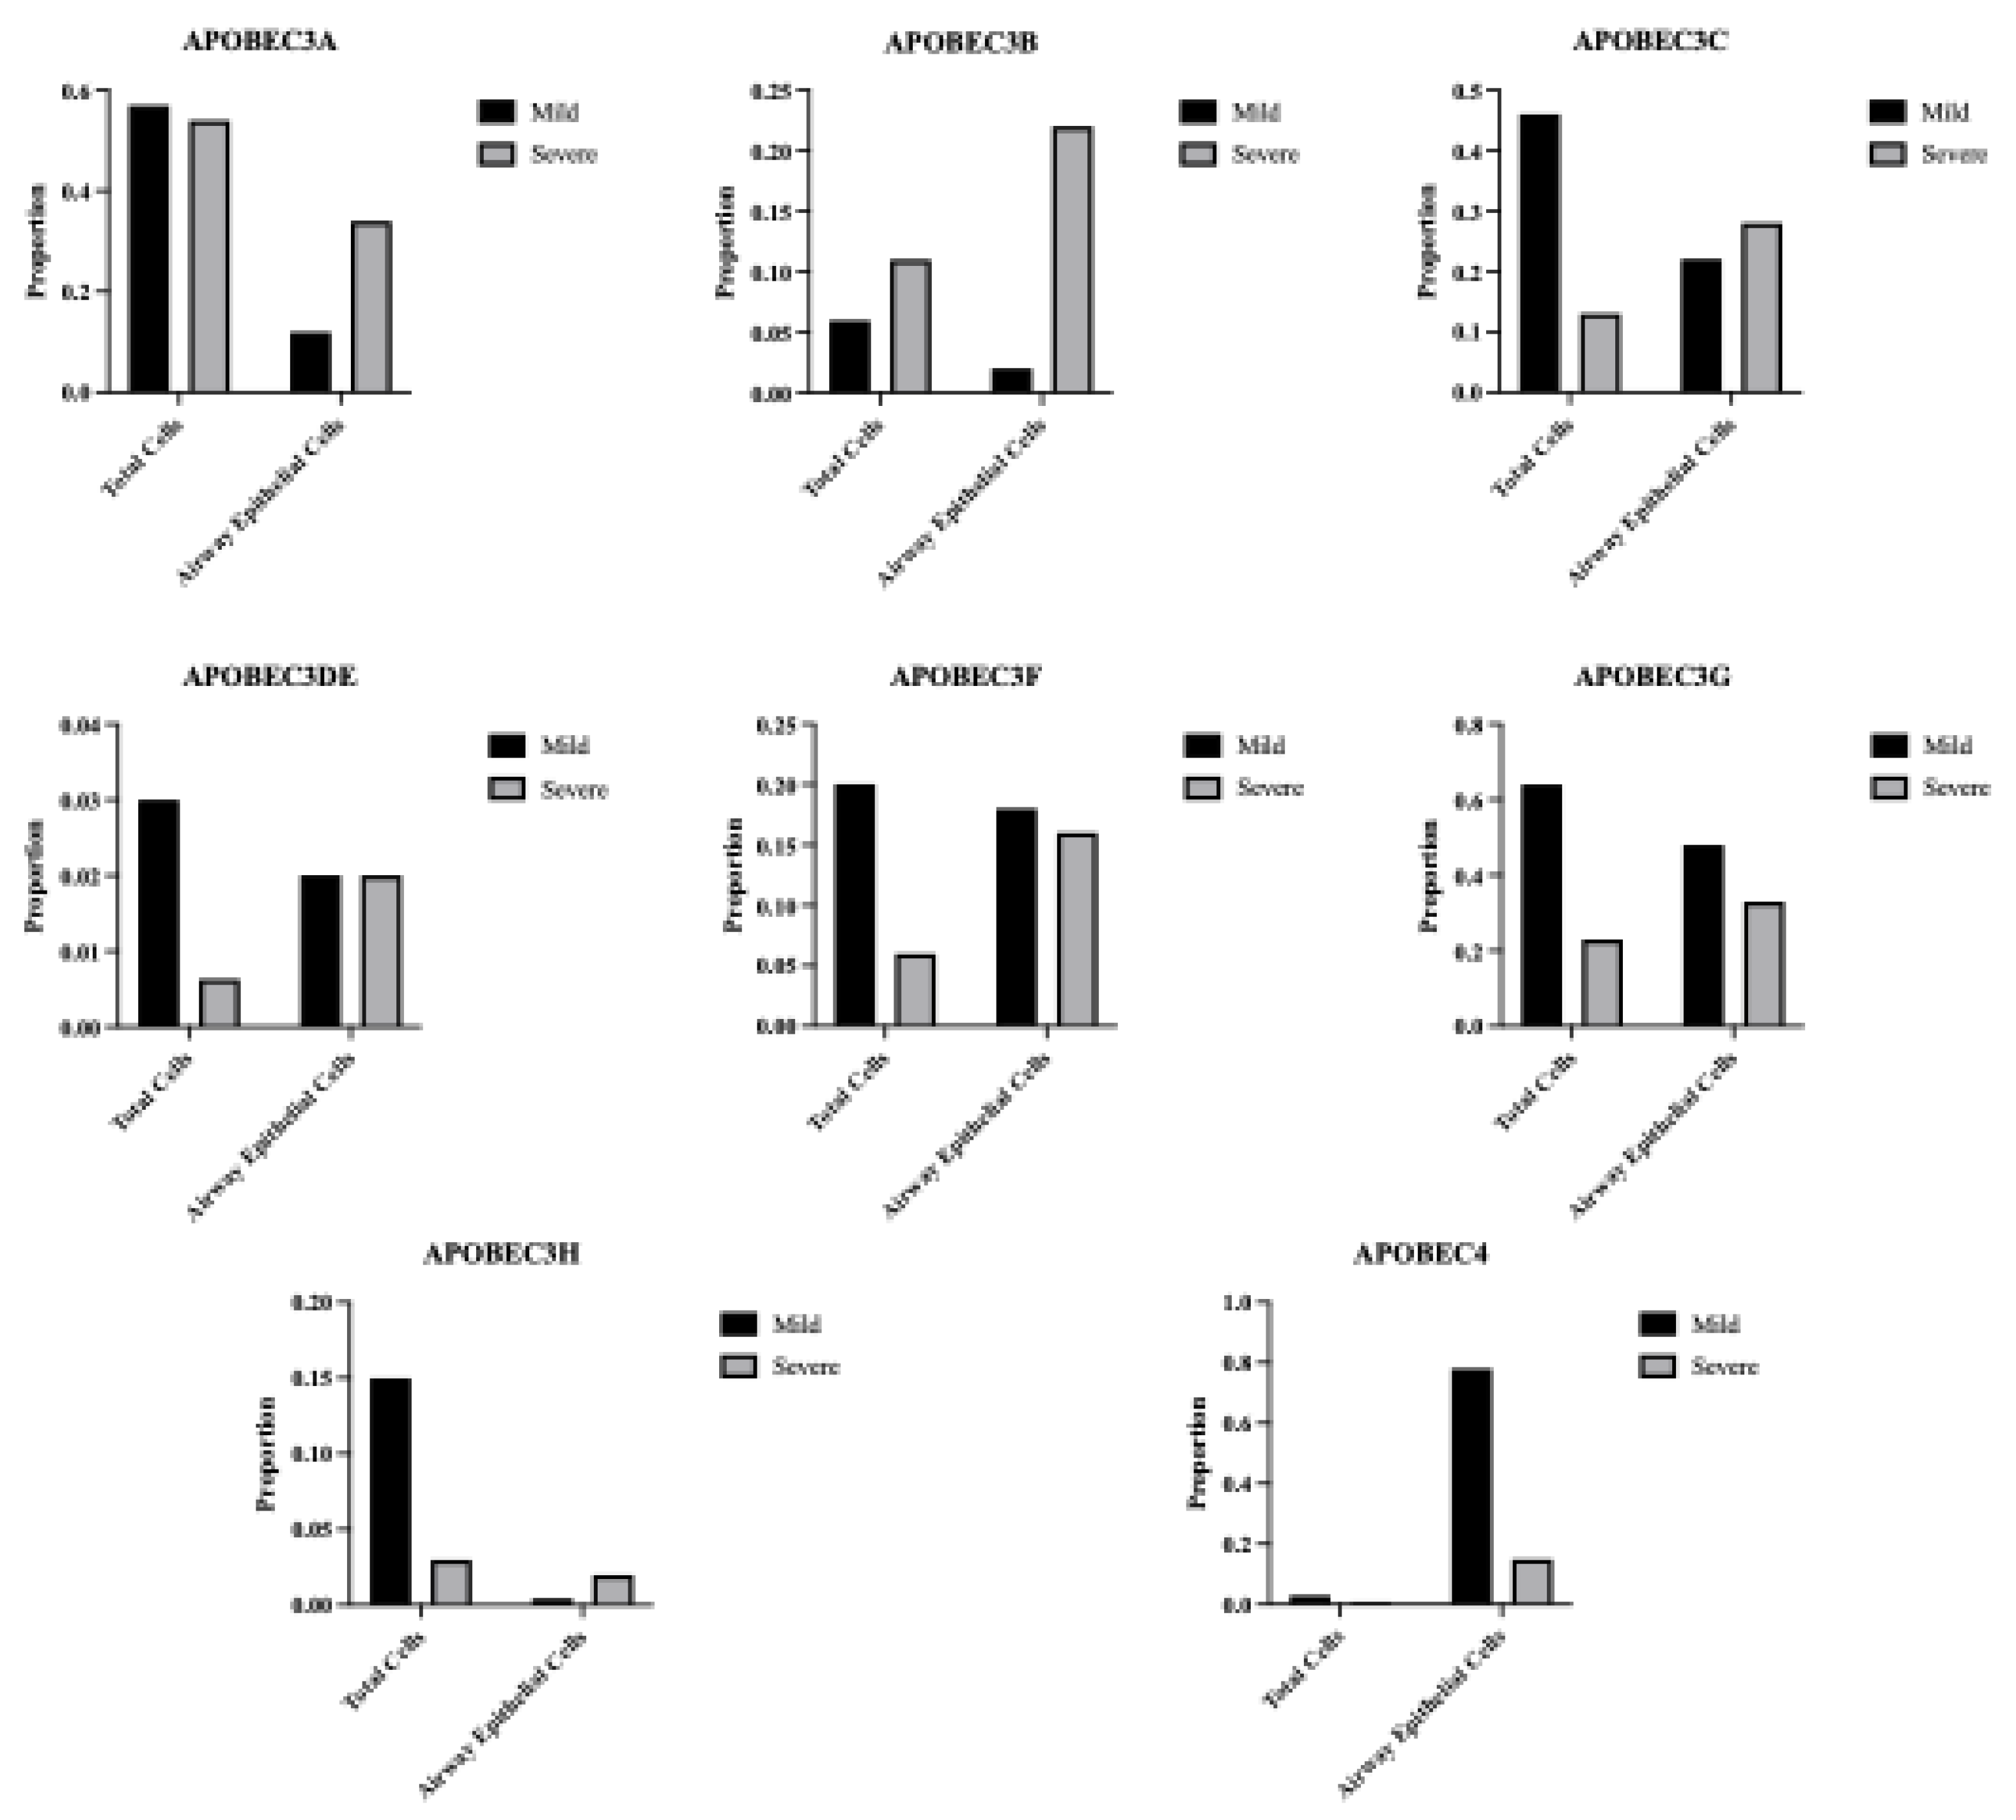
Figure S3.
A549-ACE2 cells were infected at MOI=1 and RNA was harvested 3-days post infection for quantification by RT-qPCR. Bar graph shows mean ± SEM. Statistical analyses are calculated from data obtained from 3 experiments. **P<0.01.
Figure S3.
A549-ACE2 cells were infected at MOI=1 and RNA was harvested 3-days post infection for quantification by RT-qPCR. Bar graph shows mean ± SEM. Statistical analyses are calculated from data obtained from 3 experiments. **P<0.01.
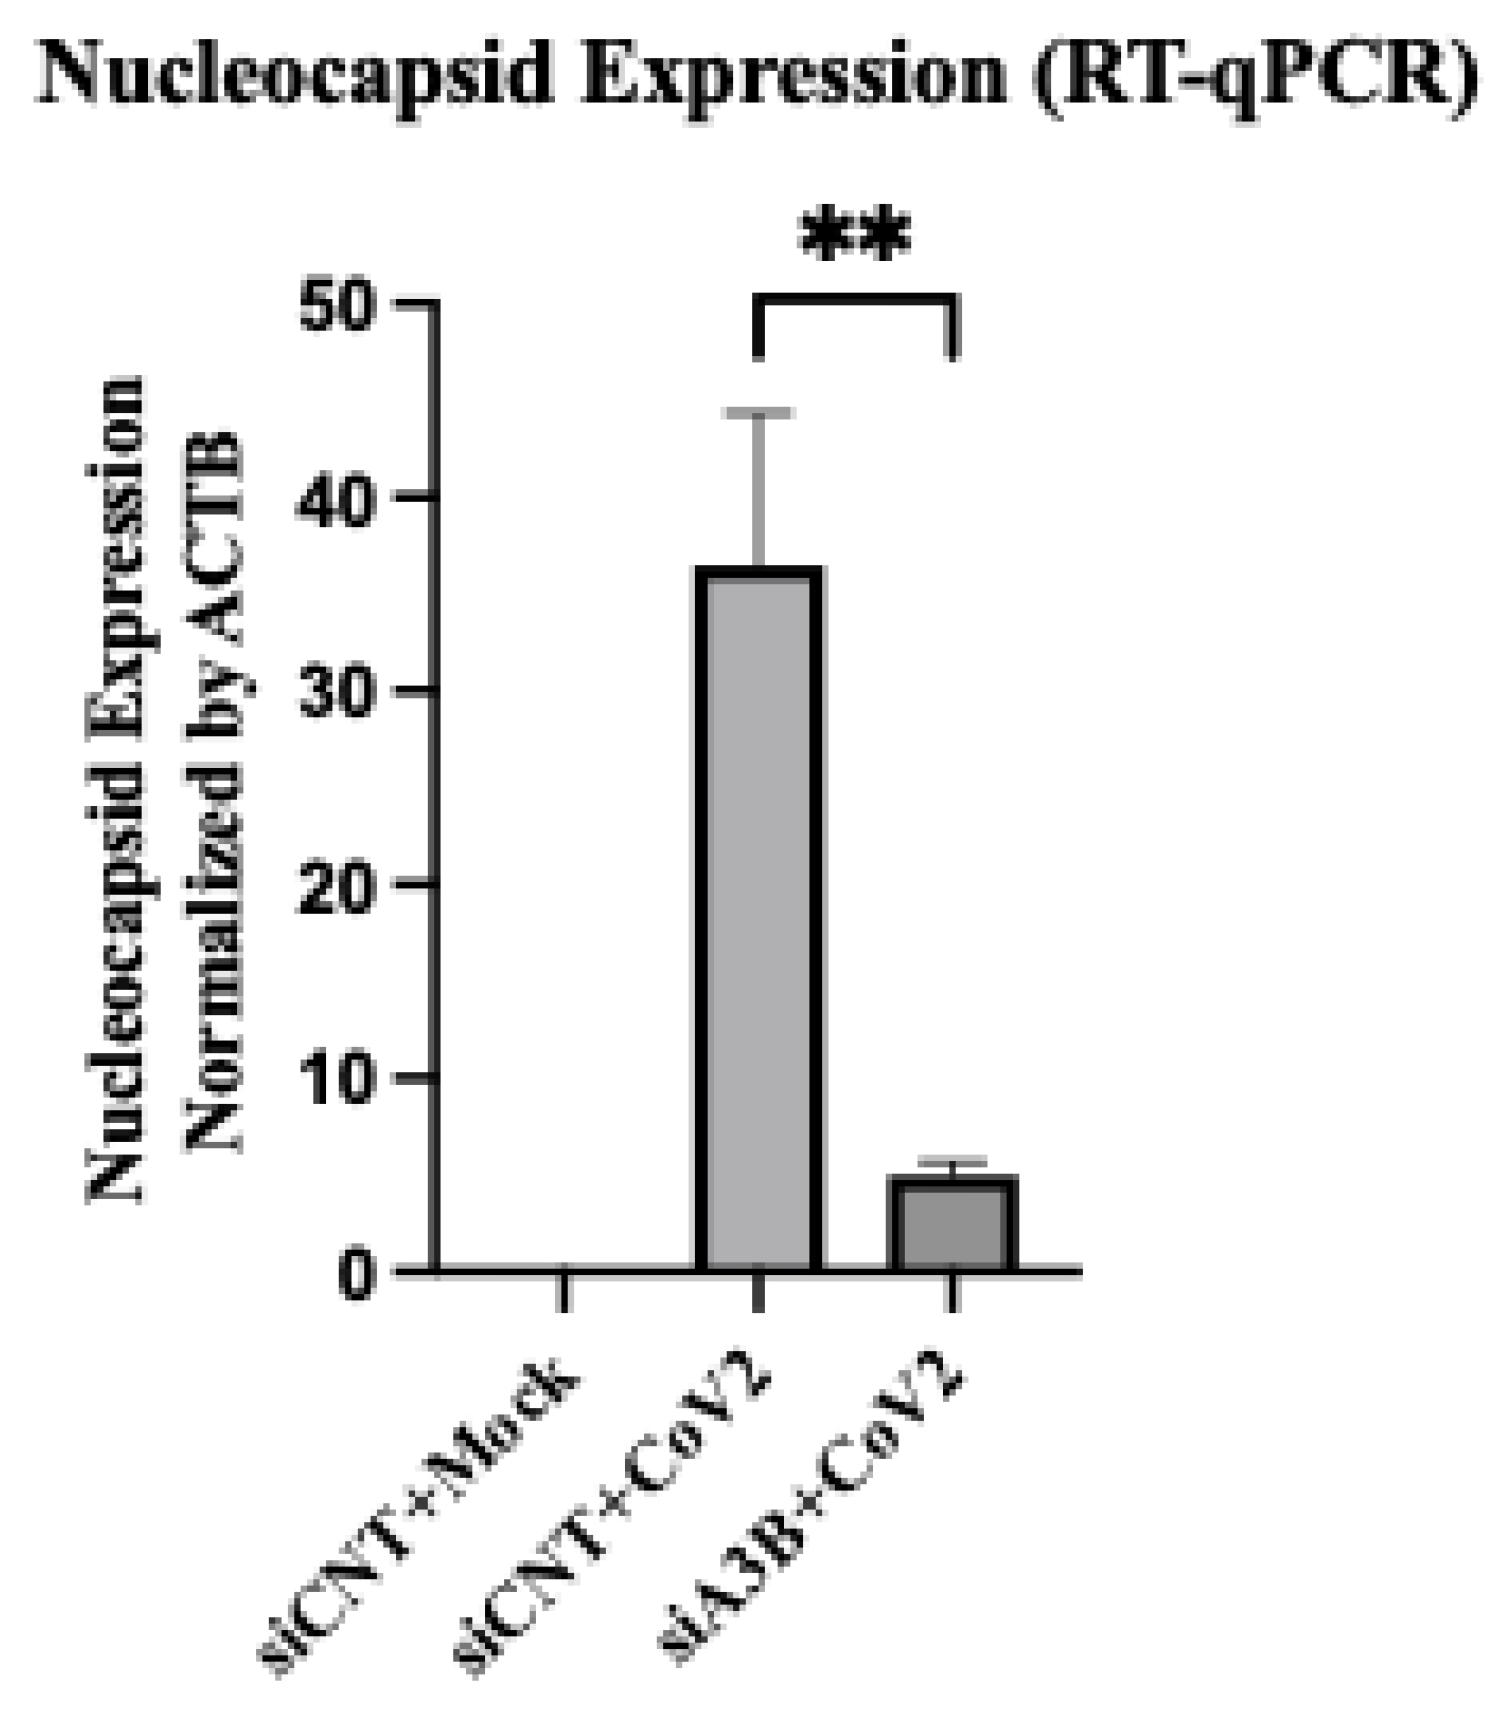
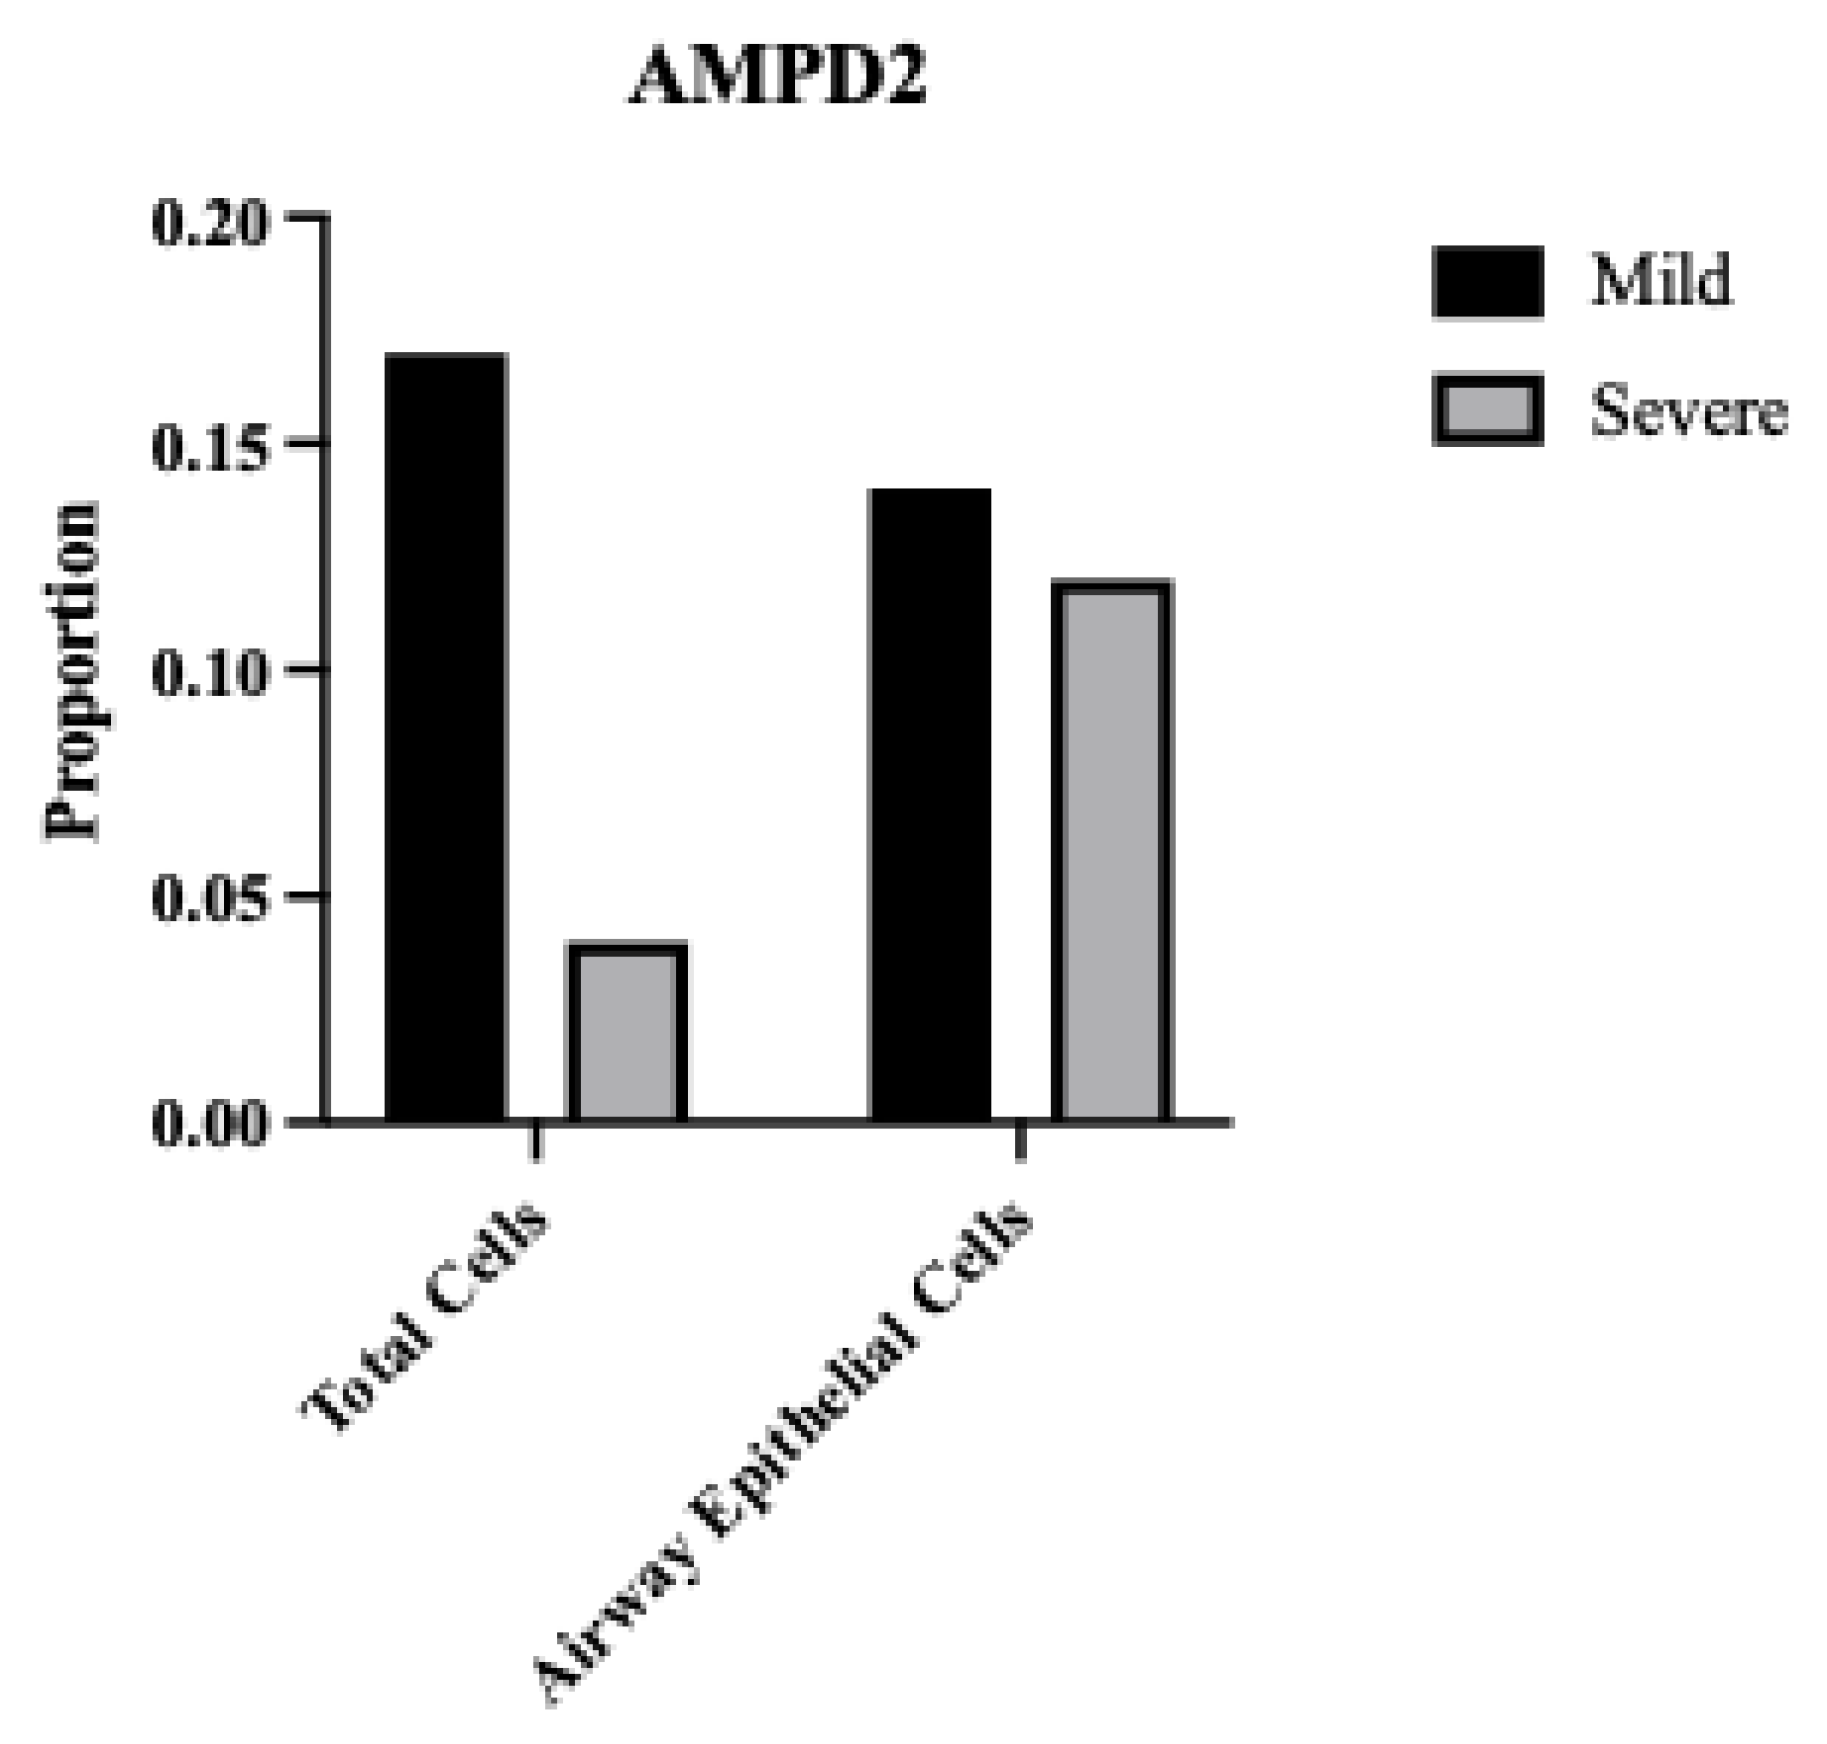
Figure S4.
Proportion of Total and Airway Epithelial Cells Expressing AMPD2 from mild and severe COVID-19 patients.
Figure S4.
Proportion of Total and Airway Epithelial Cells Expressing AMPD2 from mild and severe COVID-19 patients.
Author Contributions
B. Fixman, L. Manjunath, R. Buisson, and X. Chen conceptualized the study framework. B. Fixman with the assistance of L. Manjunath, P. Sell, S. Wang, C. Qiu, T. Margaryan, conducted the formal investigation and analysis. B. Fixman and L. Manjunath handled the methodology and visualization. B. Fixman wrote the original manuscript draft. H. Yang, L. Manjunath, R. Buisson, and X. Chen revised the manuscript. X. Chen supervised the project.
Funding
L.M. was supported by a Center for Virus Research Graduate Fellowship funded by the UCI Division of Graduate Studies. This work is supported by the NIH grants R01 AI150524 to X.S.C., and R37 CA252081, R21 AI185033, and R21 ES036190 to R.B. R.B. was supported by a Research Scholar Grant (RSG-24-1249960-01-DMC) from the American Cancer Society.
Acknowledgments
Sincere thanks to the USC Libraries Bioinformatics Services, including Drs. Yibu Chen and Meng Li. Thanks to the USC Center for Advanced Computing Research (CARC) support staff Drs. Tomek Osinski, Derek Strong, and Cesar Sul. Thank you to Dr. Brooke Hjelm, Dr. Chao Qin, Dr. Chun Li, Dr. Christina Theodoris, Dr. Peter Calabrese for general support with the project at different stages. Thanks to Dr. Derrick Morton and lab members Nina Barr and Lauryn Higginson for access to lab tools. Thanks to Dr. Kyu Min Kim whose previous work inspired this project. All BSL-3 work was performed within the Hastings Foundation and Wright Foundation Laboratories at USC. SARS-CoV-2 BSL3 resources were supported by a grant from the COVID-19 Keck Research Fund to L. Comai. The following reagent was deposited by the Centers for Disease Control and Prevention and obtained through BEI Resources, NIAID, NIH: SARS-Related Coronavirus 2, Isolate hCoV-19/USA-WA1/2020, NR-52281.
Conflicts of Interest
The authors declare no competing interests.
References
- Salter JD, Bennett RP, Smith HC. The APOBEC protein family: united by structure, divergent in function. Trends in biochemical sciences. 2016;41(7):578-594. [CrossRef]
- Jarmuz A, Chester A, Bayliss J, et al. An anthropoid-specific locus of orphan C to U RNA-editing enzymes on chromosome 22. Genomics. 2002;79(3):285-296. [CrossRef]
- Cullen BR. Role and mechanism of action of the APOBEC3 family of antiretroviral resistance factors. Journal of virology. 2006;80(3):1067-1076. [CrossRef]
- Smith HC, Bennett RP, Kizilyer A, McDougall WM, Prohaska KM. Functions and regulation of the APOBEC family of proteins. Elsevier; 2012:258-268. [CrossRef]
- Navarro F, Bollman B, Chen H, et al. Complementary function of the two catalytic domains of APOBEC3G. Virology. 2005;333(2):374-386. [CrossRef]
- Yang H, Ito F, Wolfe AD, et al. Understanding the structural basis of HIV-1 restriction by the full length double-domain APOBEC3G. Nature communications. 2020;11(1):632. [CrossRef]
- Harris RS, Liddament MT. Retroviral restriction by APOBEC proteins. Nature Reviews Immunology. 2004;4(11):868-877. [CrossRef]
- Sheehy AM, Gaddis NC, Choi JD, Malim MH. Isolation of a human gene that inhibits HIV-1 infection and is suppressed by the viral Vif protein. Nature. 2002;418(6898):646-650. [CrossRef]
- Belanger K, Savoie M, Rosales Gerpe MC, Couture J-F, Langlois M-A. Binding of RNA by APOBEC3G controls deamination-independent restriction of retroviruses. Nucleic acids research. 2013;41(15):7438-7452. [CrossRef]
- Harris RS, Dudley JP. APOBECs and virus restriction. Virology. 2015;479:131-145. [CrossRef]
- Ooms M, Krikoni A, Kress AK, Simon V, Münk C. APOBEC3A, APOBEC3B, and APOBEC3H haplotype 2 restrict human T-lymphotropic virus type 1. Journal of virology. 2012;86(11):6097-6108. [CrossRef]
- Beggel B, Münk C, Däumer M, et al. Full genome ultra-deep pyrosequencing associates G-to-A hypermutation of the hepatitis B virus genome with the natural progression of hepatitis B. Journal of viral hepatitis. 2013;20(12):882-889. [CrossRef]
- Lucifora J, Xia Y, Reisinger F, et al. Specific and nonhepatotoxic degradation of nuclear hepatitis B virus cccDNA. Science. 2014;343(6176):1221-1228. [CrossRef]
- Narvaiza I, Linfesty DC, Greener BN, et al. Deaminase-independent inhibition of parvoviruses by the APOBEC3A cytidine deaminase. PLoS pathogens. 2009;5(5):e1000439. [CrossRef]
- Chen H, Lilley CE, Yu Q, et al. APOBEC3A is a potent inhibitor of adeno-associated virus and retrotransposons. Current Biology. 2006;16(5):480-485. [CrossRef]
- Zhu B, Xiao Y, Yeager M, et al. Mutations in the HPV16 genome induced by APOBEC3 are associated with viral clearance. Nature communications. 2020;11(1):886. [CrossRef]
- Warren CJ, Xu T, Guo K, et al. APOBEC3A functions as a restriction factor of human papillomavirus. Journal of virology. 2015;89(1):688-702. [CrossRef]
- Cheng AZ, Yockteng-Melgar J, Jarvis MC, et al. Epstein–Barr virus BORF2 inhibits cellular APOBEC3B to preserve viral genome integrity. Nature microbiology. 2019;4(1):78-88. [CrossRef]
- Bekerman E, Jeon D, Ardolino M, Coscoy L. A role for host activation-induced cytidine deaminase in innate immune defense against KSHV. PLoS pathogens. 2013;9(11):e1003748. [CrossRef]
- Weisblum Y, Oiknine-Djian E, Zakay-Rones Z, et al. APOBEC3A is upregulated by human cytomegalovirus (HCMV) in the maternal-fetal interface, acting as an innate anti-HCMV effector. Journal of virology. 2017;91(23):10.1128/jvi. 01296-17.
- Pautasso S, Galitska G, Dell’Oste V, et al. Strategy of human cytomegalovirus to escape interferon beta-induced APOBEC3G editing activity. Journal of virology. 2018;92(19):10.1128/jvi. 01224-18.
- Stewart JA, Holland TC, Bhagwat AS. Human herpes simplex virus-1 depletes APOBEC3A from nuclei. Virology. 2019;537:104-109. [CrossRef]
- Moraes SN, Becker JT, Moghadasi SA, et al. Evidence linking APOBEC3B genesis and evolution of innate immune antagonism by gamma-herpesvirus ribonucleotide reductases. elife. 2022;11:e83893.
- Peretti A, Geoghegan EM, Pastrana DV, et al. Characterization of BK polyomaviruses from kidney transplant recipients suggests a role for APOBEC3 in driving in-host virus evolution. Cell host & microbe. 2018;23(5):628-635. e7. [CrossRef]
- Venkatesan S, Rosenthal R, Kanu N, et al. Perspective: APOBEC mutagenesis in drug resistance and immune escape in HIV and cancer evolution. Annals of Oncology. 2018;29(3):563-572.
- Kim K, Calabrese P, Wang S, et al. The roles of APOBEC-mediated RNA editing in SARS-CoV-2 mutations, replication and fitness. Scientific Reports. 2022;12(1):14972. [CrossRef]
- Manjunath L, Oh S, Ortega P, et al. APOBEC3B drives PKR-mediated translation shutdown and protects stress granules in response to viral infection. Nature communications. 2023;14(1):820. [CrossRef]
- Pavitt GD. Regulation of translation initiation factor eIF2B at the hub of the integrated stress response. Wiley Interdisciplinary Reviews: RNA. 2018;9(6):e1491. [CrossRef]
- McCormick C, Khaperskyy DA. Translation inhibition and stress granules in the antiviral immune response. Nature Reviews Immunology. 2017;17(10):647-660. [CrossRef]
- Wei L-H, Sun Y, Guo JU. Genome-wide CRISPR screens identify noncanonical translation factor eIF2A as an enhancer of SARS-CoV-2 programmed− 1 ribosomal frameshifting. Cell Reports. 2023;42(8). [CrossRef]
- Slobodin B, Sehrawat U, Lev A, et al. Cap-independent translation and a precisely located RNA sequence enable SARS-CoV-2 to control host translation and escape anti-viral response. Nucleic acids research. 2022;50(14):8080-8092. [CrossRef]
- Renner DM, Parenti NA, Bracci N, Weiss SR. Betacoronaviruses Differentially Activate the Integrated Stress Response to Optimize Viral Replication in Lung-Derived Cell Lines. Viruses. 2025;17(1):120. [CrossRef]
- Ricciardi-Jorge T, da Rocha EL, Gonzalez-Kozlova E, et al. PKR-mediated stress response enhances dengue and Zika virus replication. Mbio. 2023;14(5):e00934-23. [CrossRef]
- Qin C, Rao Y, Yuan H, et al. SARS-CoV-2 couples evasion of inflammatory response to activated nucleotide synthesis. Proceedings of the National Academy of Sciences. 2022;119(26):e2122897119. [CrossRef]
- Xiao N, Nie M, Pang H, et al. Integrated cytokine and metabolite analysis reveals immunometabolic reprogramming in COVID-19 patients with therapeutic implications. Nature Communications. 2021;12(1):1618. [CrossRef]
- Theodoris CV, Xiao L, Chopra A, et al. Transfer learning enables predictions in network biology. Nature. 2023;618(7965):616-624. [CrossRef]
- Chen H, Venkatesh MS, Ortega JG, et al. Quantized multi-task learning for context-specific representations of gene network dynamics. bioRxiv. 2024;
- Liao M, Liu Y, Yuan J, et al. Single-cell landscape of bronchoalveolar immune cells in patients with COVID-19. Nature medicine. 2020;26(6):842-844. [CrossRef]
- Zupin L, Fontana F, Clemente L, Ruscio M, Ricci G, Crovella S. Effect of short time of SARS-CoV-2 infection in Caco-2 cells. Viruses. 2022;14(4):704. [CrossRef]
- Pires De Souza GA, Le Bideau M, Boschi C, et al. Choosing a cellular model to study SARS-CoV-2. Frontiers in cellular and infection microbiology. 2022;12:1003608.
- Garcia M, Meurs E, Esteban M. The dsRNA protein kinase PKR: virus and cell control. Biochimie. 2007;89(6-7):799-811. [CrossRef]
- Xu J, He B, Carver K, et al. Heterogeneity of neutrophils and inflammatory responses in patients with COVID-19 and healthy controls. Frontiers in immunology. 2022;13:970287.
- Ehlers L, Kuppe A, Damerau A, et al. Surface AMP deaminase 2 as a novel regulator modifying extracellular adenine nucleotide metabolism. The FASEB Journal. 2021;35. [CrossRef]
- Leonard B, McCann JL, Starrett GJ, et al. The PKC/NF-κB signaling pathway induces APOBEC3B expression in multiple human cancers. Cancer research. 2015;75(21):4538-4547. [CrossRef]
- Faure-Dupuy S, Riedl T, Rolland M, et al. Control of APOBEC3B induction and cccDNA decay by NF-κB and miR-138-5p. JHEP reports. 2021;3(6):100354. [CrossRef]
- Chen X-W, Zhou S-F. Inflammation, cytokines, the IL-17/IL-6/STAT3/NF-κB axis, and tumorigenesis. Taylor & Francis; 2015. p. 2941-2946.
- Liu W, Wu J, Yang F, et al. Genetic polymorphisms predisposing the interleukin 6–induced APOBEC3B-UNG imbalance increase HCC risk via promoting the generation of APOBEC-signature HBV mutations. Clinical Cancer Research. 2019;25(18):5525-5536. [CrossRef]
- Li S, Bao X, Wang D, et al. APOBEC3B and IL-6 form a positive feedback loop in hepatocellular carcinoma cells. Science China Life Sciences. 2017;60:617-626. [CrossRef]
- Alexandrov LB, Kim J, Haradhvala NJ, et al. The repertoire of mutational signatures in human cancer. Nature. 2020;578(7793):94-101. [CrossRef]
- Wang S, Jia M, He Z, Liu X-S. APOBEC3B and APOBEC mutational signature as potential predictive markers for immunotherapy response in non-small cell lung cancer. Oncogene. 2018;37(29):3924-3936. [CrossRef]
- Burns MB, Temiz NA, Harris RS. Evidence for APOBEC3B mutagenesis in multiple human cancers. Nature genetics. 2013;45(9):977-983. [CrossRef]
- Nikkilä J, Kumar R, Campbell J, et al. Elevated APOBEC3B expression drives a kataegic-like mutation signature and replication stress-related therapeutic vulnerabilities in p53-defective cells. British journal of cancer. 2017;117(1):113-123. [CrossRef]
- Taylor BJ, Nik-Zainal S, Wu YL, et al. DNA deaminases induce break-associated mutation showers with implication of APOBEC3B and 3A in breast cancer kataegis. elife. 2013;2:e00534.
- Fixman B, Díaz-Gay M, Qiu C, Margaryan T, Lee B, Chen XS. Validation of the APOBEC3A-Mediated RNA Single Base Substitution Signature and Proposal of Novel APOBEC1, APOBEC3B, and APOBEC3G RNA Signatures. Journal of Molecular Biology. 2024;436(24):168854. [CrossRef]
- Partek, an Illumina company (2024). Partek™ Flow™ (Version 10.0) [Computer software].
Figure 1.
APOBEC3B is overexpressed in severe relative to mild COVID patient BALF. (A) Scatter plots showing log2 Normalized CPM+1 of APOBEC gene expression in mild (blue) and severe (red) COVID patients. Mean expression ratio (severe:mild) is shown above each plot. Cell counts were down-sampled to c=6318 (severe) to allow fair visual comparison with mild (c=6316). FDR<0.001 for all comparisons except APOBEC1 and APOBEC2. (B) UMAP plot showing distribution of cells from all samples and colored for epithelial airway marker KRT18 (green). Identified airway epithelial cells are circled in purple. (C) UMAP plot marked for A3B expression (green). Airway epithelial cells are circled. (D) Scatter plot showing log2 Normalized CPM+1 of APOBEC3B gene expression in airway epithelial cells, mild (blue) and severe (red) COVID patients.
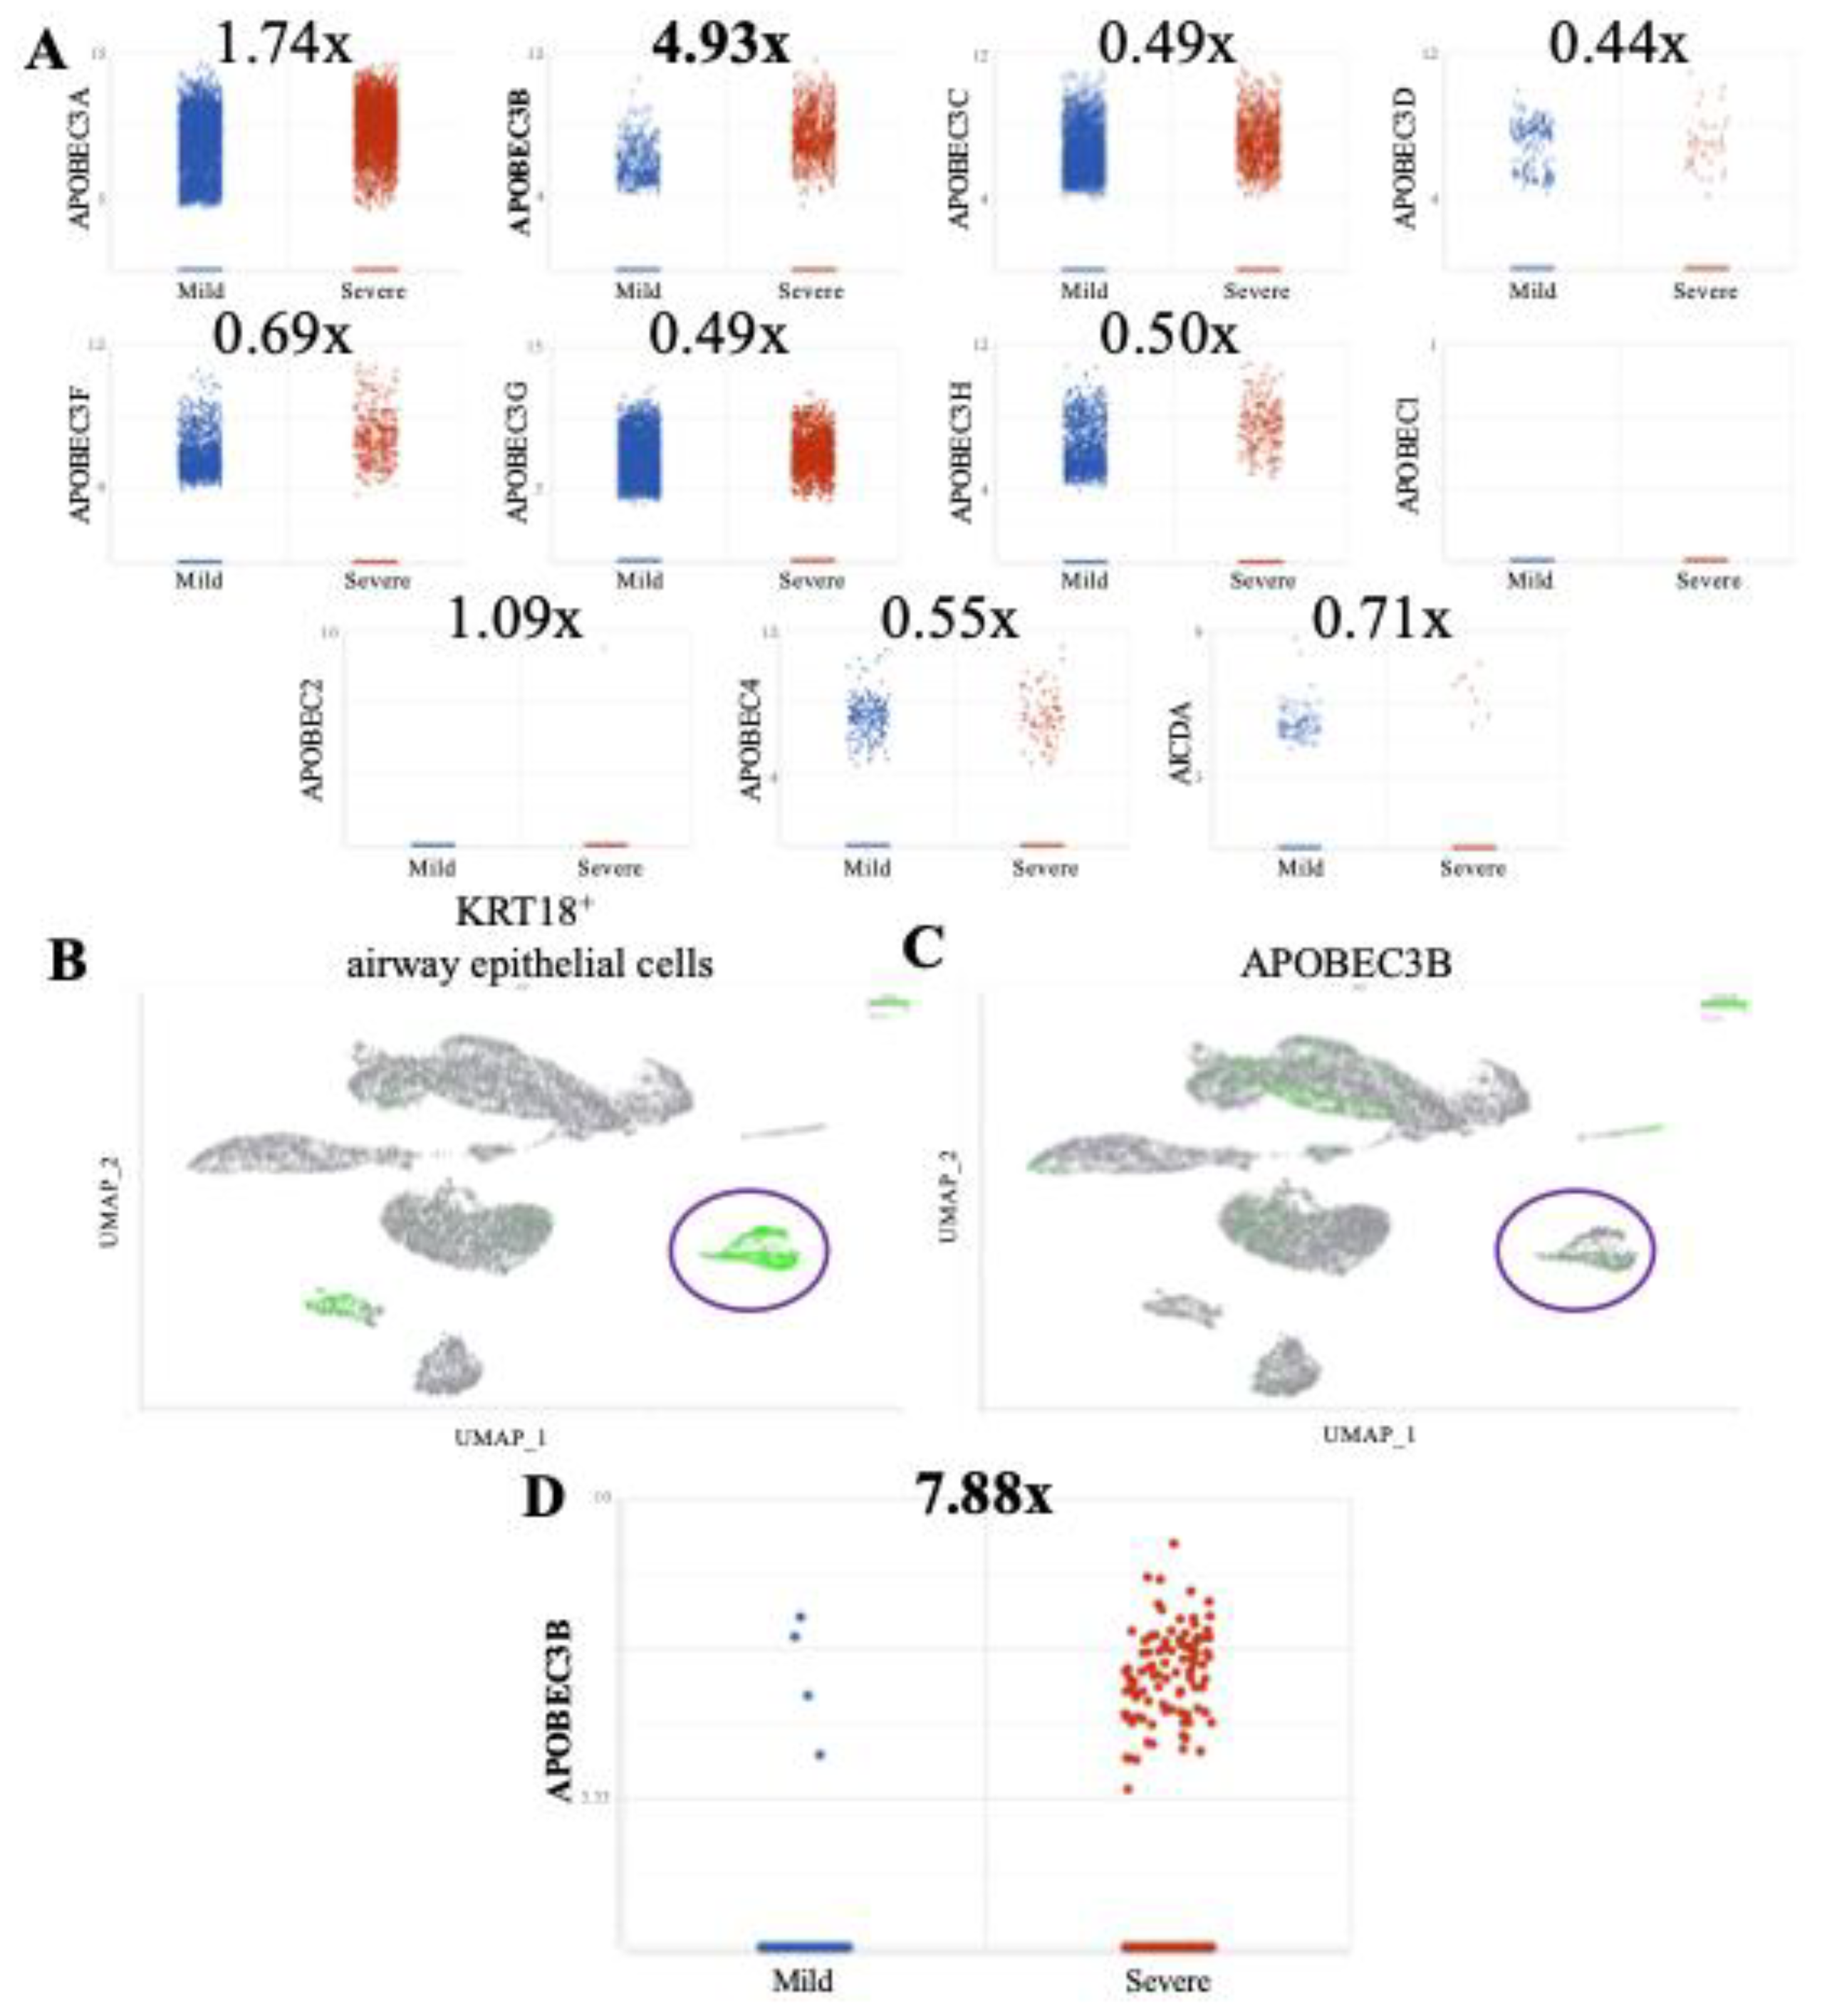
Figure 2.
APOBEC3B knockdown reduces SARS-CoV-2 infectivity in Caco-2 through attenuation of p-PKR/p-eIF2⍺. (A) Genomic equivalents of SARS-CoV-2 at 2-, 3-, and 4-days post-infection with 8000pfu. (B) Plaque forming units/mL of media collected at 2-, 3-, and 4-days post infection (C) Western blot showing the levels of Vinculin, PKR, eIF2⍺, A3B, and SARS-CoV-2 Nucleocapsid at 2- and 3-days post infection (MOI = 0.1) in siCNT and siA3B treated cells. (D) Western blot showing the levels of Vinculin, GAPDH, PKR, eIF2⍺, and SARS-CoV-2 Nucleocapsid at 16, 24, and 36h post infection (MOI = 1) in siCNT and siA3B treated cells. (E) Western blot showing the levels of Vinculin and intracellular SARS-CoV-2 Nucleocapsid at 2- and 3-days post infection in siCNT, siA3B, and siPKR treated cells. (F) Plaque forming units/mL of media collected at 3 days post infection in siCNT, siA3B, and siPKR treated cells. Bar graphs show mean ± SEM. Statistical significance was calculated by Student’s T Test: Statistical analyses are calculated from data obtained from 3 experiments. *P<0.05, **P<0.01, ***P<0.001.
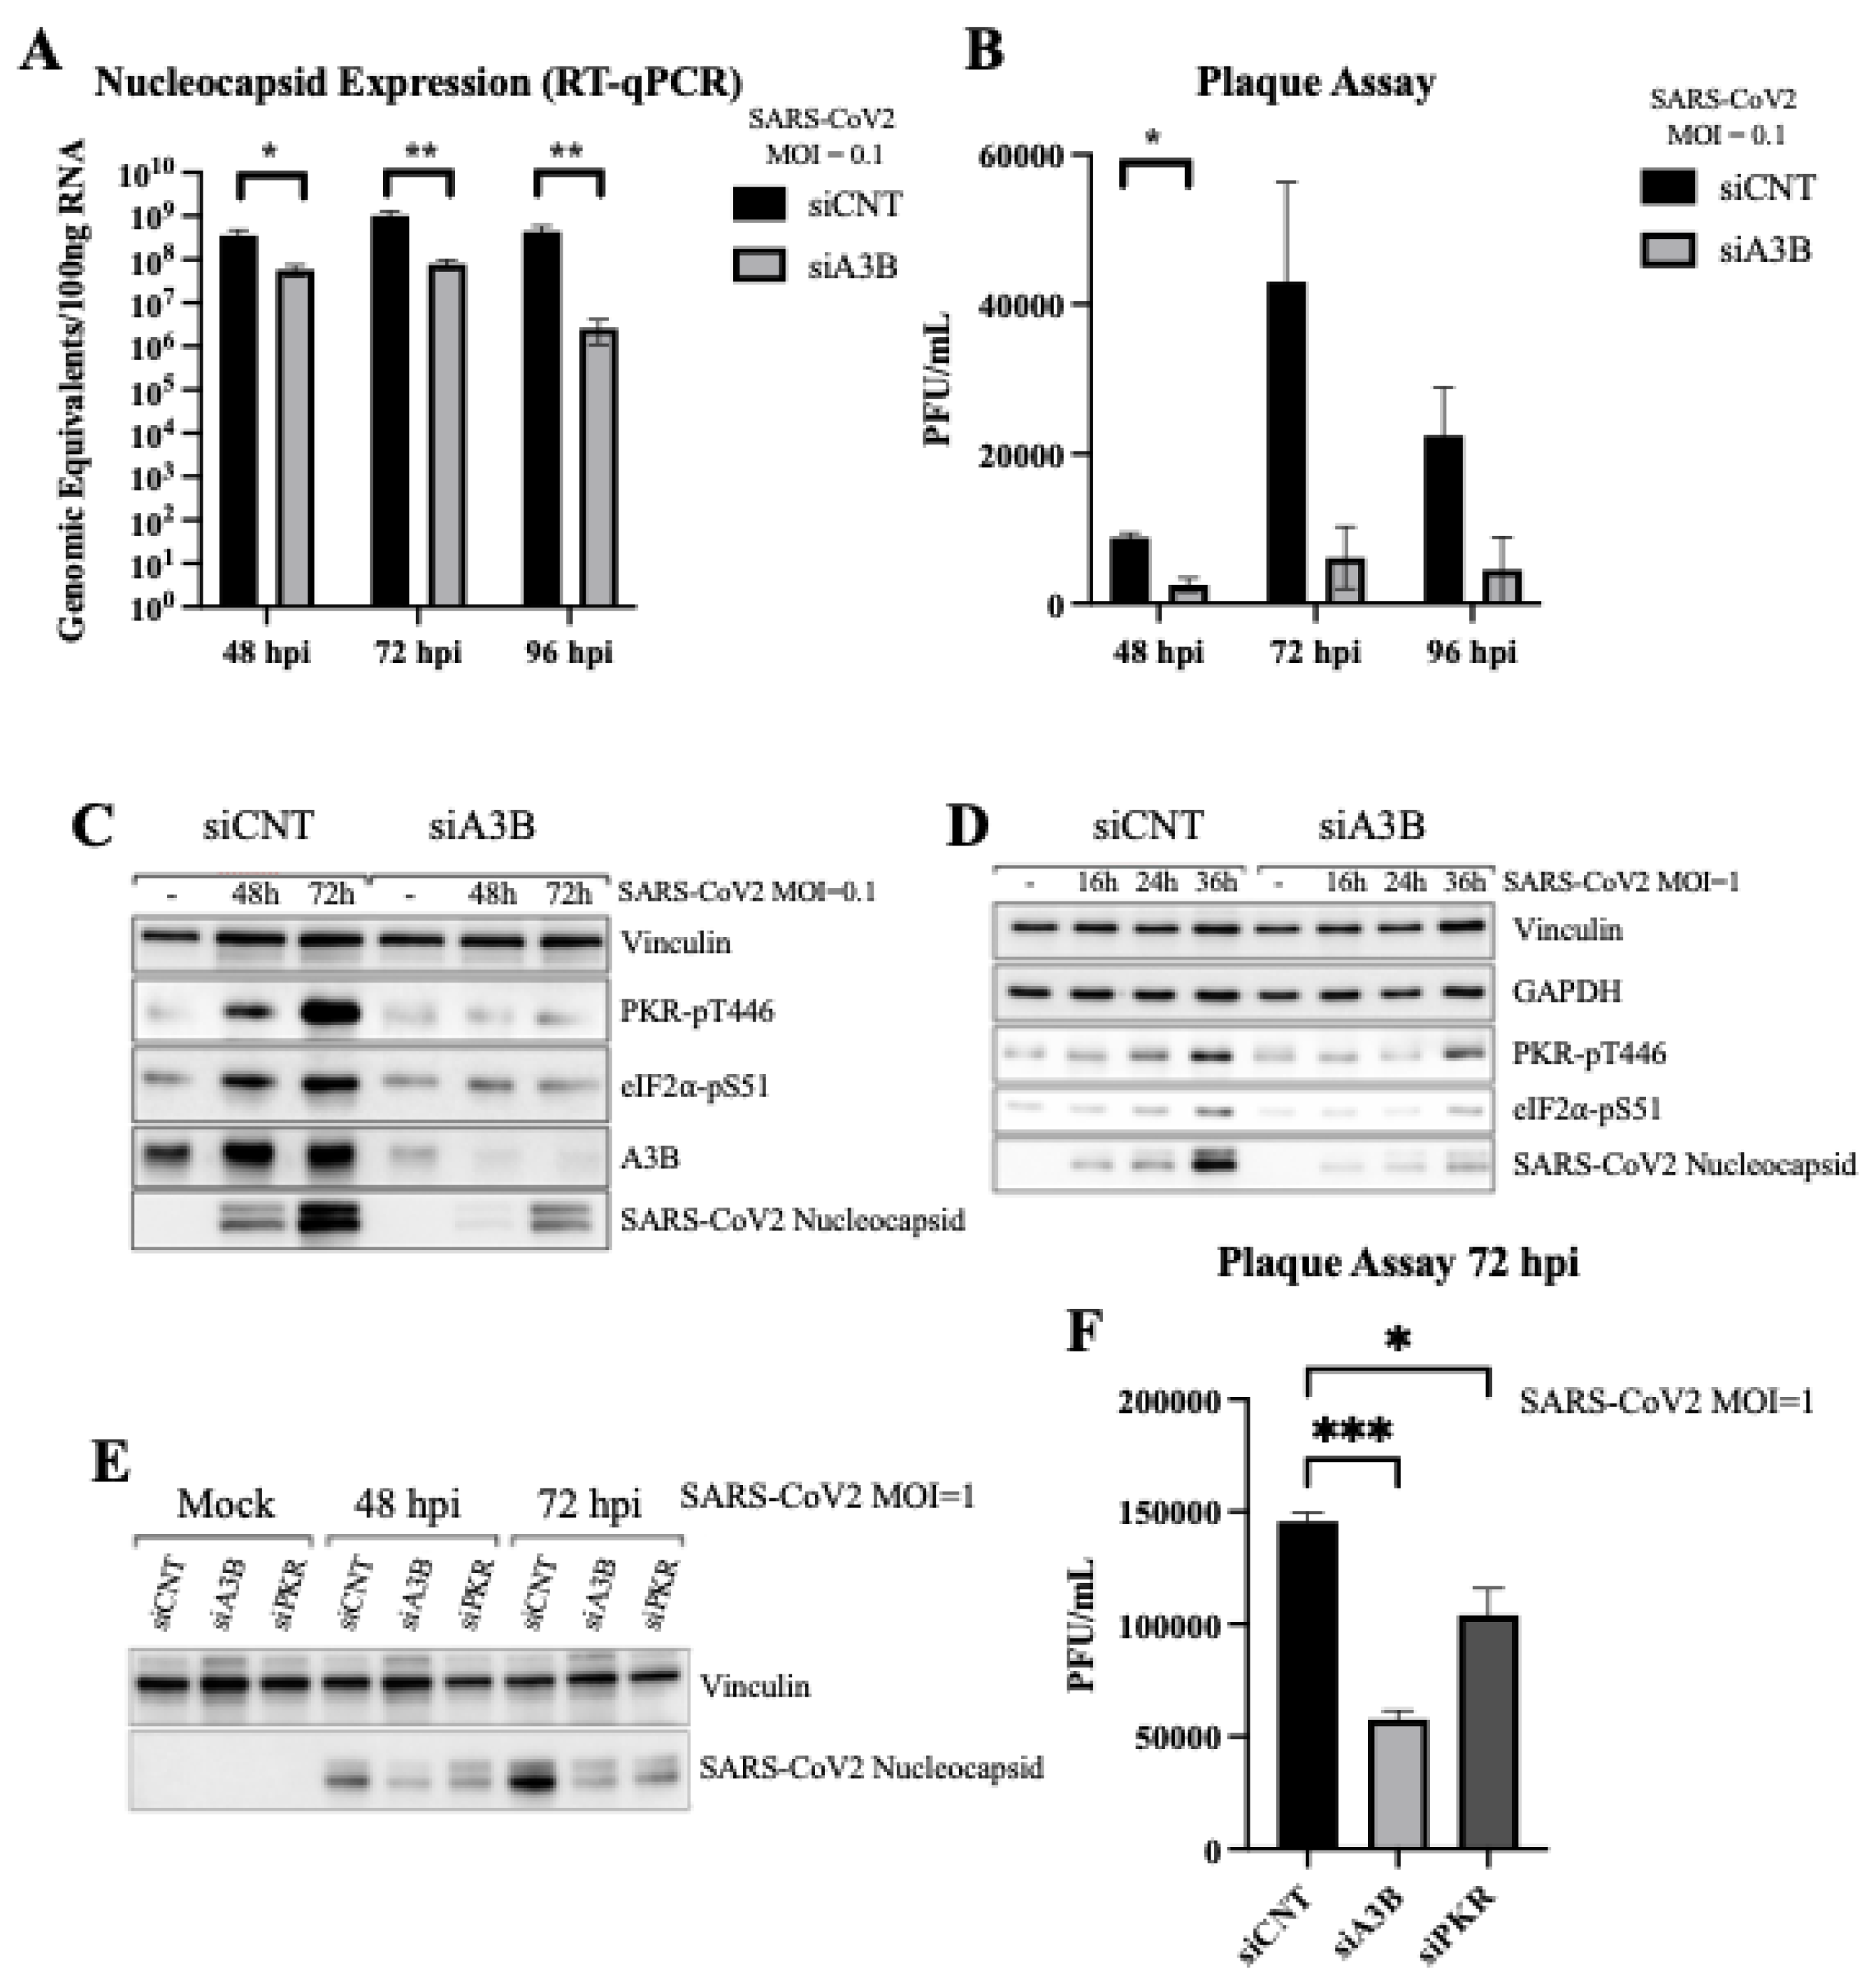
Figure 3.
Severe COVID-19 patient BALF cells show signs of p-PKR/p-eIF2⍺ activation. (A) Increased eIF2⍺ phosphorylation (p-eIF2⍺) leading to translational repression leads to a decrease in expression of eIF2B, and (B) an upregulation of ATF4, GADD34, and CHOP expression. (C) Pathway overview in which SARS-CoV-2 infection induces an upregulation of APOBEC3B, driving an increase in p-PKR and p-eIF2⍺, leading to a decrease in eIF2B and increases in ATF4, GADD34, and CHOP.
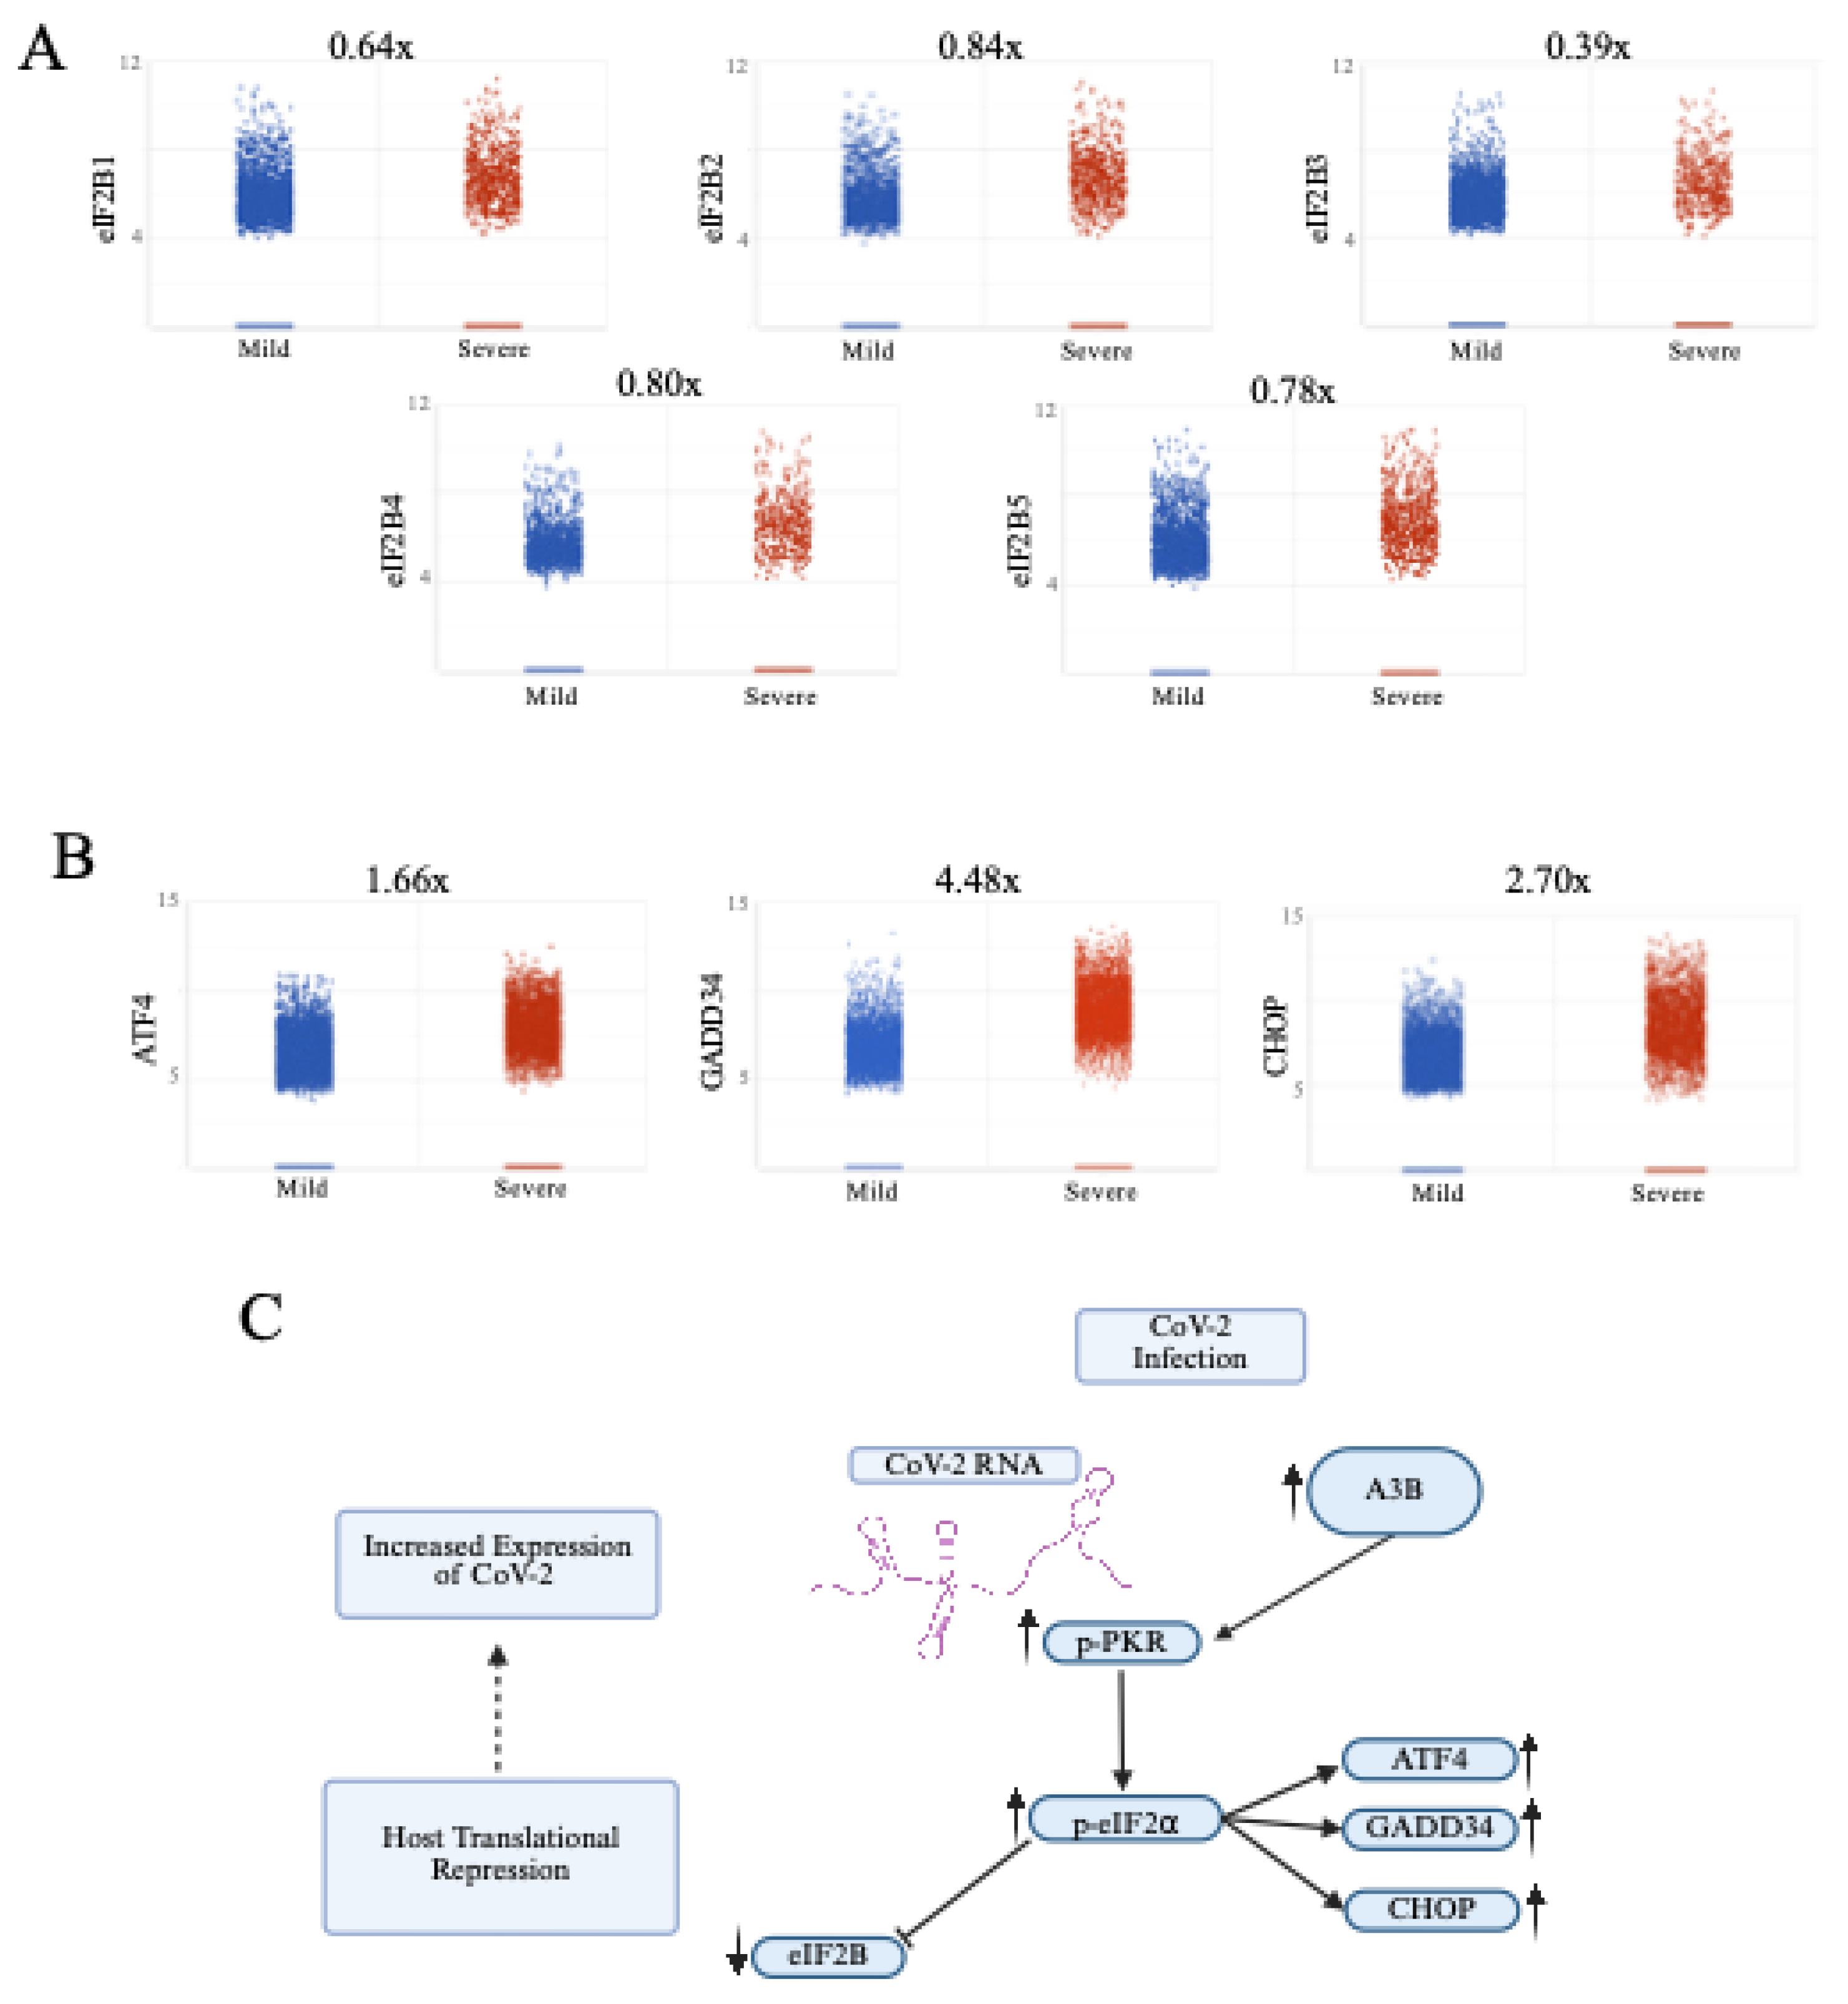
Figure 4.
APOBEC3B knockdown reduces SARS-Cov-2 Infectivity in A549-ACE2 independent of p-PKR/p-eIF2⍺. (A) A549-ACE2 cells were infected at MOI=0.1 and RNA was harvested 3-days post infection for quantification by RT-qPCR. Bar graph shows mean ± SEM. (B) Western blot showing a decrease of intracellular SARS-Cov-2 Nucleocapsid at 3-days post infection with APOBEC3B knockdown, but no clear sign of PKR activation with infection. (C) Quantification of intracellular nucleocapsid intensity per cell as stained by immunofluorescence 3-days post infection (MOI=1) showing decreased nucleocapsid with APOBEC3B knockdown only. (D) Representative images showing nuclei (blue), CoV-2 Nucleocapsid (red). Statistical significance was calculated by ANOVA followed by pairwise comparison with correction. Statistical analysis for qPCR was completed on 3 experiments. Statistical analysis on immunofluorescence was completed on 1 experiment. **P<0.01, ****P<0.0001.
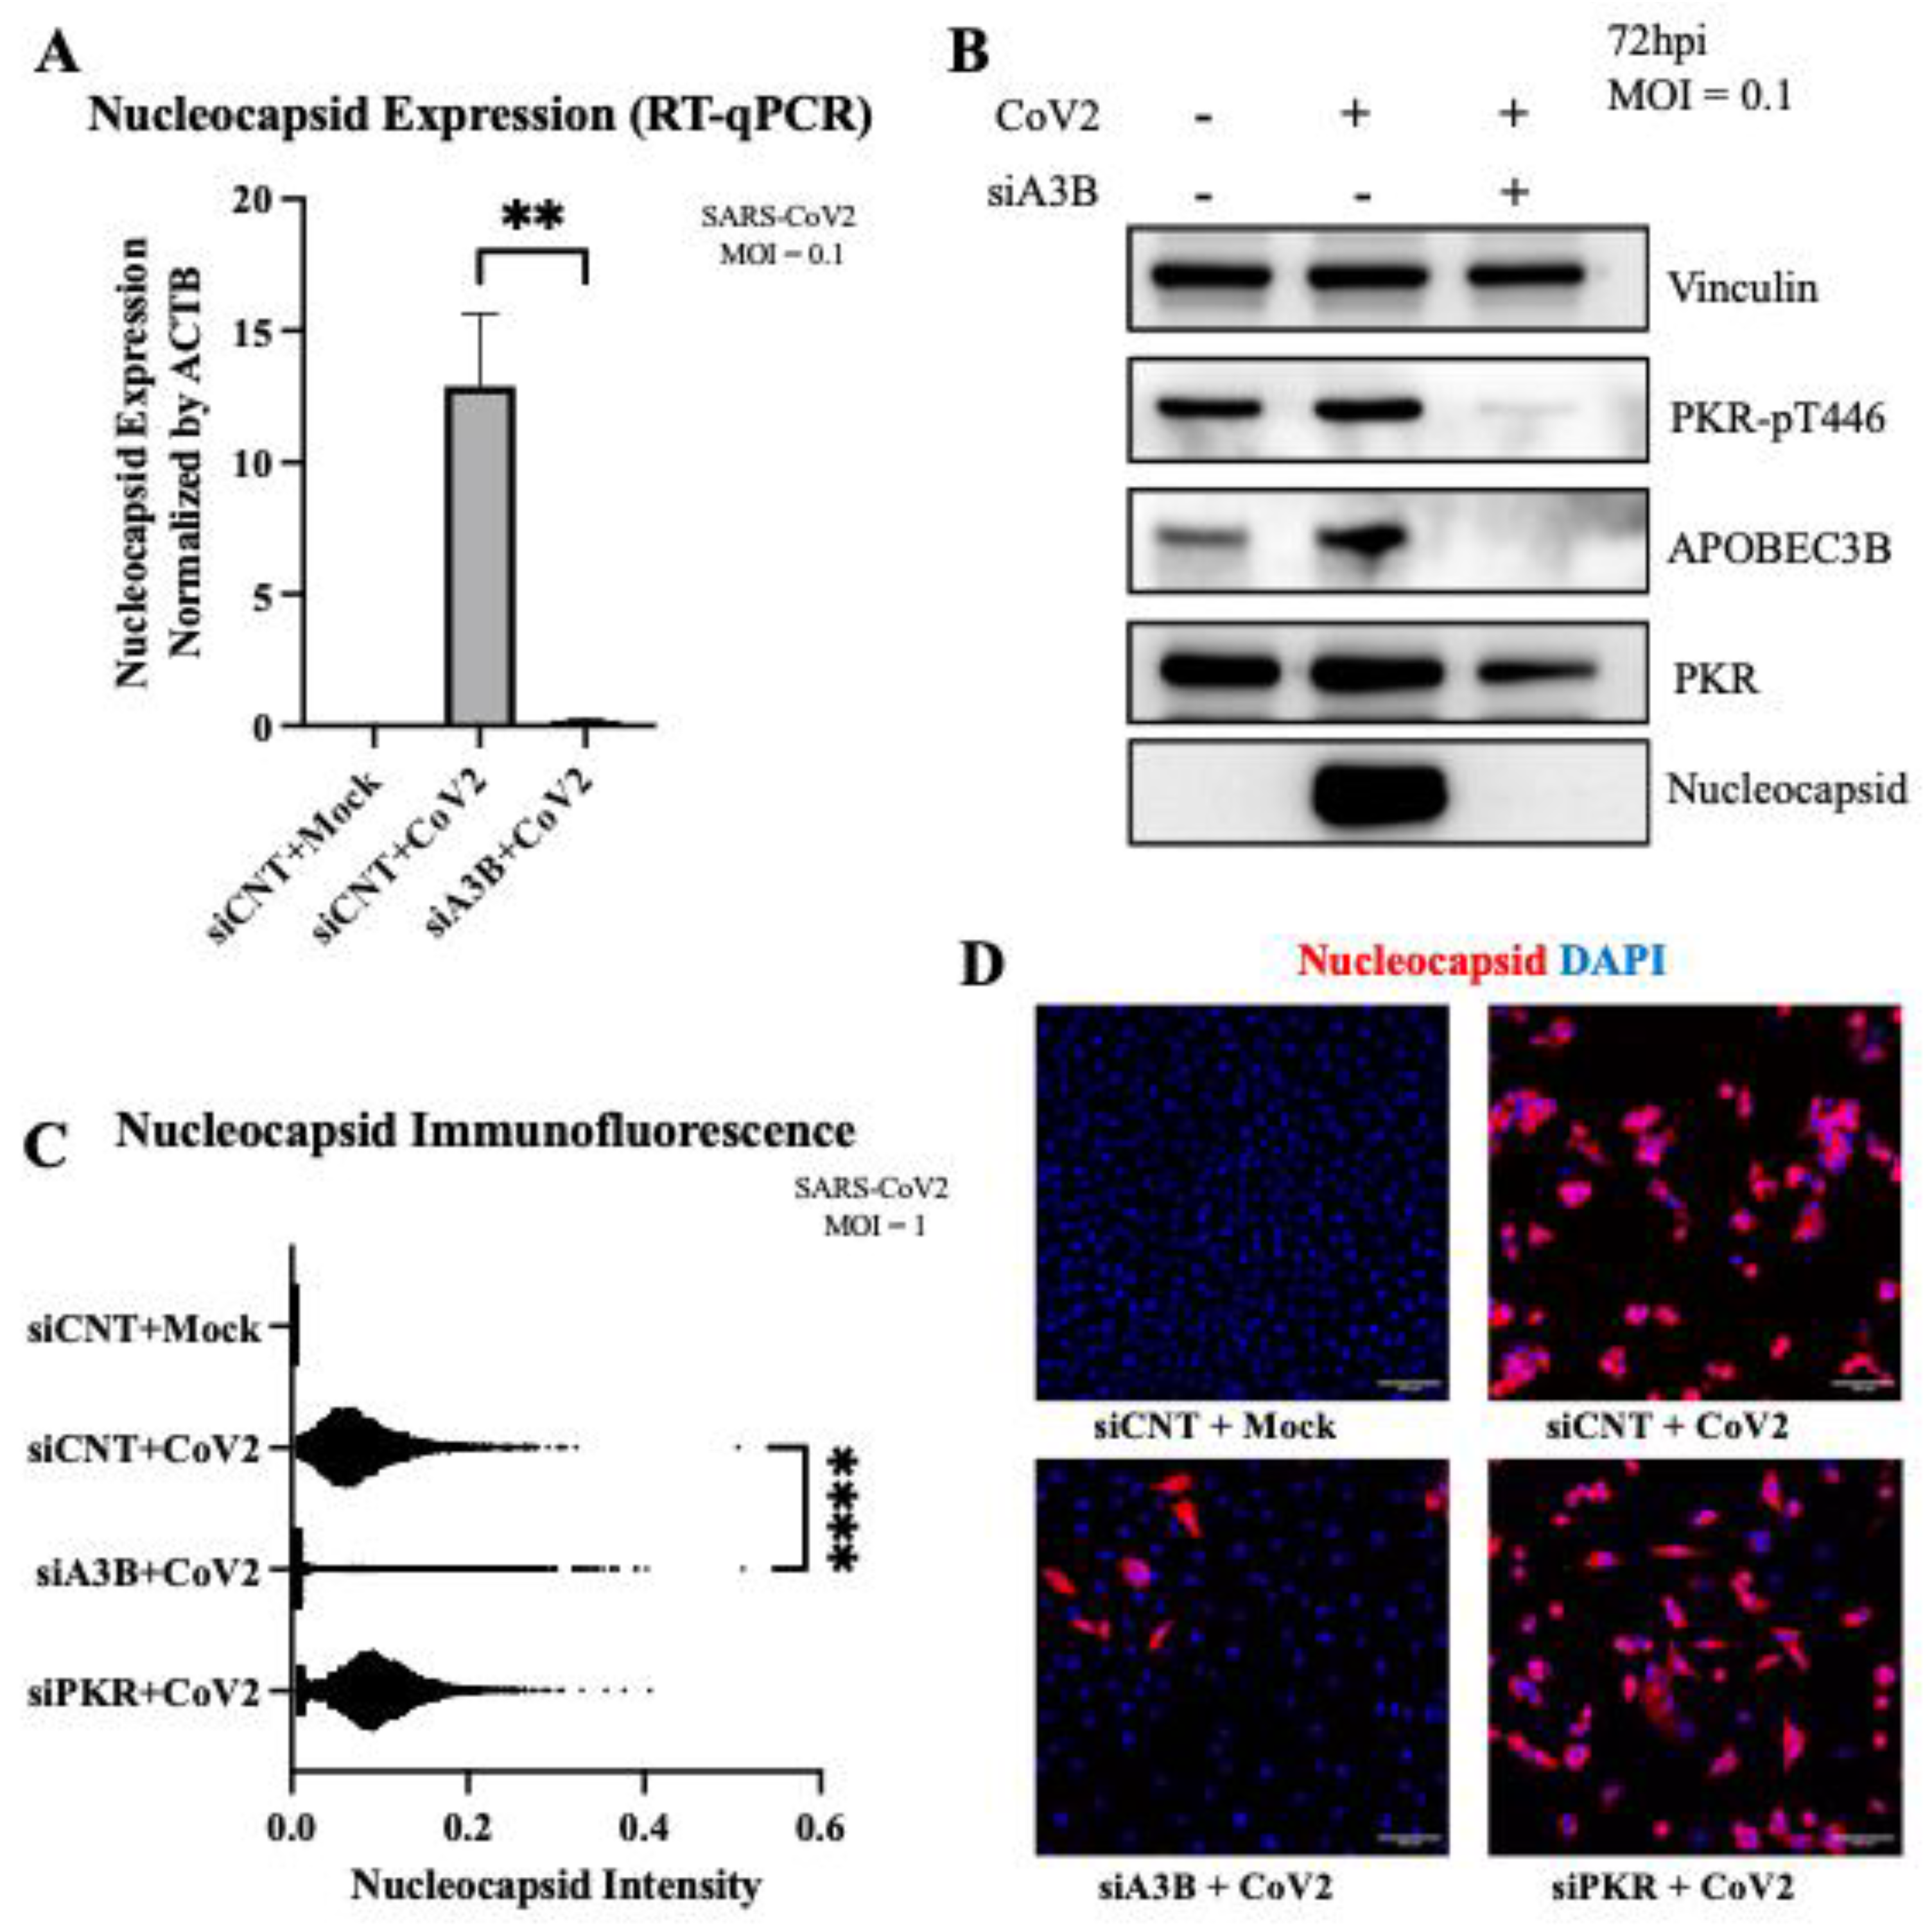
Figure 5.
Geneformer predicts AMPD2 is dysregulated by APOBEC3B knockout in severe COVID-19 infection. (A) In-Silico deletion of APOBEC3B in airway epithelial cells of severe COVID patients revealed gene embedding predictions on 14498 genes. AMPD2 is circled in red. (B) Pathway through which AMPD2 dysregulation could impact SARS-CoV-2 pathology. (C) Bulk RNA Seq shows that APOBEC3B expression is induced by SARS-CoV-2 infection and knocked down by siA3Bs (left). AMPD2 is knocked out with SARS-CoV-2 infection, and has expression restored with APOBEC3B knockdown (right). (D) AMPD2 expression is reduced in severe relative to mild COVID-19 BALF (right); corresponding increase in APOBEC3B in severe relative to mild COVID (from Figure 1A, left). Bar graphs show mean ± SEM. Statistical significance was calculated by Student’s T Test, corrected for multiple comparisons: Statistical analyses are calculated from data obtained from 3 experiments. *P<0.05, **P<0.01.2.7. AMPD2 Is Down-Regulated in Severe COVID-19 Infection.
Disclaimer/Publisher’s Note: The statements, opinions and data contained in all publications are solely those of the individual author(s) and contributor(s) and not of MDPI and/or the editor(s). MDPI and/or the editor(s) disclaim responsibility for any injury to people or property resulting from any ideas, methods, instructions or products referred to in the content. |
© 2025 by the authors. Licensee MDPI, Basel, Switzerland. This article is an open access article distributed under the terms and conditions of the Creative Commons Attribution (CC BY) license (http://creativecommons.org/licenses/by/4.0/).
Copyright: This open access article is published under a Creative Commons CC BY 4.0 license, which permit the free download, distribution, and reuse, provided that the author and preprint are cited in any reuse.


